Article

Intelligent Identification Method for the Diagenetic Facies of Tight Oil Reservoirs Based on Hybrid Intelligence—A Case Study of Fuyu Reservoir in Sanzhao Sag of Songliao Basin

1
School of Computer & Information Technology, Northeast Petroleum University, Daqing 163318, China
2
School of Earth Sciences, Northeast Petroleum University, Daqing 163318, China
*
Author to whom correspondence should be addressed.
Energies 2024, 17(7), 1708; https://doi.org/10.3390/en17071708
Submission received: 2 March 2024 / Revised: 28 March 2024 / Accepted: 30 March 2024 / Published: 3 April 2024

Abstract

:
The diagenetic facies of tight oil reservoirs reflect the diagenetic characteristics and micro-pore structure of reservoirs, determining the formation and distribution of sweet spot zones. By establishing the correlation between diagenetic facies and logging curves, we can effectively identify the vertical variation of diagenetic facies types and predict the spatial variation of reservoir quality. However, it is still challenging work to establish the correlation between logging and diagenetic facies, and there are some problems such as low accuracy, high time consumption and high cost. To this end, we propose a lithofacies identification method for tight oil reservoirs based on hybrid intelligence using the Fuyu oil layer of the Sanzhao depression in Songliao Basin as the target area. Firstly, the geological characteristics of the selected area were analyzed, the definition and classification scheme of diagenetic facies and the dominant diagenetic facies were discussed, and the logging response characteristics of various diagenetic facies were summarized. Secondly, based on the standardization of logging curves, the logging image data set of various diagenetic facies was built, and the imbalanced data set processing was performed. Thirdly, by integrating CNN (Convolutional Neural Networks) and ViT (Visual Transformer), the C-ViTM hybrid intelligent model was constructed to identify the diagenetic facies of tight oil reservoirs. Finally, the effectiveness of the method is demonstrated through experiments with different thicknesses, accuracy and single-well identification. The experimental results show that the C-ViTM method has the best identification effect at the sample thickness of 0.5 m, with Precision of above 86%, Recall of above 90% and F1 score of above 89%. The calculation result of the Jaccard index in the identification of a single well was 0.79, and the diagenetic facies of tight reservoirs can be identified efficiently and accurately. At the same time, it also provides a new idea for the identification of the diagenetic facies of old oilfields with only logging image data sets.

1. Introduction

With the continuous exploration and development of unconventional oil and gas resources, tight oil reservoirs have attracted increasing attention [1,2]. China’s tight oil reservoirs are mainly distributed in Songliao Basin, Ordos Basin, Bohai Bay Basin and Junggar Basin [3,4]. Tight oil reservoirs are deeply buried and have the characteristics of coexistence of source rock and reservoir, low porosity and low permeability, complex pore structure and strong heterogeneity after complex diagenetic processes [5,6,7,8,9]. The analysis of the influence of diagenetic change on reservoir quality can effectively guide the exploration and development of tight oil reservoirs, so the study of diagenetic facies is of great significance for the quality evaluation of tight oil reservoirs and “sweet spots” prediction [10,11].
At present, there is no standard definition for diagenetic facies. The meaning of diagenetic facies has been expressed by scholars from different perspectives, but it is generally believed that diagenetic facies are the integration of diagenetic type, diagenetic degree and diagenetic mineral combination [12,13]. The high cost and discontinuity of coring make it relatively difficult to study the diagenetic facies space [14,15]. For this purpose, many scholars have utilized the multidimensional nature and continuity of logging data to establish the correlation model between diagenetic facies and logging data, identify diagenetic facies and screen favorable reservoirs [16]. Common methods for identifying diagenetic facies logging include rendezvous diagram method, spider diagram method (also known as radar chart method), diagenetic facies strength calculation method and mathematical method. The rendezvous diagram method establishes the identification criteria of each type of diagenetic facies by selecting different types and quantities of logging curves. Ran [17] and Shi [18] et al. used the logging rendezvous diagram method to quantitatively characterize the diagenetic facies of tight oil reservoirs in Ordos Basin and established the logging quantitative identification standard of diagenetic facies. The spider diagram method maps the logging responses of various types of diagenetic facies to the axis to identify diagenetic facies types. Lai [19] et al. proposed the method for identifying diagenetic facies with spider diagram logging and distinguished different types of diagenetic facies with graphs. The identification plates of the rendezvous diagram method and spider diagram method are simple to make, but require a lot of time for experienced domain experts to complete, and the identification effect is affected by the number of logging curves. The diagenetic facies strength calculation method achieves quantitative characterization of diagenetic facies by calculating diagenetic strength parameters such as compactional and cementational porosity loss. Ozkan [20] et al. calculated the intergranular volume, compactional porosity loss and cementational porosity loss based on established point data, and realized diagenetic facies type judgment and reservoir quality evaluation in combination with logging data. This method has a high identification accuracy, but requires a large amount of experimental data support and high cost. Based on the logging response characteristics, the mathematical method realizes the identification of typical diagenetic facies types by identifying the morphological characteristics of logging curves. It mainly includes principal component analysis and neural network prediction methods. Cui [21] and Zhu [22] et al. established a diagenetic facies prediction model based on principal component analysis, but this method only applies to the case where the degree of overlap is less than 15%. Qi [5] et al. proposed a logging identification method for the diagenetic facies of tight oil reservoirs based on CNN. This method completes the identification of diagenetic facies type by extracting local features from logging curve images. However, due to the insufficient learning of the overall features of logging curve images by CNN and the long training time, it still needs to be further improved. In order to improve the deficiency of CNN algorithm in learning the overall features of images, Dosovitskiy [23] et al. proposed the Vision Transformer (ViT) method and applied the image patch sequence converter to complete the task of image classification and identification.
In summary, the existing methods have problems such as dependence on domain experts, high time cost and the need to improve identification accuracy. To this end, we referred to the hybrid intelligent algorithm design idea of “complementary advantages” [23,24,25] and proposed the intelligent identification method for the diagenetic facies of tight oil reservoirs based on the integration of CNN and Vision Transformer, C-ViTM. The overall process of the method is shown in Figure 1. The hybrid intelligent algorithm idea of this method is mainly reflected in the following: the local features of logging curves in samples are extracted with CNN, and the ViT is applied to learn the global features of each logging curve, realizing the rapid and accurate intelligent identification of diagenetic facies.
The remaining parts of this study are organized as follows. The second section elaborates the geological setting. The diagenetic facies types and logging response characteristics are analyzed in the third section. The fourth section provides a detailed introduction to the C-ViTM method. The experimental scheme is described in the fifth section. The experimental results are discussed in the sixth section. The seventh section is about the summary of the research work and the prospects for future work.

2. Geological Setting

Fuyu reservoir (K1q4) at the top of Quantou Formation (K1q) is a typical tight oil reservoir in Sanzhao Sag of north Songliao Basin, China, and it belongs to the lacustrine delta sedimentary system [26], as shown in Figure 2. The depth of reservoir rock is 1043–2302 m, and the diagenesis mainly includes compaction, cementation and dissolution, and the lithology is mainly siltstone, mudstone and fine sandstone [27,28]. Due to strong compaction, Fuyu reservoir has a low porosity and permeability, with an average porosity of 10.8% and air permeability of 0.64 mD [29]. There is a good linear relationship between porosity and permeability, indicating that Fuyu reservoir is a typical porous tight sandstone reservoir [30].
Fuyu reservoir in Sanzhao Sag has the characteristics of fine particle size and high shale content [31]. Generally, reservoir compaction strength is positively correlated with the burial depth of sediments [28]. By observing cast thin sections, it is found that due to compaction, the brittle particles are broken, the clastic particles are mainly in linear contact, and the long particles are arranged semi-directionally, as shown in Figure 3a. The types of cement in the reservoir include carbonate cement, authigenic clay minerals, quartz secondary enlargement, authigenic feldspar, etc., all of which produce destructive effects on the physical properties of the reservoir, as shown in Figure 3b,d,e. Through the dissolution of feldspar, lithic fragment, calcite cement, argillaceous matrix and other components, new pores are created or the original pores are enlarged, and the physical properties of the reservoir are improved, as shown in Figure 3c,e,f.

3. Diagenetic Facies Classification and Logging Response Analysis

This section elaborates the definition and classification scheme of diagenetic facies. Based on the screening of logging curves, the logging response characteristics of different types of diagenetic facies were analyzed.

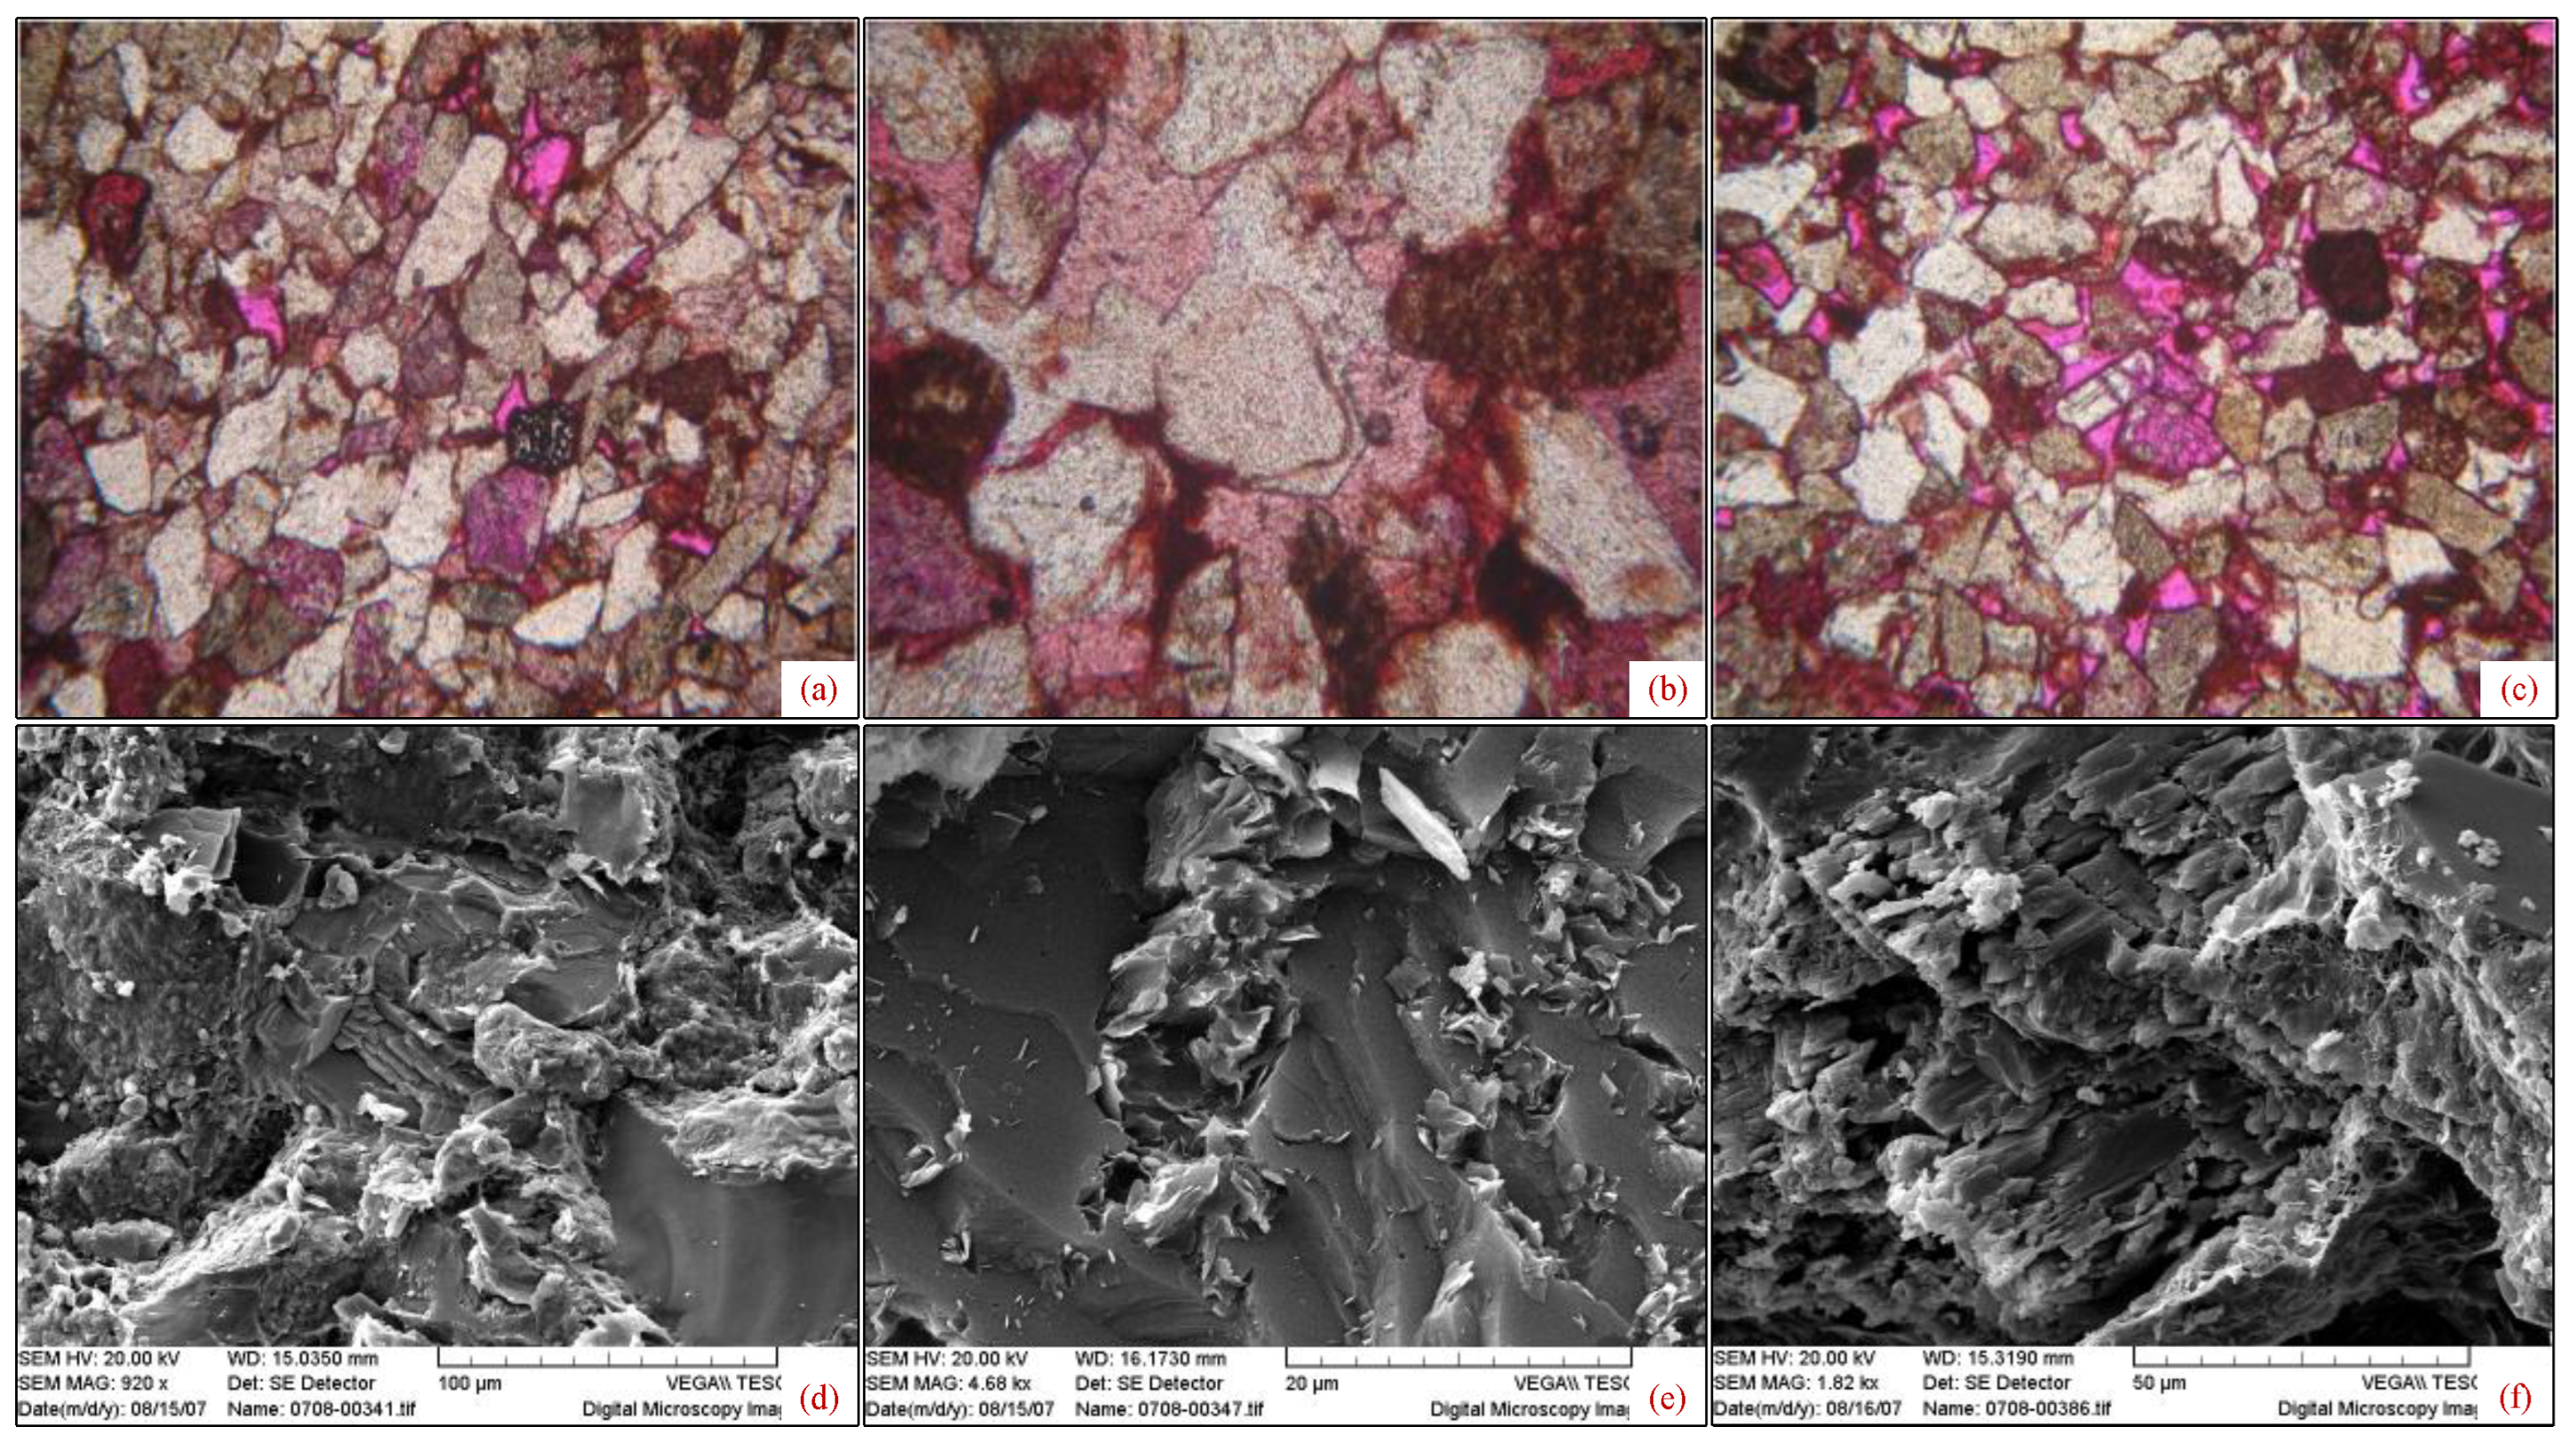
3.1. Definition of Diagenetic Facies

As a response to the combined results of different diagenetic histories, diagenetic facies reflect the comprehensive features of diagenetic types, diagenetic degrees, diagenetic mineral composition types and their evolution, and determine the formation and distribution of sweet spots in tight reservoirs, and it is an important basis for the evaluation of tight reservoirs [21,32,33,34]. Zou et al. [13] defined diagenetic facies as a comprehensive description of sedimentary diagenesis and diagenetic mineral evolution under diagenesis and tectonism. Zhang et al. [35] defined diagenetic facies as the product of diagenesis and evolution of sediments under fluid and tectonic action, which is a comprehensive characterization of minerals such as rock particles, cements, fabrics and fracture-caves. Duan et al. [36] defined diagenetic facies as the product of sediments reflecting petrological and geochemical characteristics after diagenetic and tectonic processes in specific sedimentary and physicochemical environments, including comprehensive characteristics such as rock particles, cements, fabrics, pores and fractures. We define diagenetic facies as the stratigraphic unit of sediments that reflects the diagenetic degree, diagenetic type and diagenetic mineral composition through fluid, tectonic and diagenetic processes in sedimentary and physicochemical environments, which can be identified based on thin section analysis and logging response, including compaction, lithology, cementation and dissolution [2,20,21,37,38,39].

3.2. Classification of Diagenetic Facies

The diagenetic facies types of Fuyu reservoir in Sanzhao Sag were classified based on compaction, lithology, cementation and dissolution. The compaction effect increased with the burial depth, and the porosity decreased from 25.5% to 17.5% when the burial depth reached 1800 m. Cements such as carbonate minerals and quartz secondary enlargement fill the reservoir, which inhibits the compaction and pressure dissolution to some extent. The porosity increased from less than 15% to 20.7% when the burial depth exceeded 1800 m, because the dissolution of feldspar, rock debris and carbonate cement results in the formation of interparticle dissolution pores and intragranular dissolution pores to form secondary pore development zones, which improves the reservoir performance [31]. According to the buried depth of 1800 m, Fuyu reservoir compaction was divided into weak compaction (buried depth ≤ 1800 m) and medium to strong compaction (buried depth > 1800 m). According to the logging response, the lithology is mainly divided into fine sandstone, siltstone and mudstone [3]. Cementation and dissolution are divided into weak cementation dissolution and weak dissolution cementation according to the action strength. In addition, diagenetic facies whose lithology type is mudstone have poor reservoir performance, so they are classified into one class. According to the above standards, the diagenetic facies types of Fuyu reservoir in Sanzhao Sag are divided as follows: weakly compacted weakly cemented dissolved siltstone phase (Wip), weakly compacted weakly cemented dissolved fine sandstone phase (Wap), medium to strong compaction of weakly cemented dissolved fine sandstone phase (Map), medium to strong compaction of weakly cemented dissolved siltstone phase (Mip), medium to strong compaction of weakly dissolved colluvial fine sandstone phase (Msap) and mudstone phase (Mp).
Wip: buried depth ≤ 1800 m, mainly siltstone, with loose samples and good particle sorting. The pores are relatively developed, mainly interparticle dissolution pores, with a maximum of 60 μm, and have connectivity. There are a few calcite cements, which are distributed in a scattered way. The rock exhibits the oil impregnation phenomenon and good reservoir properties.
Wap: buried depth ≤ 1800 m, mainly fine sandstone, with loose samples and good particle sorting. The pores are relatively developed, mainly interparticle dissolution pores, with a maximum of 60 μm, and have connectivity. There are a few calcite-filled interparticle metasomatic particles. The rock exhibits the oil impregnation phenomenon and good reservoir properties.
Map: buried depth > 1800 m, mainly fine sandstone, with loose samples and good particle sorting. The pores are relatively developed, mainly interparticle dissolution pores, with a maximum of 80 μm, and have connectivity. There are a few calcite-filled interparticle metasomatic particles. The rock exhibits the oil impregnation phenomenon and good reservoir properties.
Mip: buried depth > 1800 m, mainly siltstone, with loose samples and good particle sorting. The dissolution pores are relatively developed, mainly interparticle dissolution pores, granular dissolution pores and intragranular dissolution pores. The interparticle dissolution pores can reach up to 50 μm, and have certain connectivity. There are calcite-filled interparticle metasomatic particles. The rock exhibits good reservoir properties.
Msap: buried depth > 1800 m, mainly fine sandstone, with loose samples and general particle sorting. The pores are relatively developed, mainly interparticle dissolution pores, with a maximum of 60 μm, and have certain connectivity. There are calcite-filled interparticle metasomatic particles. The rock exhibits good reservoir properties.
Mp: mainly mudstone, with relatively dense or dense samples and general particle sorting. The pores are undeveloped and unevenly distributed, and there are interparticle dissolution pores and muddy micropores, which have poor connectivity. The interstitial materials are argillaceous, calcite and quartz secondary enlargement. The rock exhibits poor reservoir performance.
According to the reservoir properties of different diagenetic facies types, Class I reservoir, Class II reservoir and Class III reservoir were classified. Class I reservoir corresponds to Wip, Wap and Map. Class II reservoir corresponds to Mip and Msap. Class III reservoir corresponds to Mp.

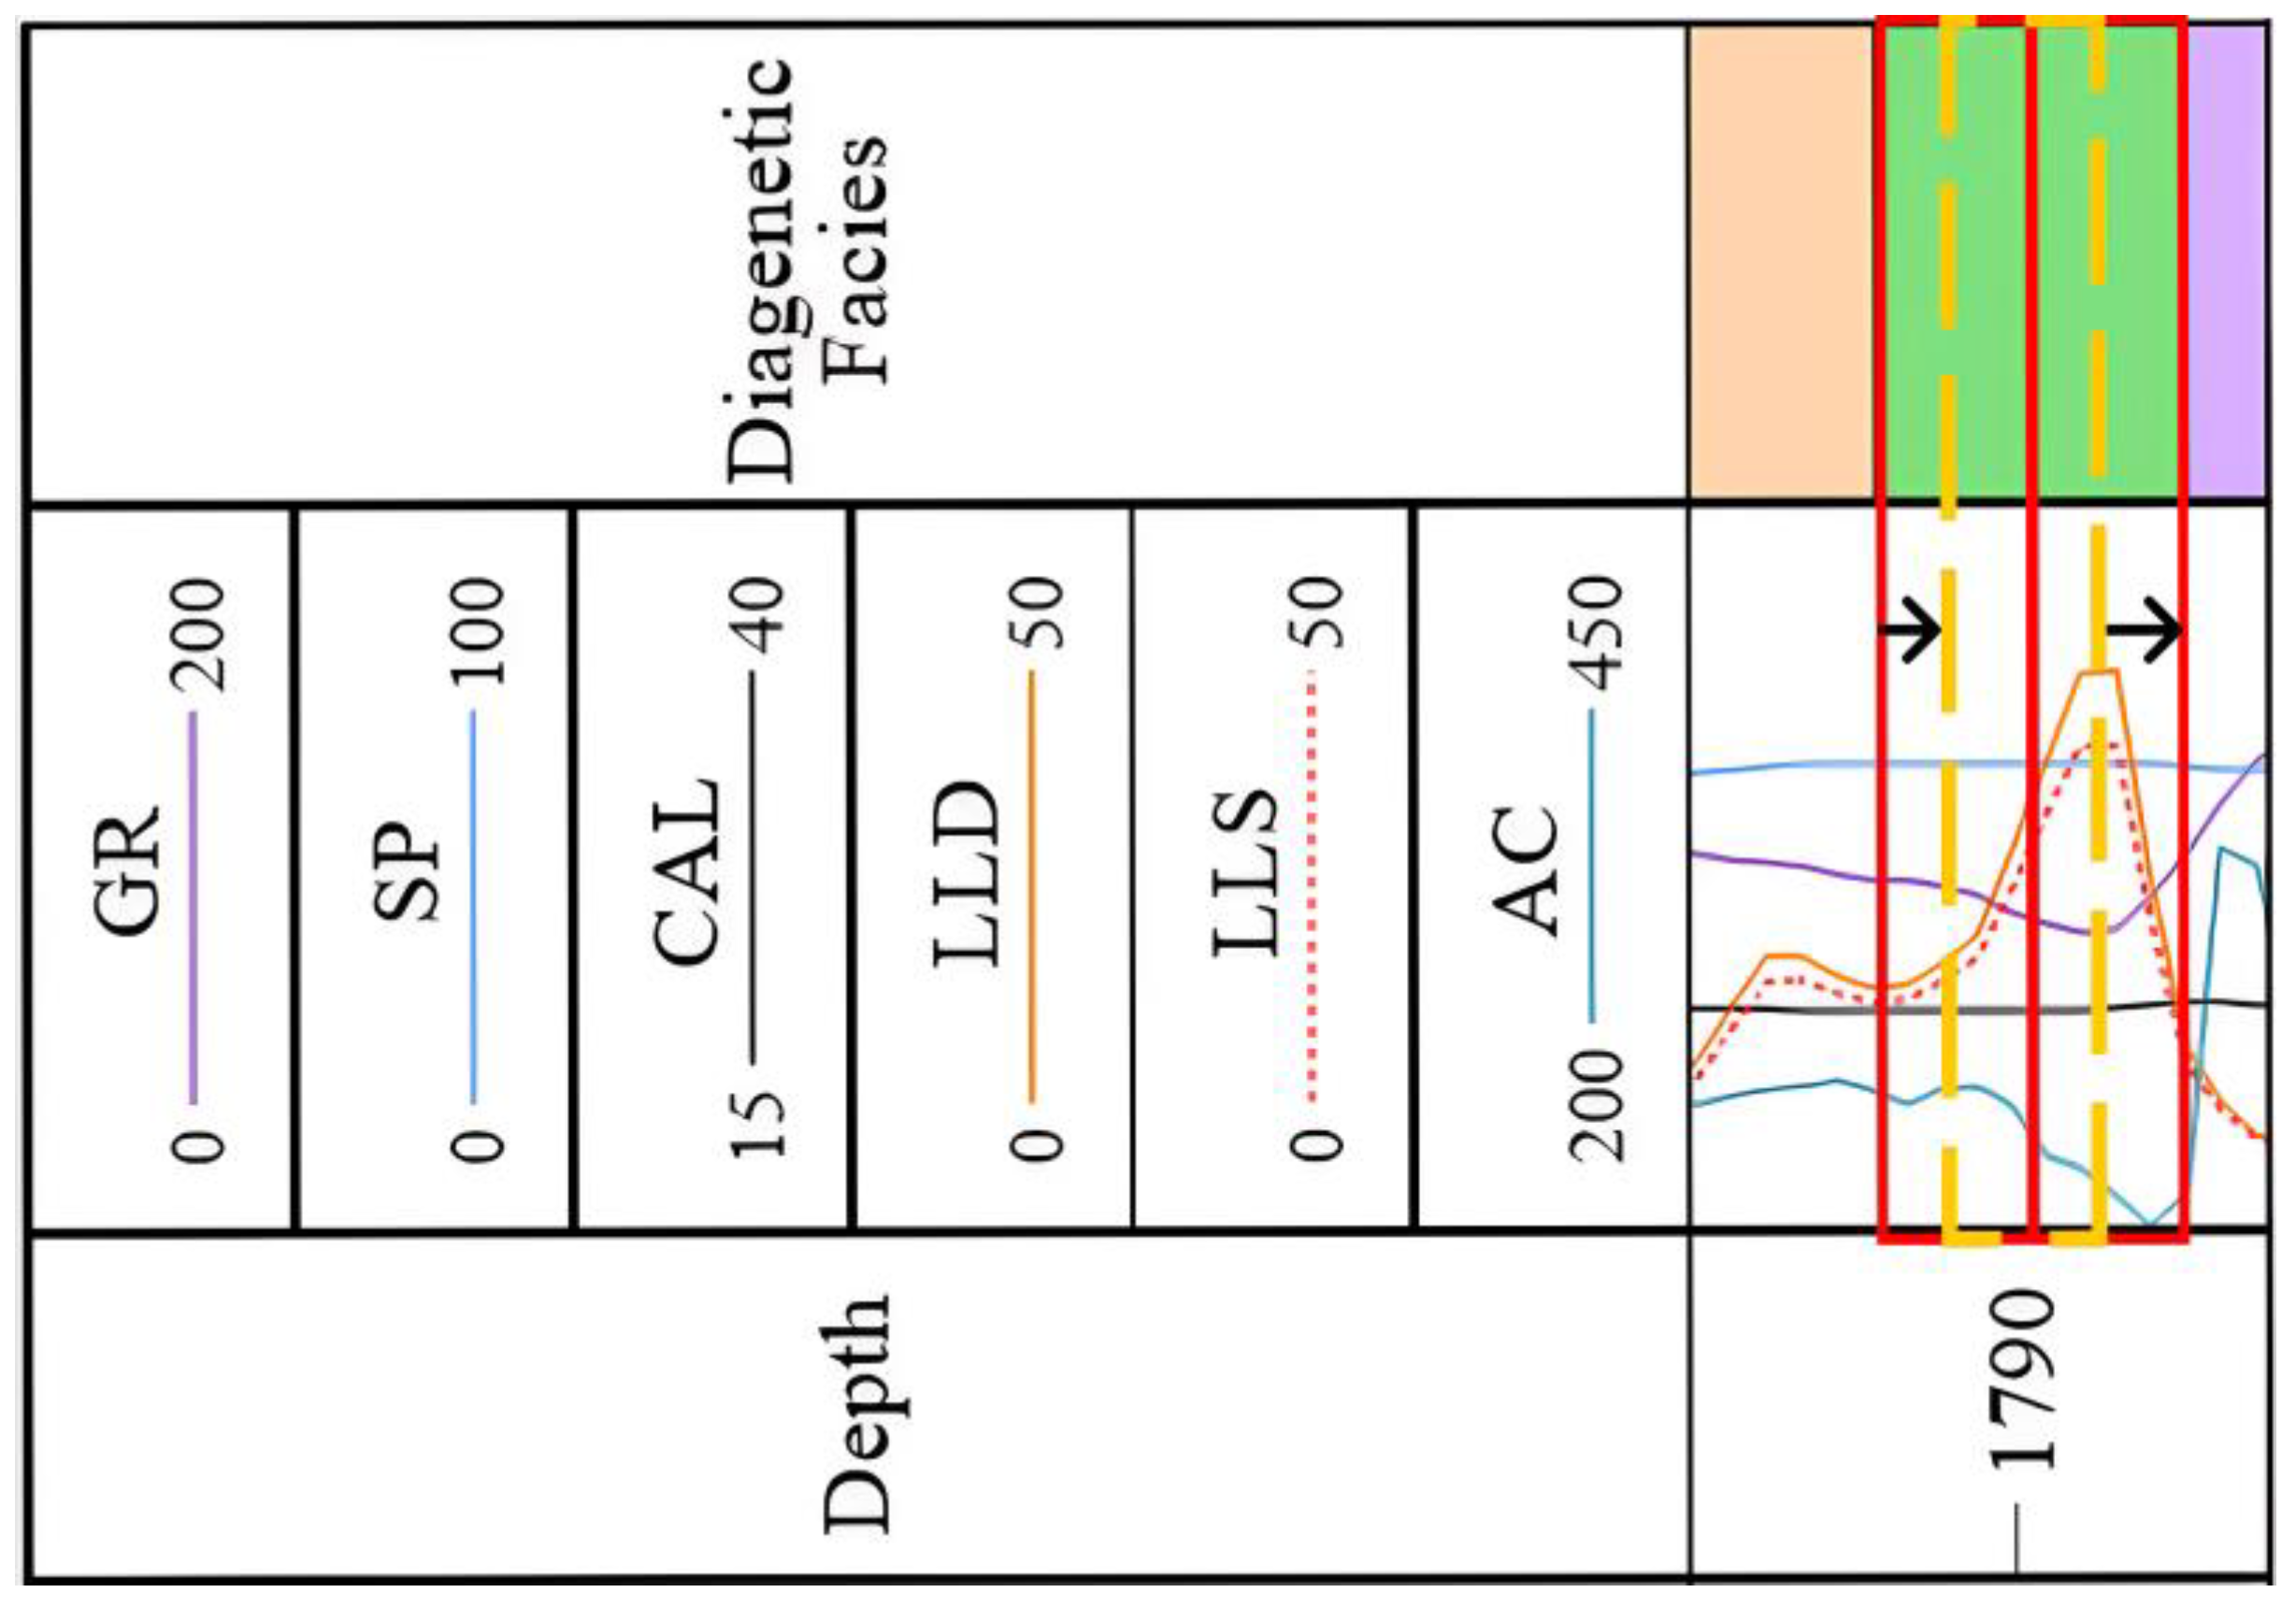
3.3. Diagenetic Facies Logging Response Characteristics

In order to establish the correlation between diagenetic facies and logging, and analyze the logging response characteristics of various diagenetic facies, the importance of each logging curve was scored by using the decision tree scoring method. Gamma ray (GR), spontaneous potential (SP), borehole compensated acoustilog (AC), deep lateral resistivity (RLLD), shallow lateral resistivity (RLLS) and caliper (CAL) were selected as the response curves [40].
Wip: GR shows low-amplitude micro-tooth shape, RLLD and RLLS present small-amplitude frame shape, and AC has low-amplitude micro-tooth shape characteristics. Wap: GR has a stable shape, and RLLD and RLLS exhibit a high-amplitude bell shape. Map: GR shows low-amplitude smoothness, RLLD and RLLS are box or bell shaped, and AC is in a symmetrical tooth shape. Mip: GR shows low-amplitude smoothness, RLLD and RLLS values are lower, and AC exhibits a low-amplitude finger type. Msap: GR shows low-amplitude smoothness, RLLD and RLLS are box or toothed curves, and AC is finger shaped. Mp: GR value is higher, RLLD and RLLS values are lower, and AC is bell shaped. See Figure 4 for details.

4. C-ViTM Method

In this section, the research process of the C-ViTM method is introduced in detail, including five steps of logging data analysis, data set establishment, imbalanced data set processing, diagenetic facies identification model design and model training.

4.1. Logging Data Analysis

Logging data and core analysis data provide accurate lithology and physical property information, and they are the main basis for diagenesis and diagenetic facies logging identification [3,40]. The cumulative logging depth of 30 wells in Fuyu reservoir is 3064.5 m, as shown in Table 1. The well locations in the study area are shown in Figure 1.
The quantity and thickness of various diagenetic facies were preliminarily counted according to the logging curve data of the above 30 wells, and the statistical results are shown in Figure 5. According to the statistical results, there is an imbalance in the data of various diagenetic facies, among which the number of Mip is the highest (486), and the number of Wap is the lowest (57), with a quantity difference of 429. The maximum thickness of Mp is 753.45 m, and the minimum thickness of Wap is 68.75 m, with a thickness difference of 684.70 m. According to the thickness statistics, the thickness of various diagenetic facies is mainly in the range of 0 m–1.50 m. The external factor leading to this result may be that the logging data are not standardized, so the standardization of logging curves is necessary in the data establishment process to verify the accuracy of logging data.

4.2. Establishment of the Diagenetic Facies Image Data Set

To ensure the accuracy of the logging data, the GeoSoftwareSuite9.1 software was applied to standardize the logging data. The standardized results of Well f188-138 are shown in Figure 6. After the completion of standardization, the Plot method was used to convert logging curve data into logging curve images, and the Resize method was applied to convert logging curve images into a 224-pixel × 224-pixel logging curve image data set. In addition, based on the statistical results of diagenetic facies thickness (Figure 5a), we sampled the logging curve images according to the longitudinal uniform thickness units of 0.50 m, 0.75 m, 1.00 m and 1.25 m to obtain the best diagenetic facies identification effect. The obtained image sample data set is shown in Table 2 (1.50 m samples are not displayed due to insufficient quantity). According to Table 2, there is an imbalance in the number of samples of different diagenetic facies types. This imbalance will result in higher identification accuracy of diagenetic facies type (Mp) with a large number of samples, and lower identification accuracy of diagenetic facies type (Wap) with a small number of samples. For this reason, we conducted imbalance processing on the sample data set.

4.3. Processing of Imbalanced Data Sets

Over-sampling and under-sampling were combined to process various diagenetic facies logging curve image samples, so as to reduce the influence of sample quantity imbalance on the identification effect of diagenetic facies.
For Wap, Wip (0.50 m) and Msap (0.50 m) with a small number of samples, sliding overlap-tile sampling was used for up-sampling. That is, based on the original diagenetic facies logging curve image samples, a sliding window with a certain step size was set on the image samples, and the sample interval was taken as the sampling window for overlap-tile along the depth downwards to increase the number of samples [41]. We used 50% of the sample interval length as the sliding step size for overlap-tile sampling, as shown in Figure 7. The total number of samples after sampling can be calculated by Equation (1).
N = 2 × B T S I
where N represents the total number of samples, B represents the bottom depth, T represents the top depth, and SI represents the sample interval.
The random under-sampling method was used for the sampling of diagenetic facies (Mp) with a large number of samples, so that the sample size was the same as the average of the total number of other 5 types of diagenetic facies samples, to ensure the overall sample balance. The number of samples of various diagenetic facies obtained after screening is shown in Table 3. We divided the training set and the testing set at a ratio of 8:2.

4.4. Design of Identification Model for the Diagenetic Facies of Tight Oil Reservoirs

To improve the identification efficiency and accuracy of the diagenetic facies of tight oil reservoirs, we transformed the problem of diagenetic facies type identification into the problem of logging curve image identification based on the characteristics of different diagenetic facies logging curves. By referring to the ideas of Mo Zhao et al. [25], the identification method for the diagenetic facies of tight oil reservoirs (C-ViTM) based on hybrid intelligence was constructed by integrating the CNN network model and ViT model structure, as shown in Figure 8. The C-ViTM model uses the ResNet101 network in CNN to extract features of logging curves from image samples and applies ViT to learn the overall features of each logging curve in image samples. The C-ViTM model gives full play to the local feature extraction ability of ResNet101 and the global information control ability of ViT. The specific process is described as follows:
The local feature extraction of logging curve images using the ResNet101 network includes 1 image input layer, 1 convolutional layer, 1 BatchNorm, 1 Relu activation function, 1 maximum pooling layer, 3 Conv Block layers and 27 Density Block layers. The ResNet101 network model structure is shown in Figure 9. ViT learns the global information of logging curve images, including 1 Patch Embedding layer, 1 Class Embedding layer, 1 Position Embedding layer, 2 Layer Norms, 1 Multi-Head Attention, 2 Dropout layers and 1 MLP Head. See Figure 8 for details.
Patch Embedding was used to divide the three-dimensional matrix [224, 224, 3] of the image after feature extraction using the ResNet101 network into a two-dimensional vector matrix [196, 768] according to the patch size of 16 × 16, to provide a basis for meeting the input requirements of ViT. The specific process is shown below:
224 ,   224 ,   3 196   × 16 ,   16 ,   3   196   × [ 768 ]         Images         patch num         patch         patch num         token   patches tokens
where patches represent the total number of patches. Token represents a one-dimensional vector mapped from a single patch. Tokens represent the total number of tokens.
Class Embedding represents the sequence for the classification of diagenetic facies. The principle is to concatenate a vector of length 168 with tokens [196, 768] generated from logging curve images, to generate the two-dimensional vector [197, 768] that meets the input requirements of ViT. The specific process is shown below:
[ 196 ,   768 ] Concat token ,   [ class ] token Concat [ 196 , 768 ] ,   [ 1 , 768 ] [ 197 , 768 ]
Position Embedding superimposes the position information encoding for curve features in each patch to record the position of features. Layer Norm normalizes vector data containing logging curve information to accelerate the learning speed. The role of Multi-Head Attention is to improve the learning ability. Dropout mitigates the phenomenon of model over-fitting. MLP Head outputs the diagenetic facies identification results.

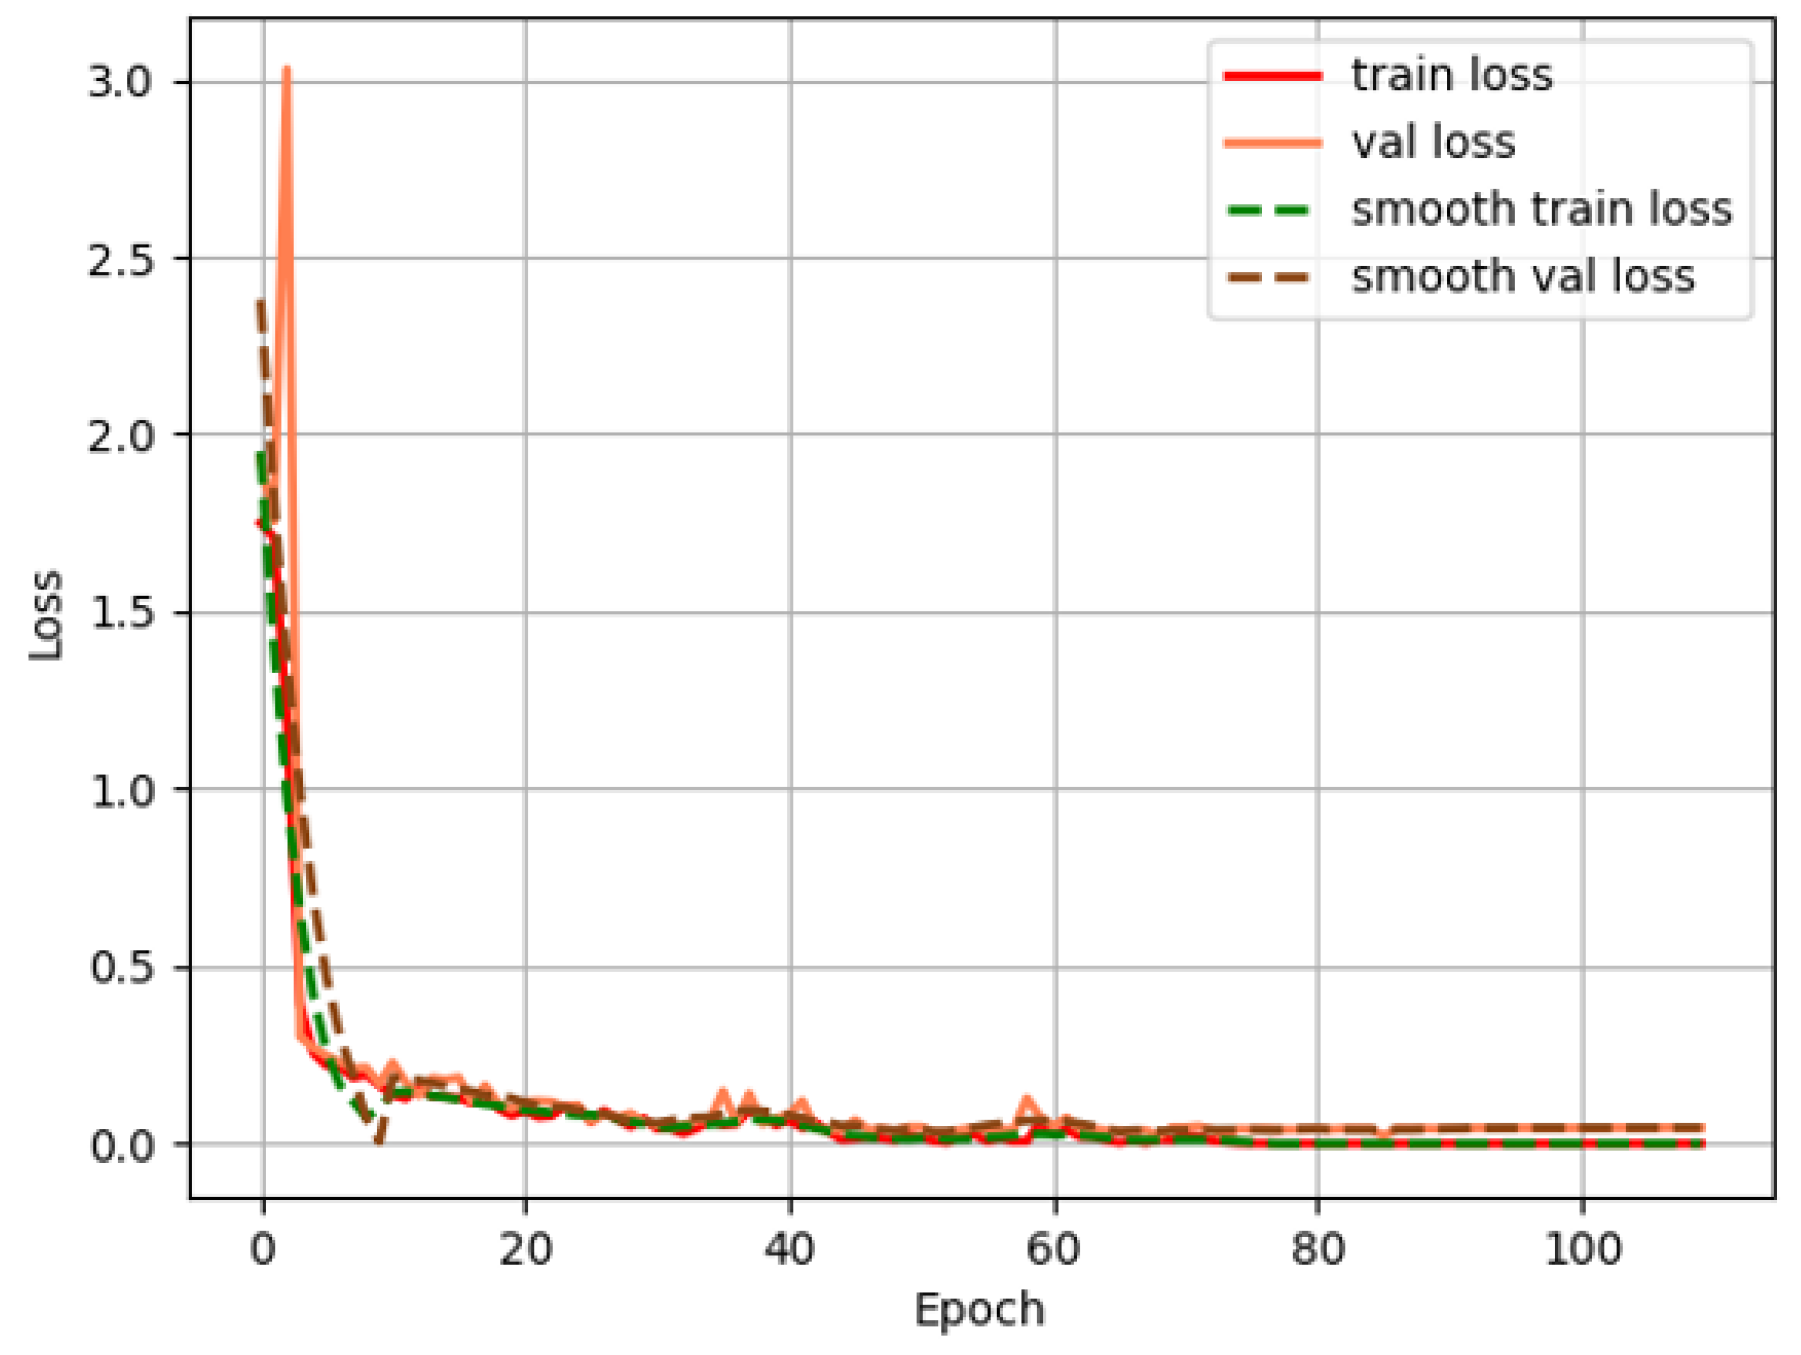
4.5. Training of the Identification Model for the Diagenetic Facies of Tight Oil Reservoirs

The training process of the C-ViTM method includes two stages. In the first stage, the transfer learning technology [42] was applied for pre-training of the C-ViTM model to improve the learning efficiency of the model. In the second stage, the adaptive gradient descent method (Adam) [43] was used to update the model training parameter θ t and complete iterative training. The update process of training parameter θ t is described below:
Step 1: Calculate the gradient information g t of small batch samples.
g t = θ J θ , X t , y t
where J θ , X t , y t represents the objective function and X t and y t represent the features and labels of a small batch of samples, respectively.
Step 2: Calculate the first matrix estimator S t and the second matrix vector R t .
S t = β 1 S t 1 + 1 β 1 g t
R t = β 2 R t 1 + 1 β 2 g t 2
where S t represents the first matrix estimation vector and R t represents the second matrix estimation vector. β 1 and β 2 represent the decay rate, with values of 0.9 and 0.999, respectively.
Step 3: Calculate the gradient information g t after bias correction.
S t = S t 1 β 1 t
R t = R t 1 β 2 t
g t = α S t R t + ϵ
where S t and R t represent the first matrix estimation vector and the second matrix estimation vector after bias correction, respectively. α indicates the learning rate. ϵ represents the smoothing item, with a value of 10 8 , preventing division by 0.
Step 4: Update the model parameter θ t .
θ t = θ t 1 g t
The iterative process loss is shown in Figure 10. It can be seen from the figure that the 70th epoch model tends to be stable.

5. Experimental Scheme

The experiment was divided into three parts: experiment of identification effect for different thickness units, accuracy comparison experiment and single-well identification effect. The specific parameters of the experimental devices are shown below: Intel Xeon Silver 4210R CPU, 64 G memory, RTX 6000/8000 GPU; Ubuntu 20.04.3 operating system; PyTorch 1.7.1 experimental framework.

5.1. Experiment of the Identification Effect for Different Thickness Units

The experiment of identification effect for different thickness units took mean Average Accuracy (mAA) [44] and mean Average Precision (mAP) [45] as evaluation indicators.
mAA denotes the average of the identification accuracy of multiple diagenetic facies types. Accuracy represents the proportion of the number correctly identified in the total, which is expressed by Equation (11), where TP is the number of correctly identified diagenetic facies, and N is the total number.
Accuracy = T P N
mAP represents the average of the average precision (AP) of multiple diagenetic facies types. AP refers to the area below the Precision—Recall curve. Precision represents the proportion of the correct number in the identified diagenetic facies types, which can be represented by Equation (12). Recall represents the proportion of the correct number in the actual composition, which can be expressed by Equation (13). The value of mAP is in the range of [0, 1]. A larger value indicates a better identification effect.
Precision = TP / ( TP + FP )
Recall = TP / ( TP + FN )
where TP represents a true positive test; FP represents a false positive test; FN represents a false negative test.
In the experiment process, data sets of the same number with intervals of 0.50 m, 0.75 m, 1.00 m and 1.25 m were selected to calculate the Accuracy and AP values of the C-ViTM algorithm for the identification results of various diagenetic facies, and the mAA and mAP values were calculated. The number of various diagenetic facies is shown in Table 3.

5.2. Accuracy Comparison Experiment

In the accuracy comparison experiment, the Precision, Recall and F1 score [46] of the identification results of diagenetic facies types were calculated as evaluation indicators by establishing the confusion matrix. The meanings and calculation methods of Precision and Recall are the same as those in Section 5.1. The F1 score was calculated based on Precision and Recall, and can be expressed by Equation (14). The value of F1 score is in the range of [0, 1]. A larger value indicates a better identification effect.
F 1 = 2 × Precision × Recall Precision + Recall  
In the experiment process, data sets of the same number were selected, CNN algorithm, ViT algorithm and C-ViTM algorithm were used to identify diagenetic facies, and Precision, Recall and F1 score were calculated to verify the effectiveness of the C-ViTM algorithm.

5.3. Single-Well Identification Effect Experiment

The Jaccard index [47] was used as the evaluation indicator in the single-well identification effect experiment. The Jaccard index completes the judgment by calculating the intersection over union between the thickness of various diagenetic facies in a single well judged by geologists (A) and the thickness of various diagenetic facies identified by C-ViTM (B). The Jaccard index can be expressed by Equation (15).
J A , B = A B A B , 0 J A , B 1

6. Results and Discussion

6.1. Experimental Results of the Identification Effect for Different Thickness Units

The calculation results of mAA and mAP in the identification effect of diagenetic facies with different thickness units are shown in Figure 11. Figure 11 shows that the identification effect of various diagenetic facies is the best at the thickness unit of 0.5 m. The Accuracy and mAA values of the identification result of various diagenetic facies are all above 0.9, and the calculation results of AP value and mAP value are above 0.76. This is because the mAA and mAP values of different diagenetic facies are related to the thickness of various diagenetic facies and the thickness of sample intervals. In addition, Mip and Mp have higher scores at the thickness units of 1.00 m and 1.25 m, possibly due to the larger thickness of their diagenetic facies samples. This phenomenon is also verified by the statistical results in Figure 4.
Since the 0.5 m thickness unit realized the best identification result, the sample of 0.5 m thickness unit was used for the accuracy experiment.

6.2. Accuracy Comparison Experiment Results

To verify the accuracy of the C-ViTM method in identifying diagenetic facies, the confusion matrix of the C-ViTM, CNN and ViT methods was constructed, and the influence of geological characteristics on the method was analyzed, as shown in Figure 12. The calculation results of Precision, Recall and F1 score are shown in Figure 13.
According to Figure 12, the C-ViTM method has the best effect on the identification of diagenetic facies, and the CNN method has a higher identification accuracy than ViT, proving that the proposed method can identify diagenetic facies of tight reservoirs better than a single CNN model and ViT model. Due to the limited number of selected target data sets, the CNN method shows a better identification effect compared to the ViT method. This phenomenon has been verified in natural image identification [23]. In addition, it can be seen from Figure 12 that Wip is mainly misjudged as Mip and Mp; Wap is mainly misjudged as Msap and Map; Map is mainly misjudged as Wap, Mip and Wip; Mip is mainly misjudged as Wip, Mp and Map; Msap is mainly misjudged as Wap and Map; Mp is mainly misjudged as Wip and Wap. The cause of misjudgment is related to the internal structural characteristics during the formation of diagenetic facies, which makes the logging curves have similar characteristics [46]. At the same time, it is found that although the diagenetic facies of the same type are subjected to similar compaction, cementation and dissolution, the different action intensity and diagenetic grade result in different particle size sorting and pore connectivity of their components, which affect the reservoir performance.
Figure 13 shows that the Precision, Recall and F1 score of C-ViTM method are higher than those of the CNN method and ViT method, and those of the CNN method are higher than those of the ViT method. It is known from Figure 13a that the three methods have the lowest efficiency for Wap, mainly because Wap and Msap logging curves have similar characteristics, so that some Msaps are misjudged as Wap, reducing the Precision. The same phenomenon also exists in Wip and Mip. The C-ViTM method has a Precision of over 86% for various diagenetic facies, indicating its high Precision. It is learned from Figure 13b that the three methods have the lowest efficiency for Map, mainly because its sample size is relatively small, and some Maps are misjudged. The C-ViTM method has a Recall of over 90% for various diagenetic facies, indicating its good Recall. In Figure 13c, the C-ViTM method has the highest FI scores, which are all above 89%, indicating that it has a good identification effect on various diagenetic facies and can meet the accuracy requirements for identifying the diagenetic facies of tight reservoirs. In addition, the labeling of sample labels also affects the identification efficiency of the three methods.

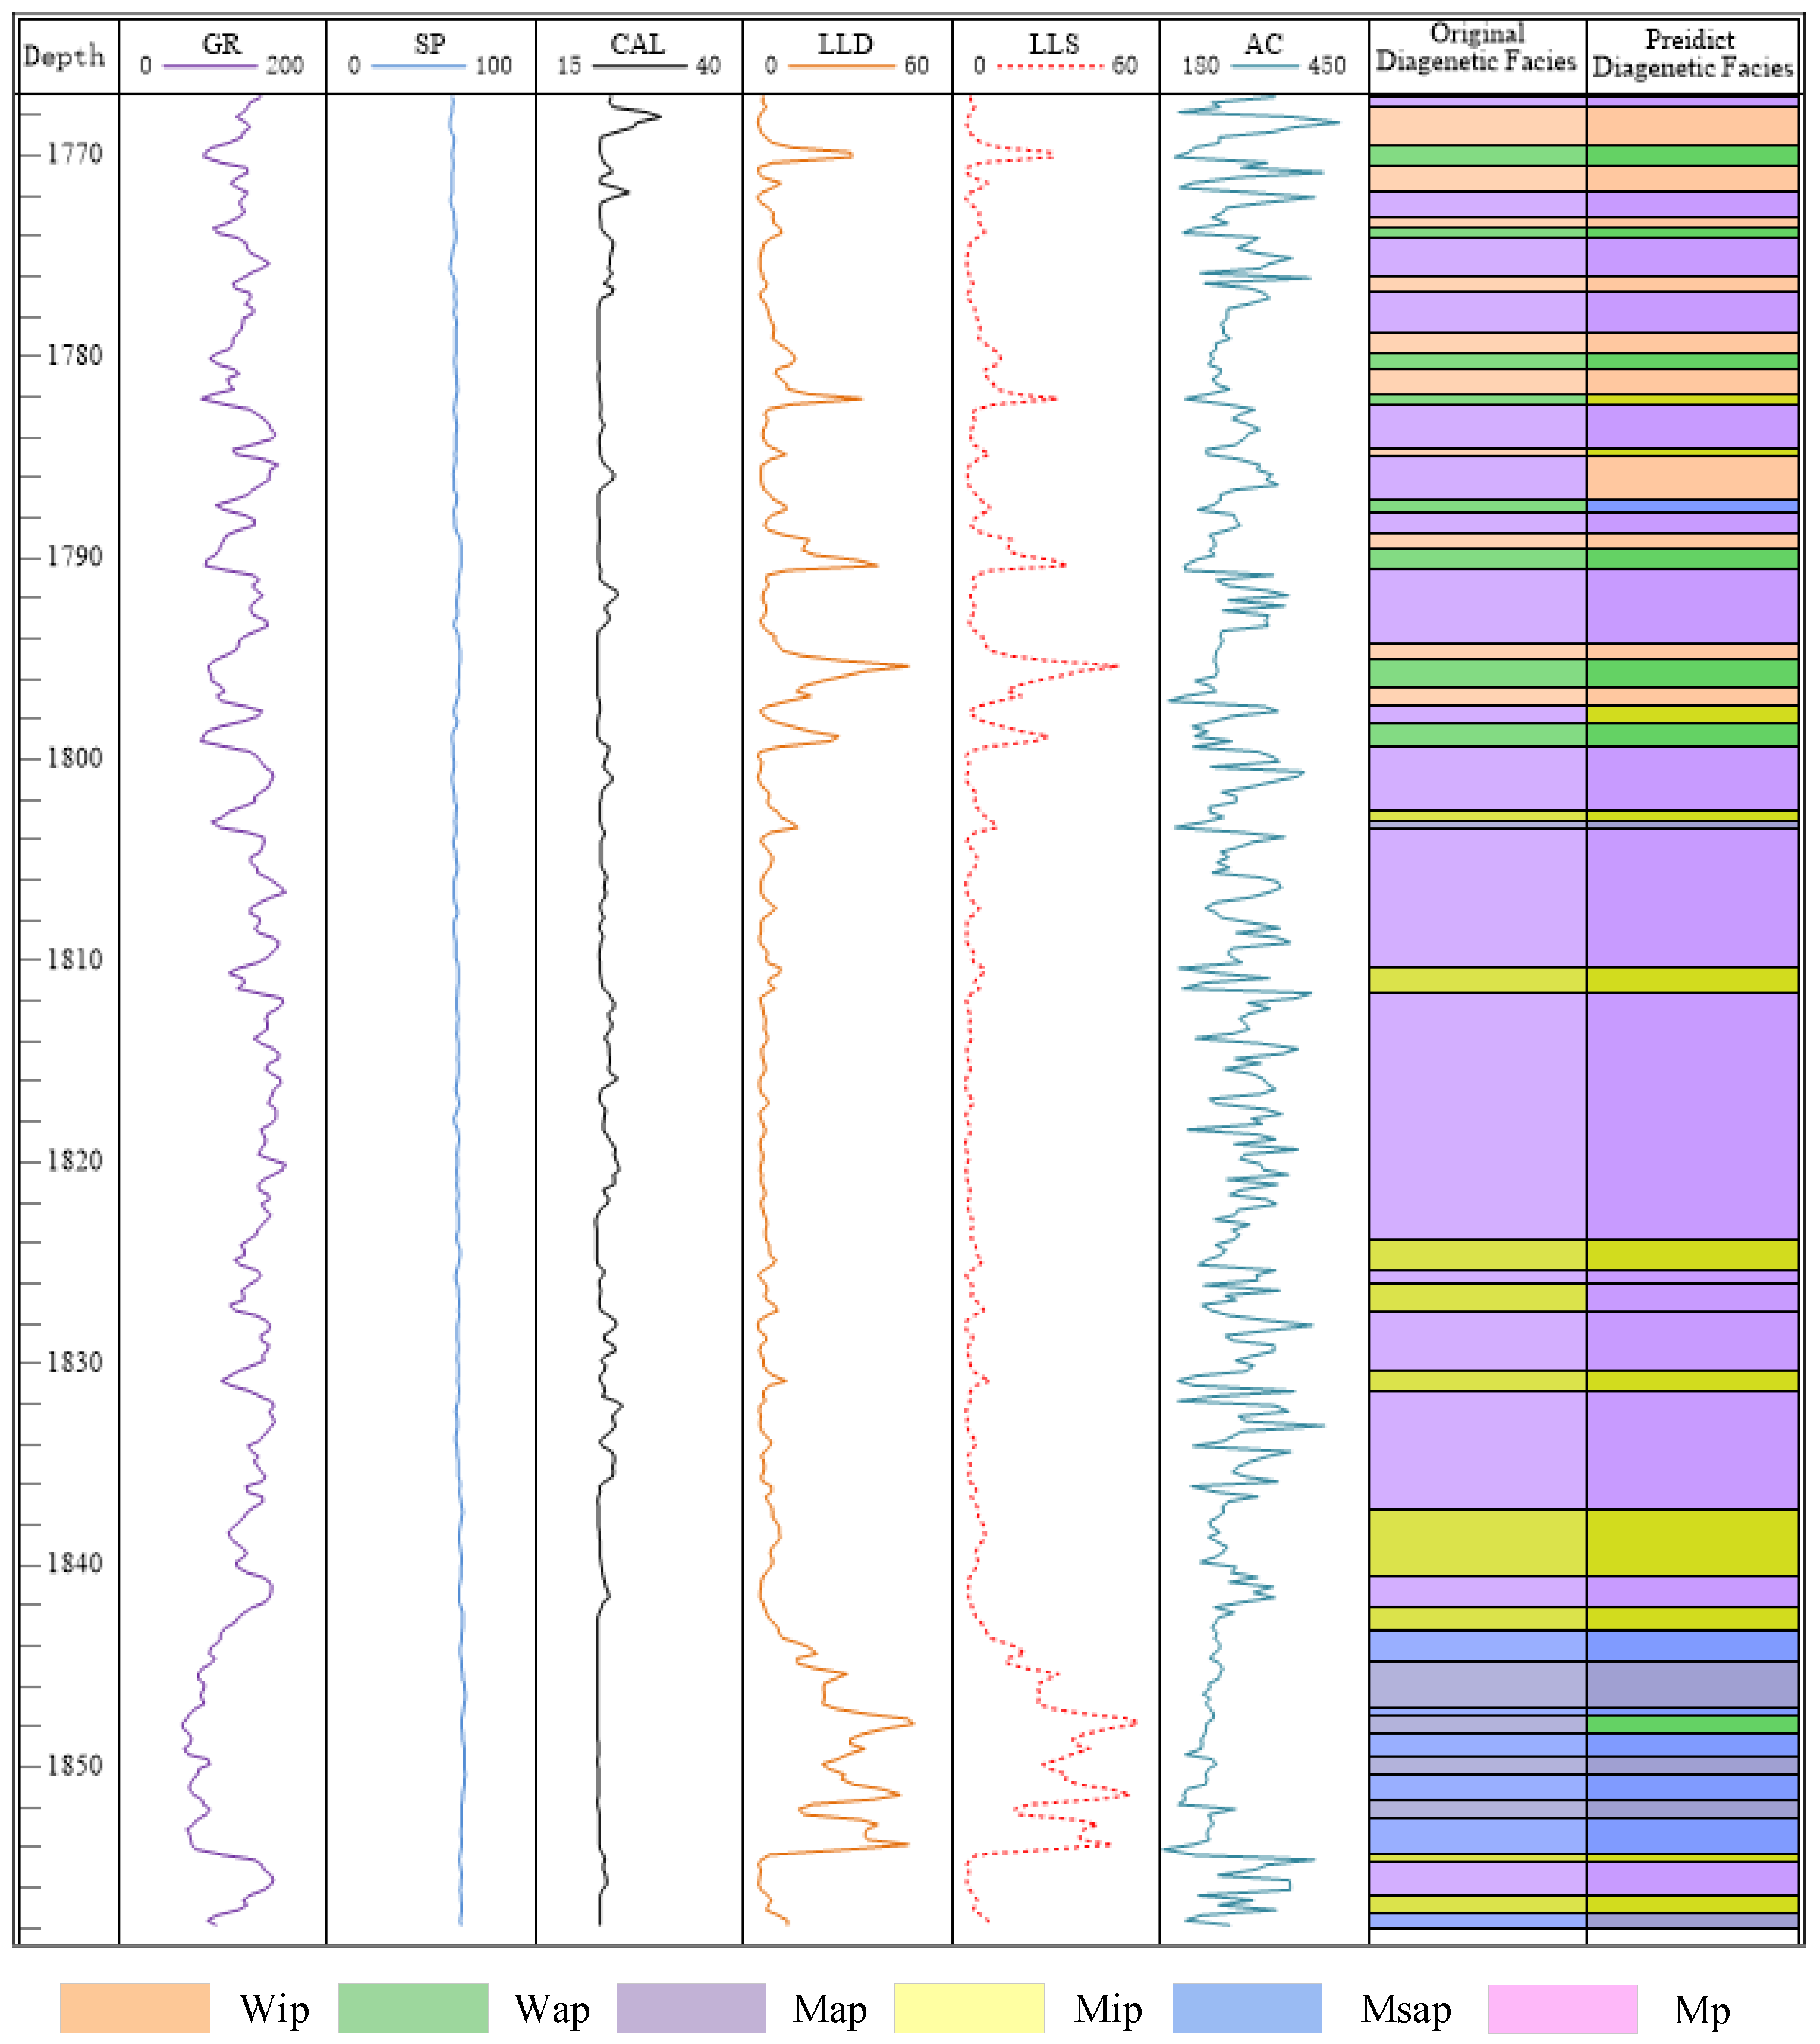
6.3. Experimental Results of the Single-Well Identification Effect

To further validate the effectiveness of the C-ViTM method, a well from Fuyu reservoir in Sanzhao Sag, Songliao Basin (not involved in the training) was randomly selected for verification, and the identification results are shown in Figure 14. The Original Diagnostic Facies in the figure are the results of manual identification, and the division of diagenetic facies is mainly based on core data and logging response characteristics. Predicted Diagenetic Facies are the identification results of the C-ViTM method (the color is slightly deepened for distinction). The calculation results of the Jaccard index for various diagenetic facies are shown in Table 4. Table 4 shows that the Jaccard index of various diagenetic facies in a single well is above 0.74, and the average Jaccard index is 0.79, indicating that the C-ViTM method has a good single-well identification effect and can be applied to the identification of diagenetic facies of tight reservoirs, with good application effect. Since the selected single well is the well in the target area and has the same depositional environment, it has a good identification effect. For the identification of diagenetic facies of other tight reservoirs with similar geological characteristics, further research is needed according to the logging data.

6.4. Application Prospect and Limitation Analysis of the C-ViTM Method in Diagenetic Facies Identification

As a diagenetic facies identification method based on hybrid intelligence, the C-ViTM method has higher identification accuracy, and can replace the manual identification of the diagenetic facies of tight reservoirs to a certain extent to determine the location of high-quality reservoirs. However, due to the influence of sedimentation and diagenesis on the characteristics of tight reservoirs, various diagenetic facies have similar characteristics to some extent, resulting in misjudgment. At the same time, the identification effect of the C-ViTM method is easily affected by the quantity of various diagenetic facies samples, the geometric characteristics of logging curves and the design of model structure, so it needs to be further optimized in the identification of the diagenetic facies of other types of reservoirs such as carbonate reservoir and volcanic reservoir.

7. Conclusions

Based on the intersection of geological big data and artificial intelligence, a new C-ViTM method for the identification of the diagenetic facies of tight oil reservoirs was proposed in this study, which solves the problems such as difficulty in the identification of the diagenetic facies of tight oil reservoirs, time cost and human cost.
(1)
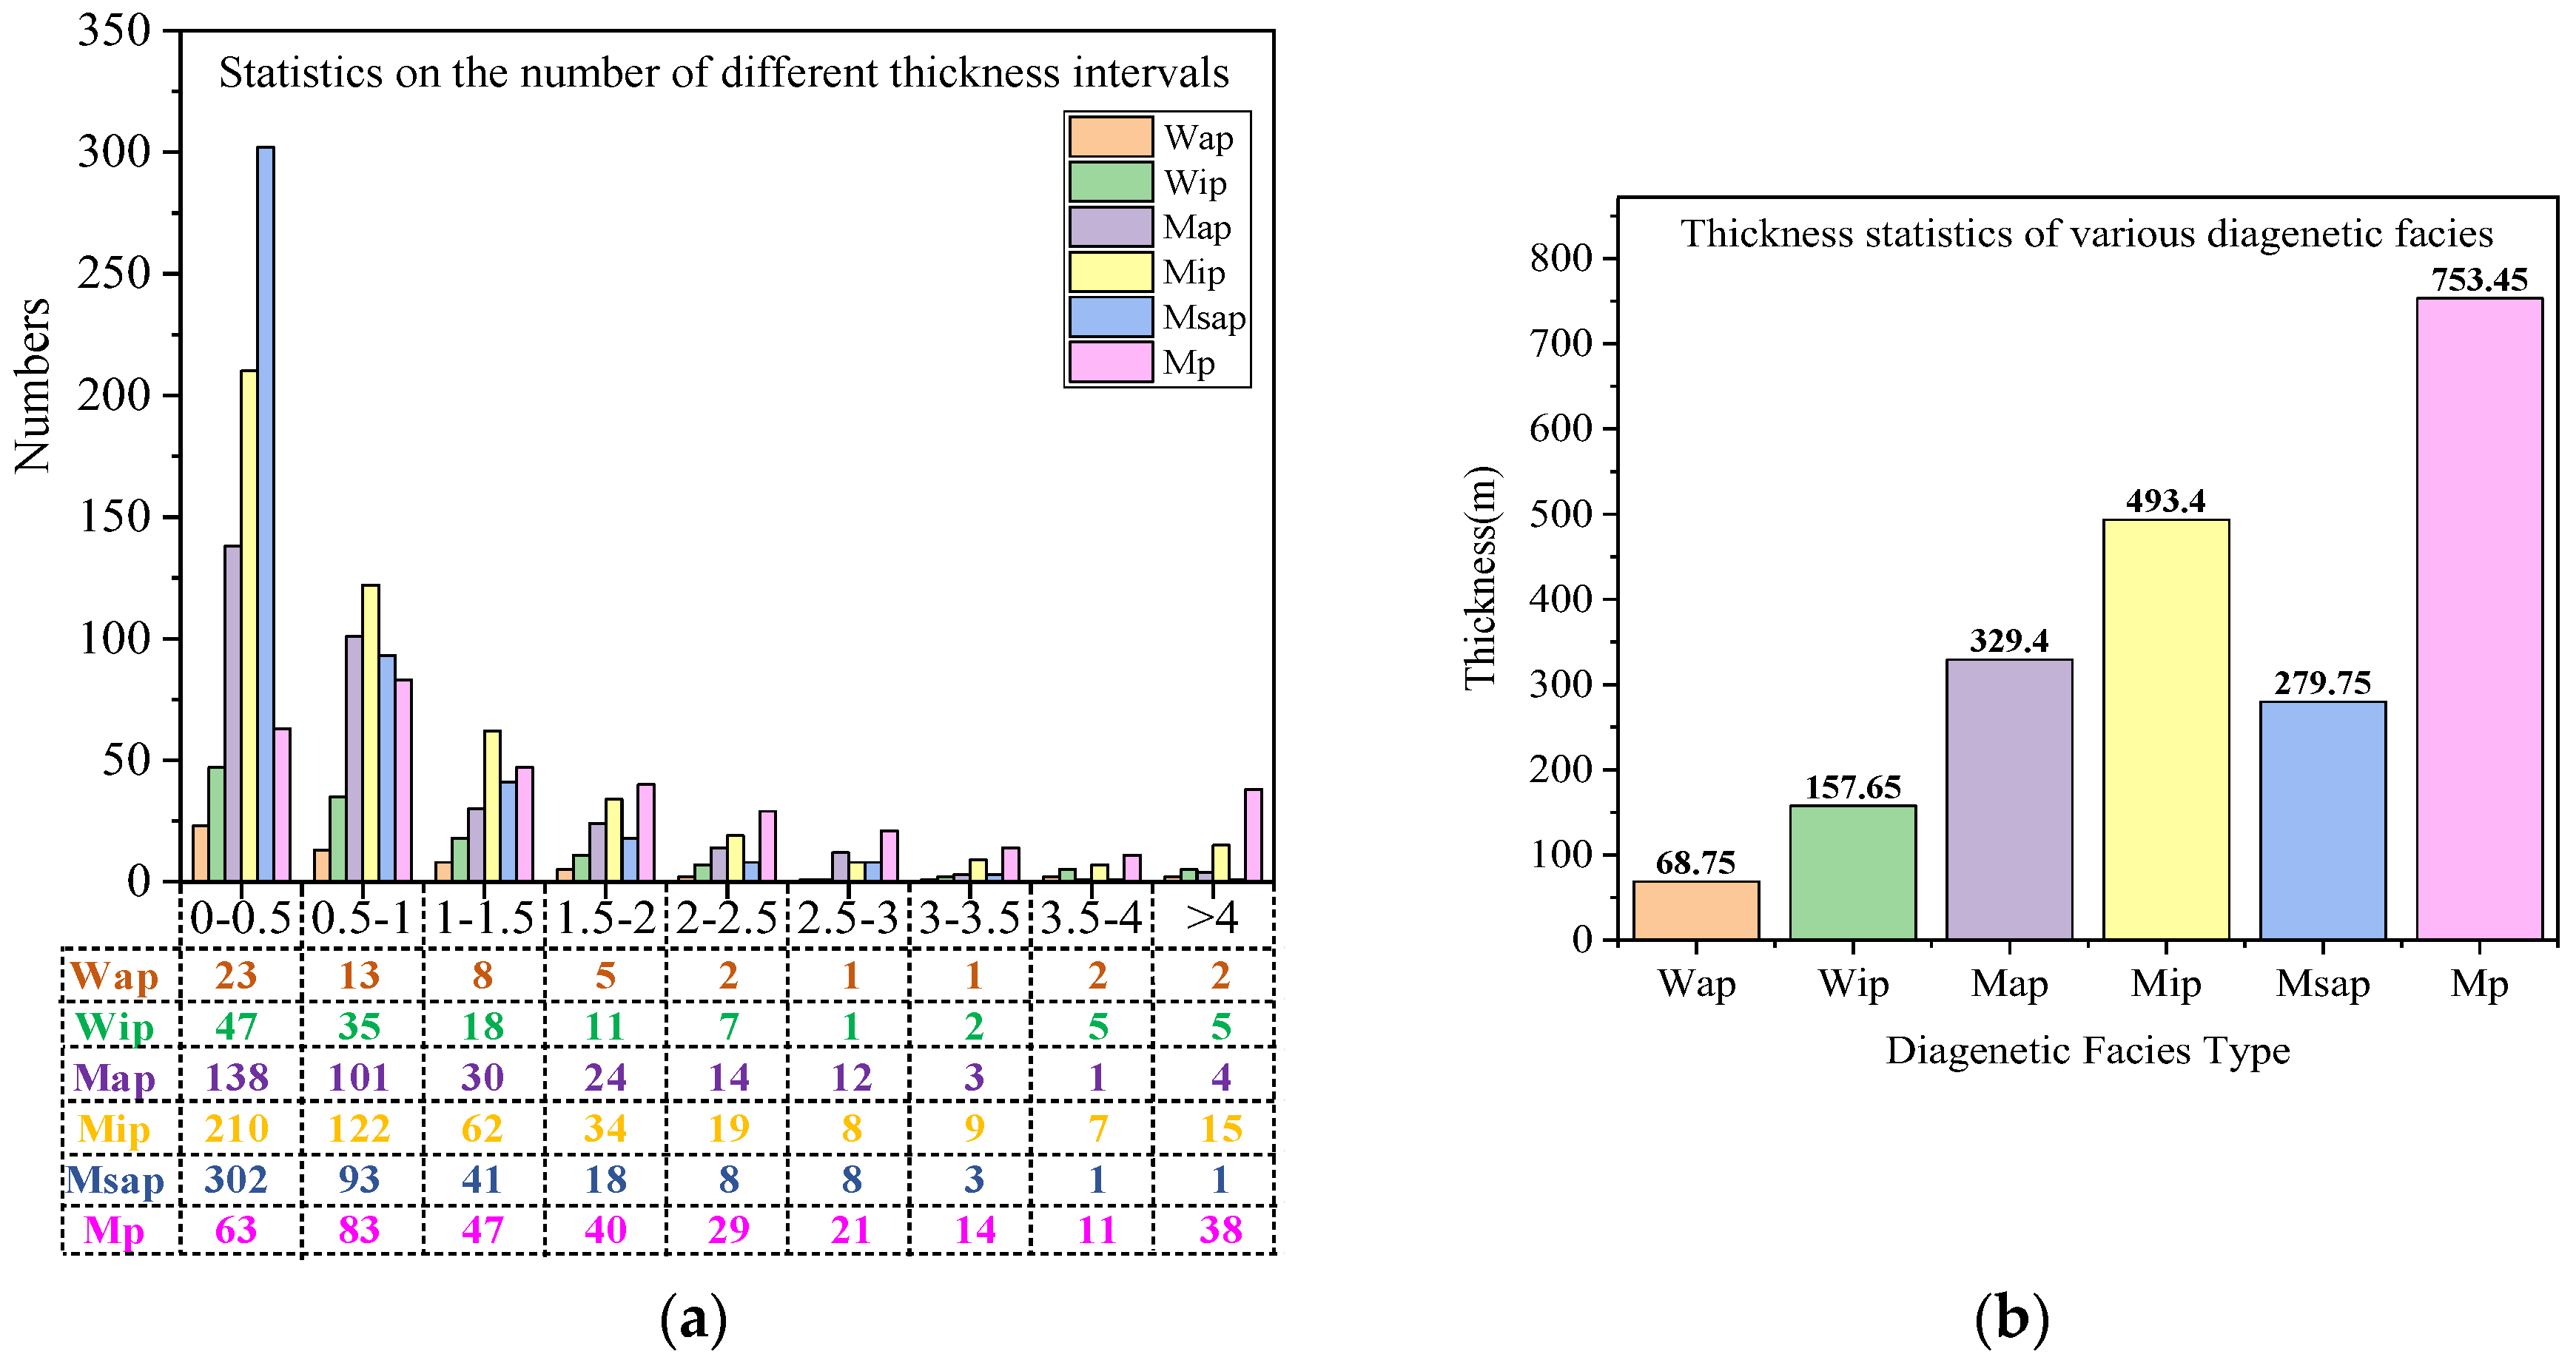
Based on core data and logging response characteristics, the diagenetic facies of tight reservoirs of Fuyu reservoir in Sanzhao Sag were classified into seven types: Wip, Wap, Mip, Map, Msap, Mp, etc. The relationship between diagenetic facies and reservoir performance was established. Wip, Wap and Mip were classified as Class I reservoirs; Map and Msap were classified as Class II reservoirs; Mp was classified as a Class III reservoir. The reservoir performance was completed while realizing diagenetic facies identification.
(2)
By comparing the identification results of diagenetic facies at different thickness intervals of 0.50 m, 0.75 m, 1.00 m and 1.25 m, it was found that the best identification effect can be realized at the sample thickness of 0.50 m, indicating that the identification results are related to the thickness of various diagenetic facies and the thickness of sample intervals.
(3)
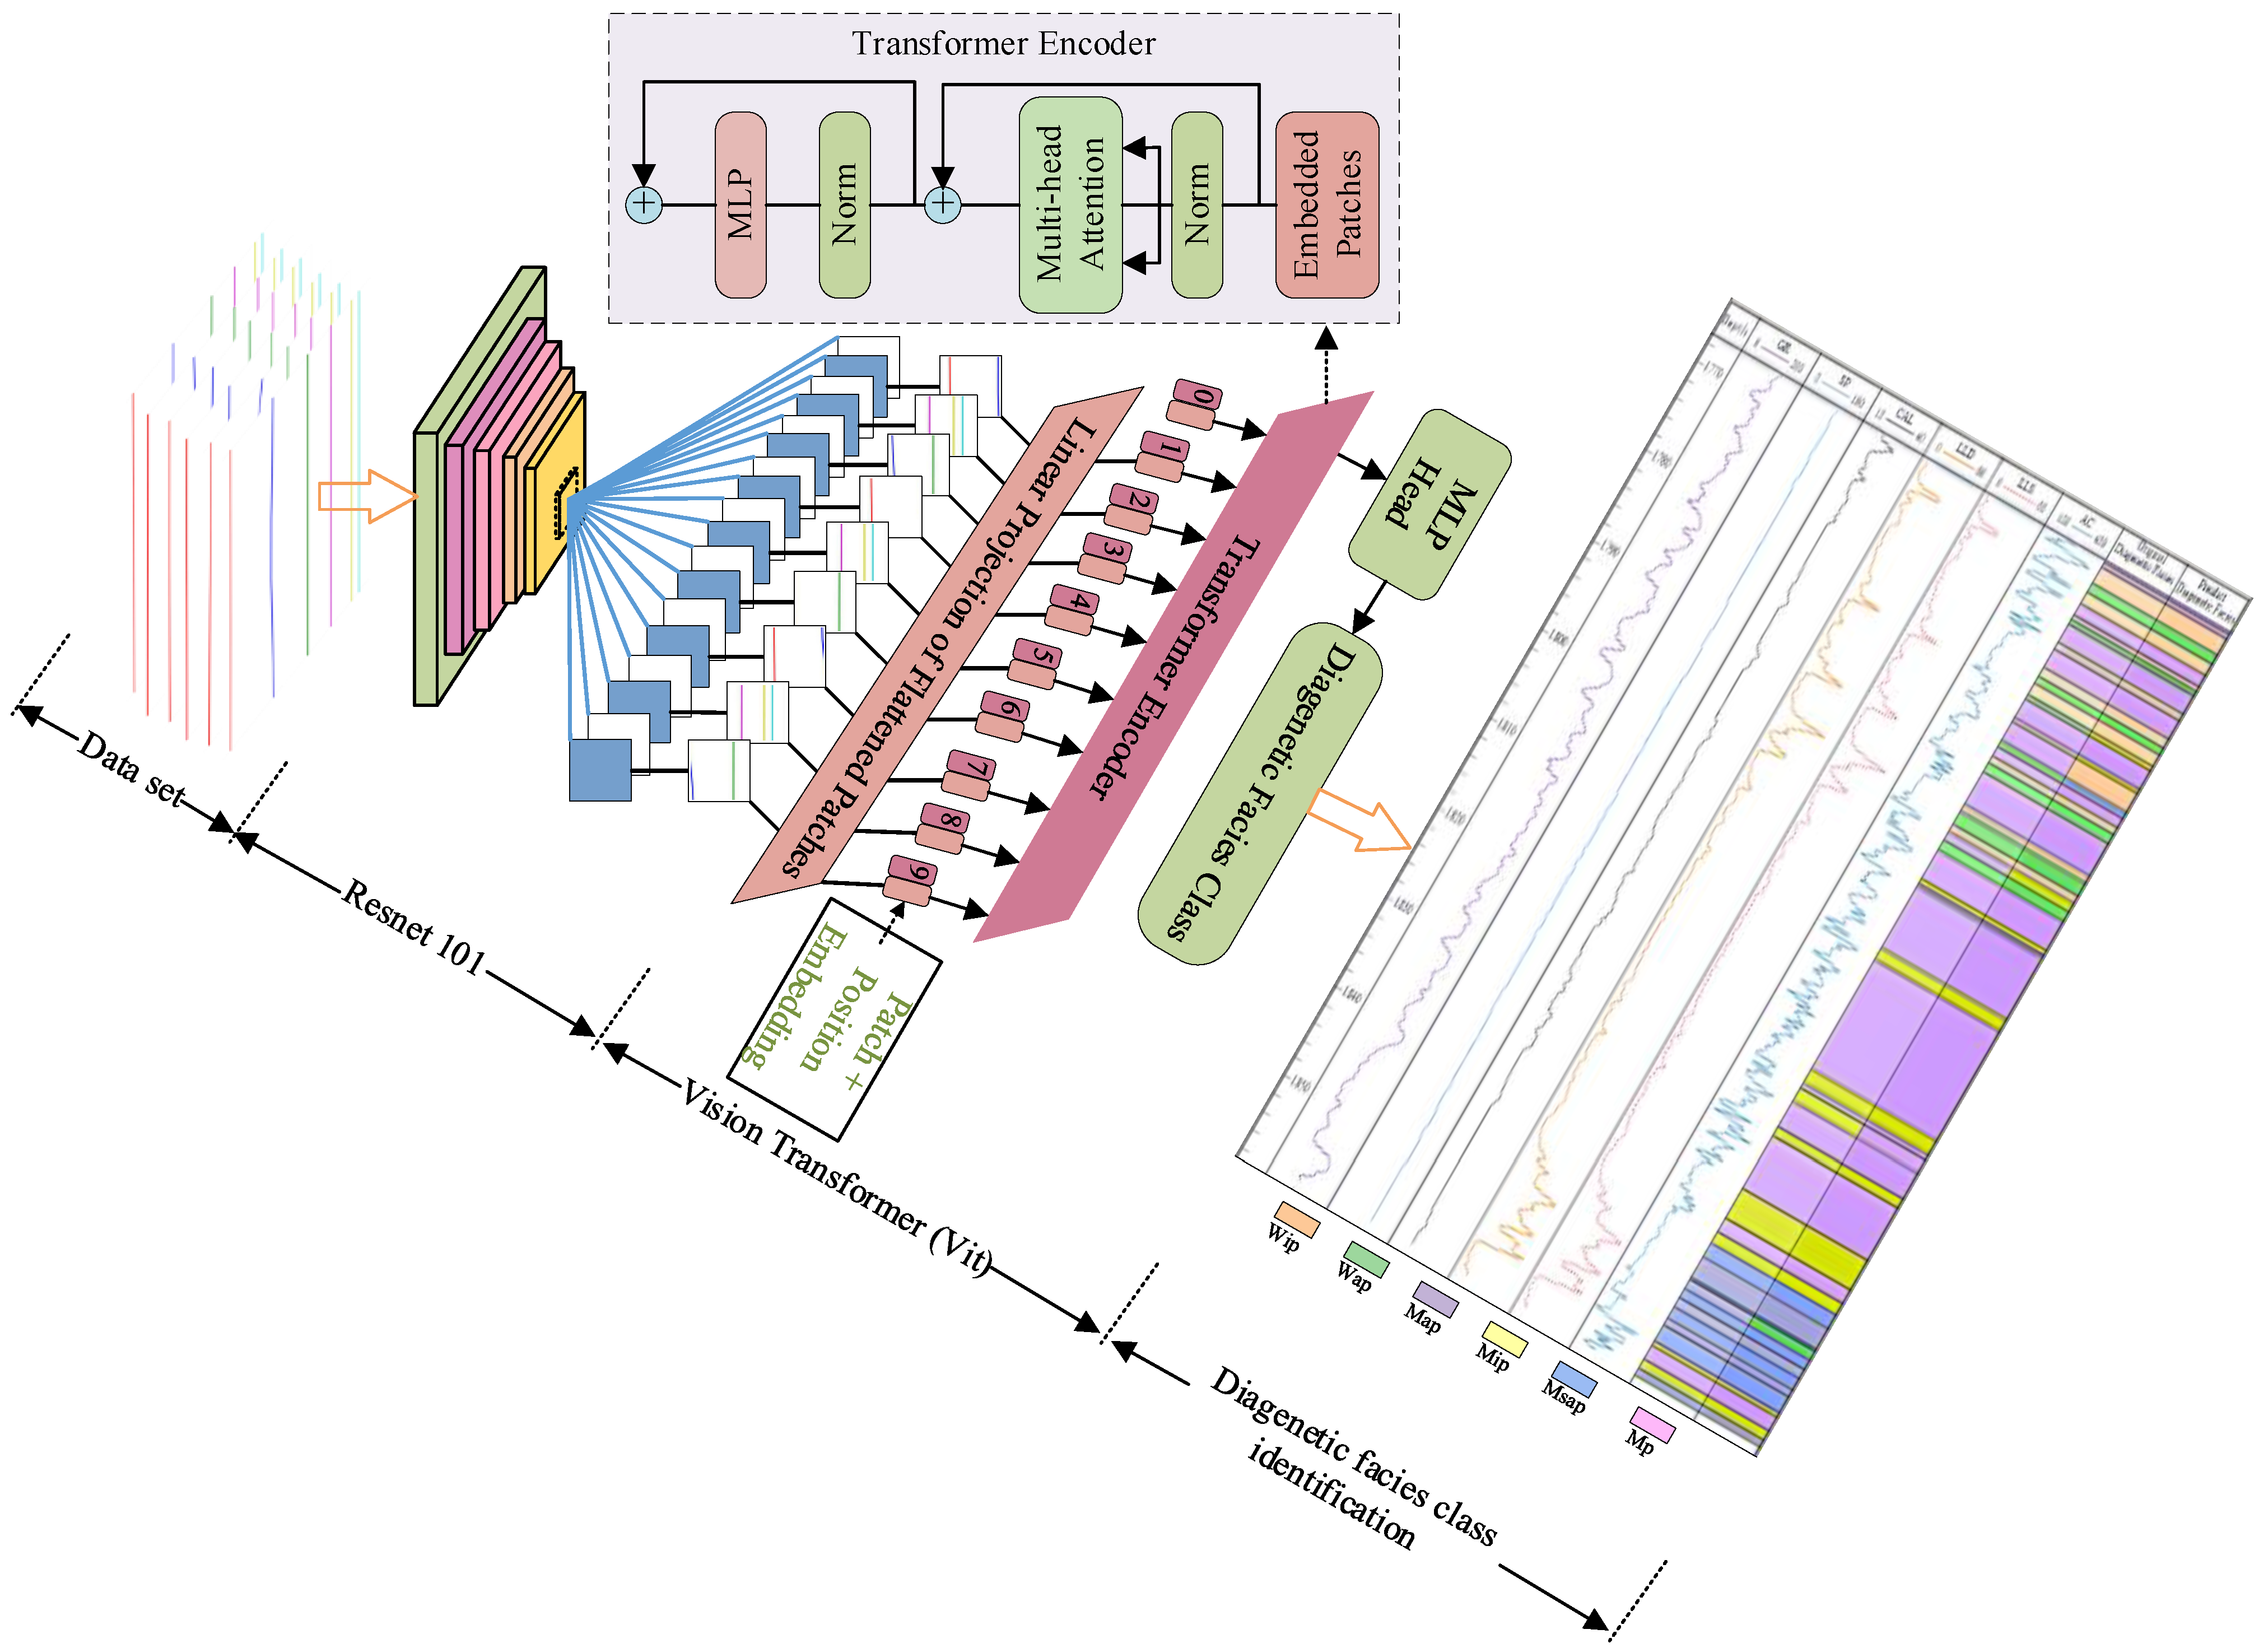
Compared with the single methods of CNN and ViT, C-ViTM has a better identification effect, with Precision of above 86%, Recall of above 90% and FI score of above 89%. The C-ViTM method is suitable for the identification of the diagenetic facies of tight reservoirs, but the identification effect is easily affected by the number of samples and the similarity of the internal structural features of diagenetic facies (the similarity of logging curve features), such as Wip and Mip.
(4)
The average Jaccard index calculated by using the C-ViTM method in diagenetic facies identification of a single well is 0.79, indicating that the C-ViTM method has a good identification effect and wide application prospects.
In future work, we expect to optimize the C-ViTM method so that it can be better applied to the identification and evaluation of diagenetic facies in other reservoirs such as shale oil reservoirs, and evaluate the potential application of this method.

Author Contributions

T.L.: Methodology, Software, Investigation, Data Curation, Writing—Original Draft, Visualization, Project administration. Z.L.: Conceptualization, Methodology, Resources, Writing—Review & Editing, Funding acquisition. K.Z.: Formal analysis, Writing—Review & Editing, Funding acquisition. C.L.: Methodology, Writing—Review & Editing. Y.Z.: Formal analysis, Visualization. Z.M.: Data Curation, Visualization. F.L.: Resources, Supervision. X.L.: Investigation, Project administration, Funding acquisition. M.M.: Software, Validation, Visualization. S.Z.: Data Curation, Investigation. All authors have read and agreed to the published version of the manuscript.

Funding

This research is supported by the National Natural Science Foundation of China (42172161), the Youth Fund of the National Natural Science Foundation of China (42102173), the CNPC Innovation Foundation (2020D-5007-0102), the Heilongjiang Provincial Natural Science Foundation of China (YQ2020D001), the Heilongjiang Provincial Natural Science Foundation of China (LH2020F003) and the Heilongjiang Provincial Department of Education Project of China (UNPYSCT-2020144).

Data Availability Statement

The original contributions presented in the study are included in the article, further inquiries can be directed to the corresponding authors.

Conflicts of Interest

The authors declare that they have no known competing financial interests or personal relationships that could have appeared to influence the work reported in this paper.

References

  1. Huang, L.; Yan, J.; Liu, M.; Zhang, Z.; Ye, S.; Zhang, F.; Zhong, G.; Wang, M.; Wang, J.; Geng, B. Diagenetic facies logging identification and application of deep tight sandstone gas reservoir: A case study of the third member of Xujiahe formation in Dayi area of western Sichuan depression. J. China Univ. Min. Technol. 2022, 51, 107–123. [Google Scholar]
  2. Lai, J.; Wang, G.; Wang, S.; Cao, J.; Li, M.; Pang, X.; Zhou, Z.; Fan, X.; Dai, Q.; Yang, L.; et al. Review of diagenetic facies in tight sandstones: Diagenesis, diagenetic minerals, and prediction via well logs. Earth-Sci. Rev. 2018, 185, 234–258. [Google Scholar] [CrossRef]
  3. Liu, F.; Wang, X.; Liu, Z.; Tian, F.; Zhao, Y.; Pan, G.; Peng, C.; Liu, T.; Zhao, L.; Zhang, K.; et al. Identification of tight sandstone reservoir lithofacies based on CNN image recognition technology: A case study of Fuyu reservoir of Sanzhao Sag in Songliao Basin. Geoenergy Sci. Eng. 2023, 222, 211459. [Google Scholar] [CrossRef]
  4. Guo, Q.; Wang, S.; Chen, X. Assessment on tight oil resources in major basins in China. J. Asian Earth Sci. 2019, 178, 52–63. [Google Scholar] [CrossRef]
  5. Qi, M.; Han, C.; Ma, C.; Liu, G.; He, X.; Li, G.; Yang, Y.; Sun, R.; Cheng, X. Identification of Diagenetic Facies Logging of Tight Oil Reservoirs Based on Deep Learning—A Case Study in the Permian Lucaogou Formation of the Jimsar Sag, Junggar Basin. Minerals 2022, 12, 913. [Google Scholar] [CrossRef]
  6. Liu, T.; Li, C.; Liu, Z.; Zhang, K.; Liu, F.; Li, D.; Zhang, Y.; Liu, Z.; Liu, L.; Huang, J. Research on Image Identification Method of Rock Thin Slices in Tight Oil Reservoirs Based on Mask R-CNN. Energies 2022, 15, 5818. [Google Scholar] [CrossRef]
  7. Lai, J.; Wang, G.W.; Ran, Y.; Zhou, Z.L.; Cui, Y.F. Impact of diagenesis on the petrophysical properties of tight oil reservoirs: The case of Upper Triassic Yanchang Formation Chang 7 oil layers in Ordos Basin. J. Pet. Sci. Eng. 2016, 145, 54–65. [Google Scholar] [CrossRef]
  8. Lai, J.; Wang, G.; Fan, Z.; Zhou, Z.; Chen, J.; Wang, S. Fractal analysis of tight shaly sandstones using nuclear magnetic resonance measurements. AAPG Bull. 2018, 102, 175–193. [Google Scholar] [CrossRef]
  9. Ma, P.; Lin, C.; Zhang, S.; Dong, C.; Zhao, Y.; Dong, D.; Shehzad, K.; Awais, M.; Guo, D.; Mu, X. Diagenetic history and reservoir quality of tight sandstones: A case study from Shiqianfeng sandstones in upper Permian of Dongpu Depression, Bohai Bay Basin, eastern China. Mar. Pet. Geol. 2018, 89, 280–299. [Google Scholar] [CrossRef]
  10. Su, Y.; Zha, M.; Ding, X.; Qu, J.; Gao, C.; Jin, J.; Iglauer, S. Petrographic, palynologic and geochemical characteristics of source rocks of the Permian Lucaogou formation in Jimsar Sag, Junggar Basin, NW China: Origin of organic matter input and depositional environments. J. Pet. Sci. Eng. 2019, 183, 106364. [Google Scholar] [CrossRef]
  11. Lin, M.; Xi, K.; Cao, Y.; Liu, Q.; Zhang, Z.; Li, K. Petrographic features and diagenetic alteration in the shale strata of the Permian Lucaogou Formation, Jimusar sag, Junggar Basin. J. Pet. Sci. Eng. 2021, 203, 108684. [Google Scholar] [CrossRef]
  12. Lai, J.; Wang, G.; Chai, Y.; Ran, Y. Prediction of diagenetic facies using well logs: Evidences from Upper Triassic Yanchang Formation Chang 8 sandstones in Jiyuan region, Ordos basin, China. Oil Gas Sci. Technol.–Rev. D’ifp Energ. Nouv. 2016, 71, 34. [Google Scholar] [CrossRef]
  13. Zou, C.-N.; Tao, S.-Z.; Zhou, H.; Zhang, X.-X.; He, D.-B.; Zhou, C.-M.; Wang, L.; Wang, X.-S.; Li, F.-H.; Zhu, R.-K.; et al. Genesis, classification and evaluation method of diagenetic facies. Pet. Explor. Dev. 2008, 35, 526–540. [Google Scholar] [CrossRef]
  14. Lai, J.; Fan, X.; Pang, X.; Zhang, X.; Xiao, C.; Zhao, X.; Han, C.; Wang, G.; Qin, Z. Correlating diagenetic facies with well logs (conventional and image) in sandstones: The Eocene–Oligocene Suweiyi Formation in Dina 2 Gasfield, Kuqa depression of China. J. Pet. Sci. Eng. 2019, 174, 617–636. [Google Scholar] [CrossRef]
  15. Li, Y.; Chang, X.; Yin, W.; Sun, T.; Song, T. Quantitative impact of diagenesis on reservoir quality of the Triassic Chang 6 tight oil sandstones, Zhenjing area, Ordos Basin, China. Mar. Pet. Geol. 2017, 86, 1014–1028. [Google Scholar] [CrossRef]
  16. Ma, B.; Yang, S.; Zhang, H.; Kong, Q.; Song, C.; Wang, Y.; Bai, Q.; Wang, X. Diagenetic facies quantitative evaluation of low-permeability sandstone: A case study on Chang 82 reservoirs in the Zhenbei area, Ordos basin. Energy Explor. Exploit. 2018, 36, 414–432. [Google Scholar] [CrossRef]
  17. Ran, Y.; Wang, G.W.; Lai, J.; Zhou, Z.L.; Cui, Y.F.; Dai, Q.Q.; Chen, J.; Wang, S.C. Quantitative characterization of diagenetic facies of tight sandstone oil reservoir by using logging crossplot: A case study on Chang 7 tight sandstone oil reservoir in Huachi area, Ordos Basin. Acta Sedimentol. Sin. 2016, 34, 694–706. [Google Scholar]
  18. Shi, Y.; Xiao, L.; Mao, Z.; Guo, H. An identification method for diagenetic facies with well logs and its geological significance in low-permeability sandstones: A case study on Chang 8 reservoirs in the Jiyuan region, Ordos Basin. Acta Pet. Sin. 2011, 32, 820–828. [Google Scholar]
  19. Lai, J.; Wang, G.W.; Wang, S.N.; Xin, Y.; Wu, Q.K.; Zheng, Y.Q.; Li, J.; Cang, D. Overview and research progress in logging recognition method of clastic reservoir diagenetic facies. J. Cent. South Univ. (Sci. Technol.) 2013, 44, 4942–4953. [Google Scholar]
  20. Ozkan, A.; Cumella, S.P.; Milliken, K.L.; Laubach, S.E. Prediction of lithofacies and reservoir quality using well logs, late cretaceous Williams fork formation, Mamm creek field, Piceance basin, Colorado. AAPG Bull. 2011, 95, 1699–1723. [Google Scholar] [CrossRef]
  21. Cui, Y.; Wang, G.; Jones, S.J.; Zhou, Z.; Ran, Y.; Lai, J.; Li, R.; Deng, L. Prediction of diagenetic facies using well logs–A case study from the upper Triassic Yanchang Formation, Ordos Basin, China. Mar. Pet. Geol. 2017, 81, 50–65. [Google Scholar] [CrossRef]
  22. Zhu, P.; Lin, C.Y.; Wu, P.; Fan, R.F.; Wang, D.R.; Liu, X.L. Logging quantitative identification of diagenetic facies by using principal component analysis: A case of Es3x1 in Zhuang62-66 Area, Wu Hao-zhuang Oil field. Prog. Geophys. 2015, 30, 2360–2365. [Google Scholar]
  23. Dosovitskiy, A.; Beyer, L.; Kolesnikov, A.; Weissenborn, D.; Zhai, X.; Unterthiner, T.; Dehghani, M.; Minderer, M.; Heigold, G.; Gelly, S.; et al. An image is worth 16x16 words: Transformers for image recognition at scale. arXiv 2020, arXiv:2010.11929. [Google Scholar]
  24. Carion, N.; Massa, F.; Synnaeve, G.; Usunier, N.; Kirillov, A.; Zagoruyko, S. End-to-end object detection with transformers. In Proceedings of the Computer Vision–ECCV 2020: 16th European Conference, Glasgow, UK, 23–28 August 2020; Proceedings, Part I 16. Springer International Publishing: Cham, Switzerland, 2020; pp. 213–229. [Google Scholar]
  25. Zhao, M.; Cao, G.; Huang, X.; Yang, L. Hybrid Transformer-CNN for Real Image Denoising. IEEE Signal Process. Lett. 2022, 29, 1252–1256. [Google Scholar] [CrossRef]
  26. Meng, Q.; Zhao, B.; Chen, S.; Lin, T.; Zhou, Y.; Qiao, W. Sedimentary enrichment mode and effect analysis of exploration and development: A case study of Fuyu reservoir tight oil in northern Songliao Basin. Acta Sedimentol. Sin. 2021, 39, 112–125. [Google Scholar]
  27. Deng, Q.; Hu, M.; Hu, Z.; Wu, Y. Sedimentary characteristics of shallow-water delta distributary channel sand bodies: A case from II-I formation of Fuyu oil layer in the Sanzhao depression, Songliao Basin. Oil Gas Geol. 2015, 36, 118–127. [Google Scholar]
  28. Wang, B.Q.; Xu, W.F.; Liu, Z.L.; Kong, F.Z.; Chang, Z.Y.; Wang, C.R. Diagenesis of reservoirs in Fuyu and Yangdachengzi of Sanzhao region. Oil Gas Geol. 2001, 22, 82–87. [Google Scholar]
  29. Tang, Z.; Zhao, J.; Wang, T. Evaluation and key technology application of “sweet area” of tight oil in south Songliao Basin. Nat. Gas Geosci. 2019, 30, 1114–1124. [Google Scholar]
  30. Cao, Y.; Xi, K.; Zhu, R.; Zhang, S.; Zhang, X.; Zheng, X. Microscopic pore throat characteristics of tight sandstone reservoirs in Fuyu layer of the fourth member of Quantou Formation in southern Songliao Basin. J. China Univ. Pet. 2015, 39, 7–17. [Google Scholar]
  31. Liu, Y.; Zhu, X.; Zhang, S.; Zhao, D. Diagenesis and pore evolution of reservoir of the Member 4 of Lower Cretaceous Quantou Formation in Sanzhao Sag, northern Songliao Basin. J. Palaeogeogr. (Chin. Ed.) 2010, 12, 480–488. [Google Scholar]
  32. Fu, G.-M.; Qin, X.-L.; Miao, Q.; Zhang, T.-J.; Yang, J.-P. Division of diagenesis reservoir facies and its control—Case study of Chang-3 reservoir in Yangchang formation of Fuxian exploration area in northern Shaanxi. Min. Sci. Technol. (China) 2009, 19, 537–543. [Google Scholar] [CrossRef]
  33. Du, H.Q.; Zhu, R.K.; He, Y.B. The diagenesis of the 2nd Member reservoirs of Xujiahe Formation and its influence on reservoirs of Hechuan area. Acta Petrol. Et Mineral. 2012, 31, 403–411. [Google Scholar]
  34. Olivarius, M.; Weibel, R.; Hjuler, M.L.; Kristensen, L.; Mathiesen, A.; Nielsen, L.H.; Kjøller, C. Diagenetic effects on porosity–permeability relationships in red beds of the Lower Triassic Bunter Sandstone Formation in the North German Basin. Sediment. Geol. 2015, 321, 139–153. [Google Scholar] [CrossRef]
  35. Zhang, X.X.; Zou, C.N.; Tao, S.Z.; Xu, C.; Song, J.; Li, G. Diagenetic facies types and semiquantitative evaluation of low porosity and permeability sandstones of the Fourth Member Xujiahe Formation Guangan Area, Sichuan basin. Acta Sedimentol. Sin. 2010, 28, 50–57. [Google Scholar]
  36. Duan, X.; Song, R.; Li, G.; Li, N. Research of integrated diagenetic facies characteristics of T3 x2 reservoir in Sichuan Basin. J. Southwest Pet. Univ. Sci. Technol. Ed. 2011, 33, 7–14. [Google Scholar]
  37. Rushing, J.A.; Newsham, K.E.; Blasingame, T.A. Rock typing: Keys to understanding productivity in tight-gas sands. In Proceedings of the Society of Petroleum Engineers Unconventional Reservoirs Conference, Keystone, CO, USA, 10–12 February 2008; SPE Paper 114164. p. 31. [Google Scholar] [CrossRef]
  38. Wang, J.; Cao, Y.; Liu, K.; Liu, J.; Kashif, M. Identification of sedimentary-diagenetic facies and reservoir porosity and permeability prediction: An example from the Eocene beach-bar sandstone in the Dongying Depression, China. Mar. Pet. Geol. 2017, 82, 69–84. [Google Scholar] [CrossRef]
  39. Liu, H.; Zhao, Y.; Luo, Y.; Chen, Z.; He, S. Diagenetic facies controls on pore structure and rock electrical parameters in tight gas sandstone. J. Geophys. Eng. 2015, 12, 587–600. [Google Scholar] [CrossRef]
  40. Zhang, J.; Ambrose, W.; Xie, W. Applying convolutional neural networks to identify lithofacies of large-n cores from the Permian Basin and Gulf of Mexico: The importance of the quantity and quality of training data. Mar. Pet. Geol. 2021, 133, 105307. [Google Scholar] [CrossRef]
  41. Gu, Y.; Zhang, D.; Bao, Z.; Feng, Z.; Li, J. Permeability prediction using Gradient Boosting Decision Tree (GBDT): A case study of tight sandstone reservoirs of member of Chang 4+5 in western Jiyuan Oilfeld. Prog. Geophys. 2021, 36, 0585–0594. [Google Scholar]
  42. Tan, C.; Sun, F.; Kong, T.; Zhang, W.; Yang, C.; Liu, C. A survey on deep transfer learning. In Proceedings of the International Conference on Artificial Neural Networks, Rhodes, Greece, 4–7 October 2018; Springer: Cham, Switzerland, 2018; pp. 270–279. [Google Scholar]
  43. Kingma, D.P.; Ba, J. Adam: A method for stochastic optimization. arXiv 2014, arXiv:1412.6980. [Google Scholar]
  44. Antariksa, G.; Muammar, R.; Lee, J. Performance evaluation of machine learning-based classification with rock-physics analysis of geological lithofacies in Tarakan Basin, Indonesia. J. Pet. Sci. Eng. 2022, 208, 109250. [Google Scholar] [CrossRef]
  45. Pereira, N. PereiraASLNet: ASL letter recognition with YOLOX taking Mean Average Precision and Inference Time considerations. In Proceedings of the 2022 2nd International Conference on Artificial Intelligence and Signal Processing (AISP), Vijayawada, India, 12–14 February 2022; pp. 1–6. [Google Scholar] [CrossRef]
  46. Maria Navin, J.R.; Pankaja, R. Performance analysis of text classification algorithms using confusion matrix. Int. J. Eng. Tech. Res. IJETR 2016, 6, 75–78. [Google Scholar]
  47. Jaccard, P. Nouvelles recherches sur la distribution florale. Bull. Soc. Vaud. Sci. Nat. 1908, 44, 223–270. [Google Scholar]
Figure 1. C-ViTM method process.
Energies 17 01708 g001
Figure 2. Structural locations of Fuyu reservoir of Sanzhao sag in Songliao Basin: (A) Location of Songliao Basin; (B) Study area Fuyu oil layer location; (C) Location of research wells.
Energies 17 01708 g002
Figure 3. Photo of Fuyu reservoir in Sanzhao Sag: (a) Fang 186-32 Well, 1848.09 m, cast thin section, unipolar light, ×40, feldspar fine sandstone. Due to compaction, the clastic particles are in linear contact, and the long particles are arranged semi-directionally; (b) Fang 188-138 Well, 1789.4 m, cast thin sheet, unipolar light, ×100, feldspathic lithic fine sandstone, quartz authigenic enlargement, calcite stained. It is presumed that calcite cementation is later than quartz secondary enlargement; (c) Fang 186-132 Well, 1847.0 m, cast thin sheet, unipolar light, ×40, lithic feldspar fine sandstone. Interparticle and intragranular dissolution pores are visible, feldspar particles undergo dissolution, and calcite is stained; (d) Fang 186-32 Well, 1831.59 m, ×920, intergranular calcite cement; (e) Fang 186-32 Well, 1835.6 m, ×4680. Soda feldspar particles undergo dissolution to form intragranular dissolution pores, which are filled with lamellar illite; (f) Fang 188-138 Well, 1793.0 m, ×1820. Feldspar particles undergo dissolution to form secondary pores, with filamentous illite visible on the surface of particles.
Energies 17 01708 g003
Figure 4. Logging response characteristics of different diagenetic facies.
Energies 17 01708 g004
Figure 5. Statistical results of quantity and thickness of various diagenetic facies in Fuyu reservoir: (a) Statistics on the number of different thickness intervals; (b) Thickness statistics of various diagenetic facies.
Energies 17 01708 g005
Figure 6. Standardization results of each logging curve of Well f188-138 in Fuyu reservoir: (a) AC standardization results; (b) CAL standardization results; (c) GR standardization results; (d) SP standardization results; (e) RLLD standardization results; (f) RLLS standardization results.
Energies 17 01708 g006
Figure 7. Wap sliding overlap-tile sampling process.
Energies 17 01708 g007
Figure 8. C-ViTM model structure.
Energies 17 01708 g008
Figure 9. ResNet101 network model structure.
Energies 17 01708 g009
Figure 10. Iterative process loss.
Energies 17 01708 g010
Figure 11. Calculation results of mAA and mAP in the identification effect of various diagenetic facies at different thickness units: (a) Calculation results of Accuracy and mAA values in the identification effect of various diagenetic facies; (b) Calculation results of AP value and mAP value in the identification effect of various diagenetic facies.
Energies 17 01708 g011
Figure 12. Identification results of diagenetic facies: (a) C-ViTM identification results; (b) CNN identification results; (c) ViT identification results.
Energies 17 01708 g012
Figure 13. Calculation results of Precision, Recall and F1 score: (a) Precision calculation results; (b) Recall calculation results; (c) F1 score calculation results.
Energies 17 01708 g013
Figure 14. Identification results of single-well diagenetic facies.
Energies 17 01708 g014
Table 1. Log data statistics of Fuyu reservoir in Sanzhao depression.
OrderWellCoring Depth (m)Length (m)OrderWellCoring Depth (m)Length (m)
TopBottomTopBottom
1B71872.7002081.100208.4016F4641835.0391939.989104.95
2B171858.0252043.475185.4517H23-61800.0201831.17031.15
3B181836.0012139.951303.9518S521719.0001872.000153.00
4B1021914.5001963.40048.9019S5411818.0251946.975128.95
5B1831895.0121906.96211.9520S551754.0001793.95039.95
6B2111775.0001792.55017.5521X181943.0252021.97518.95
7B3511982.9812021.18138.2022X212182.0002228.00046.00
8BF59-511720.6901854.940134.2523X232068.0002138.00070.00
9F131787.3001998.800211.5024X1412030.0002095.98169.95
10F271755.1251843.12588.0025Z111810.0002004.700194.70
11F291843.0001875.00032.0026Z221695.8001798.900103.10
12F98-161760.0001870.950110.9527Z43-2511800.0301861.83061.80
13F186-161920.0402024.990104.9528Z43-251-11800.0091876.95976.95
14F188-1381767.1001858.05090.9529Z43-2611800.0491885.99985.95
15F3611765.3251890.475125.1530Z44-2511773.9501880.900106.95
Table 2. Statistics of the number of logging curve image samples of different thickness units.
Diagenetic FaciesLongitudinal Thickness Unit Interval
0.50 (m)0.75 (m)1.00 (m)1.25 (m)
Wip2671519772
Wap110644531
Map442242150105
Mip768449290194
Msap36418311470
Mp1342831587439
Table 3. Statistics of the number of samples of various diagenetic facies after imbalance processing.
Diagenetic FaciesLongitudinal Thickness Unit Interval
0.50 (m)0.75 (m)1.00 (m)1.25 (m)
Wip6001509570
Wap52515011080
Map440240150105
Mip765445290190
Msap51518011070
Mp570235150105
Table 4. Calculation results of Jaccard index for various diagenetic facies.
Diagenetic Facies
WipWapMipMapMsapMp
Jaccard0.780.740.750.740.810.91
Disclaimer/Publisher’s Note: The statements, opinions and data contained in all publications are solely those of the individual author(s) and contributor(s) and not of MDPI and/or the editor(s). MDPI and/or the editor(s) disclaim responsibility for any injury to people or property resulting from any ideas, methods, instructions or products referred to in the content.

