Article

Study on Sedimentary Environment and Organic Matter Enrichment Model of Carboniferous–Permian Marine–Continental Transitional Shale in Northern Margin of North China Basin

1
Key Laboratory of Coalbed Methane Resources and Reservoir Formation Process, Ministry of Education, China University of Mining and Technology, Xuzhou 221008, China
2
School of Resources and Geoscience, China University of Mining and Technology, Xuzhou 221116, China
*
Author to whom correspondence should be addressed.
Energies 2024, 17(7), 1780; https://doi.org/10.3390/en17071780
Submission received: 24 January 2024 / Revised: 23 March 2024 / Accepted: 4 April 2024 / Published: 8 April 2024

Abstract

:
The shales of the Taiyuan Formation and Shanxi Formation in the North China Basin have good prospects for shale gas exploration and development. In this study, Well KP1 at the northern margin of the North China Basin was used as the research object for rock mineral, organic geochemical, and elemental geochemical analyses. The results show that brittle minerals in the shales of the Taiyuan Formation and Shanxi Formation are relatively rare (<40%) and that the clay mineral content is high (>50%). The average TOC content is 3.68%. The organic matter is mainly mixed and sapropelic. The source rocks of the Taiyuan Formation and Shanxi Formation are mainly felsic, and the tectonic background lies in the continental island arc area. The primary variables that influenced the enrichment of organic materials during the sedimentary stage of the Taiyuan Formation were paleosalinity and paleoproductivity. Paleosalinity acted as the primary regulator of organic matter enrichment during the sedimentary stage of the Shanxi Formation.

1. Introduction

In recent years, China has made major breakthroughs in the exploration and development of marine and continental shale, and it has discovered several huge shale gas fields [1,2,3]. Compared with the development research of marine shale, the exploration and development of marine–continental transitional shale is still in the early stages [4,5,6]. The sedimentary environment of marine–continental transitional shale is relatively complex, generally deposited in the transitional environment from the surface ocean to the river delta [7,8,9,10]. Marine–continental transitional shale is widely distributed in China, including in the North China Basin, Qinshui Basin, Ordos Basin, and Bohai Bay Basin [11,12,13]. These resources are rich in shale gas reserves, accounting for about one-quarter of the total shale gas resources, and they represent potentially important areas for unconventional oil and gas exploration [4,5]. Among them, multiple sets of marine–continental transitional shale distributed in the Carboniferous–Permian system in the northern North China Basin are characterized by diverse kerogen types, large changes in organic matter abundance, high maturity, and medium clay abundance. They have become the current research hotspots for the exploration and development of shale gas [14,15,16].
The abundance of shale organic matter affects the generation and accumulation of shale oil and gas, but the enrichment and preservation of organic matter are complex physical and chemical processes [17,18,19,20,21]. Previous studies have shown that organic matter enrichment and preservation are jointly controlled by the depositional environment (terrigenous input, sedimentation rate, paleoclimate, paleoredox, paleosalinity, and primary productivity) and the source of organic matter [19,20,21,22,23,24]. The controlling factors of the depositional environment and organic matter enrichment of marine–terrestrial transitional shale are more complex [21,25]. Due to the intense tectonic movement of the North China Basin in the Late Paleozoic, the North China Basin transitioned from a surface sea to a river delta environment [14,26]. This led to changes in the depositional environment and provenance. Changes in the sedimentary environment and provenance affect the growth of paleontology in sedimentary water bodies and the enrichment and preservation of organic matter. Furthermore, this leads to differences in the abundance of organic matter in shale at different depositional stages [27,28,29,30,31]. Therefore, it is necessary to reveal the main factors controlling the enrichment of organic matter in the marine–continental transitional shale in the northern part of the North China Basin and to determine the optimal conditions for the enrichment of organic matter in marine–continental transitional shale.
The primary purpose of this study is threefold: (1) to reveal and compare the abundance of organic matter and the characteristics of reservoir physical properties in Late Paleozoic marine–continental transitional shale (specifically that of the Taiyuan and Shanxi Formations) based on rock mineral analysis and organic geochemistry; (2) to identify the source characteristics, structural background, and paleoenvironmental factors of the marine–continental transitional shale within the Taiyuan and Shanxi Formations of the Late Paleozoic through an elemental geochemical analysis combined with numerical analysis methods, and to determine the main controlling factors of organic matter enrichment in these shale formations; and (3) to establish an organic matter enrichment model for marine–terrestrial transitional shale and determine the optimal conditions for shale organic matter enrichment. Our study holds great significance for evaluating the potential of marine–continental transitional shale and provides a theoretical basis for optimizing reservoir selection for marine–continental transitional shale gas exploration in the North China Basin.

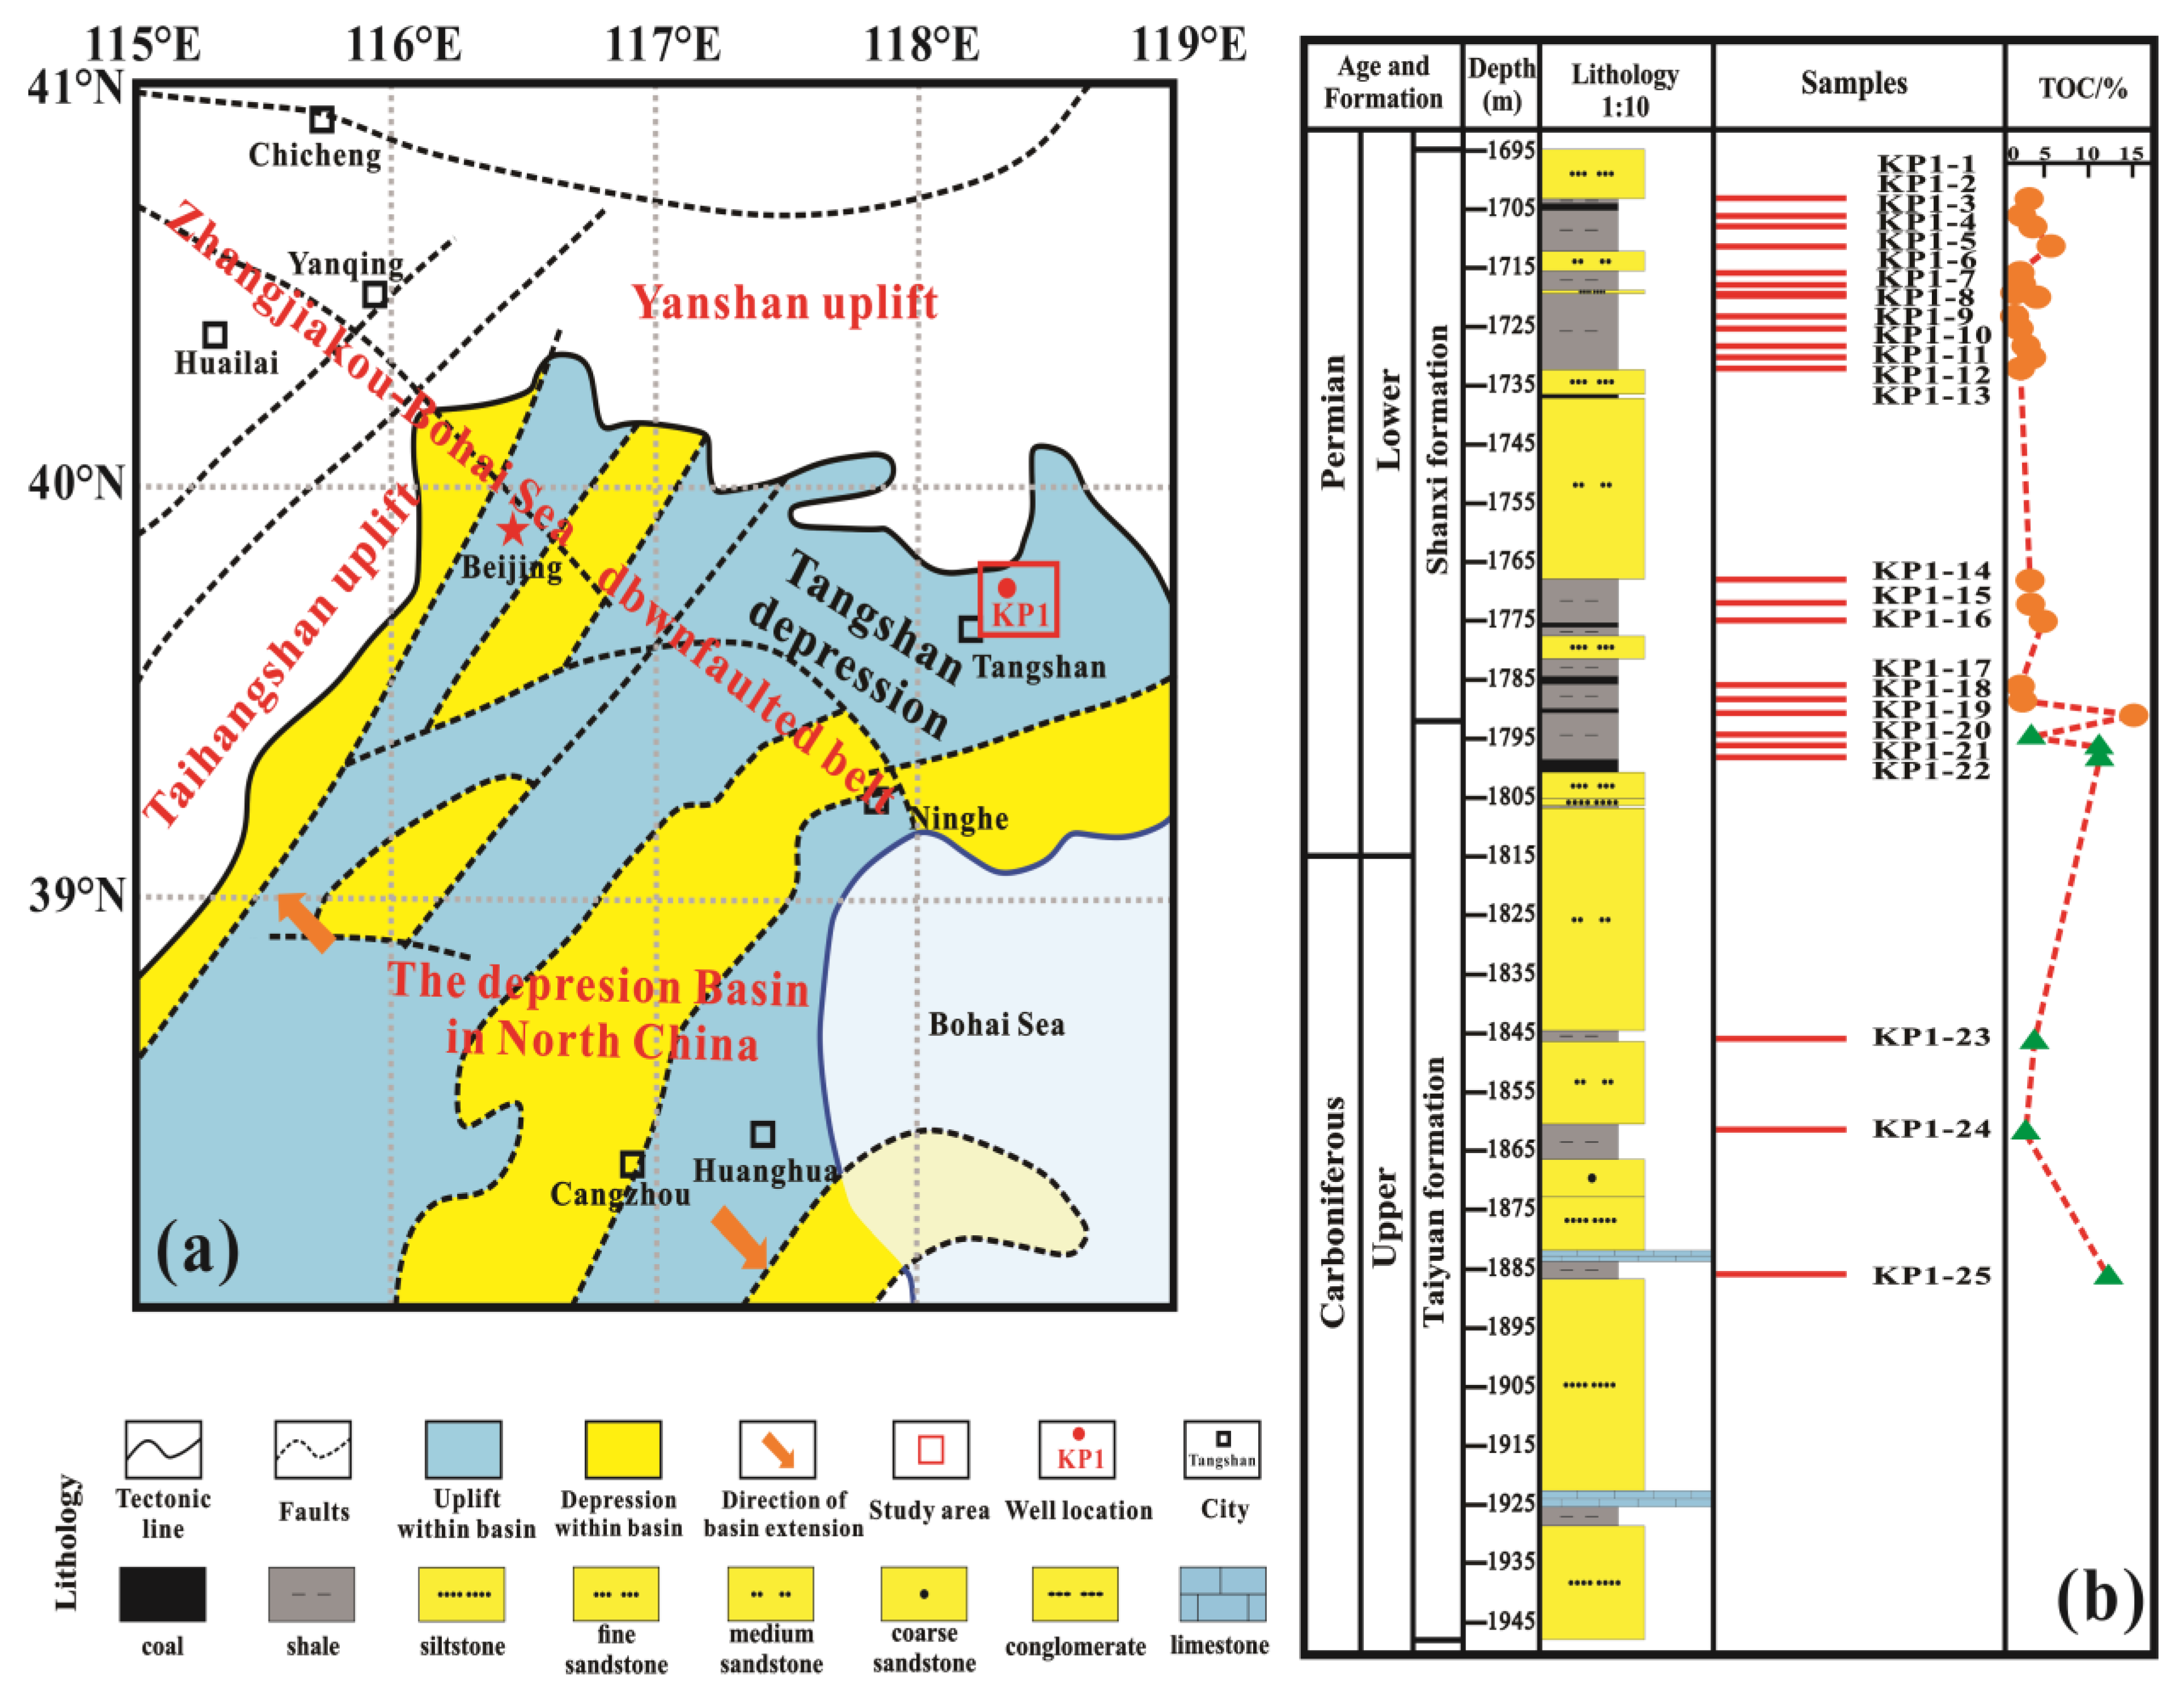
2. Geological Setting

The North China Basin is adjacent to the Taihang Mountain uplift to the west, the Bohai Sea to the east, and the Yanshan Fold uplift to the north (Figure 1a). Because of the staggered ups and downs of faults, several secondary tectonic units have developed [32]. The sedimentary evolution process of the North China Basin can be roughly divided into four stages: the stages of early Paleozoic uplift and late Paleozoic sea–land alternation; the early Mesozoic filling of the intracontinental lake basin depression; and the late Mesozoic and Cenozoic rifting stages [33,34].
The North China Basin was in the land–sea alternation stage during the Carboniferous–Permian period, which was crucial for the basin’s ecosystem to change from an intracontinental lake to an epicontinental sea. Well KP1 (latitude N39° 45′ 46.8″, longitude E118° 21′ 25.2″) in the study area is located in Fengnan District, Tangshan City, Hebei Province, and its structural position belongs to the east wing of the Kaiping syncline. The Taiyuan Formation has a thickness of 71.33 m and is primarily made up of sandstone, thin limestone, coal seams, and black shale, according to KP1 drilling data in the research region. The Shanxi Formation has a thickness of 69.5 m and is primarily made up of sandstone, shale, and thin coal seams (Figure 1b).

3. Samples and Analysis

3.1. Samples and Experimental Method

A total of 25 representative samples were collected and analyzed in this study: 19 samples from the Shanxi Formation and 6 samples from the Taiyuan Formation. The samples were taken from the shale core of Well KP1, with sampling depths ranging between 1695 and 1886 m. The main lithology of the samples comprises shale and carbonaceous shale (Figure 1b).
The analysis of shale samples includes total organic carbon content (TOC) detection, major- and trace-element content detection, XRD whole-rock mineral quantitative analysis detection, clay mineral X-ray diffraction quantitative analysis detection, rock pyrolysis analysis detection, and kerogen maceral identification. The above analysis and testing are carried out in the laboratory of the Shandong Coal Geological Planning and Exploration Institute.
The content of major elements in the 25 samples was determined according to the Chinese standard GB/T21114-2019 by using the refractory X-ray fluorescence spectrum chemical analysis melting glass method [35]. The XRD whole-rock mineral quantitative analysis test and clay mineral X-ray diffraction quantitative analysis test were carried out using a Rigaku SmartLab9 X-ray diffractometer (Rigaku Company, Tokyo, Japan). According to the national standard SY/T5163-2018, 17 samples were analyzed and tested to further determine the brittleness of the shale [36]. By using an OGE-VI rock pyrolysis instrument, 25 samples were analyzed according to the Chinese standard experimental method GB/T18602-2012, and the hydrocarbon generation potential of the shale organic matter was further analyzed [37]. The process of identifying and categorizing kerogen macerals by the use of transmission light fluorescence is known as identification. According to the Chinese standard experimental method SY/T5125-2014, 25 samples of shale were analyzed, and the analysis results were further used for kerogen-type identification [38].

3.2. Data Processing

The majority of trace elements in sediments are made up of terrigenous debris and authigenic components. Only the authigenic components in sediments can reflect the evolutionary characteristics of the sedimentary environment in geological history. However, rock composition is complex and diverse, and there is some deviation in judging its enrichment only by the content of trace elements and standard shale. To eliminate terrigenous detrital components from having an impact on authigenic components, the trace-element concentration is usually standardized by using the Al element with relatively stable properties during diagenesis [39]. In this study, the upper crust content (UCC) was used for a standardized calculation. The enrichment factor (EF) of elements was calculated as follows:
X-EF = (X/Al)sample/(X/Al)UCC
The EF of element X is represented by X-EF, the measured concentrations of elements X and Al in the examined samples are represented by (X/Al)sample, and the X/Al ratio in the UCC is represented by (X/Al)UCC. X-EF greater than 1 means that some element is richer than the UCC, while X-EF less than 1 means that an element is more deficient than the UCC.
To assess paleoproductivity more accurately, the Ba bio content in the sediments was also calculated [40] utilizing the equation below:
Babio = Basample − Alsample × (Ba/Al)PAAS
Here, Basample is the measured content of element Ba in the samples under study, (Ba/Al)PAAS are the ratios of Ba/Al in post-Archean Australian shale (PAAS), and Babio represents the Ba content produced by biological processes; the estimated content in terrigenous debris is generally subtracted from the total amount in the sample.
There are multiple indicators that can characterize the paleoredox conditions of sedimentary water bodies in the shale deposition stage, such as V/Cr, V/Sc, and Ce/La. In this study, the data sets composed of different element indexes representing paleoredox conditions were processed using the normalization method. The average value obtained after the normalization of the different element indexes was used as the representative parameter of the paleoredox conditions. The calculation formula is as follows:
Paleo- = {[(V/Cr)sample − (V/Cr)min]/[ (V/Cr)max − (V/Cr)min] + [ (V/Sc)sample − (V/Sc)min]/[(V/Sc)max − (V/Sc)min] + [(Ce/La)sample − (Ce/La)min]/[ (Ce/La)max − (Ce/La)min]}/3
In the formula, Paleo- is the representative parameter of the paleoredox conditions; (V/Cr)sample, (V/Sc)sample, and (Ce/La)sample are the ratios of V/Cr, V/Sc, and Ce/La, respectively; (V/Cr)min, (V/Sc)min, and (Ce/La)min are the minimum values of the V/Cr, V/Sc, and Ce/La ratios, respectively; and (V/Cr)max, (V/Sc)max, and (Ce/La)max are the maximum values of V/Cr, V/Sc, and Ce/La, respectively.
Based on the above calculation data, by using Origin (2021) software and combining the discriminant templates and analysis methods developed by previous researchers, the mudstone provenance and tectonic background characteristics, sedimentary environment, and water retention environment of the Taiyuan Formation and Shanxi Formation are discussed. By using SPSS Pro (Education version) software, the main controlling factors of shale organic matter enrichment in the Taiyuan Formation and Shanxi Formation are discussed and analyzed.

4. Results

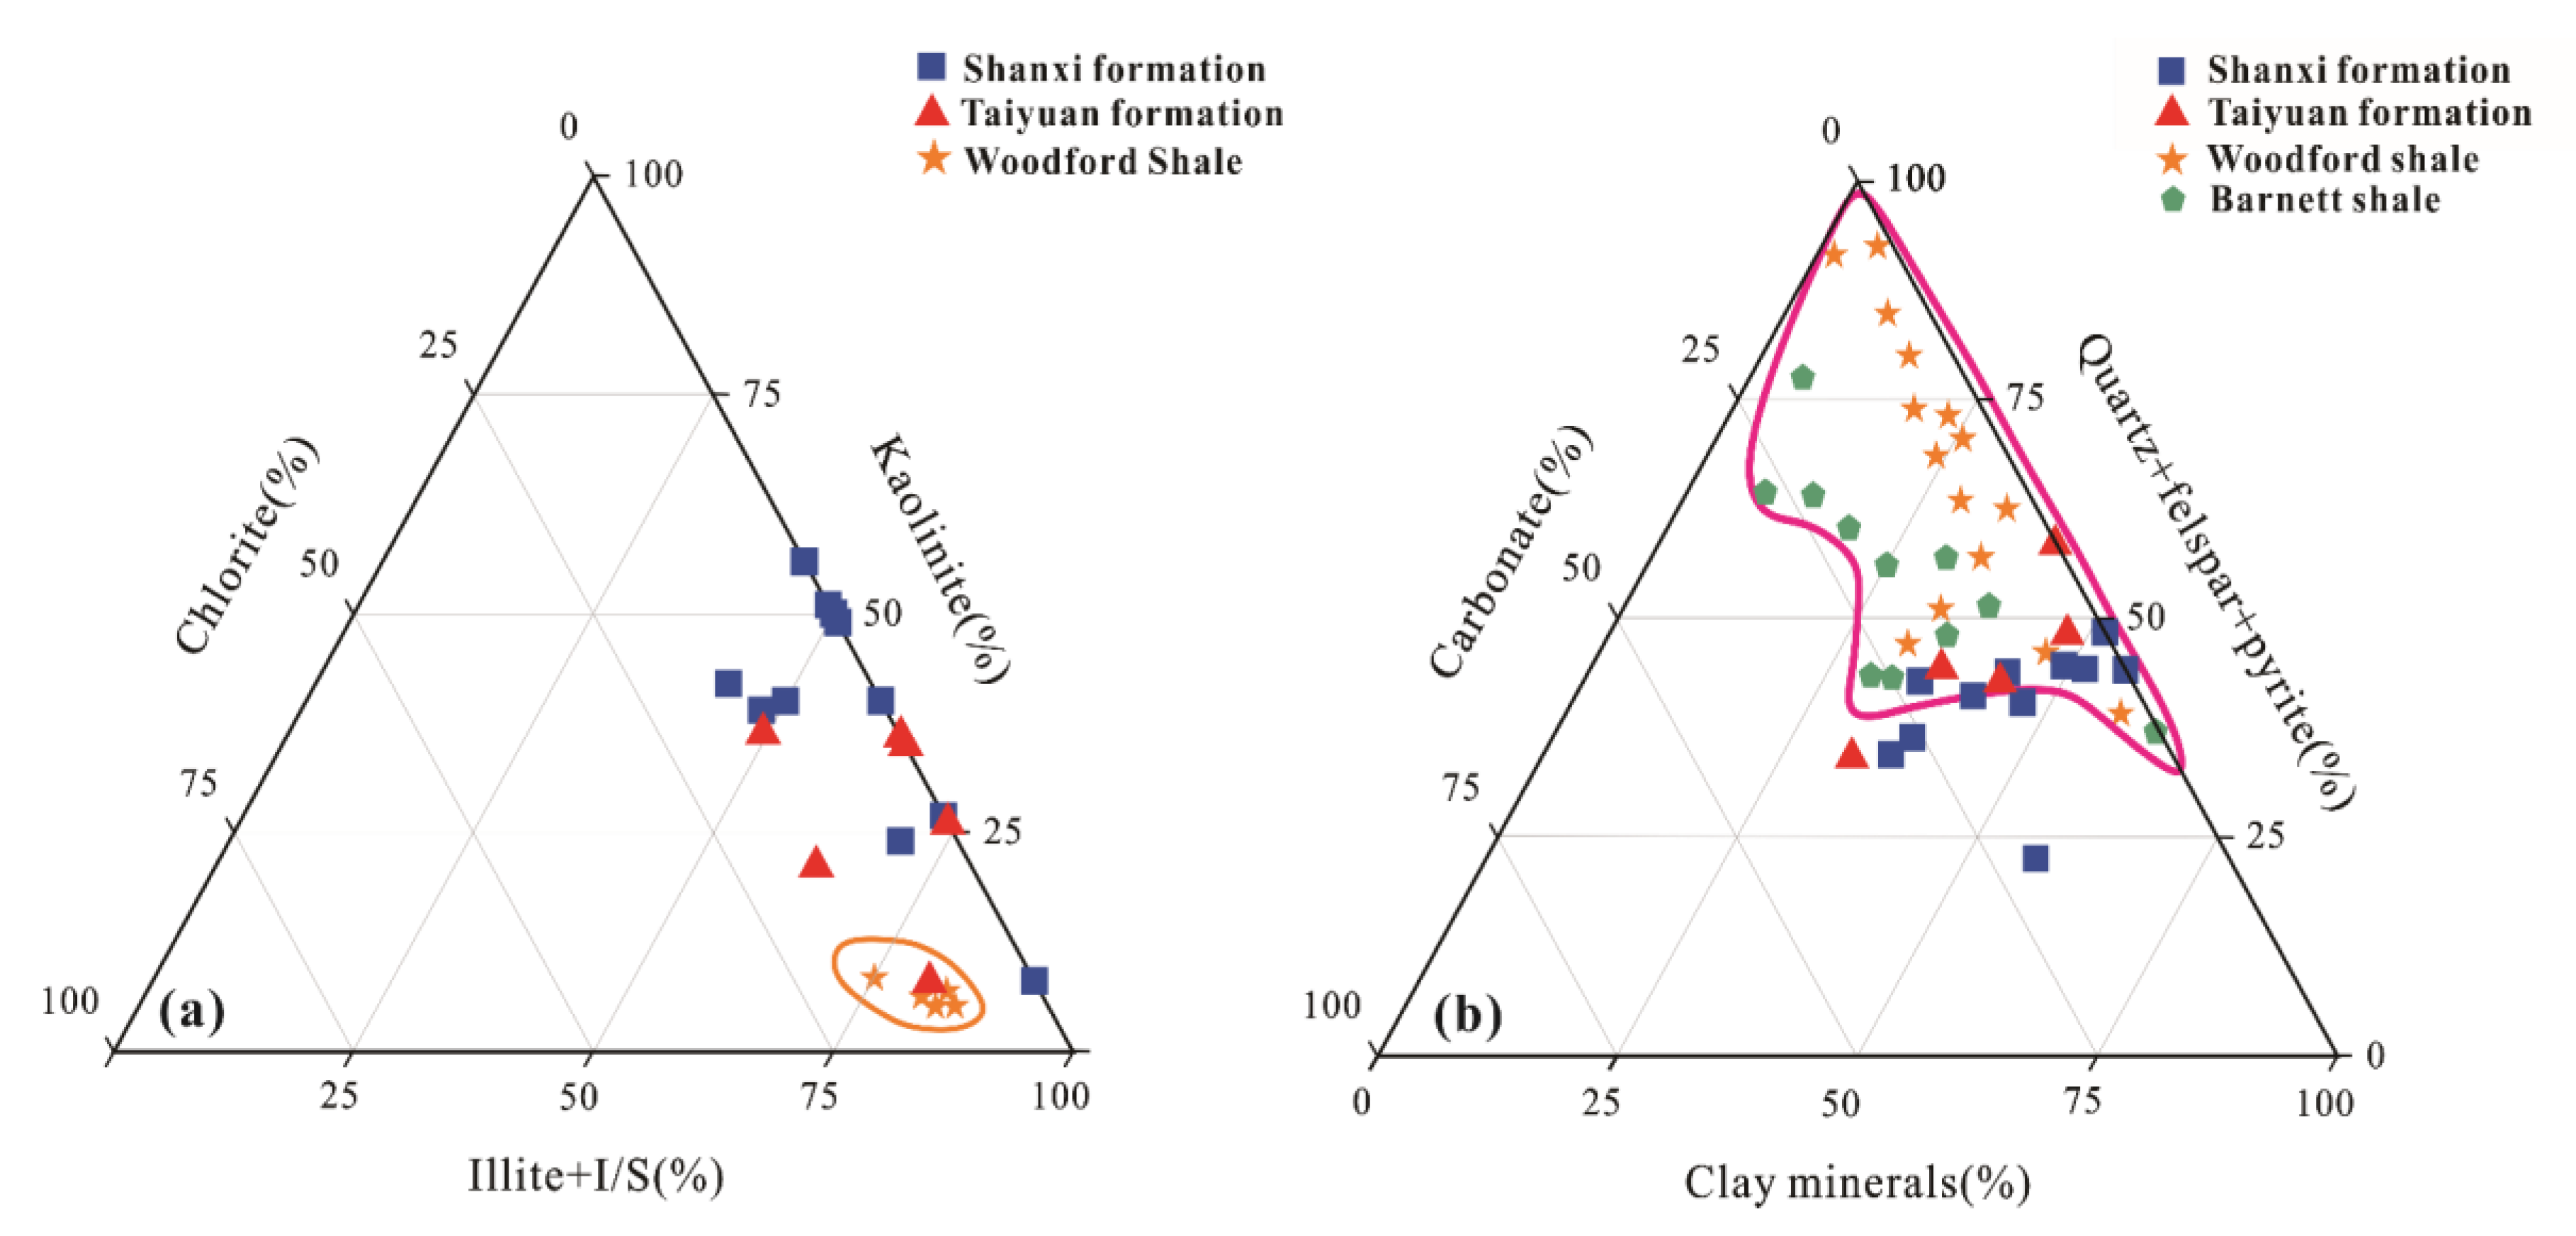
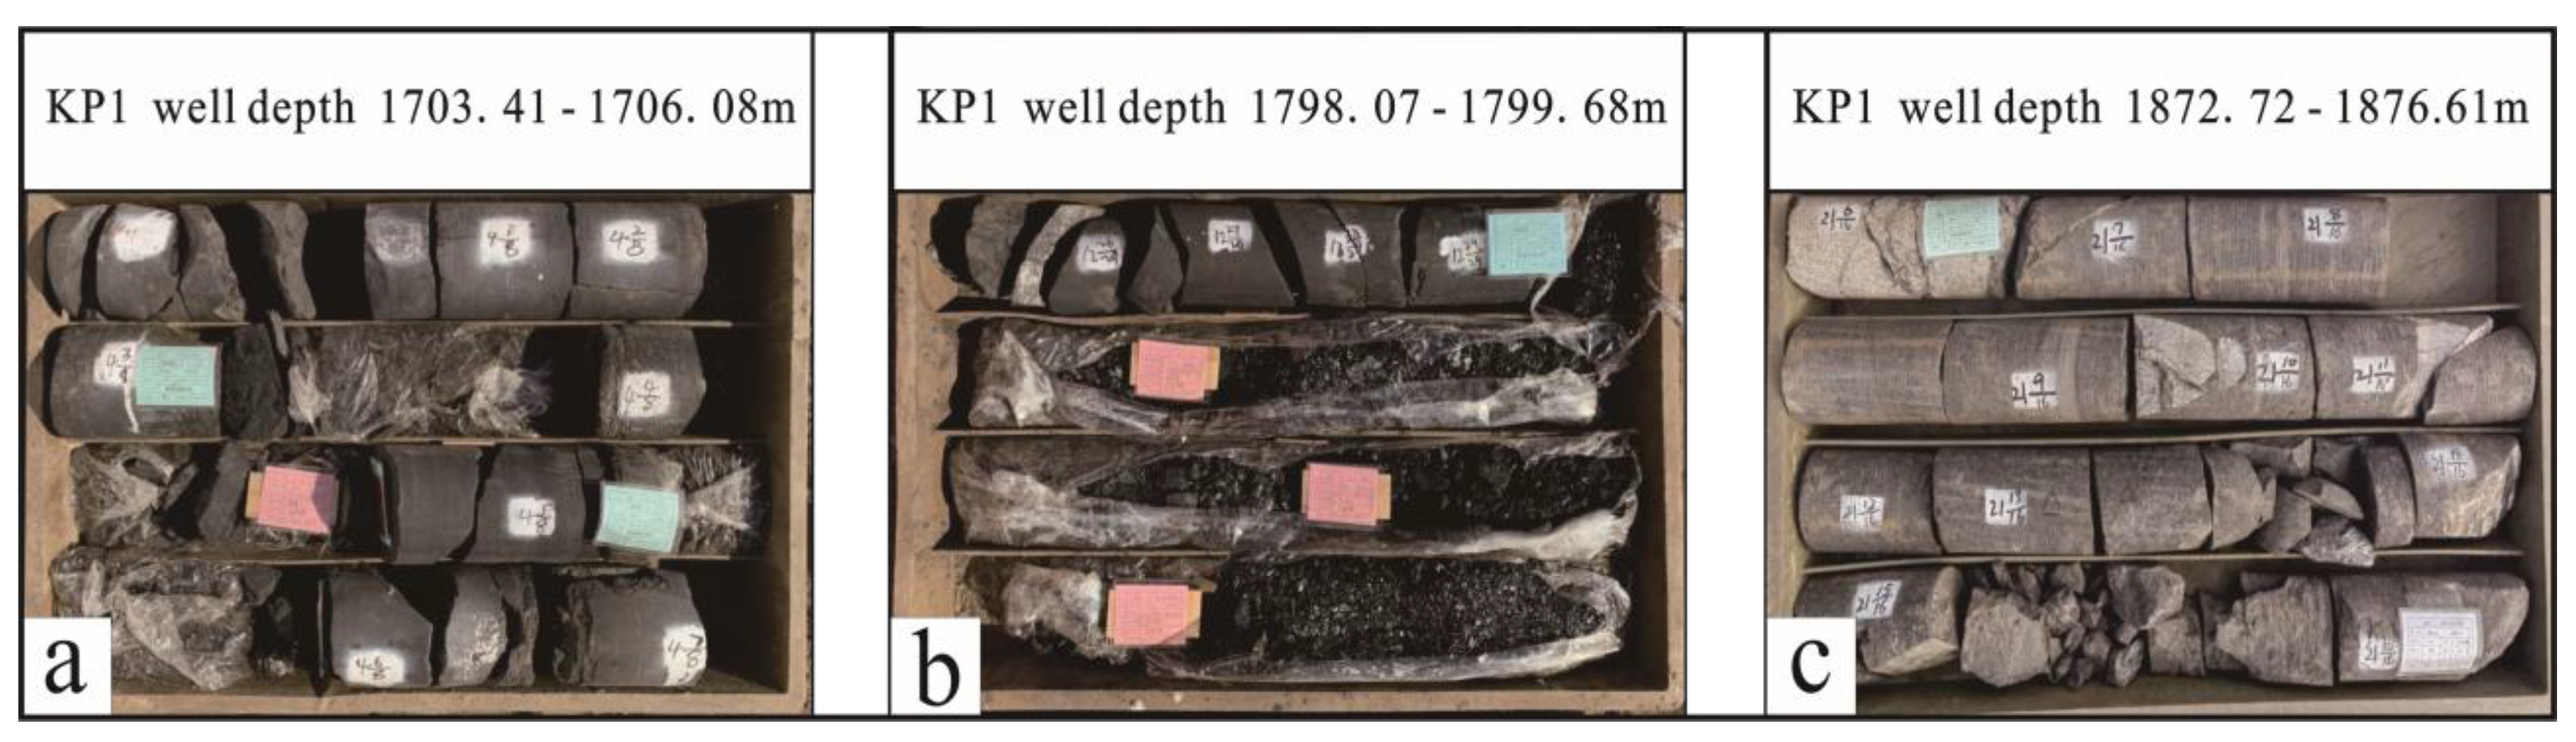
4.1. Lithological Characteristics

Through a detailed observation of the core samples from Well KP1, the source rock sections were found to have strong heterogeneity. The core lithology of the Shanxi Formation’s interbedded sandstone and mudstone in Well KP1 is mostly composed of dark-grey sandy mudstone with a thin overlay of dark-grey fine sandstone (Figure 2a). The vertical variation in the core lithology of the Taiyuan Formation shows that grey-white coarse sandstone and medium sandstone were transformed into dark-grey and black-grey silty mudstone (Figure 2b). The core lithology of the Taiyuan Formation is interbedded with dark-grey siltstone, fine sandstone, and grey-black sandy mudstone, mainly sandstone (Figure 2c).
The brittle mineral content of shale in the Shanxi Formation was between 22.5% and 48.4% (average = 40.02%), mainly quartz minerals (Figure 3b). The Taiyuan Formation shale had a comparatively high brittle mineral concentration, ranging from 34.1% to 58.5% (average = 47.7%) (Figure 3b). The brittle mineral content of shale in the Taiyuan and Shanxi Formations fulfilled the minimum fracturing feasibility standard (brittle mineral = 40%). However, the contents of clay minerals in the shales of the Taiyuan and Shanxi Formations were high, with averages of 46.1% and 40.6%, respectively [41] (Figure 3b).
The clay minerals in the Taiyuan and Shanxi Formations were mainly illite–montmorillonite mixed layer minerals (average values of 57.27% and 65.83%, respectively) and kaolinite (average values of 38.72% and 27%, respectively). This slightly differs from the clay mineral composition of the Woodford shale (Figure 3a). Therefore, compared with the North American marine gas shale (Barnett and Woodford shales), the brittle mineral content of the Taiyuan and Shanxi Formations shale is relatively low, barely meeting the hydraulic fracturing standard, and the clay mineral content is relatively high, making fracturing more difficult (Figure 3a).

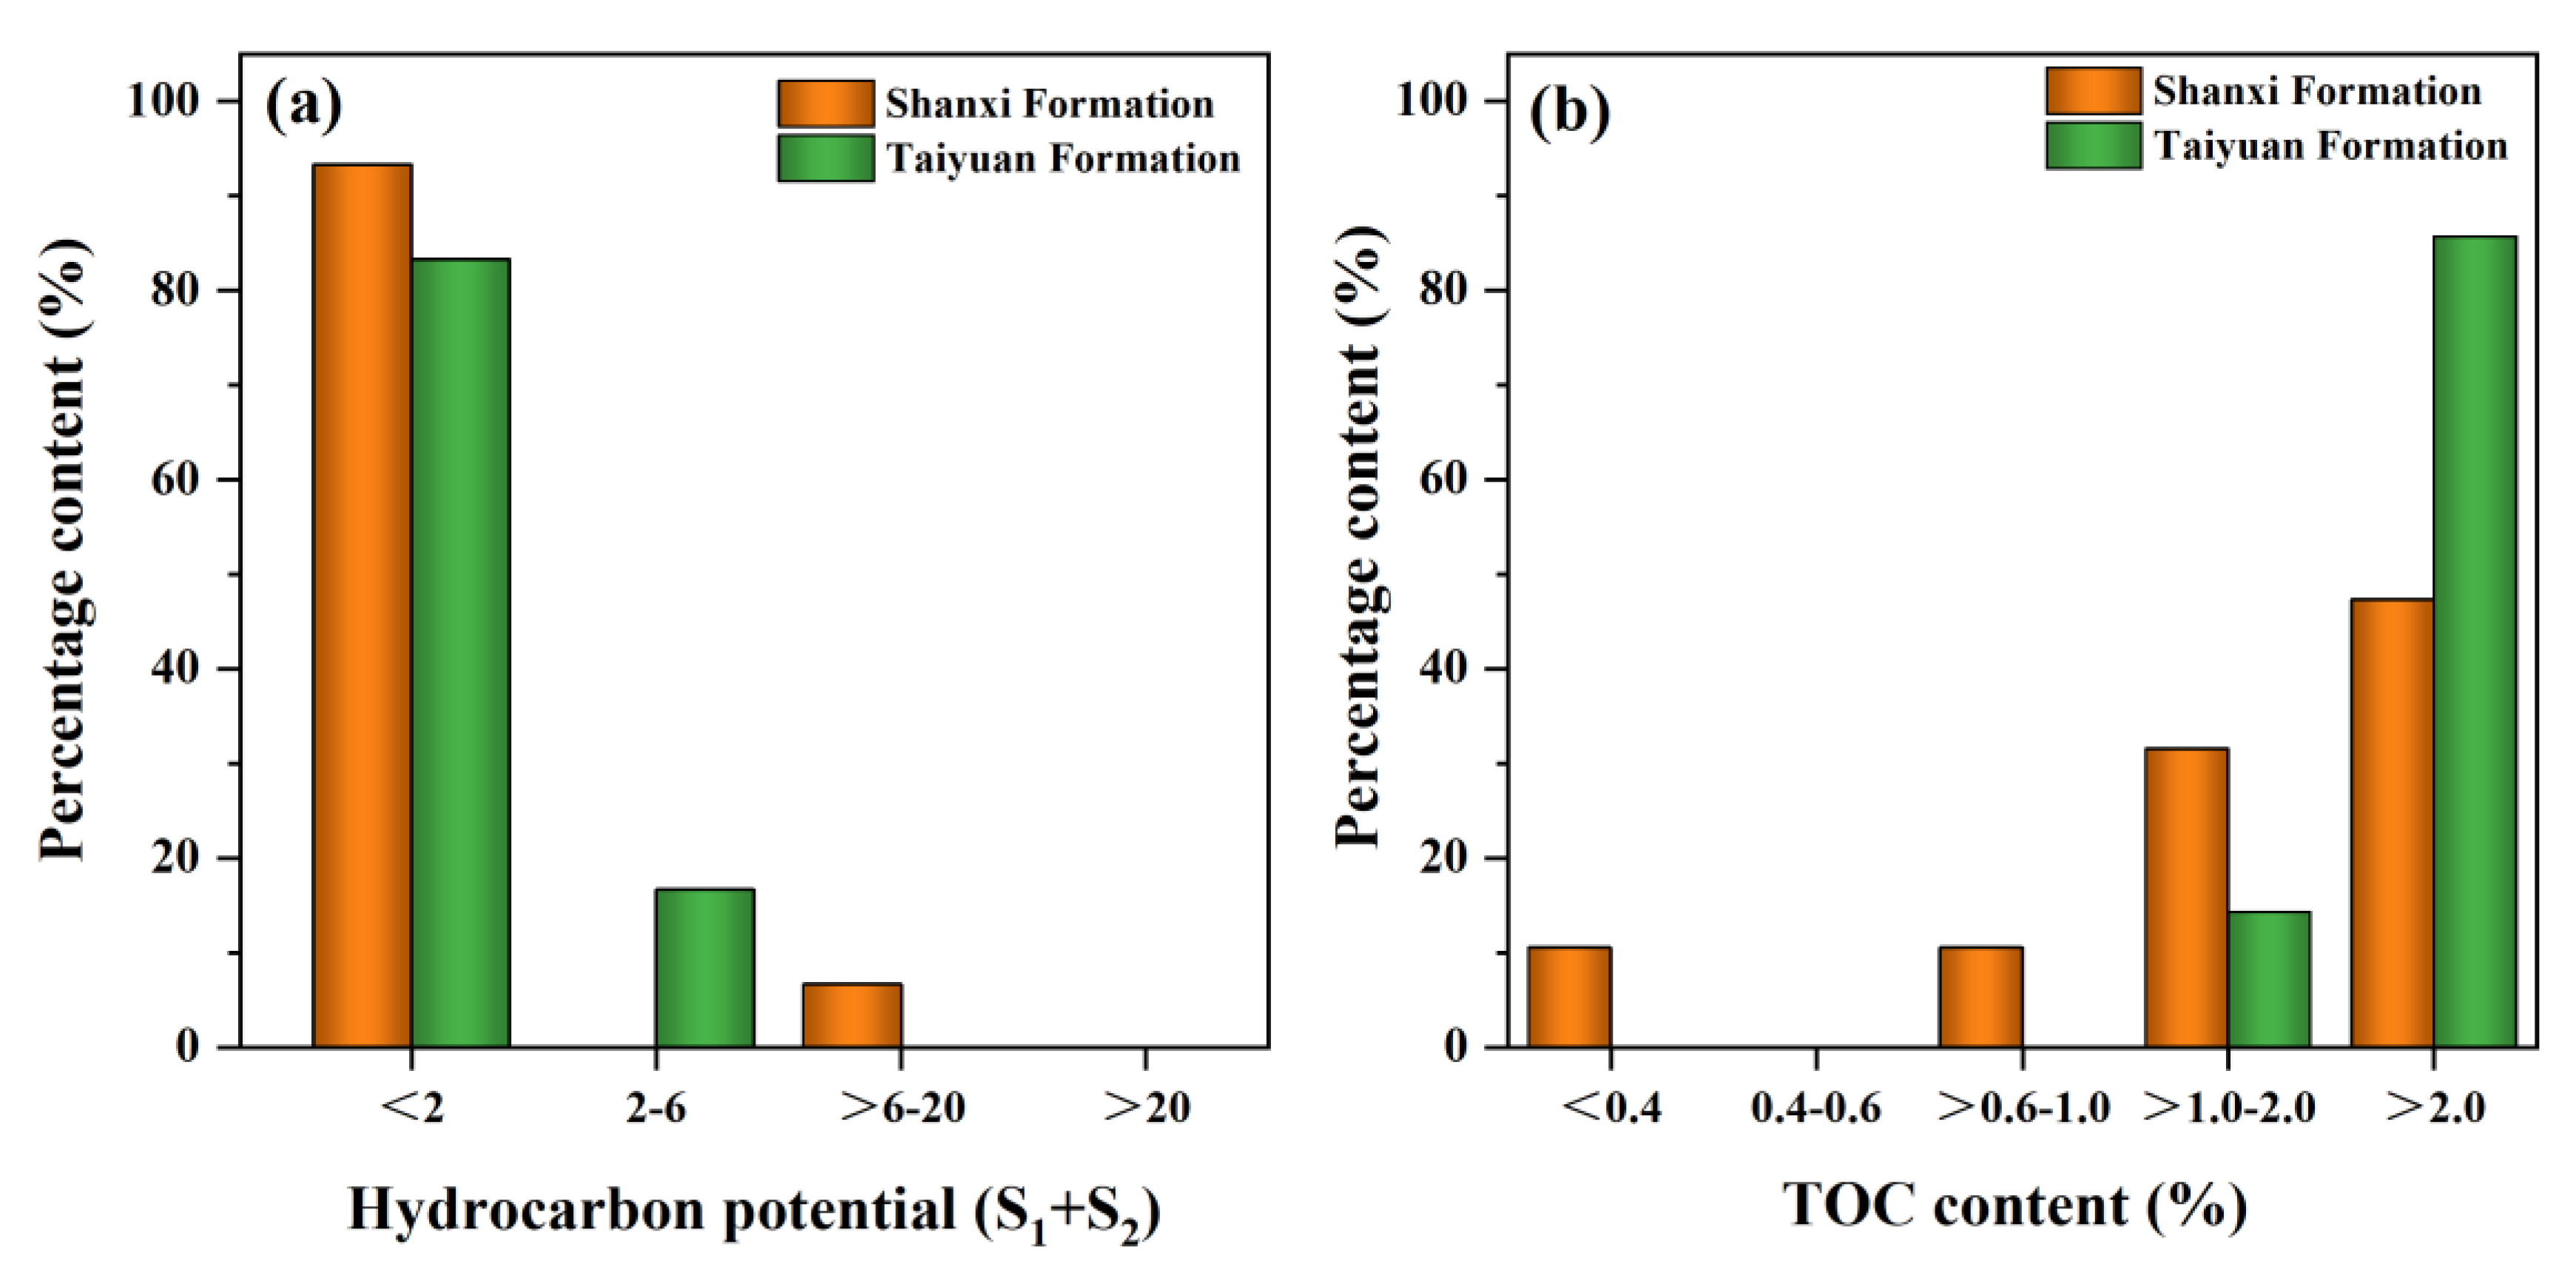
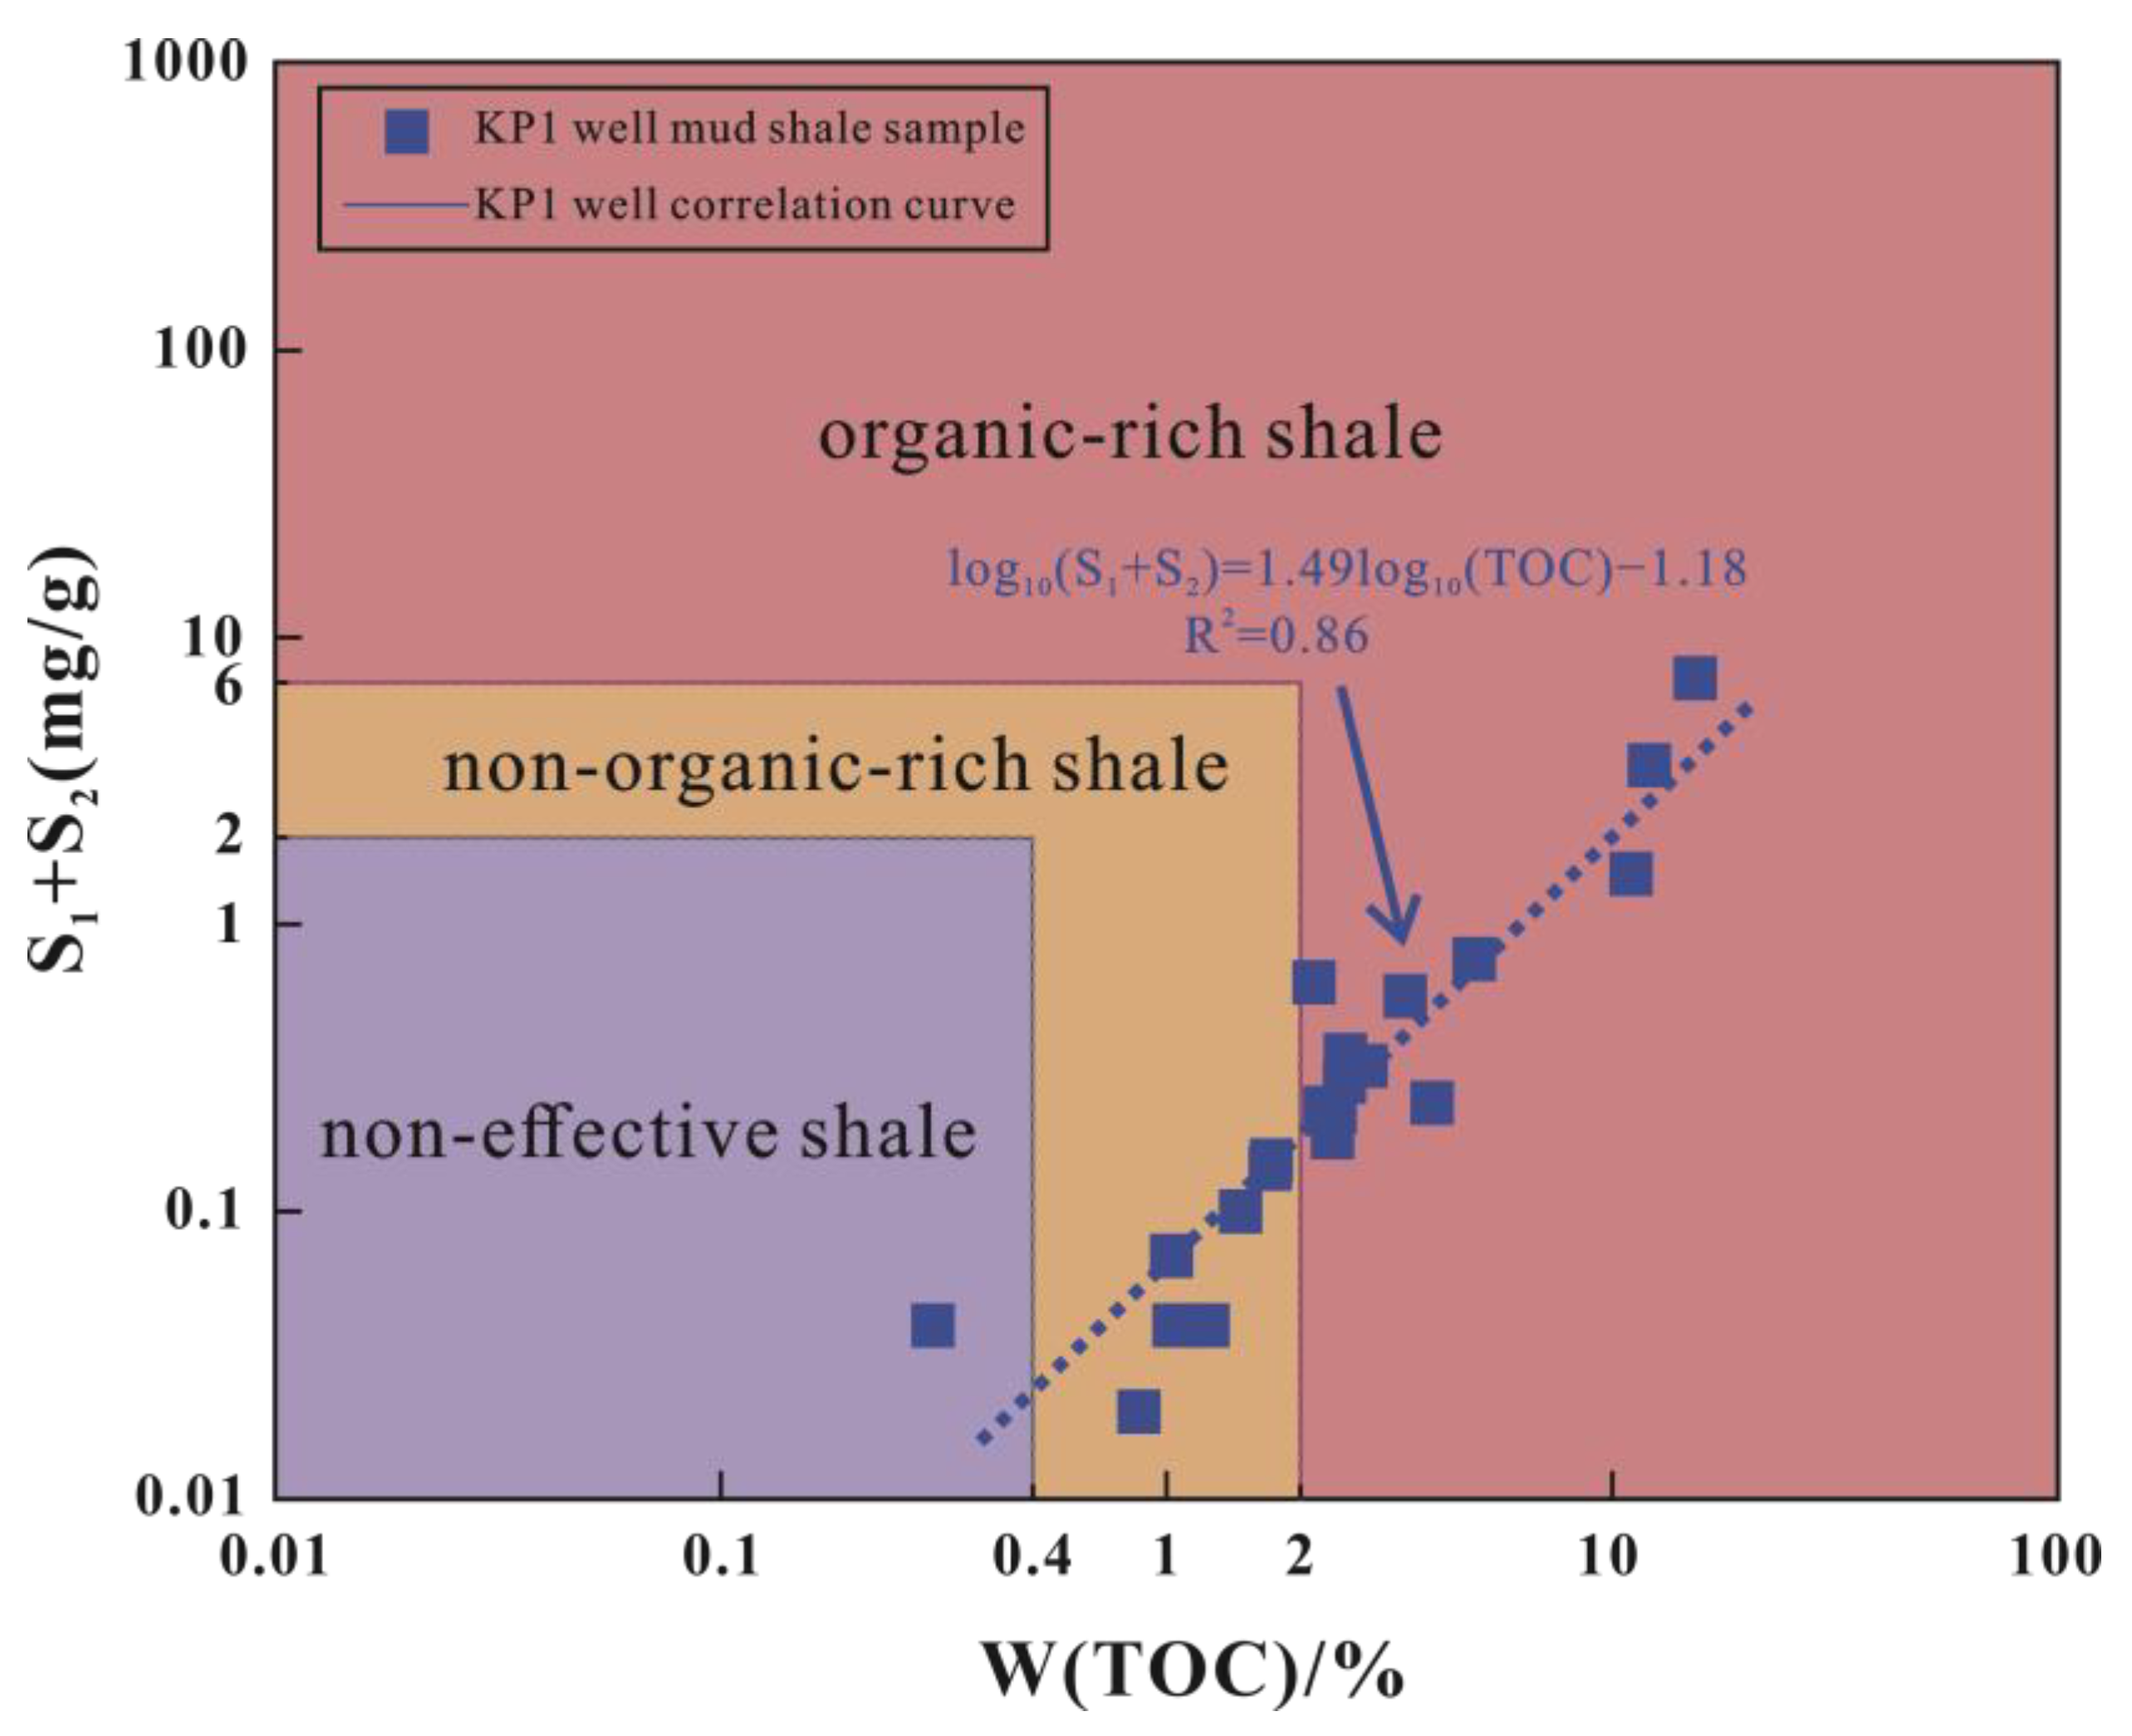
4.2. Organic Matter Abundance

According to the experimental results, the TOC content of the shale of the Shanxi Formation was between 0.20% and 15.39% (average = 2.60%). Furthermore, 47.37% of the shale samples met the standards for excellent source rocks, and 89.47% of the shale samples met the standards for medium source rocks (Figure 4; Table 1). The TOC content of the shale of the Taiyuan Formation was between 1.71% and 12.15%, with an average of 6.84%. Moreover, 85.71% of the shale samples met the standards for excellent source rocks, and all samples met the standards for good source rocks (Figure 4; Table 1).
According to the curve fitting equation of shale samples, log10(S1 + S2) = 1.49log10 (TOC) − 1.18 (R2 = 0.86), indicating that TOC content has a good correlation with hydrocarbon generation potential. According to Figure 5, most of the Well KP1 shale samples fell into the organic-rich and non-organic-rich shale areas, and only one sample fell into the non-effective shale area [42].

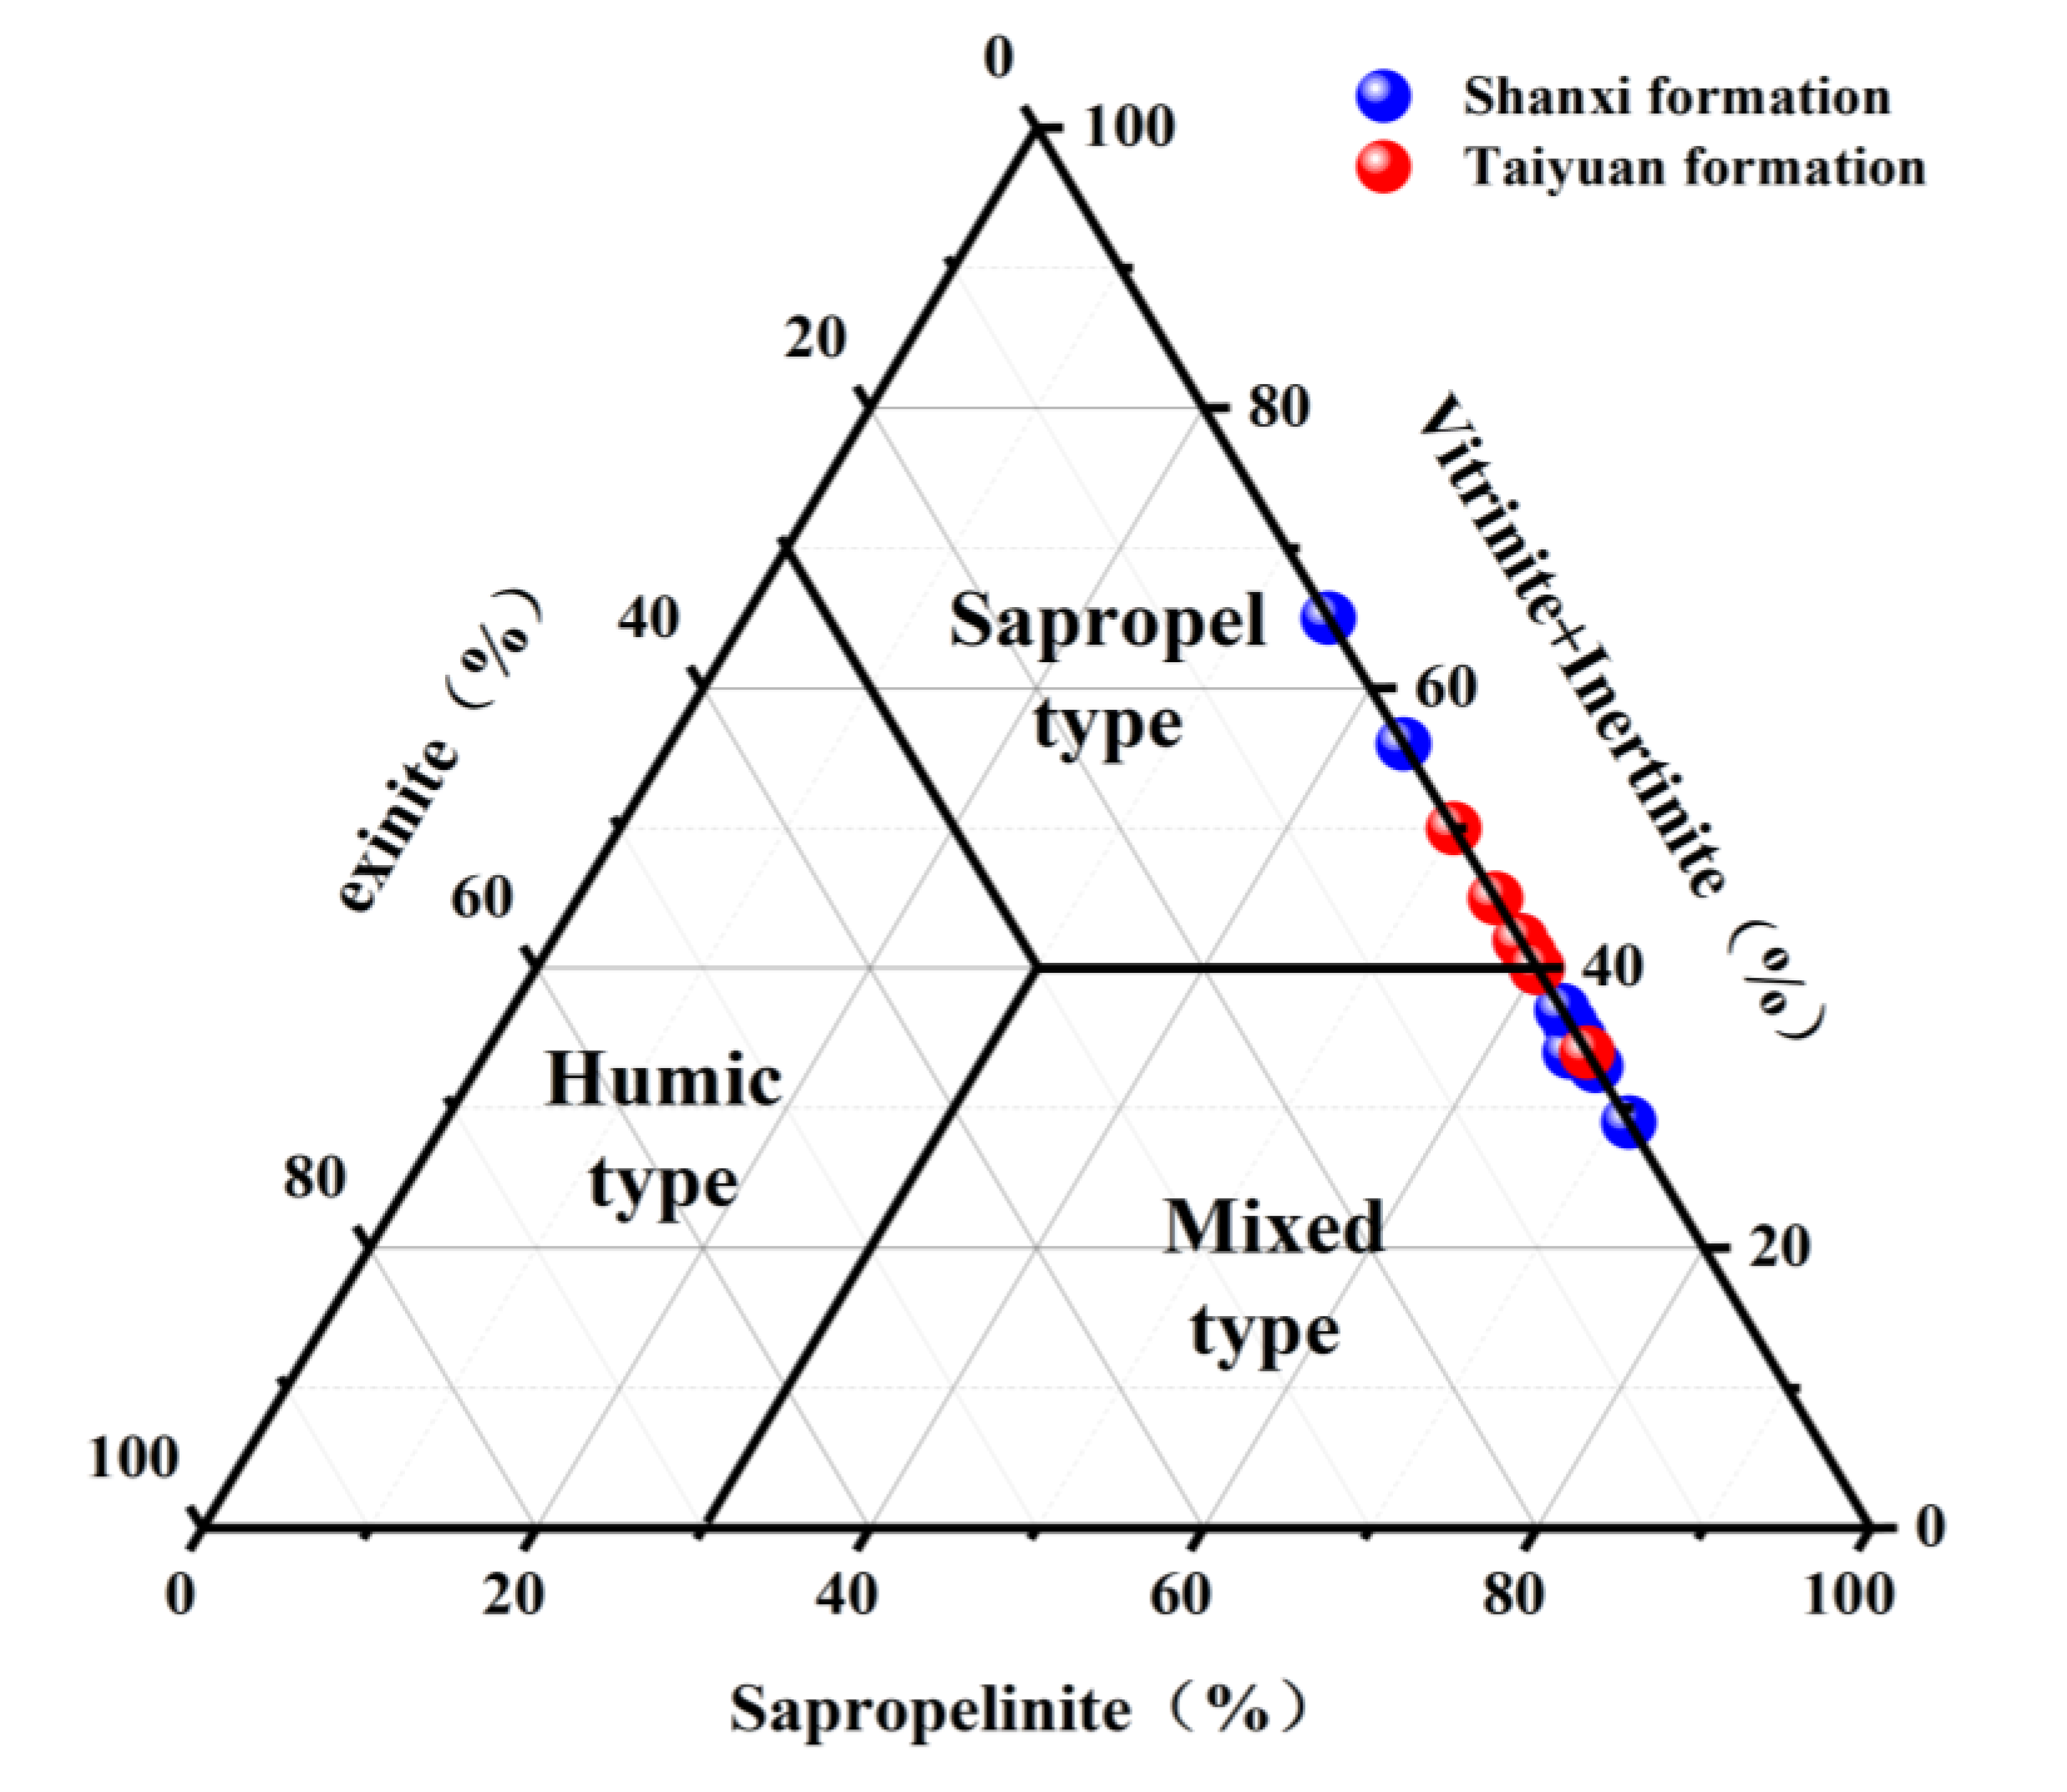
4.3. Organic Matter Type

The maceral characteristics of kerogen can effectively provide the biogenic composition of organic matter and determine the kerogen type. According to the discriminant diagram, the shale samples in Well KP1 were mainly of the mixed type and a small amount of the sapropel type (Figure 6).
This study showed that the shale of the Taiyuan and Shanxi Formations has abundant sapropelic components, indicating that organic matter mainly originates from lower aquatic algae. The analysis showed that the source rocks of the Taiyuan and Shanxi Formations have rich oil and gas generation potential.

4.4. Element Geochemical Characteristics

According to the test results for the major elements, the shale samples of the Taiyuan and Shanxi Formations had the highest Al, Si, and Fe contents. The Si content was the highest. The Si contents in the Taiyuan and Shanxi Formations were between 44.52% and 66.57% (average = 56.22%) and between 52.81% and 64.92% (average = 56.42%), respectively. In addition to these three elements, there were some elements with relatively high contents, such as Mg, K, Ca, and Ti, with average contents of 2.72%, 4.30%, 2.59%, and 1.04%, respectively (Table 2).
The trace-element content results show that the shale samples are mainly enriched in V, Sr, Zr, and Ba, with contents generally greater than 100 ppm. Their average contents were 138.45 ppm (48.2–175 ppm, n = 25), 201.88 ppm (98–434 ppm, n = 25), 199.68 ppm (131–430 ppm, n = 25), and 473.2 ppm (276–880 ppm, n = 25), respectively. The total rare earth element abundance (∑REE) of the Well KP1 shale samples ranged from 179.16 to 390.52 μg/g (average = 249.73 μg/g) (Table 3).

5. Discussion

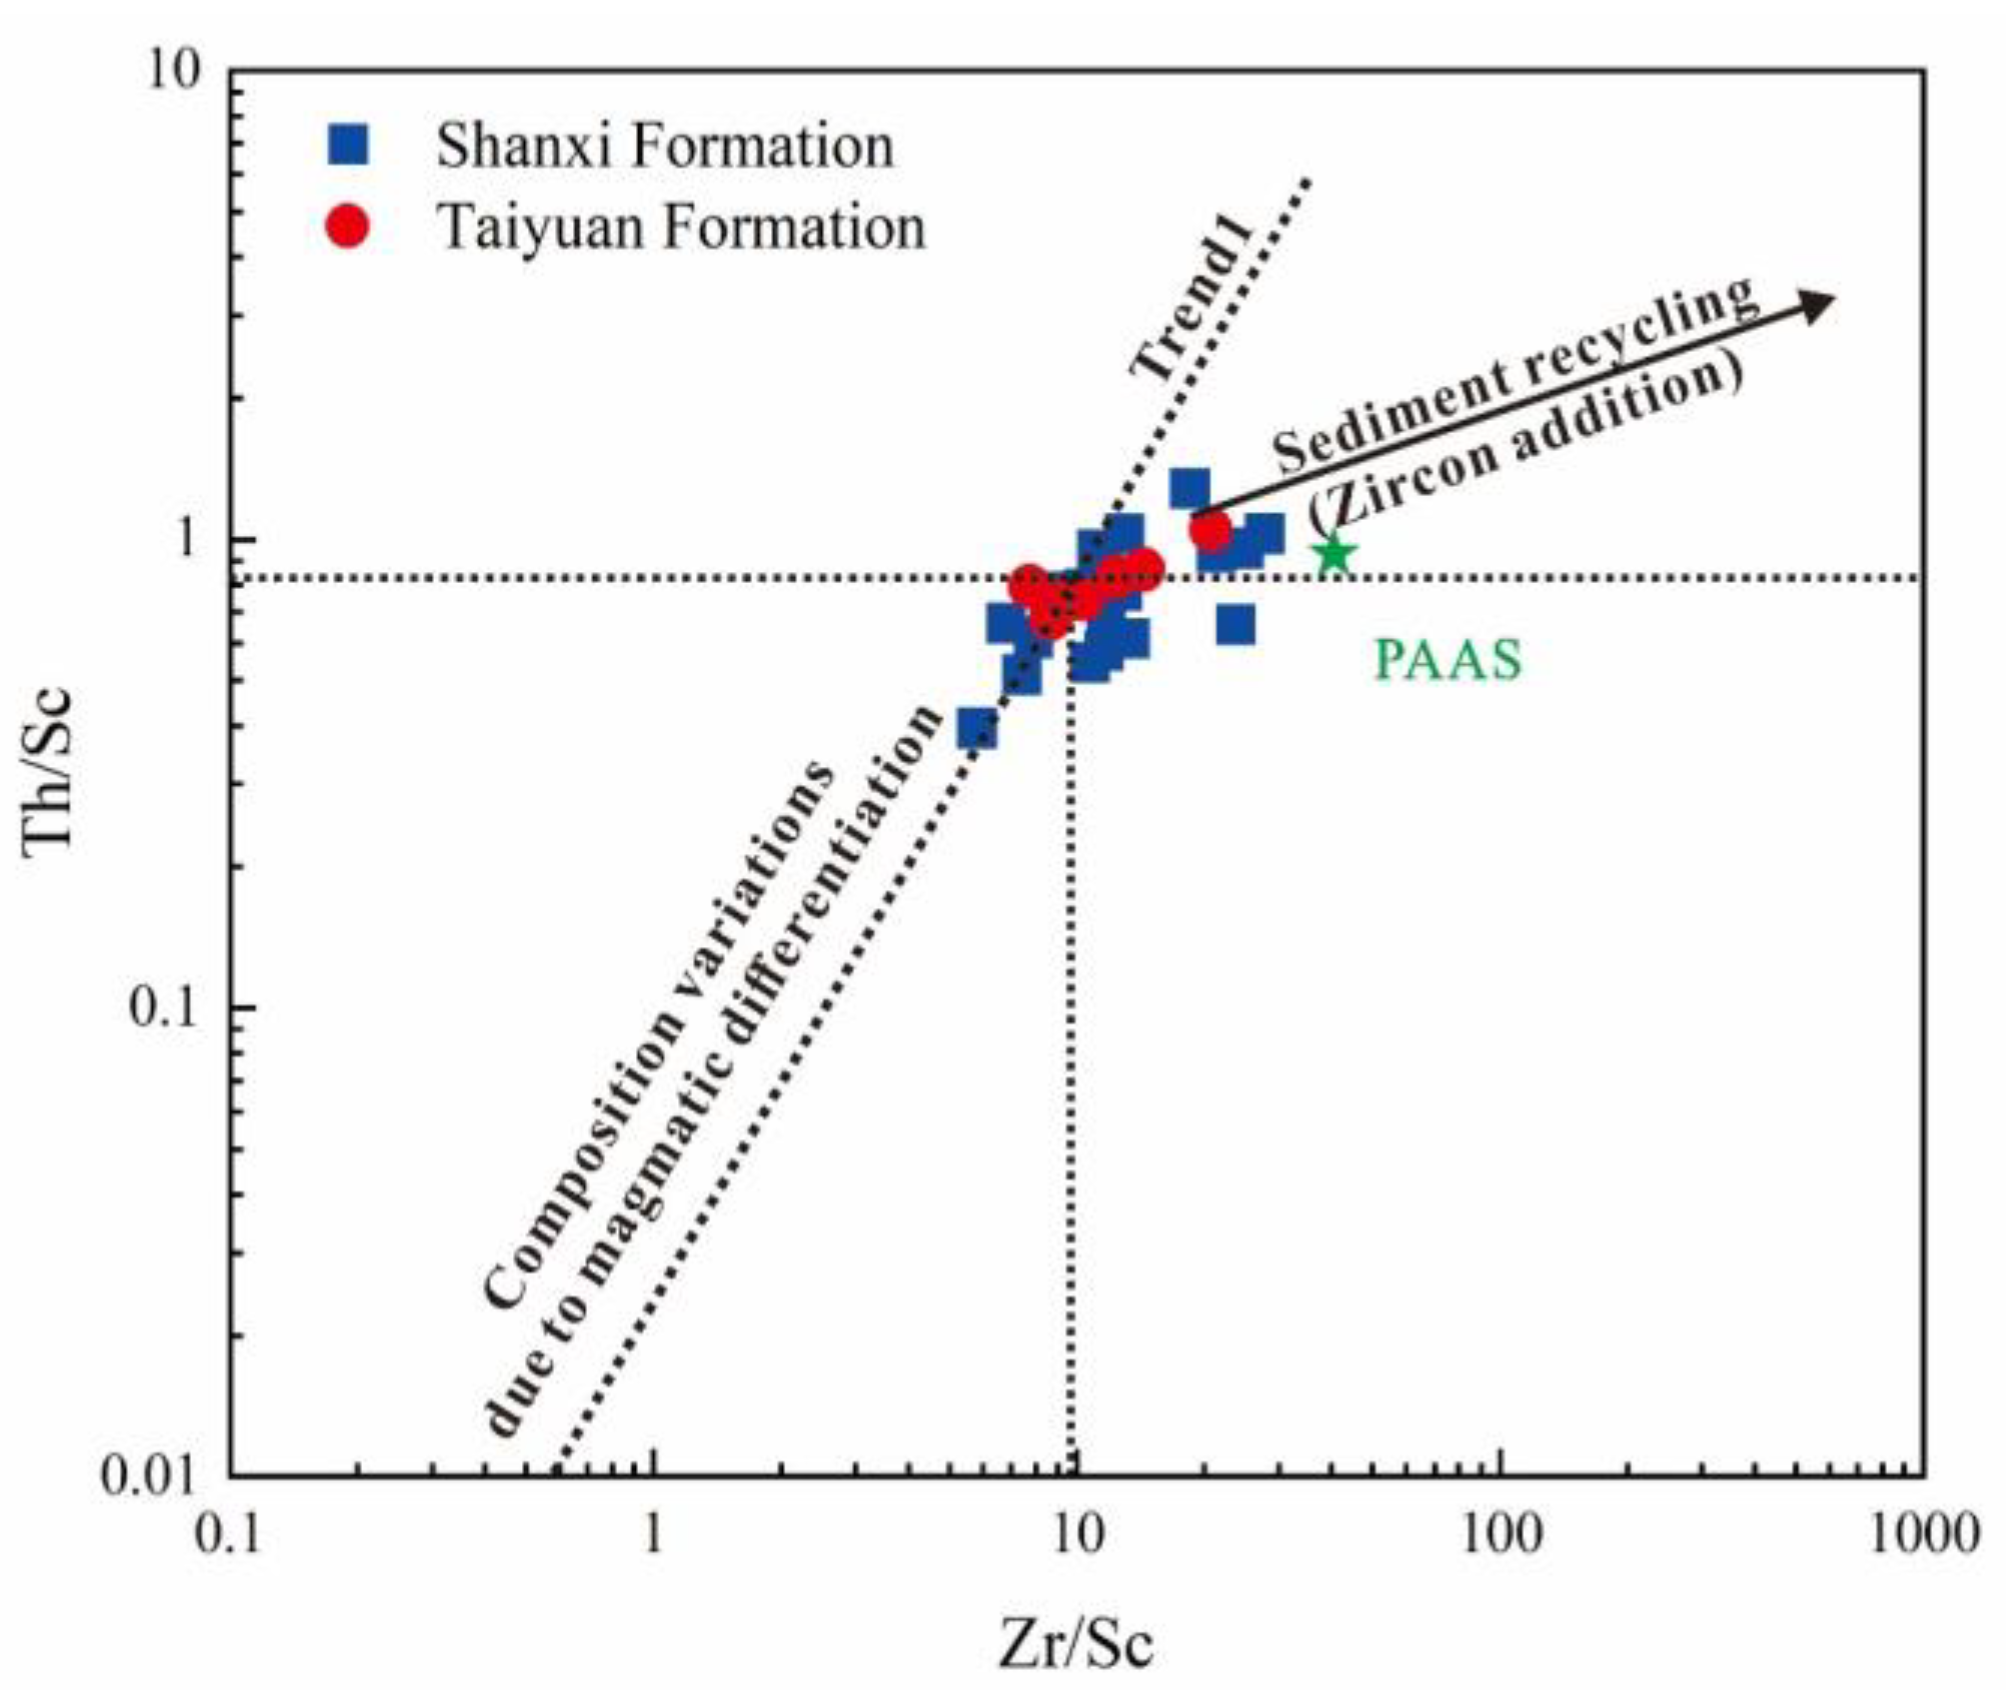
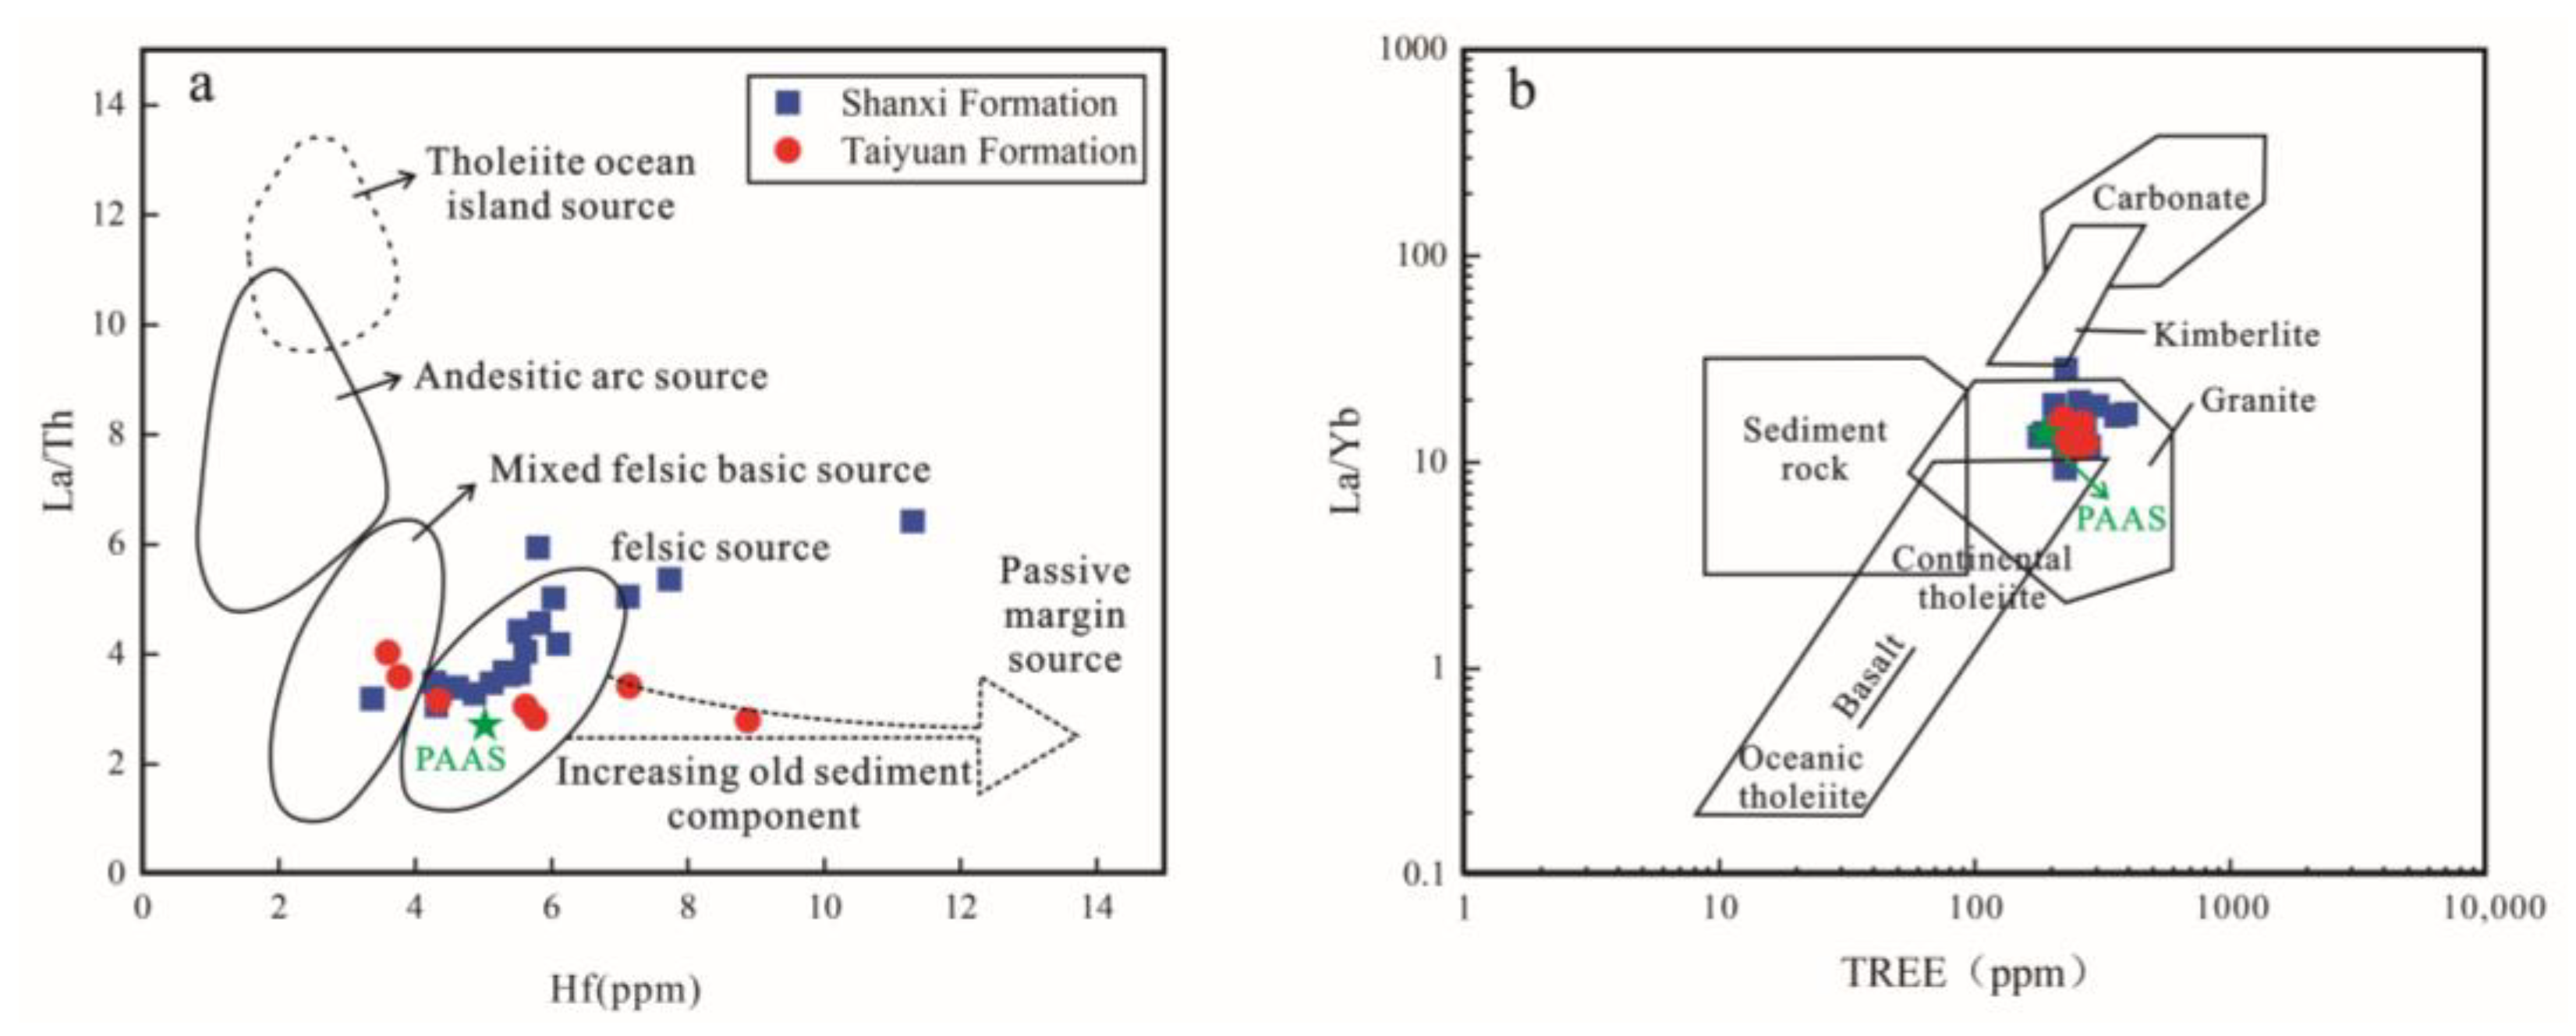
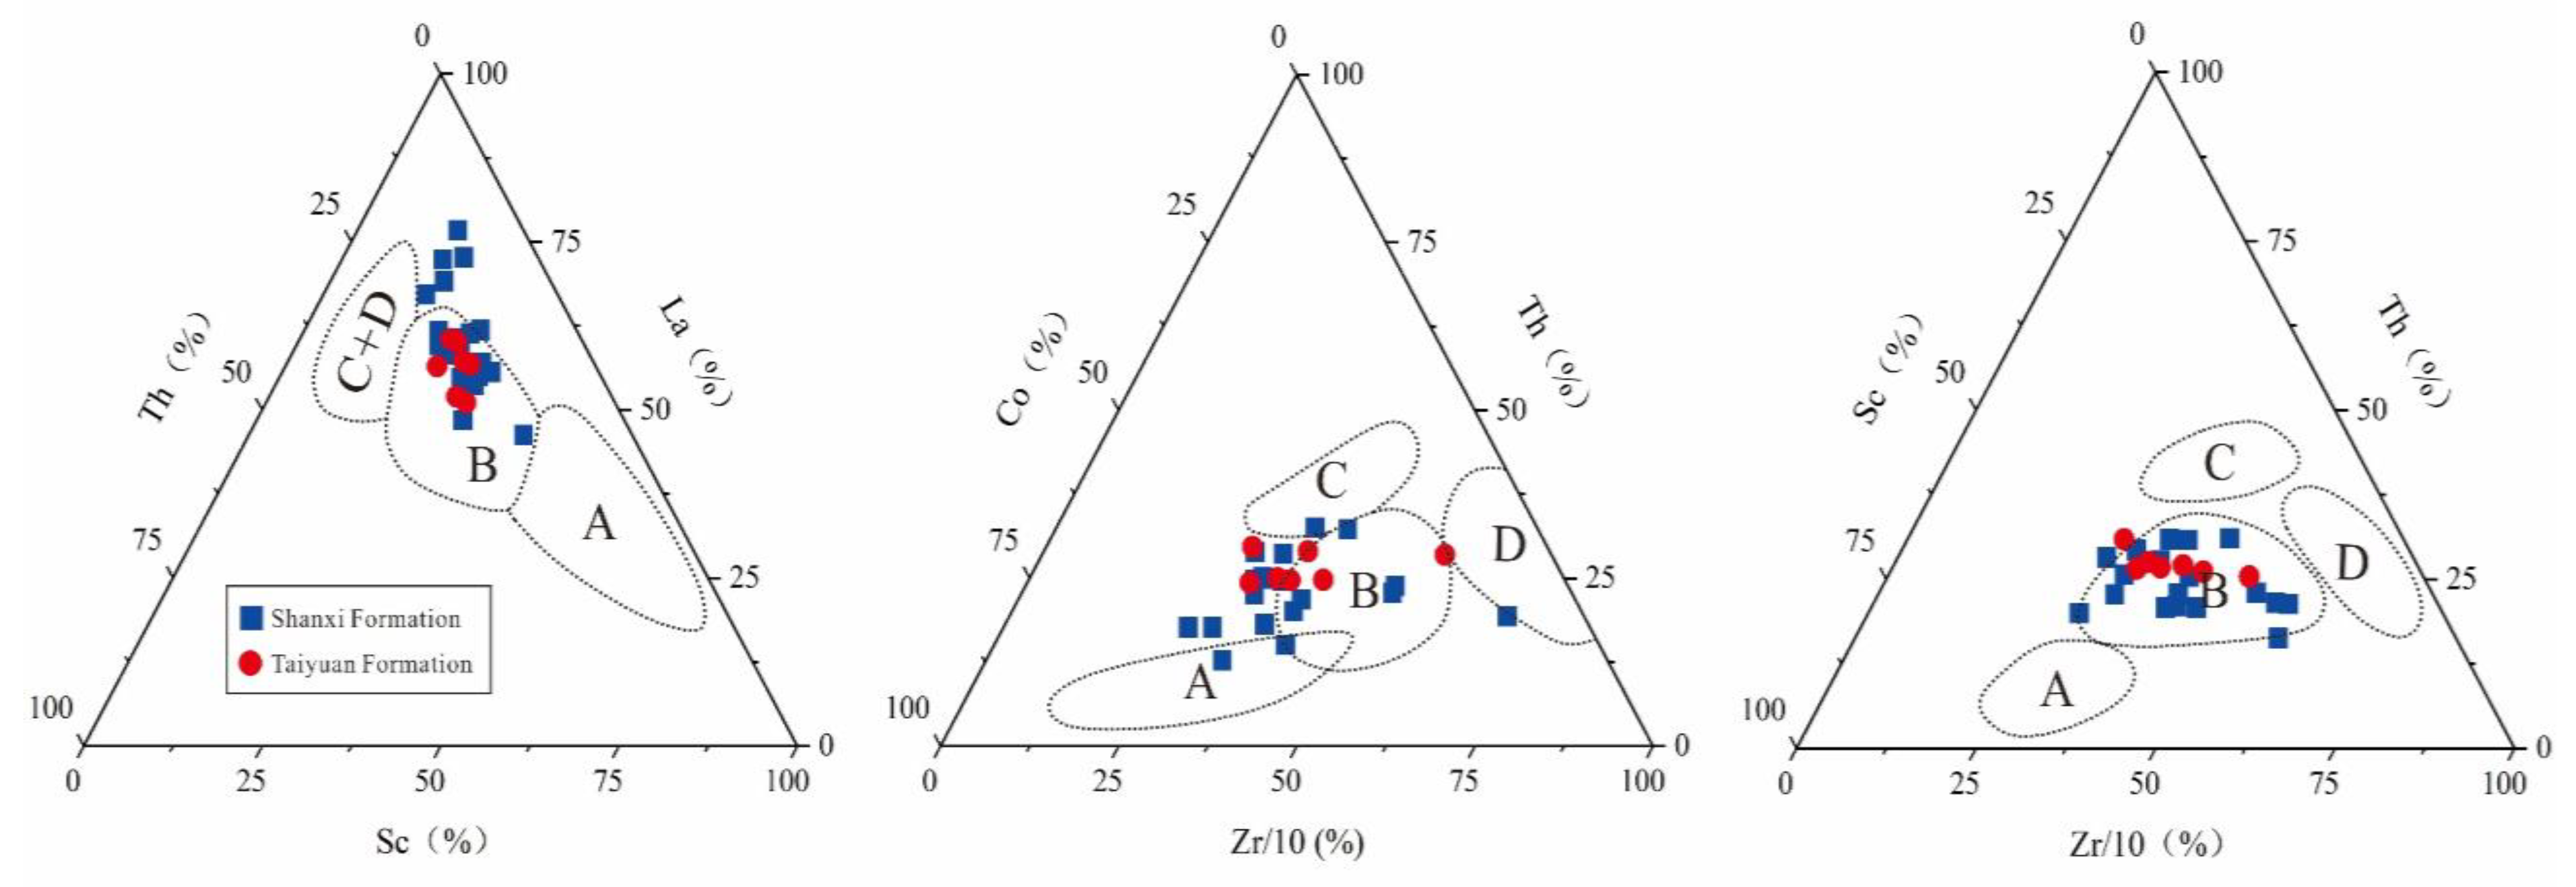
5.1. Provenance and Tectonic Setting

The location of source rock deposition in petroliferous basins influences the preservation state of organic matter in the source rocks [43,44]. The shale material composition is easily altered by sedimentary cycles [45]. Therefore, determining the sedimentary cycle rate of shale samples is a prerequisite for an accurate reflection of their provenance characteristics and tectonic background [43]. Previous studies have shown that the trace elements Zr, Th, and Sc can effectively represent the degree of sediment recycling and changes in rock mineral composition [45,46]. Based on this, a Th/Sc–Zr/Sc diagram was established to determine the degree of sediment recycling [46]. The results show that the average Th/Sc and Zr/Sc ratios of the Well KP1 samples in the northern North China Basin were 0.78 and 13.13, respectively (Figure 7), which are close to the elemental composition characteristics of the PAAS samples (Th/Sc = 0.91; Zr/Sc = 13.12) [47]. This indicated that the shale samples were less affected by weathering, denudation, transportation, and sedimentary recycling. Geochemical shale data can be used to accurately identify the source rock and its tectonic background characteristics.
REE and trace elements (such as Sc, Hf, and Zr) play directional roles in tracing the source area of hydrocarbon source rocks and distinguishing the tectonic background [13,43,48]. The results of the La/Th–Hf provenance discrimination showed that most shale samples from the Shanxi Formation originated in a source area with felsic volcanic rocks. This indicates that the shale source area may be related to acidic magmatic activity. The mud shale samples from the Taiyuan Formation basically fell into the mixed area of felsic and basic rocks and the felsic source area (Figure 8a). In addition, the La/Yb–REE binary diagram is an effective index for distinguishing the source characteristics of source rocks [49]. According to Figure 8b, the samples from the Taiyuan and Shanxi Formations originated from a granite (felsic) source area, and only a single sample originated from the basic basalt source area. In summary, the source rocks of the Taiyuan and Shanxi Formations of Well KP1 chiefly originated from felsic (granite) source areas.
The tectonic background of the source area can be determined using trace and rare earth element discriminant diagrams (La–Th–Sc, Th–Co–Zr/10, and Th–Sc–Zr/10) [3,50]. As shown in Figure 9, the shale samples from Well KP1 were located in or near the continental island arc area. This is consistent with the previous studies showing that the North China Basin was in a stable platform subsidence area during the Late Carboniferous–Permian [50].

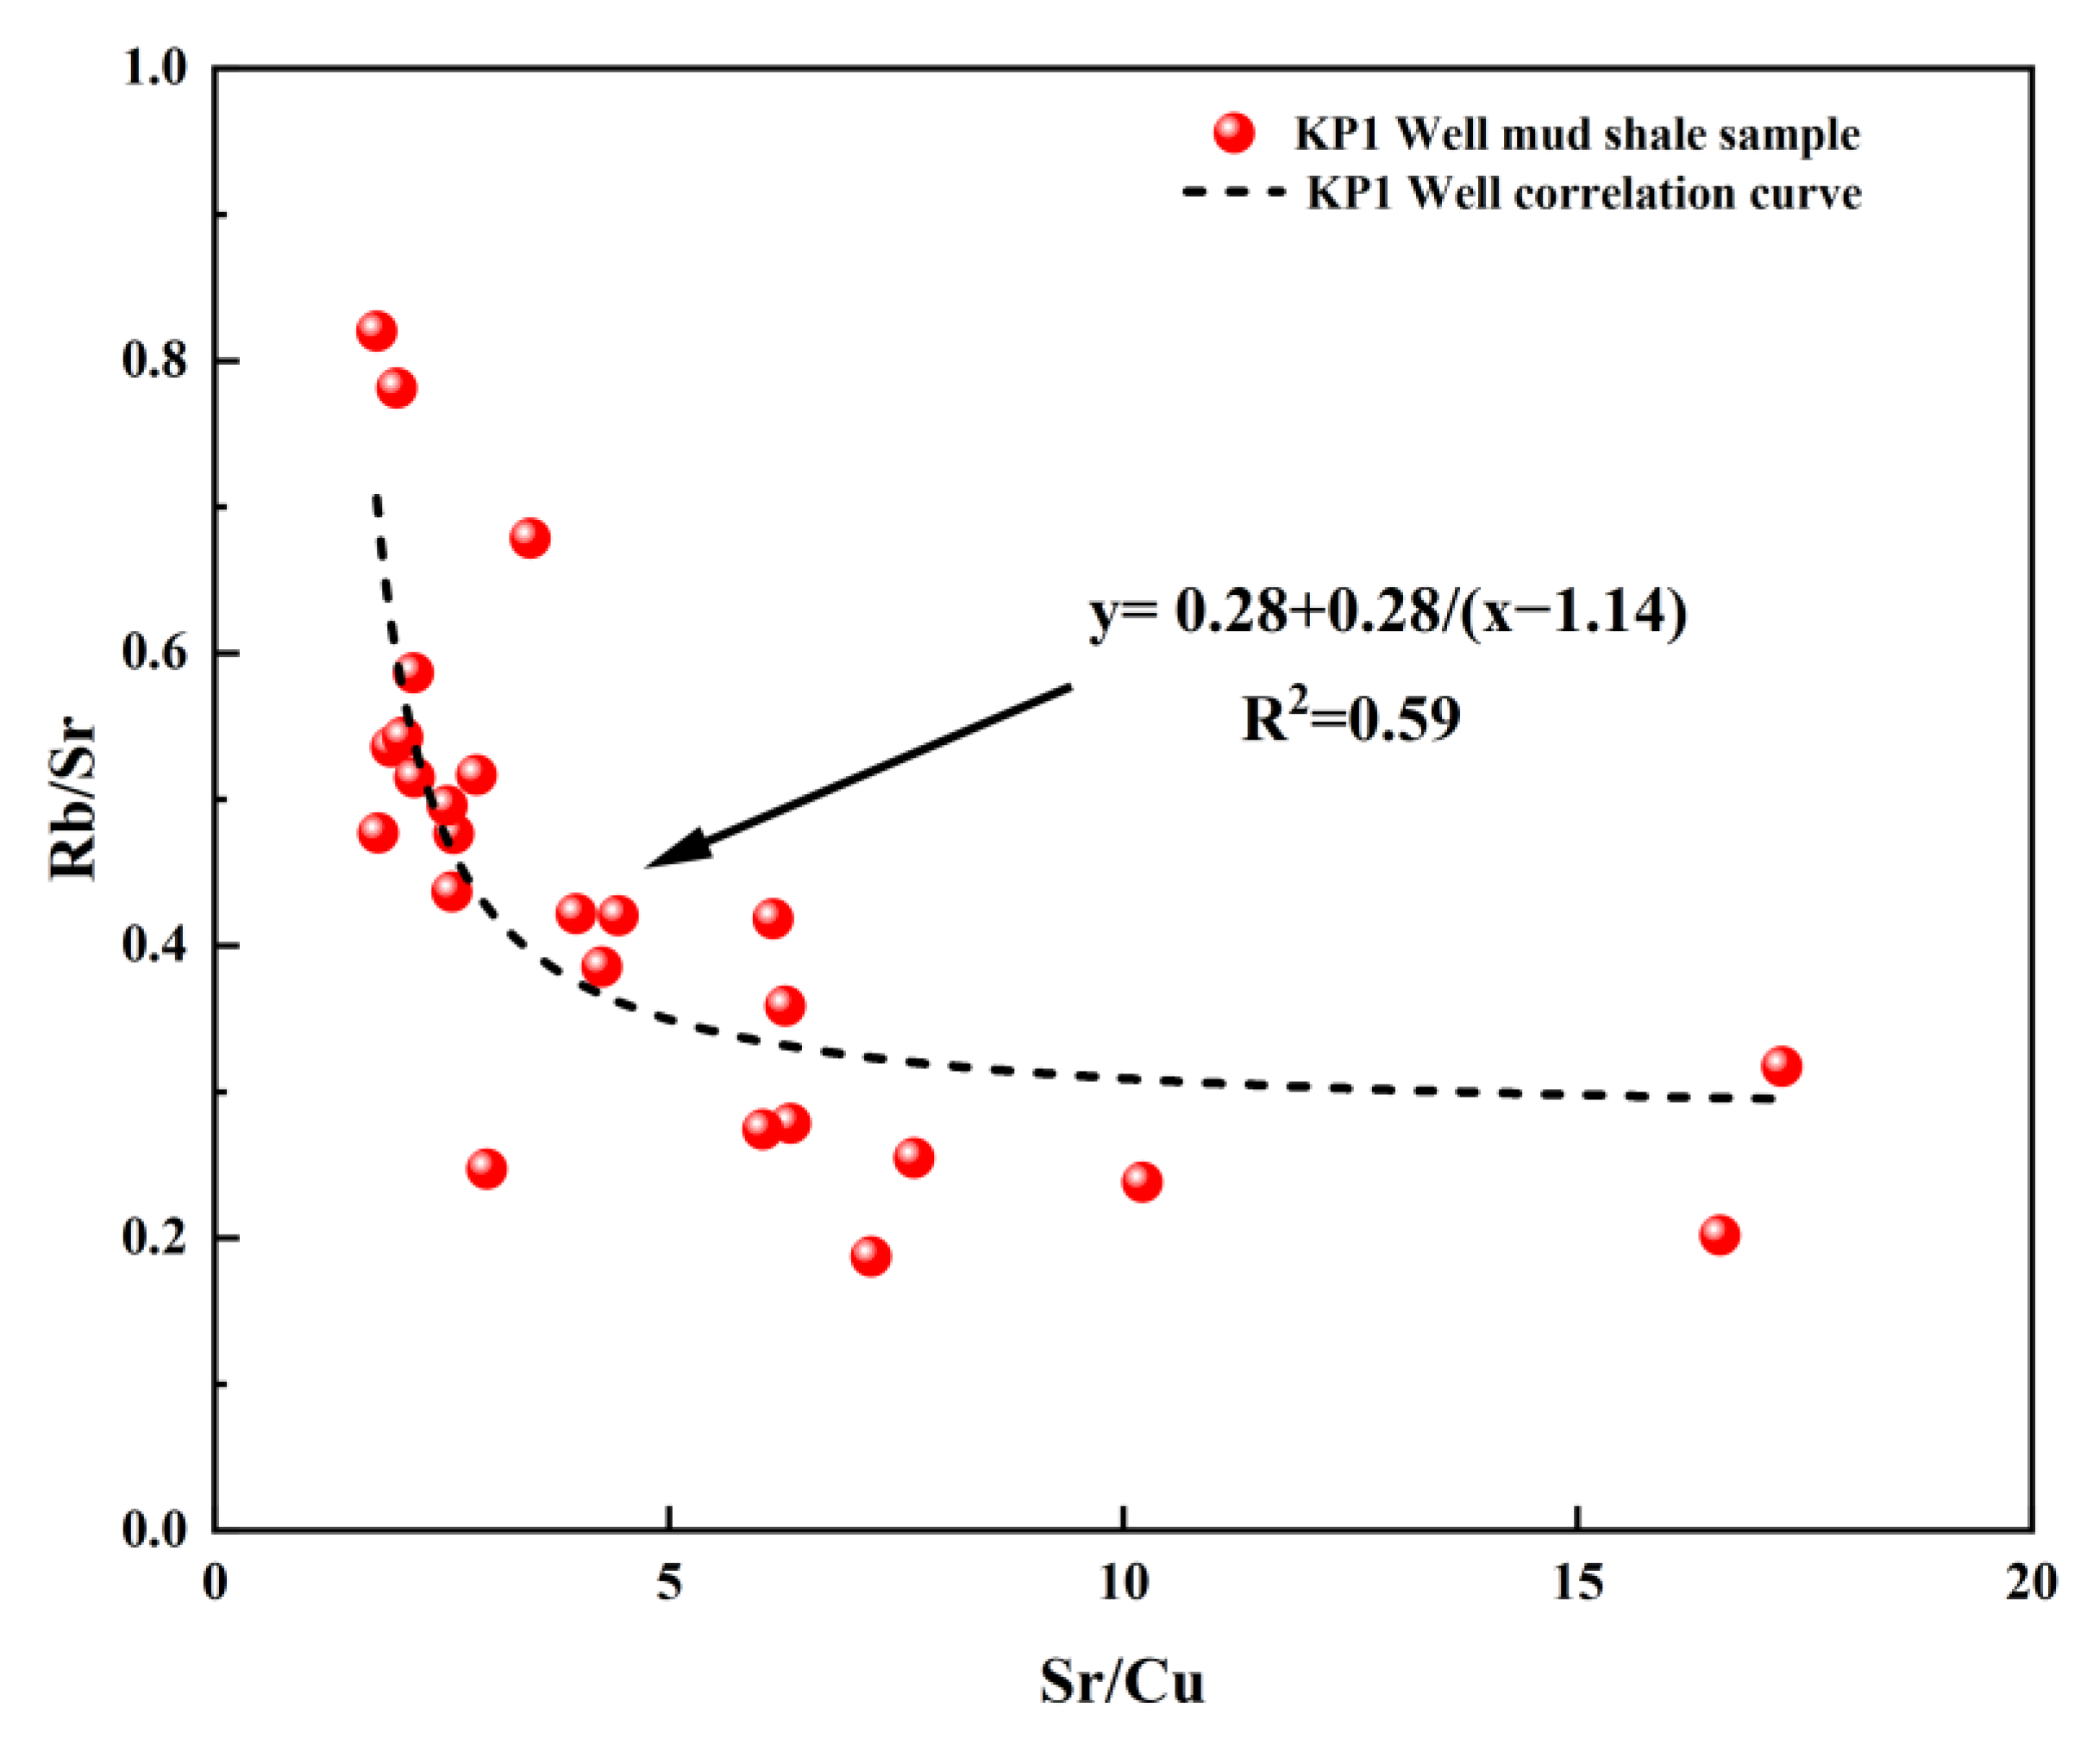
5.2. Paleoclimatic Conditions

Paleoclimatic conditions not only regulate the weathering and denudation degree of source rocks and the growth and prosperity of paleontology but also affect the enrichment and preservation of organic matter in sediments [13,28].
Trace elements Sr, Cu, and Rb are sensitive to climatic conditions. Under warm and humid climatic conditions, Sr is preferentially lost, whereas Cu and Rb remain stable. Therefore, the concentration ratios of Sr/Cu and Rb/Sr can indicate the characteristics of paleoclimatic conditions [28,32]. When the Sr/Cu ratio is between 1 and 10, it represents warm and humid climatic conditions. When the Sr/Cu ratio is greater than 10, it indicates hot and dry climatic conditions. In addition, the Rb/Sr ratio reflects the characteristics of precipitation during the sedimentary stage. The larger the ratio, the more abundant the precipitation and the stronger the hydrodynamic conditions. The smaller the ratio, the lower the precipitation and the worse the hydrodynamic conditions [51].
According to the correlation analysis of Rb/Sr and Sr/Cu in the shale samples, the curve-fitting equation of the shale samples in Well KP1 was y = 0.28 + 0.28/(x − 1.14) (R2 = 0.59) (Figure 10). When the Sr/Cu ratio was less than 10, the Rb/Sr ratio increased rapidly. When the Sr/Cu ratio exceeded 10, the Rb/Sr ratio decreased slowly. This shows that the Sr content is sensitive to climate. When rainfall is rich, the Sr content is lost rapidly, which causes the Rb/Sr ratio to increase rapidly. When the climate was dry, the Sr content remained stable, causing the Rb/Sr ratio to decrease slowly (Figure 10). This indicates that paleoclimatic conditions correlate well with precipitation. The Sr/Cu ratio in the shale samples from Well KP1 in the study area was between 1.78 and 17.25, and the Rb/Sr ratio was between 0.19 and 0.82 (Table 4). The average value of Sr/Cu in the Taiyuan Formation to the Shanxi Formation is on the rise (increased from 2.18 to 5.13). The average Rb/Sr ratio was maintained at approximately 0.4. This suggests that the warm, humid paleoclimate gave way to a hot, dry one. From the Taiyuan Formation to the middle and lower parts of the Shanxi Formation, the Sr/Cu ratio was less than 10, and the Rb/Sr ratio remained low (close to 0.4). This indicates that during this sedimentary stage, the climate changed from warm and humid to hot and dry, precipitation decreased, and hydrodynamic conditions weakened. Subsequently, precipitation increased, and warm and humid conditions were experienced again.
The Taiyuan Formation has a constant warm and humid climate. The climate of the Shanxi Formation shows a reciprocating change with increasing and decreasing rainfall, and the paleoclimatic conditions were even worse.

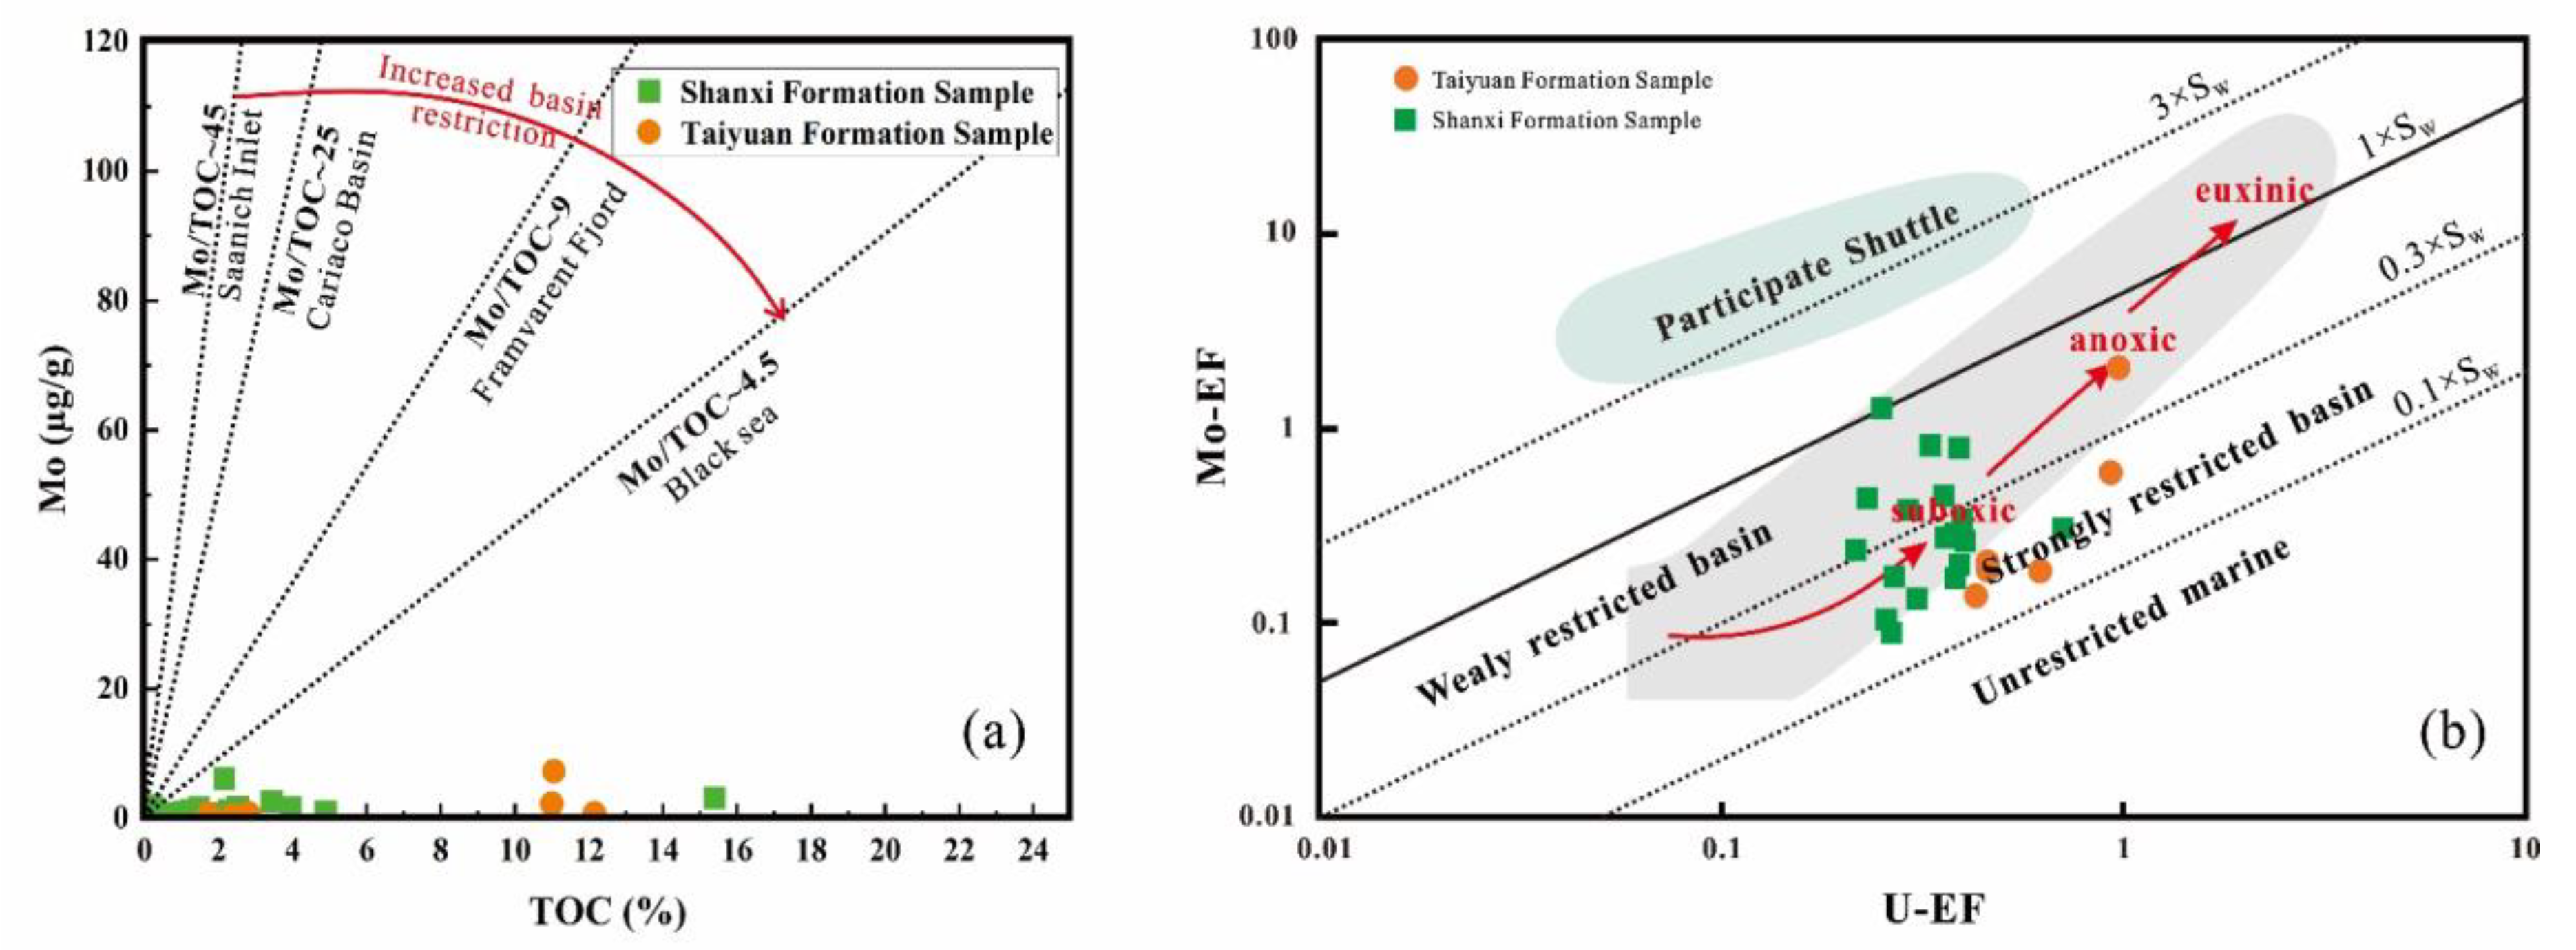
5.3. Paleoredox Conditions

According to Figure 11a, the Mo/TOC values of the Taiyuan and Shanxi Formations in the northern North China Basin are between 0.06 and 10.1 (average = 1.04). Only a single sample with medium retention intensity was in the Cariaco Basin model, and the remaining samples were in the Black Sea model. This indicated that the sedimentary environment was a strong water-retention environment [19,32,52] (Figure 11a). According to the U-EF–Mo-EF covariation diagram, the samples of the Taiyuan and Shanxi Formations were consistent with the comprehensive evaluation index, and all data points in the study area were mainly near the anoxic area. The samples from the Taiyuan Formation had a high degree of hypoxia and were in a strong water-retention environment, indicating that the sea level was relatively stable. The samples from the Shanxi Formation were in an oxygen-poor area as a whole, and the sedimentary environment was mainly a medium–strong water-retention environment. It is speculated that the stranded environment will change owing to changes in sea level (Figure 11b).
In general, the paleoredox conditions of the sedimentary water in the study area were mainly anoxic reduction conditions in a medium–strong water-retention environment. The sedimentary basin of Well KP1 in the northern part of the North China Basin was in the Taiyuan Formation sedimentary stage during the Late Carboniferous. The sedimentary water body had an anoxic reduction and a strong water-retention environment. During the sedimentary stage of the Permian Shanxi Formation, the paleoredox level and retention environment of the sedimentary water fluctuated with changes in sea level; however, it was still an anoxic reduction and medium–strong water-retention environment.

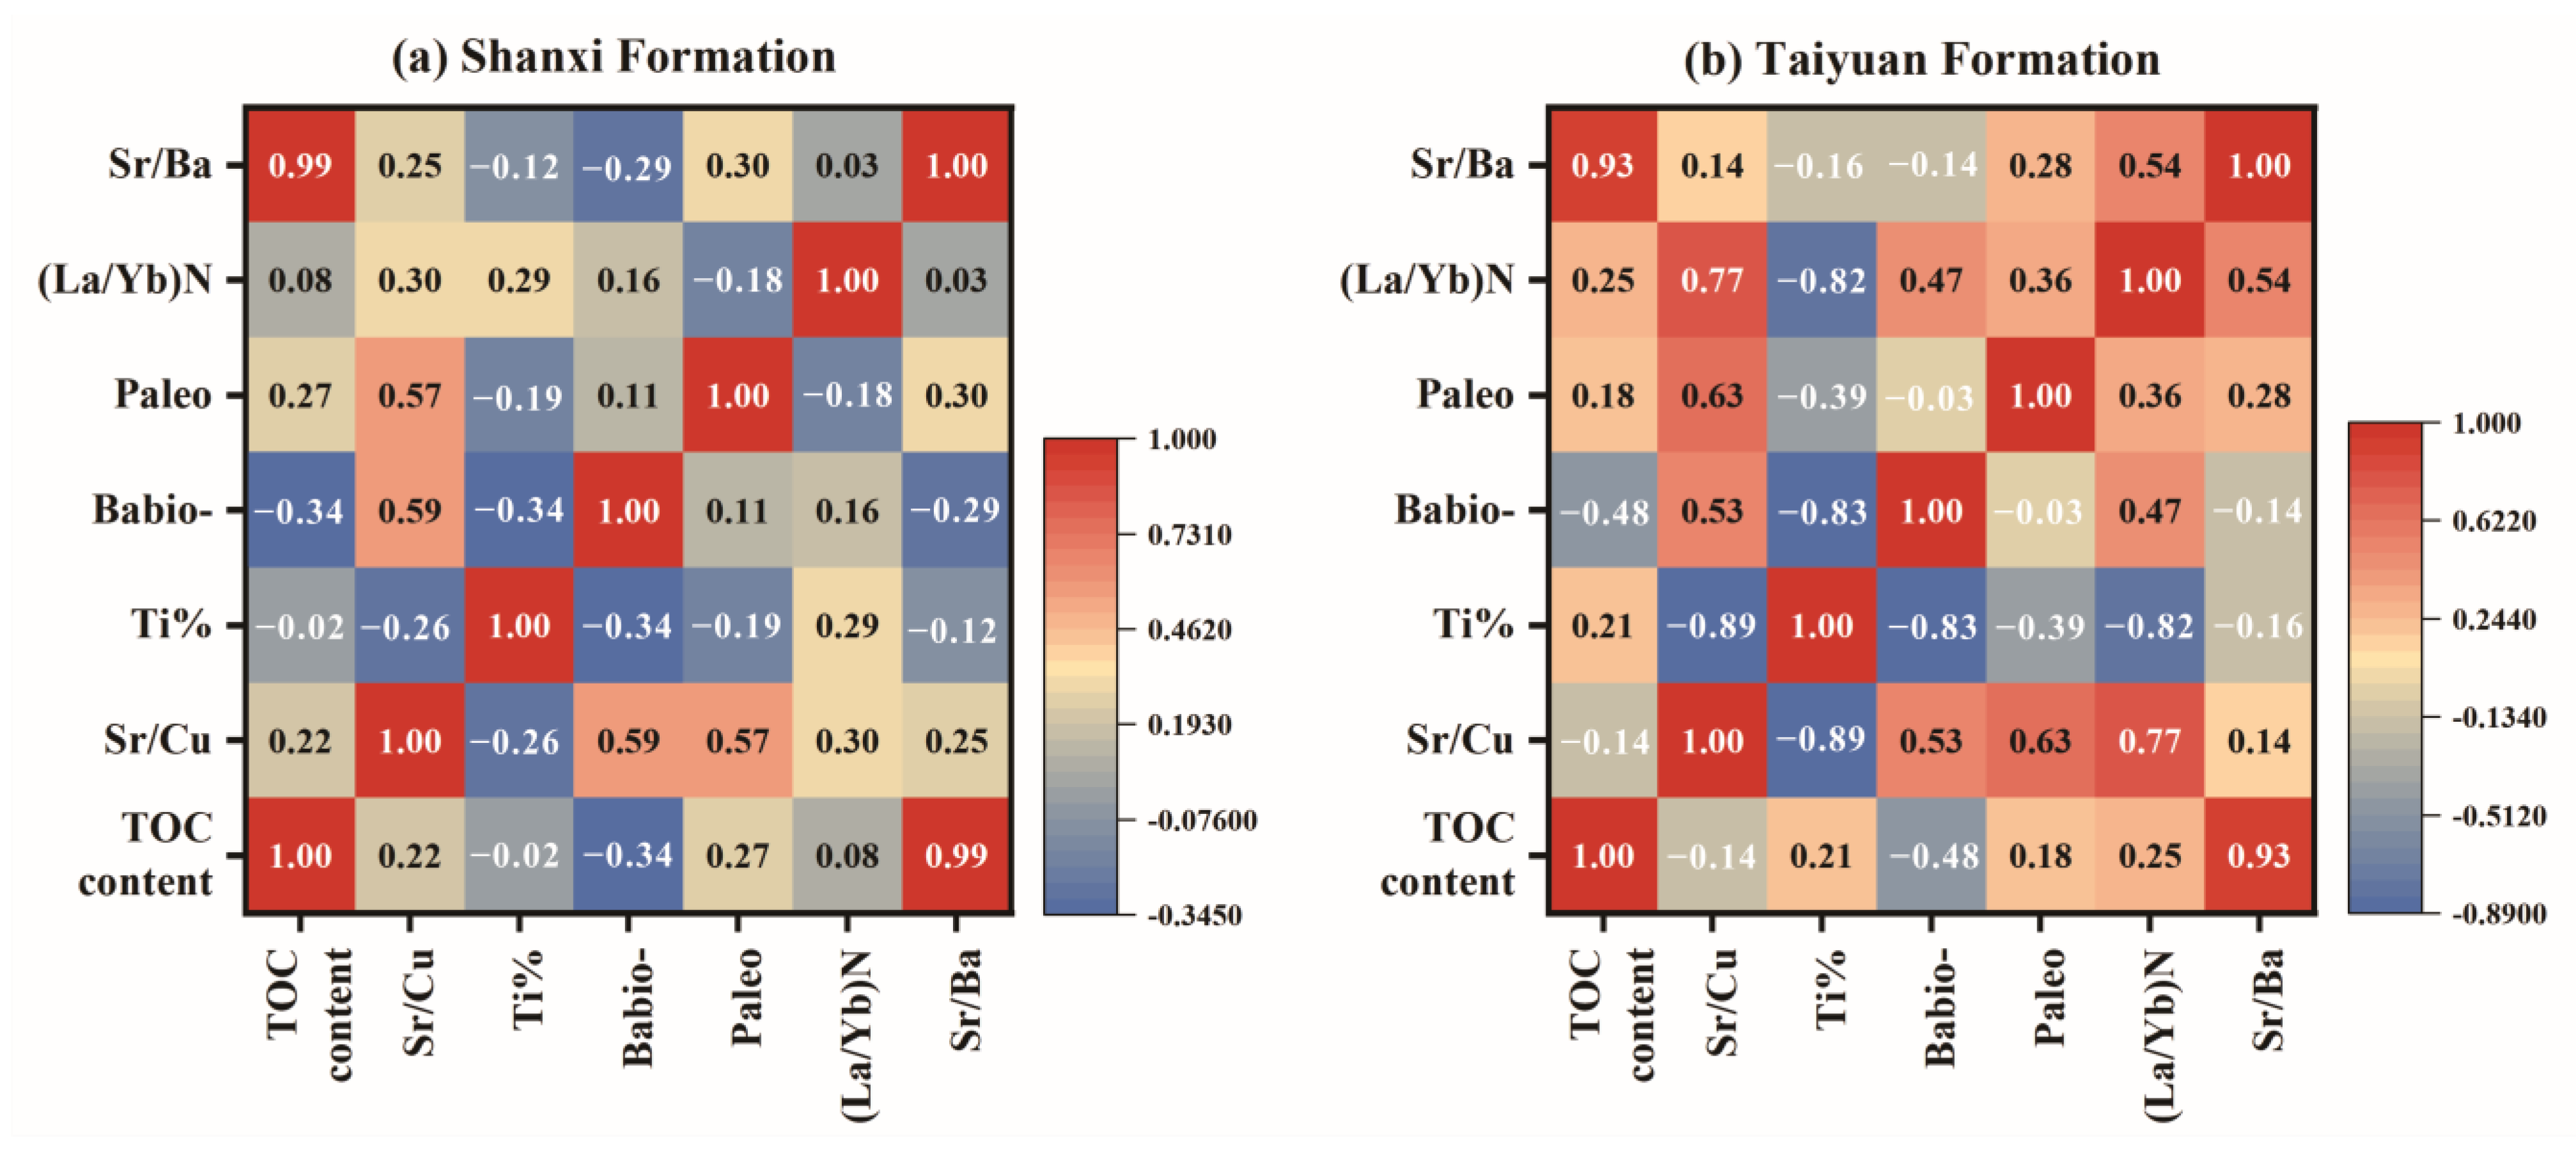
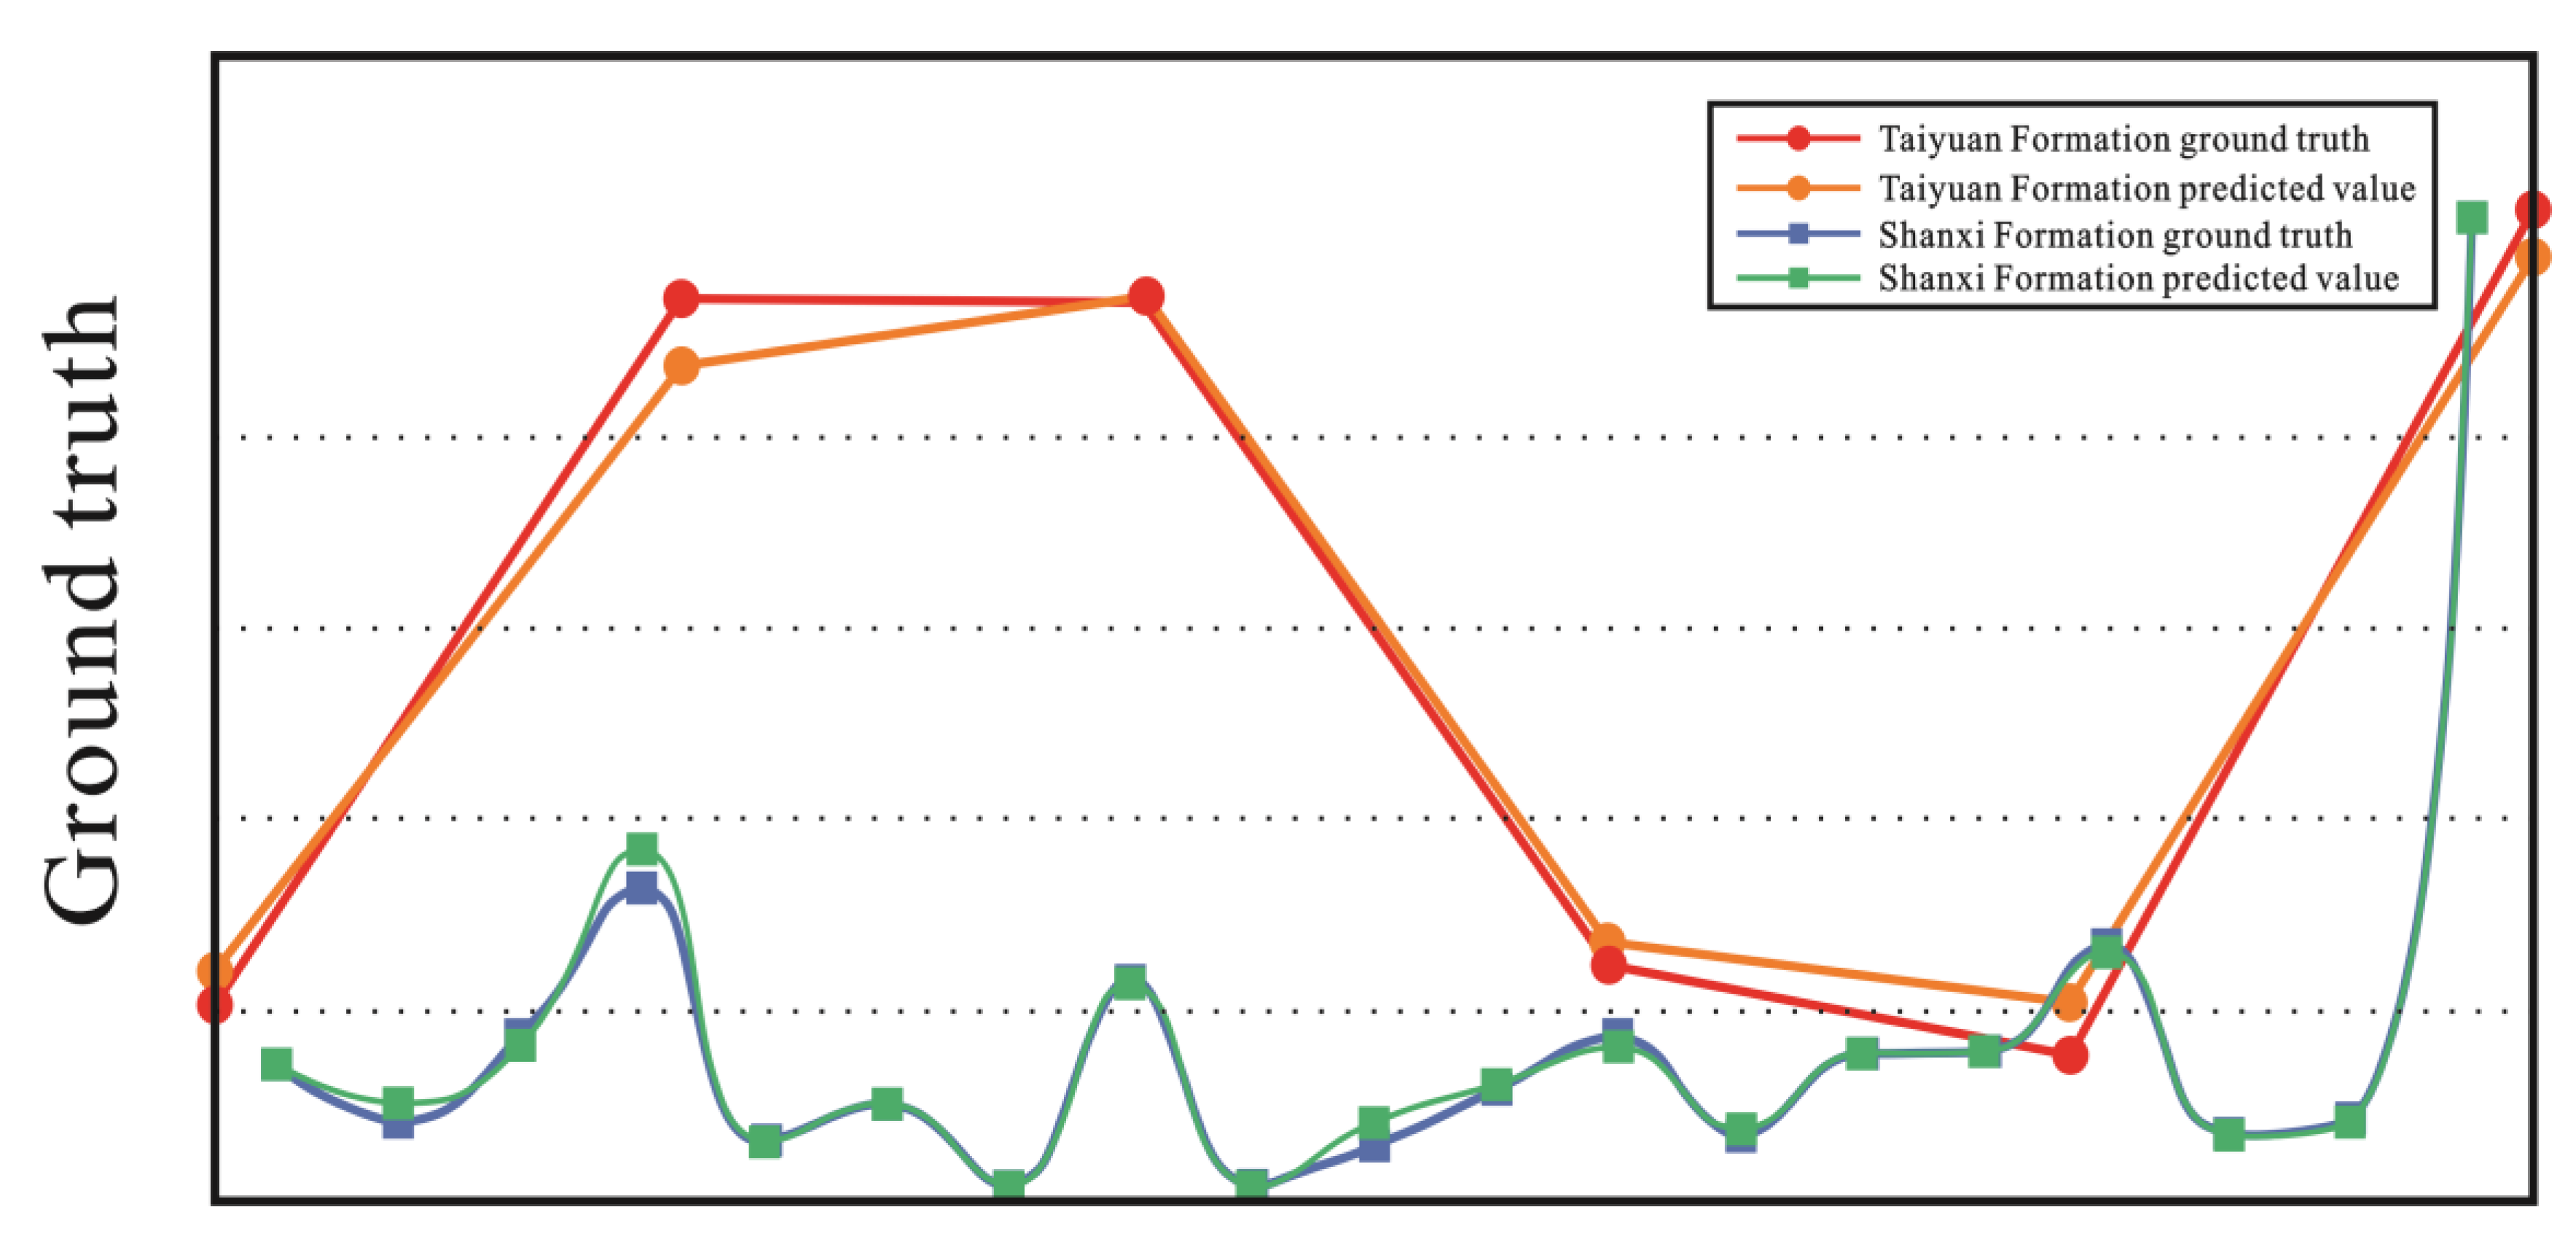
5.4. Multivariate Statistical Analysis of Organic Matter Enrichment Control Factors

Organic matter enrichment may result from interactions between multiple environmental factors. However, a single environmental factor cannot explain the enrichment of organic matter. Therefore, grey correlation and multiple linear regression analyses of organic matter enrichment can systematically characterize the organic matter content under the combined effects of various environmental factors.
The principle of a grey correlation analysis is that the degree of correlation between curves can be reflected by determining the geometric similarity between the reference sequence (the TOC content) and several comparative data columns (paleoproxy water columns) [53,54] (Table 5). The grey correlation method can be used to explore the correlation between the organic matter content and paleoenvironmental factors (such as paleoclimate, paleosalinity, paleoproductivity, terrigenous clastic input, sedimentation rate, and paleoredox). The primary and secondary relationships between the paleoenvironmental factors and TOC content were determined by comparing the grey correlation degree of each paleoenvironmental factor in the system.
The correlation coefficient heat map between various influencing factors and the TOC content of the shale samples from the Shanxi Formation shows that the correlation from strong to weak is paleosalinity (Sr/Ba), paleoproductivity (Babio), paleoredox (Paleo-), paleoclimate (Sr/Cu), debris flow (Ti, %), and deposition rate (La/Yb) N. The grey correlation coefficient between the paleosalinity index and the TOC was the highest (0.99), and there was no significant correlation between the other influencing factors and the TOC content. This shows that sea-level fluctuations play a decisive role in the enrichment of shale organic matter in the Shanxi Formation in the study area (Figure 12).
According to Figure 11b, the grey correlation degree of each influencing factor of Taiyuan Formation shale from strong to weak is paleosalinity (Sr/Ba), paleoproductivity (Babio), sedimentation rate (La/Yb) N, debris flux (Ti, %), paleoredox (Paleo-), and paleoclimate (Sr/Cu). The correlation coefficient between the paleosalinity index and the TOC was the highest (0.99), followed by paleoproductivity, and the coefficient was −0.48. This indicates that sea-level fluctuations have a significant effect on the enrichment of organic matter in Taiyuan Formation shale, and the ancient production conditions also play a certain role in controlling the enrichment of organic matter. The remaining control factors have little effect on the enrichment of organic matter in the Taiyuan Formation in the study area (Figure 12).
Moreover, a multiple linear regression analysis can be used to effectively study the uncertain interdependence and restrictive relationship between organic matter enrichment and various paleoenvironmental factors. This relationship can be mathematically expressed. The purposes of this are to determine the image-specific performance of the organic matter enrichment process and to use unknown variables to predict or test the accuracy of the change [55,56].
A regression analysis must first establish a regression equation. Using the data of dependent variable Y (the TOC content) and independent variable X (paleoproxy water column), the regression parameters ( a 1 , a 2 , , a m ) were estimated based on the classical least-squares principle (V^T PV = min). However, there were errors in both the dependent and independent variables. The classical least-squares principle was not robust. When data, especially geochemical data, have gross errors, they have a destructive effect on the parameters of the entire regression equation. In a robust regression analysis, the variance–covariance of gross error observations is continuously increased through successive iterative adjustments to automatically eliminate gross errors. Thus, a robust regression is recommended for geochemical data with gross errors. Therefore, the TOC content ensured the accuracy of the regression parameters as much as possible under the premise of gross errors in the paleoenvironmental parameters.
According to the shale data of Well KP1 in the study area, the dependent variable was the TOC content, and the independent variables were the paleoenvironmental parameters that may have a greater impact on the TOC content, namely, paleosalinity (Sr/Ba), deposition rate (La/Yb)N, paleoclimate (Sr/Cu), detrital flux (Ti, %), paleoproductivity (Babio), and paleoredox (Paleo). A robust regression method was used for the calculations.
The fitting parameters of the shale samples from the Shanxi Formation in Well KP1 were determined using the robust least-squares method. When the significant p-value of the paleoenvironmental factor parameter was closer to zero, the parameter had a significant effect on organic matter enrichment. In the process of organic matter enrichment in the Shanxi Formation, the p-values of detrital flux (Ti, %), deposition rate (La/Yb)N, and paleosalinity (Sr/Ba) were all <0.01 (Table 6). This indicates that these three factors had a significant effect on the enrichment of organic matter in the Shanxi Formation, whereas the other factors had little effect. Furthermore, a multiple linear regression model was developed based on robust regression as follows:
TOCcontent = −0.017 − 0.0 × Paleoclimate (Sr/Cu) + 1.563 × Detrital flux (Ti%) + 0.001 × Paleoredox (Paleo-) + 0.0 × Deposition rate (La/Yb)N + 0.01 × Paleosalinity (Sr/Ba)
The error between the fitted and actual values was small, and the correlation coefficient was R2 = 0.997 (Figure 13). The two curves were well-fitted and showed strong accuracy. The sample size of the Taiyuan Formation was small, and a robust regression analysis could not be performed. The samples from the Taiyuan Formation were analyzed using the ridge regression method in least-squares regression. According to ridge regression, a multiple linear regression model was obtained as follows:
TOCcontent = 0.025 − 0.002 × Paleoclimate (Sr/Cu) + 2.95 × Detrital flux (Ti%) − 0.001 × Paleoredox (Paleo-) + 0.003 × Deposition rate (La/Yb)N + 0.007 × Paleosalinity (Sr/Ba)
Because of the small number of samples, the significance of each factor at that level was low, and it was impossible to determine the factors that had a decisive influence on organic matter. However, the error between the fitted and true values was small (Figure 13), and the correlation coefficient was R2 = 0.987 (Table 6).
Based on these results, it is considered that the enrichment of organic matter in the Taiyuan Formation in the study area is controlled by paleosalinity and paleoproductivity. During the sedimentary stage of the Shanxi Formation, paleosalinity was the main factor controlling the enrichment of organic matter, while the remaining paleoenvironmental conditions had little effect.

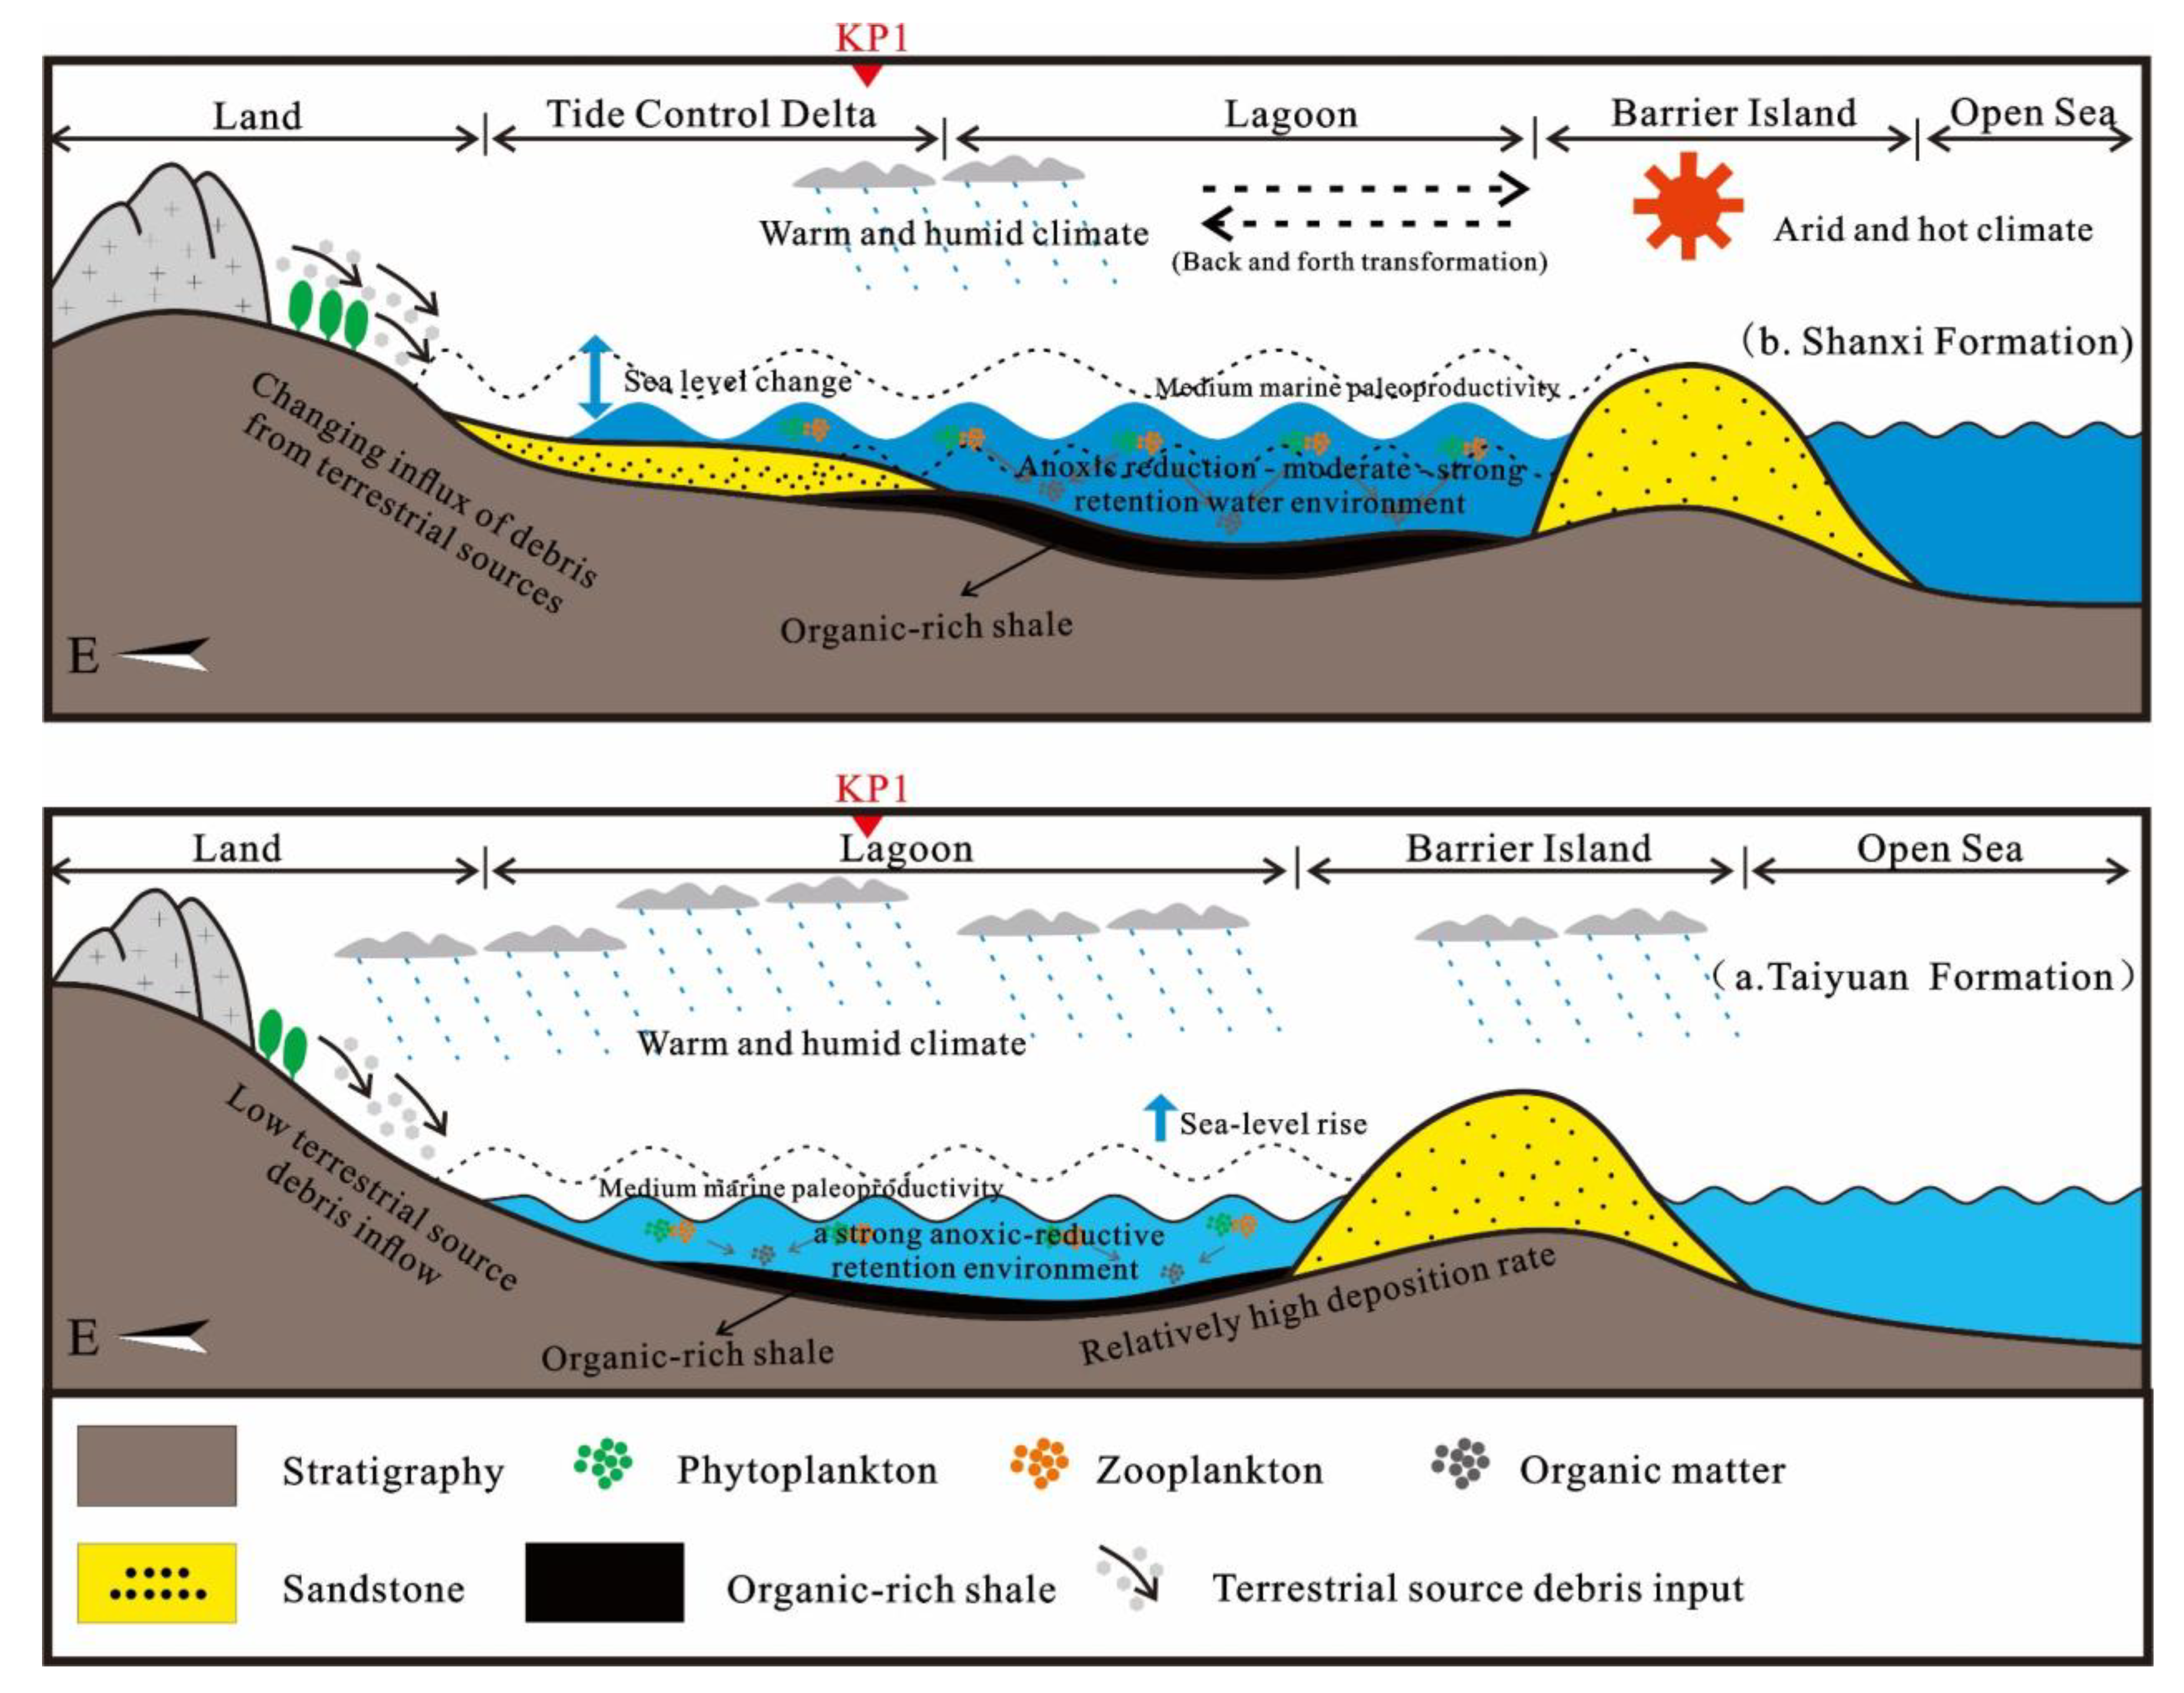
5.5. Organic Matter Accumulation Model

Based on the comprehensive research results, an organic matter enrichment model of the Carboniferous–Permian Taiyuan and Shanxi Formations is discussed. During the sedimentary stage of the Taiyuan Formation, a tidal flat–lagoon environment developed in the study area. A stable and gentle transgression phase brought large amounts of deep-marine nutrients to the sea surface. Moreover, warm and humid climatic conditions promoted the growth of plankton, such as marine algae. This laid a material foundation for the mechanism-rich shale deposition of the Taiyuan Formation. The transgression process moved the sedimentary basin far away from the land. This made it difficult for terrigenous debris to reach, and the input of terrigenous debris decreased. Therefore, the input of terrigenous debris had little effect on organic matter enrichment (Figure 14a).
During the sedimentary stage of the Shanxi Formation, a tidal-dominated delta–lagoon environment was developed in the study area. The sea level was in a stage of change, which caused the input of terrigenous debris to fluctuate and changes in the deposition rate. Moreover, the processes of transgression and regression changed the degree of retention of sedimentary water. The Shanxi Formation continues to remain in an anoxic reduction and medium–strong water-retention environment, providing better preservation conditions for organic matter. However, frequent regressions and transgressions caused the degree of enrichment of shale organic matter to differ. Therefore, the Shanxi Formation forms a set of shales with a lower organic matter content (Figure 14b).
Based on this research and analysis, the enrichment of organic matter in marine–continental transitional shales is more dependent on ancient water salinity conditions. The processes of transgression and regression not only control the amount of source debris inflow but also affect the deposition rate. In addition, they affect the redox state of the sedimentary water and the degree of water retention, thereby affecting the enrichment of organic matter. It was further proven that the enrichment of organic matter was controlled by various paleoenvironmental factors, and the optimal conditions for the generation and preservation of organic matter in shale were determined. This study reveals the mechanism of organic matter enrichment in shale and provides a theoretical basis for the exploration of transitional shale gas.

6. Conclusions

The brittle mineral content in the shales of the Taiyuan and Shanxi Formations was relatively low (<40%), and the clay mineral content was high (>50%). The average TOC content was 3.68%. The organic matter was mainly mixed and sapropelic. The felsic (granite) source area was the main source area of shale in the Taiyuan and Shanxi Formations of Well KP1, indicating that the samples were deposited in a continental island arc area.
According to the paleoclimate index and paleoredox index, the source rocks of the Taiyuan Formation in Well KP1 were mainly formed under warm and humid paleoclimate conditions and in an anoxic reduction–strong water retention environment. The source rocks of the Shanxi Formation were mainly formed under complex and changeable paleoclimate conditions and in an anoxic reduction–medium-to-strong water retention environment. The factors influencing organic matter enrichment in the shales of the Taiyuan and Shanxi Formations of Well KP1 in the northern North China Basin were determined using the grey correlation method and a robust regression analysis. The analysis showed that the enrichment of organic matter in Taiyuan Formation shale is controlled by paleosalinity and paleoproductivity. During the sedimentary stage of the Shanxi Formation, paleosalinity was the main factor controlling the enrichment of organic matter. The remaining ancient environmental conditions had little effect.
During the sedimentary stage of the Late Carboniferous–Early Permian in the northern North China Basin, paleosalinity conditions controlled the input of terrigenous debris, changes in deposition rate, redox of sedimentary water, and the degree of water retention in the study area. This provided better preservation conditions for organic matter enrichment and formed organic-rich shale in the marine–continental transitional facies.

Author Contributions

Conceptualization, H.Z. and Y.W.; methodology, H.Z.; software, H.Z., Y.W. and H.C.; validation, H.Z., Y.W. and H.C.; formal analysis, H.Z. and Y.W.; investigation, H.Z.; resources, Y.W.; data curation, Y.W.; writing—original draft preparation, H.Z.; writing—review and editing, H.Z., Y.W., H.C., Y.Z. (Yanming Zhu), J.Y., Y.Z. (Yunsheng Zhang), K.D. and Z.W.; visualization, H.Z.; supervision, Y.W.; project administration, H.C.; funding acquisition, Y.W. All authors have read and agreed to the published version of the manuscript.

Funding

This research was funded by the National Natural Science Foundation of China (42172156), the Fundamental Research Funds for the Central Universities (2022YCPY0201), and the National Key R&D Program of China (No. 2020YFA 0711800).

Institutional Review Board Statement

Not applicable.

Informed Consent Statement

Not applicable.

Data Availability Statement

Data are contained within this article.

Acknowledgments

We would like to thank the Key Laboratory of Coalbed Methane Resources and Reservoir Formation Process for all the support provided in this research.

Conflicts of Interest

The authors declare that they have no known competing financial interests or personal relationships that could have appeared to influence the work reported in this paper.

References

  1. Feng, Z.J.; Dong, D.Z.; Tian, J.Q.; Qiu, Z.; Wu, W.; Zhang, C. Geochemical characteristics of longmaxi formation shale gas in the weiyuan area, Sichuan Basin, China. J. Petrol. Sci. Eng. 2018, 167, 538–548. [Google Scholar] [CrossRef]
  2. Wang, Z.; Zhao, J.Z.; Chen, Y.H. Analysis of palaeo–sedimentary environment and characteristics of Shanxi formation in Shenfu area on the eastern margin of Ordos basin. J. Xi’an Shiyou Univ. Nat. Sci. Ed. 2019, 34, 24–30. (In Chinese) [Google Scholar]
  3. Cao, Y.T.; Liu, L.; Chen, D.L.; Wang, C.; Yang, W.Q.; Kang, L.; Zhu, X.H. Partial melting during exhumation of Paleozoic retrograde eclogite in North Qaidam, western China. J. Asian Earth Sci. 2017, 148, 223–240. [Google Scholar] [CrossRef]
  4. Li, P.; Zhang, J.C.; Tang, X.; Huo, Z.P.; Li, Z.; Luo, K.Y.; Li, Z.M. Assessment of shale gas potential of the lower Permian transitional Shanxi-Taiyuan shales in the southern North China Basin. Aust. J. Earth Sci. 2021, 68, 262–284. [Google Scholar] [CrossRef]
  5. Guo, W.; Gao, J.L.; Li, H.; Kang, L.X.; Zhang, J.W.; Liu, G.H.; Liu, Y.Y. The geological and production characteristics of marine-continental transitional shale gas in China: Taking the example of shale gas from Shanxi Formation in Ordos Basin and Longtan Formation in Sichuan Basin. Miner. Explor. 2023, 14, 448–458. [Google Scholar]
  6. Zheng, D.Z.; Miska, S.; Ozbayoglu, E.; Zhang, J.G. Combined Experimental and Well Log Study of Anisotropic Strength of Shale. In Proceedings of the SPE Annual Technical Conference and Exhibition, San Antonio, TX, USA, 16–18 October 2023; p. D031S046R003. [Google Scholar]
  7. Liu, S.X.; Wu, C.F.; Li, T.; Wang, H.C. Multiple geochemical proxies controlling the organic matter accumulation of the marine-continental transitional shale: A case study of the Upper Permian Longtan Formation, western Guizhou, China. J. Nat. Gas. Sci. Eng. 2018, 56, 152–165. [Google Scholar] [CrossRef]
  8. Luo, W.; Hou, M.C.; Liu, X.C.; Huang, S.G.; Chao, H.; Zhang, R.; Deng, X. Geological and geochemical characteristics of marine-continental transitional shale from the Upper Permian Longtan formation, Northwestern Guizhou, China. Mar. Petrol. Geol. 2018, 89, 58–67. [Google Scholar] [CrossRef]
  9. Xiao, H.; Wang, T.G.; Li, M.J.; Lai, H.F.; Liu, J.G.; Mao, F.J.; Tang, Y.J. Geochemical characteristics of Cretaceous Yogou Formation source rocks and oil-source correlation within a sequence stratigraphic framework in the Termit Basin, Niger. J. Petrol. Sci. Eng. 2019, 172, 360–372. [Google Scholar] [CrossRef]
  10. Zhang, S.H.; Liu, C.Y.; Liang, H.; Wang, J.Q.; Bai, J.K.; Yang, M.H.; Liu, G.H.; Huang, H.X.; Guan, Y.Z. Paleoenvironmental conditions, organic matter accumulation, and unconventional hydrocarbon potential for the Permian Lucaogou Formation organicrich rocks in Santanghu Basin, NW China. Int. J. Coal Geol. 2018, 185, 44–60. [Google Scholar] [CrossRef]
  11. Lai, H.F.; Li, M.J.; Liu, J.G.; Mao, F.J.; Xiao, H.; He, W.X.; Yang, L. Organic geochemical characteristics and depositional models of Upper Cretaceous marine source rocks in the Termit Basin, Niger. Palaeogeogr. Palaeoclimatol. Palaeoecol. 2018, 495, 292–308. [Google Scholar] [CrossRef]
  12. Liang, Q.S.; Zhang, X.; Tian, J.C.; Sun, X.; Chang, H.L. Geological and geochemical characteristics of marine-continental transitional shale from the lower permian Taiyuan formation, taikang uplift, southern North China basin. Mar. Petrol. Geol. 2018, 98, 229–242. [Google Scholar] [CrossRef]
  13. Chen, Y.H.; Wang, Y.B.; Guo, M.Q.; Wu, H.Y.; Li, J.; Wu, W.T.; Zhao, J.Z. Differential enrichment mechanism of organic matters in the marine-continental transitional shale in northeastern Ordos Basin, China: Control of sedimentary environments. J. Nat. Gas. Sci. Eng. 2020, 83, 103625. [Google Scholar] [CrossRef]
  14. Peng, Y.X.; Guo, S.B. Lithofacies analysis and paleosedimentary evolution of Taiyuan Formation in Southern North China Basin. J. Petrol. Sci. Eng. 2023, 220, 111127. [Google Scholar] [CrossRef]
  15. Liu, P.; Zhang, T.Q.; Xu, C.; Wang, X.F.; Liu, C.J.; Guo, R.L.; Lin, H.F.; Yan, M.; Qin, L.; Li, Y. Organic matter inputs and depositional palaeoenvironment recorded by biomarkers of marine-terrestrial transitional shale in the Southern North China Basin. Geol. J. 2022, 57, 1617–1627. [Google Scholar] [CrossRef]
  16. Nie, H.K.; Chen, Q.; Li, P.; Dang, W.; Zhang, J.C. Shale gas potential of Ordovician marine Pingliang shale and Carboniferous–Permian transitional Taiyuan-Shanxi shales in the Ordos Basin, China. Aust. J. Earth Sci. 2023, 70, 411–422. [Google Scholar] [CrossRef]
  17. Lash, G.G.; Blood, D.R. Organic matter accumulation, redox, and diagenetic history of the Marcellus Formation, southwestern Pennsylvania, Appalachian basin. Mar. Petrol. Geol. 2014, 57, 244–263. [Google Scholar] [CrossRef]
  18. Liu, W.Q.; Yao, J.X.; Tong, J.N.; Qiao, Y.; Chen, Y. Organic matter accumulation on the Dalong Formation (Upper Permian) in western Hubei, South China: Constraints from multiple geochemical proxies and pyrite morphology. Palaeogeogr. Palaeocl. 2019, 514, 677–689. [Google Scholar] [CrossRef]
  19. Shang, F.H.; Zhu, Y.M.; Hu, Q.H.; Wang, Y.; Li, W.; Liu, R.Y.; Gao, H.T. Factors controlling organic-matter accumulation in the Upper Ordovician-Lower Silurian organic-rich shale on the northeast margin of the Upper Yangtze platform: Evidence from petrographic and geochemical proxies. Mar. Petrol. Geol. 2020, 121, 104597. [Google Scholar] [CrossRef]
  20. Li, Y.; Wang, Z.S.; Gan, Q.; Niu, X.L.; Xu, W.K. Paleoenvironmental conditions and organic matter accumulation in Upper Paleozoic organic-rich rocks in the east margin of the Ordos Basin, China. Fuel 2019, 252, 172–187. [Google Scholar] [CrossRef]
  21. Qi, Y.; Ju, Y.W.; Tan, J.Q.; Bowen, L.; Cai, C.F.; Yu, K.; Zhu, H.J.; Huang, C.; Zhang, W.L. Organic matter provenance and depositional environment of marine-to-continental mudstones and coals in eastern Ordos Basin, China—Evidence from molecular geochemistry and petrology. Int. J. Coal Geol. 2020, 217, 103345. [Google Scholar] [CrossRef]
  22. Algeo, T.J.; Liu, J.S. A re-assessment of elemental proxies for paleoredox analysis. Chem. Geol. 2020, 540, 119549. [Google Scholar] [CrossRef]
  23. Wu, B. The sedimentary geochemical characteristics and geological significance of the Wufeng–Longmaxi Formation accumulation of organic matter black shale on the Southeastern Sichuan Basin, China. Geofluids 2022, 22, 1900158. [Google Scholar] [CrossRef]
  24. Bai, J.K.; Zhang, S.H.; Liu, C.Y.; Jia, L.B.; Luo, K.Y.; Jiang, T.; Peng, H. Mineralogy and geochemistry of the Middle Permian Pingdiquan Formation black shales on the eastern margin of the Junggar Basin, north–west China: Implications for palaeoenvironmental and organic matter accumulation analyses. Geo. J. 2022, 57, 1989–2006. [Google Scholar] [CrossRef]
  25. Zou, C.N.; Zhu, R.K.; Chen, Z.Q.; Ogg, J.G.; Wu, S.T.; Dong, D.Z.; Qiu, Z.; Wang, Y.M.; Wang, L.; Lin, S.H.; et al. Organic-matter-rich shales of China. Earth Sci. Rev. 2019, 189, 51–78. [Google Scholar] [CrossRef]
  26. Jia, S.X.; Zhang, C.K.; Zhao, J.R.; Fang, S.M.; Liu, Z.; Zhao, J.M. Crustal Structure of the Rift-Depression Basin and Yanshan Uplift in the Northeast Part of North China. Chin. J. Geophys. 2009, 52, 51–63. [Google Scholar]
  27. Chen, Y.H.; Zhu, Z.W.; Zhang, L. Control actions of sedimentary environments and sedimentation rates on lacustrine oil shale distribution, an example of the oil shale in the Upper Triassic Yanchang Formation, southeastern Ordos Basin (NW China). Mar. Petrol. Geol. 2019, 102, 508–520. [Google Scholar] [CrossRef]
  28. Li, Y.; Yang, J.H.; Pan, Z.J.; Meng, S.Z.; Wang, K.; Niu, X.L. Unconventional Natural Gas Accumulations in Stacked Deposits: A Discussion of Upper Paleozoic Coal-Bearing Strata in the East Margin of the Ordos Basin, China. Acta Geol. Sin.-Engl. 2019, 93, 111–129. [Google Scholar] [CrossRef]
  29. Ding, J.H.; Zhang, J.C.; Huo, Z.P.; Shen, B.J.; Shi, G.; Yang, Z.H.; Li, X.Q.; Li, C.X. Controlling factors and formation models of organic matter accumulation for the Upper Permian Dalong Formation black shale in the Lower Yangtze region, South China: Constraints from geochemical evidence. ACS Omega 2021, 6, 3681–3692. [Google Scholar] [CrossRef]
  30. Yan, M.; Feng, J.L. Depositional environment variations and organic matter accumulation of the first member of the Qingshankou formation in the southern Songliao Basin, China. Front. Earth Sci. 2023, 11, 1249787. [Google Scholar]
  31. Wei, W.; Algeo, T.J. Elemental proxies for paleosalinity analysis of ancient shales and mudrocks. Geochim. Cosmochim. Acta 2020, 287, 341–366. [Google Scholar] [CrossRef]
  32. Zhang, L.F.; Dong, D.Z.; Qiu, Z.; Wu, C.J.; Zhang, Q.; Wang, Y.M.; Liu, D.X.; Deng, Z.; Zhou, S.W.; Pan, S.Q. Sedimentology and geochemistry of Carboniferous-Permian marine-continental transitional shales in the eastern Ordos Basin, North China. Palaeogeogr. Palaeocl. 2021, 571, 110389. [Google Scholar] [CrossRef]
  33. Yu, K.; Ju, Y.W.; Qian, J.; Qu, Z.H.; Shao, C.J.; Yu, K.L.; Shi, Y. Burial and thermal evolution of coal-bearing strata and its mechanisms in the southern North China Basin since the late Paleozoic. Int. J. Coal Geol. 2018, 198, 100–115. [Google Scholar] [CrossRef]
  34. Qi, J.F.; Yang, Q. Cenozoic structural deformation and dynamic processes of the Bohai Bay basin province, China. Mar. Petrol. Geol. 2009, 27, 757–771. [Google Scholar] [CrossRef]
  35. GB/T21114-2019; Chemical Analysis of Refractory Products by XRF-Fused Cast Bead Method. China Standard Press: Beijing, China, 2019.
  36. SY/T5163-2018; Analysis Method for Clay Minerals and Ordinary Non-Clay Minerals in Sedimentary Rocks by the X-ray Diffraction. China Standard Press: Beijing, China, 2018.
  37. GB/T 18602-2012; Rock pyrolysis analysis. China Standard Press: Beijing, China, 2012.
  38. SY/T5125-2014; Method of Identification Microscopically the Macerals of Kerogen and Indivision the Kerogen Type by Transmitted-Light and Fluorescence. China Standard Press: Beijing, China, 2014.
  39. Taylor, S.R.; McLennan, S.M. The geochemical evolution of the continental crust. Rev. Geophys. 1995, 33, 241–265. [Google Scholar] [CrossRef]
  40. Francois, R.; Honjo, S.; Manganini, S.J.; Ravizza, G.E. Biogenic barium fluxes to the deep sea: Implications for paleoproductivity reconstruction. Global Biogeochem. Cycles 1995, 9, 289–303. [Google Scholar] [CrossRef]
  41. Liu, J.; Yao, Y.; Liu, D.; Pan, Z.; Cai, Y. Comparison of three key marine shale reservoirs in the southeastern margin of the Sichuan Basin, SW China. Minerals 2017, 7, 179. [Google Scholar] [CrossRef]
  42. He, J.H.; Ding, W.L.; Jiang, Z.X.; Li, A.; Wang, R.Y.; Sun, Y.X. Logging identification and characteristic analysis of the lacustrine organic-rich shale lithofacies: A case study from the Es3L shale in the Jiyang Depression, Bohai Bay Basin, eastern China. J. Petrol. Sci. Eng. 2016, 145, 238–255. [Google Scholar] [CrossRef]
  43. Khaled, A.; Li, R.X.; Xi, S.L.; Zhao, B.S.; Wu, X.L.; Yu, Q.; Zhang, Y.N.; Li, D.L. Paleoenvironmental conditions and organic matter enrichment of the Late Paleoproterozoic Cuizhuang Formation dark shale in the Yuncheng Basin, North China. J. Petrol. Sci. Eng. 2022, 208, 109627. [Google Scholar] [CrossRef]
  44. Men, X.; Mou, C.L.; Ge, X.Y. Changes in palaeoclimate and palaeoenvironment in the Upper Yangtze area (South China) during the Ordovician–Silurian transition. Sci. Rep. 2022, 12, 13186. [Google Scholar] [CrossRef]
  45. Keskin, S. Geochemistry of Çamardı Formation sediments. central Anatolia (Turkey): Implication of source area weathering. provenance. and tectonic setting. Geosci. J. 2011, 15, 185–195. [Google Scholar] [CrossRef]
  46. McLennan, S.M. Relationships between the trace element composition of sedimentary rocks and upper continental crust. Geochem. Geophys. Geosyst. 2001, 2, 2000GC000109. [Google Scholar] [CrossRef]
  47. Taylor, S.R.; Mclennan, S.M. The Continental Crust: Its Composition and Evolution. An Examination of the Geochemical Record Preserved in Sedimentary Rocks; Blackwell Scientific: Oxford, UK, 1985. [Google Scholar]
  48. Roser, B.P.; Korsch, R.J. Provenance signatures of sandstoneemudstone suites determined using discriminant function analysis of major element data. Chem. Geol. 1988, 67, 119–139. [Google Scholar] [CrossRef]
  49. Floyd, P.A.; Leveridge, B.E. Tectonic environments of the Devonian Gramscatho basin, south Cornwall: Framework mode and geochemical evidence from turbidite sandstones. Jour Geol. Soc. London 1987, 144, 531–542. [Google Scholar] [CrossRef]
  50. Bhatia, M.R.; Crook, K.A.W. Trace element characteristics of graywackes and tectonic setting discrimination of sedimentary basins. Contrib. Mineral. Petrol. 1986, 92, 181–193. [Google Scholar] [CrossRef]
  51. Wang, J.; Guo, S. Comparison of geochemical characteristics of marine facies, marine-continental transitional facies and continental facies shale in typical areas of China and their control over organic-rich shale. Energy Source Part A 2020, 1–13. [Google Scholar] [CrossRef]
  52. Algeo, T.J.; Tribovillard, N. Environmental analysis of paleoceanographic systems based on molybdenum-uranium covariation. Chem. Geol. 2009, 268, 211–225. [Google Scholar] [CrossRef]
  53. Yin, K.; Xu, J.; Li, X. A new grey comprehensive relational model based on weighted mean distance and induced intensity and its application. Grey Syst. 2019, 9, 374–384. [Google Scholar] [CrossRef]
  54. Si, S.L.; You, X.Y.; Liu, H.C.; Ping, Z. DEMATEL Technique: A Systematic Review of the State-of-the-Art Literature on Methodologies and Applications. Math. Probl. Eng. 2018, 2018, 3696457. [Google Scholar] [CrossRef]
  55. González, J.; Peña, D.; Romera, R. A robust partial least squares regression method with applications. J. Chemometr. 2009, 23, 78–90. [Google Scholar] [CrossRef]
  56. Fan, Y.L.; Xiang, Y.Y.; Guo, Z.J. Adaptive efficient and double-robust regression based on generalized empirical likelihood. Commun. Stat-Simul. C 2021, 52, 3079–3094. [Google Scholar]
Figure 1. Structural maps (a) and borehole lithology histograms (b).
Energies 17 01780 g001
Figure 2. Core lithology maps of the Taiyuan Formation and Shanxi Formation of Well KP1 in the study area. (a) The dark-grey fine sandstone of the Shanxi Formation is interbedded with a thin layer of dark-grey sandy mudstone. (b) Grey-black sandy mudstone of the Taiyuan Formation. (c) The interbedded deep grey siltstone, fine sandstone, and grey-black sandy mudstone of the Taiyuan Formation.
Energies 17 01780 g002
Figure 3. Ternary diagrams of clay mineral content and mineral content in mud shale of Well KP1. (a) Ternary diagram of clay mineral content. (b) Ternary diagram of mineral content.
Energies 17 01780 g003
Figure 4. The frequency distributions of organic matter abundance of source rocks in Well KP1. (a) Hydrocarbon potential (S1 + S2) diagram. (b) TOC content (%) diagram.
Energies 17 01780 g004
Figure 5. Plot of the hydrogen index (S1 + S2) versus the TOC, outlining the source potential of different lithotypes and the relationship between the TOC and S1 + S2 from the KP1 shale.
Energies 17 01780 g005
Figure 6. Triangle diagram of kerogen maceral composition of source rock in Well KP1.
Energies 17 01780 g006
Figure 7. Th/Sc–Zr/Sc bivariate diagram of shales and carbonaceous marls to show their sediment recycling.
Energies 17 01780 g007
Figure 8. Provenance identification plots for the samples of KP1 well: (a) La/Th vs. Hf and (b) La/Yb vs. ∑REE.
Energies 17 01780 g008
Figure 9. La–Th–Sc, Th–Co–Zr/10, and Th–Sc–Zr/10 plots of the shales from the Taiyuan and Shanxi Formations in the Well KP1 for tectonic discrimination: (A) oceanic island arc; (B) continental island arc; (C) active continental margin; and (D) passive margin.
Energies 17 01780 g009
Figure 10. Relationship diagram between the proxies of paleoclimatic conditions of shale samples in northern North China Basin.
Energies 17 01780 g010
Figure 11. (a) Relationship between Mo and TOC in the shale of the Taiyuan and Shanxi Formations in the northern part of North China Basin. (b) U-EF and Mo-EF covariation diagram of shale in Taiyuan and Shanxi Formations in northern North China Basin.
Energies 17 01780 g011
Figure 12. The correlation coefficient heat maps of paleoenvironmental factors of mud shale samples from Well KP1 in the northern part of North China Basin. (a) Shanxi Formation correlation coefficient heat map. (b) Taiyuan Formation correlation coefficient heat map.
Energies 17 01780 g012
Figure 13. Curves of fitted and true values of regression analysis of mud shale samples from KP1 well.
Energies 17 01780 g013
Figure 14. Organic matter enrichment pattern maps of Taiyuan and Shanxi Formations marine–continental transitional shale in northern North China Basin. (b) Shanxi Formation sedimentary stage. (a) Taiyuan Formation sedimentary stage.
Energies 17 01780 g014
Table 1. Evaluation criteria for organic matter abundance of continental source rocks.
IndexNon-Source RocksPoor Source RocksMedium Source RocksGood Hydrocarbon Source Rocks
TOC (%)<0.40.4–0.6>0.6–1.0>1.0–2.0
S1 + S2(mg/g)-<22–6>6–20
Table 2. Organic matter content (TOC %) and whole-rock major-element data of Taiyuan and Shanxi Formations shale in KP1 well.
StratumSample No.Depth (m)TOC (%)Na (a) (wt%)Mg (b) (wt%)Al (c) (wt%)Si (d) (wt%)Mn (e) (wt%)K (f) (wt%)Ca (g) (wt%)Ti (h) (wt%)P (i) (wt%)Fe (j) (wt%)
Shanxi
Formation
KP1-11703.562.150.561.3625.9259.120.114.020.401.250.097.17
KP1-21706.381.220.501.8826.7059.360.043.800.431.170.155.97
KP1-31708.52.520.522.5122.0757.840.204.101.181.150.1310.31
KP1-41711.734.890.646.0718.3150.640.234.349.910.840.148.88
KP1-51716.060.870.621.4721.6066.570.024.270.230.810.094.32
KP1-61717.971.470.551.6922.4165.040.024.870.210.830.064.31
KP1-71719.680.20.933.7524.8053.560.065.744.761.000.135.26
KP1-81720.373.430.484.2118.3760.530.142.835.631.110.166.56
KP1-91723.720.30.361.6017.6845.810.552.870.930.890.1529.17
KP1-101725.770.860.431.7022.8660.130.263.940.571.320.138.66
KP1-111728.371.720.404.4619.0951.600.293.456.011.170.2213.32
KP1-121730.262.520.524.9920.6155.570.133.967.581.260.135.24
KP1-131732.411.030.541.7222.8858.200.194.401.051.120.159.75
KP1-141768.152.270.441.7124.3255.210.374.170.861.140.1811.59
KP1-151772.012.310.421.6025.9250.680.464.060.881.210.2014.57
KP1-161774.973.950.570.7329.9259.730.022.570.141.310.054.97
KP1-171785.921.040.522.7021.8157.480.155.142.530.950.308.42
KP1-181788.441.240.493.5219.7755.230.365.152.960.880.1511.48
KP1-191790.8015.390.671.3820.9844.520.062.921.571.000.0626.82
Taiyuan
Formation
KP1-201794.502.360.556.9117.0852.810.183.7510.580.840.187.12
KP1-211796.4311.050.632.7819.0856.220.194.712.580.770.1212.92
KP1-221798.35110.791.8920.5052.940.114.521.470.880.0816.83
KP1-231846.152.820.422.2920.6753.040.195.130.590.980.1716.51
KP1-241861.471.710.442.3119.6861.690.087.130.291.000.067.32
KP1-251885.7912.150.471.4122.6464.920.024.670.571.310.103.90
(a) Na: Na2O; (b) Mg: MgO; (c) Al: Al2O3; (d) Si: SiO2; (e) Mn: MnO; (f) K: K2O; (g) Ca: CaO; (h) Ti: TiO2; (i) P: P2O5; (j) Fe: TFe2O3.
Table 3. The whole-rock trace-element analysis data of Taiyuan and Shanxi Formations shale in KP1 well.
StratumSample No.Depth (m)Sc(10−6)V(10−6)Co(10−6)Ni(10−6)Cu(10−6)Zn(10−6)Rb(10−6)Sr(10−6)Y(10−6)Zr(10−6)Nb(10−6)Mo(10−6)Cs(10−6)Ba(10−6)
Shanxi
Formation
KP1-11703.5611.61344772.349.388.673.414230.328815.86.178.36668
KP1-21706.3811.314511.723.76610968.612824.1242150.526.14433
KP1-31708.5020.515522.53665.713273.813632.622015.21.087.42485
KP1-41711.731816613.32126.210387.743428.615512.31.046.35645
KP1-51716.0612.410210.519.95582.880.4981916114.40.76.69505
KP1-61717.9713.513616.828.258.968.492.211826.115115.61.5810.3507
KP1-71719.6818.148.26.669.0614.911481.625743.943018.42.025.57880
KP1-81720.3718.411311.518.745.314174.41933724613.52.725.47416
KP1-91723.7225.816332.630.952.987.860.313834.415012.50.567.38383
KP1-101725.7718.317120.83775.610764.913632.921516.70.388.46366
KP1-111728.3724.914420.735.166.512183.417537.118514.40.76.69414
KP1-121730.2613.411831.153.864.513981.816526.517217.21.737.07364
KP1-131732.4116.317523.63566.491.875.214630.818914.90.5711.2386
KP1-141768.1517.613922.43357.81089723030.717314.81.257.83394
KP1-151772.017.2616421.82764.19647.519222.220216.31.146.75313
KP1-161774.979.891592543.218.92244619316.318313.81.625.38363
KP1-171785.92221642443.445.998.511828230.217414.40.9610514
KP1-181788.4421.315720.228.941.45493.326032145141.268.97511
KP1-191790.8012.993.416.941.234.277.446.324720.31349.433.184.57276
Taiyuan
Formation
KP1-201794.5015.611618.727.939.515377.530423.516211.40.445.79514
KP1-211796.4316.914418.758.546.412881.929432.413110.77.297.17602
KP1-221798.3515.114818.657.243.192.871.326026.313110.32.275.15474
KP1-231846.1521.416218.529.450.212093.822338.720215.20.7911.4535
KP1-241861.4716.613219.62548.411411416832.423917.60.6812.8568
KP1-251885.79151148.2522.358.524.675.112830.131216.30.7810.6314
Table 4. Paleoclimatic conditions analysis by trace-element ratio.
RatiosIndexKP1 Well FormationWet and WarmDry and Hot
C2tP1s
PaleoclimaticSr/Cu1.78 (a)–17.25 (b)
(5.13) (c)
2.18 (a)–7.70 (b)
(2.18) (c)
1–10>10
Rb/Sr0.19 (a)–0.82 (b)
(0.44) (c)
0.25 (a)–0.68 (b)
(0.42) (c)
-
(a) Maximum; (b) minimum; (c) average.
Table 5. Data table of organic matter content and paleoenvironmental factors of mud shale samples in Well KP1.
StratumSample No.TOC (%)Sr/CuTi (%)BabioPaleo-Mo-EFU-EF
Shanxi
Formation
KP1-12.15%2.881.25%657.890.321.280.25
KP1-21.22%1.941.17%422.590.380.100.25
KP1-32.52%2.071.15%476.390.300.260.40
KP1-44.89%16.560.84%637.860.520.300.70
KP1-50.87%1.780.81%496.570.220.170.27
KP1-61.47%2.000.83%498.260.270.380.29
KP1-70.20%17.251.00%870.330.480.440.23
KP1-83.43%4.261.11%408.840.360.790.39
KP1-90.30%2.610.89%376.110.500.170.38
KP1-100.86%1.801.32%357.080.340.090.27
KP1-111.72%2.631.17%406.560.440.200.39
KP1-122.52%2.561.26%355.960.240.450.35
KP1-131.03%2.201.12%377.080.320.130.30
KP1-142.27%3.981.14%384.510.280.280.36
KP1-152.31%3.001.21%302.890.470.240.21
KP1-163.95%10.211.31%351.330.390.290.38
KP1-171.04%6.140.95%505.490.370.240.40
KP1-181.24%6.280.88%503.290.460.340.40
KP1-1915.39%7.221.00%267.820.480.810.33
Taiyuan
Formation
KP1-202.36%7.700.84%507.340.480.140.43
KP1-2111.05%6.340.77%594.560.432.050.96
KP1-2211%6.030.88%466.010.480.590.92
KP1-232.82%4.440.98%526.940.480.200.46
KP1-241.71%3.471.00%560.330.240.190.46
KP1-2512.15%2.191.31%305.170.370.180.61
Table 6. Robust regression solving fitted parameters for KP1 well mud shale.
Fitting ParametersShanxi FormationCorrelation Coefficients R2Taiyuan FormationCorrelation Coefficients R2
Parameter ValueSignificance
p-Value
Whether
Significant
Parameter ValueSignificance
p-Value
Whether
Significant
Sr/Cu00.993No0.997−0.002--0.987
Ti%1.5630.0001Yes2.95--
Babio00.095No0--
Paleo-0.0010.603No−0.001--
(La/Yb)N00.006Yes0.003--
Sr/Ba0.010.0001Yes0.007--
Constant value−0.0170.025
Disclaimer/Publisher’s Note: The statements, opinions and data contained in all publications are solely those of the individual author(s) and contributor(s) and not of MDPI and/or the editor(s). MDPI and/or the editor(s) disclaim responsibility for any injury to people or property resulting from any ideas, methods, instructions or products referred to in the content.

