Article

Influence of the Skin and Proximity Effects on the Thermal Field in Flat and Trefoil Three-Phase Systems with Round Conductors

by
Paweł Jabłoński
1,*,
Marek Zaręba
2,
Tomasz Szczegielniak
1 and
Jerzy Gołębiowski
2
1
Department of Automation, Electrical Engineering and Optoelectronics, Faculty of Electrical Engineering, Czestochowa University of Technology, Armii Krajowej 17, 42-200 Czestochowa, Poland
2
Faculty of Electrical Engineering, Technical University of Bialystok, Wiejska 45D, 15-351 Białystok, Poland
*
Author to whom correspondence should be addressed.
Energies 2024, 17(7), 1713; https://doi.org/10.3390/en17071713
Submission received: 12 March 2024 / Revised: 30 March 2024 / Accepted: 1 April 2024 / Published: 3 April 2024
(This article belongs to the Special Issue Energy, Electrical and Power Engineering 2024)

Abstract

:
The passage of current generates heat and increases the temperature of electrical components, which affects the environment, support insulators and contacts. Knowledge of the temperature allows for the determination of important operational parameters. Time-varying currents result in a nonuniform current density distribution due to the skin and proximity effects. As a result, temperature and energy losses are increased compared to the uniform DC current density case. In this paper, these effects are considered for three-phase systems with round conductors in flat and trefoil arrangements. In the first step, the analytical expressions for current distributions are determined and used to construct the heat source density. Then, a suitable Green’s function, which allows for obtaining temperature distribution in analytical form, is used to evaluate temperature at any point throughout the conductors. The temperature differences throughout individual wires are usually negligible, whereas noticeable differences can be observed between the wires. The impact of various parameters is examined, and an approximate closed formula is derived to assess the influence of the skin and proximity effects. When the skin depth is not smaller than the wire radius, the skin effect enlarges the temperature increase by around 2% compared to the DC case. As for the proximity effect, the additional increase can be neglected if the distance is above around 10 wire radii, but for closely spaced wires, it can reach up to around 17%, depending on the arrangement and the distance between the wires. Such an additional increase may result in exceeding the permissible temperatures, which damages particular components of the system; therefore, it is important to take it into account at the design stage.

1. Introduction

Various configurations of three-phase systems are commonly used in electrical engineering, especially in power systems. One of the fundamental quantities related to individual phase conductors is their temperature. Too high a temperature threatens the environment, the strength and quality of contact connections and support insulators. It also affects the oxidation and corrosion of cables. The influence of temperature on the mechanical strength of cables is also important, as it usually decreases after exceeding a certain temperature value. For the above-mentioned reasons, temperature also has a significant impact on the permissible current in a wire (ampacity).
The main factor generating heat is the flow of current in individual conductors. Due to electromagnetic induction, the current density distribution in particular wires is not uniform, but is affected by the skin effect and, to a lesser extent, by the proximity effect [1,2]. Both effects originate from eddy currents induced in conductors due to time-varying magnetic fields. The skin effect arises from current in the conductor under consideration and results in the displacement of current density towards the outer surface of the wire. In turn, the proximity phenomenon involves the induction of additional eddy currents due to currents in nearby wires. Its impact on current density distribution is much more complex than that of the skin effect and depends on the location of the neighboring wires and their currents. In total, this causes an uneven distribution of current density in the cross-sections of individual phases. For the above-mentioned reasons, the analysis of the skin and proximity effects in three-phase systems has been the subject of discussion in numerous works. For example, trefoil cable arrangements were studied in [3]. A two-dimensional finite element method was used to assess the accuracy of the IEC standard (a calculation of the loss factor in cables with non-magnetic armor). The results were improved using the filament method. IEC 6287 [4] has been shown to lead to temperature overestimation, especially in large cable sizes (up to 8%).
In Ref. [5], a three-phase system of insulated wires was tested. The heat conduction equation was solved using the finite element method using the COMSOL Multiphysics program. It has been shown that the configuration of the three-phase system and the type of wire insulation have a significant impact on the system temperature. In the work [6], the thermal field in a three-phase GIL (gas-insulated line) was analyzed. The finite element method was also used. It has been shown that skin and proximity phenomena increase the equivalent resistance of wires and their power losses by up to one-third compared to DC current. Finite elements can be used in modeling coupled electromagnetic and thermal problems; for example, irregular-shaped busbars were analyzed in [7].
In addition to finite elements, thermal-electric analogies are also used [8]. For example, a thermal network model of a busbar system with lumped parameters was developed in [9]. It enabled the estimation of power and temperature losses in the tested system. Skin and proximity effects were also taken into account when determining the AC resistance. The obtained results were verified using the finite element method and laboratory measurements. In turn, [10] presents a method for calculating the temperature in overhead transmission lines, also based on the equivalent heat network. On this basis, a multi-parameter thermal protection strategy for the system has also been proposed. Experimental verification showed that the accuracy of the ETC (equivalent thermal circuit) method is higher than the IEEE and CIGRE standards. The thermal-electric analogy method was also widely used in [11,12,13,14]. The skin and proximity phenomena can also be approximately taken into account using appropriate correction factors [15,16].
The examples of calculating the thermal field in power systems presented above concern the use of numerical and semi-empirical methods. Analytical methods are used much less frequently. In Ref. [17], the method of separation of variables was used to calculate the temperature and stress in a cylindrical conductor carrying alternating current, with a weak skin effect taken into account. In Ref. [18], the application of the method of separation of variables was presented for various problems but not the considered one in this paper. In Ref. [19], an analytical solution for a thin rectangular busbar was presented (1D solution). Uniform current distribution was assumed, although it was possible to take into account the effect of temperature on the resistivity. In Ref. [20], the temperature of a single round wire was considered, with the skin effect taken into account. In Ref. [21], the influence of wind speed on the thermal characteristics of ACCR (aluminum conductor composite reinforced) lines was investigated. The individual elements of the system were modeled as porous bodies. The problem was solved using the state superposition method and the method of separation of variables. The obtained results were verified using the finite element method. Another method was used in [22], where the thermal field of the ACCC (aluminum conductor composite core) line was studied using the modified Green’s method, adapted to the layered structure of the system. The heat source model took into account the skin effect. Also, in [23], the Green’s function method was used to analyze the influence of current frequency on the thermal field in an insulated busbar, taking into account the skin effect.
The above-cited and other works show that the impact of the proximity effect on the temperature field has not been addressed analytically. The analytical results presented in the literature focus on power losses or integral parameters like resistance and impedance (e.g., [24]). Some works concerning analytical results for temperature take into account the skin effect (e.g., [17,20]) but not the proximity effect. Therefore, it is desirable to analyze the impact of this effect via analytical methods. Although analytical solutions are usually obtained for idealized configurations, they have a number of advantages over numerical ones. These include the final result in the form of a formula, which facilitates the discussion on the impact of individual parameters and physical interpretation of the phenomenon. They enable verification of numerical calculations using examples of asymptotic (simplified) problems. Moreover, they reveal directions for further optimization and facilitate the determination of scaling laws and quick estimation of the field at selected points in space.
The goal of this paper is to investigate analytically the skin and proximity effects on the thermal field in typical three-phase systems with round conductors. A suitably constructed Green’s function is used to determine a closed formula for temperature at any point throughout the conductor. Compared to other analytical methods, the main advantage of the proposed one is that there is no need to determine any particular solution to the Poisson equation describing the temperature distribution. Moreover, Green’s function, by definition, satisfies the boundary conditions and is independent of the source term. Therefore, it can be easily used for various current densities, i.e., for various wire arrangements. A potential disadvantage is that various shapes of wire cross-sections would require the construction of other Green’s functions, which is often quite a complicated task.
The structure of the paper is as follows. In Section 2, the physical model and assumptions, as well as the mathematical model, are presented. In Section 3, the temperatures of individual conductors in flat and trefoil three-phase configurations are determined. Then, an analytical formula for mean surface temperature increase is obtained and the impact of various parameters is examined. An approximate formula of closed form is derived to assess the influence of the skin and proximity effects on the thermal field. Finally, numerical examples are presented to illustrate the considerations. Due to quite a large number of symbols occurring in the equations they were collected at the end of this manuscript.

2. Methodology

2.1. Physical Model

The main subject of the research is a three-phase system of conductors arranged in two commonly used configurations: flat (Figure 1a) and an equilateral triangle (trefoil) (Figure 1b). It was assumed that the system consisted of three identical parallel cylindrical wires of radius R , spaced at the same distance d from each other, and that their length is much larger compared to their cross-sectional extent.

2.2. Current Density

In the analysis of the thermal field, it is necessary to know the current density distributions in individual phases of the conductors, taking into account the skin effect and proximity phenomena. For this purpose, appropriate dependencies given in [25] were used. The formulas determining the current densities were found based on the solution of the Helmholtz equation [26,27] with respect to the magnetic vector potential. The formulas were obtained under assumptions that the electrical conductivity σ and relative magnetic permeability μ r of all conductors were independent of fields and the same in the whole conductor. The conductors were assumed to carry symmetrical three-phase currents of a positive sequence and frequency f . Based on [25], the current density distribution in i -th wire can be expressed as follows:
J _ i r , φ = Γ I _ i 2 π R I 0 Γ r I 1 Γ R + n = 1 R d n I n Γ r I n 1 Γ R A n i φ , 0 r R , 0 φ 2 π , i = 1,2 , 3 ,
where r , φ are local polar coordinates related to the wire,
Γ = j ω μ r μ 0 σ = 1 + j κ , κ = ω μ r μ 0 σ 2 , ω = 2 π f , j = 1 ,
I _ 1 = I , I _ 2 = I a 2 , I _ 3 = I a , a = e j 2 π / 3 ,
I n z is the modified Bessel functions of the first kind of order n , μ 0 = 4 π × 10 7 H / m , and functions A n i φ depend on the position and current phases of the neighboring wires. For the case of the considered flat configuration, they take the following form:
A n 1 φ = 1 + 2 n + j 3 1 2 n cos n φ ,
A n 2 φ = 1 + 1 n + j 3 1 1 n cos n φ ,
A n 3 φ = 1 n 1 + 2 n j 3 1 2 n cos n φ .
In turn, in the case of the trefoil configuration, they can be expressed as follows:
A n 1 φ = 2 e j 2 π / 3 cos n φ + e j 2 π / 3 cos n φ π / 3 ,
A n 2 φ = 2 1 n e j 2 π / 3 cos n φ + e j 2 π / 3 cos n φ + π / 3 ,
A n 3 φ = 2 1 n e j 2 π / 3 cos n φ π / 3 + e j 2 π / 3 cos n φ + π / 3 .
The first component in Equation (1) determines the current density caused by the skin effect, whereas the series results from the proximity phenomenon. It should be mentioned that Equation (1) is an approximate solution obtained by replacing the neighboring wires with current filaments. However, it was shown in [28] that the approximation error is below 1% if the skin depth is not less than the wire radius and the spacing between the wires is at least one wire radius. The literature also offers other formulas describing current densities in three-phase systems. In Ref. [29], for example, approximate relationships defining current densities in the form of finite series with appropriately selected functions were given, in which the unknown coefficients were determined using the matching method. However, in this paper, the approach based on Equations (1)–(5) is considered.
Figure 2 shows exemplary distributions of current density modulus in individual phase conductors for the considered flat and triangular configuration. The following values for parameters were used to prepare the plots: current RMS I = 595.46 A , frequency f = 50 Hz , copper wires ( σ = 55 MS / m , μ r = 1 ) of radius R = 9.77 mm (cross-section area 300 mm2), d = 50 mm . The plots in Figure 2 show that the current density distributions in individual phases are nonuniform and depend on the radial coordinate r and the angular coordinate φ . Moreover, in the flat configuration, they differ between the conductors; therefore, the temperature distributions will be different, too.

2.3. Mathematical Model of Thermal Field

It was assumed that the configuration was placed at an ambient temperature of T 0 and protected from direct sunlight. The mathematical model of the thermal field in one conductor was defined using the thermal increase ϑ = T T 0 , where T is the temperature. The temperature increase in the i -th wire satisfied the classical thermal conductivity equation [30,31] of the following form:
2 ϑ i r 2 + 1 r ϑ i r + 1 r 2 2 ϑ i φ 2 = g i r , φ λ , 0 r R , 0 φ 2 π , i = 1,2 , 3 ,
where λ is the thermal conductivity of the wire material (assumed constant), and g i r , φ is the efficiency of the heat source. In this case, it equals the power loss density caused by current passage:
g i r , φ = J _ i r , φ J _ i * r , φ σ ,
where J _ i r , φ is the current density in i -th wire given by Equation (1). To solve Equation (6), it is necessary to pose boundary conditions. It was assumed that the outer surface of the wires exchanged thermal energy in accordance with Newton’s law [31,32], and the thermal influence of the neighboring wires was neglected. The above-mentioned energy exchange is described by the Hankel boundary condition, as follows:
λ ϑ i r r = R = α ϑ i R , φ , 0 φ < 2 π , i = 1,2 , 3 ,
where α is the heat transfer coefficient.

2.4. Solving Methodology

To solve Equation (6) with the boundary condition (8), an analytical method based on the Green’s function [33,34,35] was used. There are many advantages to its use. First, in Green’s method, there is no need to determine the particular integral of the non-homogeneous Equation (6), which is difficult to determine in the analyzed case. Second, the Green’s function does not depend on the excitation (heat source); therefore, it is a convenient tool for analyzing fields with non-uniform sources. In accordance with the method of Green’s function, the solution of Equation (6) can be represented by the following integral [33,34,35]:
ϑ i r , φ = 1 λ ξ = 0 R θ = 0 2 π g i ξ , θ G r , φ ; ξ , θ ξ d ξ d θ , 0 r R , 0 φ < 2 π , i = 1,2 , 3 ,
where g i ξ , θ is given by Equation (7), G r , φ ; ξ , θ is a Green’s function for the problem defined by Equations (6) and (8). It is worth noting that this function is independent of the heat source and the conductor position.
The condition for using Equation (9) is prior knowledge of the Green’s function. It is a solution to the following problem [33,35]:
2 G r 2 + 1 r G r + 1 r 2 2 G φ 2 = δ r ξ r δ φ θ , 0 r , ξ R , 0 φ , θ 2 π ,
and satisfies the boundary condition as follows:
λ G r r = R = α G R , φ ; ξ , θ , 0 ξ R , 0 φ , θ < 2 π ,
where δ is the Dirac delta distribution. The Green’s function was previously found in [36], where an expansion into a series of eigenfunctions with respect to the angular coordinate φ was used, whereas direct integration of Equation (10) with respect to the radial coordinate was performed on both sides of the pulse δ r ξ . After using the properties of the Green’s function, its continuity at point ξ , θ and the discontinuity of its derivative at this point (due to the Dirac impulse), the result can be expressed with individual expressions for r ξ and for r ξ , as follows:
G r , φ ; ξ , θ = 1 2 π ln ξ R λ α R + n = 1 1 2 n π ξ r R 2 n n λ α R n λ + α R + r ξ n cos n φ θ , 0 r ξ , 0 φ , θ < 2 π ,
G r , φ ; ξ , θ = 1 2 π ln r R λ α R + n = 1 1 2 n π ξ r R 2 n n λ α R n λ + α R + ξ r n cos n φ θ , ξ r R , 0 φ , θ < 2 π .

3. Results and Discussion

3.1. Temperature Distributions in Wires

After substituting Equations (12a) or (12b) and (7) into (9), the temperature increment distributions in individual wires can be obtained as follows:
ϑ i r , φ = 1 λ ξ = 0 r θ = 0 2 π g i ξ , θ G r , φ ; ξ , θ ξ d ξ d θ + ξ = r R θ = 0 2 π g i ξ , θ G r , φ ; ξ , θ ξ d ξ d θ ,
where the first and second integrals use the G function defined by Equations (12a) and (12b), respectively. Due to the rather complicated form of the integrands, it is impossible to fully calculate the integrals in Equation (13) analytically. Nevertheless, the equation is the basis for obtaining approximations or simplified solutions, e.g., by using the expansion of the Bessel function into appropriate series [37]. Such an approach is presented in this paper in the subsequent sections.
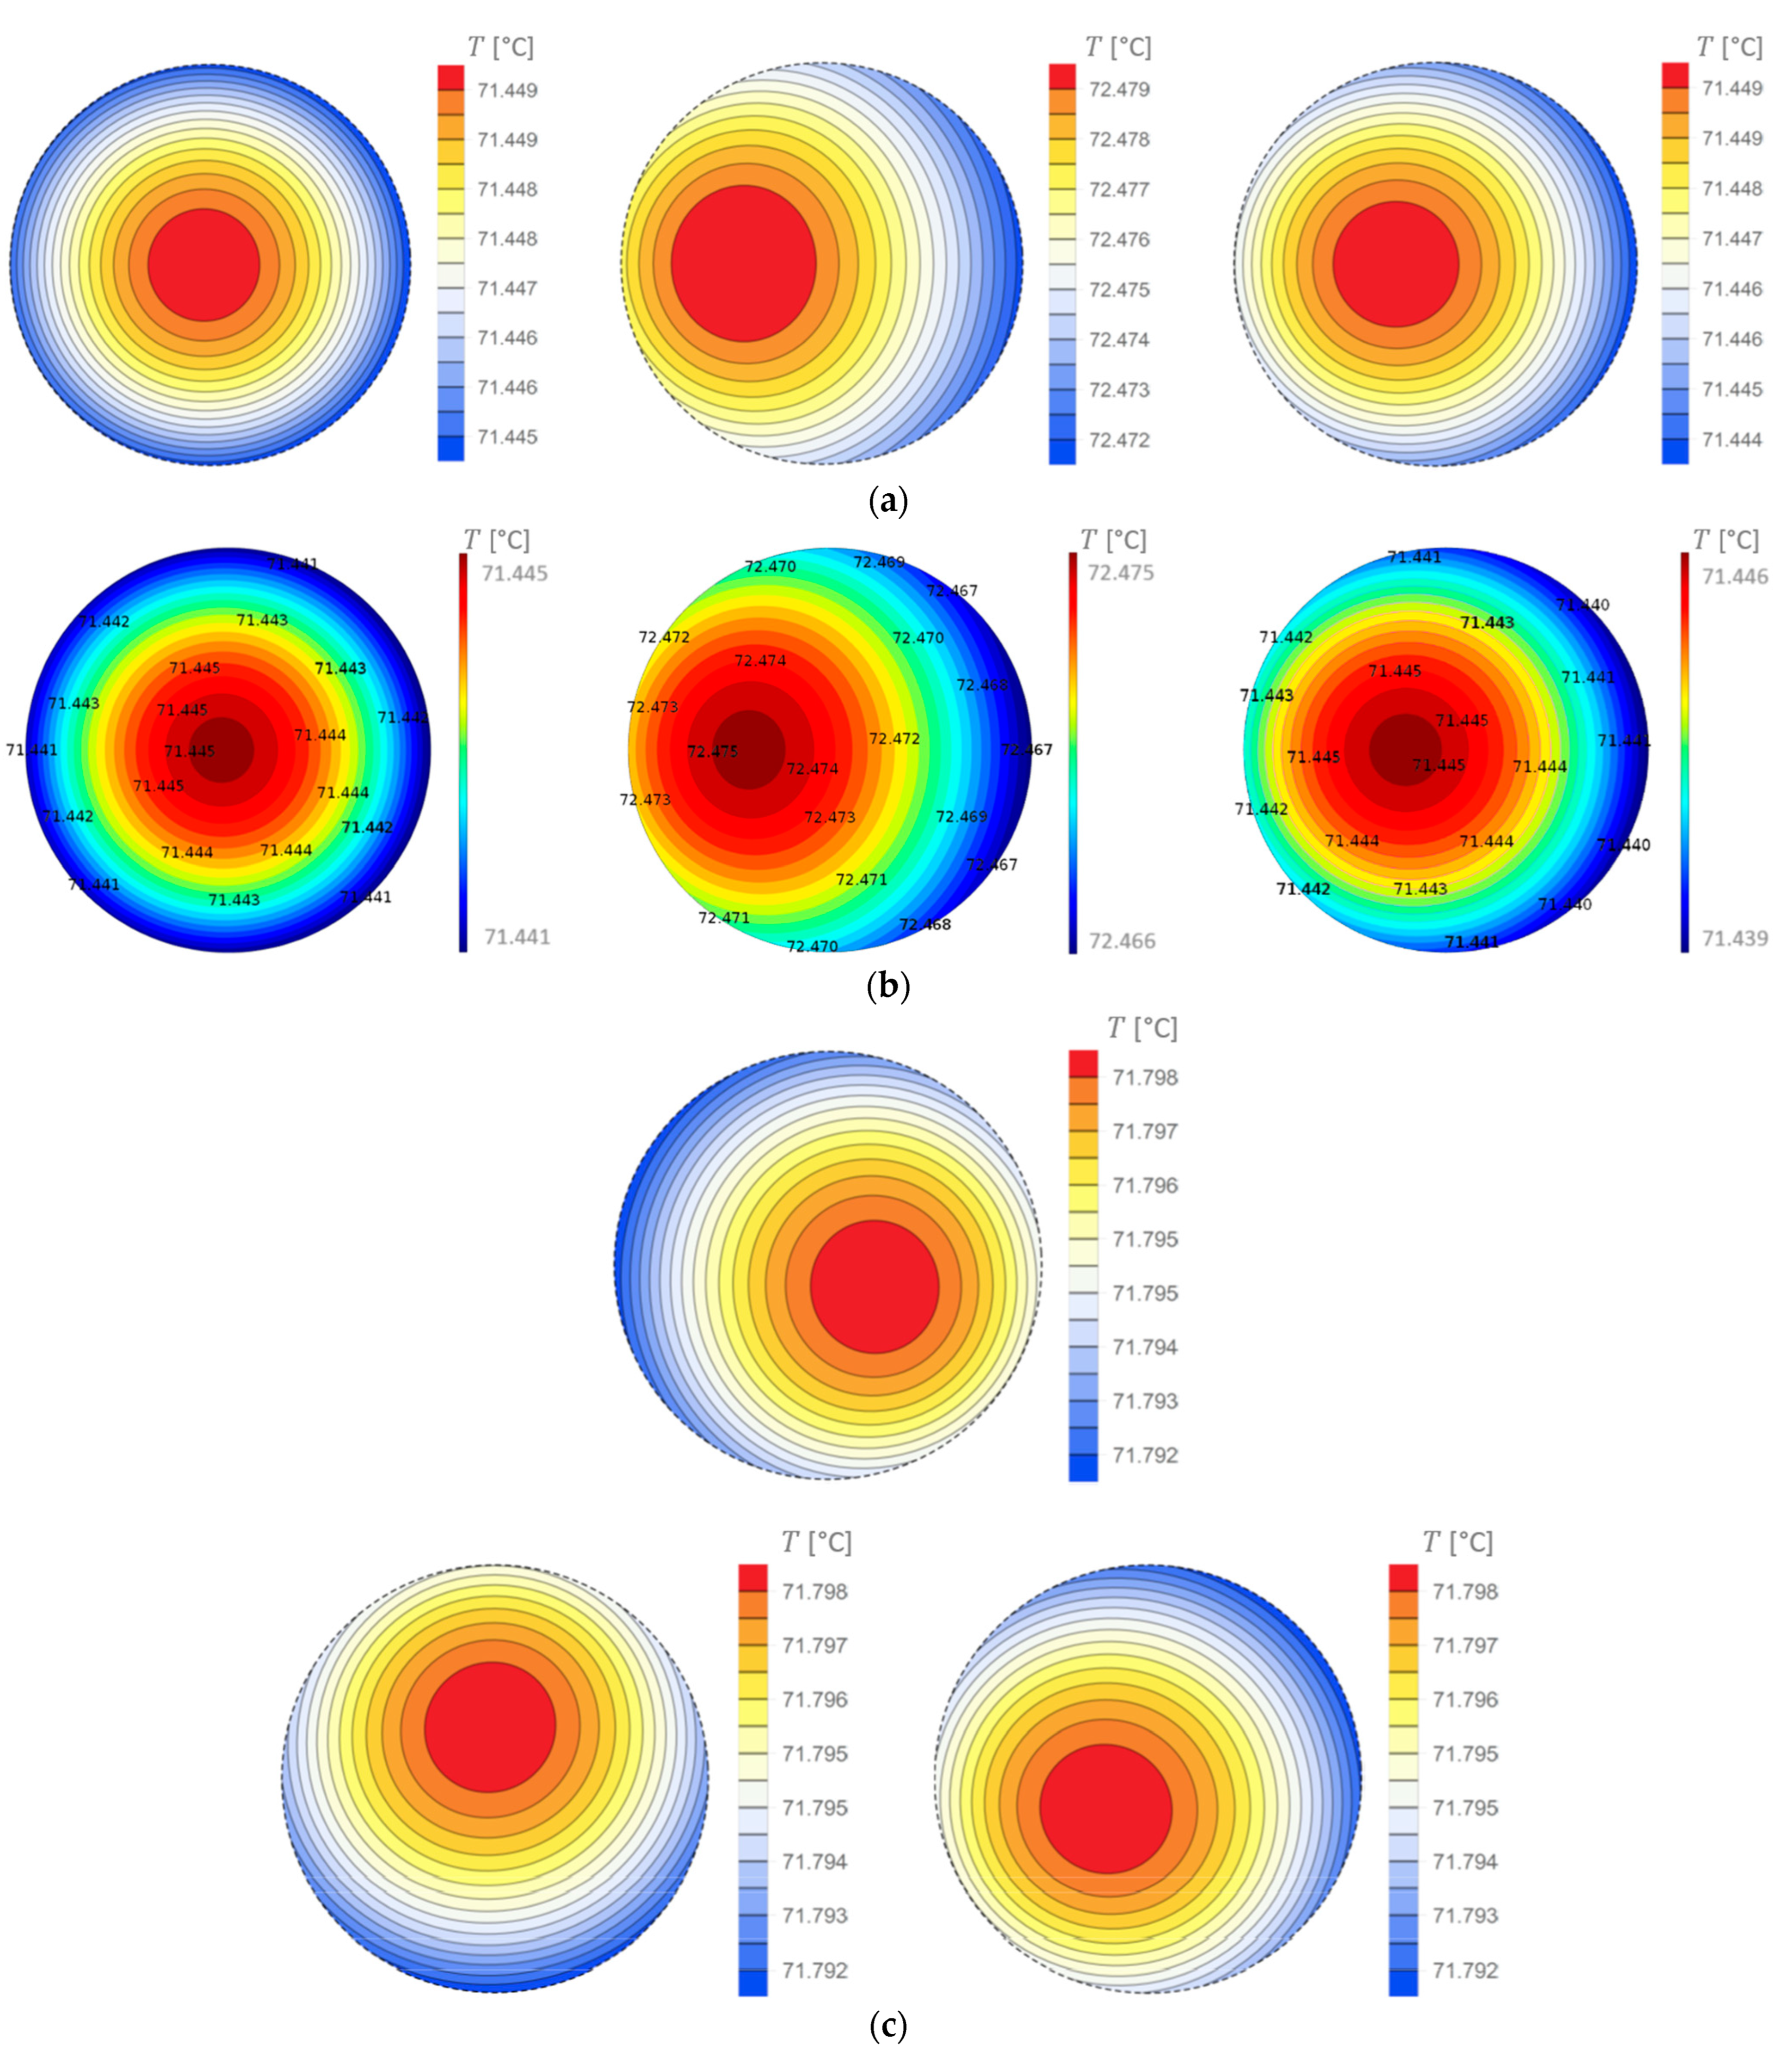
To be more specific, let us consider the wires of a cross-section area 300 mm2 ( R = 9.77 mm ) made of copper ( σ = 55 MS / m , μ r = 1 , λ = 360 W / mK ). The wires are placed at an ambient temperature of 20 °C, and the heat transfer coefficient α is assumed to be 7 W / m 2 K . The permissible temperature for a standalone wire is assumed to be 70 °C, which corresponds to the permissible DC current I = 595.46 A . However, if this current is applied in a three-phase system at a frequency of 50 Hz, the temperatures will be higher than 70 °C due to the skin and proximity effects. Figure 3a,c show the temperature distributions for d = 50 mm ( R / d 0.195 ), calculated using Equation (13) for flat and trefoil configurations by means of Wolfram Mathematica 11.1.1 software [38]. For comparison, COMSOL 6.2 software [39] was used to find the temperature distribution in the flat configuration, too (Figure 3b). The results obtained from Equation (13) and COMSOL agree very well. The differences occur at the 5th significant digit and are below 0.006 °C. They can be attributed to numerical errors related to finite elements in COMSOL. Thus, the proposed methodology should be considered correct.

3.2. Temperature on Wire Surface

The plots shown in Figure 3 reveal very small differences in temperature throughout the wire cross-sections, but noticeable differences between the wires themselves. In typical situations, it seems enough to determine the temperature on the wire surface, because this temperature directly affects the surrounding region, and it hardly differs from that inside the wire. Therefore, although Equation (13) can be used to determine temperature at any point of any wire for any material, excitation and thermal parameters, it is reasonable to focus on the wire surface. Putting r = R in Equation (13) results in considerable simplification of the formula so that
ϑ i R , φ = 1 2 π α R ξ = 0 R θ = 0 2 π g i ξ , θ 1 + α R λ n = 1 ξ R n 2 n + α R / λ cos n φ θ ξ d ξ d θ .
Let us introduce a dimensionless quantity B i = α R / λ , called the Biot number, and the normalized radial coordinate ρ = ξ / R . In addition, the dummy index n is changed into p to avoid further conflict of symbols. Then, it follows that
ϑ i R , φ = R 2 2 π α R ρ = 0 1 θ = 0 2 π g i R ρ , θ p = 0 B p ρ p + 1 cos p φ θ d ρ d θ ,
where
B p = 2 δ p B i B i + p , p = 0,1 , 2 , ,
where δ p is used to denote briefly the Kronecker delta δ p , 0 .
Now, it is necessary to use g i R ρ , θ , defined with Equation (7). Since I 1 z = I 1 z , Equation (1) can be rewritten as follows:
J _ i R ρ , φ = γ I _ i 2 π R 2 n = 0 R d n I n γ ρ I n 1 γ A n i φ ,
where γ = Γ R , A 0 i φ = 1 , and A n i φ for n = 1,2 , 3 , are defined with Equations (4) or (5). Using this in Equation (7) and calculating the product of infinite series allows us to rewrite g i R ρ , θ in the following form:
g i R ρ , θ = 1 σ I π R 2 2 m = 0 R d m n = 0 m γ γ * 4 I m n γ ρ I n γ * ρ I m n 1 γ I n 1 γ * A m n , i θ A n , i * θ .
Substituting this expression into Equation (15) yields
ϑ i R , φ = ϑ DC p = 0 B p m = 0 R d m n = 0 m C i , m n , n , p φ D m n , n , p ,
where
ϑ DC = π R 2 2 π α R 1 σ I π R 2 2 = I 2 2 π 2 σ α R 3 ,
C i , m n , n , p φ = 1 π 0 2 π A m n , i θ A n , i * θ cos p φ θ d θ ,
D m n , n , p = γ γ * 4 0 1 I m n γ ρ I n γ * ρ I m n 1 γ I n 1 γ * ρ p + 1 d ρ .
It is worth mentioning that ϑ DC represents the steady state incremental temperature for direct current I . Indeed, in the DC case, the current density is uniform, so the total power losses inside the wire equal P = 1 / σ × I 2 / π R 2 2 × π R 2 l ( l —wire length). In steady state, these losses are transferred out of the wire, i.e., heat flux across the wire surface equals q = P / 2 π R l . Moreover, Newton’s law yields q = α ϑ DC . Combining the above expressions, one obtains Equation (20).
To calculate C i , m n , n , p , it is convenient to represent A n i θ given by Equations (4) or (5) as follows:
A n i φ = c n i cos n φ + s n i sin n φ ,
where coefficients c n i and s n i for flat and trefoil configurations are summarized in Table 1. The final formulas for C i , m n , n , p and D m n , n , p are derived and presented in Appendix A—Equations (A9) and (A18). It is worth noting that C i , m n , n , p depends on the angular coordinate φ , whereas D m n , n , p is a function of κ R , only.
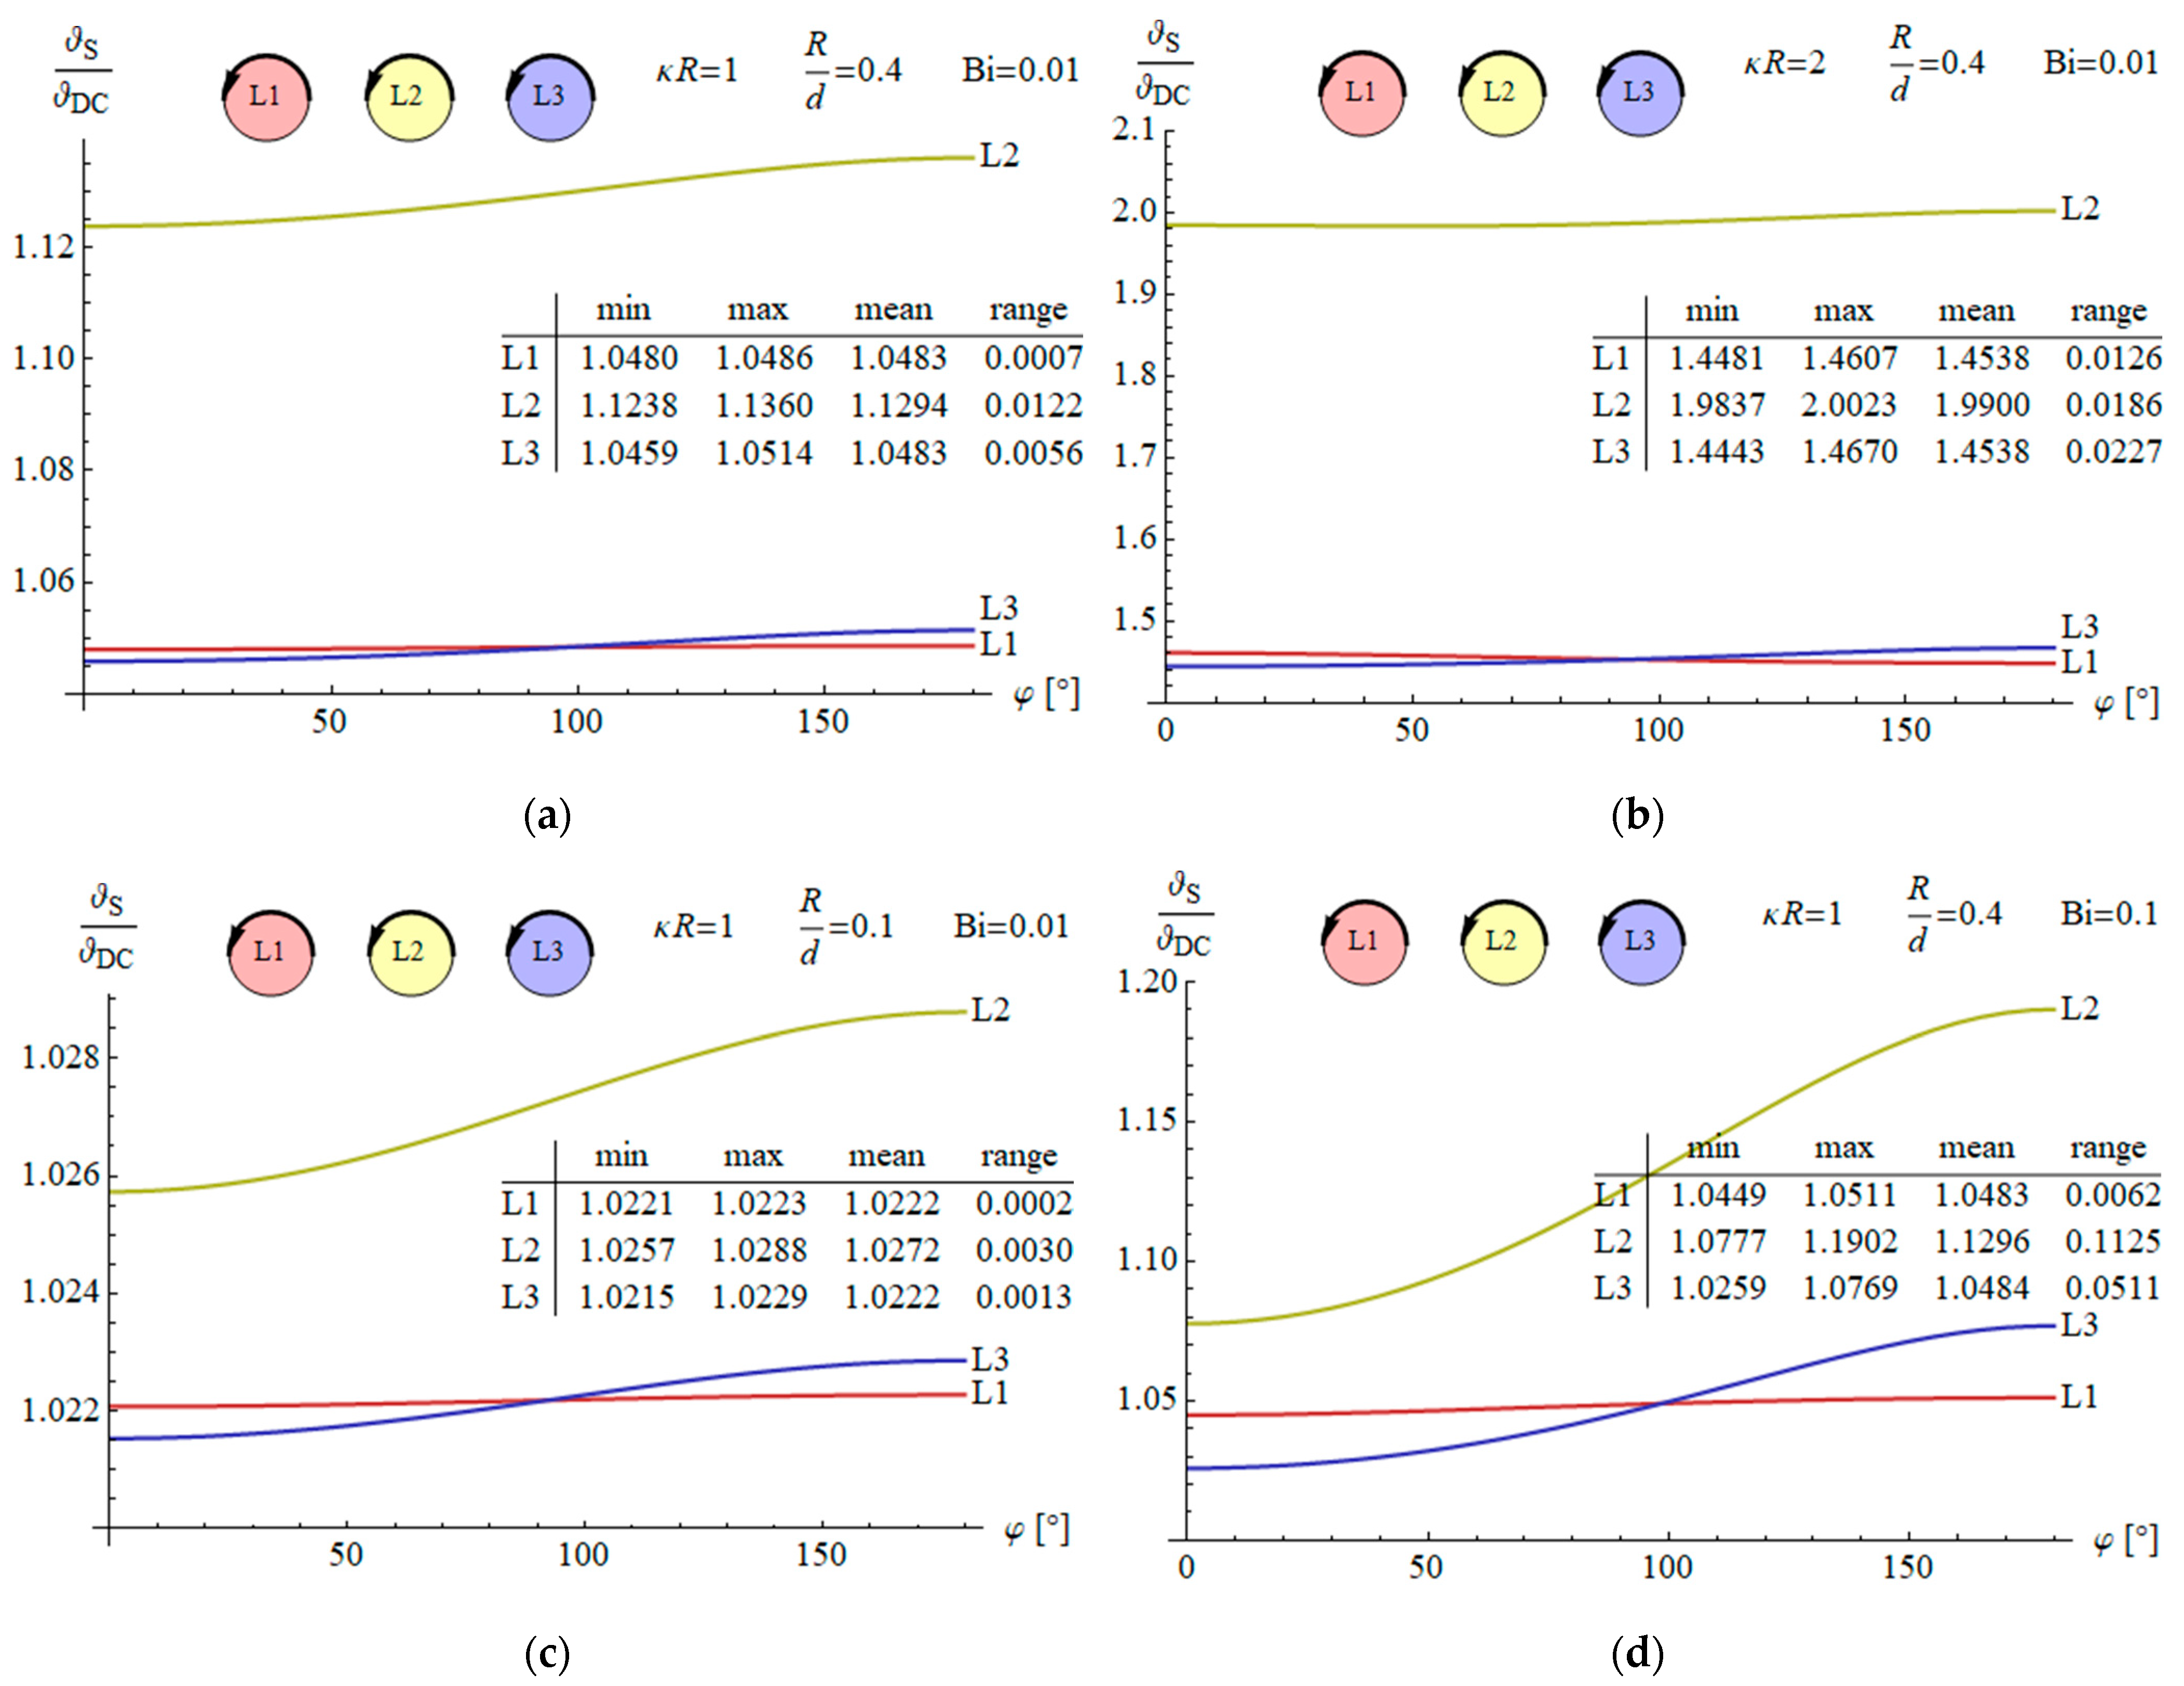
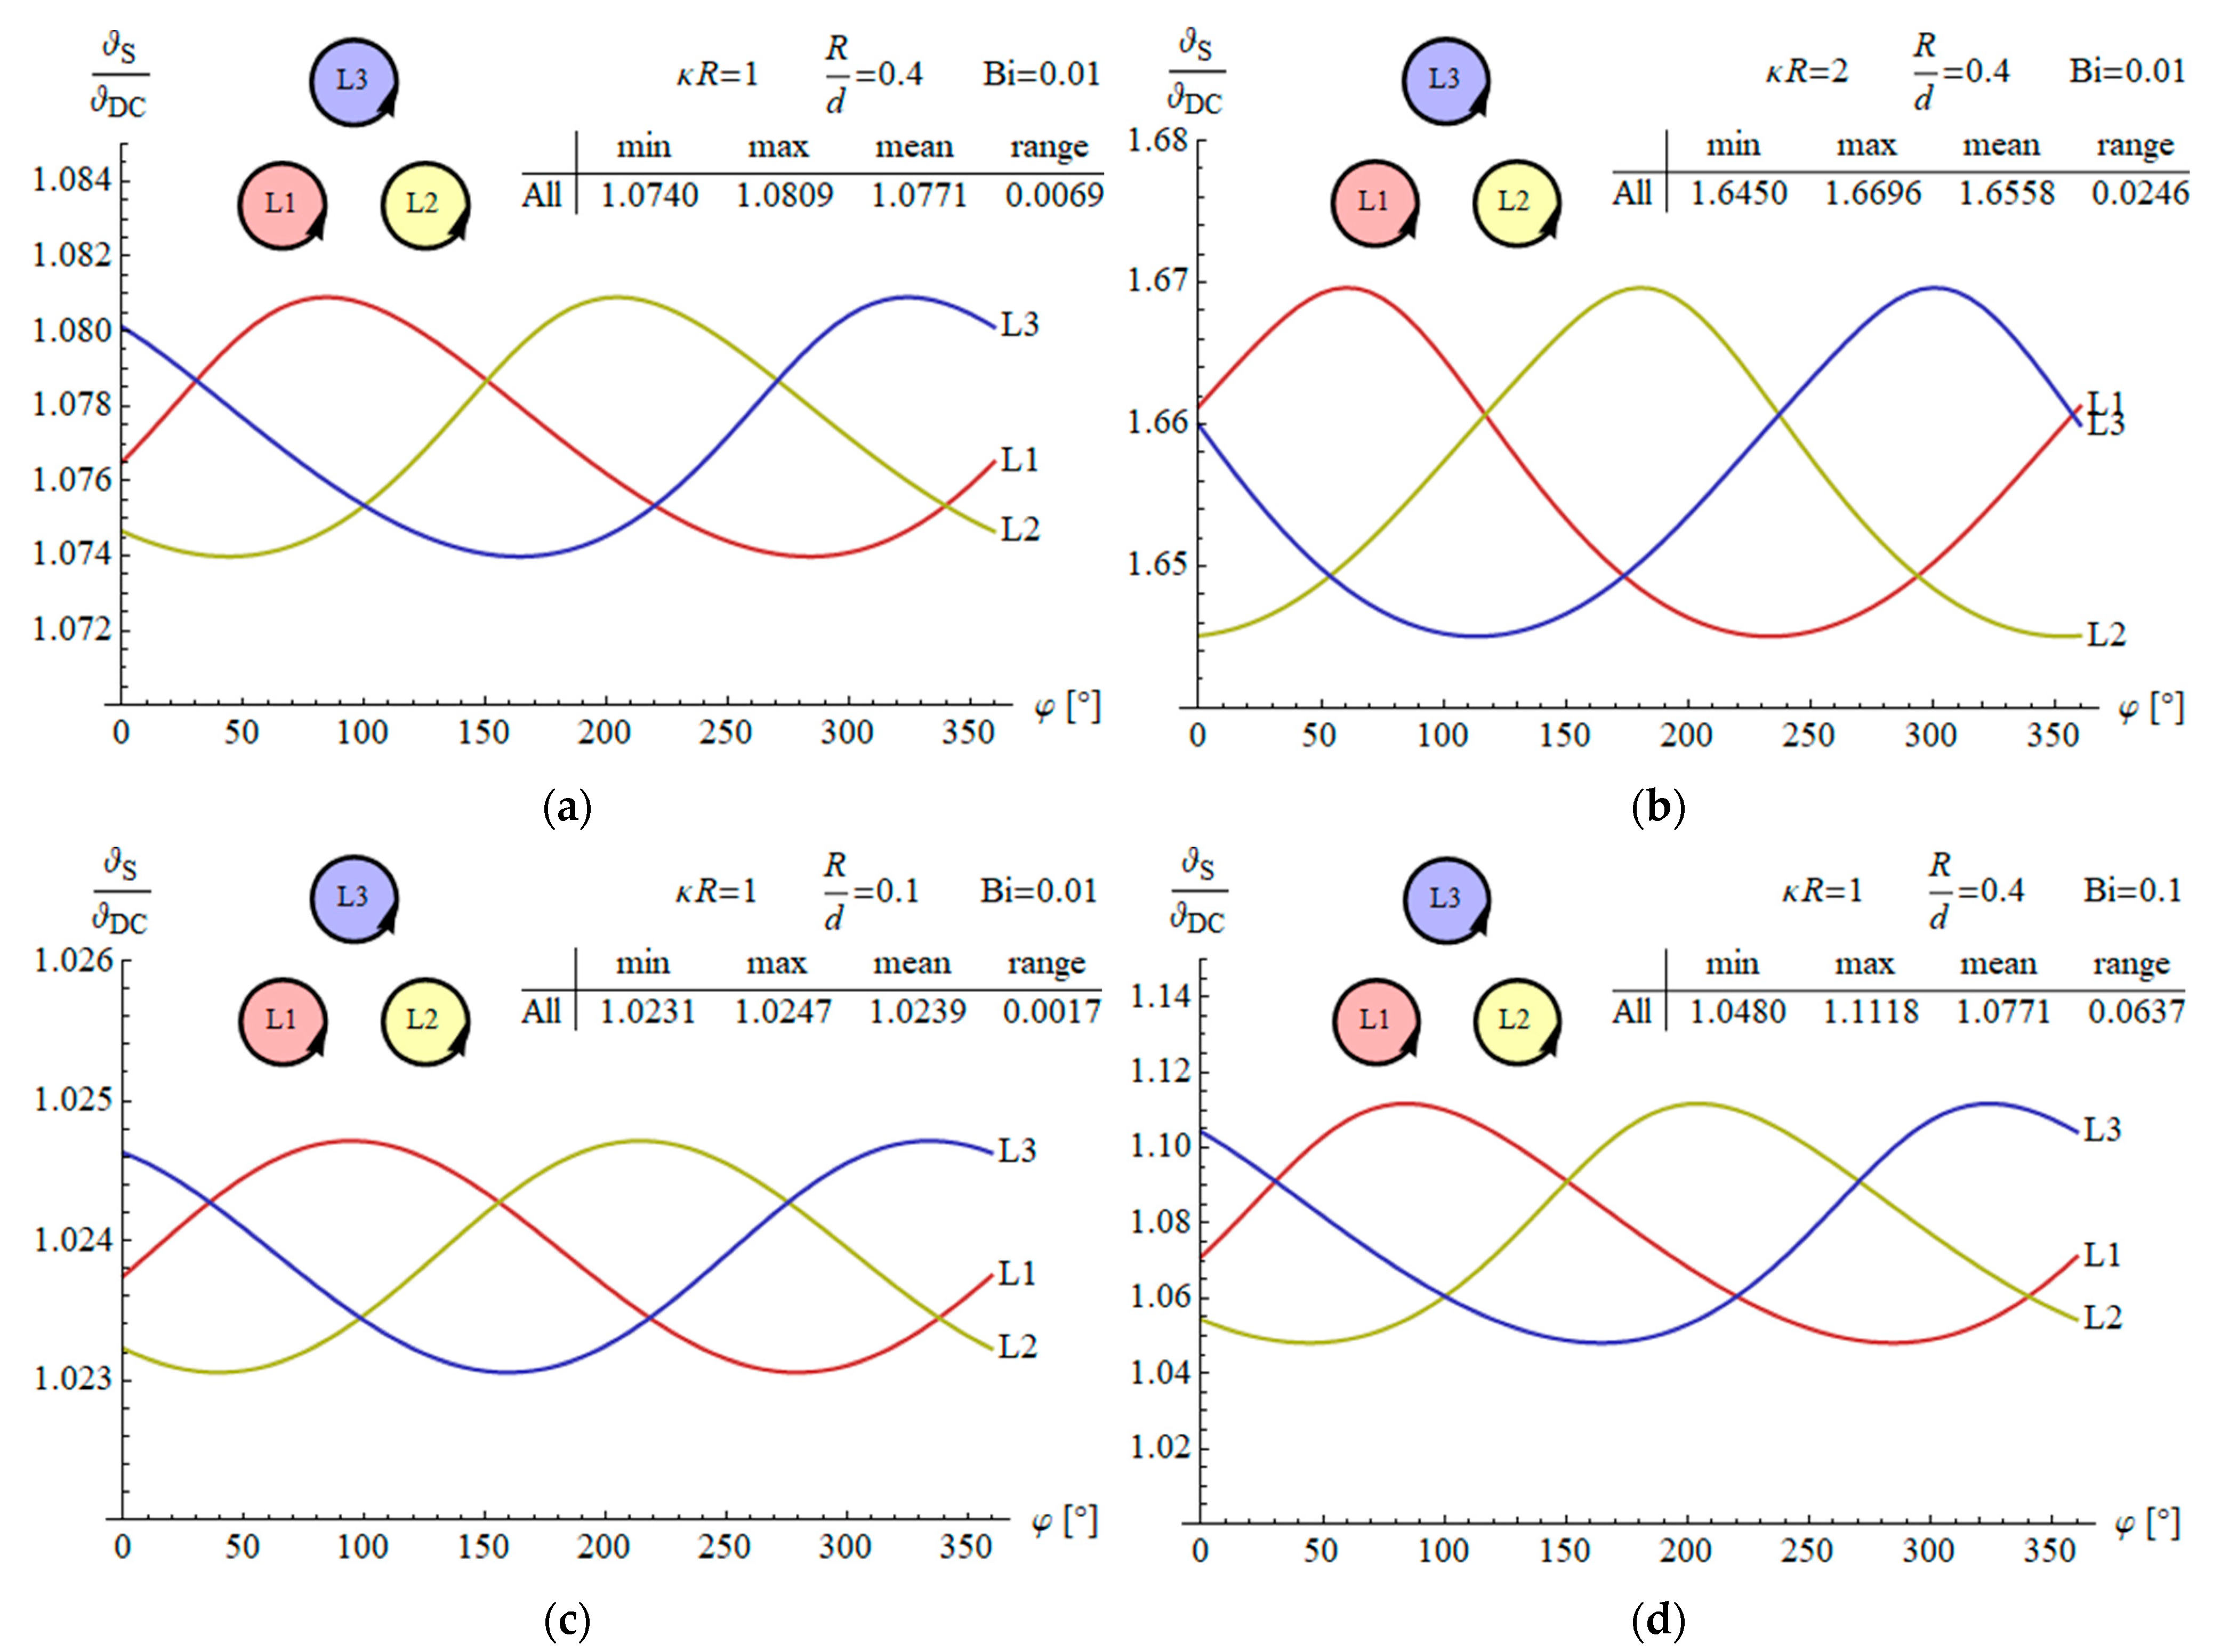
As shown in Equation (19), the temperature increase in a wire depends on three parameters: R / d , related to the distance between the wires, κ R , related to the skin effect strength and Bi, related to thermal processes. Figure 4 and Figure 5 show the relative temperature increase ϑ S / ϑ DC vs. the angular coordinate φ of individual phase wires for various parameter values in flat and trefoil configurations, respectively. The inset tables show the minimum, maximum, mean and range (equal to max–min) of temperature values for individual conductors. It can be observed that the temperatures in the flat configuration are different for different wires. The temperatures of the left and right wires are slightly different, but similar. Moreover, their means are equal. However, the middle conductor has a considerably higher temperature. The temperatures in the trefoil configuration for all phases are the same, but they are shifted by 120° due to symmetry.
When κ R is enlarged, the wire temperatures rise considerably (Figure 4b compared with Figure 4a, and Figure 5b compared with Figure 5a), and, also, their ranges for individual wires are greater the higher the κ R . This is a result of both the skin and proximity effects. The temperatures get lower with a decrease in R / d ratio (see Figure 4c and Figure 5c compared with Figure 4a and Figure 5a, respectively). Hence, the greater the distance between the wires, the lower the temperatures and their variation. The Biot number also affects the temperature distribution. The higher the Biot number, the higher the variations in wire temperatures. However, the mean values of wire surface temperature are not affected by the Biot number.

3.3. Mean Temperature on Wire Surface

Equation (19) can be used to calculate the temperature at any point on the wire surface. When the Biot number is low enough (much below 0.1), the temperature variations are small, as shown in Figure 4 and Figure 5. This is the case encountered in practical applications. For example, the thermal conductivity of copper is around 360 W/mK, and the heat transfer coefficient is assumed at a level of 7 W/m2K. This results in a Bi much below 0.01, i.e., the temperature variations are negligible. This is clearly observed in Figure 3, which was obtained for parameters resulting in Bi = 0.00019. Therefore, it would be desirable to calculate the average temperature of the wire surface, i.e.,:
ϑ ¯ S i ϑ DC = 1 2 π 0 2 π ϑ i R , φ d φ = p = 0 B p m = 0 R d m n = 0 m C ¯ i , m n , n , p D m n , n , p .
Taking into account Equation (A9), it follows that
C ¯ i , m n , n , p = δ p δ m 2 n + δ m c m n , i c n i * + δ m 2 n δ m s m n , i s n i * .
Hence, C ¯ i , m n , n , p is nonzero only if p = 0 . Therefore, terms with p = 0 are responsible for the mean temperature on the conductor surface, whereas terms with p > 0 describe deviations from the mean temperature. Moreover, m = 0 or n = m / 2 are required to obtain a non-zero result, i.e., m must be an even, non-negative integer. As a result, after some transformations, Equation (24) can be rewritten as follows:
ϑ ¯ S i ϑ DC = 2 D 0,0 , 0 + n = 1 M n i R d 2 n D n , n , 0 ,
where M n i = c n i 2 + s n , i 2 . The values of these coefficients for n 10 are presented in Table 2. The term 2 D 0,0 , 0 is responsible for the temperature increase due to the skin effect, whereas the series term is related to the proximity effect. Since the largest value of R / d equals 0.5, the series is quickly convergent; therefore, usually only a few terms can be taken. Importantly, integral D n , n , 0 can be found analytically. Equations (A10) and (A13) allow the following relationship to be obtained:
D n , n , 0 = γ γ * 4 I γ I n γ * I n + 1 γ I γ 2 I n 1 γ I n 1 γ * .
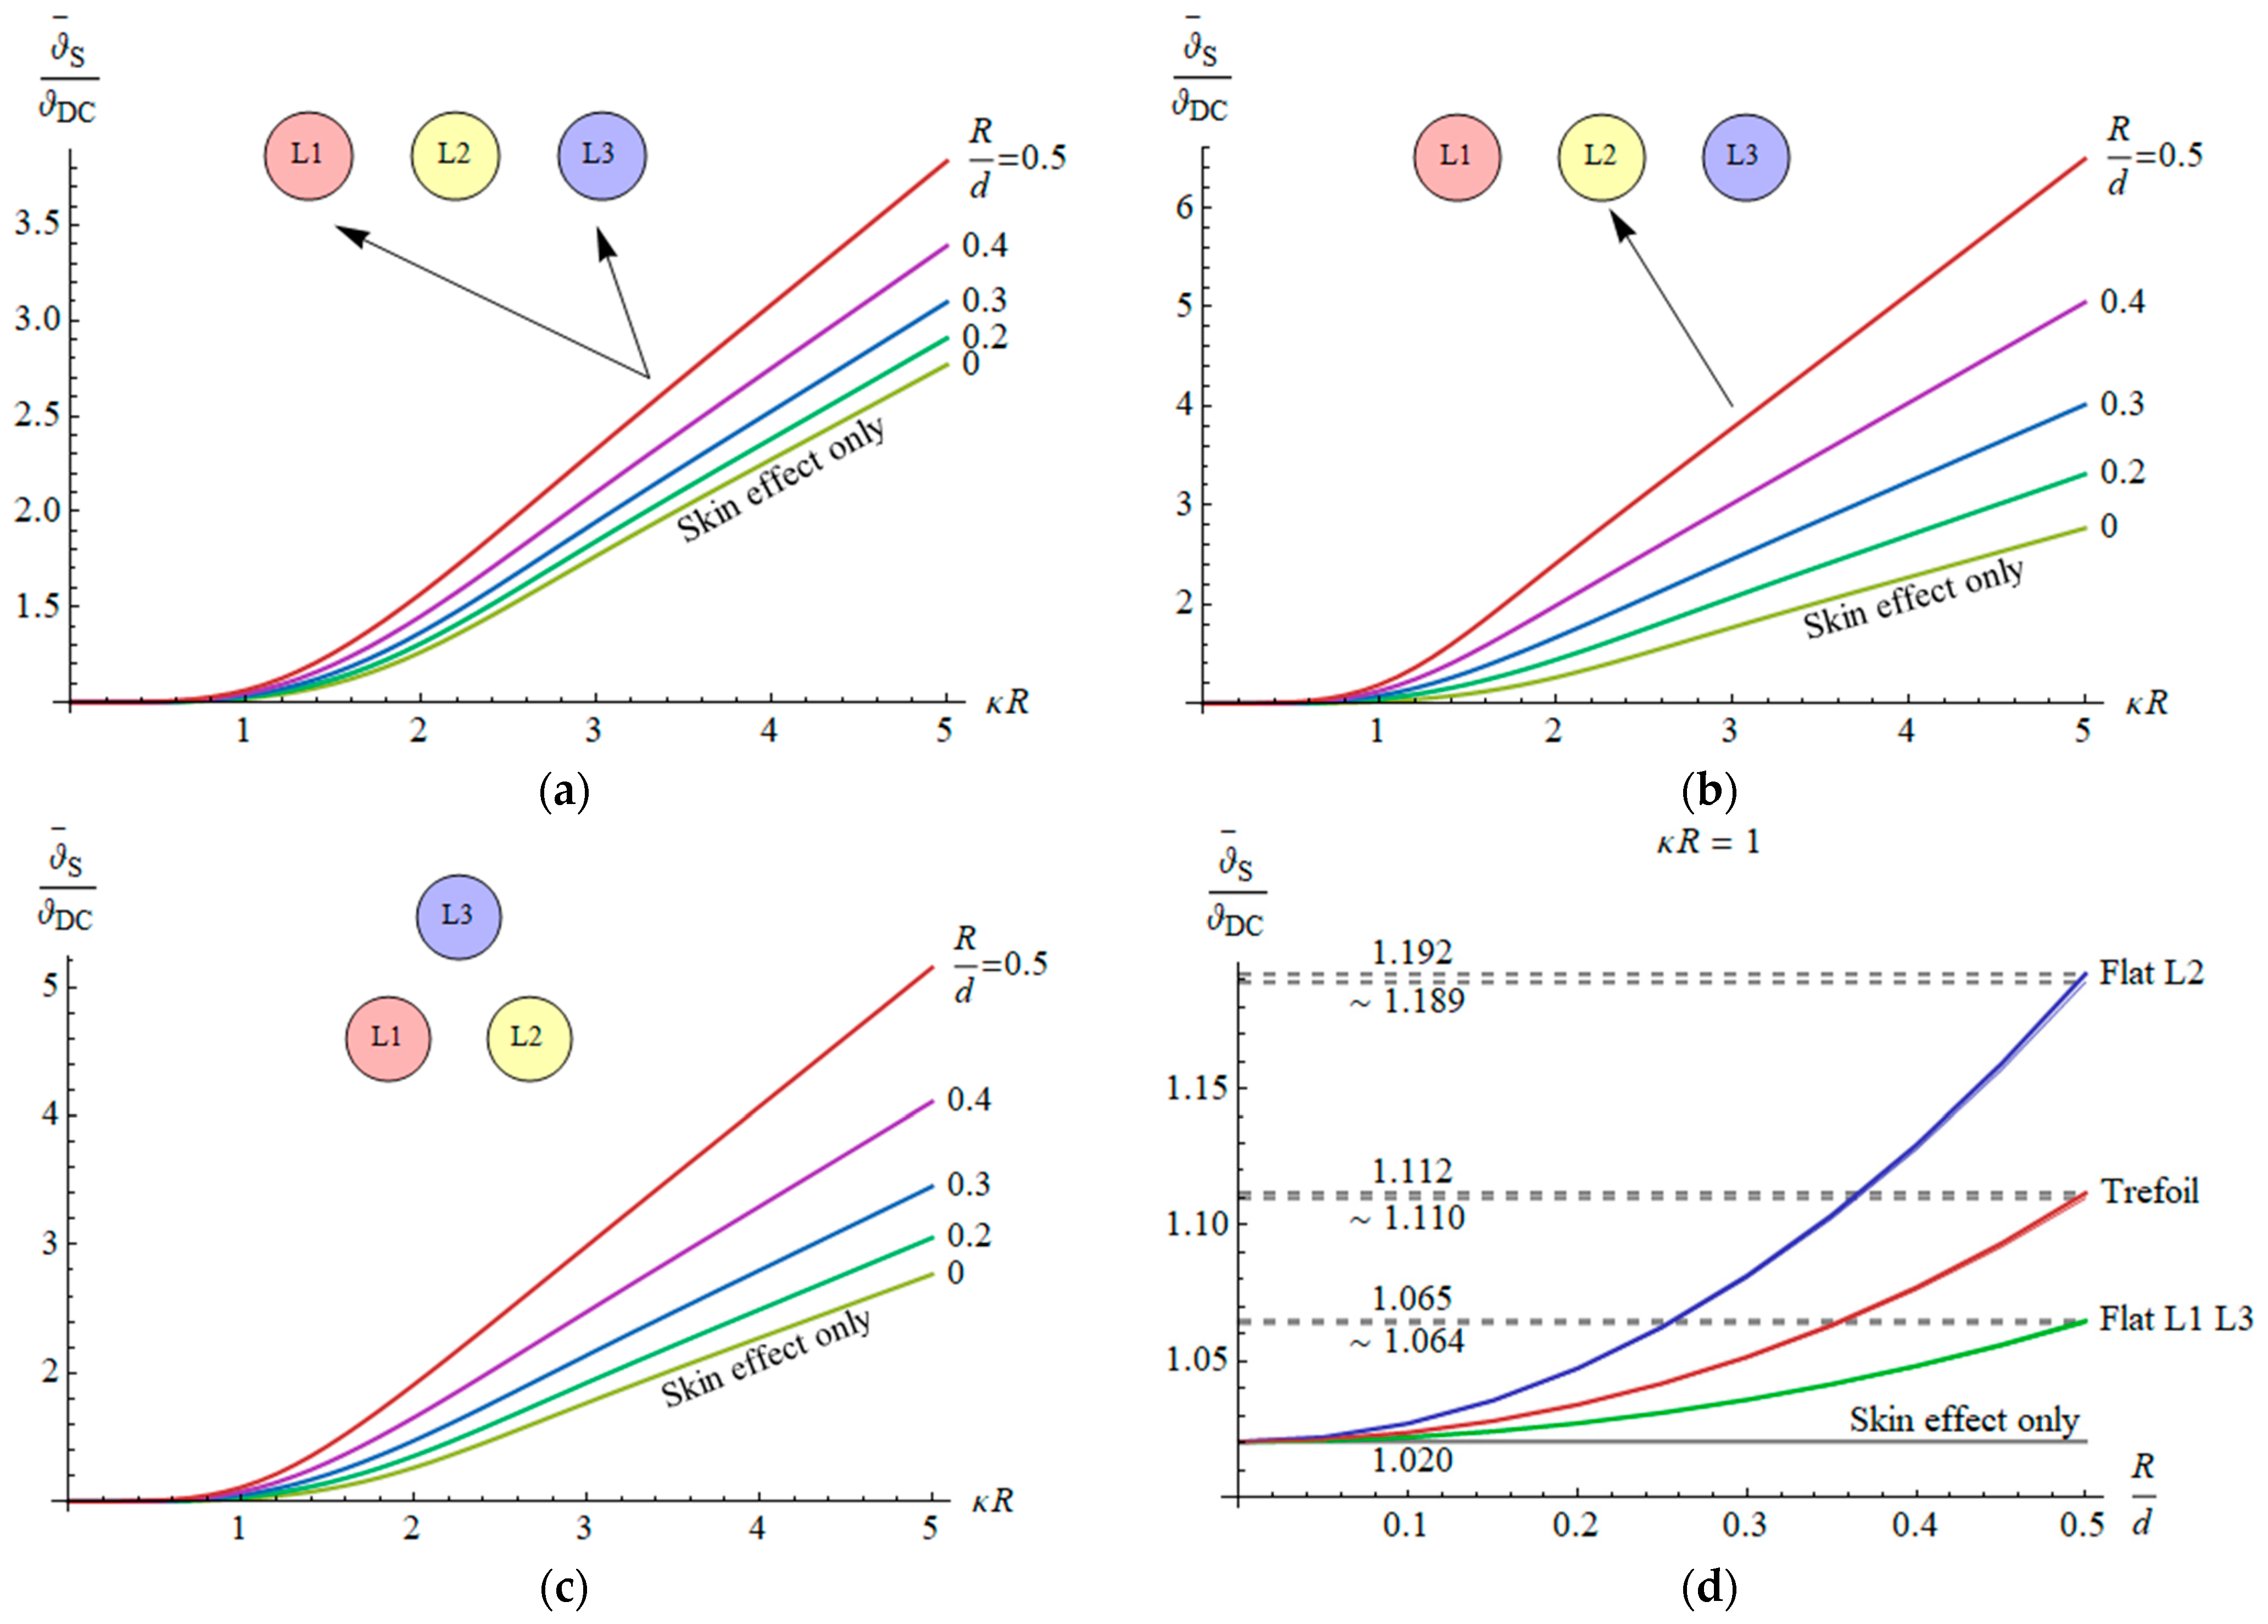
Figure 6a–c show the influence of κ R (ratio of R and skin depth) and R / d on the mean surface temperature increment ϑ ¯ S for individual phase conductors. If the wires are far enough apart, the proximity effect is negligible, and the temperature of all the wires is the same (light green trace labeled “skin effect only”). However, the closer the wires, the higher the wire temperature. Moreover, the temperature depends on the wire position. In the case of the flat configuration, the temperature of the middle conductor is clearly higher than that of the outer ones. Interestingly, despite different distributions of current density in the outer left and right wires, the mean surface temperature increase is the same in both wires. The trefoil configuration results in equal temperatures in all conductors. When compared with the flat configuration, the temperature is higher than that of the outermost wires in the flat configuration but lower than that of the middle wire.
Usually, the wire radius is kept at a level of skin depth so that κ R 1 . Therefore, it is desirable to obtain approximations for low κ R . By expanding the functions D n , n , 0 into power series with respect to κ R around point 0, it follows that
D 0,0 , 0 = 1 2 + 1 96 κ R 4 1 5760 κ R 8 + O κ R 12 , n = 0 ,
D n , n , 0 = κ R 4 8 n 2 n + 1 6 + 5 n κ R 8 32 n 4 n + 1 2 n + 2 n + 3 + O κ R 12 , n = 1,2 , 3 ,
Taking into account that R / d < 0.5 , only terms up to O R / d 2 and O κ R 8 can be retained in Equation (26) to keep satisfactory accuracy. As a result, the following approximation for the temperature increase is obtained:
ϑ ¯ s i ϑ DC 1 + 1 48 1 1 60 κ R 4 κ R 4 skin effect + M 1 i 16 1 11 96 κ R 4 κ R 4 R d 2 proximity effect , κ R < ~ 1 ,
where M 1 i equals 3, 12 and 6 for the side wires in the flat configuration, the middle wire in the flat configuration, and all wires in the trefoil configurations, respectively (see Table 2). The maximum error of this approximation does not exceed 0.75% for κ R 1 and R / d 0.5 . Figure 6d shows a comparison between the approximation given by Equation (29) and the exact theoretical value given by Equation (26). It can be observed that both equations yield practically the same values, although Equation (29) results in slightly decreased values compared to the exact Equation (26), because the omitted terms O κ R 12 and O R / d 4 are positive. Assuming κ R = 1 , the temperature increase due to the skin effect is around 2% compared to that for the DC case. However, depending on the wire arrangement and spacing, the proximity effect can result in a temperature increase up to 4.5%, 9% and 17% for the outer wires in the flat, all wires in trefoil, and the middle wire in the flat configuration, respectively.

3.4. Comparison with Other Methods

As mentioned in the introduction, the literature is scarce for analytical methods related to temperature and the proximity effect. Therefore, the results obtained in this work are compared with those obtained via finite elements (COMSOL). The results are presented in Table 3. The differences do not exceed 0.006 °C, which corresponds to a relative percentage error below 0.01%. They can be attributed mainly to numerical errors related to finite elements and, to a lesser degree, to the errors of numerical integration of Equation (13) or neglecting the higher order reactions in Equation (1) for current density. Nevertheless, the relative error below 0.01% means a very high consistency.
In addition, the results are compared with those given by the formula presented in [20], where the skin effect was taken into account in a single round wire. The formula, although with somewhat different designations, is as follows:
ϑ S ϑ DC = F 4 1 1 2 ; 1,1 , 3 2 , 3 2 ; p 4 64 + p 4 144 F 4 1 3 2 ; 2,2 , 5 2 , 5 2 ; p 4 64 F 3 0 ; 3 2 , 1,2 ; p 4 64 ,
where p = 2 κ R , and F n m a 1 , a 2 , a m ; b 1 , b 2 , , b n ; z is the generalized hypergeometric function. This case corresponds to d . The results are presented in Table 4. It follows that the results are identical to those given by Equation (26) for R / d = 0 . It can be shown that Equation (30) is another mathematical form of integral 2 D 0,0 , 0 , which represents the temperature increase due to the skin effect.

3.5. Numerical Examples

Let us consider the same numerical values of parameters as in Section 3.1. They result in the following values of the dimensionless parameters:
  • R / d ratio: 0.195,
  • the skin effect parameter κ R = 1.02 ,
  • the Biot number B i = 0.00019 .
They also result in the DC temperature increase ϑ D C = 50 ° C . Figure 7 presents temperature distributions of wire surfaces calculated via Equation (19). The mean values of the temperatures on surfaces, calculated using exact Equation (26) and approximate Equation (29), are presented in Table 5. Although the differences in temperature on the wires’ surfaces are negligible, there are noticeable differences between the wires, and the temperature rise due to the skin and proximity effect is clearly visible.
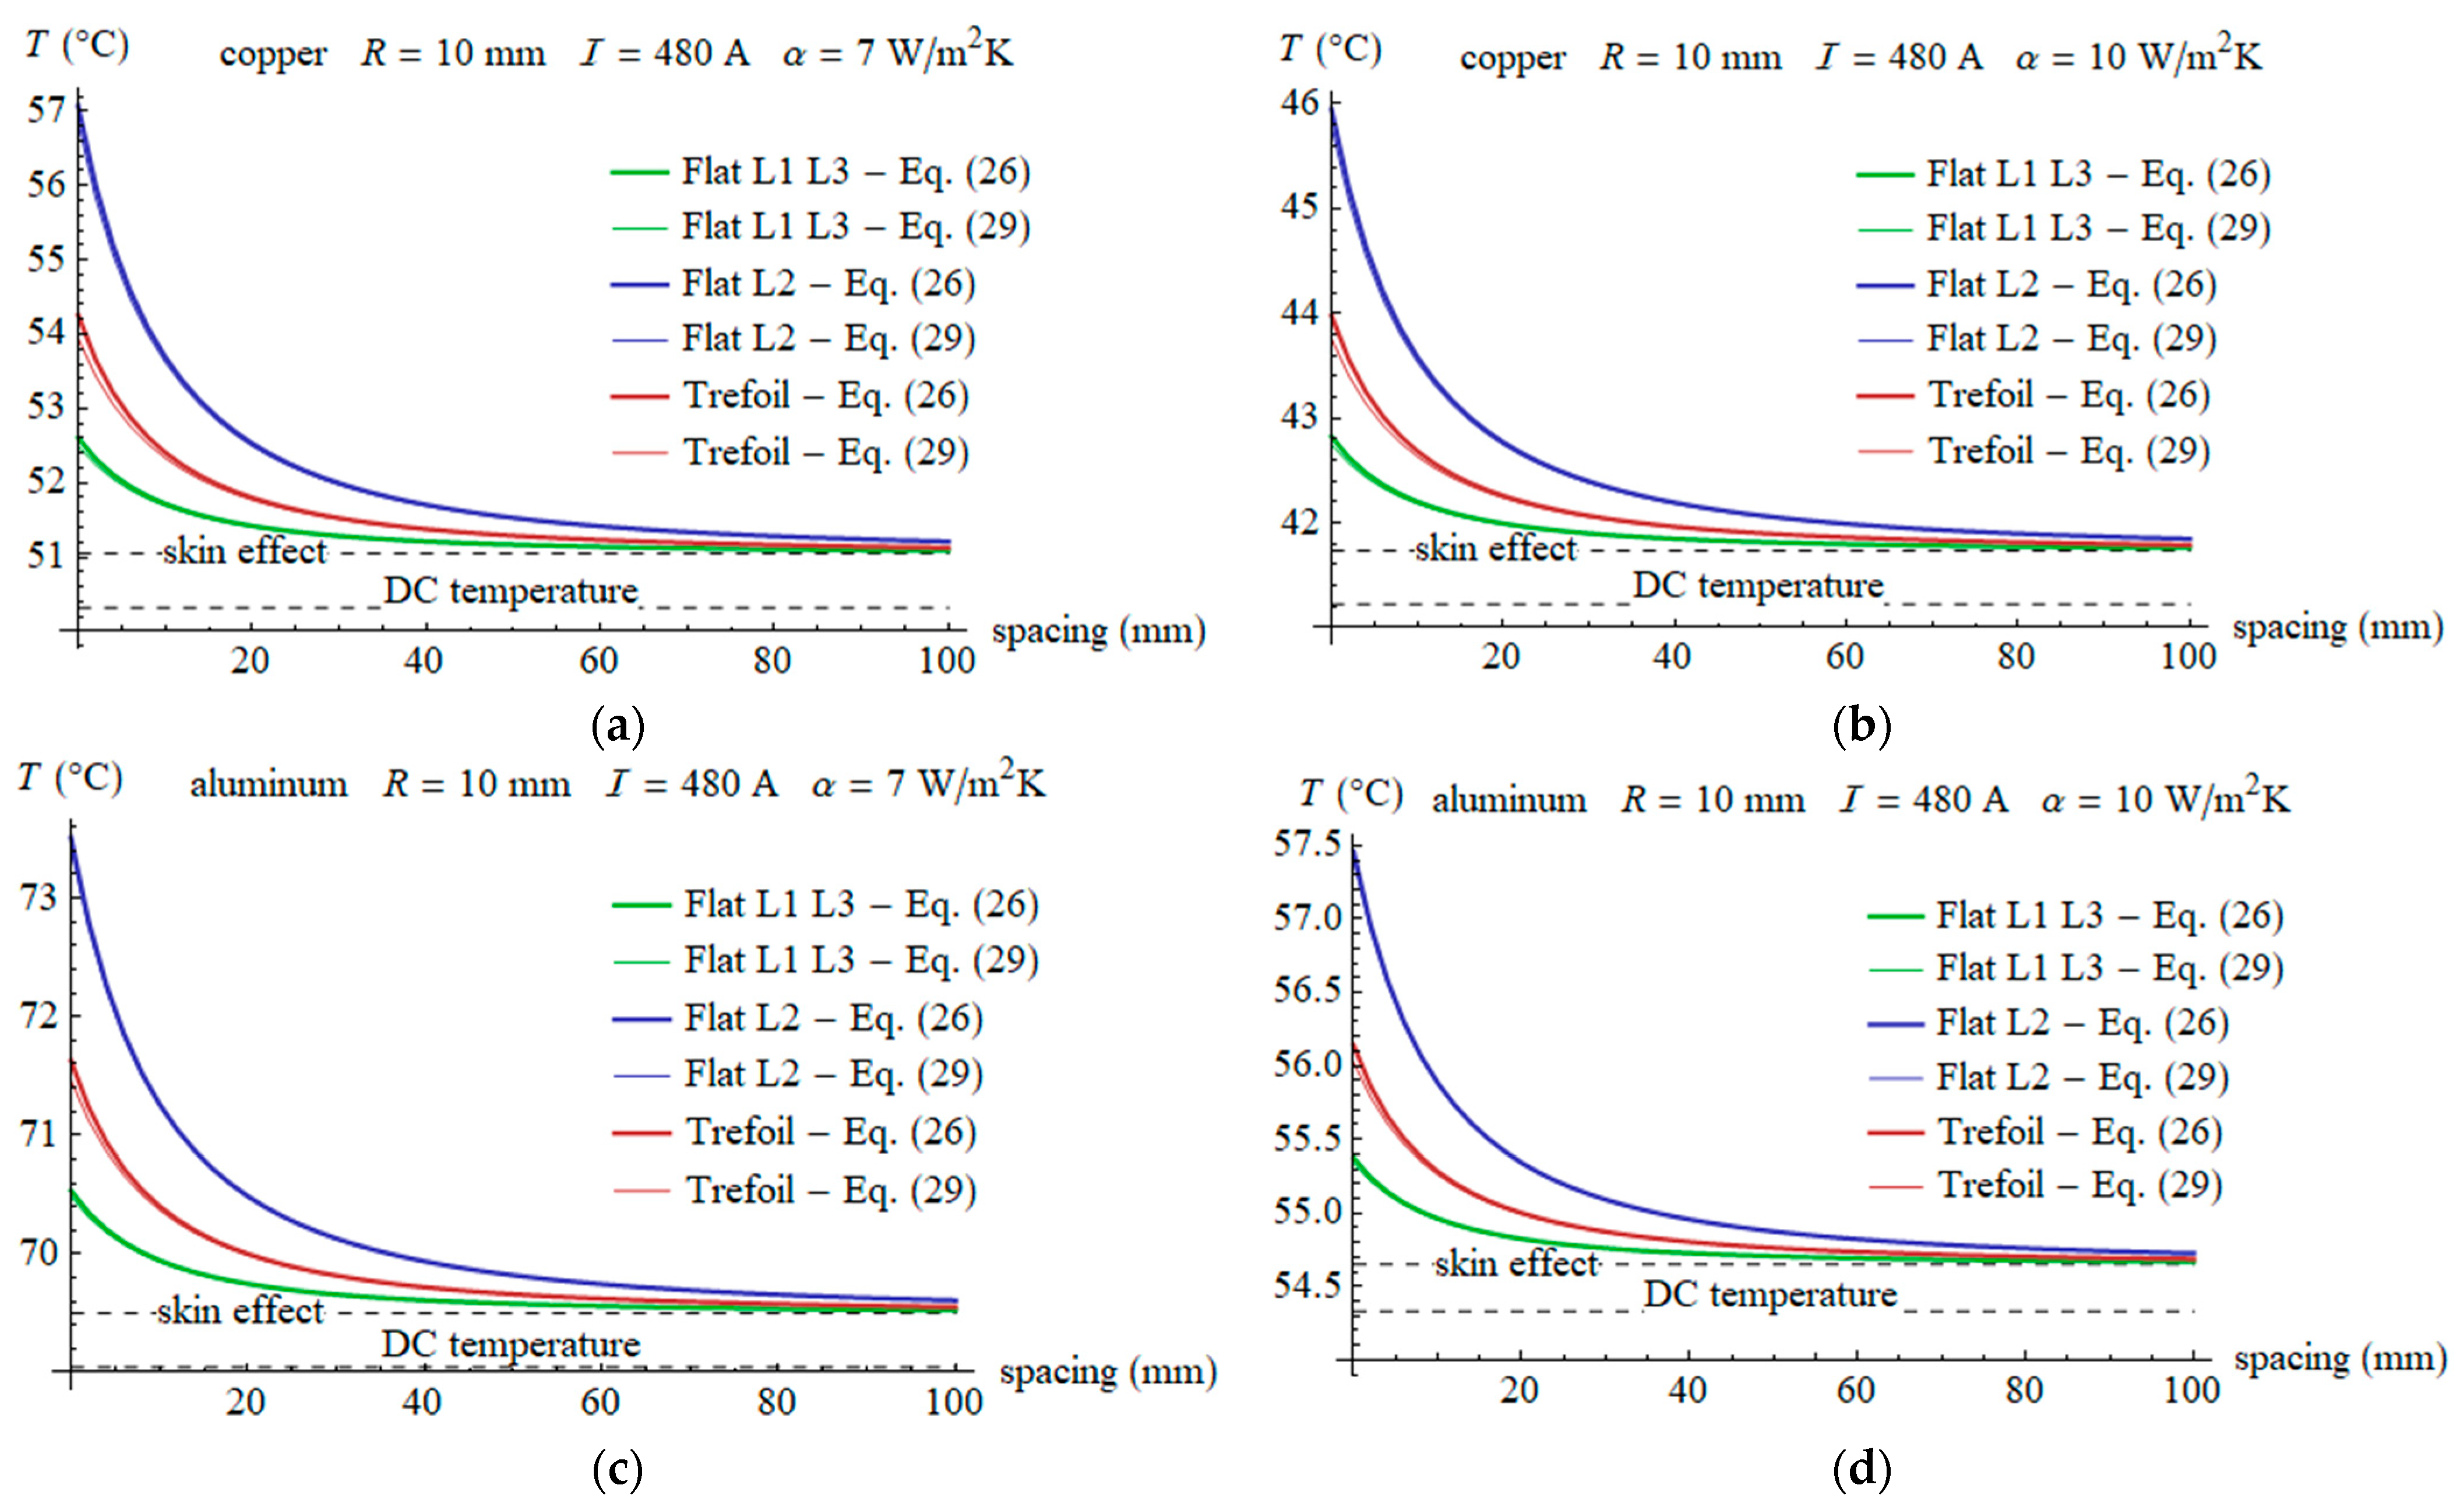
In the next example, the effect of spacing between busbars in a three-phase busduct with round conductors is considered for typical wire materials and heat transfer coefficients. Two typical materials were taken into account: copper ( σ = 55 MS / m , μ r = 1 , λ = 360 W / mK ) and aluminum ( σ = 34 MS / m , μ r = 1 , λ = 237 W / mK ). The wire radius was assumed to be R = 10 mm and the current I = 480 A . The calculations were performed for two typically assumed values for heat transfer coefficients α equal to 7 and 10 W/m2K. The results are presented in Figure 8. The dashed line “skin effect” indicates the temperature increment due to the skin effect only. In the considered cases, it is around 1 °C compared to the DC case. The temperature increment due to the proximity effect reaches several degrees Celsius and strongly depends on the spacing between the wires. When the spacing is above 80 mm, i.e., the distance between the wires’ axes is above 100 mm, which corresponds to R / d ratio below 0.1, the proximity effect can be neglected.

4. Conclusions

An analytical method for determining the temperature distribution in three-phase lines with round conductors arranged in two typical configurations (flat and trefoil) was developed. For this purpose, a two-dimensional equation of heat conduction was solved. The efficiency of the heat sources was related to the current density distribution in the wires, with the skin and proximity effects taken into account. Typical excitation (balanced currents) and cooling conditions (natural convection) were assumed. The corresponding boundary problem was solved using a suitably constructed Green’s function. The obtained expression for temperature is fully analytical and allows for determining the temperature at any point throughout the wires. In general, evaluation of the integral may require numerical calculations; however, the mean surface temperature can be expressed in a compact and useful analytical form. The obtained expressions were used to analyze the impact of individual parameters on the temperature increase. Based on the analysis, the following conclusions can be formulated:
  • The maximum values of the temperature field are shifted towards the highest current densities.
  • Current density changes are significantly greater than temperature changes in the wire cross-sections. From the physical side, this is due to the high thermal conductivity of copper (or aluminum), which causes a significant equalization of the temperature values throughout the wire cross-section.
  • In a flat configuration, the temperature of the central conductor is noticeably higher than that of the adjacent ones. In turn, in the trefoil configuration, all the wires heat up to approximately the same temperature due to symmetry. It is worth noting that the average temperature in both configurations is approximately the same.
  • The temperature increase due to the skin and proximity effects for the skin depth greater than the wire radius can reach around 2% and up to 17% compared to the DC case, respectively. Typically, this may result in an increase of around 1 °C and up to 6 °C, respectively.
  • The results of the calculations performed using the Green’s method and finite element methods are consistent. Numerical examples show that temperature distributions by both methods are very similar, with differences below 0.006 °C, which can be attributed to numerical errors or neglecting the higher order reactions in the expression for current density.
  • The increase in temperature on the conductor surface depends on the busbar arrangement and three dimensionless parameters: radius to skin depth ratio ( κ R ), radius to distance between conductors’ axes ratio ( R / d ), and the Biot number Bi related to heat transfer conditions; however, the mean temperature increase on the conductor surface is independent of the Biot number.
  • In typical excitation conditions (symmetrical currents, skin depth greater than wire radius) and cooling conditions (natural convection), the differences in temperature across the conductors’ cross-sections are negligible, whereas the differences between individual wires are clearly noticeable.
  • For a skin depth greater than or equal to the wire radius, the temperature increase can be evaluated using the derived approximate formula with an error below 1%.
  • The proximity effect can be neglected if the skin depth is greater than the wire radius and the distance between the conductors’ axes is greater than ten wire radii.
It is worth noting that the above results were obtained for naked round wires carrying symmetrical three-phase currents of a positive sequence. In future research, more realistic situations will be considered, like insulated wires or distorted currents.

Author Contributions

Conceptualization, P.J., M.Z., T.S. and J.G.; methodology, P.J., M.Z. and J.G.; software, P.J. and M.Z.; validation, J.G.; formal analysis, P.J., M.Z. and T.S.; investigation, M.Z. and T.S.; resources, T.S.; writing—original draft preparation, P.J. and M.Z.; writing—review and editing, T.S. and J.G.; visualization, P.J. and M.Z.; supervision, P.J.; project administration, M.Z.; funding acquisition, P.J. and T.S. All authors have read and agreed to the published version of the manuscript.

Funding

This research was financially supported by the Faculty of Electrical Engineering of the Częstochowa University of Technology and the Faculty of Electrical Engineering of the Technical University of Białystok. This research received no external funding. The APC was partially funded by the Częstochowa University of Technology (BS/PB-3-300-3011/2024/P).

Data Availability Statement

The raw data supporting the conclusions of this article will be made available by the authors on request.

Conflicts of Interest

The authors declare no conflicts of interest.

Nomenclature

A n i coefficients related to wire arrangement and currents,
a operator of complex rotation by 120°, = e j 120 ° ,
B i Biot number,
B p coefficients of temperature distribution,
C i , m n , n , p function related to integration over angular coordinate,
c n i coefficients related to wire arrangements,
D m n , n , p coefficients related to integration over radial coordinate,
d distance between the wires, m,
f frequency of currents, Hz,
G Green’s function for the temperature in round wire,
g heat source density, W/m3,
I current root mean square value, A,
I n z modified Bessel function of the first kind of order n ,
I z imaginary part of z ,
J current density modulus, A/m2,
j imaginary unit, = 1 ,
M n i coefficients related to the proximity effect,
R wire radius, m,
r radial coordinate in cylindrical coordinates, m,
s n i coefficients related to wire arrangements,
T temperature, °C,
T 0 ambient temperature, °C,
z * conjugate of z ,
α heat transfer coefficient between wires and the surrounding medium, W/Km2,
Γ electromagnetic field penetration coefficient, 1/m,
γ dimensionless coefficient of electromagnetic field penetration,
δ x Dirac delta,
δ p Kronecker delta,
θ angular coordinate,
ϑ temperature increase above ambient temperature, °C,
ϑ D C temperature increase for DC (uniform) current density distribution, °C,
ϑ ¯ S mean temperature increase on wire surface, °C,
κ skin depth parameter equal to skin depth reciprocal, 1/m,
λ thermal conductivity, W/mK,
μ magnetic permeability of wire material, H/m,
μ 0 magnetic permeability of vacuum, = 4 π 10 7 H/m,
μ r relative magnetic permeability of wire material,
ξ radial coordinate, m,
ρ normalized dimensionless radial coordinate,
σ electrical conductivity of wire material, S/m,
φ angular coordinate in cylindrical coordinates,
ω angular frequency of current, rad/s.

Appendix A. Coefficients C i , m n , n , p and D m n , n , p

Coefficient C i , m n , n , p is given by Equation (21). Using Equation (23) leads us to the following expression:
C i , m n , n , p φ = c m n , i c n i * T c c + c m n , i s n i * T c s + s m n , i c n i * T s c + s m n , i s n i * T s s ,
where
T c c = 1 π 0 2 π cos m n θ cos n θ cos p φ θ d θ ,
T c s = 1 π 0 2 π cos m n θ sin n θ cos p φ θ d θ ,
T s c = 1 π 0 2 π sin m n θ cos n θ cos p φ θ d θ ,
T s s = 1 π 0 2 π sin m n θ sin n θ cos p φ θ d θ .
Let us focus on T c c . By elementary trigonometrical relationships, the integrand can be expressed as follows:
1 4 cos m 2 n p θ + p φ + cos m 2 n + p θ p φ + cos m p θ + p φ + cos m + p θ p φ .
Now, it can be easily integrated. The elementary result,
0 2 π cos k θ + p φ d θ = 0 f o r k = ± 1 , ± 2 , ± 3 , 2 π cos p φ f o r k = 0
can be rewritten briefly as 2 π δ k , 0 cos p φ , where δ k , 0 is the Kronecker delta. For further brevity, the second subscript in δ k , 0 will be dropped when equal to 0 ( δ k may be understood as discrete Dirac delta—it is equal to 1 for k = 0 and 0 for the other integer k ). Hence, it follows that
T c c = 1 2 δ m 2 n p + δ m 2 n + p + δ m p + δ m + p cos p φ .
The integrals represented by T c s , T s c and T s s are calculated in the same manner. As a result, the following formula is obtained:
C i , m n , n , p φ = c m n , i c n i * 2 δ m 2 n p + δ m 2 n + p + δ m p + δ m + p cos p φ + s m n , i s n i * 2 δ m 2 n p + δ m 2 n + p δ m p δ m + p cos p φ + c m n , i s n i * 2 δ m 2 n p + δ m 2 n + p + δ m p δ m + p sin p φ + s m n , i c n i * 2 δ m 2 n p δ m 2 n + p + δ m p δ m + p sin p φ .
As for integral D m n , n , p , Equation (22) yields
D m n , n , p = 1 4 γ γ * I m n 1 γ I n 1 γ * I m n , n , p ,
where
I m n , n , p = 0 1 I m n γ ρ I n γ * ρ ρ p + 1 d ρ .
Unfortunately, there is no closed formula for this integral for arbitrary m , n and p . One important exception is the case m n = n and p = 0 . In such a situation, ref. [40] yields
I n a x I n b x x d x = x a I n b x I n + 1 a x b I n a x I n + 1 b x a 2 b 2
so that after some transformations, it follows that
I n , n , 0 = I γ I n γ * I n + 1 γ I γ 2 .
In general, however, the integral I m n , n , p has to be calculated either numerically or by expansion into power series. Tests performed with the two approaches showed that the second approach is reasonable, because the calculations are much quicker. Additionally, the result is analytical. The main points of the derivation are presented below.
Using a series expansion of function I n z [37],
I n z = k = 0 1 k ! k + n ! z 2 2 k + n
allows the integral to be rewritten as follows:
I m n , n , p = k = 0 l = 0 k γ 2 2 k l + m n k l ! k l + m n ! γ * 2 2 l + n l ! l + n ! 0 1 ρ 2 k l + m n + 2 l + n + p + 1 d ρ .
The integral with respect to ρ yields
0 1 ρ 2 k l + m n + 2 l + n + p + 1 d ρ = 1 2 k + m + p + 2 .
Using symbols defined in Equation (2), it follows that
γ 2 2 k l + m n γ * 2 2 l + n = 2 κ R 2 2 k + m e j π 4 2 k 4 l + m 2 n
so that the final formula for I m n , n , p takes the following form:
I m n , n , p = e j π 4 m 2 n κ R 2 m k = 0 j k κ R 2 k 2 k 2 k + m + p + 2 l = 0 k 1 l k l ! k l + m n ! l ! l + n ! .
This approach was implemented in adaptive form to obtain the relative error below a presumed value. The series is quickly converging, so that for κ R 5 it is enough to take a maximum of 15 terms of the lowest order to obtain the relative error below 10 6 .

References

  1. Popović, Z.; Popović, B.D. Introductory Electromagnetics; Prentice Hall: Upper Saddle River, NJ, USA, 2000. [Google Scholar]
  2. Lehner, G. Electromagnetic Field Theory; Springer: Berlin/Heidelberg, Germany, 2010. [Google Scholar]
  3. Chatzipetros, J.; Pilgrim, A. Impact of Proximity Effects on Sheath Losses in Trefoil Cable Arrangements. IEEE Trans. Power Deliv. 2020, 35, 455–463. [Google Scholar] [CrossRef]
  4. IEC 60287-1-1; Electric Cables—Calculation of the Current Rating—Part 1-1: Current Rating Equations (100% Load Factor) and Calculation of Losses—General. IEC: Geneva, Switzerland, 2014.
  5. Shazly, J.H.; Mostafa, A.M.; Ibrahim, D.K.; Abo El Zahab, E.E. Thermal analysis of high-voltage cables with several types of insulation for different configuration in the presence of harmonics. IET Gener. Transm. Distrib. 2017, 11, 3439–3448. [Google Scholar] [CrossRef]
  6. Wang, Z.; Zhong, J.; Jiang, J.; He, Y.; Wang, Z.; Zhang, H. Development of temperature rise simulation APP for three-phase common enclosure GIS/GIL. In Proceedings of the 5th IEEE Conference on Energy Internet and Energy System Integration, Taiyuan, China, 22–25 October 2021. [Google Scholar]
  7. Li, S.; Han, Y.; Liu, C. Coupled multiphysics field analysis of high-current irregular-shaped busbar. IEEE Trans. Compon. Packag. Manuf. Technol. 2019, 9, 1805–1814. [Google Scholar] [CrossRef]
  8. Save, Y.D.; Narayanan, H.; Patkar, S.B. Solution of partial differential equations by electrical analogy. J. Comput. Sci. 2011, 2, 18–30. [Google Scholar] [CrossRef]
  9. Smirnova, L.; Juntunen, R.; Murashko, K.; Musikka, T.; Pyrhönen, J. Thermal analysis of the laminated busbar system of a multilevel converter. IEEE Trans. Power Electron. 2016, 31, 1479–1488. [Google Scholar] [CrossRef]
  10. Hu, J.; Xiong, X.; Chen, J.; Wang, J. Transient temperature calculation and multi-parameter thermal protection of overhead transmission lines based on an equivalent thermal network. Energies 2019, 12, 67. [Google Scholar] [CrossRef]
  11. Anders, G.J. Rating of Electric Power Cables: Ampacity Computations for Transmission, Distribution and Industrial Application; McGraw-Hill Professional: Columbus, OH, USA, 1997. [Google Scholar]
  12. Baker, A.; De León, F. Equivalent circuit for the thermal analysis of cables in non-vented vertical risers. IET Sci. Meas. Technol. 2015, 9, 606–614. [Google Scholar] [CrossRef]
  13. Enescu, D.; Colella, P.; Russo, A. Thermal Assessment of Power Cables and Impacts on Cable Current Rating: An Overview. Energies 2020, 13, 5319. [Google Scholar] [CrossRef]
  14. Henke, A.; Frei, S. Fast analytical approaches for the transient axial temperature distribution in single wire cables. IEEE Trans. Ind. Electron. 2022, 69, 4158–4416. [Google Scholar] [CrossRef]
  15. Ducluzaux, A. Extra Losses Caused in High Current Conductors by Skin and Proximity Effects; Cahier Technique no. 83; Technical Report; Schneider Electric: Rueil-Malmaison, France, 2002. [Google Scholar]
  16. Morgan, V.T. The current distribution, resistance and internal inductance of linear power system conductors—A review of explicit equations. IEEE Trans. Power Deliv. 2013, 38, 1252–1262. [Google Scholar] [CrossRef]
  17. Rolicz, P. Temperature and stresses in cylindrical conductor with an alternating current. J. Appl. Phys. 1978, 49, 4363–4365. [Google Scholar] [CrossRef]
  18. Moon, P.; Spencer, D.E. Field Theory Handbook; Springer-Verlag: New York, NY, USA, 1988. [Google Scholar]
  19. Plesca, A. Thermal Analysis of Busbars from a High Current Power Supply System. Energies 2019, 12, 2288. [Google Scholar] [CrossRef]
  20. Barka, A.; Bernard, J.J.; Benyoucef, B. Thermal behavior of a conductor submitted to skin effect. Appl. Therm. Eng. 2003, 23, 1261–1274. [Google Scholar] [CrossRef]
  21. Zaręba, M.; Gołębiowski, J. The thermal characteristics of ACCR lines as a function of wind speed—An analytical approach. Bull. Pol. Acad. Sci. Tech. Sci. 2022, 70, e141006. [Google Scholar] [CrossRef]
  22. Gołębiowski, J.; Zaręba, M. Transient Thermal Field Analysis in ACCC Power Lines by the Green’s Function Method. Energies 2020, 13, 280. [Google Scholar] [CrossRef]
  23. Gołębiowski, J.; Zaręba, M. Analysis of the influence of current frequency on the thermal field of the insulated busbar. Bull. Pol. Acad. Sci. Tech. Sci. 2020, 68, 89–97. [Google Scholar] [CrossRef]
  24. Machado, V.M.; Pedro, M.E.; Brandão Faria, J.A.; Van Dommelen, D. Magnetic field analysis of three-conductor bundles in flat and triangular configurations with the inclusion of proximity and skin effects. Electr. Power Syst. Res. 2011, 81, 2005–2014. [Google Scholar] [CrossRef]
  25. Jabłoński, P.; Szczegielniak, T.; Kusiak, D.; Piątek, Z. Analytical–Numerical Solution for the Skin and Proximity Effects in Two Parallel Round Conductors. Energies 2019, 12, 3584. [Google Scholar] [CrossRef]
  26. Griffiths, D.J. Introduction to Electrodynamics; Cambridge University Press: Cambridge, UK, 2023. [Google Scholar]
  27. Greenberg, M.D. Advanced Engineering Mathematics; Prentice Hall: Hoboken, NJ, USA, 1988. [Google Scholar]
  28. Jabłoński, P.; Kusiak, D.; Szczegielniak, T. Analytical-Numerical Approach to the Skin and Proximity Effect in Lines with Round Parallel Wires. Energies 2020, 13, 6716. [Google Scholar] [CrossRef]
  29. Dlabač, T.; Filipović, D. Proximity effect in a shielded symmetrical three-phase line. Serbian J. Electr. Eng. 2014, 11, 585–596. [Google Scholar]
  30. Latif, M.J. Heat Conduction; Springer: Berlin/Heidelberg, Germany, 2009. [Google Scholar]
  31. Hahn, D.W.; Ozisik, M.N. Heat Conduction; John Wiley & Sons: Hoboken, NJ, USA, 2012. [Google Scholar]
  32. Bergman, T.L.; Lavine, A.S.; Incropera, F.P.; Dewitt, D.P. Fundamentals of Heat and Mass Transfer; John Wiley and Sons: Hoboken, NJ, USA, 2011. [Google Scholar]
  33. Cole, K.D.; Beck, J.V.; Haji-Sheikh, A.; Litkouhi, B. Heat Conduction Using Green’s Functions; CRC Press: Boca Raton, FL, USA, 2011. [Google Scholar]
  34. Greenberg, M.D. Applications of Green’s Functions in Science and Engineering; Dover Publications: Mineola, NY, USA, 2015. [Google Scholar]
  35. Duffy, D.G. Green’s Functions with Applications; CRC Press: Boca Raton, FL, USA, 2015. [Google Scholar]
  36. Zaręba, M.; Szczegielniak, T.; Jabłoński, P. Influence of the Skin and Proximity Effects on the Thermal Field in a System of Two Parallel Round Conductors. Energies 2023, 16, 6341. [Google Scholar] [CrossRef]
  37. Abramowitz, A.; Stegun, I.A. Handbook of Mathematical Functions with Formulas, Graphs, and Mathematical Tables; Dover Publications, Inc.: New York, NY, USA, 1972. [Google Scholar]
  38. Wolfram Research Inc. Mathematica; Wolfram Research Inc.: Champaign, IL, USA, 2020. [Google Scholar]
  39. COMSOL Multiphysics, version 6.2; Reference Manual Release 6.2; COMSOL: Stockholm, Sweden, 2023.
  40. Gradshteyn, I.S.; Ryzhik, I.M. Tables of Integrals, Sums, Series and Products, 17th ed.; Elsevier Academic Press: Cambridge, MA, USA, 2007. [Google Scholar]
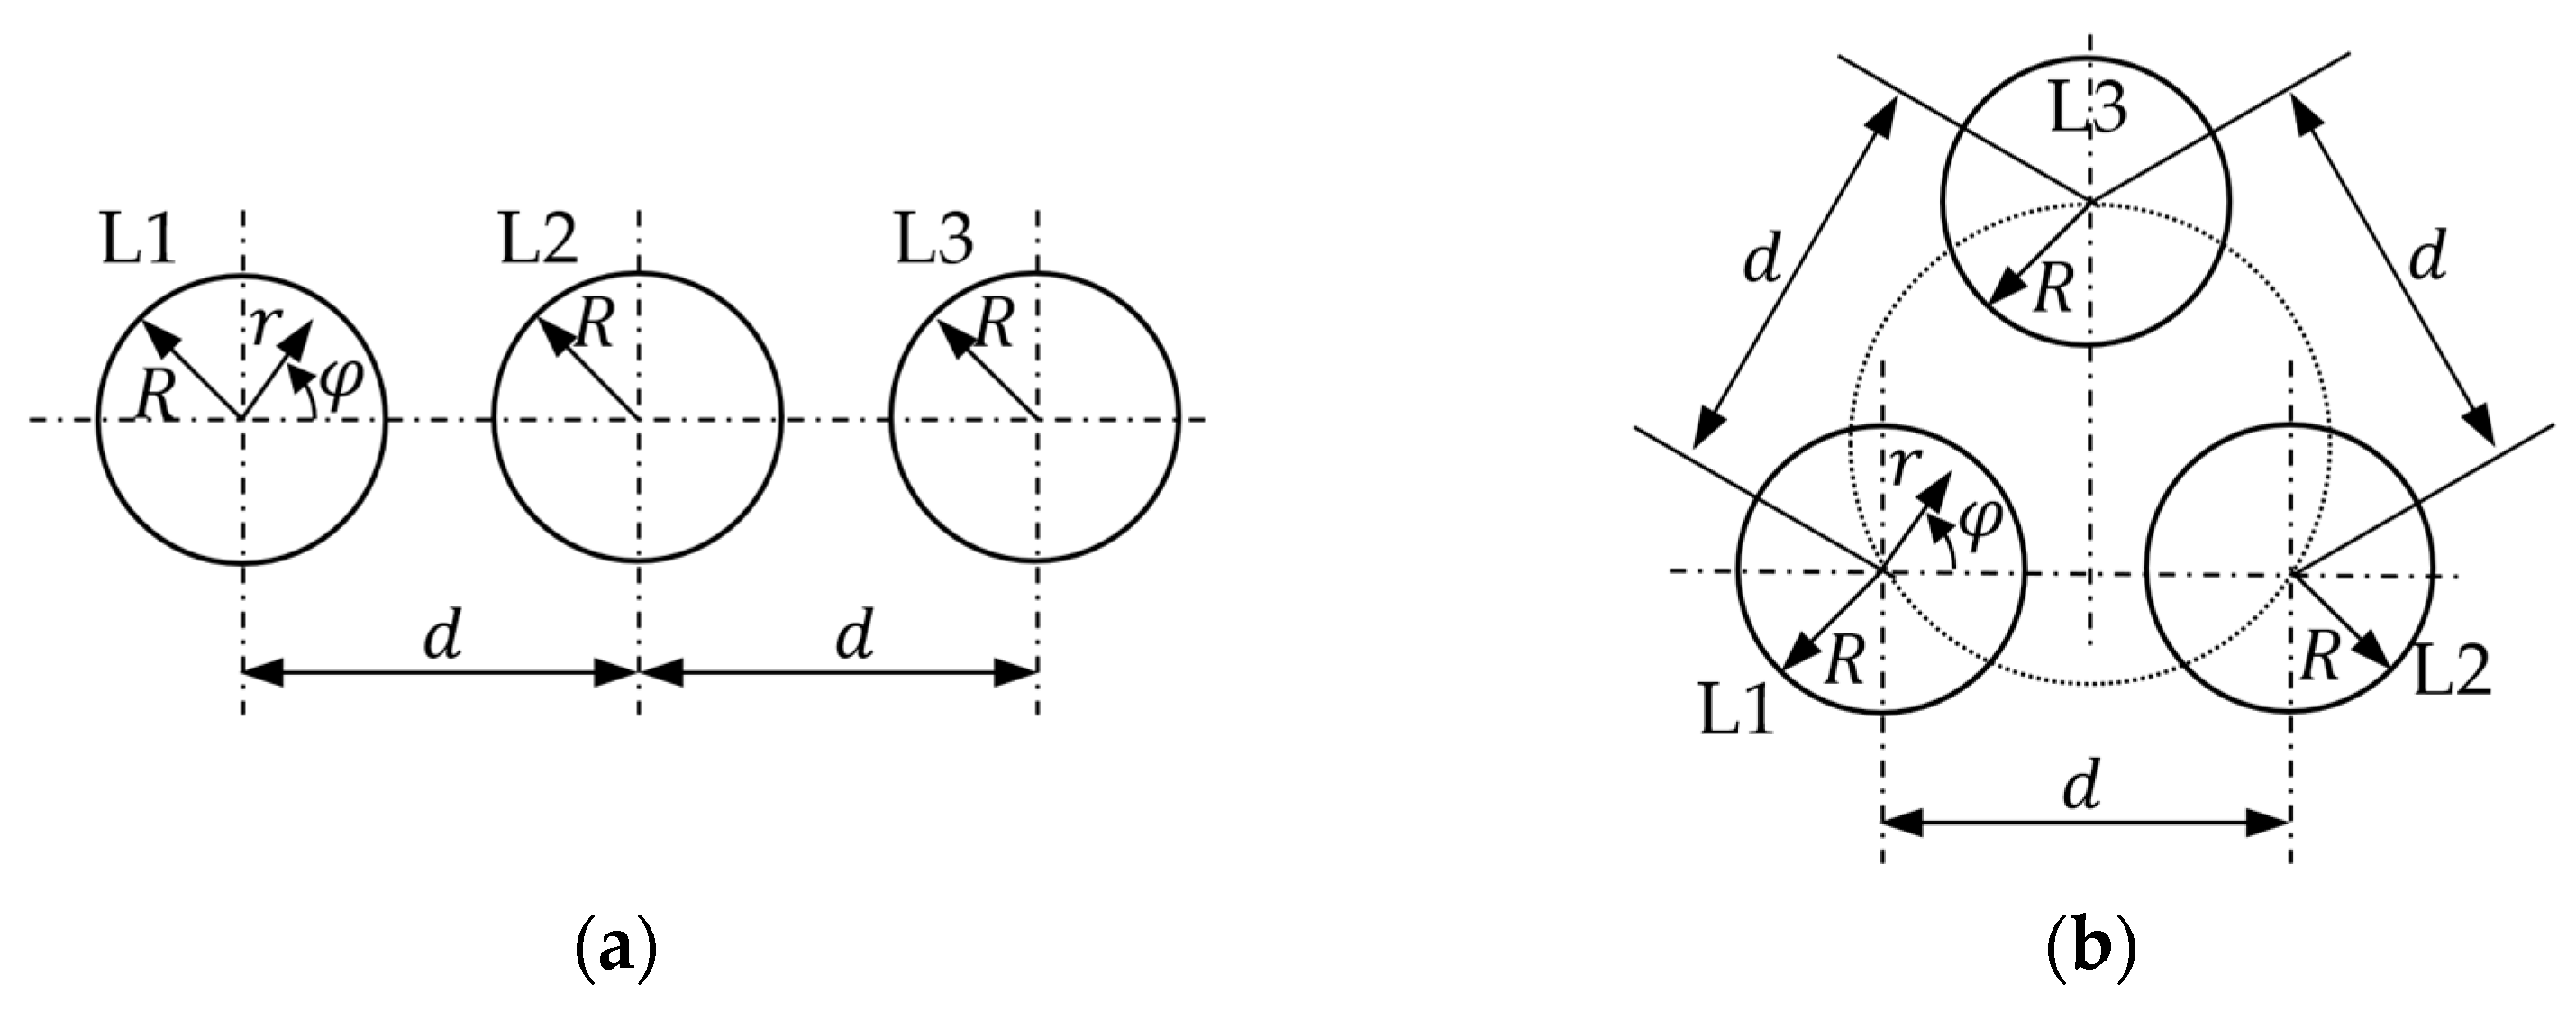
Figure 1. Considered three-phase arrangements: (a) flat, (b) trefoil.
Energies 17 01713 g001
Figure 2. Current density modulus distribution in flat (a) and trefoil (b) configurations ( I 595 A , f = 50 Hz , σ = 55 MS / m , μ r = 1 , R = 9.77 mm , d = 50 mm , values of current density in A/mm2, distance not to scale).
Energies 17 01713 g002
Figure 3. Temperature distributions ( R = 9.77 mm , d = 50 mm , I 595 A ,   f = 50 Hz , σ = 55 MS / m , μ r = 1 , λ = 360 W / mK , α = 7 W / m 2 K , ambient temperature 20 °C, values of temperature in °C, distance not to scale): (a) flat configuration—Equation (13), (b) flat configuration—COMSOL, (c) trefoil configuration—Equation (13).
Energies 17 01713 g003
Figure 4. Relative temperature increase ϑ S / ϑ DC on wire surfaces in the flat configuration as a function of angular coordinate for exemplary parameters given in the right top corner of the plot: (a) weak skin effect, closely spaced wires, small Biot number; (b) the impact of skin effect strength; (c) the effect of distance between of wires; (d) the effect of Biot number.
Energies 17 01713 g004
Figure 5. Relative temperature increase ϑ S / ϑ DC on wire surfaces in the trefoil configuration as a function of angular coordinate for exemplary parameters given in the right top corner of the plot: (a) weak skin effect, closely spaced wires, small Biot number; (b) the impact of skin effect strength; (c) the effect of distance between of wires; (d) the effect of Biot number.
Energies 17 01713 g005
Figure 6. The effect of κ R and R / d on the mean surface temperature increment ϑ ¯ S of individual wires: (a) left and right wires in flat configuration, (b) middle wire in flat configuration, (c) all wires in trefoil configuration, (d) the effect of R / d for κ R = 1 (thick lines—exact Equation (26), thin lines—approximation Equation (29)).
Energies 17 01713 g006
Figure 7. Theoretical temperature distributions for the considered parameters: (a) L1 and L3 conductors in flat configuration, (b) L2 conductor in flat configuration, (c) trefoil configuration.
Energies 17 01713 g007
Figure 8. Mean surface temperature vs. spacing between the wires (equal to d 2 R ) for typical cases; the following parameters were assumed: R = 10 mm , I = 480 A , f = 50 Hz , ambient temperature T 0 = 20 °C; DC temperature level and the skin effect temperature are shown; bold traces correspond to exact theoretical values via Equation (26); thin traces—approximate values via Equation (29); (a) copper busbars, α = 7 W / m 2 K ; (b) copper busbars, α = 10 W / m 2 K ; (c) aluminum busbars, α = 7 W / m 2 K ; (d) aluminum busbars, α = 10 W / m 2 K .
Energies 17 01713 g008
Table 1. Cosine and sine coefficients in A n i for flat and trefoil configurations.
n , i FlatTrefoil
c n i s n i c n i s n i
n = 0 1010
n > 0 , i = 1 2 a 2 n + a 0 2 a a + cos n π 3 2 a sin n π 3
n > 0 , i = 2 2 a 1 n + a 0 2 a 1 n + a cos 2 n π 3 2 a 2 sin 2 n π 3
n > 0 , i = 3 2 a 2 1 n 2 n + a 2 0 2 a cos n π 3 + a cos 2 n π 3 2 a sin n π 3 + a sin 2 n π 3
Table 2. Coefficients M n i for wires in flat and trefoil configurations for 0 n 10 .
n 012345678910
Left/right flat133.253.56253.76563.87893.93853.96903.98443.99223.9961
Middle flat1124124124124124
Trefoil16101210646101210
Table 3. Comparison of the results at selected points of flat configuration (numerical values of parameters, as in Figure 3).
PhasePointTemperature, °C T T F E M , °C T T F E M T F E M 100 %
Equation (13)FEM
L1 ( 0 , 0 ) 71.45071.4450.00480.0067
( R , 0 ) 71.44571.4410.00480.0067
R , 90 ° 71.44571.4410.00470.0066
L2 ( 0 , 0 ) 72.48072.4740.00560.0077
( R , 0 ) 72.47272.4660.00560.0077
R , 90 ° 72.47572.4690.00560.0077
L3 ( 0 , 0 ) 71.45071.4450.00480.0067
( R , 0 ) 71.44471.4400.00470.0066
R , 90 ° 71.44571.4410.00480.0067
Table 4. Comparison of the relative temperature increase ϑ S / ϑ D C on wire surface for d (skin effect only).
κ R 012345
ϑ S ϑ D C [20]—Equation (30)1.00001.02051.26471.76812.27382.7681
This work—Equation (26)1.00001.02051.26471.76812.27382.7681
Table 5. Temperature on the wire surface for parameters, as in Section 3.1.
PhaseTemperature on Wire Surface, °C
MinMaxMean—Equation (26)Mean—Equation (29)Range
Distance between the wires’ axes d = 50 m m
Flat L171.44471.44471.44471.436<0.001
Flat L272.47072.47672.47372.4480.006
Flat L371.44371.44571.44471.4360.003
Trefoil71.79171.79471.79271.7730.003
Distance between the wires’ axes d = 30 m m
Flat L172.07272.07272.07272.036<0.001
Flat L274.93174.94174.93574.8480.010
Flat L372.07072.07472.07272.0360.005
Trefoil73.06573.07173.06872.9730.006
Disclaimer/Publisher’s Note: The statements, opinions and data contained in all publications are solely those of the individual author(s) and contributor(s) and not of MDPI and/or the editor(s). MDPI and/or the editor(s) disclaim responsibility for any injury to people or property resulting from any ideas, methods, instructions or products referred to in the content.