Article

Geochemical Properties and Gas-Bearing Analysis of Lower Cambrian Black Shale in Western Hunan Province

1
Institute of Geomechanics, Chinese Academy of Geological Sciences, Beijing 100081, China
2
Key Laboratory of Petroleum Geomechanics, China Geological Survey, Beijing 100081, China
3
College of Petroleum, China University of Petroleum (Beijing) at Karamay, Karamay 834000, China
4
College of Geosciences, China University of Petroleum, Beijing 102249, China
*
Author to whom correspondence should be addressed.
Energies 2024, 17(7), 1743; https://doi.org/10.3390/en17071743
Submission received: 18 November 2023 / Revised: 21 January 2024 / Accepted: 24 January 2024 / Published: 4 April 2024

Abstract

:
Western Hunan province and its surrounding areas are significant targets for shale gas exploration and development in southern China, where the black shale of the lower Cambrian Niutitang Formation and Wunitang Formation is extensively distributed. Geochemical analysis was conducted on the lower Cambrian black shale from a new exploration well of XAD1 located at the southeast margin of the Yangtze paraplatform, followed by a discussion on gas-bearing properties using molecular dynamics simulation. The geochemical characteristics indicate that the black shale in well XAD1 was primarily deposited in a strongly reducing marine environment, with organic matter predominantly composed of type I kerogen derived from algae. Currently, it has reached a stage of high to over maturity with limited potential for liquid hydrocarbon generation. The recovery of the original hydrocarbon generation potential shows that they are excellent source rocks and have completed the main hydrocarbon generation evolution. Despite the favorable conditions for shale gas formation observed in well XAD1, the low measured gas content within the Niutitang Formation suggests that other geological factors may have contributed to a substantial loss of shale gas. Gas adsorption simulation reveals that the maximum methane adsorption capacity (15.77 m3/t) was achieved by Niutitang shale during the late Silurian period when there was an abundant source of natural gas without any influence from CO2, H2O or other molecules. However, due to a lack of natural gas replenishment and subsequent tectonic uplift and subsidence causing variations in temperature and pressure, the methane adsorption capacity gradually decreased (to 6.56 m3/t). Furthermore, water occurrence within the shale reservoir further reduced the methane adsorption capacity (below 2 m3/t), while tectonic activities exacerbated the loss of shale gas potential within this study area. The findings indicate that the dynamic alteration of gas-bearing properties in shale reservoirs due to tectonic movements is a crucial factor influencing the success rate of shale gas exploration in the study area, provided that there are sufficient gas resources and superior reservoir conditions.

1. Introduction

During the Cambrian period, a marine sedimentary system was established on the Yangtze craton in southern China, resulting in stacked assemblages of source, reservoir and cap rocks [1,2]. The craton margin exhibits heterogeneity in oil and gas distribution due to multiple tectonic events affecting different structural units [3]. The gas field was discovered at Weiyuan in the Sichuan Basin in the 1960s; after that, no discovery was made in the following 60 years. However, the discovery of the Anyue world-class gas field in the Sinian–Cambrian Formation at the ancient uplift in Central Sichuan changed this situation [4,5]. Ref. [6] studied the paleo-sedimentary environment of early Cambrian black rocks of the Niutitang Formation based on the outcrop and discussed the relationship between TOC content and clay content. Previous studies also evaluated shale gas potential based on hydrocarbon generation potential and fracability characteristics [7,8]. These studies confirmed the global exploration potential of marine sedimentary basins in the southern basin and reviewed complex gas geological conditions. However, the lower Cambrian marine, highly mature shale in southern China is commonly damaged by strong structural deformations in the later stage, which is a dynamic process. Thus, how the evolution of temperature and pressure caused by tectonic movement control the enrichment of shale gas still needs further study.
Molecular dynamic simulation is a valid method for studying methane adsorption. Previous studies have simulated the adsorption capacity of methane by clay minerals and kerogen using molecular dynamic models [9,10,11,12,13]. These studies have shown that methane in shale is mainly adsorbed on the illite of clay minerals before adsorption to kerogen. Under the same temperature and pore pressure, the adsorption capacity varies in the following order: illite > montmorillonite > kaolinite. The adsorption capacity of clay minerals for CH4 increases with the increase in pore pressure. In addition, parameters such as organic matter content, kerogen structure, specific surface area, mineral type, organic matter type and maturity also affect methane adsorption. The adsorption amount of methane increases with specific surface areas of kerogen. The effect of kerogen on methane adsorption capacity is as follows: type Ⅰ > type Ⅱ > type Ⅲ kerogen. Although the adsorption capacities of clay minerals and kerogen for methane have been previously discussed, there is a dearth of simulation studies investigating the accumulation mechanisms underlying natural gas adsorption under actual geological conditions.
In this study, the geochemical properties of lower Cambrian source rocks in Western Hunan were systematically analyzed based on data from a new exploratory well to confirm their hydrocarbon generation potential. Subsequently, in utilizing reconstructed burial history, the temperatures, pressures, and petroleum generation histories of the formations were reconstructed. Based on this knowledge, a molecular dynamic simulation was carried out for the ternary system of kerogen, clay mineral and methane under constrained conditions of temperature and pressure to simulate the enrichment process of methane in black shale reservoirs and provide guidance for shale gas explorations in lower Cambrian black shales.

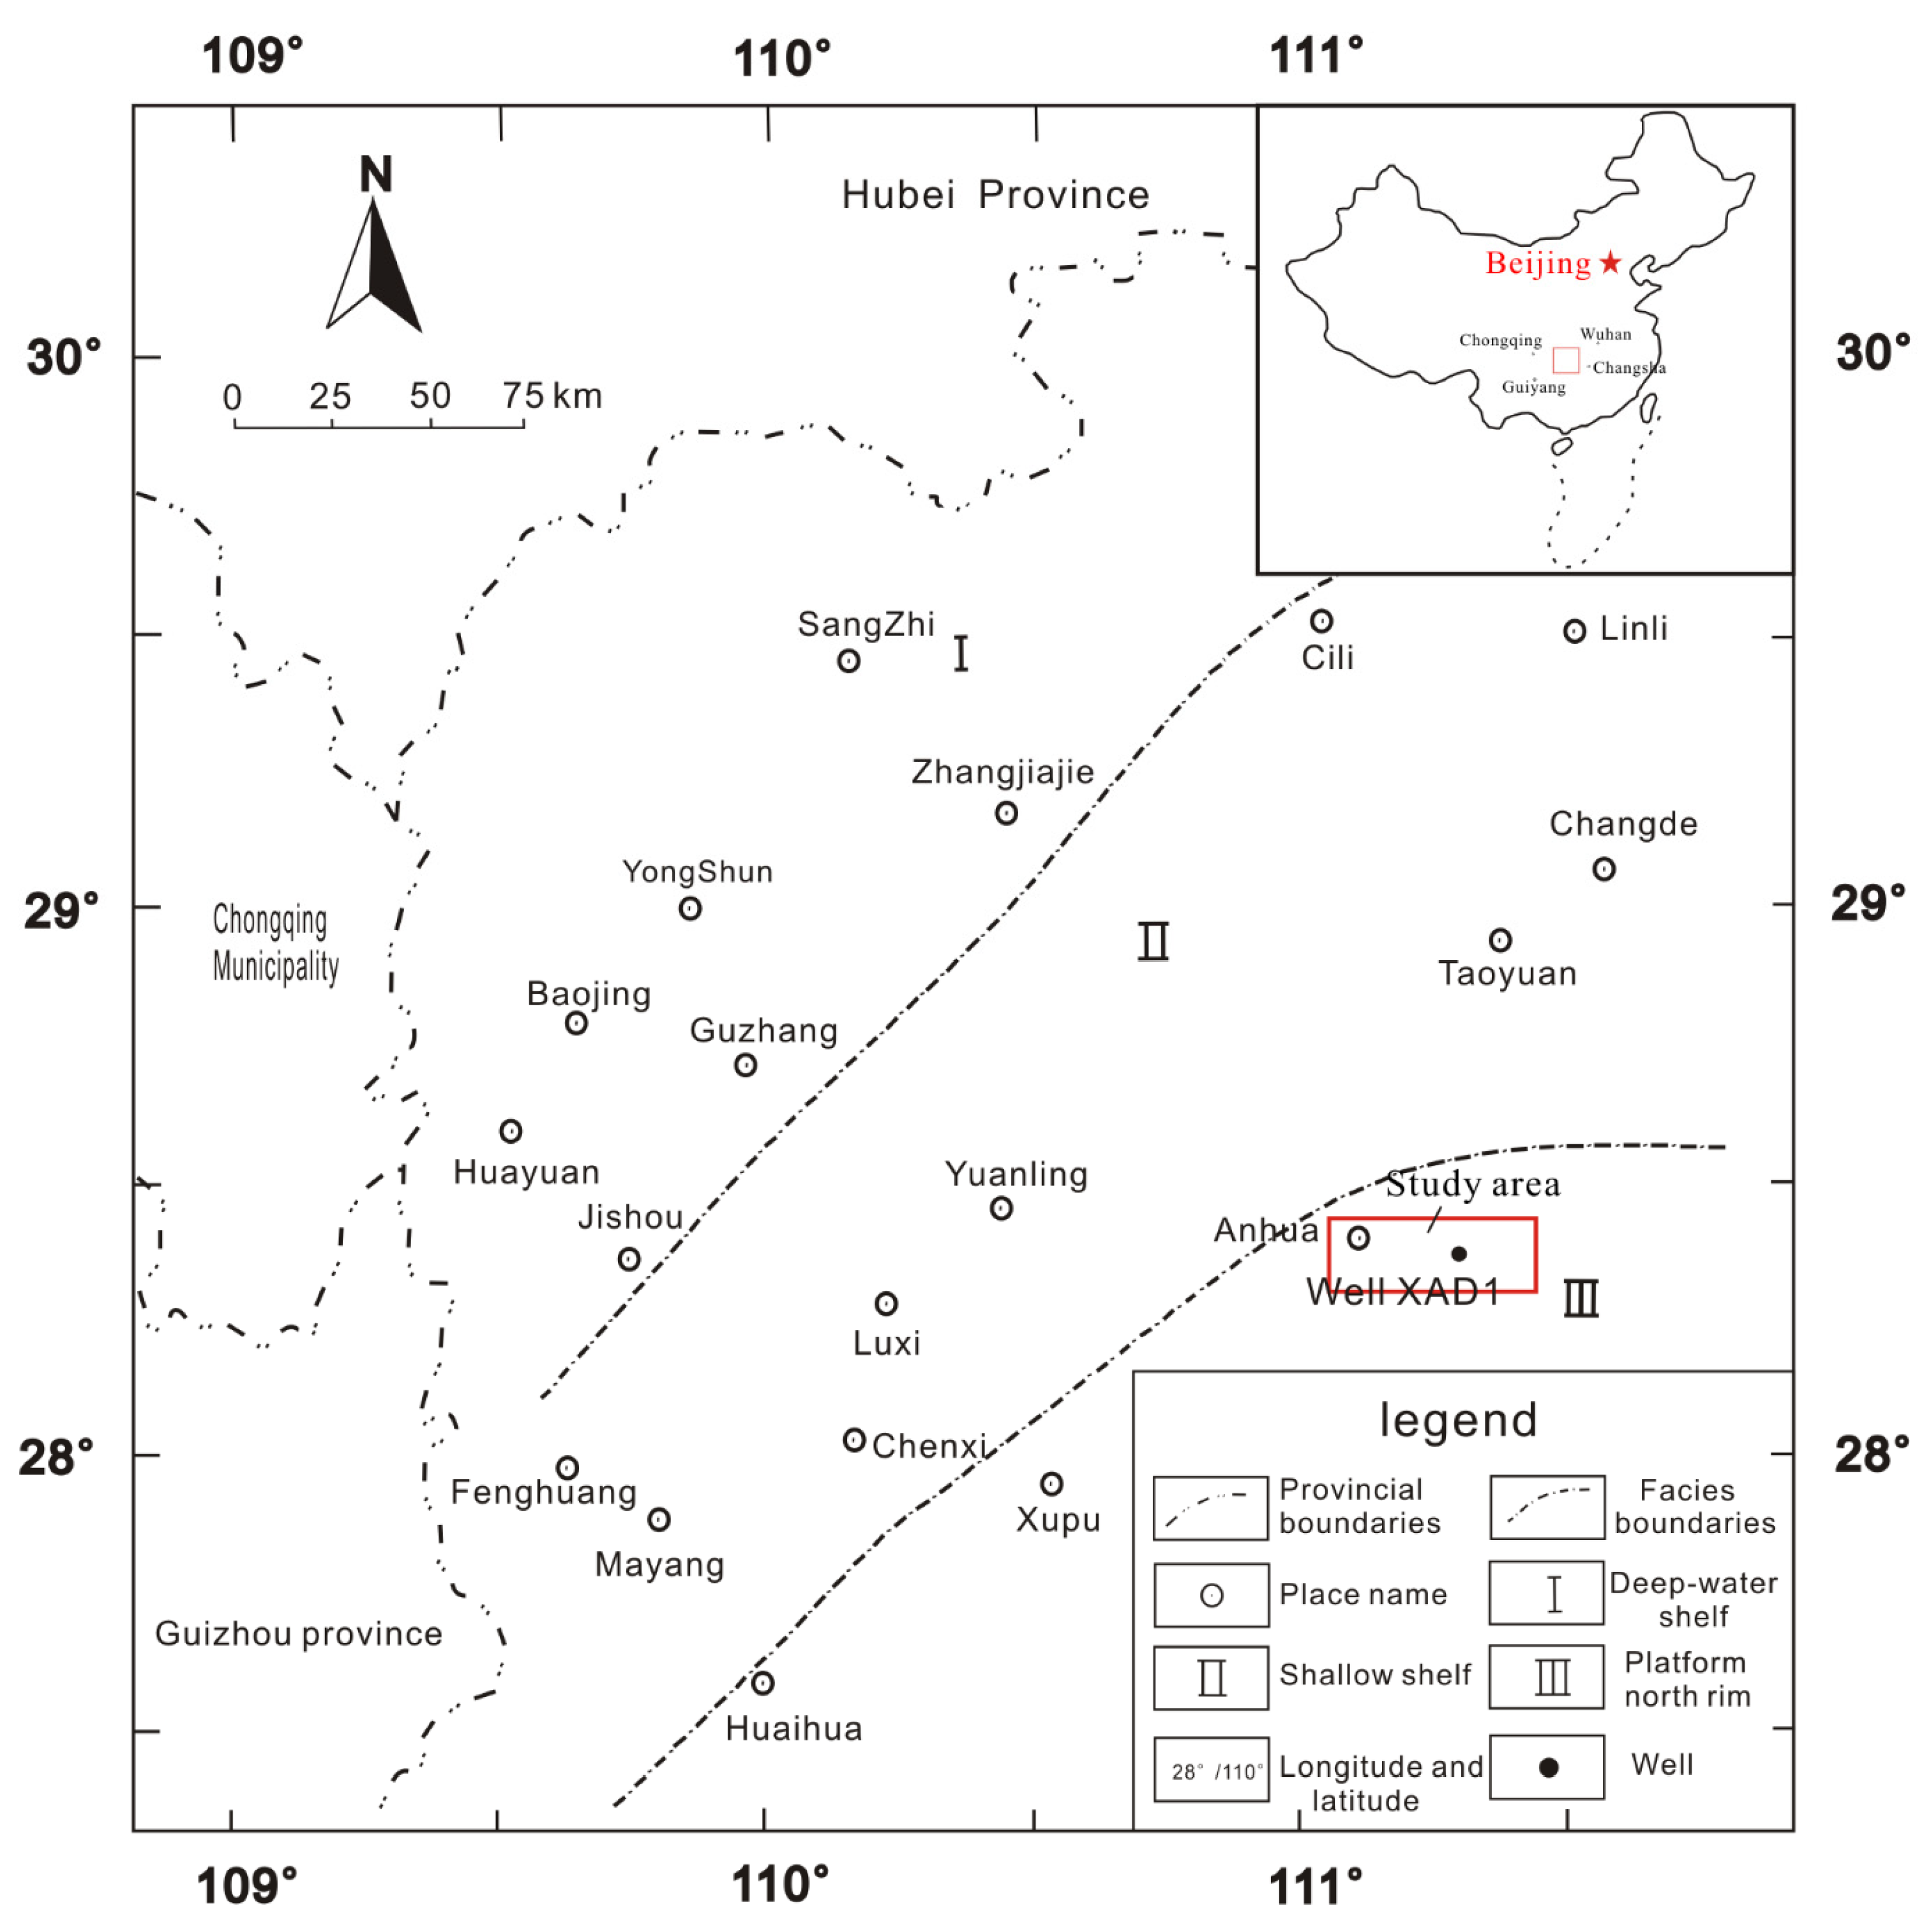
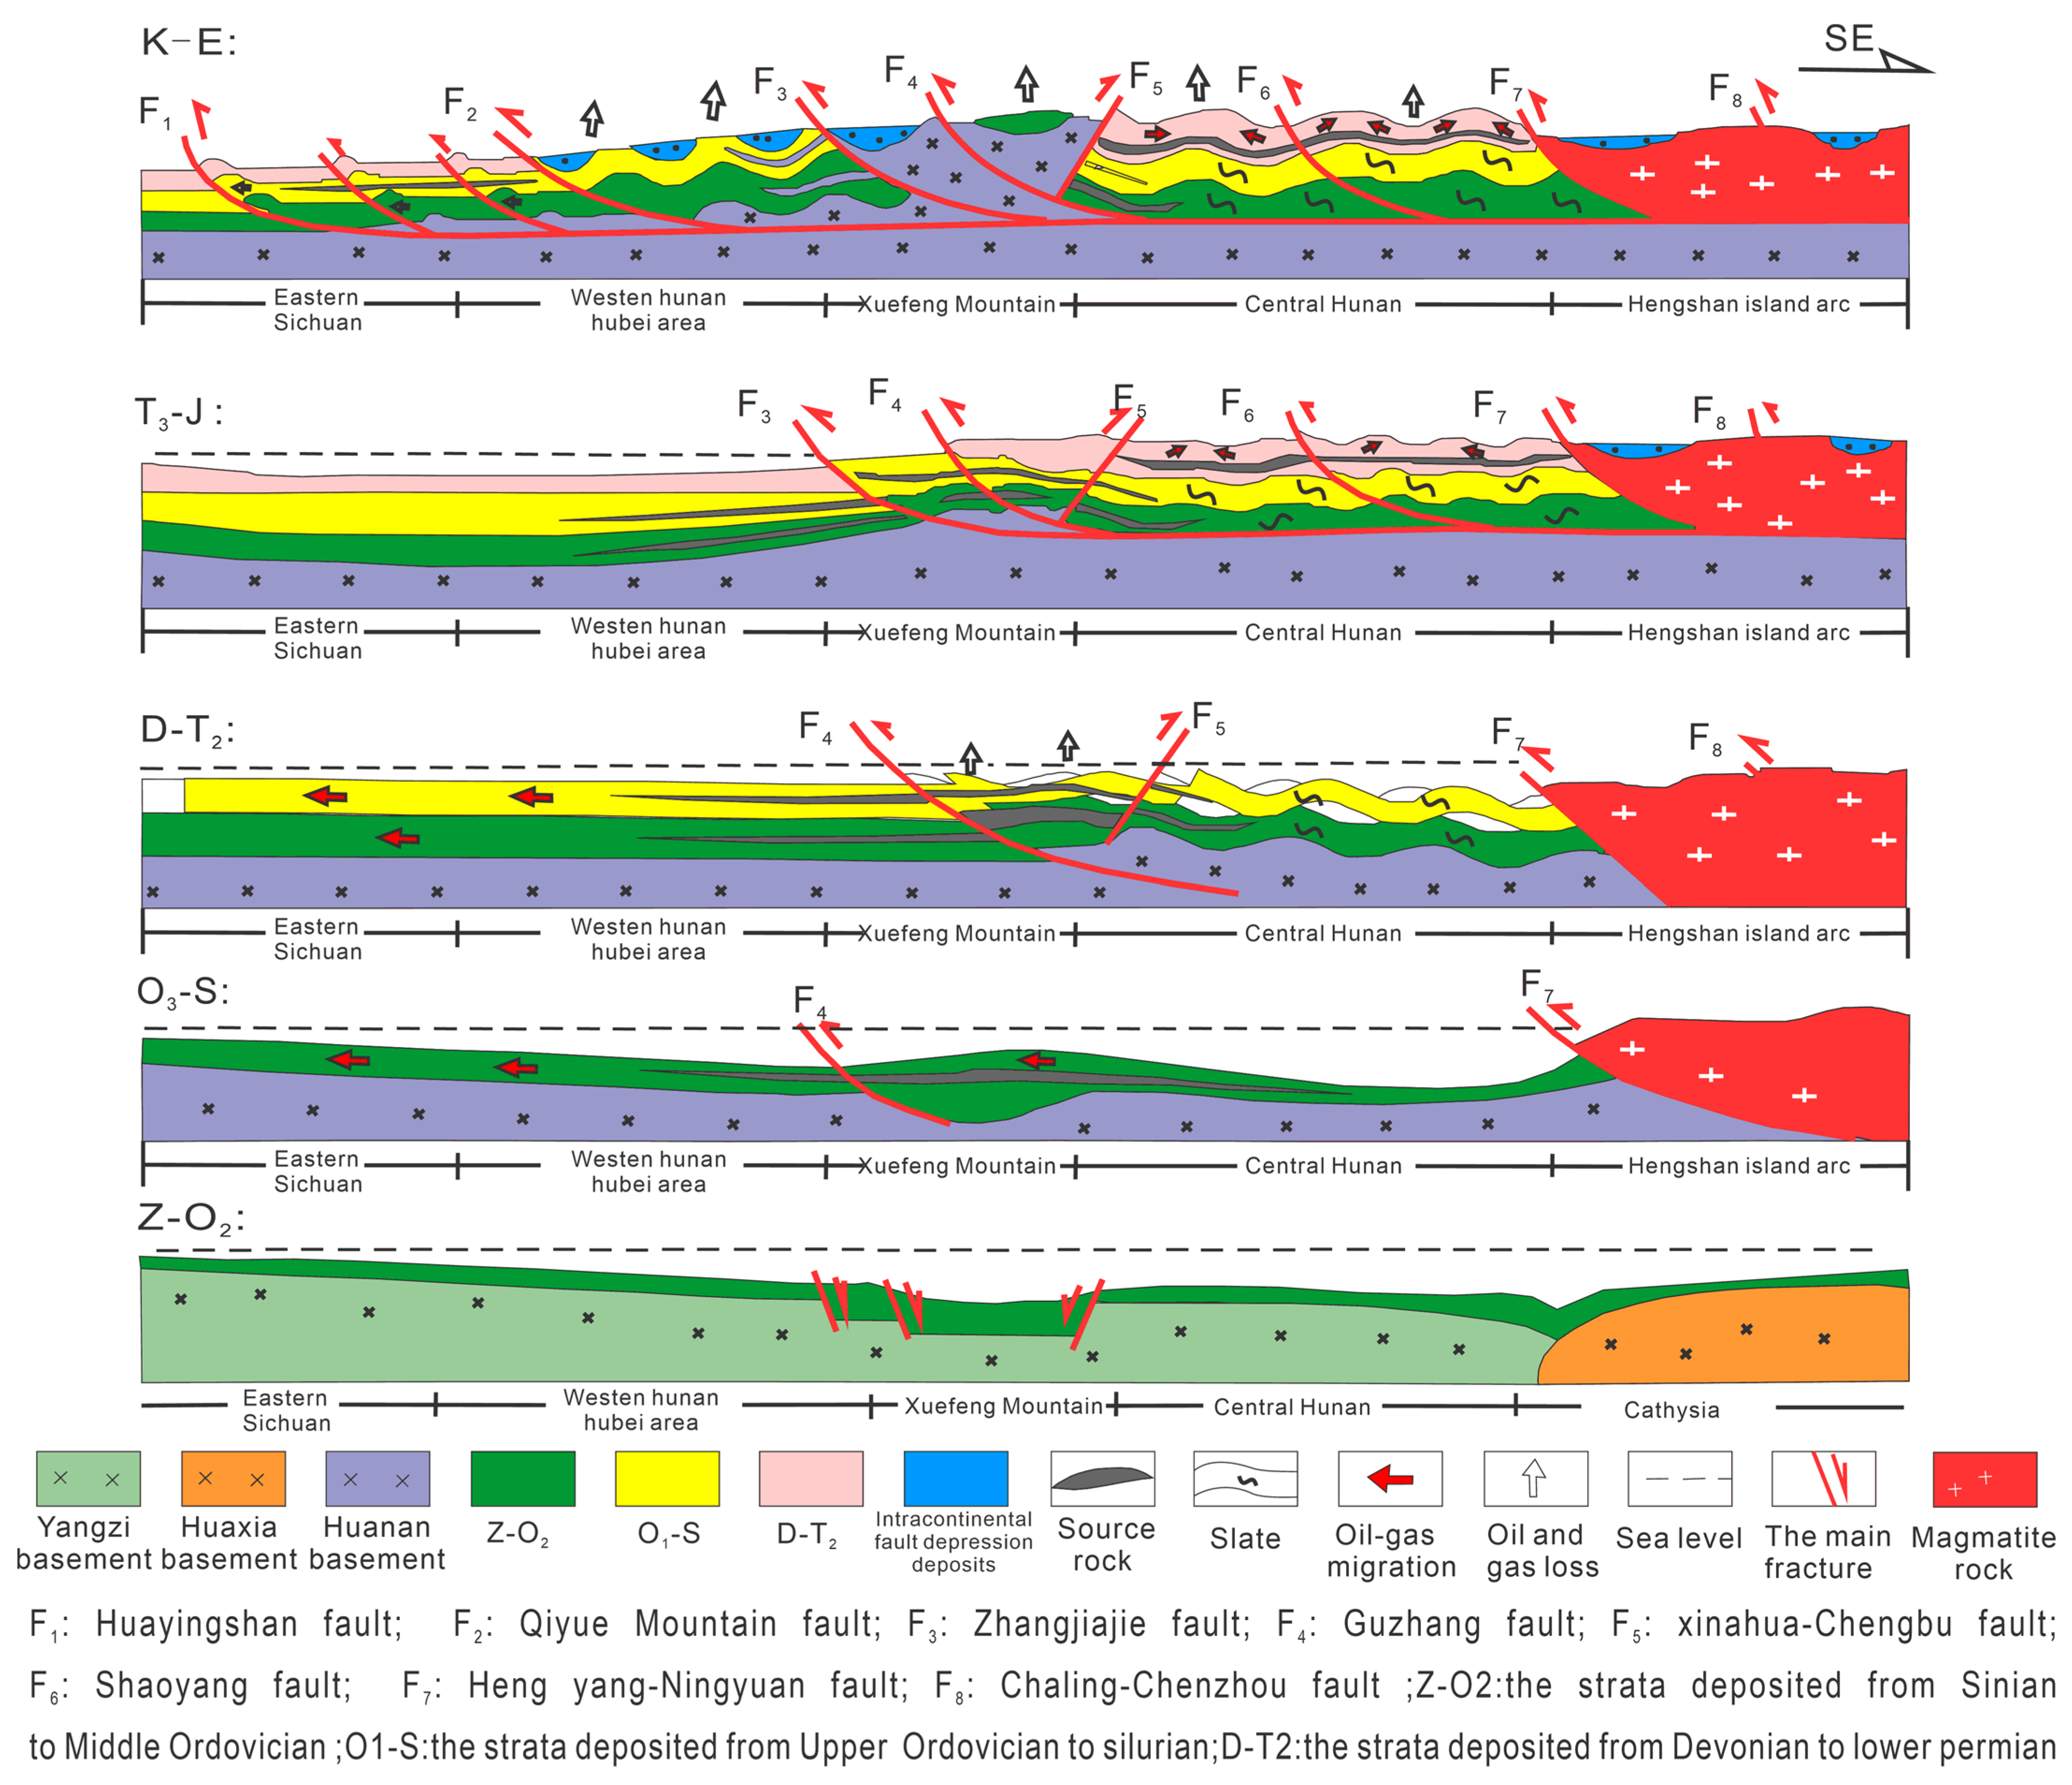
2. Geological Setting

The study area was located at Anhua County in the west of Hunan province, which is structurally at the junction of the Jiangnan axis and the Yangtze platform fold belt (on the southeast edge of the Yangtze paraplatform) (Figure 1). It has experienced multiple tectonic movements since the Sinian period, including the Xuefeng movement, Wuling movement, Anyuan movement, Caledonian movement, Ningzhen movement and Xishan movement. Five major basin-developing periods can be identified, i.e., the early Caledonian period, late Caledonian period, early Hercynian period, Hercynian to late Indosinian period and Indosinian to Himalayan period [3]. The breakup of the Rodinia supercontinent during the Sinian–Cambrian period formed rift basins along Xuefeng Mountain to Jiuling, depositing lower Cambrian sequences [14] (Figure 2, Z-O2 period). The Yangtze block and South China block converged during the Middle Ordovician, forming a thrust fault at the joints (Guzhang fault, i.e., F4 of the O3-S period in Figure 2), where magma intrusion due to the Guangxi movement accelerated the thermal maturation of the Niutitang shale. The Caledonian movement at the end of the Silurian period intensified the compression of the Yangtze plate to the South China plate, further uplifting Xuefeng Mountain and forming a “Y” structure (Figure 2, D-T2 period). It stagnated the thermal evolution of underlying shale, where oil and gas that formed in the early stage were lost vertically along the faults. Large-scale transgression occurred to South China from Devonian to Middle Triassic, and the Xuefeng area received terrigenous clastic sediments (Figure 2, D-T2 period). The subsequent Indosinian movement resulted in a large-scale detachment structure along the basement and developed the Zhangjiajie fault (F3), while the Yanshan movement developed complex anticlines and synclines above the basement in Western Hunan province and Hubei province. The crust in the Xuefeng area was shortened; magma intrusion and delamination extended the surface to form a fault depression (Figure 2, T3-J period) [15]. It slipped along three sets of detachments (Middle and lower Cambrian, Silurian and Middle and lower Triassic) to the Sichuan Basin at the end of the Yanshan period. This dynamic model of “sliding following napping” exposed the Paleozoic system at Western Hunan province and Western Hubei province in the west of Xuefeng Mountain, which has been weakly affected by Himalayan movement and entered a stable stage since Neogene (Figure 2, K-E period).
Initial shale gas exploration activities targeted the lower Cambrian Niutitang Formation (Є23w) in South China, whose vertical and horizontal distributions are important to understand. The Upper Sinian Liuchapo Formation (Z2l) is overlain by the Niutitang Formation [16]. The Liucapo Formation is widely distributed in Guizhou, Hunan, Chongqing and their surrounding areas, and it is generally considered to be the sediments of the semi-deep–deep sea facies or the carbonate platform front slope facies [17] (Figure 3). The Niutitang Formation and Qiongzhusi Formation are isochronous stratigraphic units, mainly black organic-rich shale, which comfortably or uncomfortably make contact with the Dengying Formation, Gezhongwu Formation, Laobao Formation, etc. (Figure 3).

3. Samples and Methods
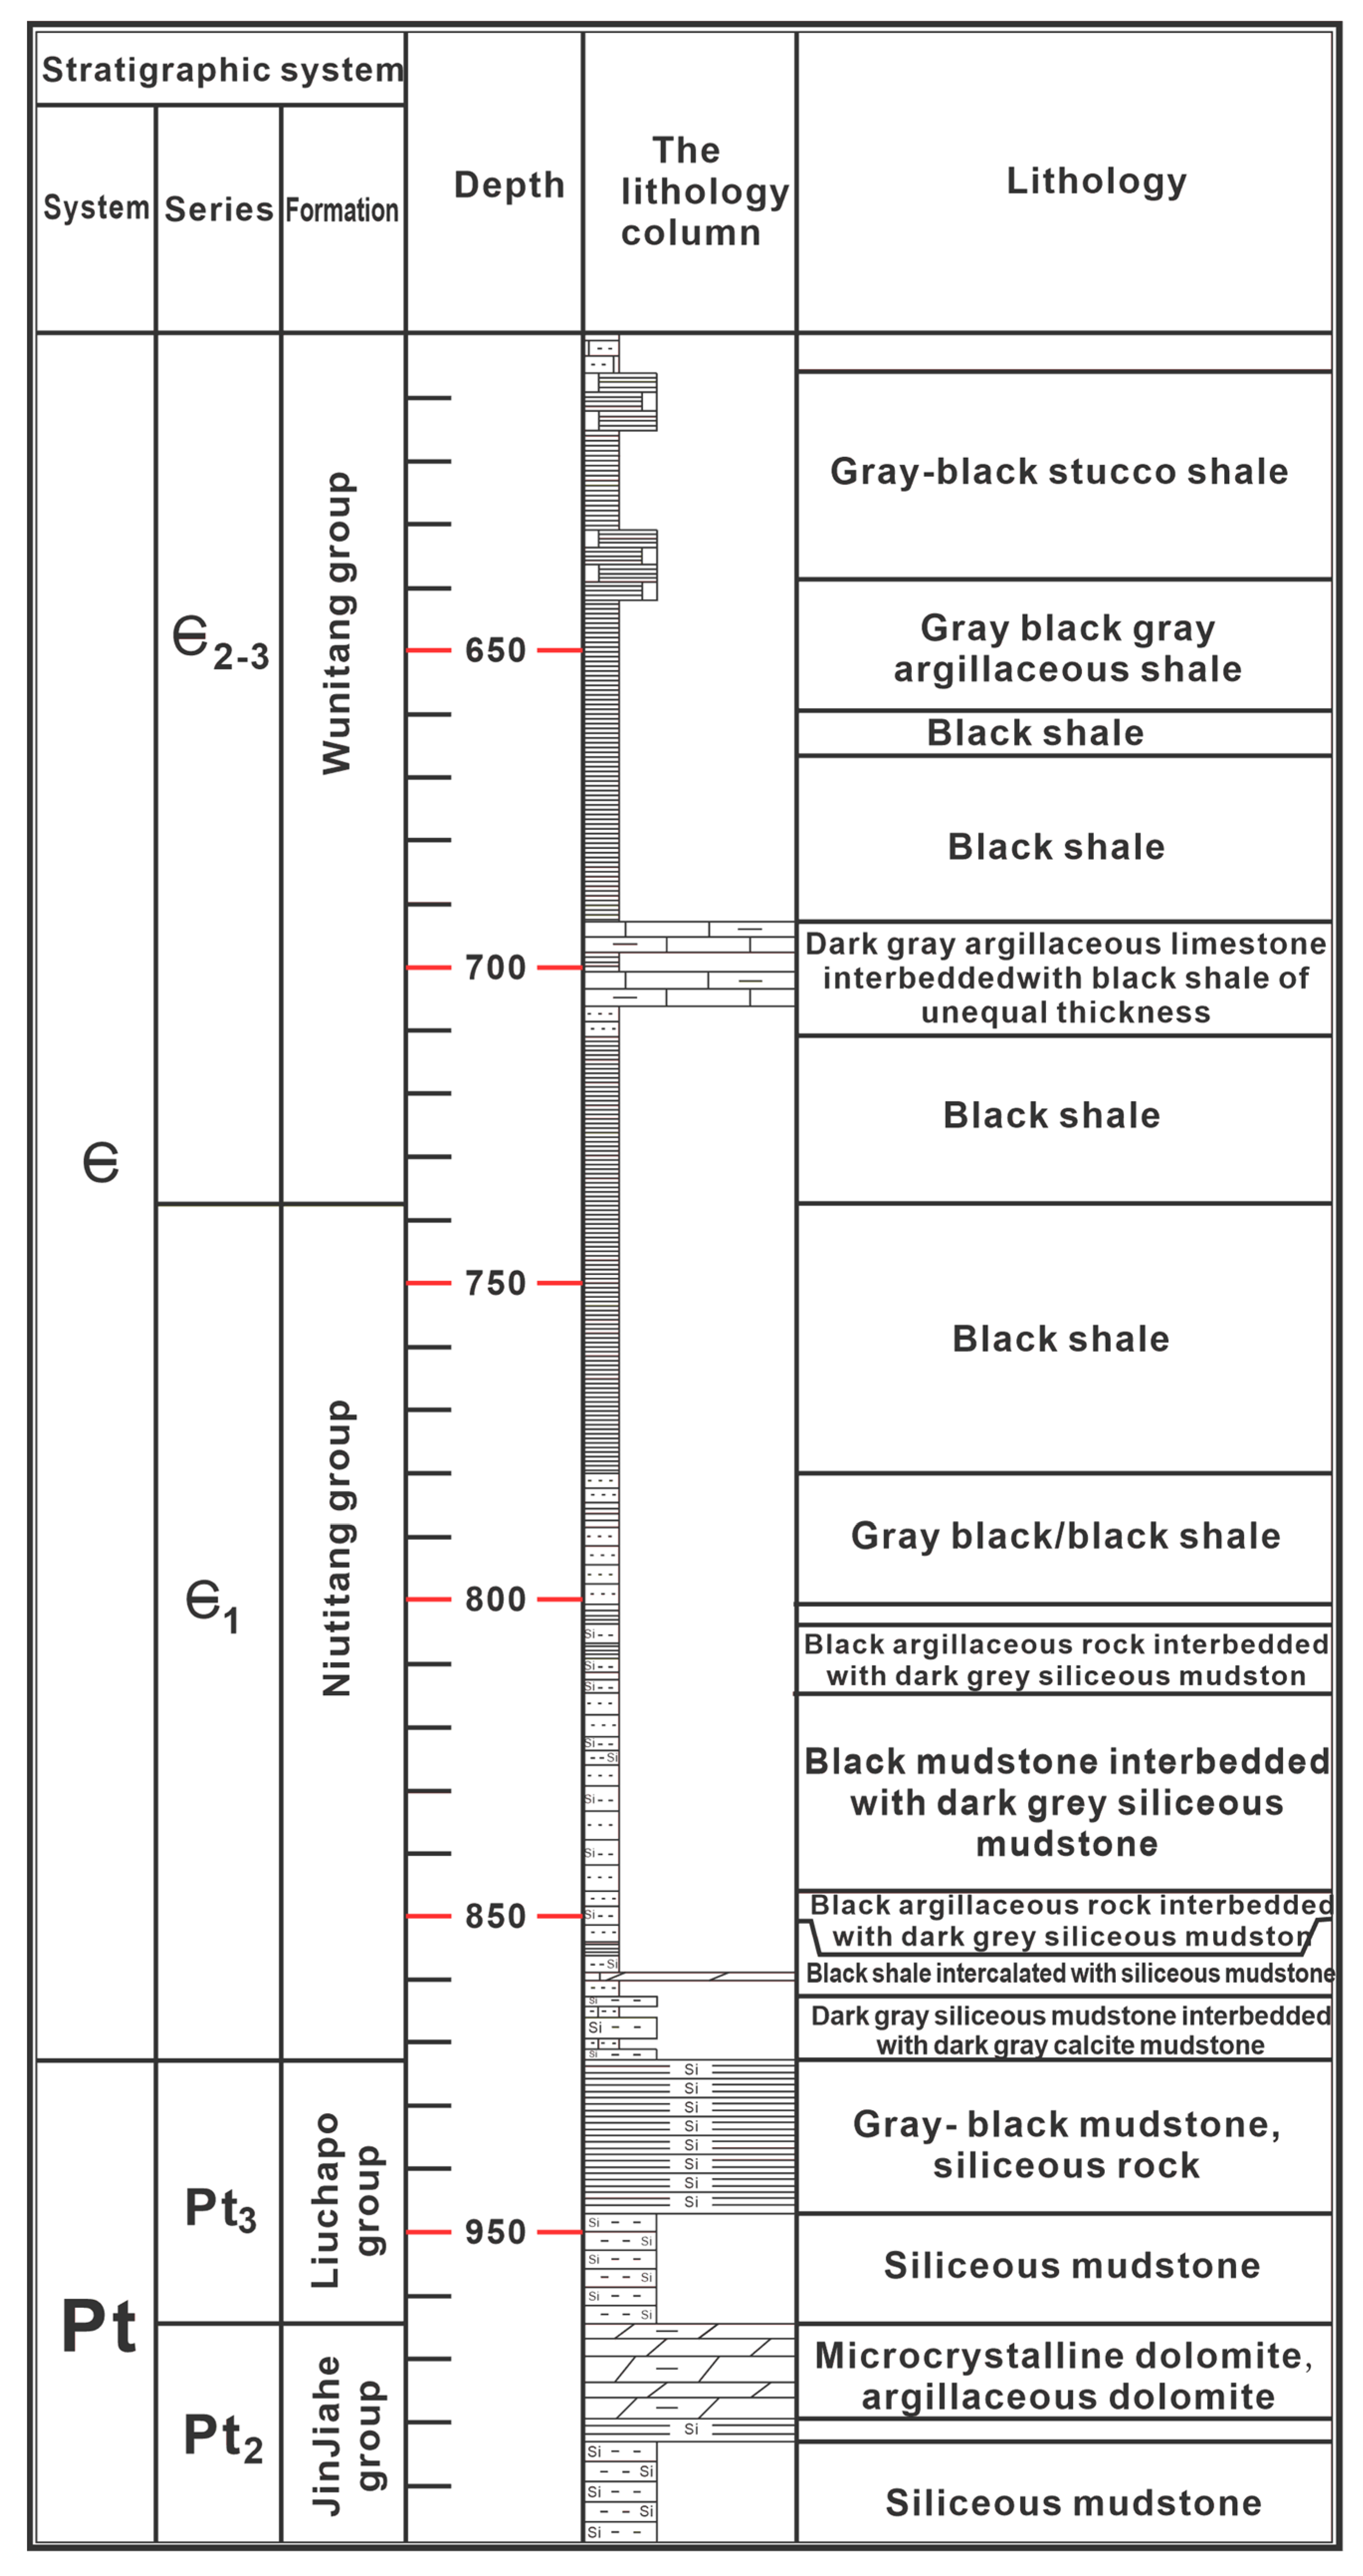
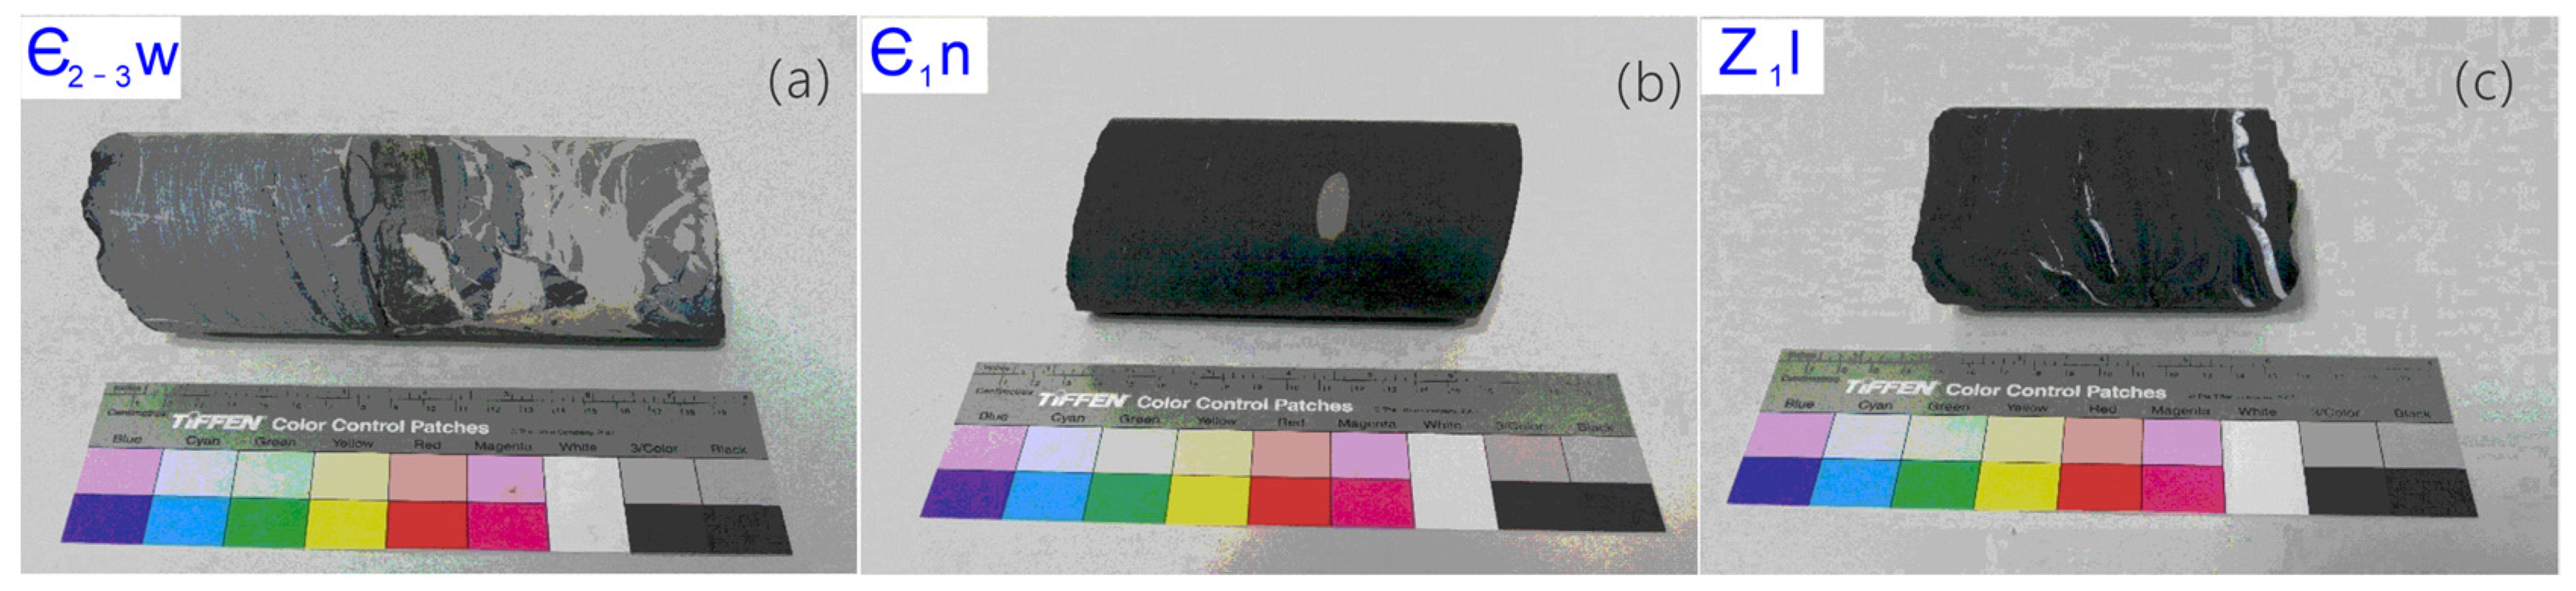
3.1. Samples

All samples analyzed were from cores drilled by the Institute of Geomechanics, Chinese Academy of Geological Sciences. In total, 10 samples were from the Wunitang Formation (Є2–3w), 12 samples from the Niutitang Formation (Є1n) and 2 samples from the Liuchapo Formation (Pt3L) (Figure 4).

3.2. Methods

3.2.1. TOC Measurements

The TOC contents were measured at the State Key Laboratory of Oil and Gas Resources and Detection, China University of Petroleum (Beijing, China). All samples (24 mudstones) were washed and crushed to a <100 mesh. The crushed samples were treated with hydrochloric acid (hydrochloric acid to distilled water was 1:9 in volume ratio) and heated to 50 °C for 1 h to remove carbonate minerals. Finally, the fully reactive samples were washed with distilled water to remove excess HCl. Then, the TOC determination was carried out using a LECO CS-230 Carbon/Sulfur analyzer (LECO, St. Joseph, MI, USA) with an error of ±0.2%.

3.2.2. Pyrolysis

Rock-Eval pyrolysis is an effective method used to characterize the type and thermal maturity of organic matter in sedimentary rocks, in addition to their petroleum generation potential [18]. In this study, a Rock-Eval analysis was performed on 24 samples using a Rock-Eval II laboratory apparatus under a room temperature of 27 °C and humidity of 50% (adhering to standard GB/T 18602-2012 [19]).

3.2.3. Bitumen Reflectance

The bitumen reflectances (Rbs) of five samples were examined at the China University of Petroleum, Beijing. Since no vitrinite originating from higher plants in the lower Paleozoic, an equivalent vitrinite reflectance (Requ) converted from an Rb was used to investigate thermal maturity. Several models have been proposed to determine the Requ at different maturity stages [20,21,22]. The formulae for Rb based on the Experience function from [22] were used to convert Requ in this study.

3.2.4. Soxhlet Extraction

All 24 mudstone samples were washed with distilled water and dried repeatedly, and were further crushed to a <100 mesh. Crushed samples were Soxhlet-extracted for 48 h using dichloromethane. After that, petroleum ether was added to the extract to precipitate the asphaltene fraction. Saturated hydrocarbons, aromatics and non-hydrocarbons were separated via column chromatography. The chromatographic column was filled with silica gel and aluminum oxide (3:1), while the separation reagents were n-hexane, dichloromethane and petroleum ether (2:1), dichloromethane and methanol (93:7).

3.2.5. Gas Chromatography–Mass Spectrometry

Gas chromatography–mass spectrometry (GC-MS) was performed on the 24 saturated hydrocarbon fractions using an Agilent 6890 GC/5075i MS (Agilent, Santa Clara, CA, USA). Then, 99.99% helium was used as carrier gas, with a flow rate of 1 mL/min, and the chromatographic column was HP-5MS (60 m × 0.25 mm × 0.25 μm), with a temperature at the injection port of 300 °C. The initial temperature was 50 °C for 1 min. It was heated to 120 °C at 20 °C/min, and then to 310 °C at 3 °C/min, which was maintained for 25 min. The electron impact (EI) mode was used for the mass spectrometer, with an electron energy of 70 ev for a full scan and selected ion data acquisition.

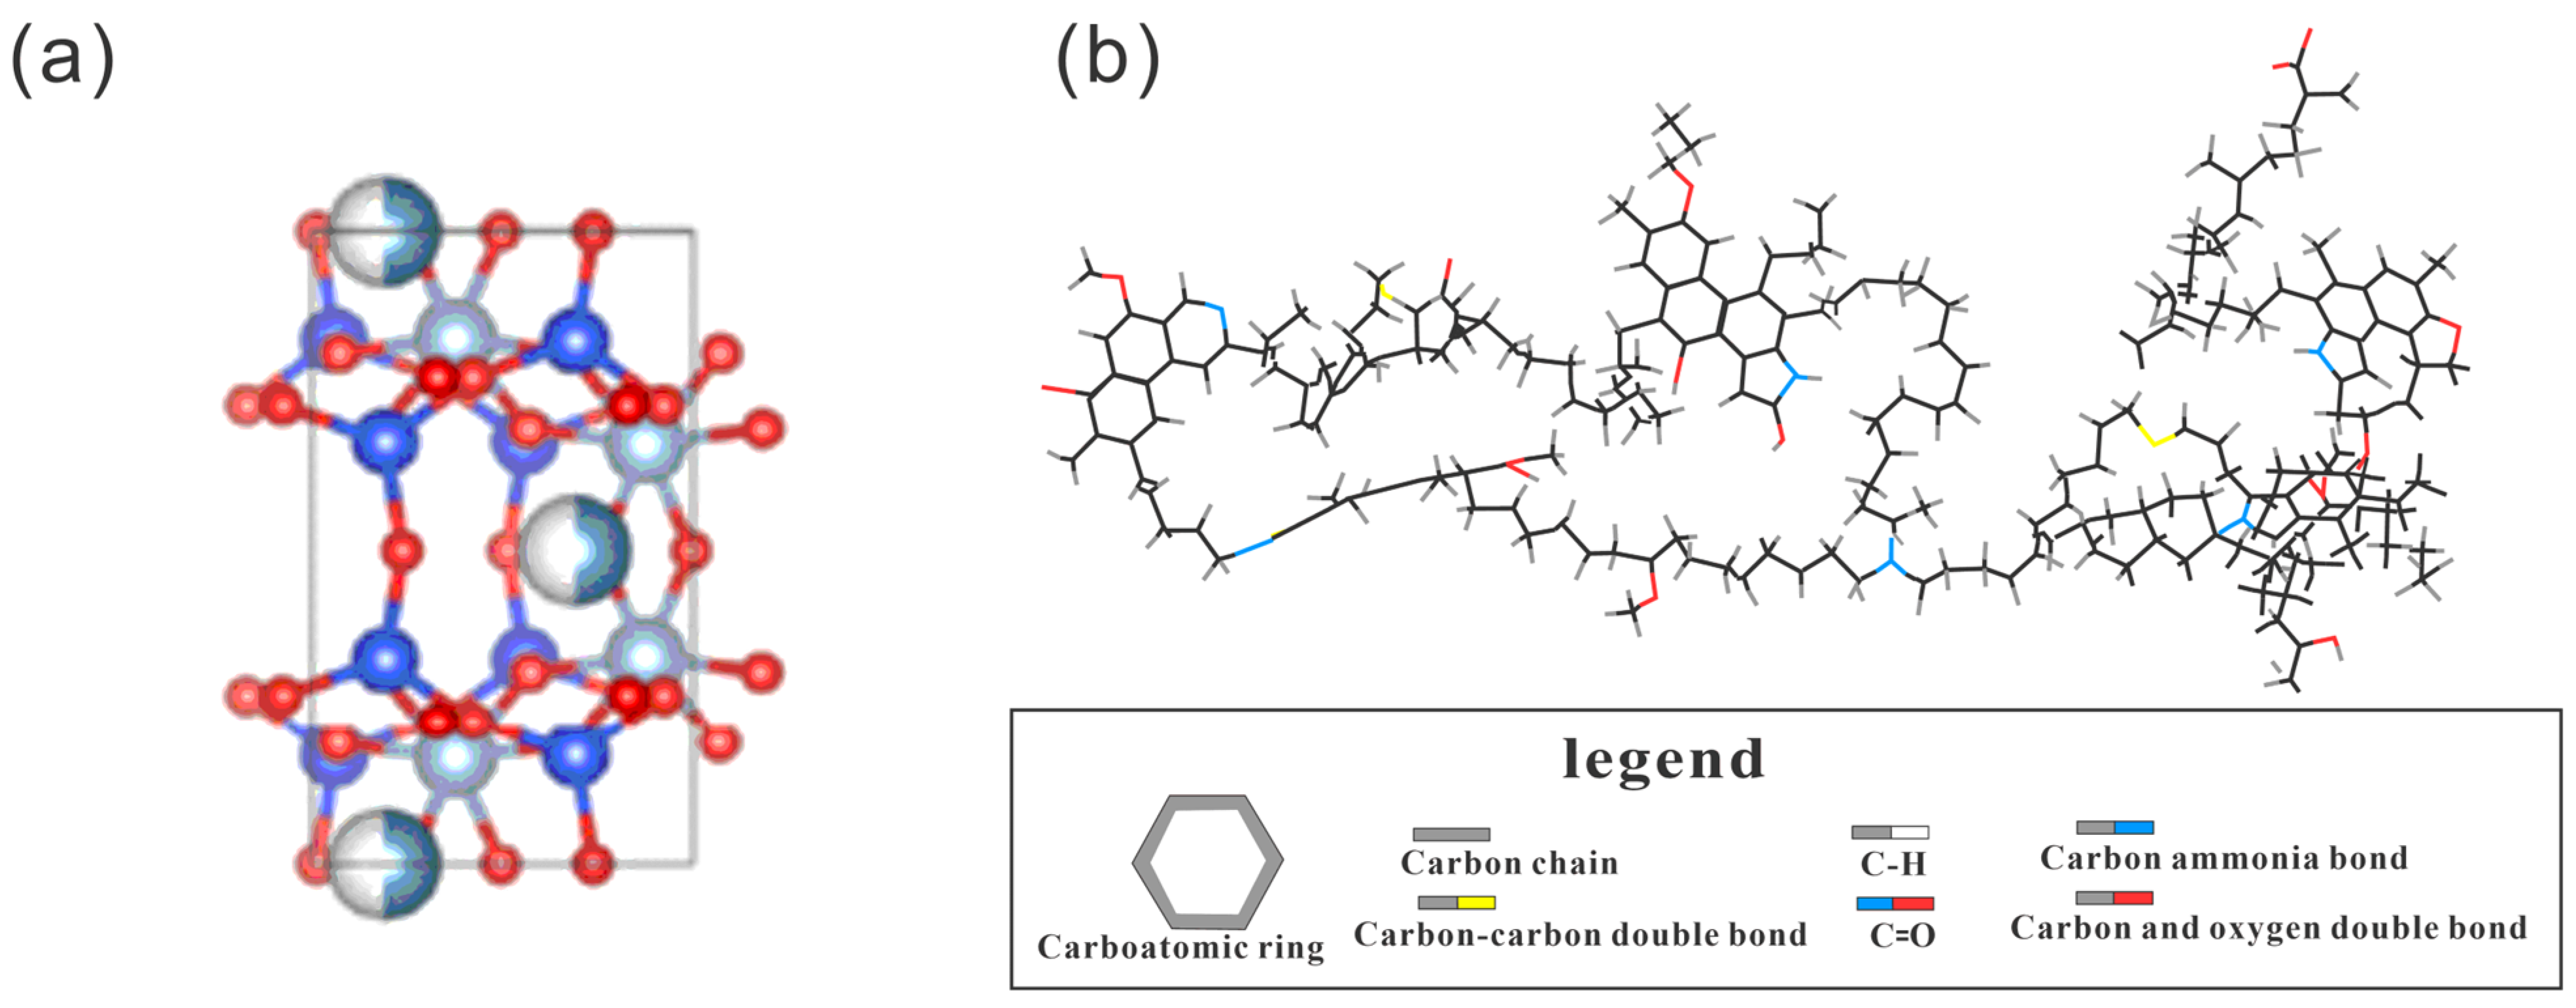
3.3. Grand Canonical Monte Carlo (GCMC) Simulation

In recent years, GCMC simulation has become an important method used to understand methane adsorption mechanisms, e.g., in investigating adsorption processes on clay minerals [23,24]. Mud gas logging data from well XAD1 shows that relative CH4 content in the whole well is 0.000–0.055%, and total hydrocarbon content ranges from 0.0002 to 0.0550%, which does not agreed with the shale gas potential in this area [25,26]. Therefore, the molecular dynamic simulation method was used to determine the adsorbed gas volume of lower Cambrian Niutitang black shale in Western Hunan province at certain temperatures and pressures. The influence of water was not considered in the simulation. Considering that the presence of water influences the methane adsorption of clay minerals, a supplementary discussion is provided in Section 4.4.
The molecular simulation primarily employs the Monte Carlo adsorption simulation (grand canonical ensemble) to simulate methane adsorption by rocks. In the grand canonical ensemble, which is an open system, heat exchange and particle exchange can occur while keeping temperature (T), volume (V), chemical potential (m) and other parameters of each sample fixed. However, energy (E) and the number of particles (n) are variable. The simulation system considers methane molecules, kerogen and clay minerals. Prior to conducting molecular dynamic simulations, the structure of adsorbed substances in the system was optimized to achieve a stable configuration since the natural state of molecular configuration energy represents its most stable form [27].
An atomic model was employed wherein all valence bonds and atoms were fully represented. The simulated agents consist of type I kerogen and illite based on the pore structure and mineral composition of Niutitang black shale at a depth of 777.8 m in well XAD1. The sample had a total organic carbon content of 6.37%, clay mineral content of 27.5% and porosity value of 1.451%. For representing inorganic minerals, single crystal cells were selected from the ICSD2009 crystal structure database, which previously established models utilized for type I kerogen representations [28,29] (Figure 5). Material Studio software 2020 was used to implement these simulations.
The relative composition of each component in the model was determined based on the organic carbon content, relative content of clay minerals, as well as the porosity and permeability in the black shale. Numerous attempts have been made to model the structure of type I kerogen and illite, resulting in the following final cell chemical: C251H385N7O1357Al224Si448S3K112. The simulated total organic carbon content of the cell model was 6.23%, while the illite content was 27.6%. These values align well with the measured TOC and clay mineral content of Niutitang black shale at a depth of 777.8 m in well XAD1. Therefore, this cell chemical formula serves as our calculation model. Other parameters for the cell model include volume = 36016.18 Å3, density = 1.52 g/cm3, porosity = 31.6% and pore size = 1.5 nm.
The simulated temperature and pressure were determined based on the burial history and hydrostatic pressure at well XAD1 (see Section 4.2). Quartz, calcite and other minerals contribute significantly less to methane adsorption compared to kerogen and clay minerals; hence, they were not included in the modeling process, which resulted in certain differences between the density and porosity of our established model and those of actual samples.
Figure 5. Schematics of molecular structures for (a): single crystal molecular structure of illite (modified after [29]) and (b): kerogen I (C251H385O13N7S3) (modified after [29]).
Energies 17 01743 g005

4. Results and Discussion

4.1. Source Rock Geochemistry

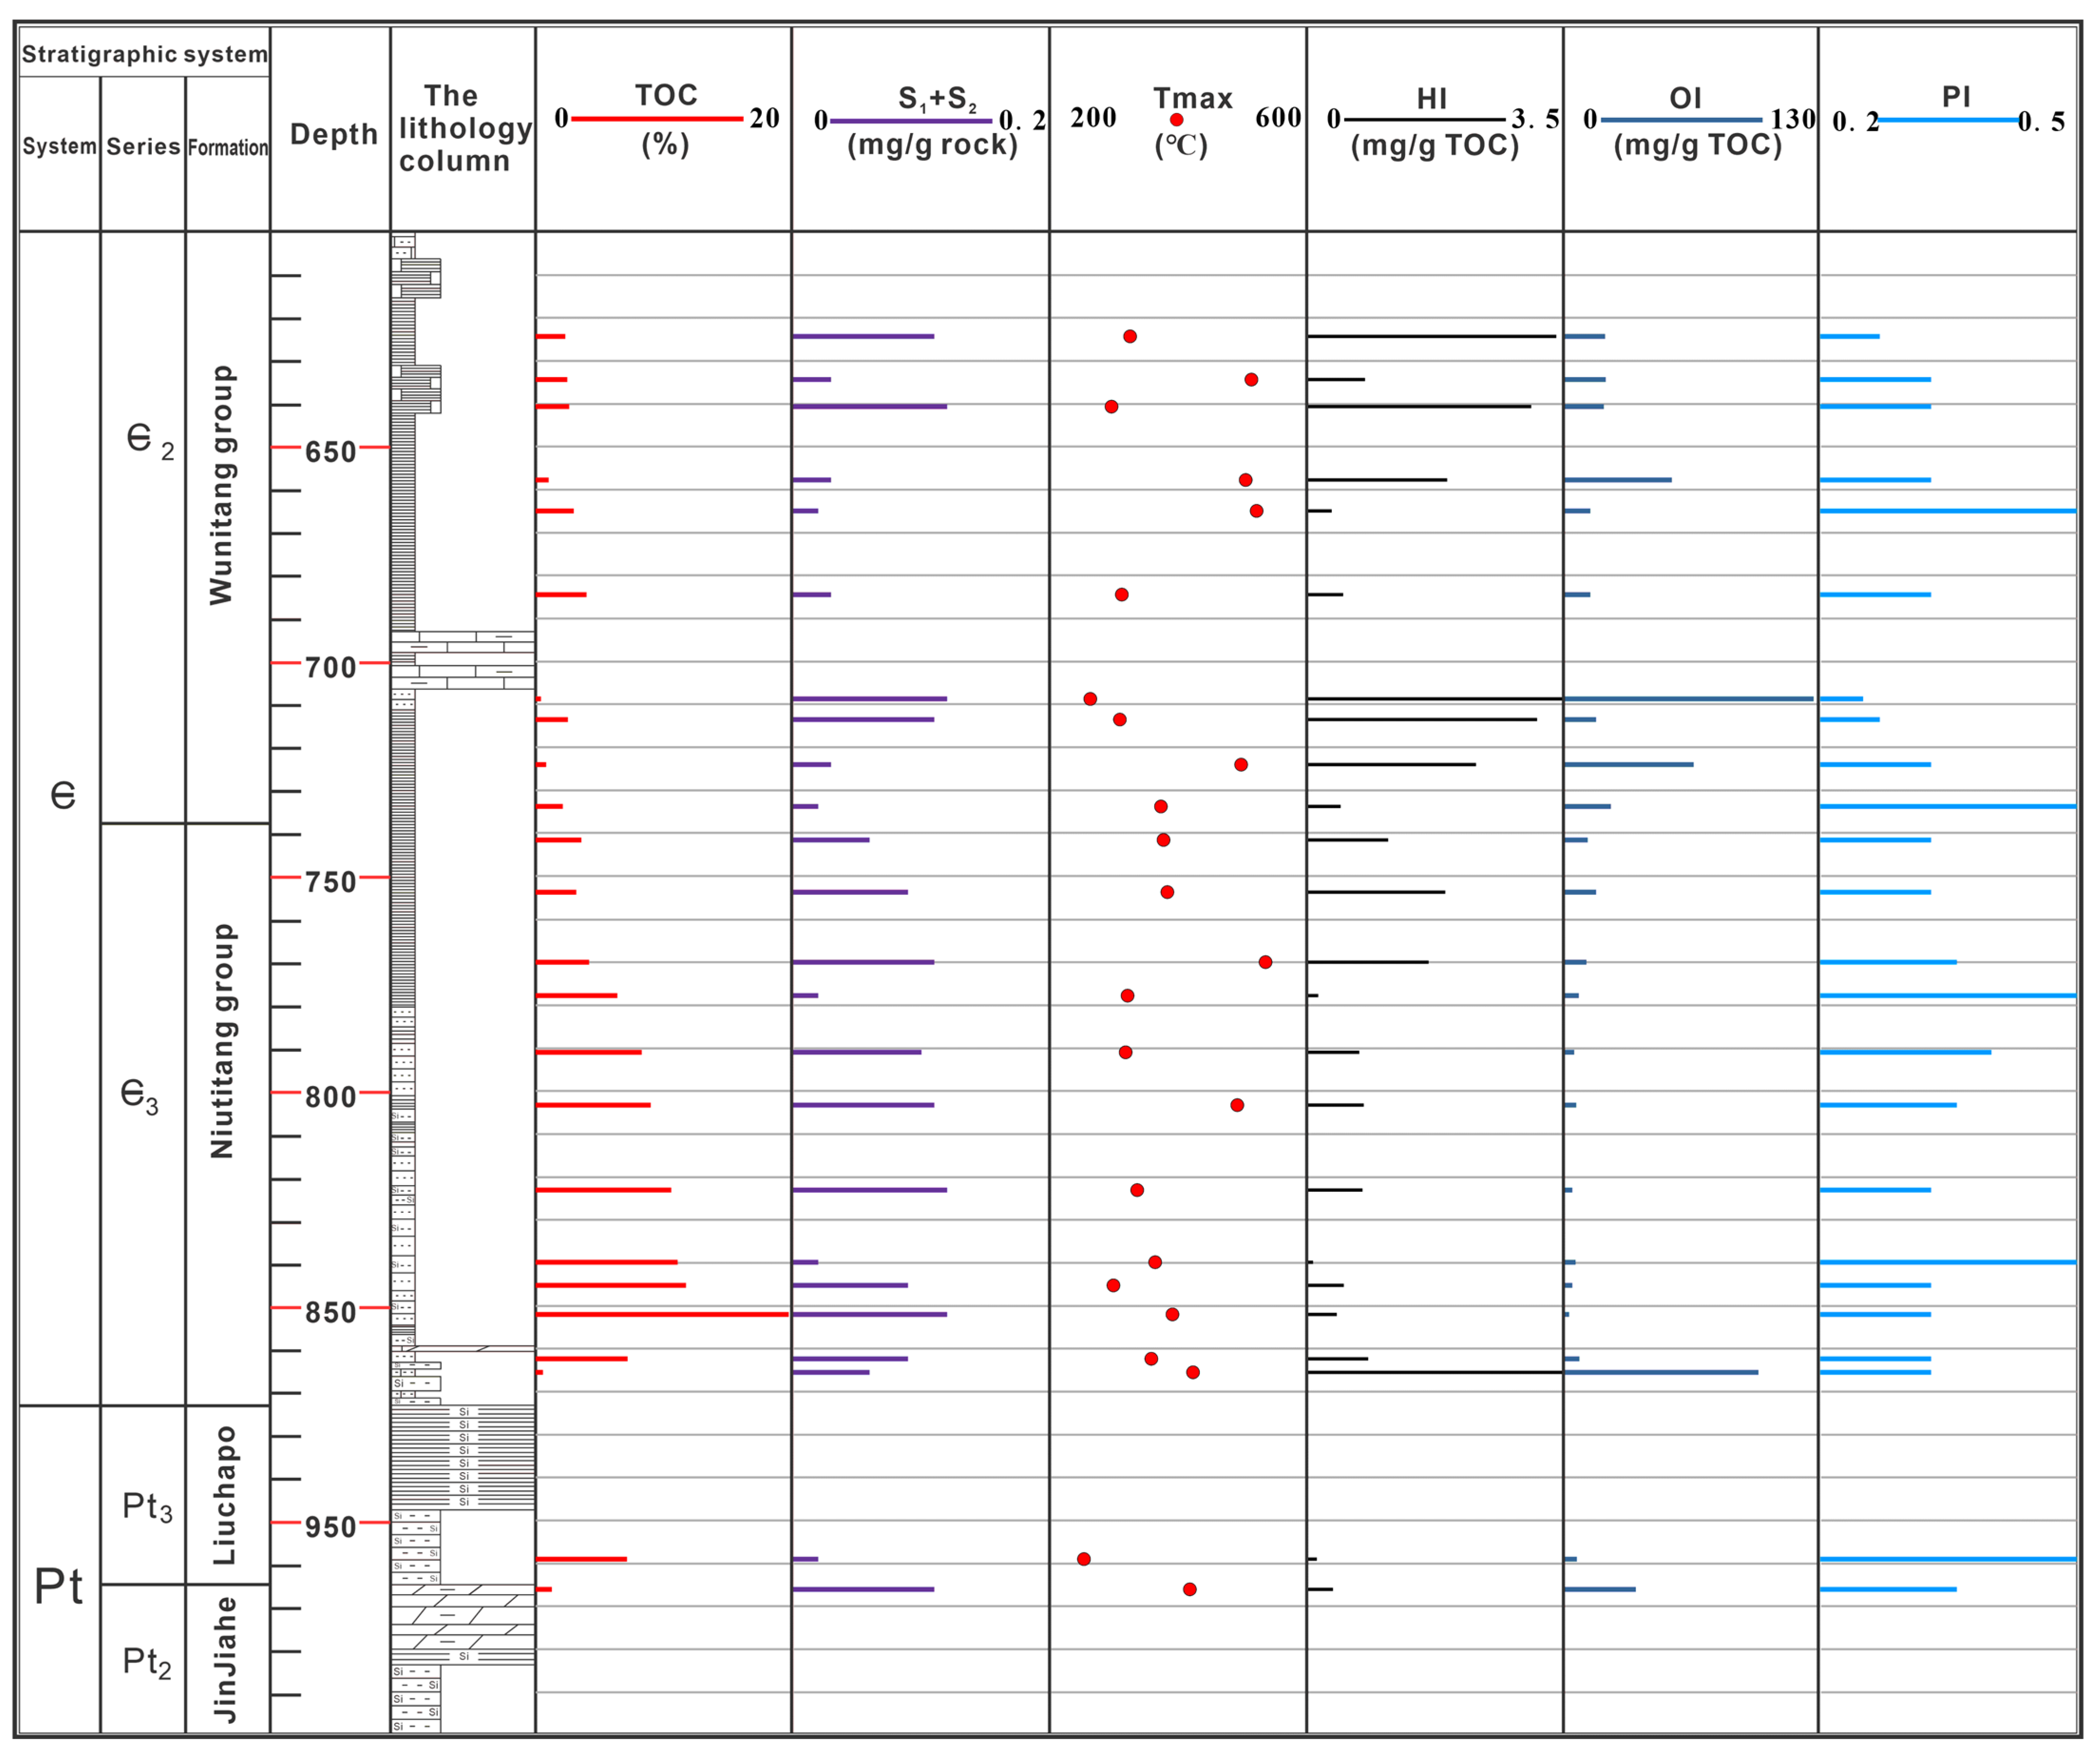
4.1.1. Petroleum Generation Potential of Black Shale

The TOC and pyrolysis data obtained from the samples collected from well XAD1 (Table 1) indicate that the TOCs of the Niutitang Formation (Є1n) vary significantly, ranging between 0.47% and 19.69%, with an average value of 5.32%. Generally, the TOC values are higher than 2.0%. The geochemical profile presented in Figure 6 shows that the black shale in the Niutitang Formation (Є1n) is continuous vertically; however, the TOC contents of the Wunitang Formation (Є23w) and Liuchapo Formation (Pt3l) were relatively low, varying between 0.47% and 7.01%, with an average value of 2.5%. In general, the TOC is a crucial index for evaluating hydrocarbon generation potential in source rocks; for shale gas reservoirs specifically, kerogen serves as the primary adsorption site for methane—thus indicating that higher TOC values correspond to a stronger gas adsorption capacity. For well XAD1, it can be concluded that Є1n shale exhibits a better gas generation potential and adsorption capacity compared to the Є23w and Pt3l Formations.
The conventional method for evaluating kerogen type is not applicable to the lower Cambrian overmature black shales studied. For instance, the hydrogen index (HI) of black shale in the XAD1 well ranges from 0 to 20 with an average value of 2.3 mg HCs/g TOC (Table 1), and the HI-Tmax chart cannot be used to determine kerogen type in this area. Carbon isotopes of kerogen have been utilized to analyze lower Paleozoic source rocks in Northwestern Hunan province. Previous studies indicated that most carbon isotopes of Niutitang black shale from Western Hunan province are relatively light, measuring between −28.8‰ and −34.2‰, which is indicative of type I kerogen [30,31] (Table 2). The lower Cambrian highly mature to overmature black shales found in well XAD1 exhibit good to excellent TOC values but low S1 + S2 values due to their overmaturity, resulting in no remaining generation potential and unreliable Tmax values that cannot be used for determining thermal maturity.
Although vitrinite reflectance is a reliable indicator of kerogen maturity, its applicability is limited to source rocks containing vitrinite and may not be suitable for those with different organic matter types or older ages. To address this limitation, [32] developed a linear regression equation that correlates bitumen reflectance with vitrinite reflectance based on extensive measurements: Re = 0.6569 × Rb + 0.3364 [20]. In applying this equation, the determined equivalent vitrinite reflectance (Re) of the Є1n Formation was found to be 3.02% and 3.35%, corresponding to an indication of highly mature to overmature source rock conditions [33]. The equivalent Ro value of the Є23w Formation is similar to that of the Є1n Formation, both representing highly mature to overmature source rock environments.
The S1 + S2 versus TOC relationship is commonly employed for evaluating the hydrocarbon generation potential of source rocks. However, this approach loses its significance when dealing with overmature source rocks. In such cases, a more practical method involves establishing a quantitative correlation between the hydrocarbon generating potential and organic carbon content based on the organic matter types of immature to low-mature source rocks in order to calculate their original hydrocarbon generating potential. By conducting regression analysis on low-mature marine source rocks from the Paleozoic era (including Proterozoic), an equation for the original hydrocarbon generation potential (Pg) and TOC was derived, which can be expressed as Pg = 5.63 × TOC−2.37 [34]. Our findings indicate that all three studied source rocks exhibit good-to-excellent levels of recovered original hydrocarbon generation potentials (Table 1). Specifically, Є1n black shale demonstrates a Pg ranging mainly from 17.39 mg/g TOC up to 108.43 mg/g TOC, which surpasses those of the Є2–3w and Pt3l Formations.
Table 1. Pyrolysis data for Wunitang and Niutitang black shale, XAD1 well.
No.FormationDepth
(m)
TOC
(%)
S1
(mg/g)
S2
(mg/g)
Tmax
(°C)
HI
(mg HCs/g TOC)
%RbRePg
(mg/g)
1Є2–3w624.32.350.030.083253.40 / 10.86
2Є2–3w634.42.500.010.025140.80 4.002.9611.71
3Є2–3w640.62.620.040.082963.06 / 12.38
4Є2–3w657.71.040.010.025051.92 / 3.49
5Є2–3w665.02.980.010.015220.34 4.183.0814.41
6Є2–3w684.53.990.010.023120.50 / 20.09
7Є2–3w708.70.470.030.0926319.03 / 0.28
8Є2–3w713.52.550.030.083093.14 / 11.99
9Є2–3w724.00.870.010.024982.31 4.163.072.53
10Є2–3w733.82.160.010.013730.46 / 9.79
11Є1n741.63.600.020.043771.11 / 17.90
12Є1n753.73.170.030.063831.89 / 15.48
13Є1n769.94.210.040.075361.66 4.093.0221.33
14Є1n777.86.370.010.013210.16 / 33.49
15Є1n791.0 8.300.040.063180.72 / 44.36
16Є1n803.2 8.990.040.074920.78 / 48.24
17Є1n823.1 10.580.040.083360.76 4.583.3557.20
18Є1n839.8 11.060.010.013640.09 / 59.90
19Є1n845.311.730.030.062990.51 / 63.67
20Є1n852.019.680.040.083910.41 / 108.43
21Є1n862.37.170.030.063580.84 / 38.00
22Є1n865.50.580.020.044236.94 / 0.90
23Pt3L909.07.010.010.012520.12 37.10
24Pt3L916.11.540.030.074100.45 6.30
Note: TOC—total organic carbon; S1—soluble hydrocarbon; S2—pyrolysed hydrocarbon; Tmax—the highest temperature; HI—hydrogen index; %Rb—bitumen reflectance; Re—equivalent vitrinite reflectance based on Re = 0.6569 × Rb + 0.3364 [8,14]; Pg = 5.63 × TOC−2.37 [34].
Table 2. The kerogen carbon isotope (δ13C) classifies the organic matter type of the source rock.
Kerogen TypeType IType II1Type II2Type III
δ13C (‰)<−28−28~−26−26~−24>−24

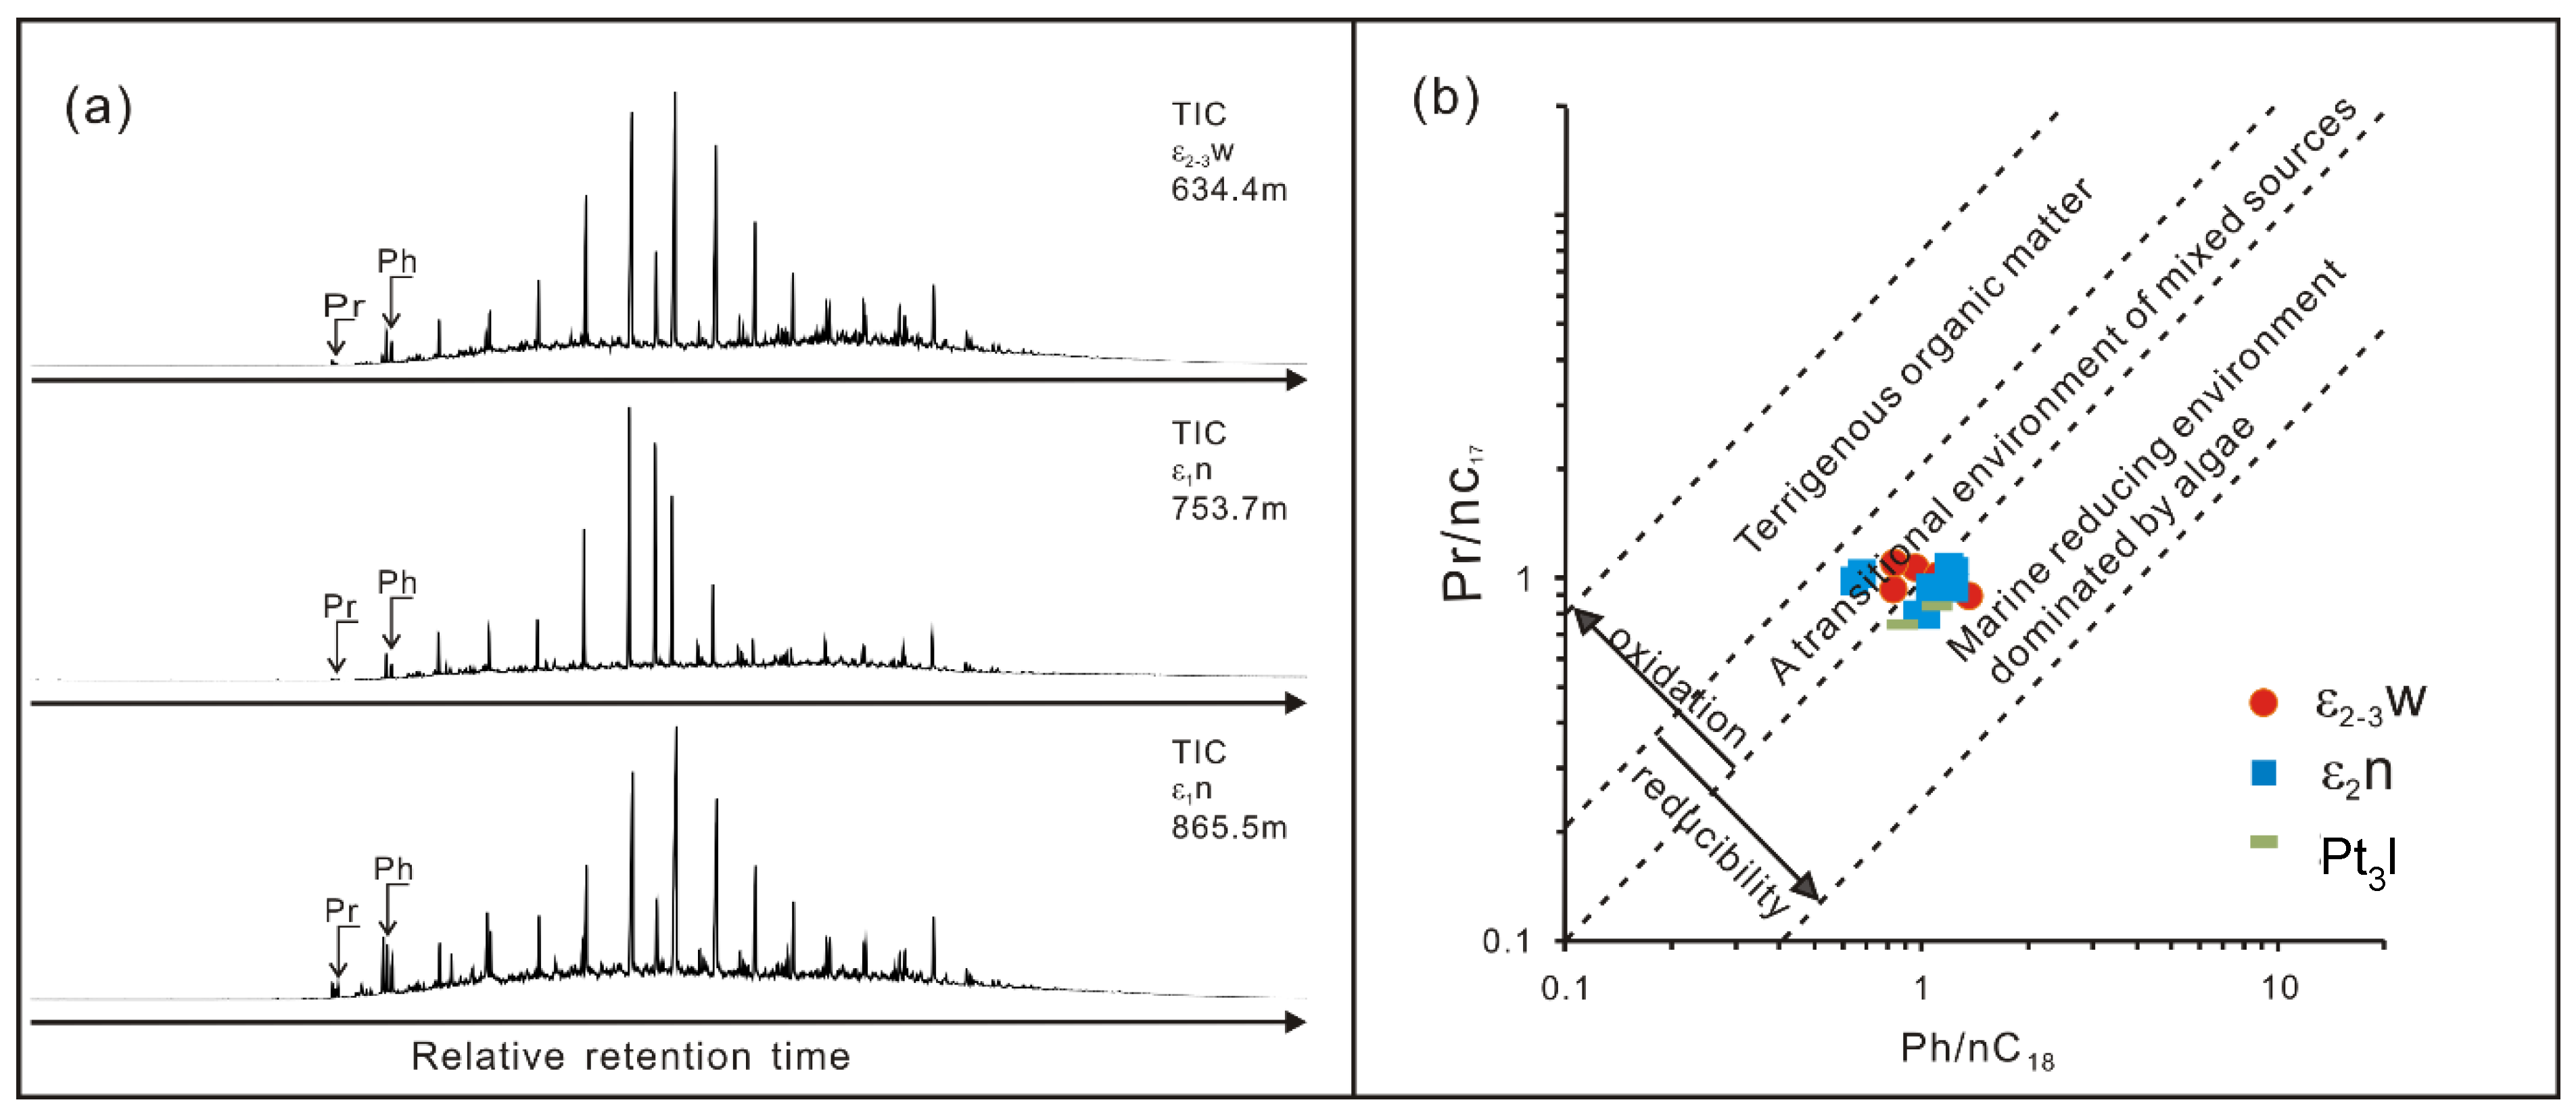
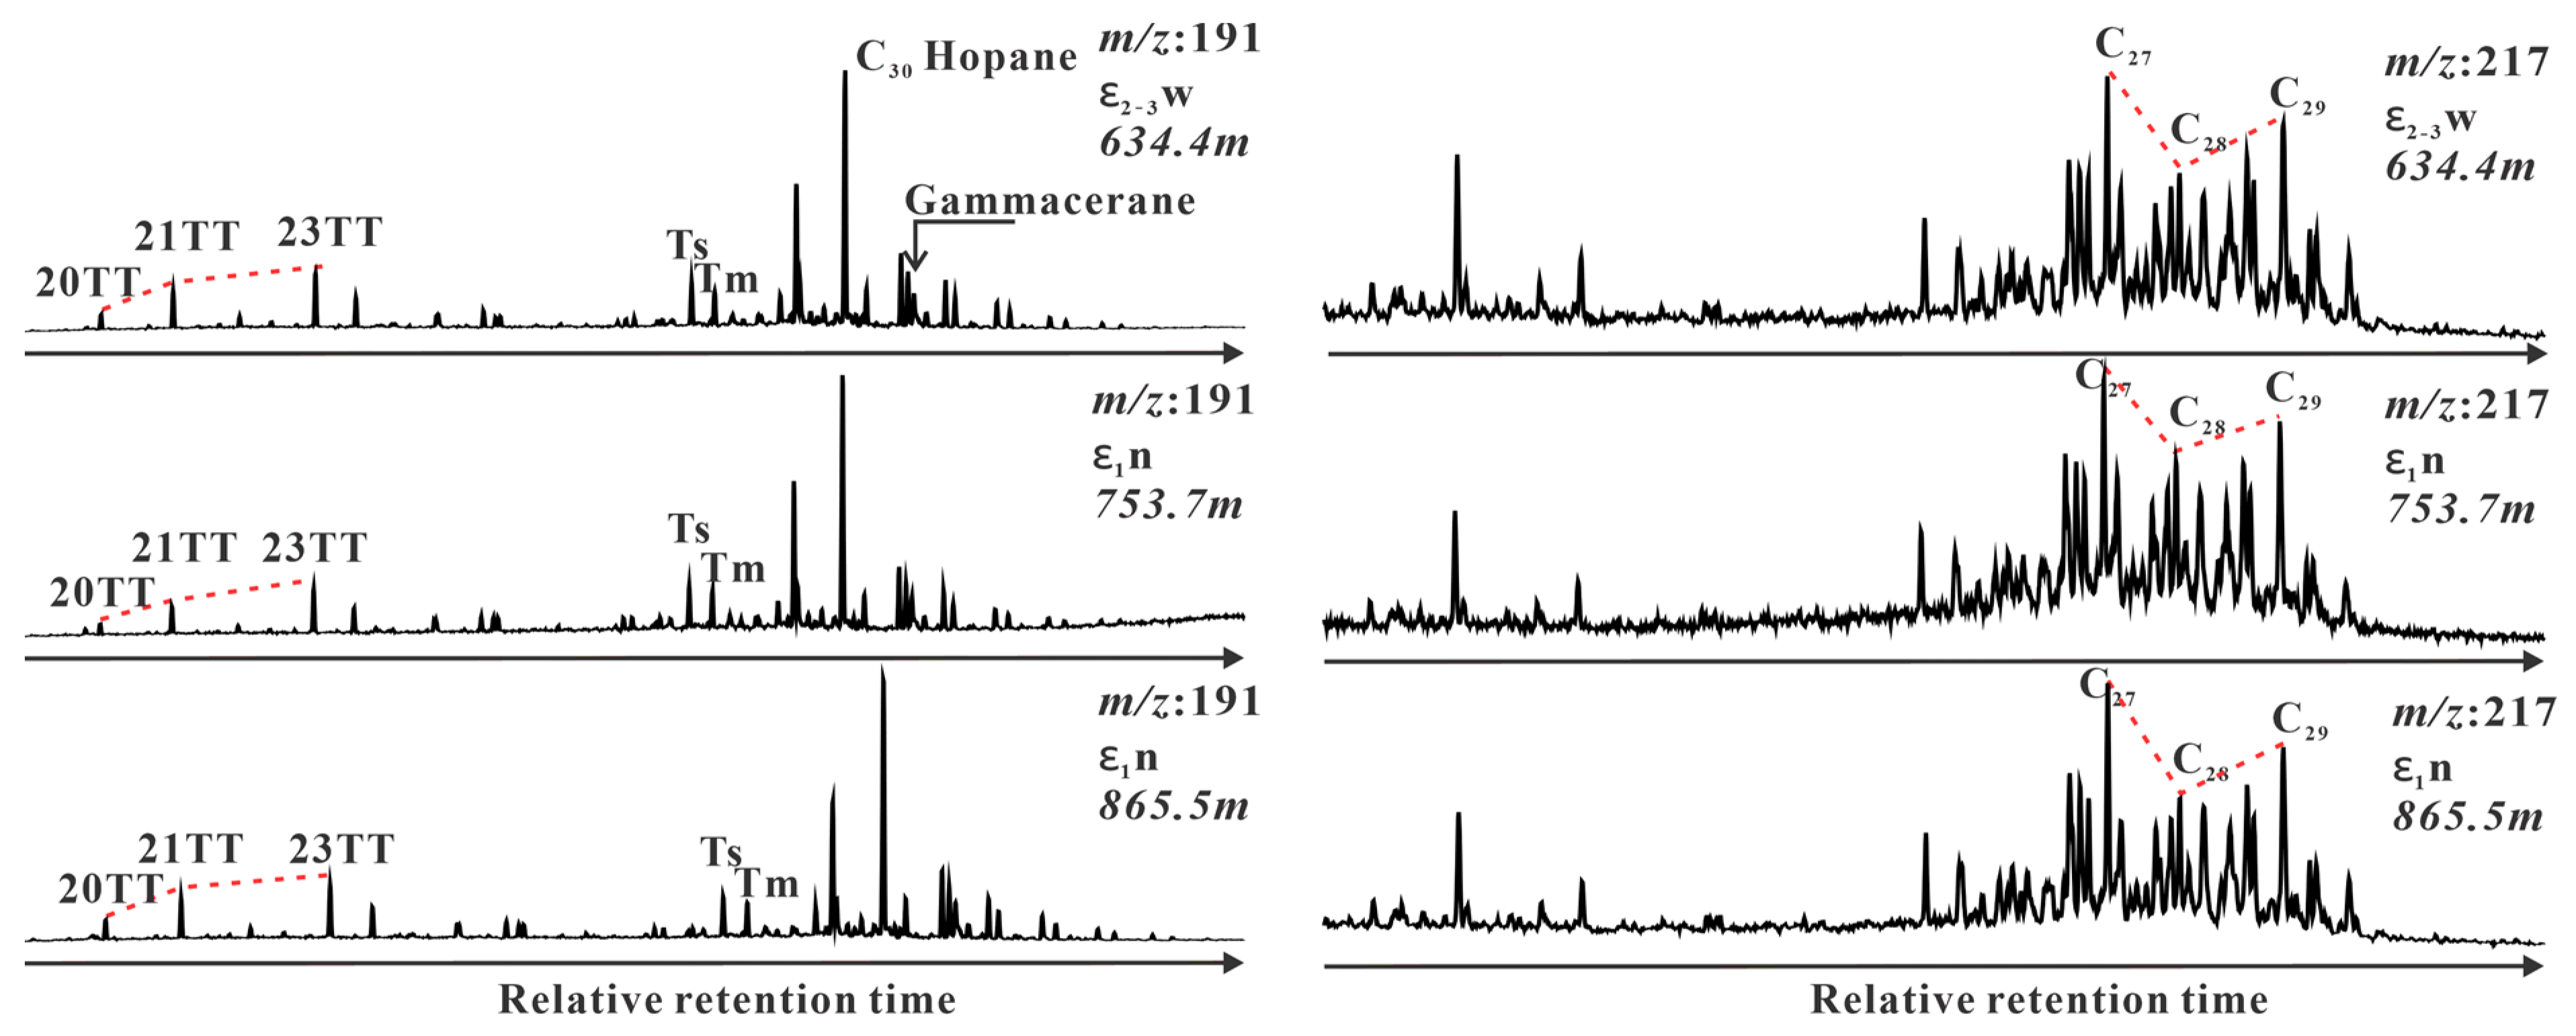
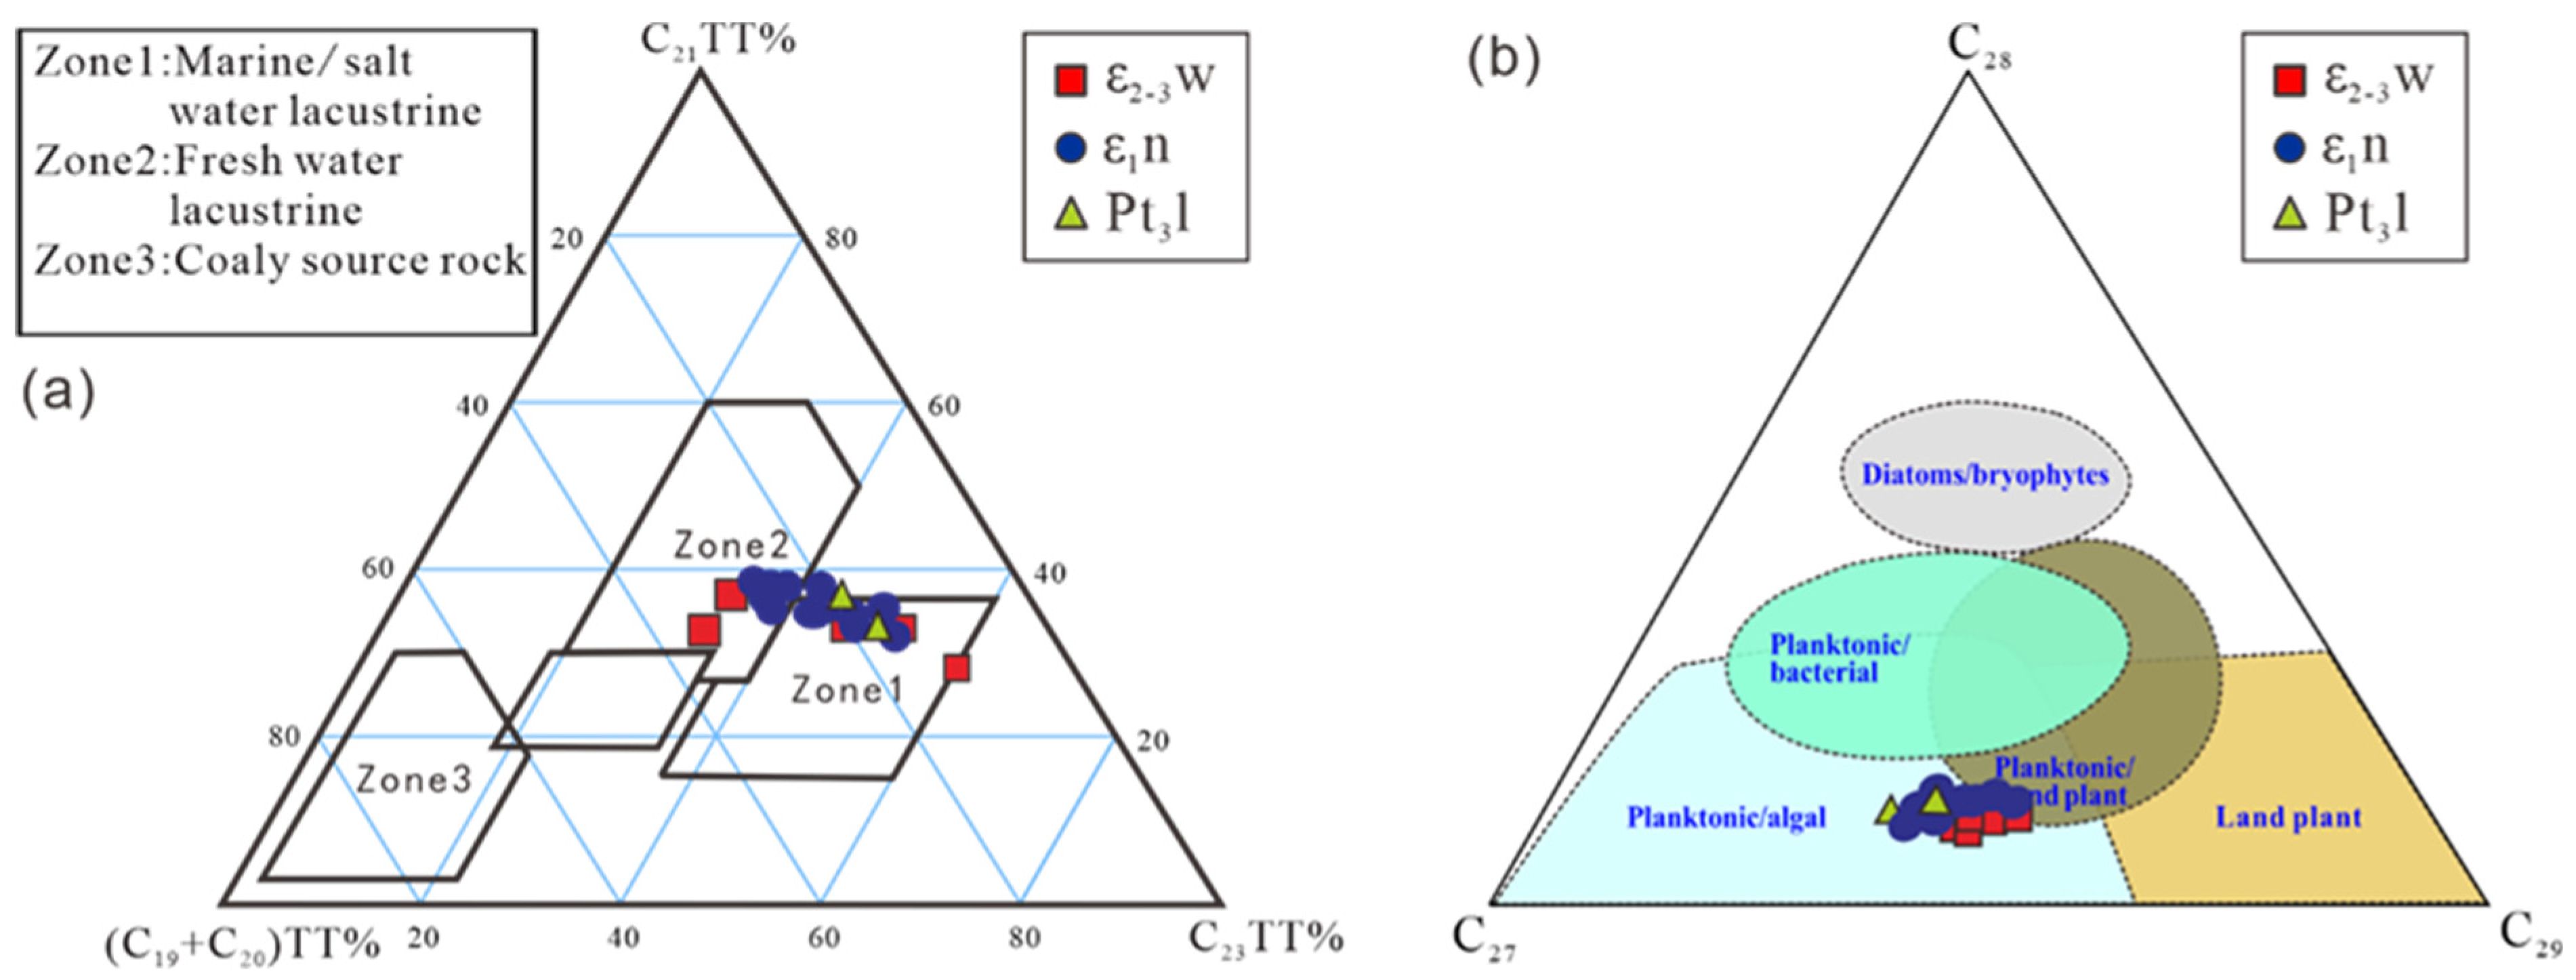
4.1.2. Molecular Geochemical Characteristics of the Black Shale

N-alkanes are typically major constituents of petroleum, and their n-alkane patterns can be used to identify organic sources due to the significant variation in the n-alkane series among different biological sources. The Cambrian black shale samples from the XAD1 well exhibit a similar distribution pattern of n-alkanes with carbon numbers ranging from nC17 to nC33, characterized by a unimodal pattern at nC23-nC24 where lower carbon-number n-alkanes are conspicuously absent (Figure 7). The absence of any obvious unresolved complex mixture (UCM) anomaly in the n-alkanes suggests that no biodegradation occurred, indicating that high maturity led to a low compound abundance.
Pristane (Pr) and phytane (Ph) are primarily derived from phytoalcohols through microbial action in bacteria and algae [35]. The extracts obtained from the XAD1 well’s Cambrian black shale exhibit low abundances of Pr and Ph, with Ph being higher than Pr. However, due to their extremely low concentrations, ratios calculated using these compounds along with adjacent n-alkanes hold little or no significance.
Terpanes and steranes are the primary biomarkers in crude oil and extracts, with their distributions and concentrations commonly employed for source facies identification and assessments of thermal maturity [36]. Tricyclic terpanes primarily originate from bacteria or lower algae. Generally, a tricyclic terpane abundance exhibits variations in the carbon number distribution across different organic facies; for instance, tricyclic terpanes are more abundant in salinized environments [37]. In terrestrial or freshwater lacustrine environments, tricyclic terpanes are dominated by low-carbon compounds with peaks at C19 or C21. Conversely, marine environments and salinized lacustrine environments exhibit peaks at C23 for tricyclic terpanes [38]. The distribution pattern of tricyclic terpanes in lower Cambrian black shale follows a trend, C20 < C21 < C23 (Figure 8), indicating algae as the primary source of organic matter [36]. This is consistent with the dominance of C27 sterane observed in regular sterane distributions (Figure 8 and Figure 9b). The triangular chart depicting C19+20TT-C21TT-C23TT reveals that most samples are plotted within Zone 1 with a smaller group falling into Zone 2, suggesting that the samples are mainly formed in marine depositional environments accompanied by water desalination sedimentary environments (Figure 9a) [38]. This environmental fluctuation is also reflected in the sterane triangle, which indicates the biological origin (Figure 9b). The Ts abundance surpassing the Tm abundance indicates high thermal maturity levels within the samples. Additionally, elevated salinity conditions can be inferred from the high abundance of gammacerane across all samples—indicating deposition under reducing saline water conditions—further supporting that organic matter mainly originated from algae and low-aquatic organisms.

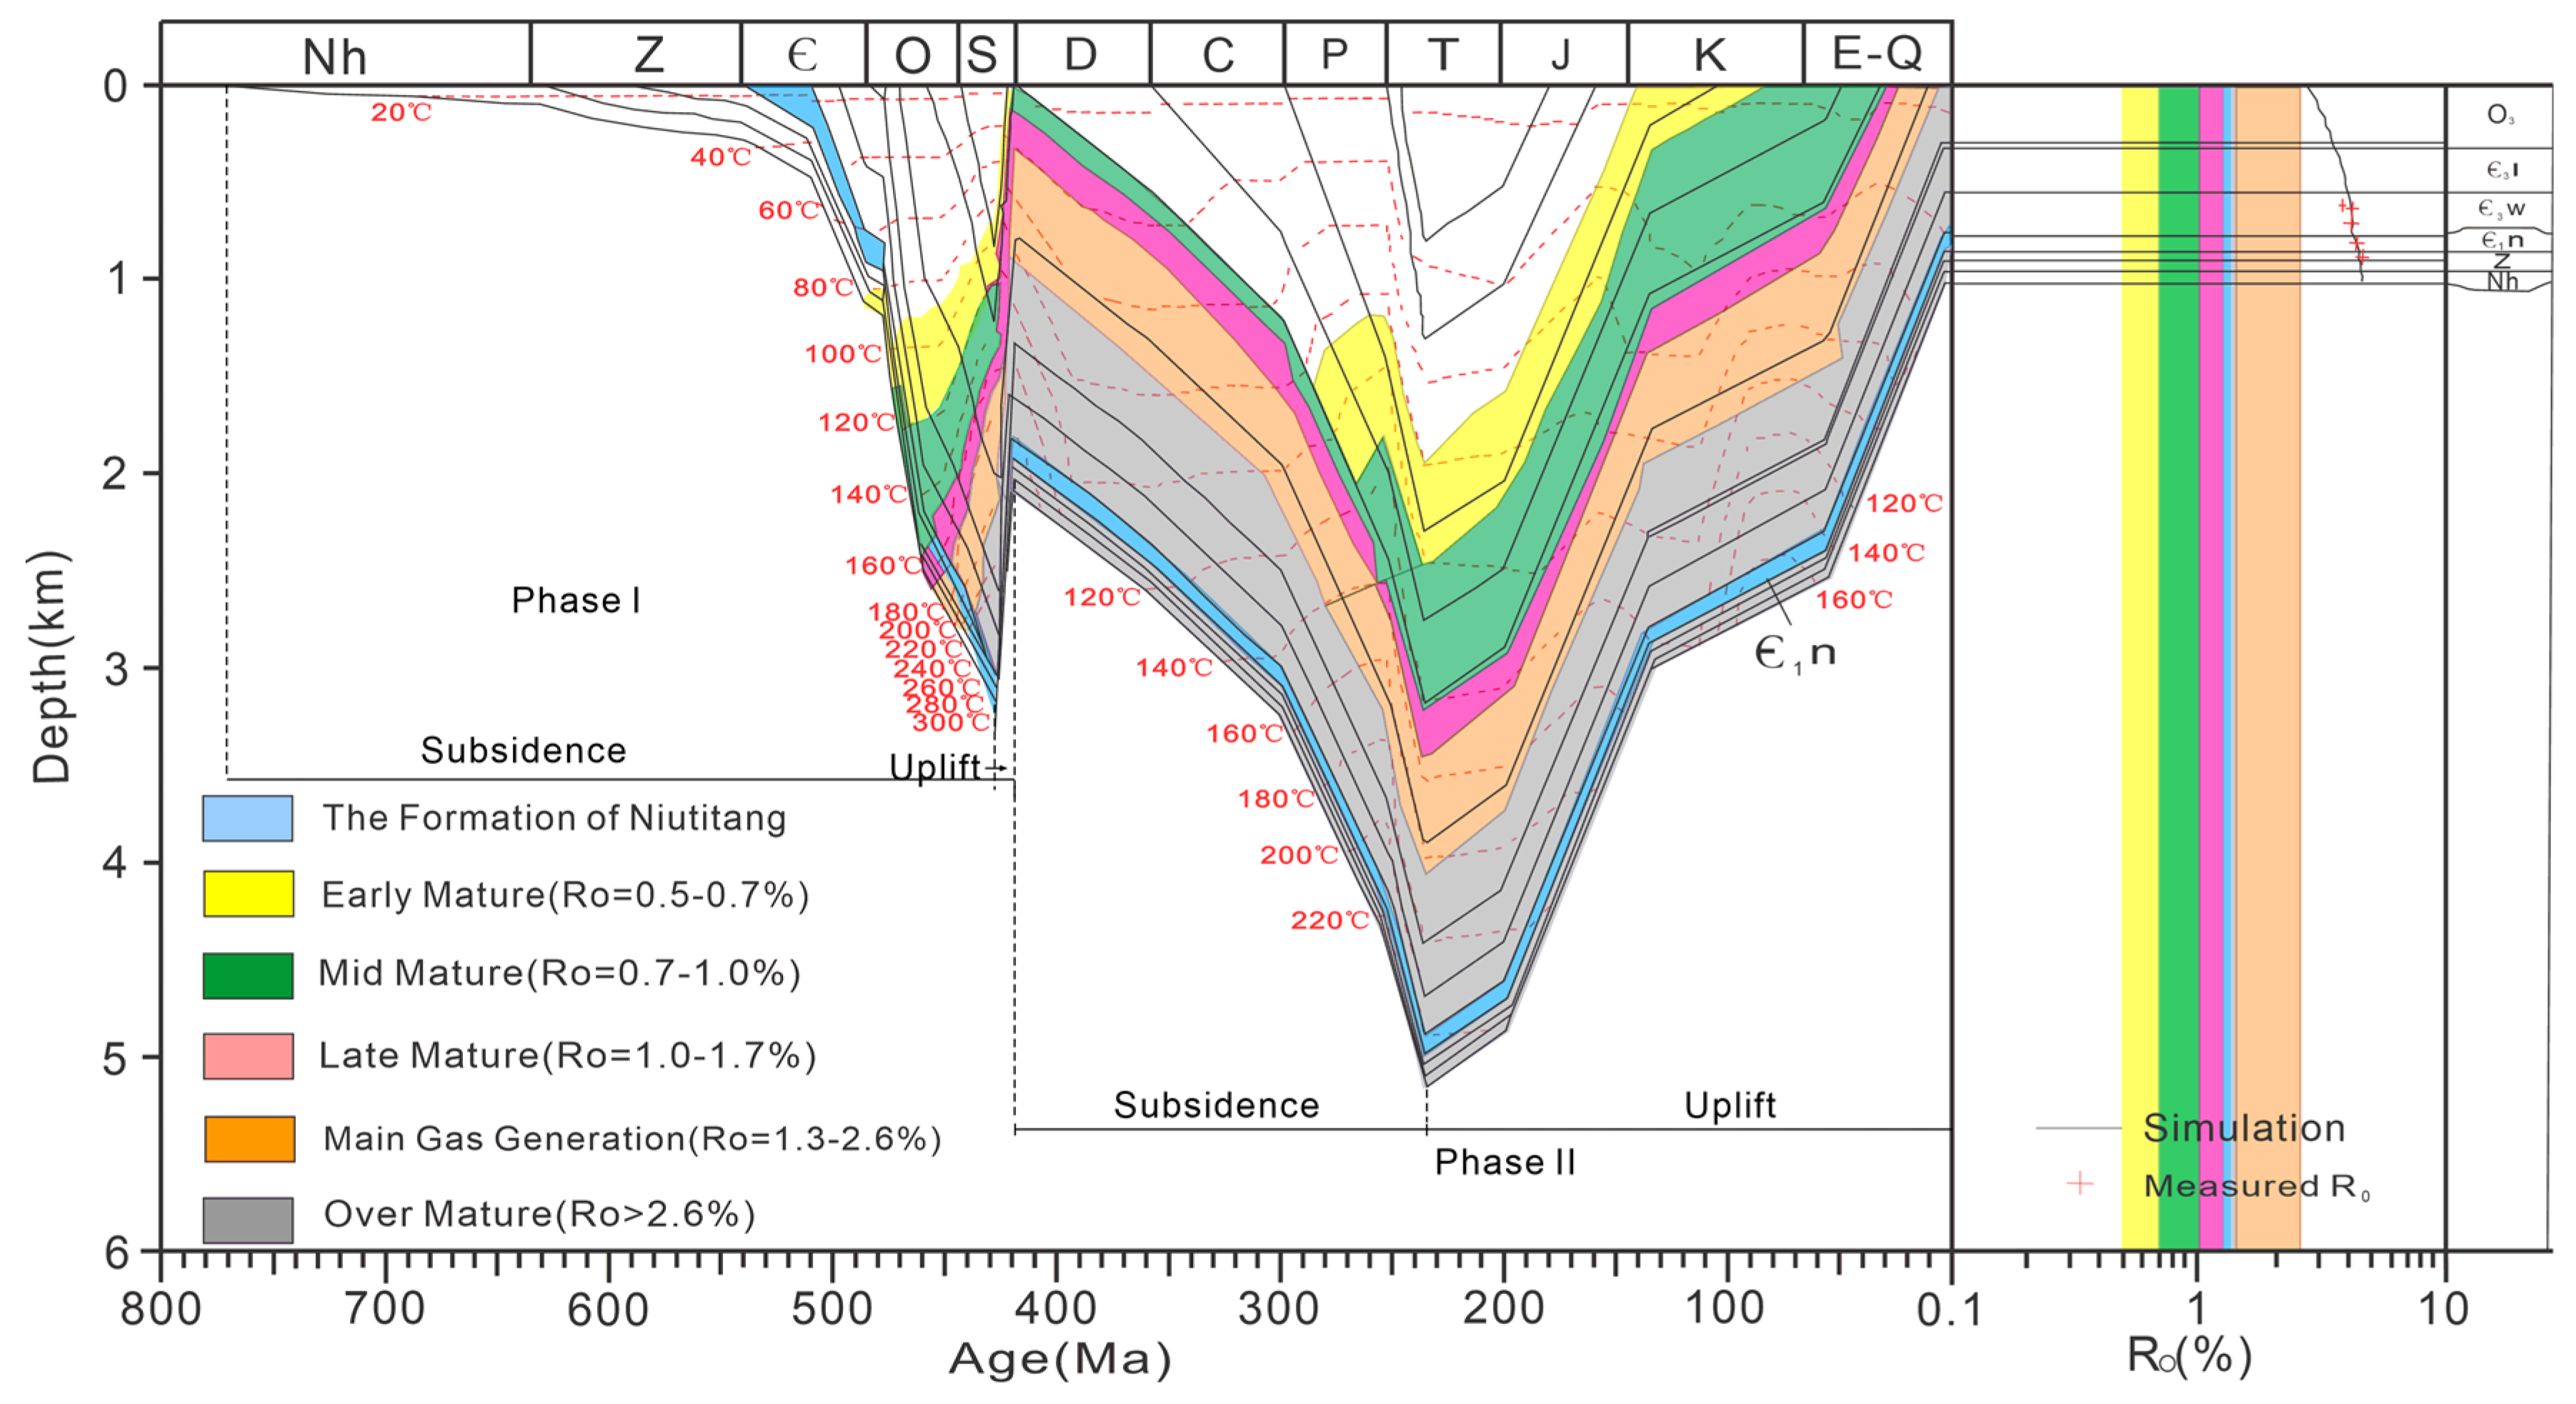
4.2. Burial History of Well XAD1

The burial history of well XAD1 was reconstructed to understand the thermal, pressure and petroleum generation histories, which are crucial for molecular dynamic simulations of natural gas content in shale reservoirs. Basin Mod 1D software was used to simulate the thermal history based on steady-state heat flow and constrained by the calculated vitrinite reflectance data. Figure 10 illustrates that rocks from well XAD1 experienced two subsidence events and two uplift events, with the maximum temperature occurring at the first maximum burial depth due to early rifting and magmatic activity. The Є1n shale underwent rapid thermal maturation during phase I subsidence, reaching its peak maturity at the end of the early Silurian period. Although buried to its maximum depth at the end of Middle Permian, the geothermal gradient was lower than that during the early Silurian period, resulting in a lower maximum temperature than that of the phase I subsidence due to the controlled magma intrusion during the late Cretaceous period being far less impactful compared to the combined rifting and magmatic activities during phase I subsidence. Furthermore, he Є1n shale in well XAD1 underwent rapid oil generation and cracking from the Cambrian to the early Silurian period; however, subsequent oil and gas loss occurred due to two large-scale uplifts and erosion.

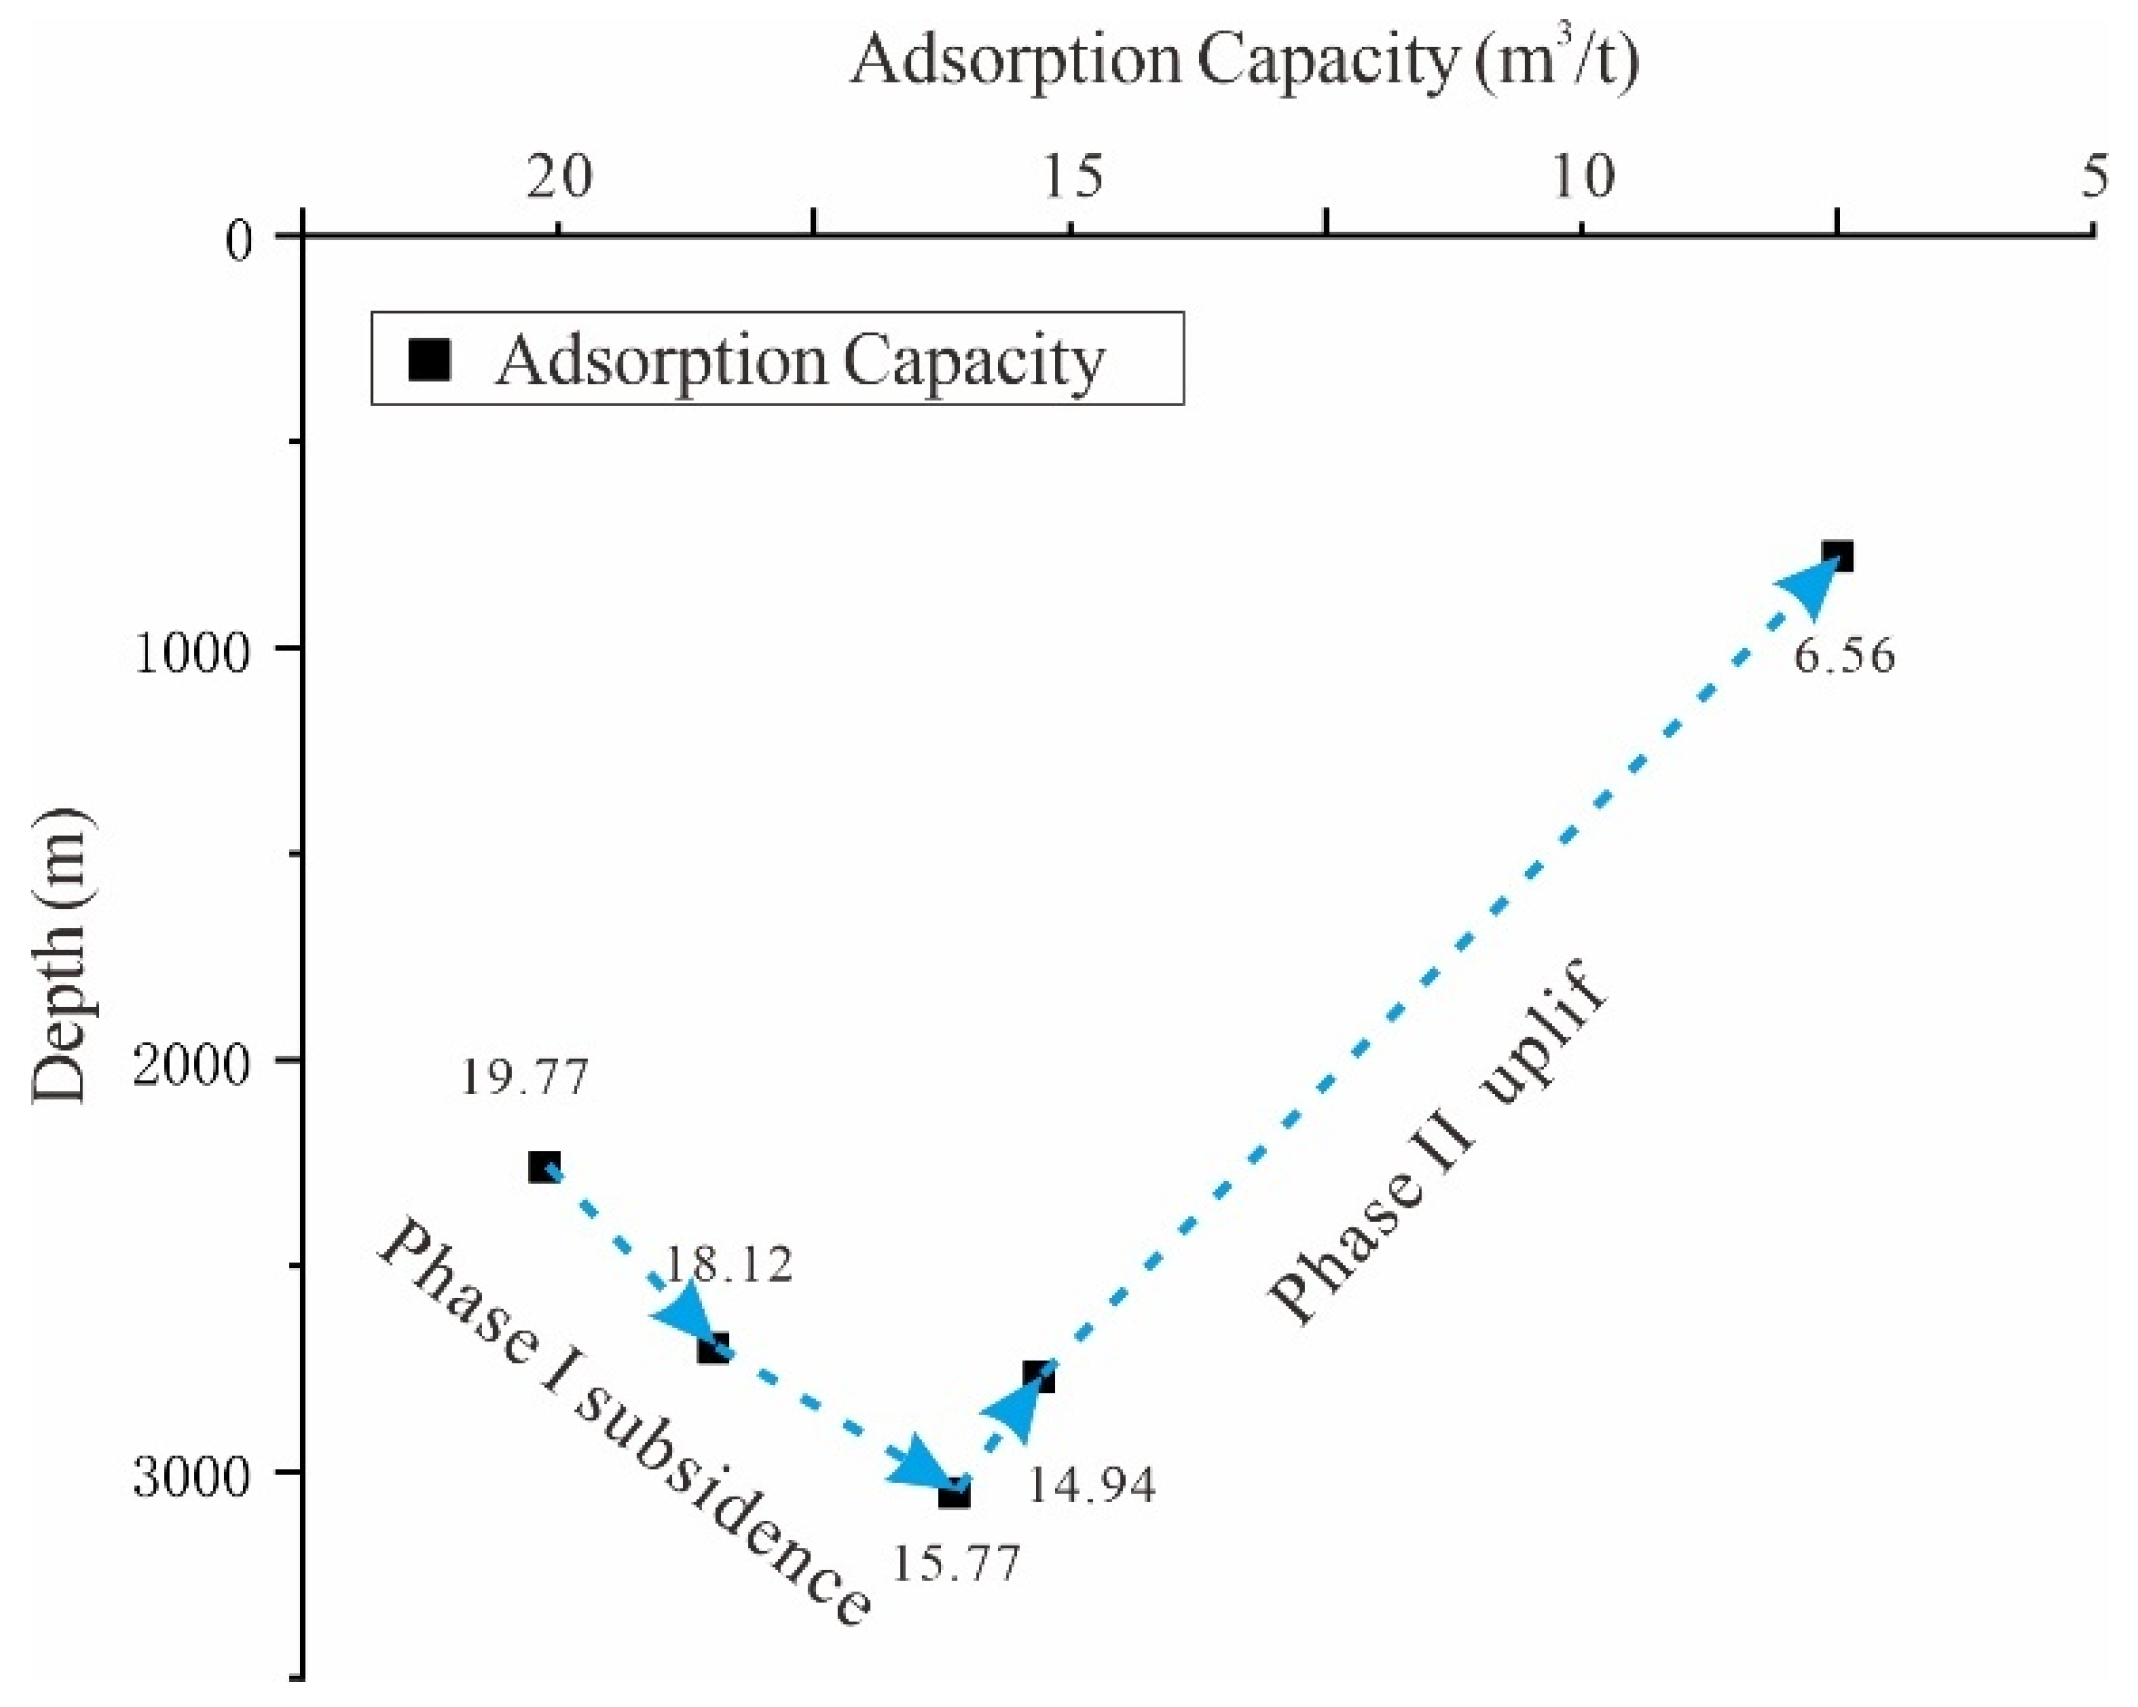
4.3. Methane Adsorption Characteristics

According to Section 4.1, the Є1n black shale was identified as the most favorable source bed among the three source rocks. For methane adsorption simulation, a depth of 778 m was selected at the midpoint of the Є1n Formation, with a TOC value (6.37%) close to its average TOC value (7.95%). The simulated points exhibit consistent organic matter content due to the completion of the hydrocarbon generation process. The molecular dynamic simulation utilizes formation pressure (hydrostatic pressure) and temperature data from the point located at the current burial depth of 778 m (Table 3 and Figure 9), aiming to investigate natural gas enrichment and loss within the target interval.
The methane molecular adsorption capacities of the simulated unit cell under different formation temperatures and pressures are presented in Table 4. It exhibits four phases. Phase I: the adsorption capacity of black shale for methane decreases with increasing depth (accompanied by gradually increasing in temperature and pressure) during phase I subsidence after petroleum generation. Phase II: it initially decreases and then increases again during phase I uplift (with a gradual decrease in temperature and pressure). Phase III: it gradually increases during phase II subsidence, with a decreasing temperature followed by an increase, along with a gradual increase in pressure (indicating burial depths beyond the initial level). Phase IV: it exhibits a gradual decrease during phase II uplift as both temperature and pressure decline.
The adsorption of methane by black shale gradually increases with rising temperature and pressure when the temperature is below 200 °C. However, the overall change is not significant, and pressure remains the main controlling factor affecting methane adsorption. Nevertheless, at temperatures of 220 °C and 280 °C, even though pressures can reach up to 30.5 Mpa, the black shale’s adsorption capacity for methane decreases. Therefore, it can be inferred that around 200 °C when the temperature gradually increases, temperature becomes the primary controlling factor affecting methane adsorption by black shale. Previous studies suggest that high temperatures are not conducive to methane molecule adsorption under similar pressure conditions [39]. When the adsorption heat exceeds 42 kJ/mol or is less than 42 kJ·mol−1, chemical or physical absorption occurs, respectively [40]. The kerogen and clay mineral (illite, montmorillonite and kaolinite) have an average absorption heat between 19~28 kJ/mol and 24~32 kJ/mol, indicating typical physical absorption [41,42]. As temperatures rise, the absorption heat decreases, weakening CH4 molecules’ bonding strength with kerogen and the clay minerals’ surfaces. Furthermore, the kinetic energy of the CH4 molecules also rises, making it easier for them to escape from bondage on kerogen and mineral molecular surfaces, resulting in a decrease in the macroscopic black shale’s adsorptive capacity.

4.4. Shale Gas-Bearing Capacity

The adsorption capacity simulated in this study is based on an ideal state, where the structure of illite and type I kerogen remain unchanged and unaffected, while other parameters (such as organic matter content, porosity, pore volume, density) are held constant. Only temperatures and pressures vary in the simulation. It should be noted that the simulation assumed an ample supply of pure CH4 molecules for adsorption without considering the influence of other molecules such as CO2, H2O and C2H6. Consequently, a significant volume was adsorbed.
Section 4.3 suggests that the Є1n shale underwent rapid thermal maturation during early rifting and magmatism in phase I subsidence, reaching maximum temperature and maturity (also current maturity) by the end of the early Silurian period. Therefore, the increase in adsorption capacity shown in Table 4 for phase II subsidence cannot occur under real geological conditions. After phase I subsidence, no petroleum was generated from black shale, and no significant gas could be supplied during subsequent uplift or subsidence events. Thus, the simulated adsorption capacity at a maximum depth of 3050 m in phase I should represent the highest gas adsorption capacity for subsequent geological processes. Any further increase due to increasing depth would not have occurred under the actual geological settings of the XAD1 well. The difference between the minimum and reduced adsorption capacities during following subsidence and uplift processes should be used as the actual adsorption capacity under ideal conditions (Table 5).
Theoretically, the current methane adsorption capacity of the lower Cambrian Niutitang black shale in Western Hunan province is 6.56 m3/t under ideal conditions (Table 5 and Figure 11). However, it does not align with the observed well results, where logging data indicate that the relative content of CH4 throughout the well ranges from 0.000 to 0.055% (Section 3.3), whereas typical measurements for shale gas reservoirs are generally greater than 1%. Consequently, there appears to be a lack of significant shale gas reserves in well XAD1. This discrepancy suggests the presence of additional factors influencing the potential for shale gas accumulation.
The observation of numerous veins in the Є1n black shale (Figure 4) suggests that dissolution and fracture fill are common features in this formation, which can significantly reduce the gas adsorption capacity when water is present [35,43,44]. Water molecules can occupy mineral adsorption sites and form hydrogen bonds with clay minerals or organic matter functional groups, leading to an enhanced water adsorption capacity and pore throat blockage. Ref. [45] reported a reduction of up to 67% in methane adsorption capacity with increasing moisture content in coal seams. The illite and type I kerogen cells have a methane adsorption capacity of approximately 1.968 m3/t under these conditions, which is consistent with low gas content observed at the XAD1 wellsite. In addition to these factors, errors may arise during model building due to neglecting the presence of the water medium during the simulation process as well as overestimating the porosity compared to measured values (1–4%). Although porosity may increase up to ~15–20% during burial processes, it remains lower than the modeled pore space.
This study was primarily based on the actual evolution of temperature and pressure during formation, as well as measured organic matter and clay mineral content, to simulate methane adsorption characteristics under anhydrous conditions to restore the adsorption characteristics of the study area. The simulation results partially reflect the evolution of methane adsorption in shale reservoirs within this region. It can be observed from these results that tectonic movement-induced changes in temperature and pressure are key factors controlling gas enrichment via adsorption in shale reservoirs. Furthermore, when considering the influence of formation water on organic matter and clay minerals, our simulation results align well with measured data.

5. Conclusions

(1)
The lower Cambrian black shales in well XAD1 have high but widely varied organic matter abundances, ranging from 0.47% to 19.69% with an average of 5.32%. Most TOCs are higher than 2.0%, which meets the requirements of shale gas exploitation. The equivalent vitrinite reflectance ranges from 3.02% to 3.35%, indicating over maturity for gas generation.
(2)
The biomarkers indicate that the black shales were deposited in an enhanced marine setting. The maturity of the biomarkers also indicates that the organic-rich shale has entered a high maturity stage.
(3)
The dynamic alteration of gas-bearing properties in shale reservoirs due to tectonic movements is a crucial factor influencing the success rate of shale gas exploration in the study area. The molecular dynamic simulation showed that the petroleum generation of the Cambrian black shale ended with the phase I subsidence, and shale methane adsorption was the largest (15.77 m3/t), assuming sufficient gas generation and an absence of CO2, H2O and other molecules at that period. Temperature and pressure variations caused by subsequent tectonic uplifts and subsidences led to a continuous decreasing shale methane adsorption (about 6.56 m3/t), since no natural gas was supplied in later stages. The methane adsorption capacity would be reduced to < 2 m3/t with water present in the shales in the study area. Two subsidence events and two uplifting events could have aggravated gas loss and eventually caused the abnormally low shale gas potential in the study area.

Author Contributions

Conceptualization, K.Z.; Methodology, X.T.; Software, X.T., X.L. and Z.Z.; Validation, Z.Z.; Writing—original draft, K.Z.; Writing—review & editing, X.T.; Supervision, M.L.; Funding acquisition, K.Z. All authors have read and agreed to the published version of the manuscript.

Funding

This research was funded by Chinese Academy of Geological Science grant number JYYWF20181201.

Data Availability Statement

Data are contained within the article.

Acknowledgments

We express our gratitude to China University of Petroleum (Beijing) for generously providing the necessary facilities for analytical measurements. The authors would also like to acknowledge the dedicated efforts of all staff members involved in the evaluation project of the Niutitang–Wunitang Formation shales. Furthermore, we wish to recognize the diligent work of the editor and appreciate the valuable comments provided by anonymous reviewers.

Conflicts of Interest

The authors declare no conflict of interest.

References

  1. Chen, X.; Shi, W.; Hu, Q.; Hou, Y.; Zhai, G.; Dong, T.; Zhou, Z.; Du, X. Origin of authigenic quartz in organic-rich shales of the Niutitang Formation in the northern margin of Sichuan Basin, South China: Implications for pore network development. Mar. Pet. Geol. 2022, 138, 105548. [Google Scholar] [CrossRef]
  2. Song, Y.; Li, Z.; Jiang, Z.; Luo, Q.; Liu, D.; Gao, Z. Progress and development trend of unconventional oil and gas geological research. Pet. Explor. Dev. 2017, 44, 675–685. [Google Scholar] [CrossRef]
  3. Yang, X.; Liu, X.; Wang, Y.; Liu, Y.; Zheng, J. The Tectonic Controls on the Disturibution of Marine Oil and Gas in the Adjacent Areas of Xuefeng Mountain. J. Southwest Pet. Univ. 2011, 33, 7–12, (In Chinese with English Abstract). [Google Scholar]
  4. Liu, Y.; Chen, D.; Qiu, N.; Fu, J.; Jia, J. Geochemistry and origin of continental natural gas in the western Sichuan basin, China. J. Nat. Gas Sci. Eng. 2018, 49, 123–131. [Google Scholar] [CrossRef]
  5. Wang, N.; Li, M.; Hong, H.; Song, D.; Tian, X.; Liu, P.; Fang, R.; Chen, G.; Wang, M. Biological sources of sedimentary organic matter in Neoproterozoic–Lower Cambrian shales in the Sichuan Basin (SW China): Evidence from biomarkers and microfossils. Palaeogeogr. Palaeoclimatol. Palaeoecol. 2019, 516, 342–353. [Google Scholar] [CrossRef]
  6. Awan, R.S.; Liu, C.; Gong, H.; Dun, C.; Tong, C.; Chamssidini, L.G. Paleo-sedimentary environment in relation to enrichment of organic matter of Early Cambrian black rocks of Niutitang Formation from Xiangxi area China. Mar. Pet. Geol. 2020, 112, 104057. [Google Scholar] [CrossRef]
  7. Wu, J.; Zhang, S.; Cao, H.; Zheng, M.; Sun, P.; Luo, X. Fracability evaluation of shale gas reservoir—A case study in the Lower Cambrian Niutitang formation, northwestern Hunan, China. J. Pet. Sci. Eng. 2018, 164, 675–684. [Google Scholar] [CrossRef]
  8. Yan, J.-F.; Men, Y.-P.; Sun, Y.-Y.; Yu, Q.; Liu, W.; Zhang, H.-Q.; Liu, J.; Kang, J.-W.; Zhang, S.-N.; Bai, H.-H.; et al. Geochemical and geological characteristics of the Lower Cambrian shales in the middle–upper Yangtze area of South China and their implication for the shale gas exploration. Mar. Pet. Geol. 2016, 70, 1–13. [Google Scholar] [CrossRef]
  9. Chen, G.; Zhang, J.; Lu, S.; Pervukhina, M.; Liu, K.; Xue, Q.; Tian, H.; Tian, S.; Li, J.; Clennell, M.B.; et al. Adsorption Behavior of Hydrocarbon on Illite. Energy Fuels 2016, 30, 9114–9121. [Google Scholar] [CrossRef]
  10. Kadoura, A.; Narayanan Nair, A.K.; Sun, S. Adsorption of carbon dioxide, methane, and their mixture by montmorillonite in the presence of water. Microporous Mesoporous Mater. 2016, 225, 331–341. [Google Scholar] [CrossRef]
  11. Sui, H.; Yao, J. Effect of surface chemistry for CH4/CO2 adsorption in kerogen: A molecular simulation study. J. Nat. Gas Sci. Eng. 2016, 31, 738–746. [Google Scholar] [CrossRef]
  12. Tian, S.; Xue, H.; Lu, S.; Zeng, F.; Xue, Q.; Chen, G.; Wu, C.; Zhang, S. Molecular Simulation of Oil Mixture Adsorption Character in Shale System. J. Nanosci. Nanotechnol. 2017, 17, 6198–6209. [Google Scholar] [CrossRef]
  13. Zhang, J.; Clennell, M.B.; Liu, K.; Pervukhina, M.; Chen, G.; Dewhurst, D.N. Methane and Carbon Dioxide Adsorption on Illite. Energy Fuels 2016, 30, 10643–10652. [Google Scholar] [CrossRef]
  14. Wang, J.; Li, Z. History of Neoproterozoic rift basins in South China: Implications for Rodinia break-up. Precambrian Res. 2003, 122, 141–158. [Google Scholar] [CrossRef]
  15. Zhou, X.M.; Li, W.X. Origin of Late Mesozoic igneous rocks in Southeastern China: Implications for lithosphere subduction and underplating of mafic magmas. Tectonophysics 2000, 326, 269–287. [Google Scholar] [CrossRef]
  16. Xue, Y.; Tang, T.; Yu, C. Division and Comparison of Late Sinian Strata in Southern Anhui and Western Hunan. J. Stratigr. 1989, 13, 52–58. [Google Scholar]
  17. Zhu, M.; Strauss, H.; Shields, G.A. From snowball earth to the Cambrian bioradiation: Calibration of Ediacaran–Cambrian earth history in South China. Palaeogeogr. Palaeoclimatol. Palaeoecol. 2007, 254, 1–6. [Google Scholar] [CrossRef]
  18. Espitalié, J.; Laporte, J.L.; Madec, M.; Marquis, F.; Leplat, P.; Paulet, J.; Boutefeu, A. Rapid Method for Source Rocks Characrerysation and for Determination of Petroleum Potential and Degree of Evolution. OGSAT 1977, 32, 23–42. [Google Scholar] [CrossRef]
  19. GB/T 18602-2012; Rocl Pyrolysis Analysis. The China National Standardization Management Committee: Beijing, China, 2012.
  20. Jacob, H. Disperse Solid Bitumens as an Indicator for Migration and Maturity in Prospecting for Oil and Gas. Erdol Kohgle 1985, 38, 365. [Google Scholar]
  21. Liu, D.H.; Shi, J.Y. Study on the evaluation methods on high matured carbonate source rocks. Pet. Explor. Dev. 1994, 21, 113–115. [Google Scholar]
  22. Xiao, X.; Wilkins, R.W.T.; Liu, D.; Liu, Z.; Fu, J. Investigation of thermal maturity of lower Palaeozoic hydrocarbon source rocks by means of vitrinite-like maceral reflectance—A Tarim Basin case study. Org. Geochem. 2000, 31, 1041–1052. [Google Scholar] [CrossRef]
  23. Shen, X.; Bourg, I.C. Molecular dynamics simulations of the colloidal interaction between smectite clay nanoparticles in liquid water. J. Colloid Interface Sci. 2021, 584, 610–621. [Google Scholar] [CrossRef]
  24. Tabatabai, M.A.; Sparks, D.L.; Goldberg, S. Equations and Models Describing Adsorption Processes in Soils; John Wiley & Sons, Ltd.: Hoboken, NJ, USA, 2005. [Google Scholar]
  25. Deng, Y.; Yang, R.; Xiao, Z.; Wang, C. Potential Assessment on the Shale Gas Resource in Lower Cambrian Niutitang Formation, Zhangjiajie. Geol. Miner. Resour. South China 2020, 36, 177–185, (In Chinese with English Abstract). [Google Scholar]
  26. Peng, Z. Geological Conditions and Exploration Potential of Shale Gas in the Niutitang Formation of the Lower Cambrian in the Yuanma Basin and Its Periphery Area. Ph.D. Thesis, China University of Geosciences, Wuhan, China, 2019. [Google Scholar]
  27. Al Jamri, M.; Smith, R.; Li, J. Molecular Modelling of Co-processing Biomass Pyrolysis Oil with Vacuum Gasoil in an Oil Refinery Fluid Catalytic Cracking Unit. In Computer Aided Chemical Engineering; Kiss, A.A., Zondervan, E., Lakerveld, R., Özkan, L., Eds.; 29 European Symposium on Computer Aided Process Engineering; Elsevier: Amsterdam, The Netherlands, 2019; Volume 46, pp. 991–996. [Google Scholar] [CrossRef]
  28. Gualtieri, A.F. Accuracy of XRPD QPA Using the Combined Rietveld–RIR Method. J. Appl. Crystallogr. 2000, 33, 267–278. [Google Scholar] [CrossRef]
  29. Ungerer, P.; Collell, J.; Yiannourakou, M. Molecular Modeling of the Volumetric and Thermodynamic Properties of Kerogen: Influence of Organic Type and Maturity. Energy Fuels 2015, 29, 91–105. [Google Scholar] [CrossRef]
  30. Fu, J.; Liu, D. Some Characteristics of the Evolution of Organic Matter in Carbonate Formations. Acta Pet. Sin. 1982, 1, 1–9, (In Chinese with English Abstract). [Google Scholar]
  31. Hao, S.; Wang, F.; Gao, G.; Gang, W. Characteristics and evaluation of high-over mature hydrocarbon source rocks in the Lower Paleozoic. Explorationist 1996, 1, 25–32. (In Chinese) [Google Scholar]
  32. Feng, G.; Chen, S. Relationship between Bitumen Reflectance and Vitrinite Reflectance in Rocks. Nat. Gas Ind. B 1988, 3, 7+30–35. (In Chinese) [Google Scholar]
  33. Guo, Y.; Liang, M.; Wang, Z.; Zhang, L.; Li, H.; Li, X. Organic Geochemistry and Mineral Composition Characteristics in Shales of Niutitang Formation, Northwestern Hunan. J. Geomech. 2019, 25, 392–399, (In Chinese with English Abstract). [Google Scholar]
  34. Chen, J.; Liang, D.; Zhang, S.; Deng, C.; Zhao, Z.; Zhang, D. Evaluation Criterion and Methods of the Hydrocarbon Generation Potential for China’s Paleozoic Marine Source Rocks. Acta Geol. Sin. 2012, 86, 1132–1142. [Google Scholar]
  35. Wang, P.; He, W.; Chen, Q.; Zhu, C.; Zhang, C. Molecular Marker Mass Chromatogram Atlas; Science Press: Beijing, China, 2018; ISBN 978-7-03-055701-8. [Google Scholar]
  36. Peters, K.E.; Moldowan, J.M. The Biomarker Guide: Interpreting Molecular Fossils in Petroleum and Ancient Sediments; Prentice Hall: Englewood Cliffs, NJ, USA, 1993. [Google Scholar]
  37. Xiao, H.; Wang, T.-G.; Li, M.; Fu, J.; Tang, Y.; Shi, S.; Yang, Z.; Lu, X. Occurrence and Distribution of Unusual Tri- and Tetracyclic Terpanes and Their Geochemical Significance in Some Paleogene Oils from China. Energy Fuels 2018, 32, 7393–7403. [Google Scholar] [CrossRef]
  38. Xiao, H.; Li, M.; Yang, Z.; Zhu, Z. The distribution patterns and geochemical implication of C19–C23 tricyclic terpanes in source rocks and crude oils occurred in various depositional environment. Geochimica 2019, 48, 161–170. [Google Scholar]
  39. Zhang, T.; Xu, H.; Li, S.; Ren, S. The effect of temperature on adsorbing capability of coal. J. China Coal Soc. 2009, 34, 802–805. [Google Scholar]
  40. Fu, X.; Shen, W.; Yao, T. Physical Chemistry, 4th ed.; Higher Education Press: Beijing, China, 1993. [Google Scholar]
  41. Shi, J.; Chen, C.; Gong, L.; Bai, Z.; Sun, S. Characteristic of Adsorption and Diffusion for Methane in Kerogen. J. Eng. Thermophys. 2019, 60, 1338–1343. [Google Scholar]
  42. Sun, R.; Zhang, Y.; Fan, K.; Shi, Y.; Yang, S. Molecular simulations of adsorption characteristics of clay minerals in shale. CIESC J. 2015, 66, 2118–2122. [Google Scholar]
  43. Zhao, T.; Li, X.; Zhao, H.; Li, M. Molecular simulation of adsorption and thermodynamic properties on type II kerogen: Influence of maturity and moisture content. Fuel 2017, 190, 198–207. [Google Scholar] [CrossRef]
  44. Zou, J.; Reza, R.; Quan, X.; Lijun, Y.; Kouqi, L.; Ali, S. Investigation of moisture effect on methane adsorption capacity of shale samples. Fuel 2018, 232, 323–332. [Google Scholar] [CrossRef]
  45. Liu, X.; He, X.; Qiu, N.; Yang, X.; Tian, Z.; Li, M.; Xue, Y. Molecular simulation of CH4, CO2, H2O and N2 molecules adsorption on heterogeneous surface models of coal. Appl. Surf. Sci. 2016, 389, 894–905. [Google Scholar] [CrossRef]
Figure 1. Geographical location of the study area.
Energies 17 01743 g001
Figure 2. The structural evolution of the Xuefeng uplift, modified after [3].
Energies 17 01743 g002
Figure 3. The stratigraphic column of the XAD1 well in the Xuefeng uplift.
Energies 17 01743 g003
Figure 4. Photographs of hand specimens in well XAD1 (a) Calcite veins observed in the Wunitang (Є2–3w) shale in the XAD1 well at a depth of 657.7 m, (b) calcite concretion observed in the Niutitang (Є1n) shale in the XAD1 well at a depth of 823.1 m and (c) calcite veins observed in the Liuchapo (Pt3l) shale in the XAD1 well at a depth of 916.1 m.
Energies 17 01743 g004
Figure 6. Depth profiles of organic geochemical columns of well XAD1.
Energies 17 01743 g006
Figure 7. The distribution of normal alkanes and acyclic isoprene (a) and cross-plot of the ratios Ph/nC18 versus Pr/nC17 (b) of lower Cambrian black shale from the XAD1 well.
Energies 17 01743 g007
Figure 8. Mass chromatograms of saturated hydrocarbons m/z 191 and m/z 217 extracted from lower Cambrian black shale from the XAD1 well (The red dotted line represents the distribution trend of the compound).
Energies 17 01743 g008
Figure 9. Ternary diagrams showing the relative compositions of C19-20TT-C21TT-C23TT [38] (a) and C27-C28-C29 regular sterane (b) of lower Cambrian black shale from the XAD1 well.
Energies 17 01743 g009
Figure 10. Thermal maturation of source rocks at well XAD1.
Energies 17 01743 g010
Figure 11. Variation in the adsorption capacity of black shale in the XAD1 well (The blue arrows represent the trend of the adsorption capacity).
Energies 17 01743 g011
Table 3. Measured formation temperatures and pressures of the lower Cambrian black shale from the XAD1 well.
Depth (m)Temperature (°C)Temperature (K)Pressure (Mpa)
226015042322.6
270018545822.7
305028055330.5
226022049322.6
185017044318.5
299014842129.9
496020247549.6
277012039327.7
778403137.78
Table 4. Adsorption capacity of black shale under different burial depths.
Depth (m)Temperature (°C)Pressure (Mpa)Adsorption Capacity (m3/t)Periods
226015022.619.77Phase I subsidence
270018527.018.12
305028030.515.77
305028030.515.77Phase I uplift
226022022.615.19
185017018.515.80
185017018.515.80Phase II subsidence
299014829.923.82
496020249.626.43
496020249.626.43Phase II uplift
277012027.725.60
778407.7817.80
Table 5. Actual adsorption capacity of black shale under different burial depths (modified according to Table 3).
Depth (m)Temperature (°C)Pressure (Mpa)Adsorption Capacity (m3/t)
226015022.619.77
27001852718.12
305028030.515.77
226022022.615.19
277012027.7=15.19 − (26.43 − 25.6) = 14.36
778407.78=14.36 − (25.6 − 17.8) = 6.56
Disclaimer/Publisher’s Note: The statements, opinions and data contained in all publications are solely those of the individual author(s) and contributor(s) and not of MDPI and/or the editor(s). MDPI and/or the editor(s) disclaim responsibility for any injury to people or property resulting from any ideas, methods, instructions or products referred to in the content.

