Article

Integration of Piezoelectric Energy Harvesting Systems into Building Envelopes for Structural Health Monitoring with Fiber Optic Sensing Technology

by
Alessandro Pracucci
1,2,*,
Laura Vandi
1,
Francesco Belletti
1,
Amanda Ramos Aragão Melo
3,
Marios Vlachos
4,
Angelos Amditis
4,
Maria Teresa Calcagni
5 and
David Seixas Esteves
3
1
Focchi S.p.A., 47824 Poggio Torriana, Italy
2
Levery s.r.l. Società Benefit, 47814 Bellaria Igea Marina, Italy
3
CeNTI—Centro De Nanotecnologia E Materiais Tecnicos, Funcionais E Inteligentes, 4760-034 Vila Nova de Famalicão, Portugal
4
ICCS—Institute of Communication and Computer Systems, 15773 Athens, Greece
5
Department of Industrial Engineering and Mathematical Sciences, Università Politecnica delle Marche, 60126 Ancona, Italy
*
Author to whom correspondence should be addressed.
Energies 2024, 17(7), 1789; https://doi.org/10.3390/en17071789
Submission received: 6 February 2024 / Revised: 14 March 2024 / Accepted: 28 March 2024 / Published: 8 April 2024
(This article belongs to the Section G1: Smart Cities and Urban Management)

Abstract

:
This paper presents a study about the integration of Piezoelectric Energy Harvesting Systems (PE-EHSs) into building envelopes for powering Fiber Bragg Grating (FBG) sensors, enabling efficient and low-consumption monitoring with the objective of leveraging structural health monitoring (SHM). The research includes preliminary tests conducted in a real environment to validate the PE-EHS when fully integrated into a ventilated façade, capturing mechanical vibrations generated mainly by wind loads. Based on these activities, the final configuration of PE-EHSs is defined to provide a complete system for façade monitoring. This integrated system includes the piezoelectric generator (PEG), supercapacitor (SC), Power Conditioner Circuit (PCC), Fiber Optic Sensing (FOS) interrogator, and the IoT gateway transmitting measurement data within an Internet of Things (IoT) monitoring platform. This configuration is tailored to address the challenges related to the structural integrity of building envelopes. Results demonstrate a potential for a stand-alone solution in the façade sector but raise issues for certain limitations, requiring further investigation. In particular, the study emphasizes constraints related to the energy production of PE-EHSs for façade integration. It highlights the necessity to carefully consider these limitations within the broader context of their applicability, providing insights for the informed deployment of piezoelectric energy harvesting technology in building envelope monitoring.

1. Introduction

The smart built environment is an increasing topic within the industry sector capable of enabling dynamic control and operation in buildings, thanks in particular to a data-driven approach to building environments using the Internet of Things (IoT) [1,2,3,4,5] to enable the so-called intelligent building [6]. Within the EU, the adoption of smart solutions is collaborating in the construction market to achieve strategic results defined by European strategies, policies, and directives [7,8,9,10,11] for smart operations in the building, increasing the capability to collect data in order to adopt actions about energy optimization, comfort deployment, and overall efficient building management [12,13]. The integration of smart components raises an issue related to their energy demand within the building, and the adoption of renewable energy sources within buildings has gained significant traction in achieving energy independence and sustainability at the building scale [14]. Building microgrids and nanogrids are emerging as key solutions for managing and utilizing renewable energy sources within building environments, enabling the integration of diverse renewable energy sources, such as solar photovoltaics (PVs), wind turbines, and micro-hydropower systems, alongside traditional grid connections and energy storage solutions [15,16,17]. Intelligent buildings integrated with renewable resources are the trend of next-generation buildings, along with the necessity to manage energy load capacity, which refers to the maximum amount of electrical power a building can safely draw from the grid at any given time. Traditionally, buildings relied solely on the main grid, leaving them vulnerable to power outages and limited control over energy costs, but microgrids offer a promising solution for smart buildings. These localized power systems combine diverse renewable energy sources, such as solar panels and wind turbines, with energy storage systems. By integrating these resources, microgrids can significantly reduce reliance on the main grid, enhancing energy security and potentially lowering costs. Several studies highlight the synergy between smart buildings and microgrids, highlighting the challenges of designing microgrids for buildings and emphasizing the need to balance local load capacity and renewable energy sources. The potential of even smaller nanogrids for smart buildings within the broader context of smart cities is gaining space [15], underlining the continuous development of innovative solutions for managing energy load capacity and promoting the integration of renewable energy sources into smart buildings. In this scenario, the integration of renewable resources into intelligent buildings aligns with the growing interest in utilizing microgrids for energy efficiency and savings in intelligent buildings. However, unlike traditional transmission or distribution networks, intelligent buildings with microgrids face unique challenges due to the uncertainties and uncontrollable nature of renewable energy sources like wind turbines and photovoltaic arrays. Their output depends heavily on factors like temperature, solar radiation, and wind speed. In this scenario, while balancing renewable energy sources at the building scale with microgrids and energy grids is a well-established scenario [18,19,20], the smart component with IoT embedded in building products addresses self-powered solutions adopting energy harvesting [21,22,23]. In this context, the role of active modules in providing building envelopes with capabilities is a path of research widely researched within smart building components [24,25,26,27], and the role of energy harvesting can boost their adoption. The façade integration of smart components can include components such as shading, actuators for openable vents supplied by the building energy system and connected to the Building Management System (BMS), but also active technology such as PVs or solar collectors, as well as IoT, sensors, and AI edge solutions. While active components require a relevant amount of energy for their powering and the connection to the building grid and its renewable energy sources is mandatory, the integration of IoT, sensors, and AI embedded into the façade opens the research to market analysis for the development of systemic solutions capable of providing self-powered systems capable of reading data, providing data, and analyzing these data for users’ utilization. In this frame, it appears to be an opportunity for the exploitation of energy harvesting solutions in the façade. Although multiple projects have investigated this goal using Building Integrated Photo Voltaic (BIPV) products [28,29] in particular, the introduction of energy harvesting based on Piezoelectric Energy Harvesting Systems (PE-EHSs) can represent a valuable option for building envelope integration. The scientific community has deeply investigated piezoelectric cantilevers, even for smart building applications [30,31,32]. However, the adoption of a PE-EHS cantilever in the façade is a challenge that needs to be further addressed. Indeed, based on the exploitation of the wind load and rain drops [33,34,35], its applicability has demonstrated some limitations due to energy constraints and overall architectural limitations and integration [36,37,38,39]. This paper presents alternative solutions investigated to integrate PE cantilevers into building envelopes with the purpose of validating their ability to function effectively even under challenging environmental conditions, such as the unstable and non-parallel airflow patterns commonly encountered within building façades. By addressing these non-ideal boundary conditions, this study aims to broaden the applicability of piezoelectric energy harvesting in the context of smart buildings, paving the way for a more robust and versatile approach to self-powered building components.
The utilization of energy harvesting from piezoelectric cantilevers opens an opportunity for self-powered monitoring systems. In recent years, the utilization of sensing technologies to address structural health monitoring (SHM) for civil construction has emerged [40], and it is also moving to building applications, thanks to the versatility of the sensing technologies adopted [41,42,43]. With a focus on building envelopes, the importance of integrating sensors into façades lies in the opportunity to provide data about physical parameters useful for addressing actions for building maintenance for high-rise buildings that are exposed to more stressful conditions. The introduction of embedded sensors within building envelopes for SHM guarantees continuous monitoring, and the utilization of miniaturized technologies such as fiber optic sensors (FOSs) using specific Fiber Bragg Grating (FBG) to collect data [44] can represent an opportunity to have small-size and low-energy-consumption technology embedded.
In line with this research scenario, one of the targets of the EU-funded InComEss project [45] is to develop and evaluate the performance of the PE-EHS to harness its energy production for the energy supply of a structural health monitoring system by integrating FBG/FOS. The InComEss system architecture aims to exploit the PE-EHS to supply energy to an FOS monadgator, which reads FBG data and communicates with a Power Conditioner Circuit (PCC) integrated with a Printed Circuit Board (PCB) powered by a local supercapacitor (SC). The PCC/PCB is connected via an IoT gateway to a cloud-based Internet of Things (IoT) monitoring platform for data collection and analysis. The goal is to demonstrate the feasibility of wireless sensor networks (WSNs) for SHM. Within the overall project expected results, the paper presents the results achievable by the PE-EHS within the overall InComEss system for contributing to the scientific scenario in support of analysis useful for establishing a stand-alone solution for structural health monitoring of façades using low-consumption sensing technology-based fiber optic sensors and the associated low-power wireless interrogator. The research aims to integrate piezoelectric cantilevers into building envelopes, ensuring both technological and architectural integration. The primary advancement within the scientific framework is to investigate whether piezoelectric cantilevers can effectively operate as energy harvesters for smart components within building envelopes, even under challenging conditions, such as unstable and non-parallel airflow, and considering architectural limitations, such as fully embedded and non-visible integration required by the market, which are typical boundary conditions for façades.
The paper is structured as follows: Section 2 outlines the methods used for the identification of PE-EHS configurations and the InComEss system architecture, along with the tests conducted for validation. Section 3 presents the outcomes from preliminary testing activities to the final laboratory test, displaying collected data and graphical representations for PE-EHSs and overall InComEss system architecture validation. Section 4 highlights the successful aspects of PE-EHSs and the InComEss system architecture while also addressing gaps identified due to research and test limitations. Section 5 summarizes the main achievements related to the paper’s goal of analyzing EH-PHS opportunities in supporting SHM sensor systems as stand-alone solutions and suggests future directions for in-depth investigations leading to marketable solutions.

2. Materials and Methods

This section outlines the methods and materials adopted for the implementation of the research activities presented in this paper.
The methods are focused on the stages deployed for the PE-EHS configurations within the InComEss system architecture with the following development stages:
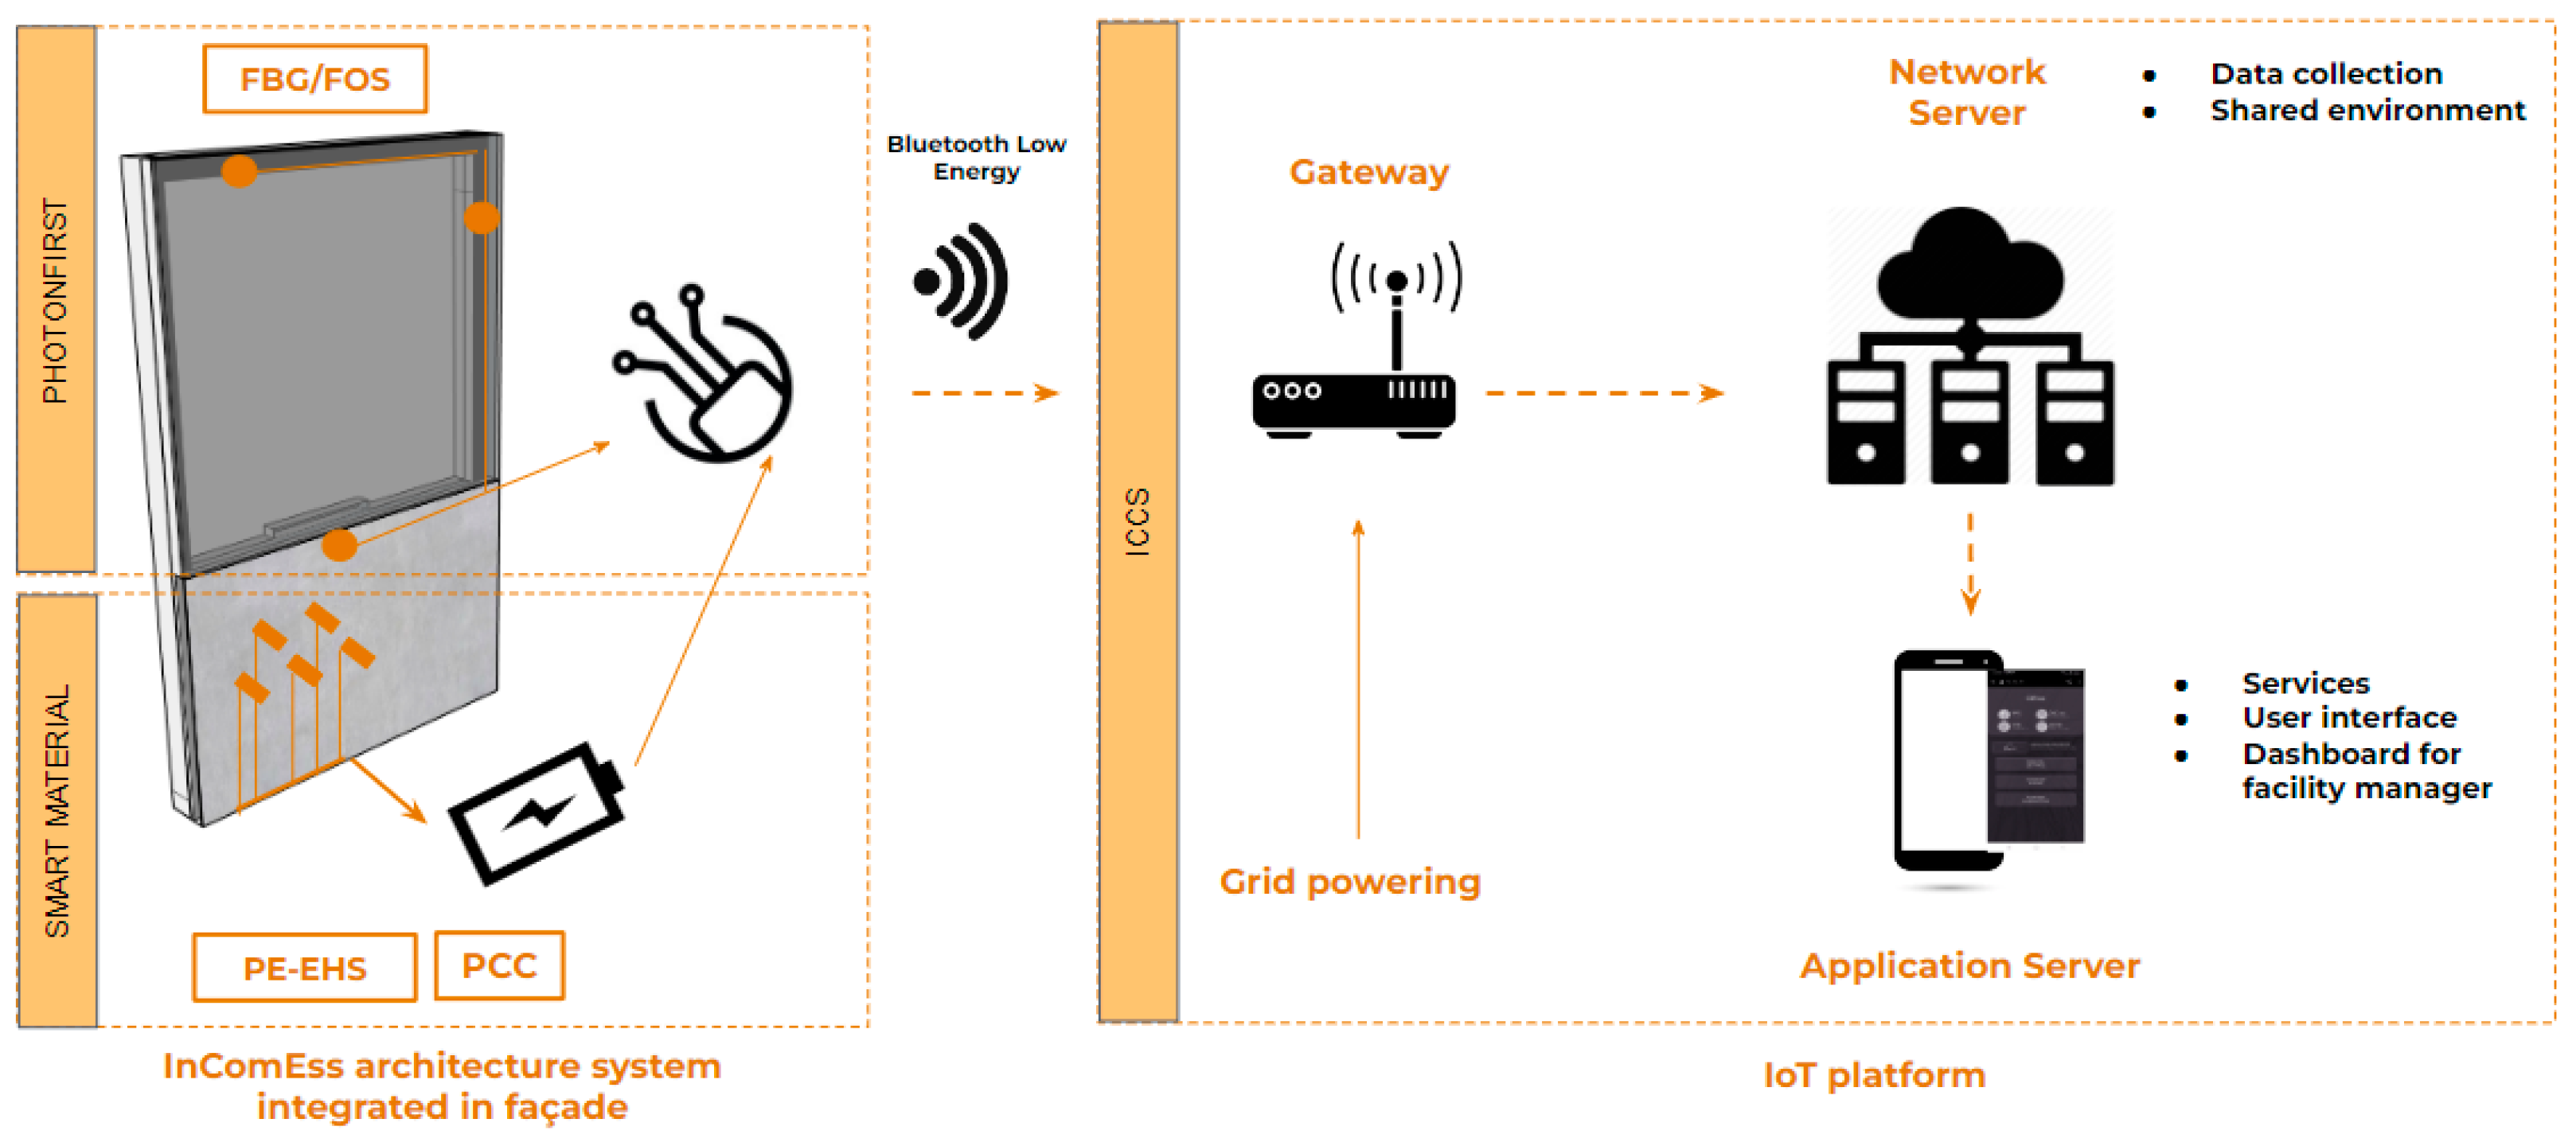
  • Analysis and design of the InComEss architecture system and components for integration into the façade—The InComEss system architecture is composed of a set of components analyzed to understand the impact of façade integrability. PE-EHS, FBG along FOS, FOS monadgator, PCC/PCB, and supercapacitor are the physical components to be embedded in the façade. Additionally, the digital component, represented by the IoT gateway for data gathering and transmitting in the IoT platform, is analyzed for its design for façade structural health monitoring. The aim is to adapt and integrate the InComEss architecture within the façade components and relative requirements. This paper underlines the study of PE-EHSs. An in-depth investigation of possible applications within the façade’s components is carried out to define the possible configuration of PE-EHSs, considering several key factors, including aesthetic considerations to ensure visual integration, energy efficiency for sustainable performance, replicability for widespread application, and maintenance considerations to facilitate long-term functionality and ease of upkeep. Multiple distinct configurations are developed with the primary objective of identifying the optimal integration for the façade system;
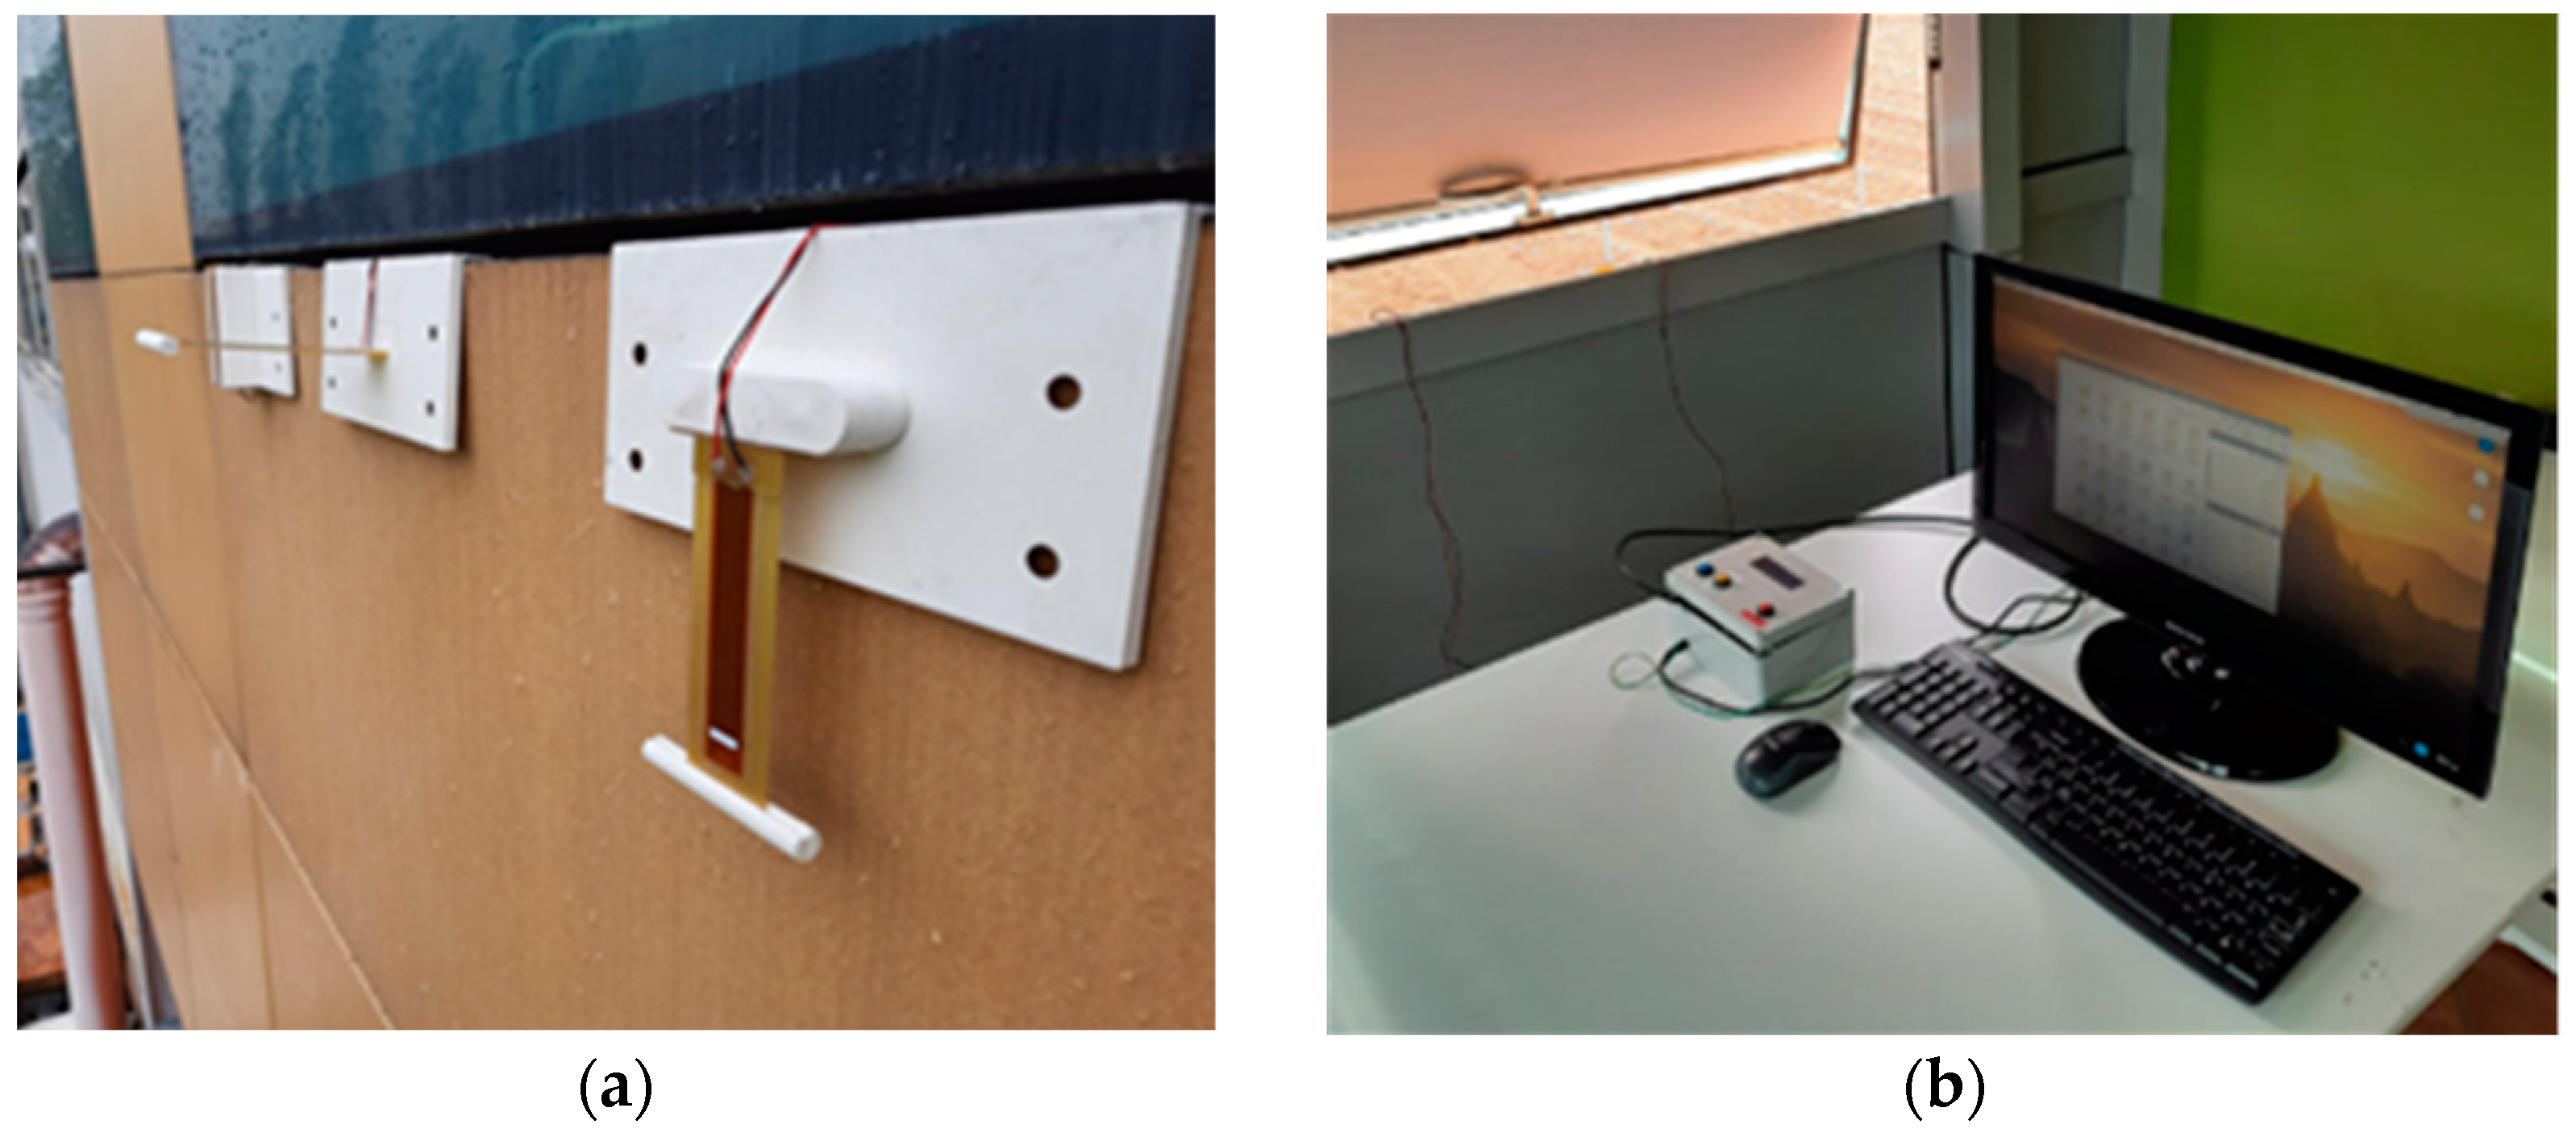
  • Preliminary PE-EHS testing activities—The PE-EHS configurations designed are tested preliminarily in small real environments with the objective of analyzing their voltage production and defining the PE-EHS configurations for the ventilated façade integration. The comprehensive evaluation of these tests addresses the final configuration and specific testing activities to be developed in a controlled lab environment;
  • Final PE-EHS configurations and tests in a laboratory of the InComEss architecture system—The PE-EHS final configurations are identified. Testing activities in the controlled lab environment include collecting voltage data for analysis of piezoelectric energy production and overall system performance to identify the results achievable by the overall system in different façade stress conditions. The InComEss architecture system’s components (PE-EH, FBG-FOS, PCC/PCB, IoT gateway, and IoT platform) are validated individually and together to evaluate the stand-alone system reliability. In particular, the PCC circuit’s capability to charge the supercapacitor is tested based on the voltage generated by the PE-EHS integrated into the ventilated façade. The FOS monadgator power consumption is monitored during testing activity. The air velocity employed in the tests during laboratory activities is chosen to reflect the typical wind load forces experienced by high-rise buildings, which serves as the primary reference point for this research. Initial tests using a fan within a range of 5 m/s to 8 m/s are conducted to identify a suitable minimum air velocity. Ultimately, a minimum velocity of 5 m/s is adopted for subsequent testing. Furthermore, to ensure consistency with standardized practices and serviceability of the façade, the wind load range during the experiments corresponds to air velocities ranging from 9.03 m/s to 31.30 m/s. These values align with the specifications outlined in the EN 13830 standard [46], which governs test service conditions for façades. By adhering to this established standard, the obtained results maintain relevance and applicability to real-world building environments;
  • Results and test analysis—The laboratory tests for the PE-EHS are analyzed based on testing conditions to comprehend the piezoelectric configuration’s potential for voltage generation. The InComEss system and its integration into the façade are analyzed to wrap up potentialities and limitations for the application. For the lab test, knowing this voltage (U) and the capacitance (C), the stored energy (E) generated by the PE-EHS is calculated as follows:
E = 1 2 C U 2 ,
hence, for time (t) t = 1 s, the value of time, the power (P) will be
P = E t
The results achieved for different configurations are compared for the voltage generated and reported. The primary challenge encountered by the piezoelectric cantilever is the generation of an electrical current in the nanoampere (nA) range, which poses significant difficulties for measurement using a PCB. Consequently, the output voltage is utilized as a benchmark for comparison.
The materials adopted for the research activities are as follows:
  • InComEss components—The research is based on component development within the project [45]:
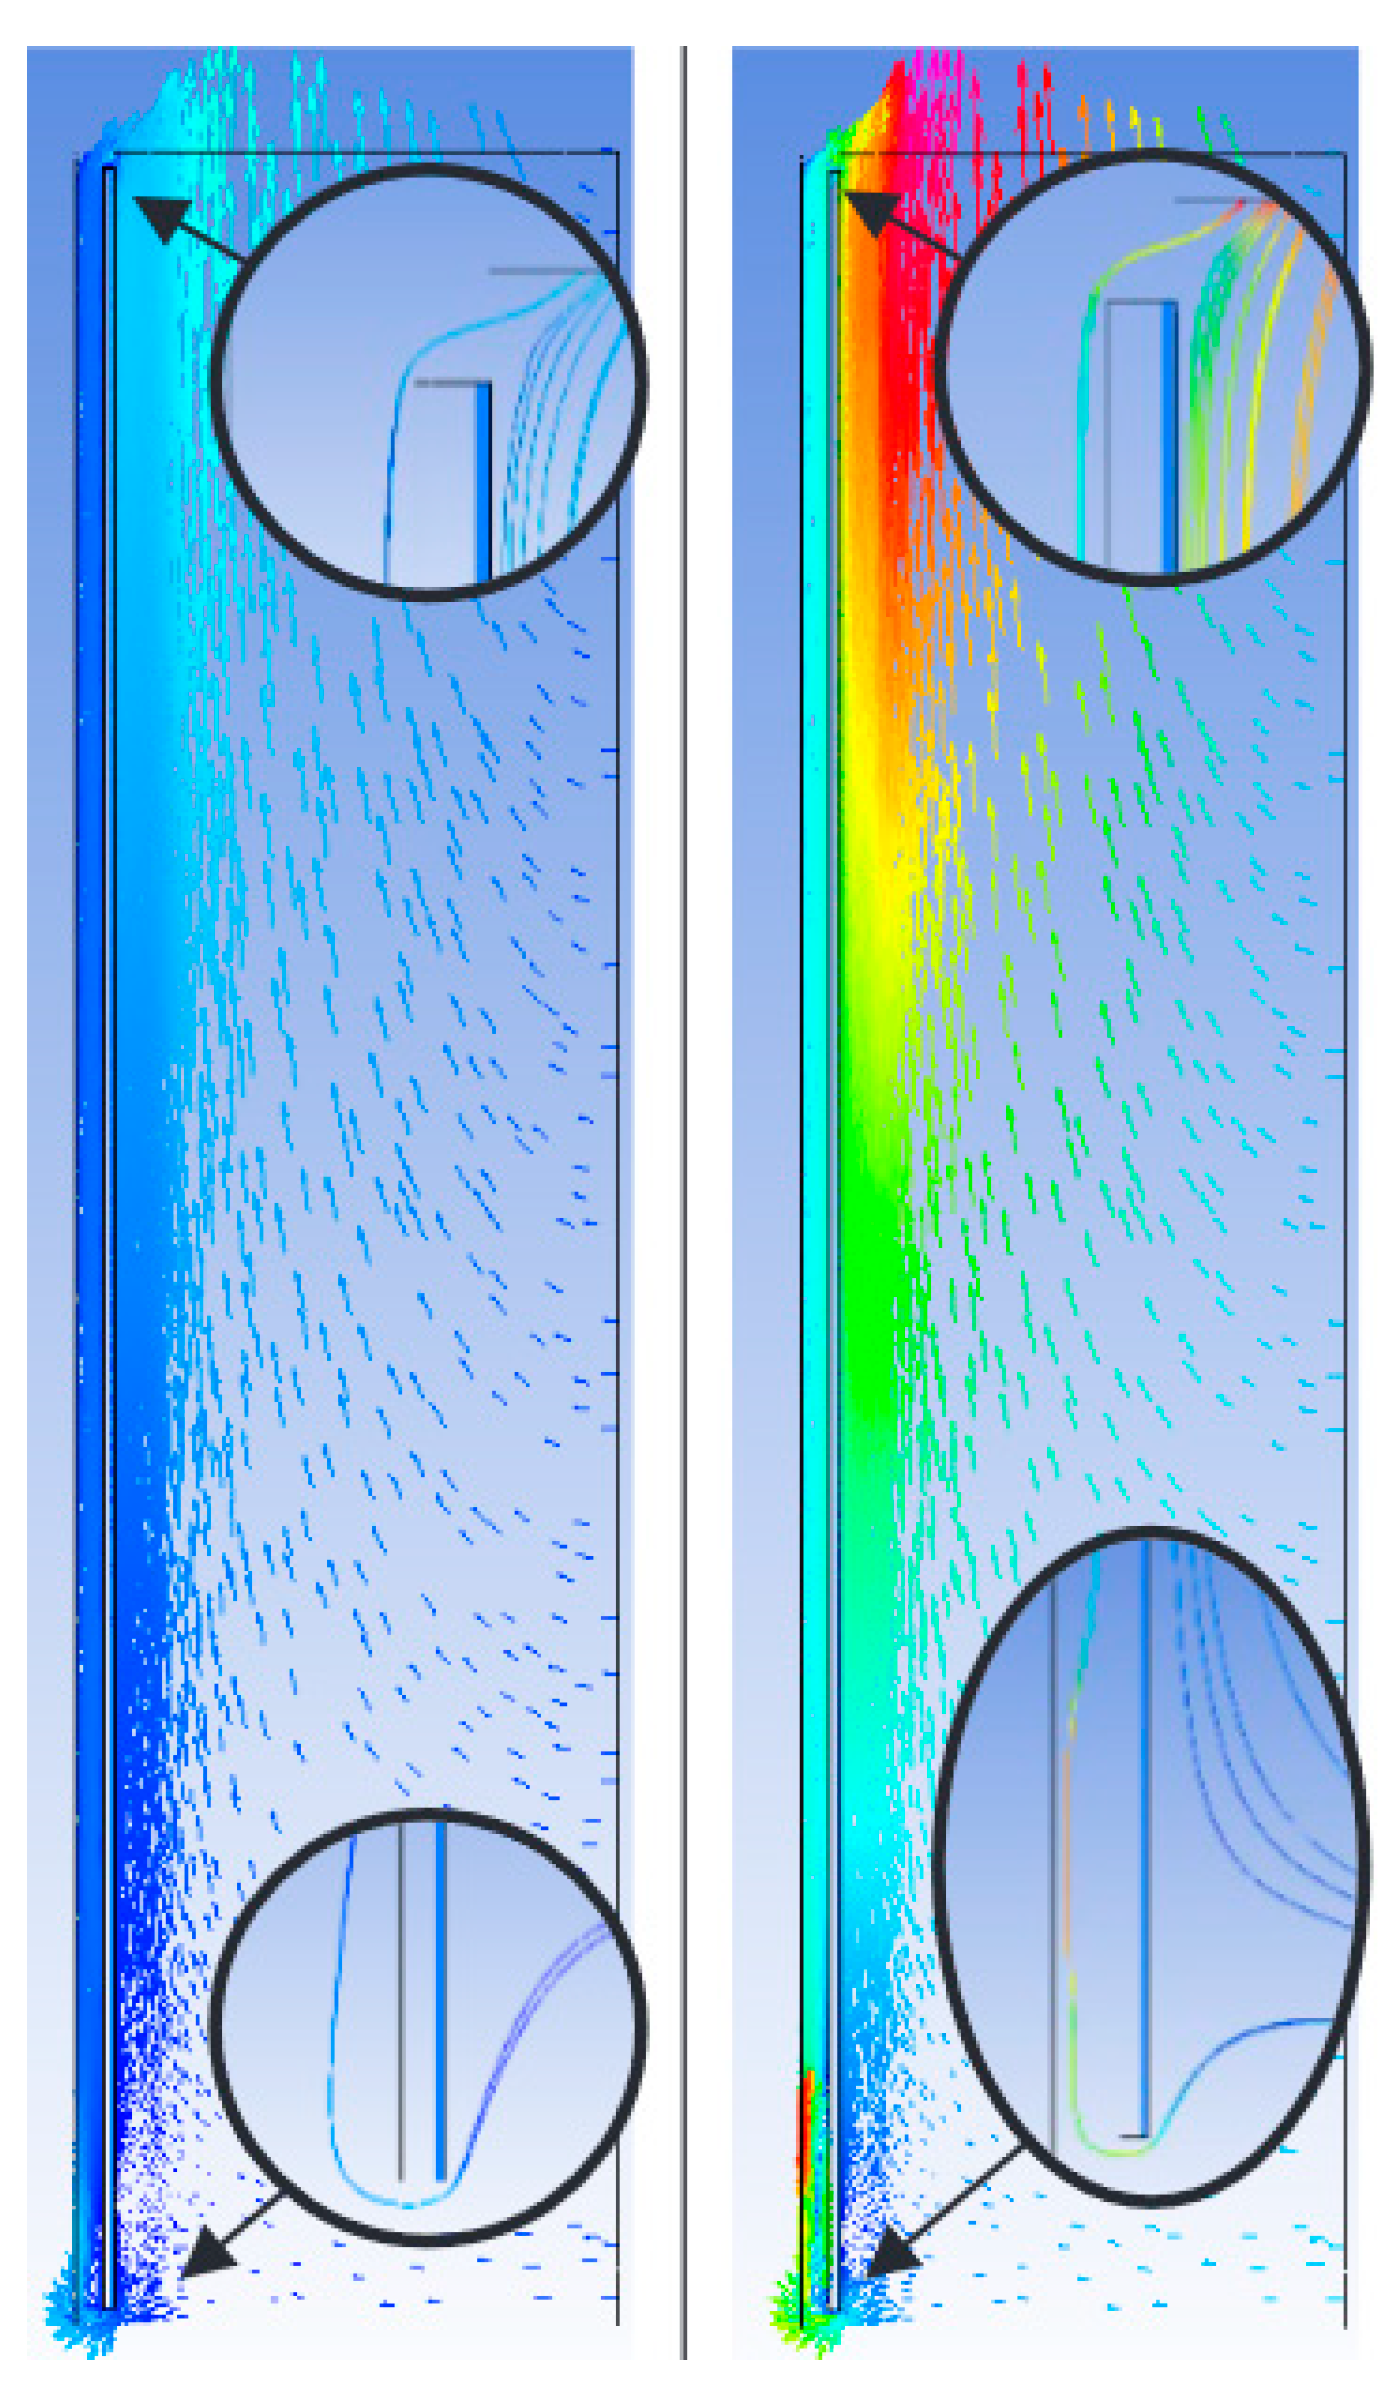
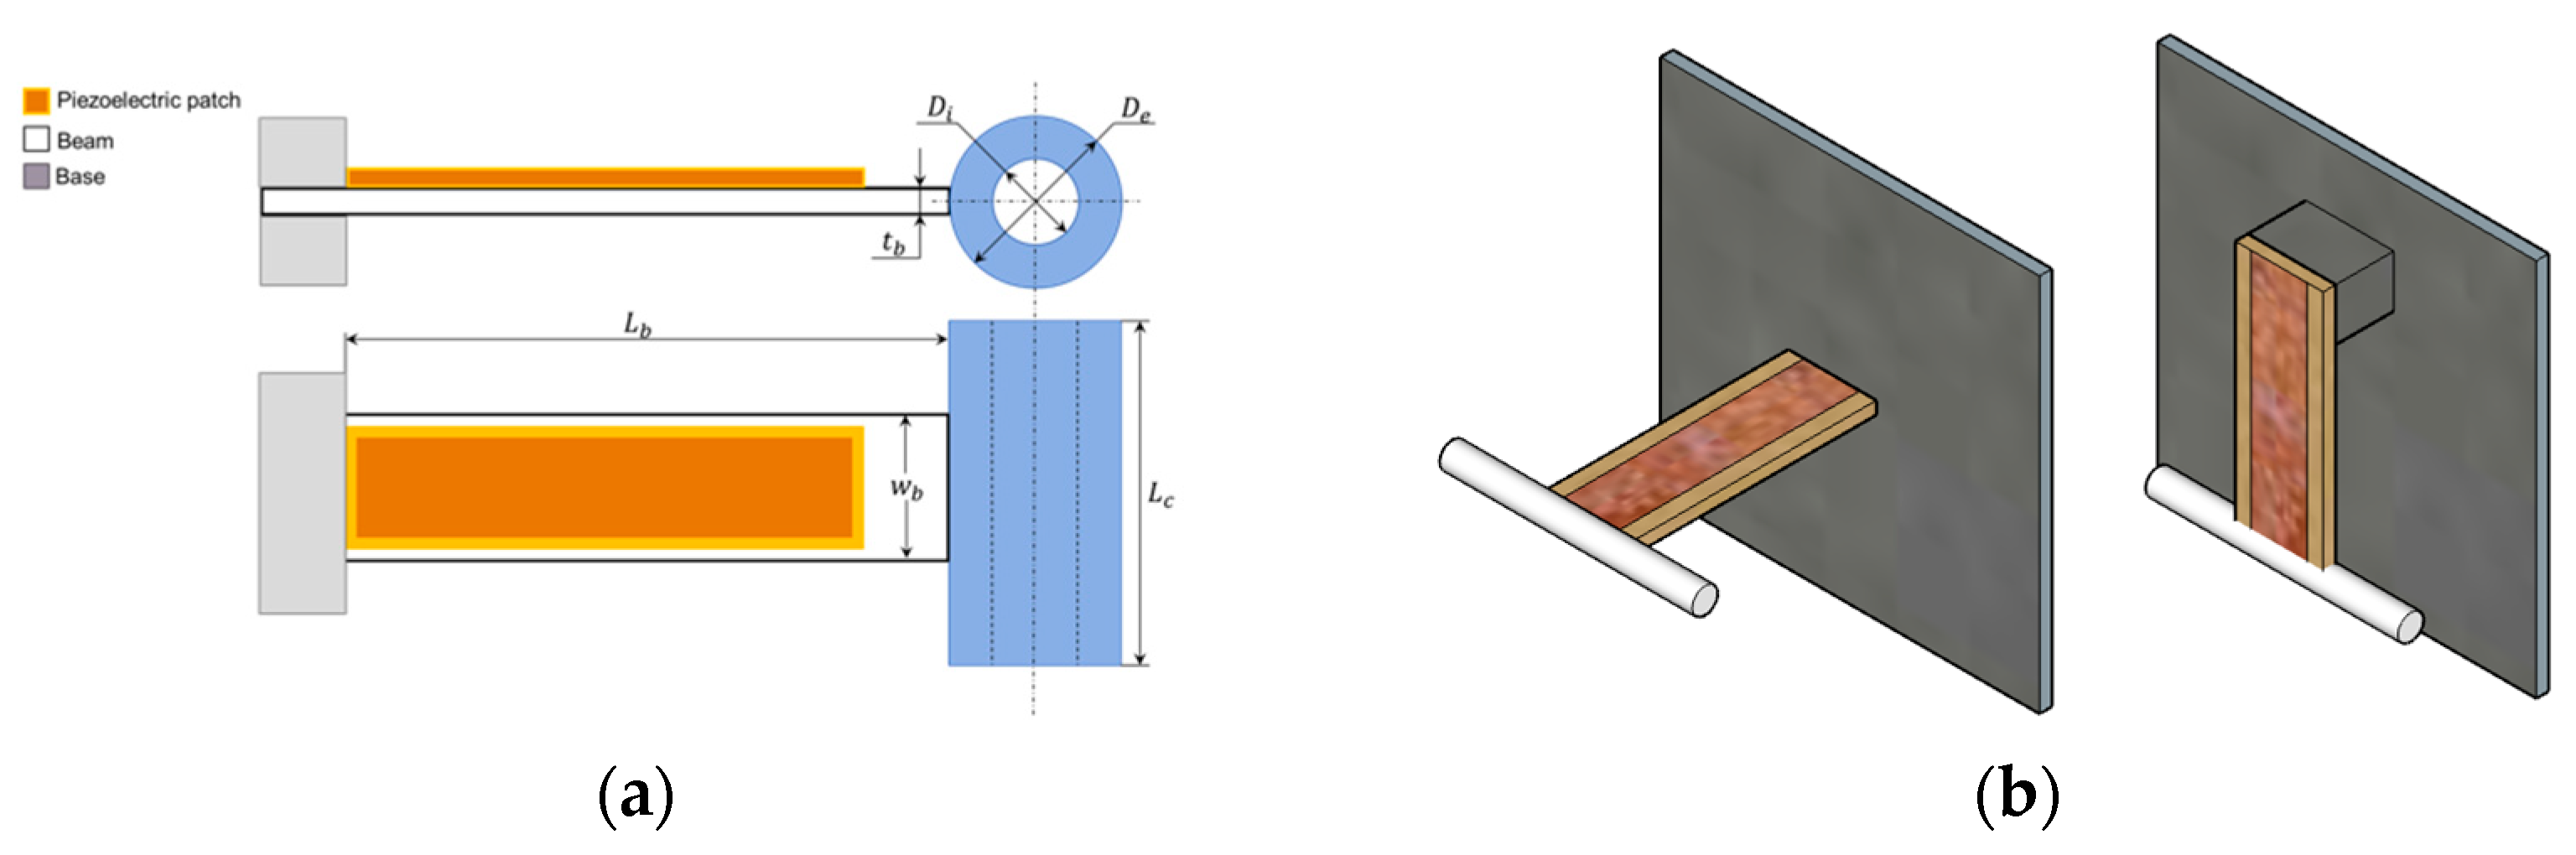
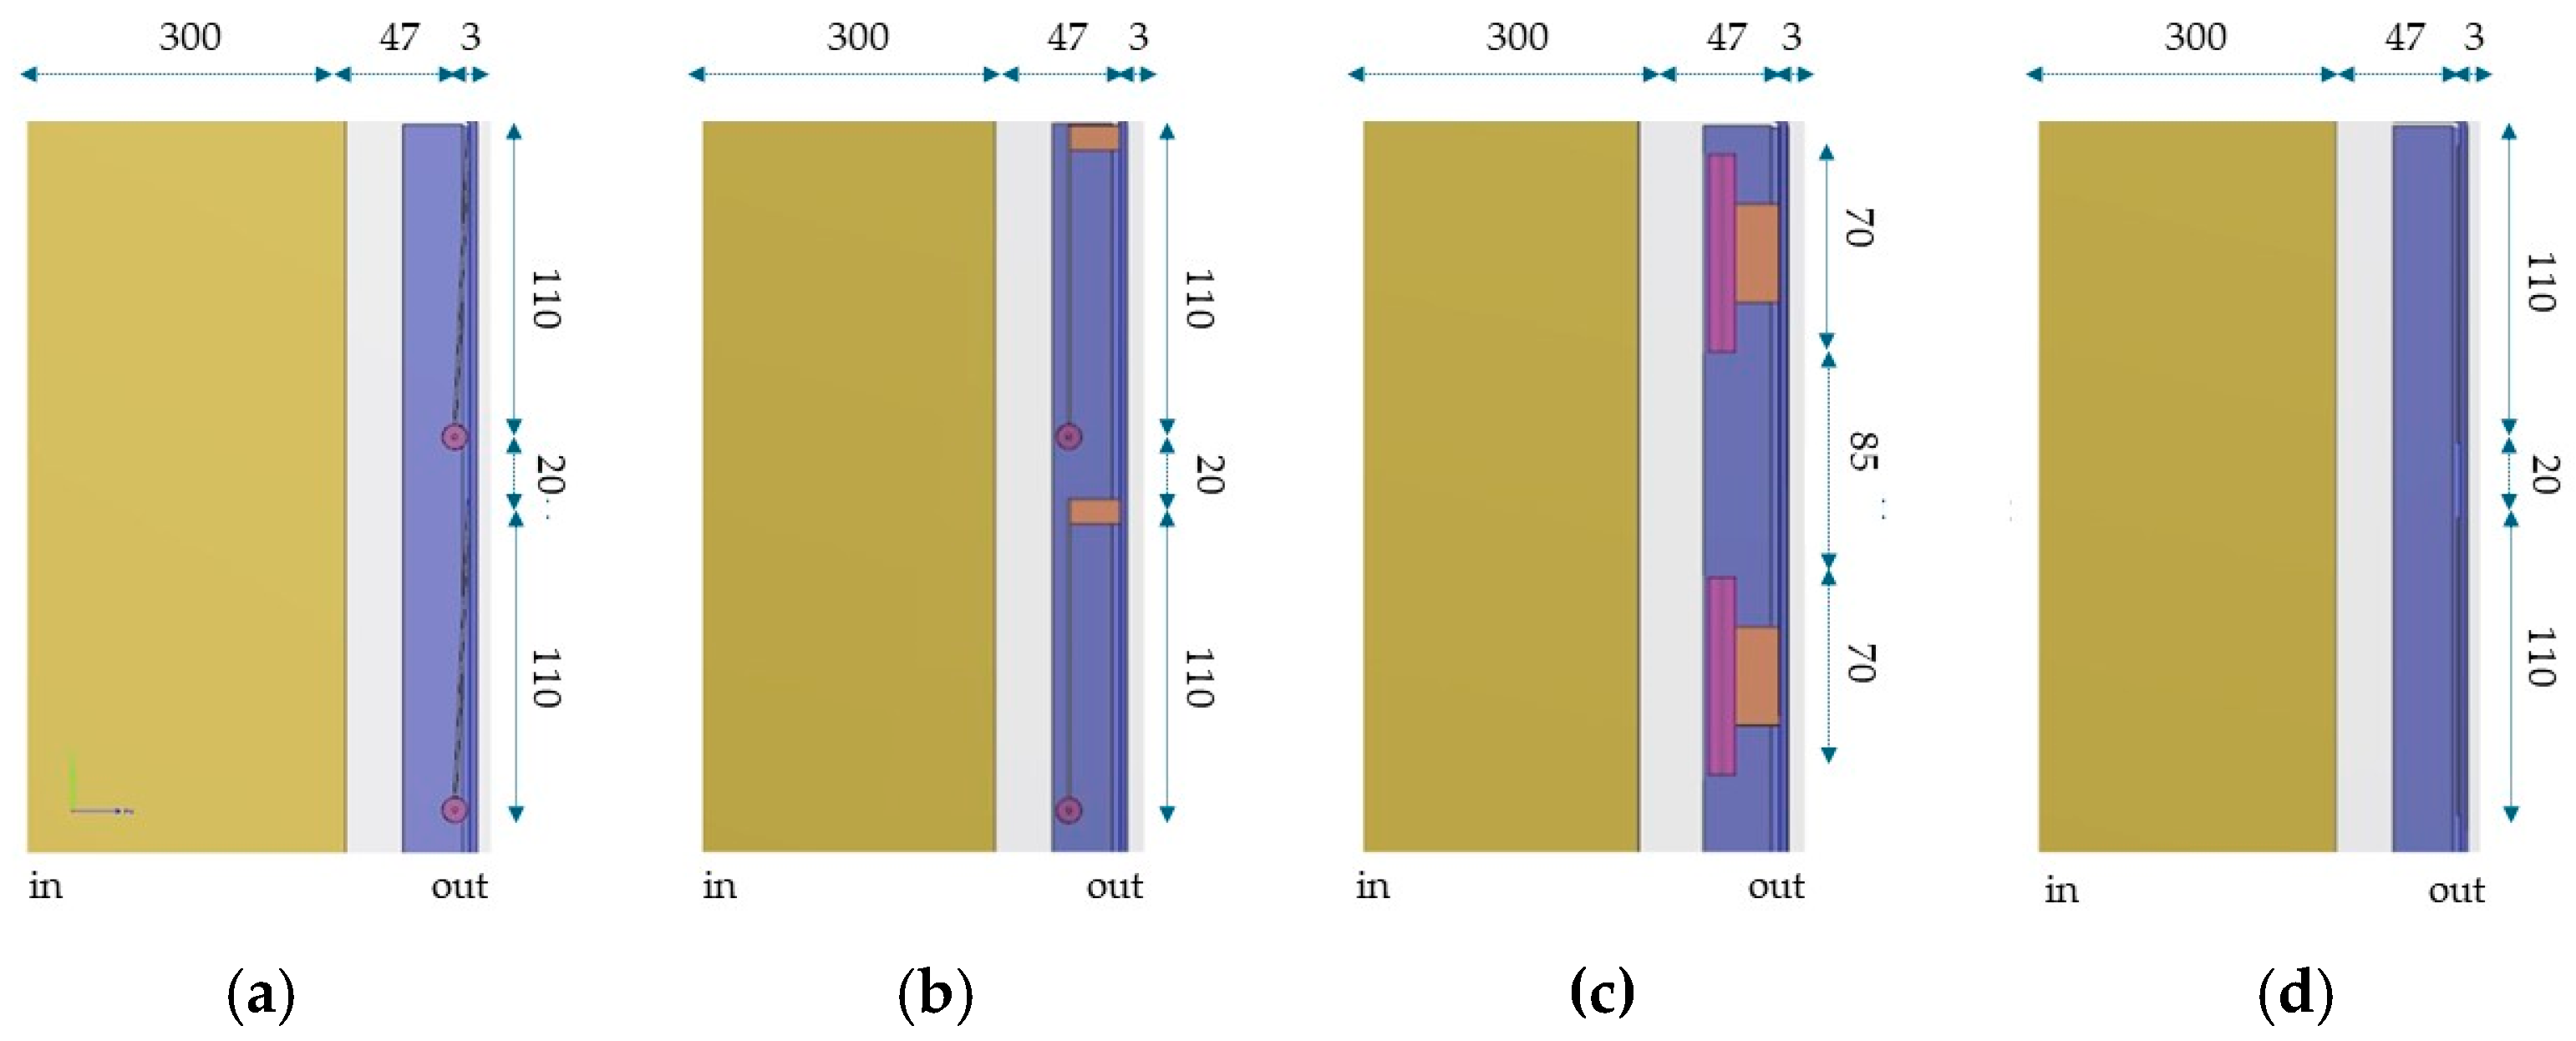
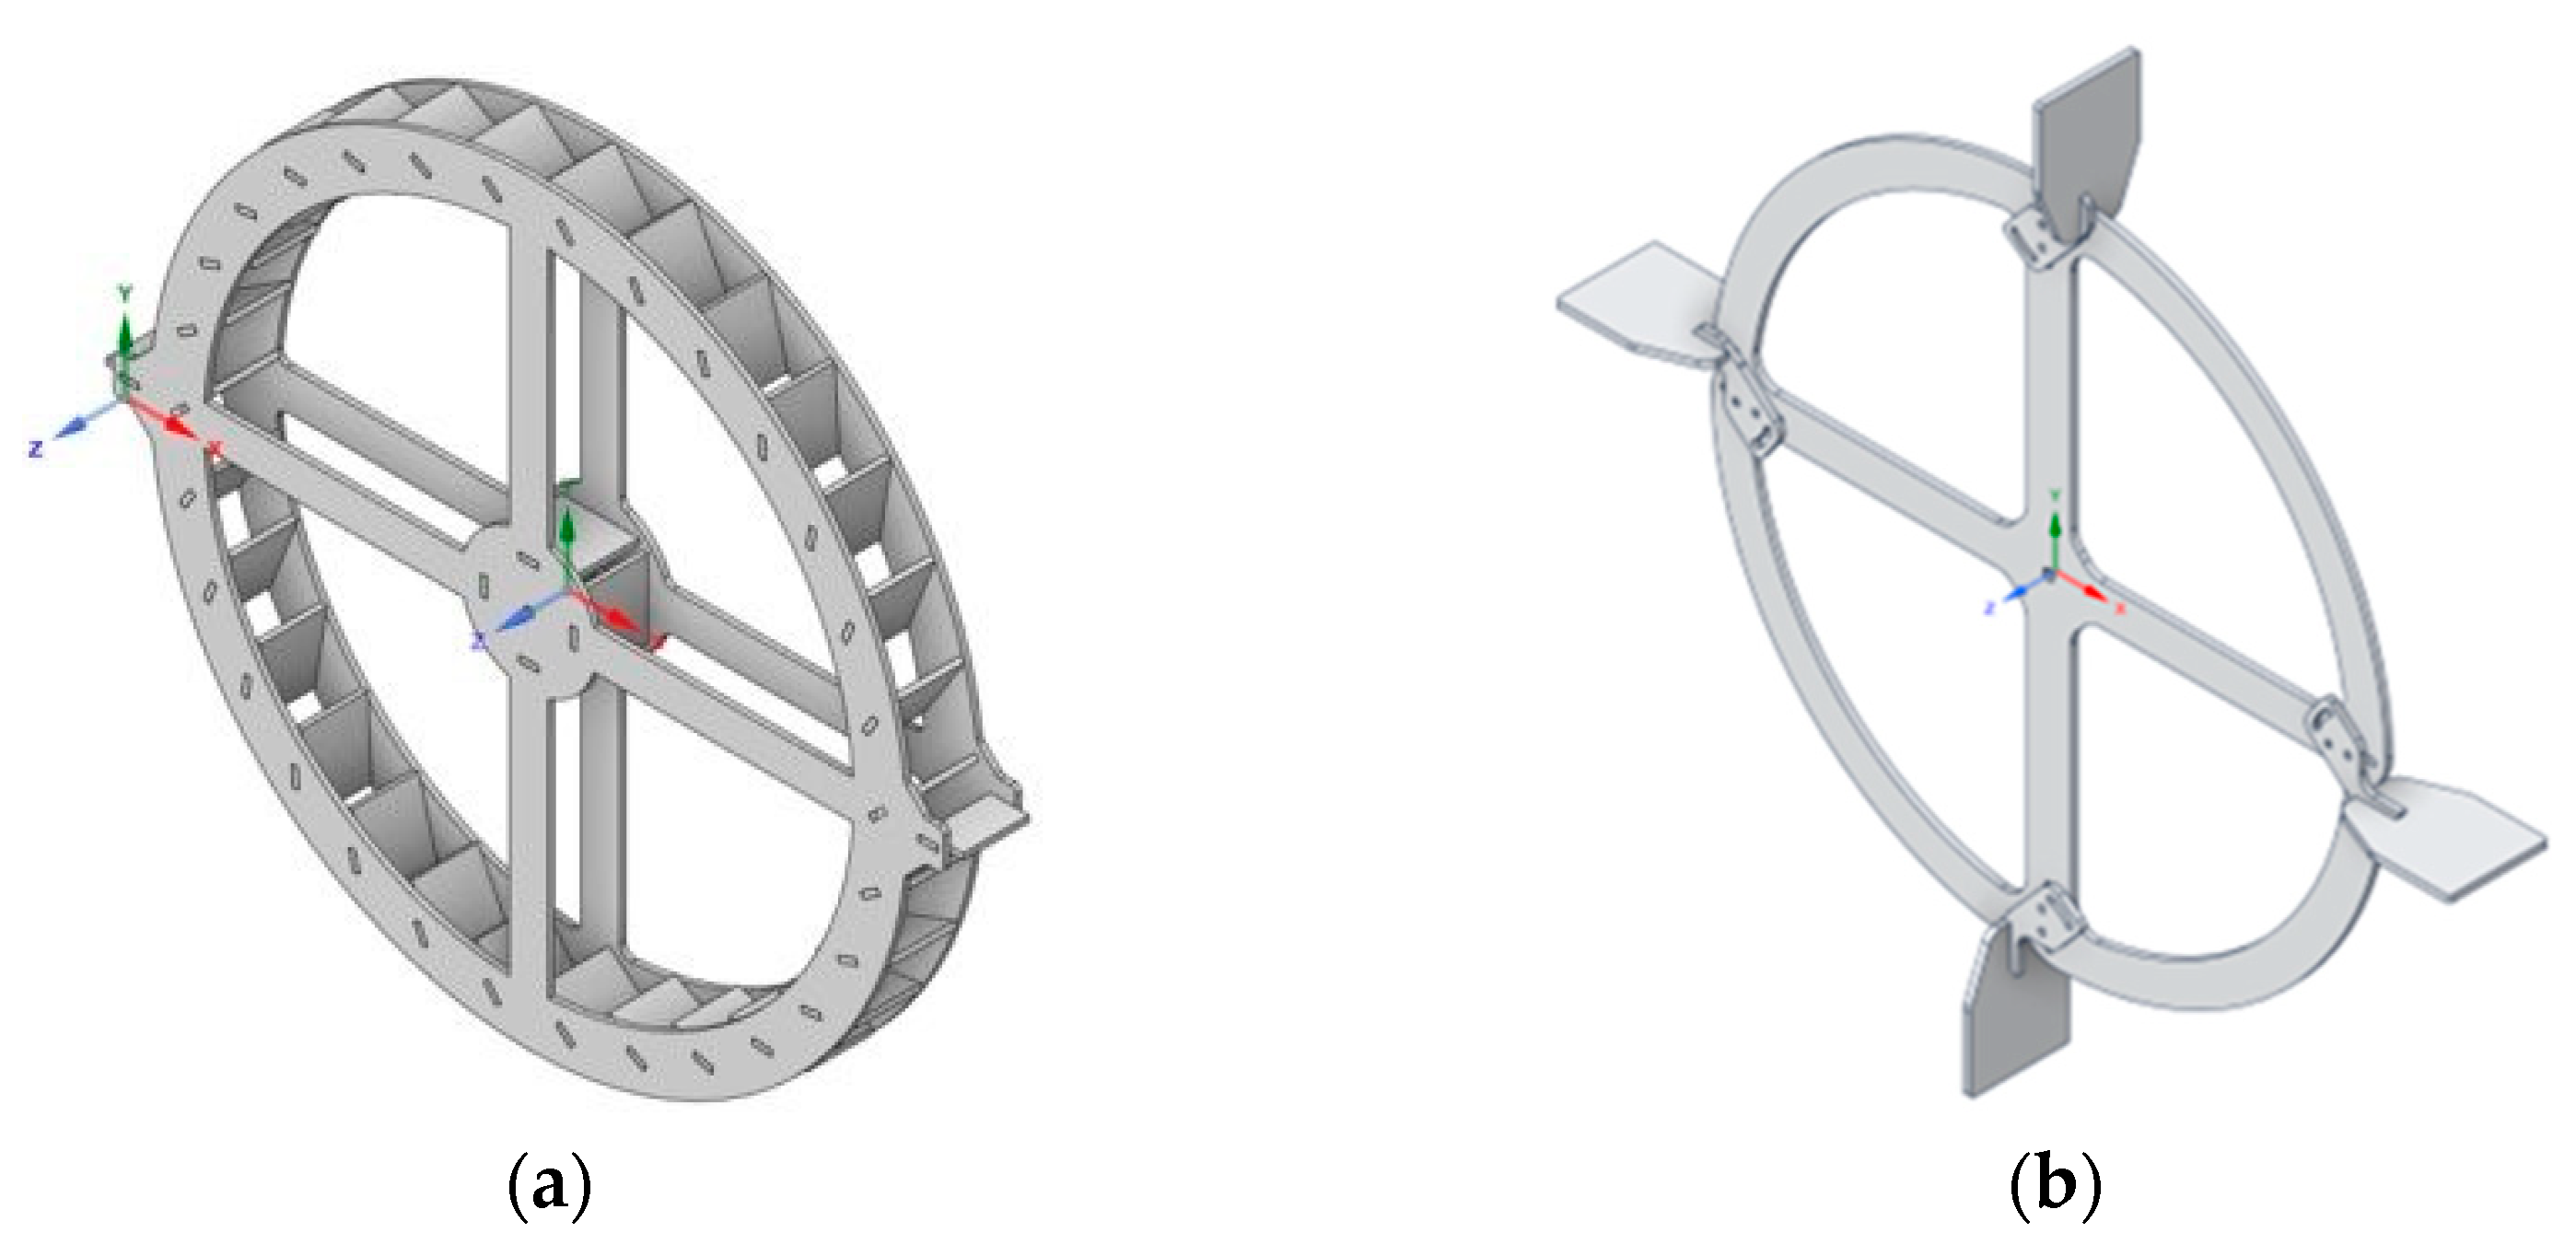
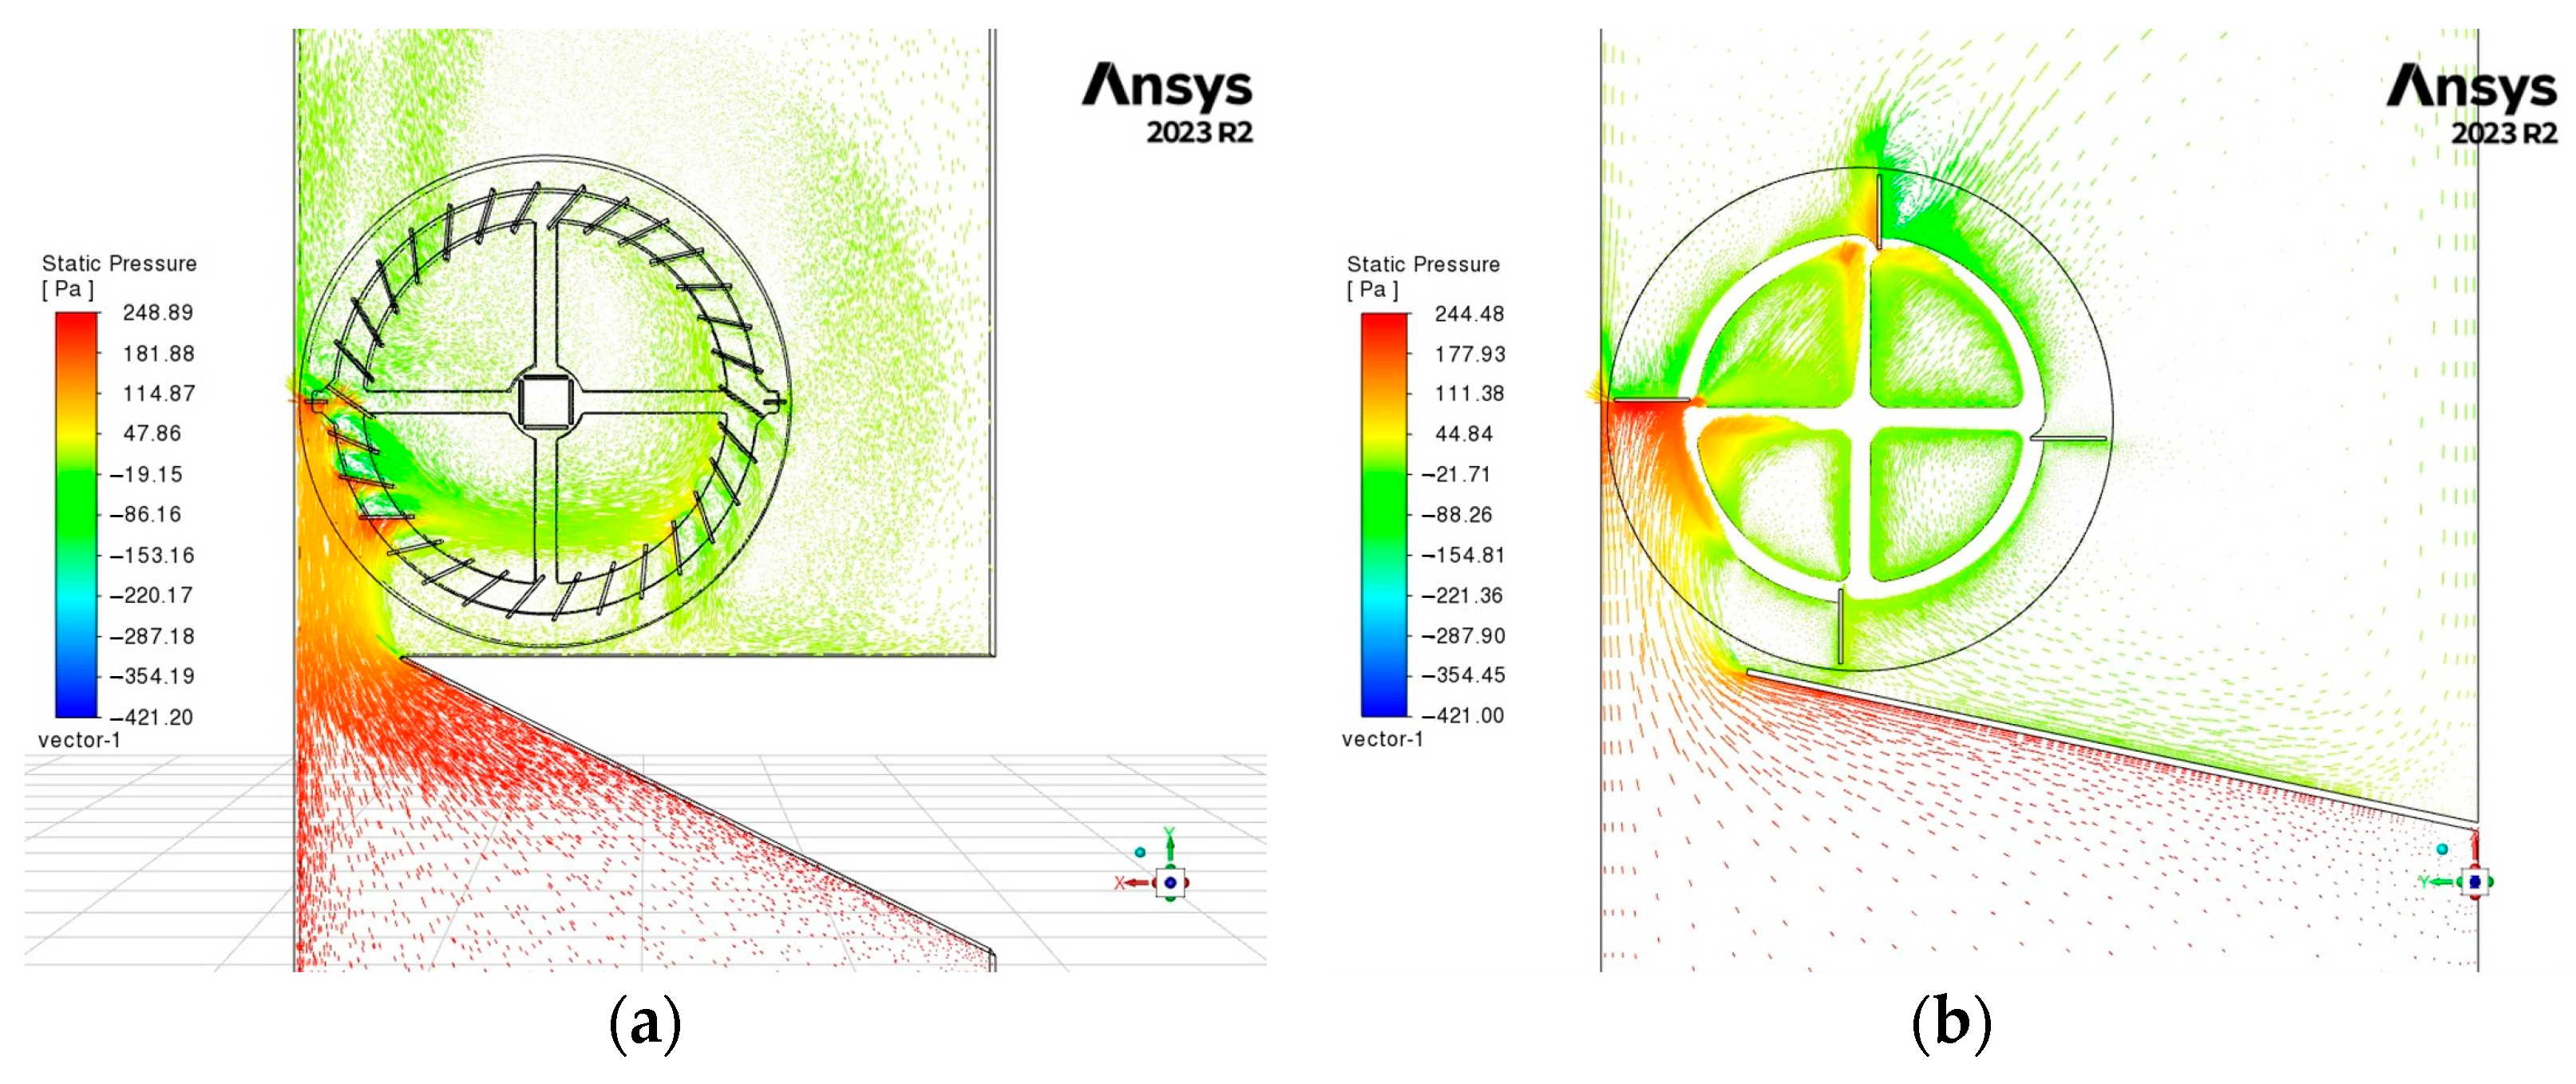
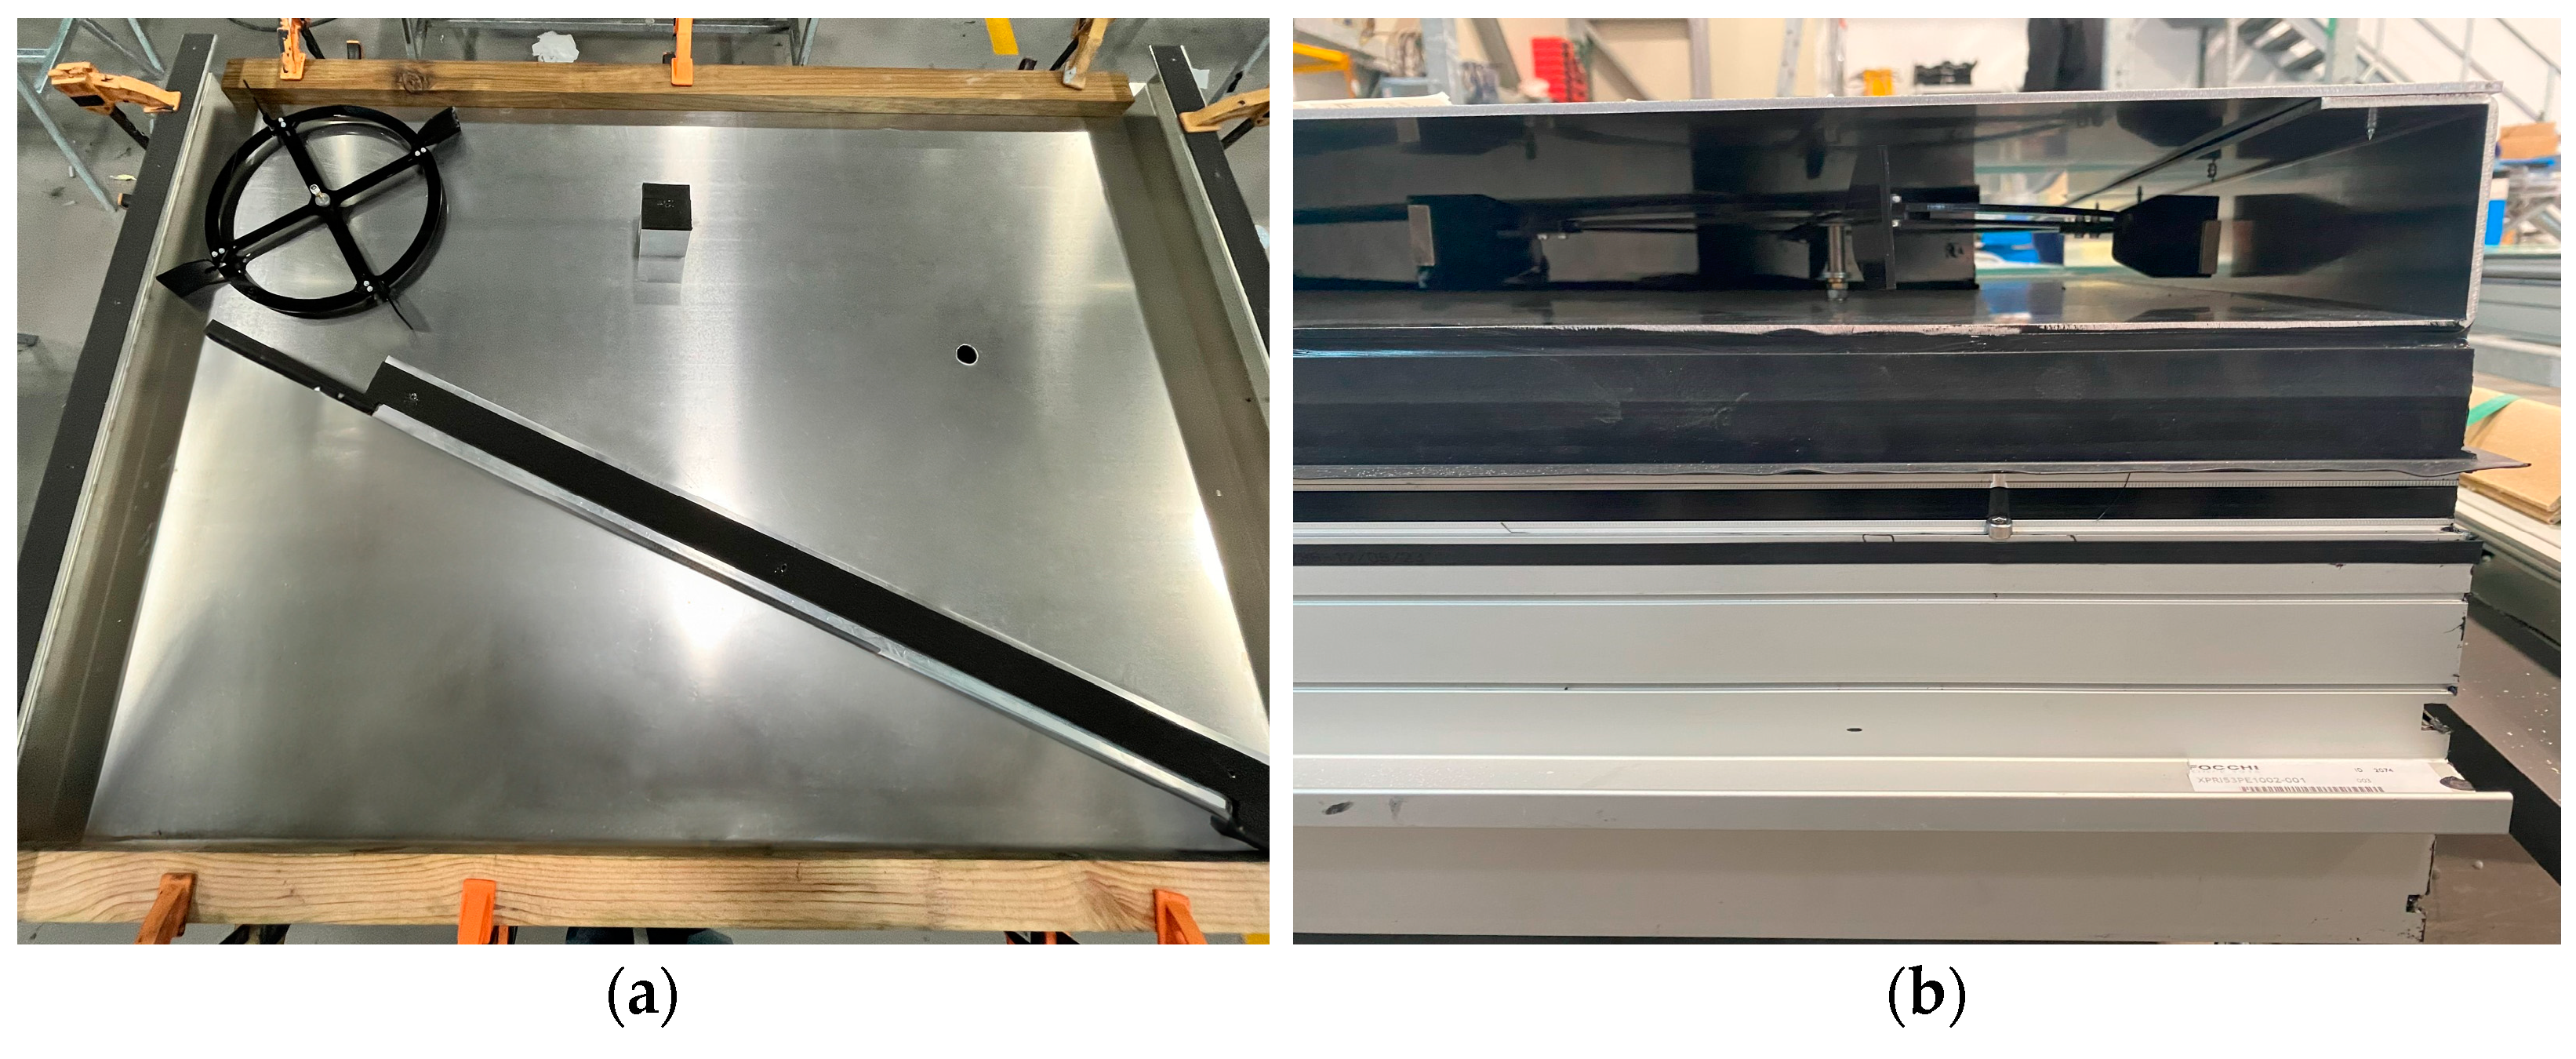
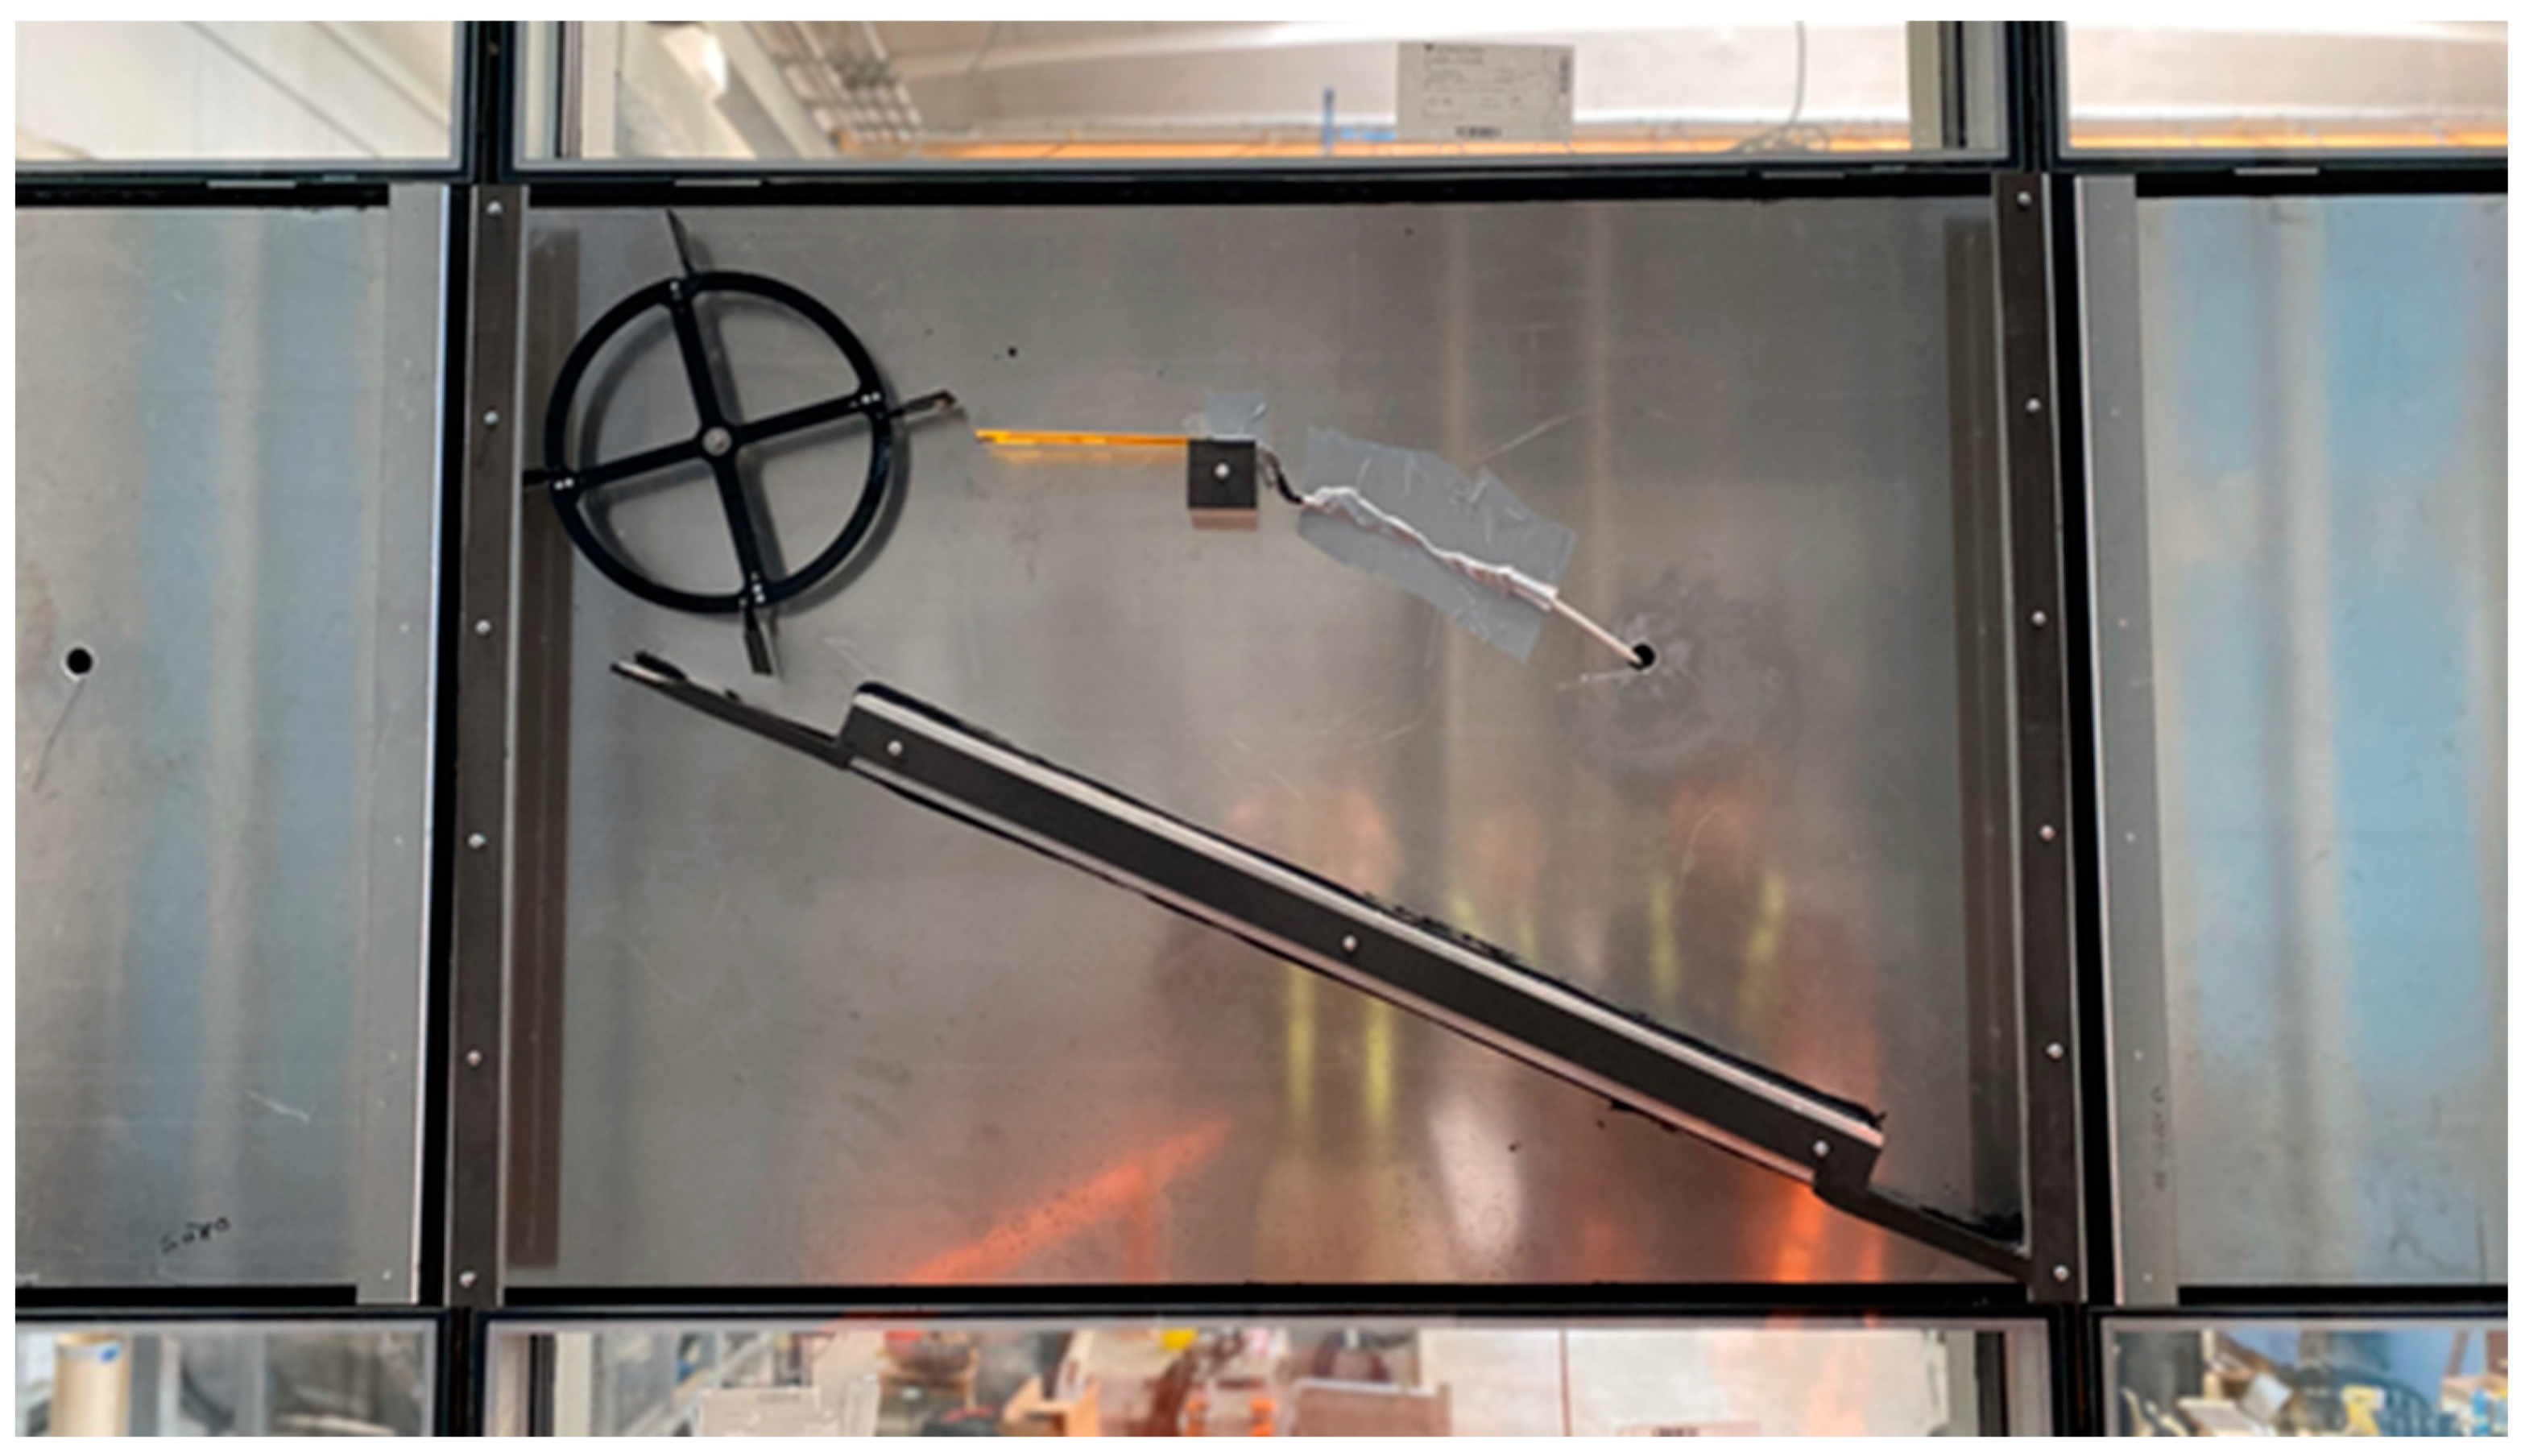
    A PE patch [47,48] is a Macro-Fiber Composite (MFC) PZT, model M8514P2, with a dimension of 18 × 100 mm bonded to a substrate carrier beam made of 1 mm (tb) FR-4 made by glass-reinforced epoxy laminate material and with a dimension of 35 × 110 mm (Wb × Lb). The bluff body is a hollow cylinder made of a polymeric material with a diameter of 10 mm (Df) and a length of 70 mm (Lc). The InComEss system architecture’s energy generation is achieved by integrating a piezoelectric cantilever, constructed from Poly(vinylidene fluoride (PVDF) tapes, into a façade. Given the challenge of inducing significant deformation through vibration alone on a piezoelectric patch with dimensions of 18 cm in length and 5 cm in width, a polymeric wheel designed to rotate with wind is developed and subjected to simulation. The strategy entails attaching permanent magnets to both the wheel and the piezoelectric cantilever, leveraging magnetic repulsion to induce deformation as the wheel turns under typical direct wind conditions (2–5 m/s). The design process utilizes SolidWorks for the wheel’s conception, while Ansys is employed for simulation purposes, with the goal of maximizing output voltage. Through initial analysis and simulation, several solutions are validated, including the reduction in blade inclination from 45° to 30°, the integration of an air channel within the façade’s ventilated cavity to focus airflow and enhance the initial force generated, and the reduction in the wheel’s weight to enable its activation by lower air pressures. These adjustments are implemented and tested on the cantilevers to determine their impact. For the development of the piezoelectric tapes used on the cantilever, PVDF homopolymer pellets, specifically Kynar 720 from Arkema, are converted into tapes using a twin-screw extruder coupled with a flat die. After that, silver ink is applied to both sides of the tapes to create electrodes. The tapes were then poled using a DC power supply to achieve a target piezoelectric coefficient (d33) of up to 20 pC/N. After polarization, the tapes are aligned on a fiberglass composite to construct the piezoelectric generator, with the aim of optimizing the mechanical-to-electrical energy conversion efficiency. The output voltage, both in laboratory and real-world conditions, is measured to evaluate the piezoelectric performance of the developed PVDF cantilever and wheel, utilizing different energy measuring systems for voltage (reported in the Section 2). These output voltages serve as a basis for comparison because, for the façade integration, a dedicated PCB is developed, which is solely capable of voltage acquisition. Consequently, the output voltage provides a comparative analysis between the ideal scenario (laboratory conditions) and the real-world simulation on a ventilated façade;
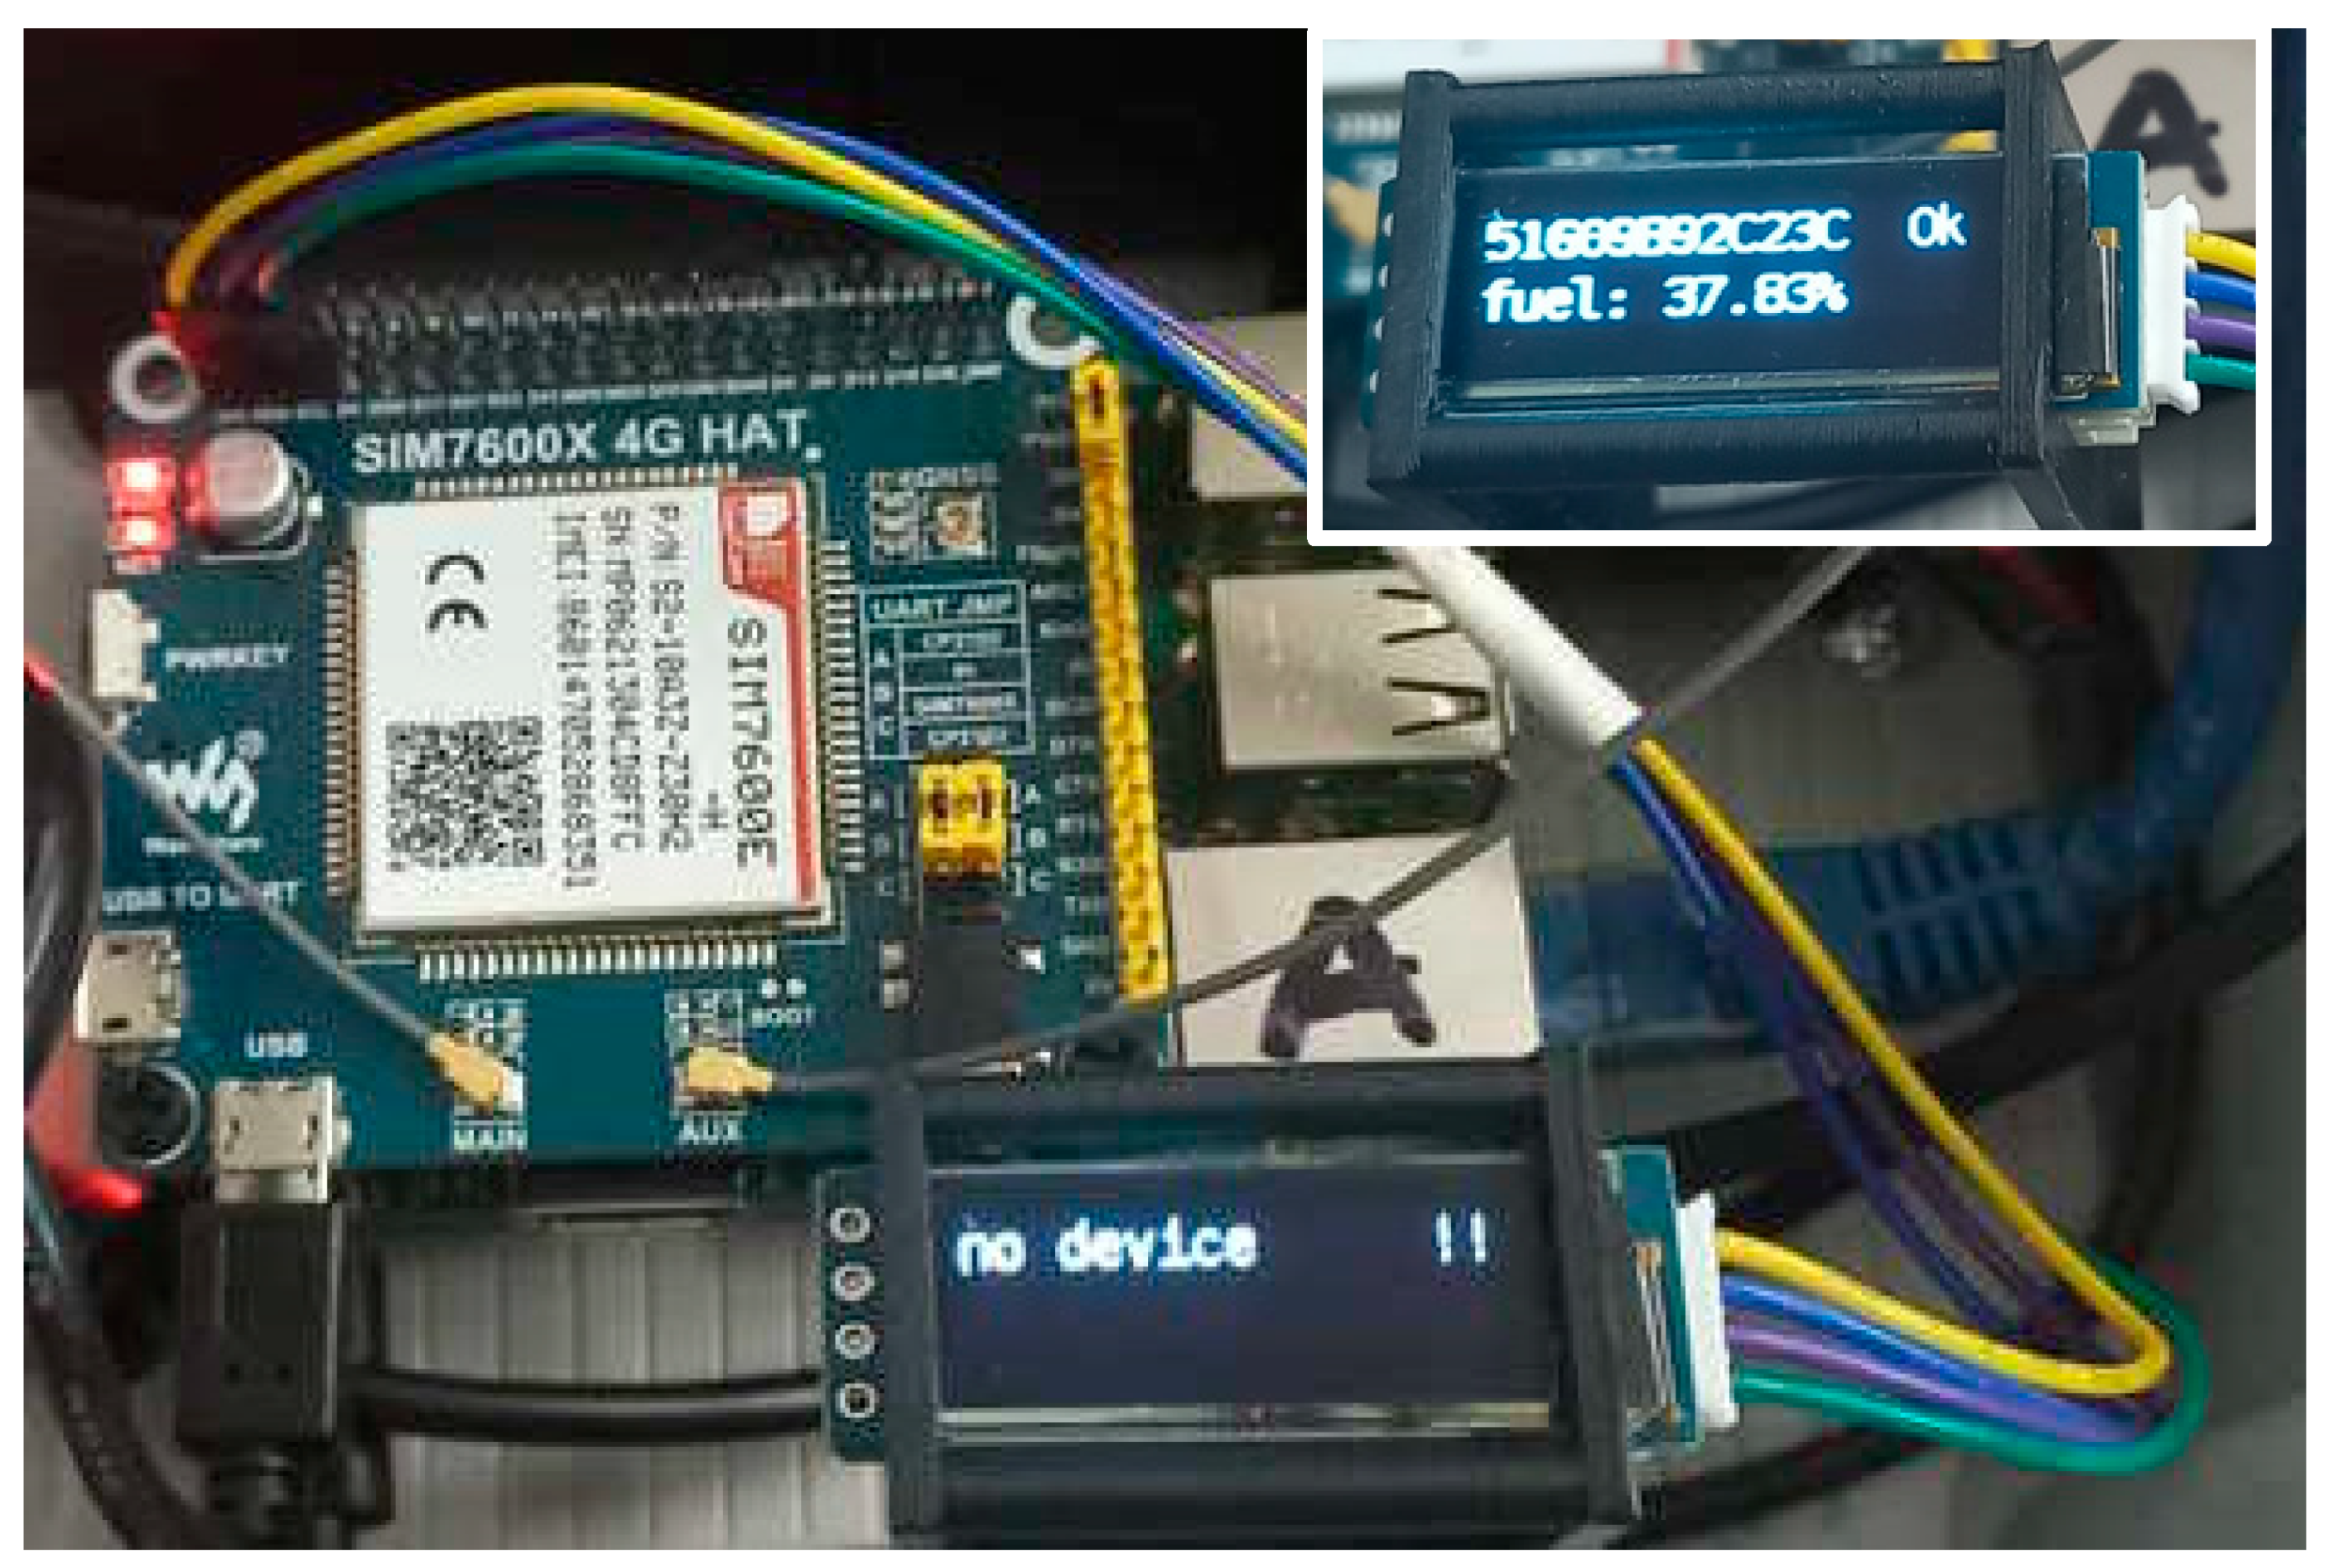
    An FOS monadgator based on a low-energy-consumption solution to data gathering and transmission of the InComEss system architecture is used. The FOS monadgator-powered consumption is measured for a full cycle (start-up, FBG data collection, data transfer);
    A supercapacitor based on the screen-printing method with a capacitance of 125 mF and a voltage of 5 V is used. The equivalent series resistance (ESR) of this module is 26 Ohm;
    A PCB/PCC is used to have all the components integrated and communicate with each other. The Power Conditioning Circuit is composed of a rectifier to transform the alternate voltage of the piezoelectrics into a direct current and an actively controlled switched regulator to convert the voltage into a usable value. The load resistance is variable since the PCC is powering an active circuit. There is a minimum voltage needed to start harvesting energy; below that threshold, the PCC does not operate. Based on in-field data analysis, a current of ~4 mA is necessary to reach a ~5 V threshold to charge the supercapacitor, and consequently, the resistance is R = U/I = 5 V/0.004 A = 1250 Ohm. The PCC needs a power of 20 mW to run. No more technical information can be disclosed due to confidentiality issues;
    An IoT gateway, which has been recently proposed for a real-time vehicle monitoring application [49], is customized to support the integration with the FOS node for data collection and transmission to the IoT platform;
    An IoT platform is customized for façade structural health monitoring, visualization, exploring, and alerting.
  • Energy measuring system for voltage:
    For configurations A1, A2, and C2 in a real environment at Focchi premises, a custom-built data acquisition system specifically designed for the project is used. The system consists of a low-voltage drop diode bridge rectifier that converts the AC that usually comes from the PEG into a DC voltage. This DC voltage is used to charge up a low-leakage foil capacitor. The rising voltage across this capacitor is measured using a very-high-input impedance op amp so that no discharging effect as a result of the measurement chain occurs. No more technical information can be disclosed due to confidentiality issues;
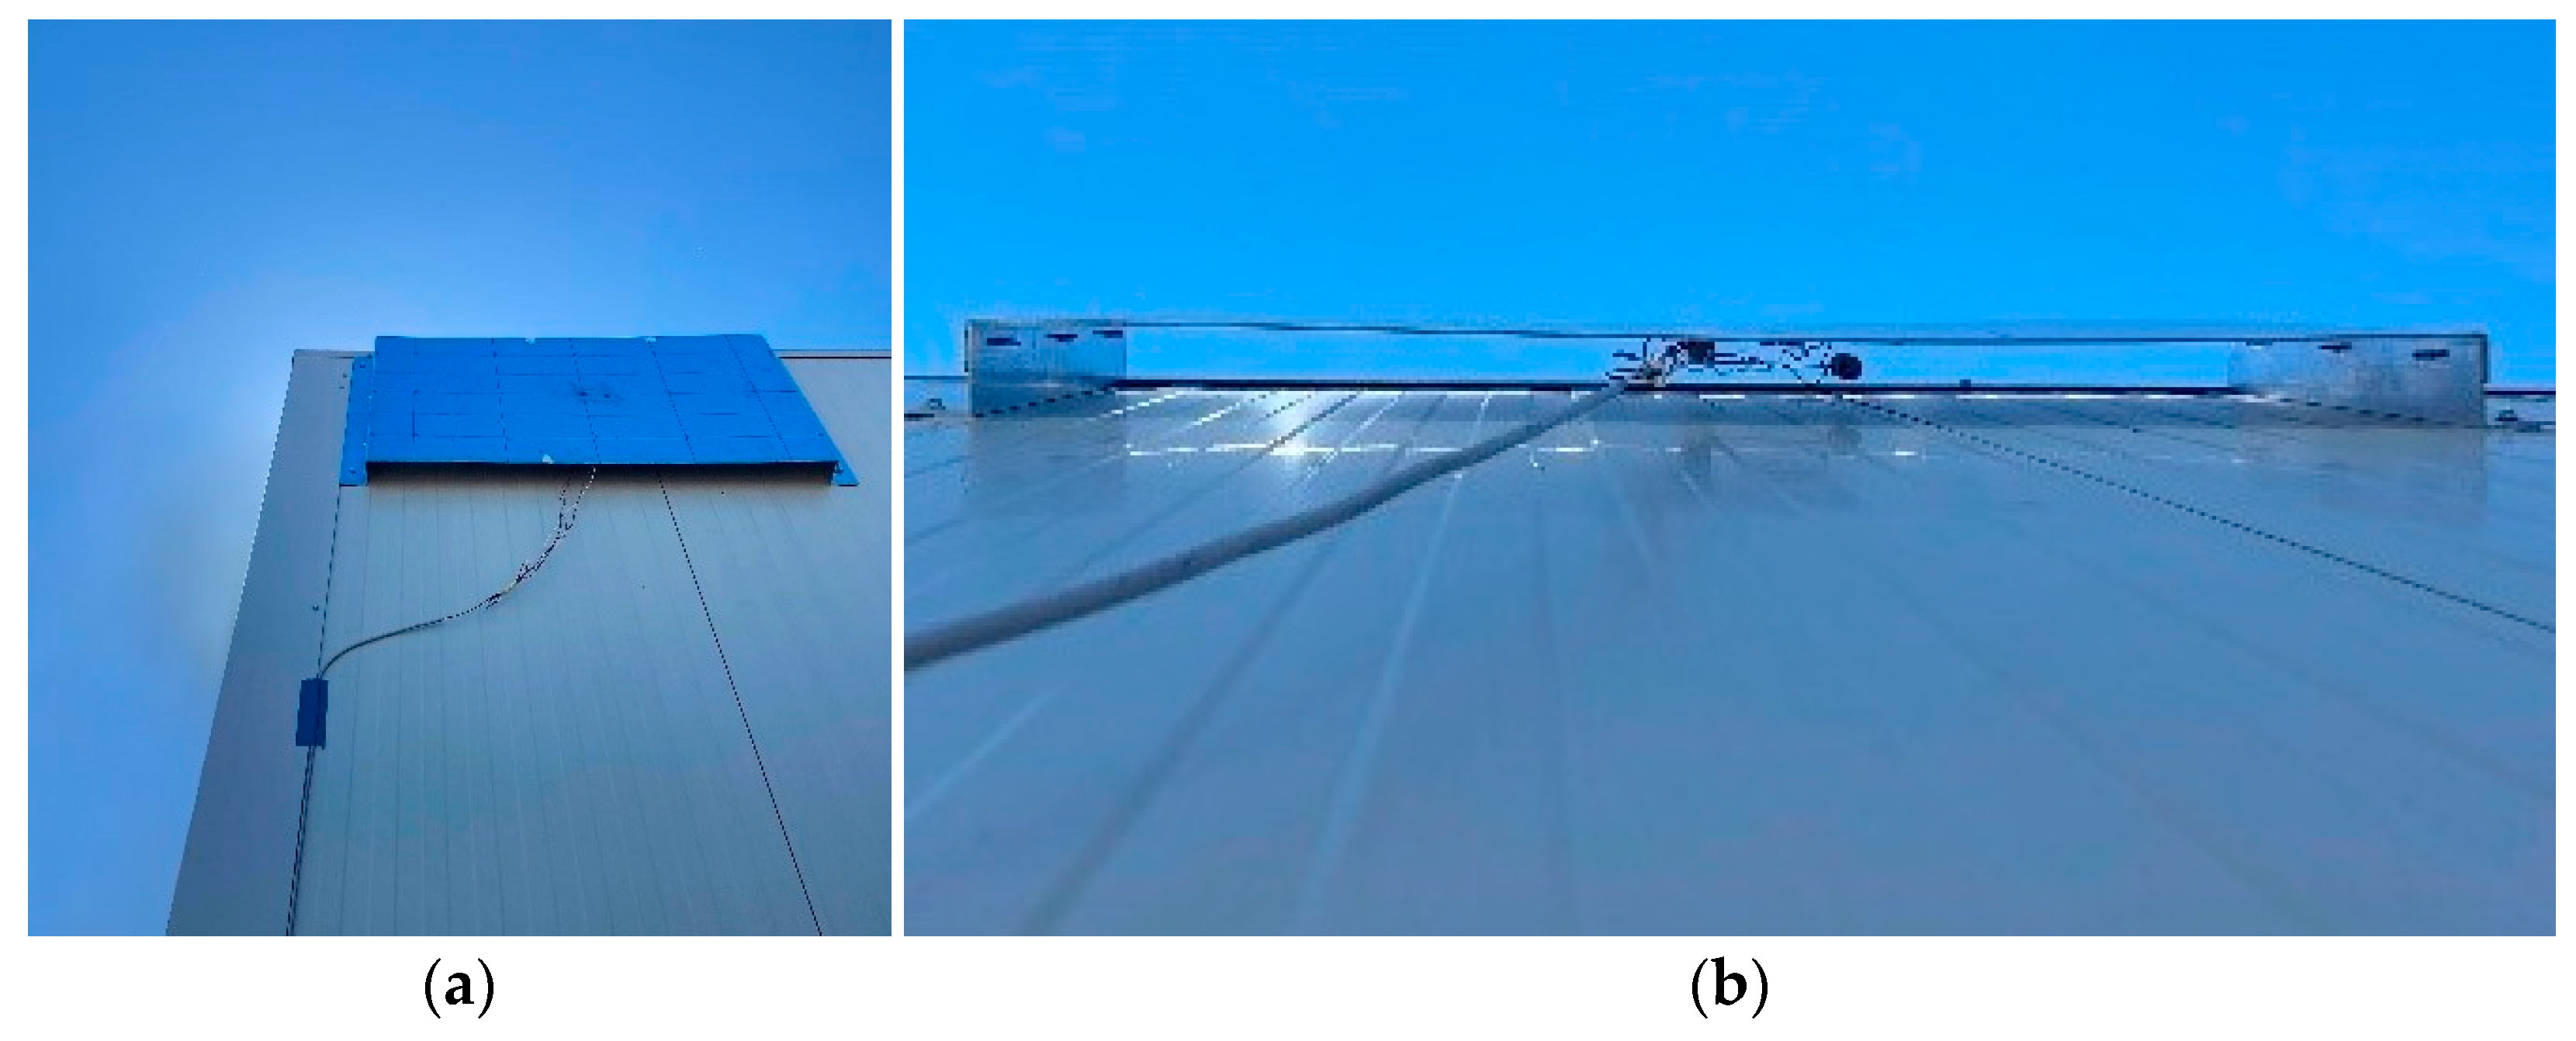
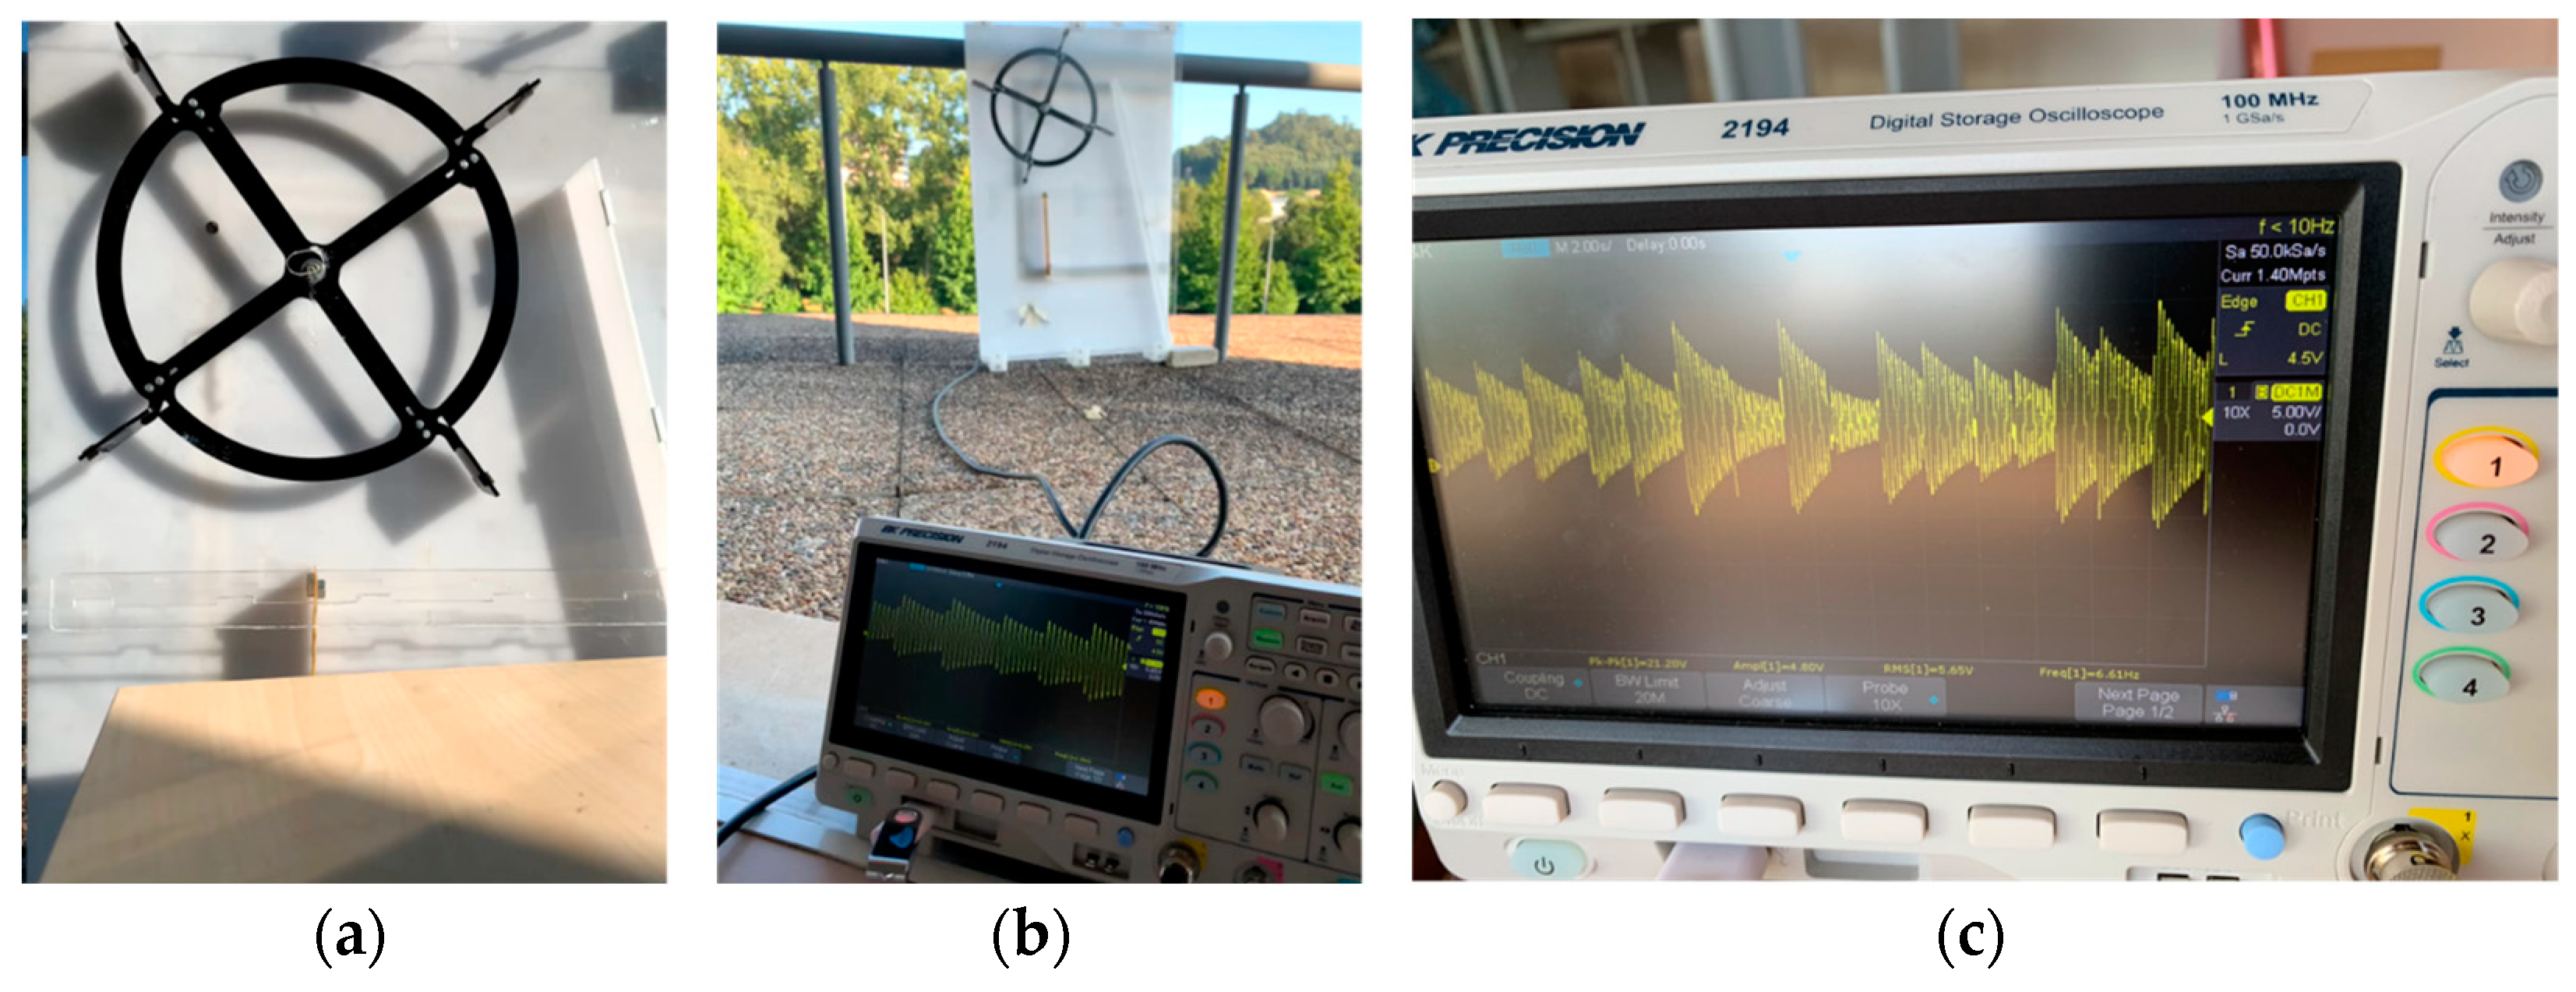
    For configuration D in a real environment at CENTI premises, a BK Precision 2194 oscilloscope is used;
    For configuration D in lab tests, a data-logger Keysight 34907A with 16 bits of digital input and output, 3 active channels, and 7 Hz for the channel is used.
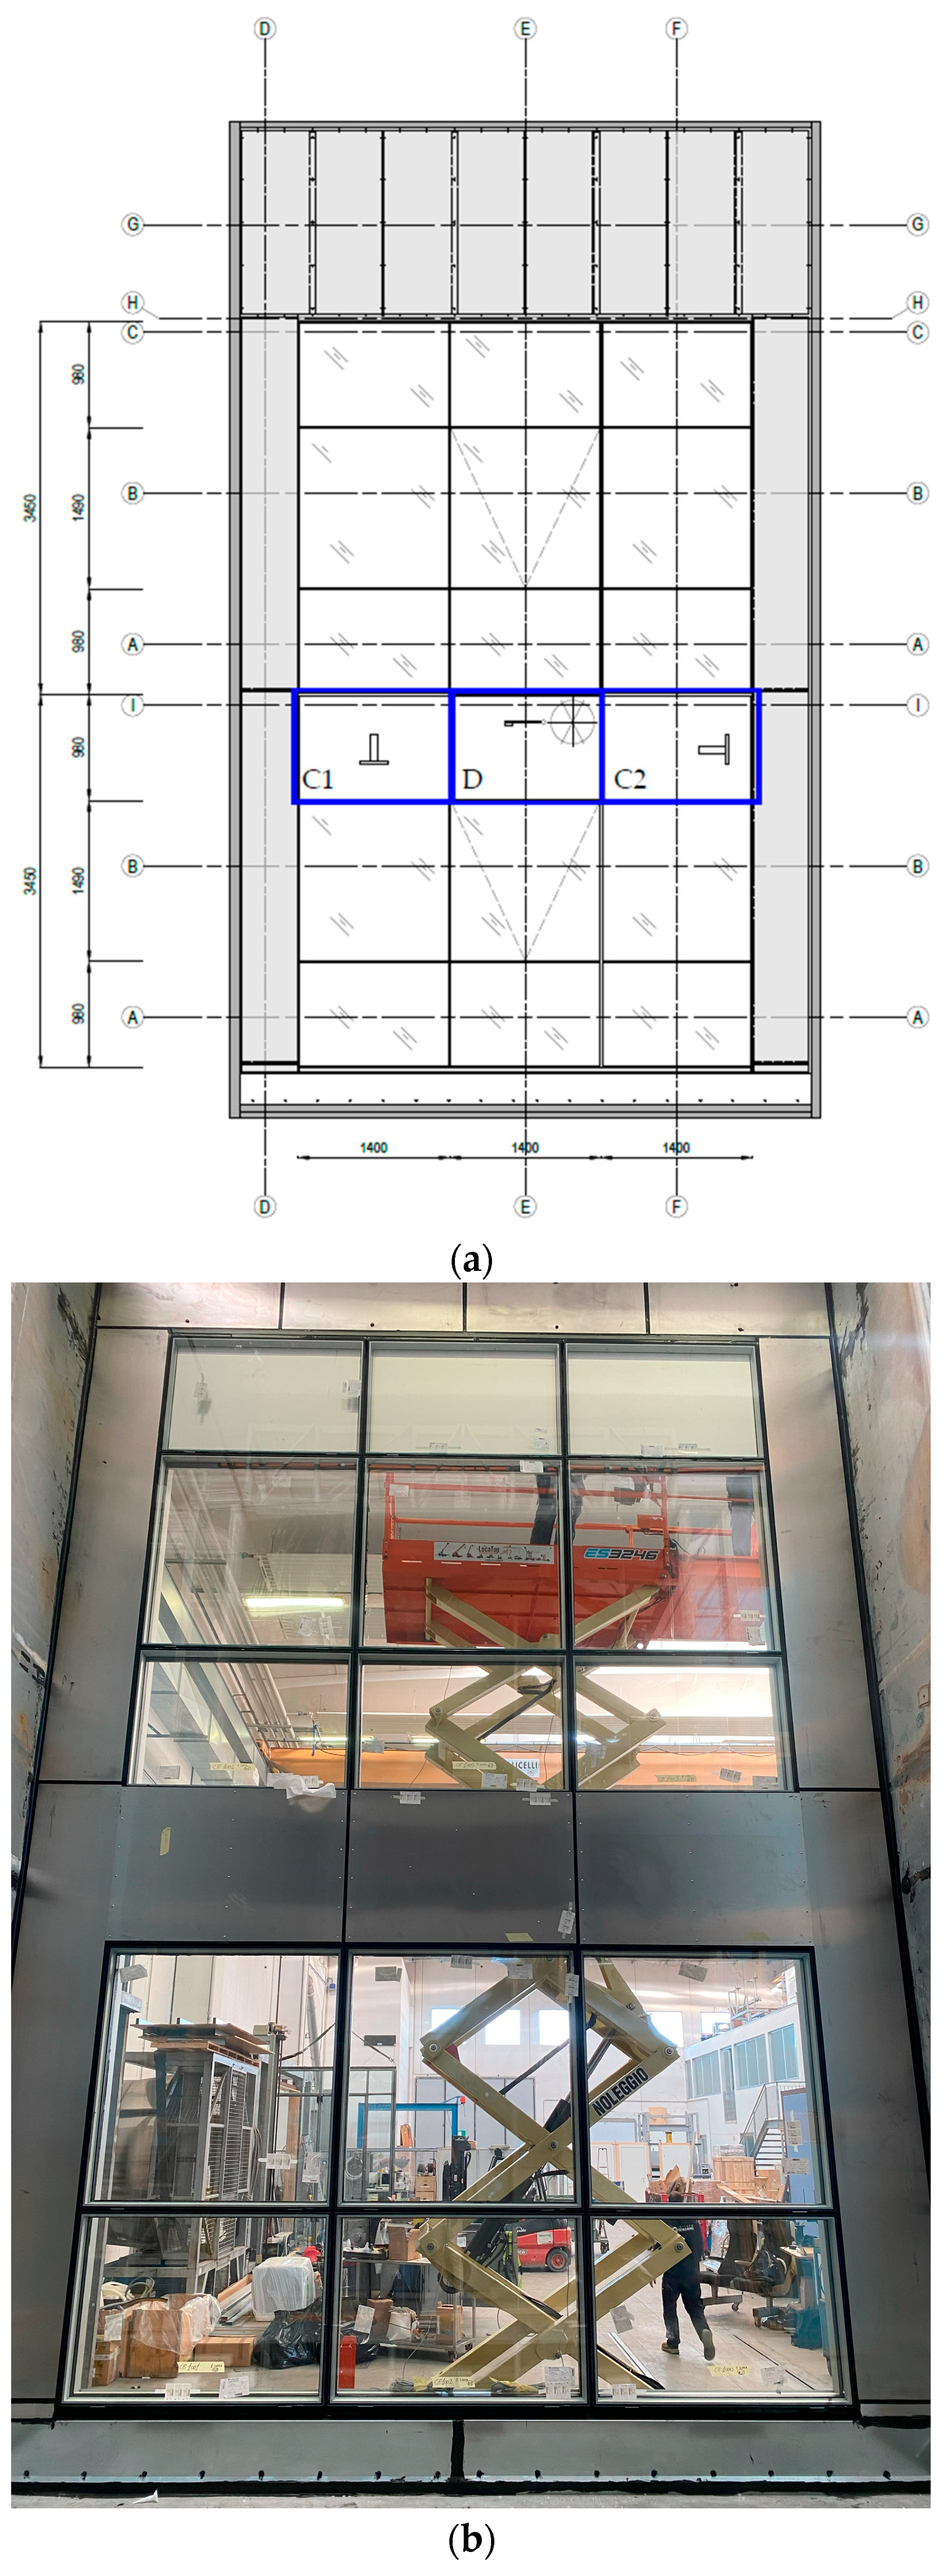
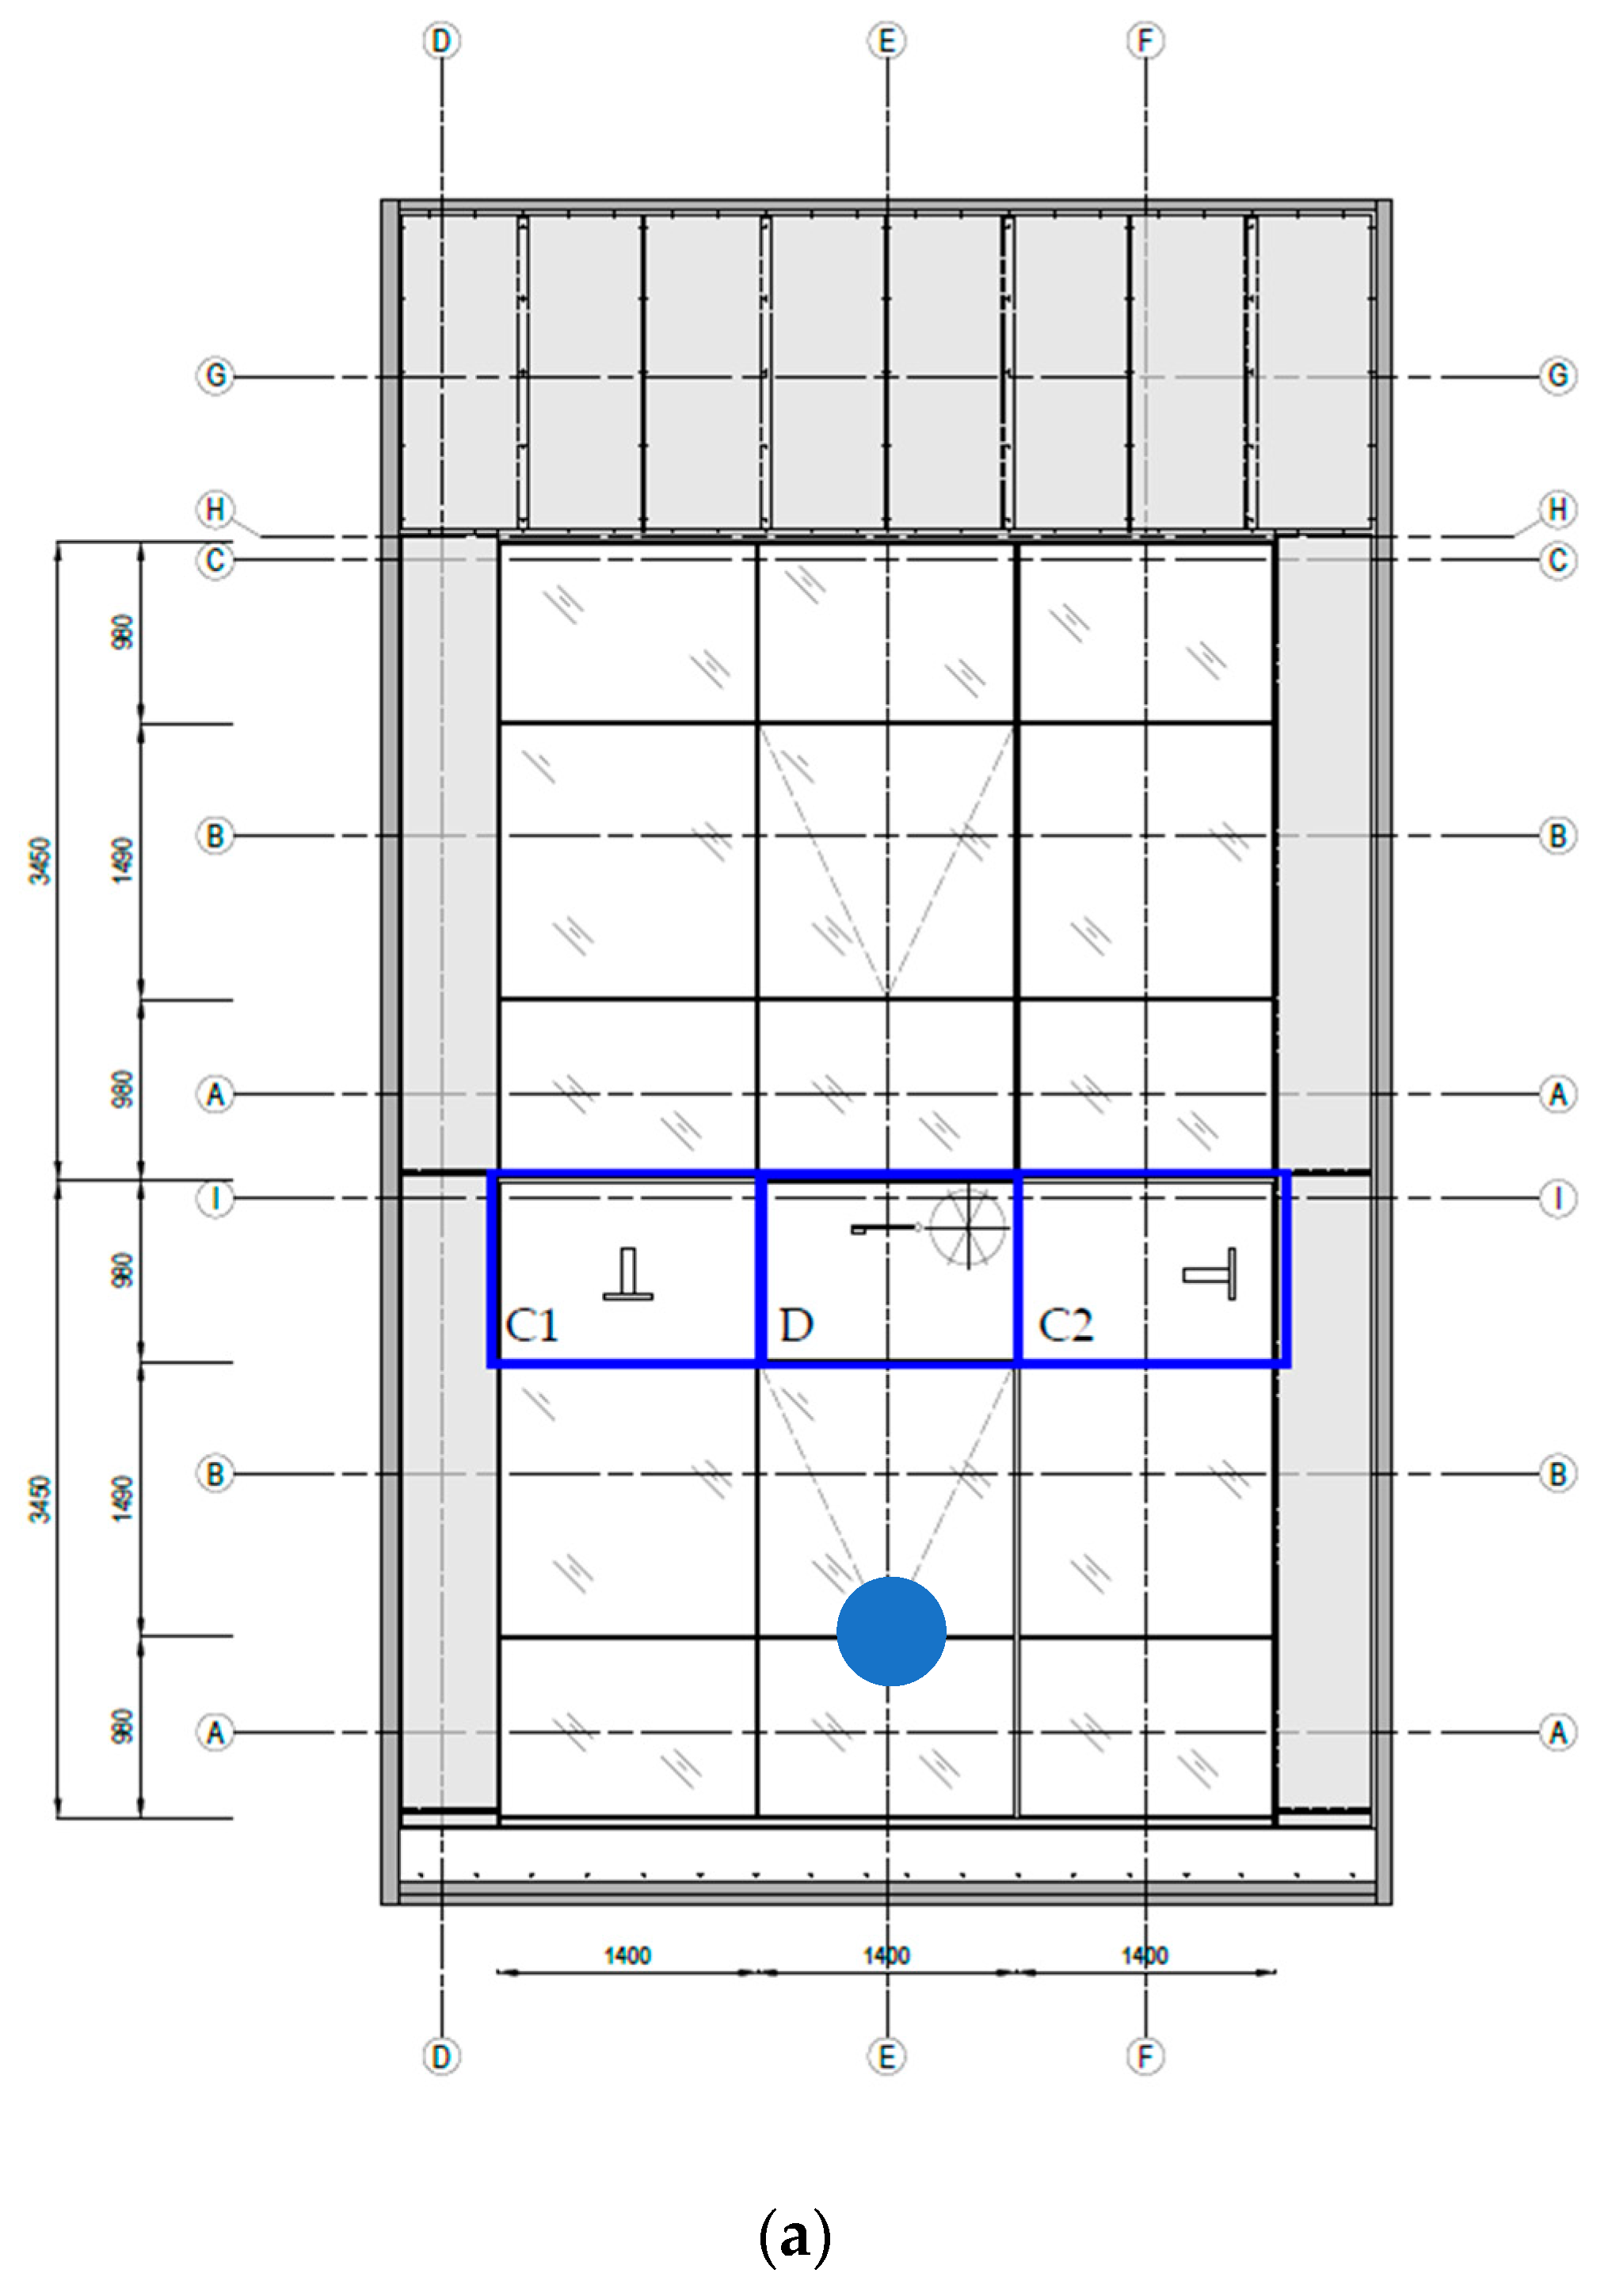
  • Prefabricated façade—A unitized façade system for a multifactional façade is selected [25] to improve solutions in the same product development;
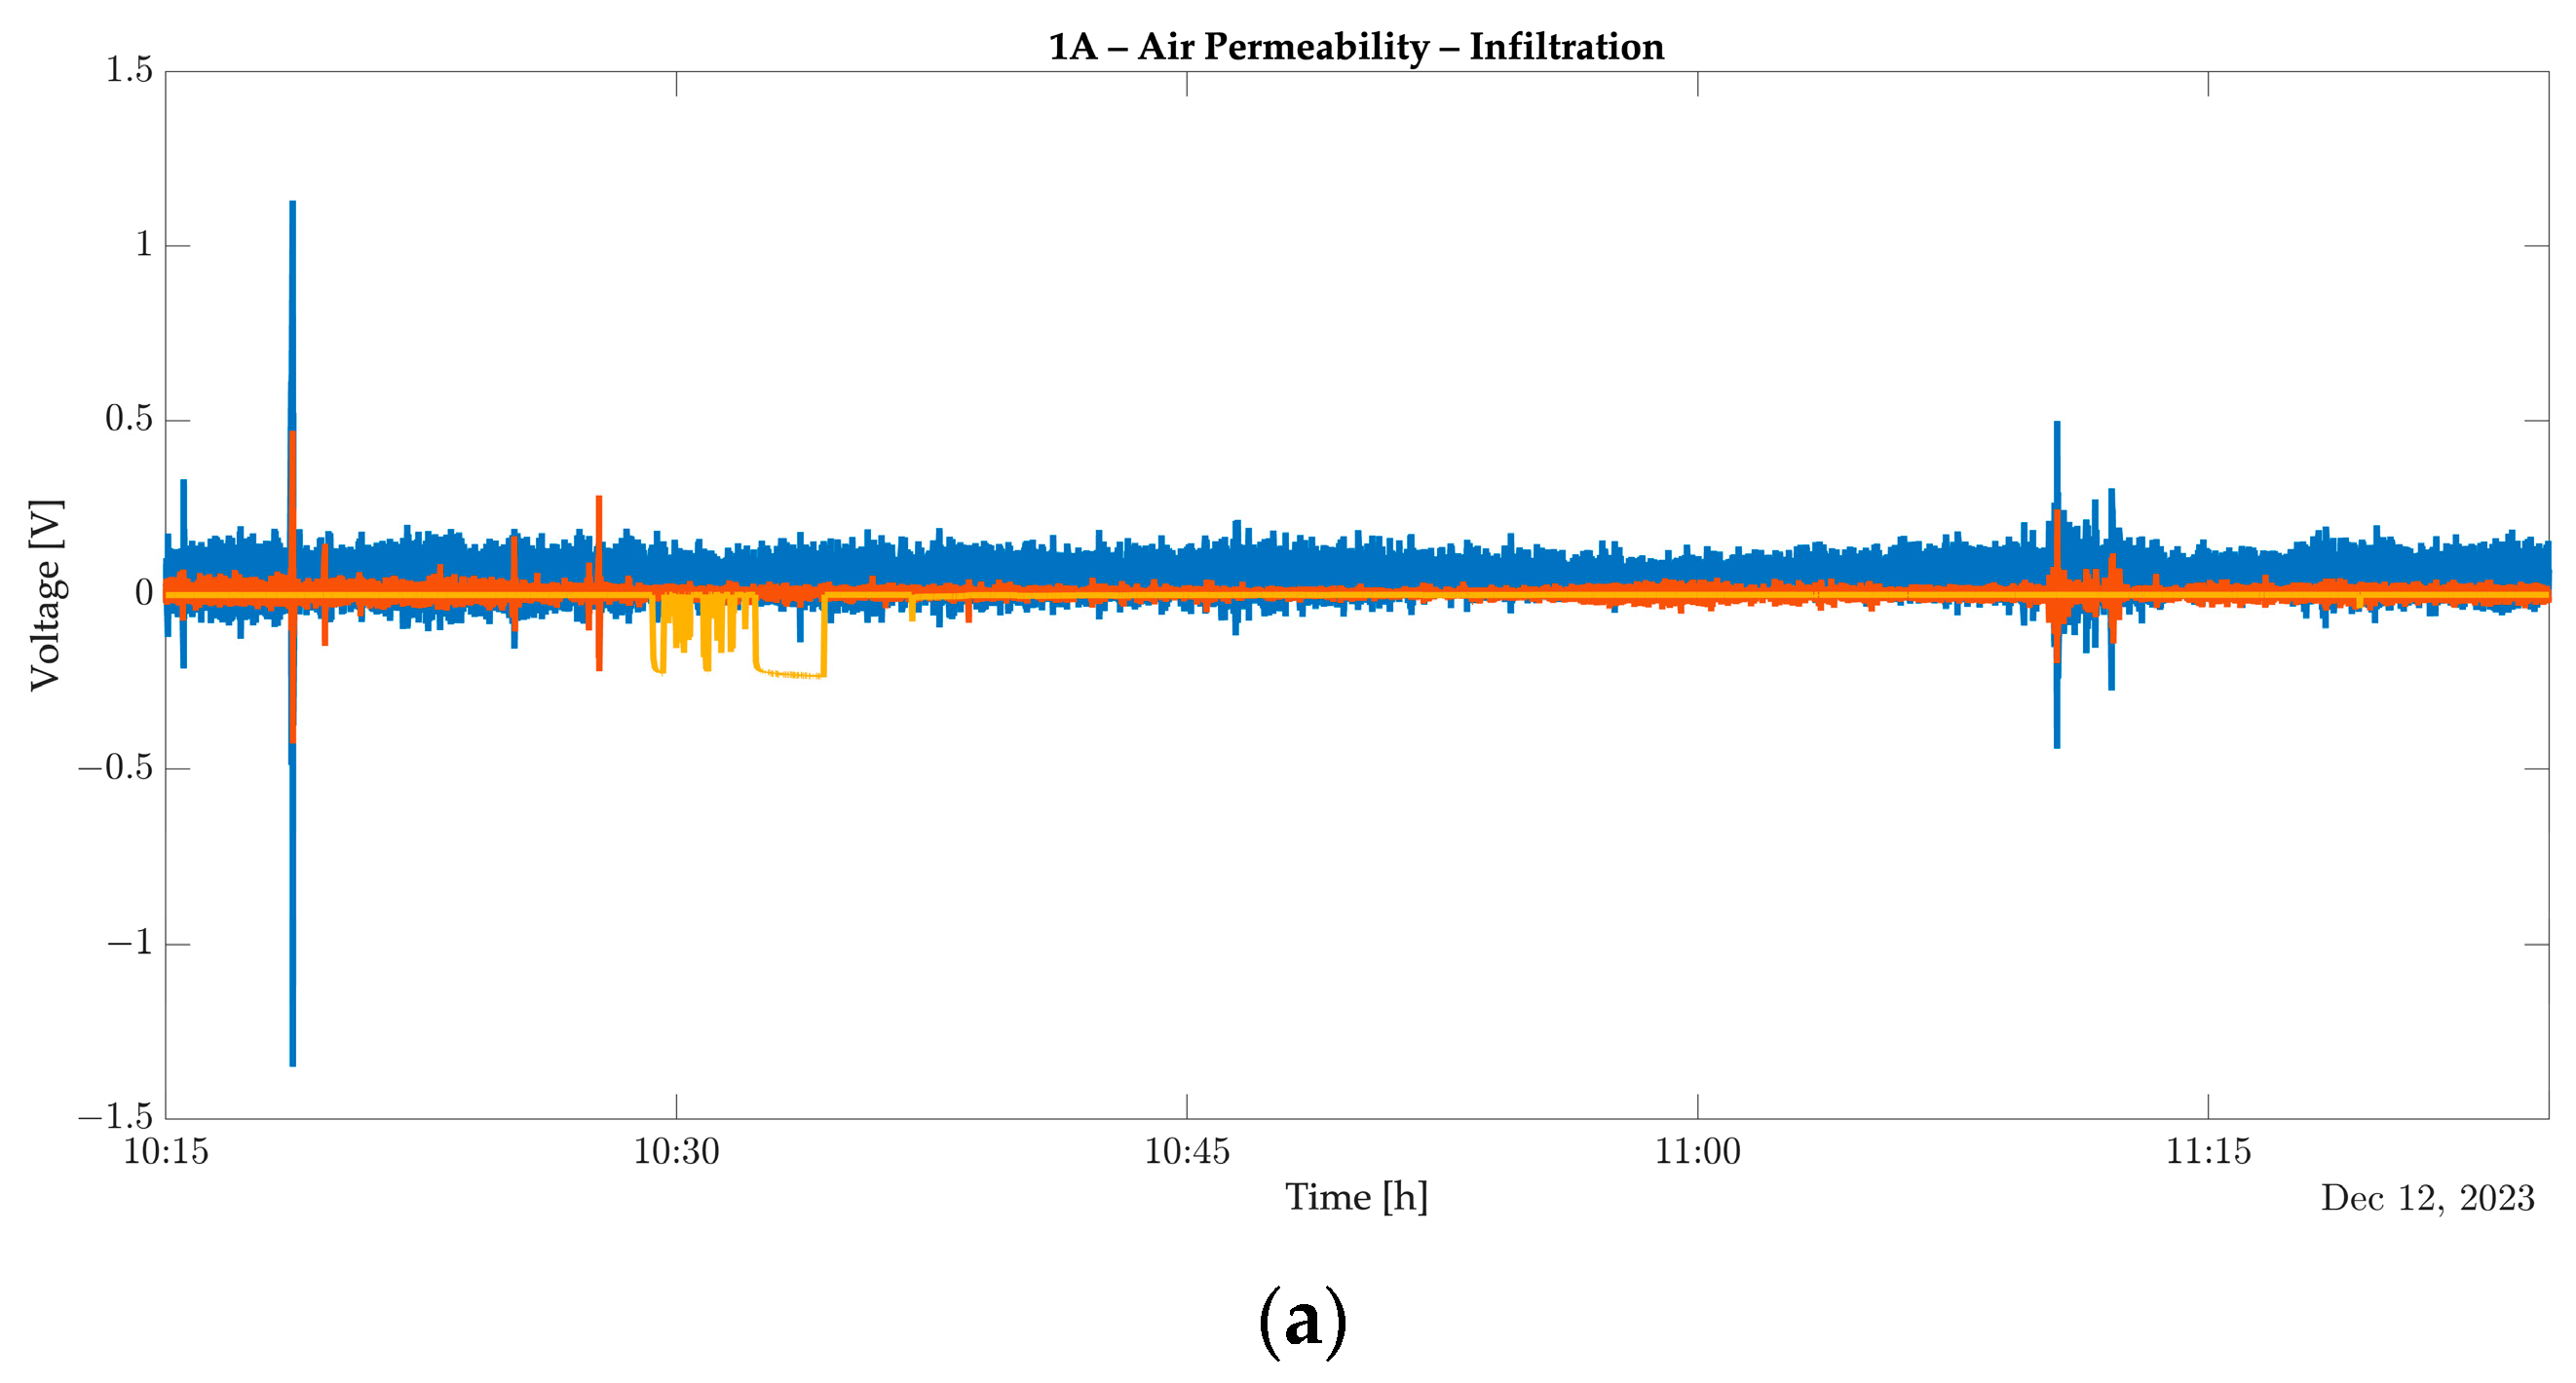
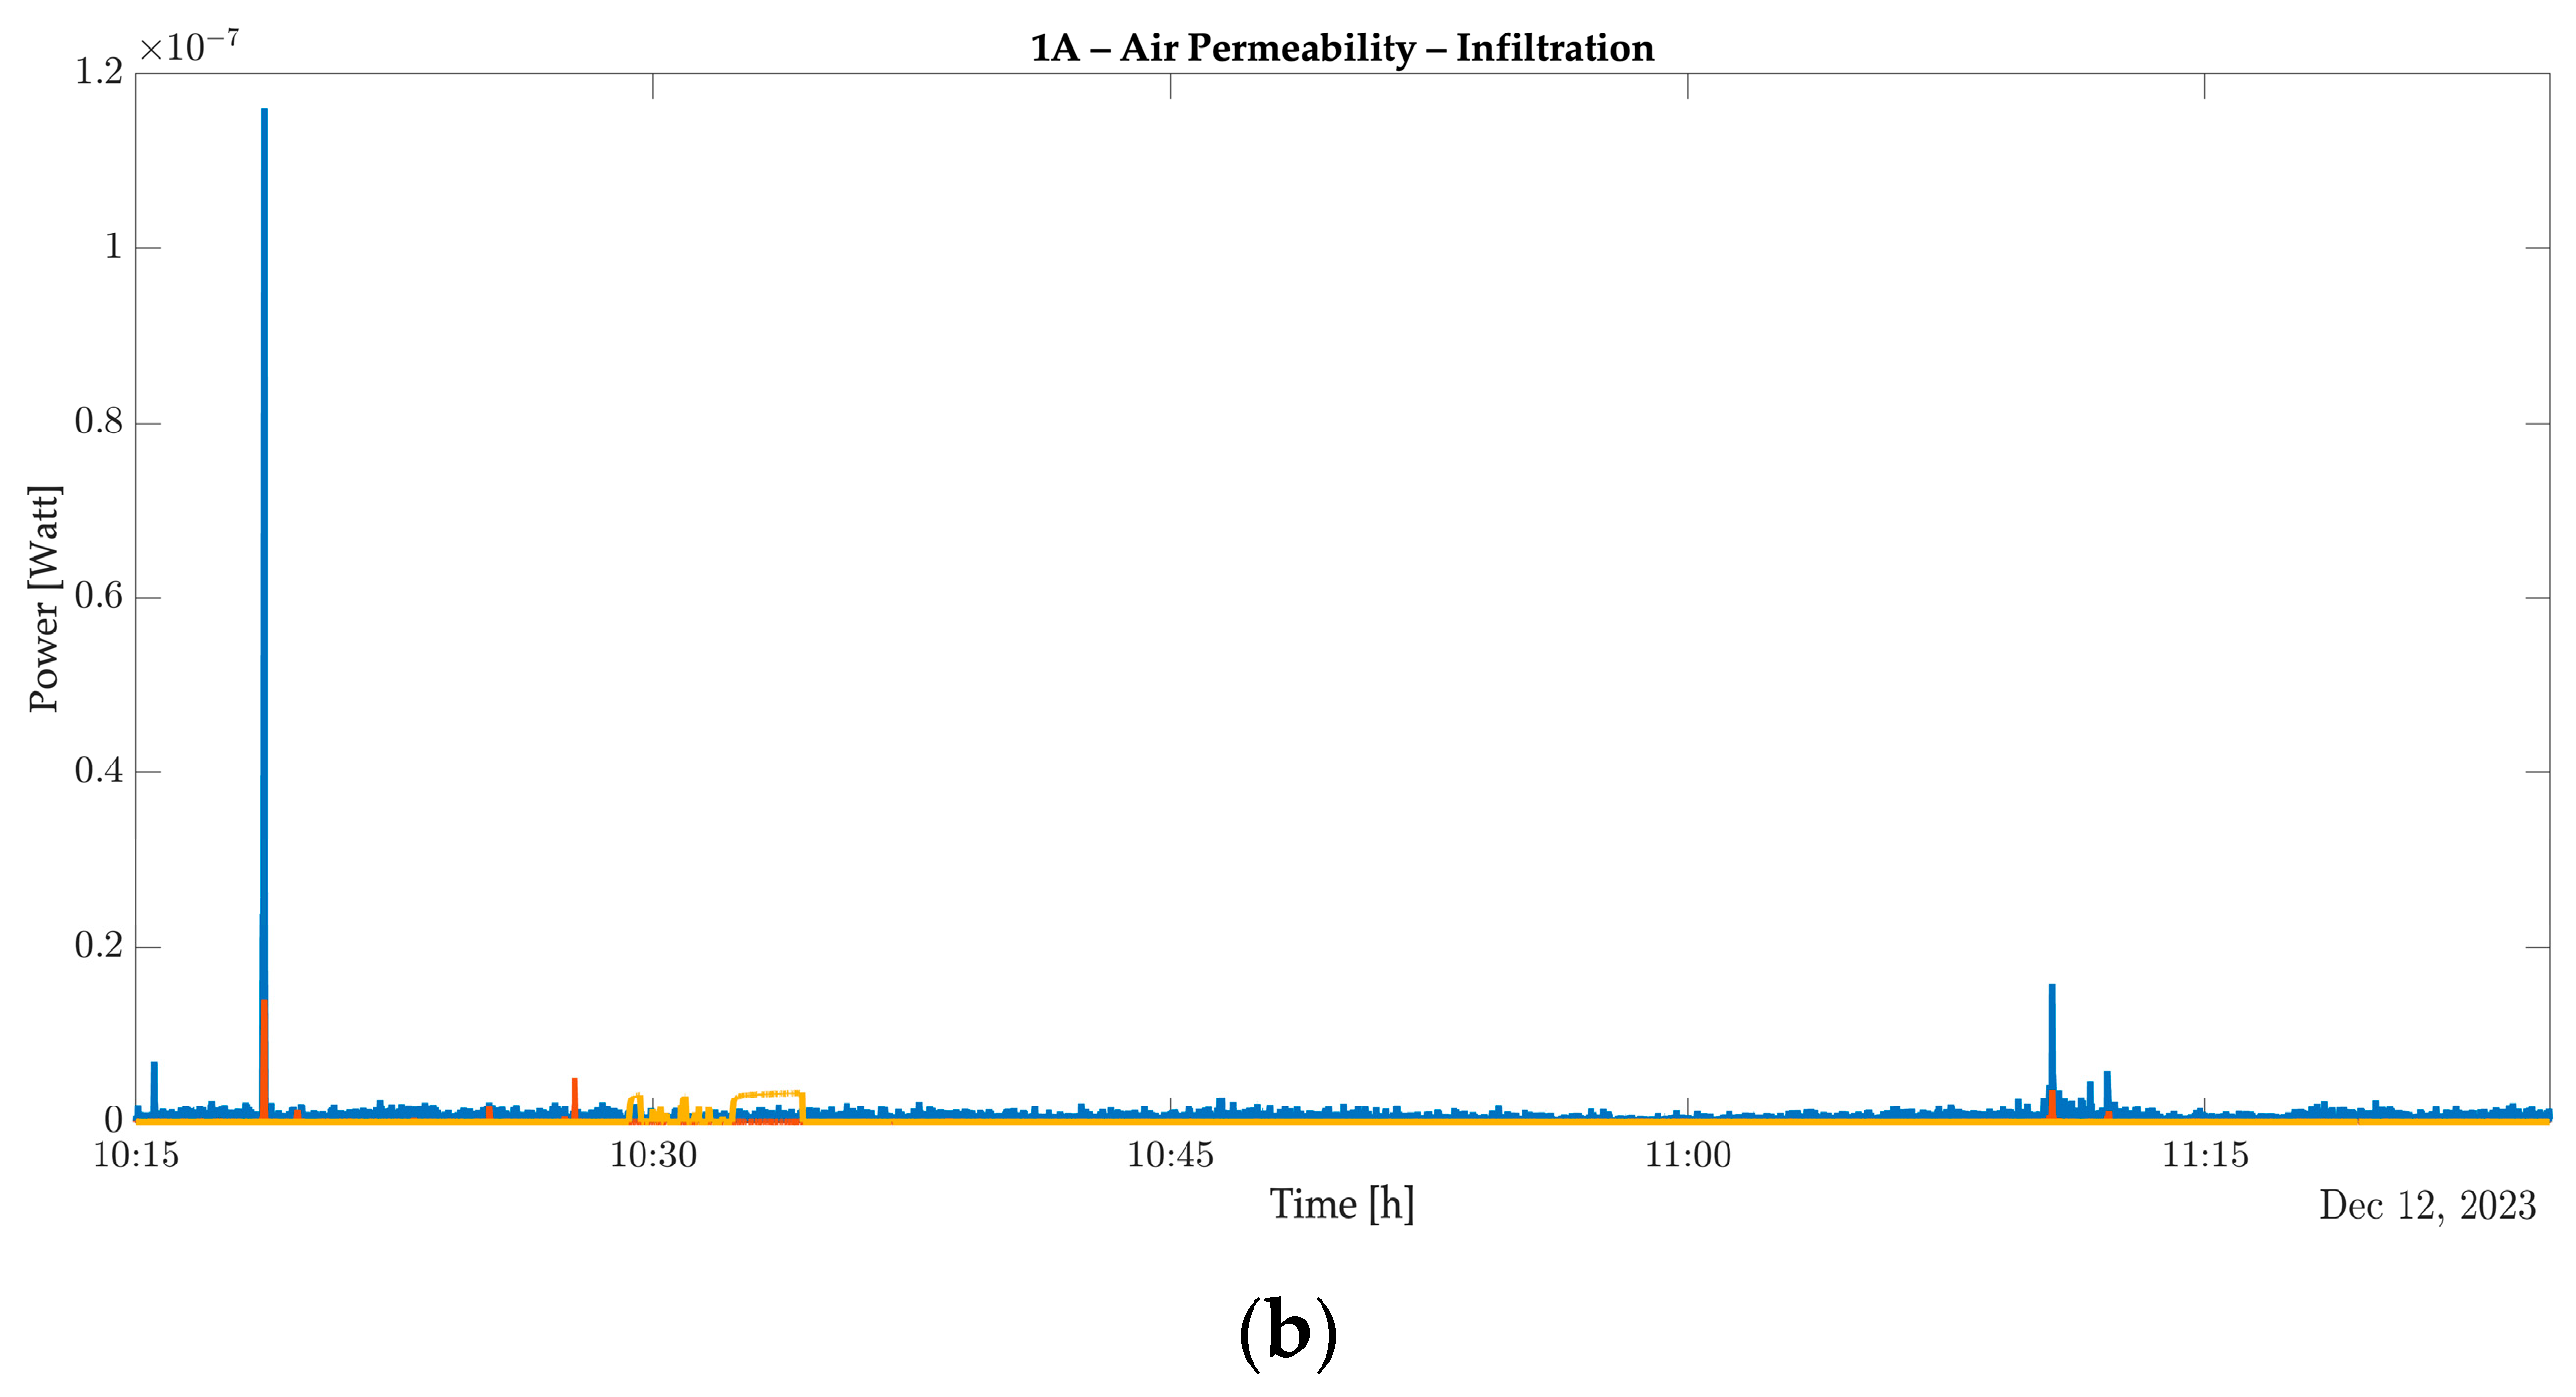
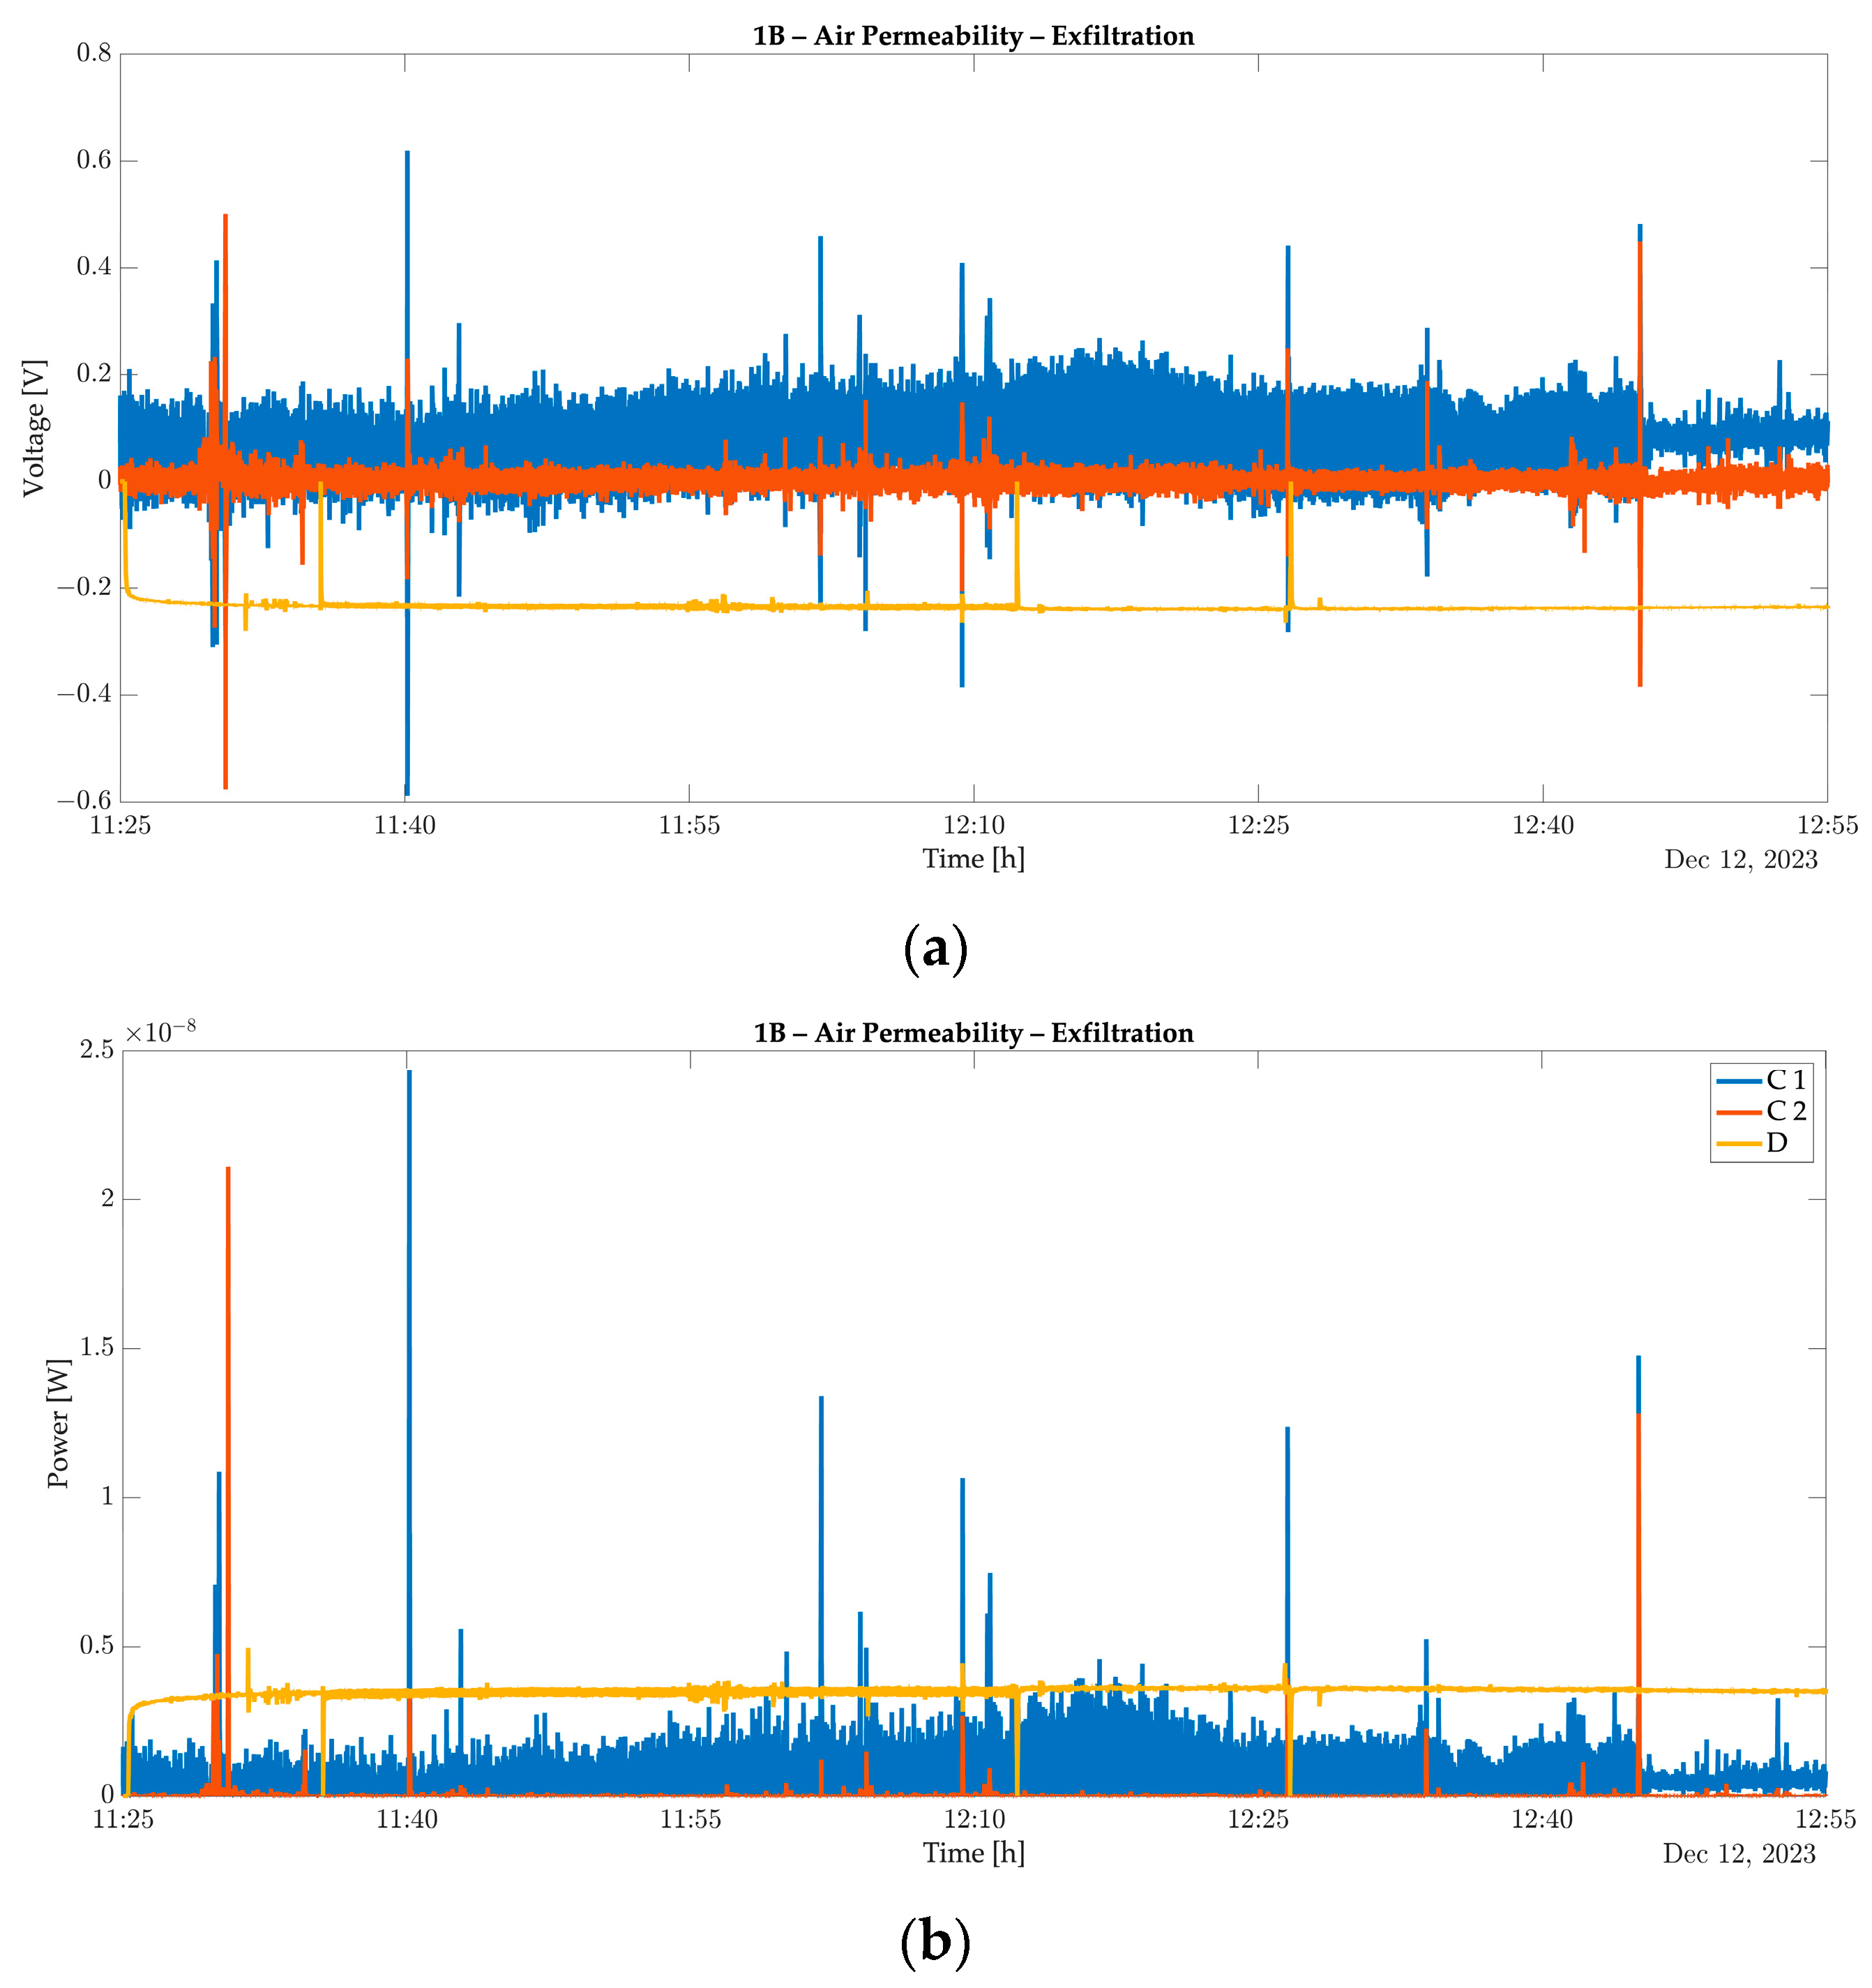
  • Test activities and method statement—In preliminary test activities, real conditions in a small environment or wind velocity generated by a fan of 2–3 m/s are used. In the laboratory tests, a specific method statement is adopted based on stress conditions of the façade using wind airflow and rain forces; see Appendix A. The tests are conducted with a fan at 600 mm and with nozzles simulating rain in correspondence with façade joints with a continuous flow rate of 2 l/min·sqm and at 400 mm from the façade. The PE-EHS is situated behind the façade cladding, replicating its intended integration within a ventilated façade system. While wind load conditions are adopted to check the PE-EHS voltage generated by airflow within the chamber, the rain exposure induces vibrations in the external cladding, exploiting this dynamic interplay between rain-induced vibrations in the cladding and the PE-EHS, in addition to utilizing the airflow within the ventilated cavity. To simulate rain within the controlled laboratory environment, a system employing a series of nozzles corresponding to the typical joint locations in a façade is utilized. Two types of rain tests are conducted:
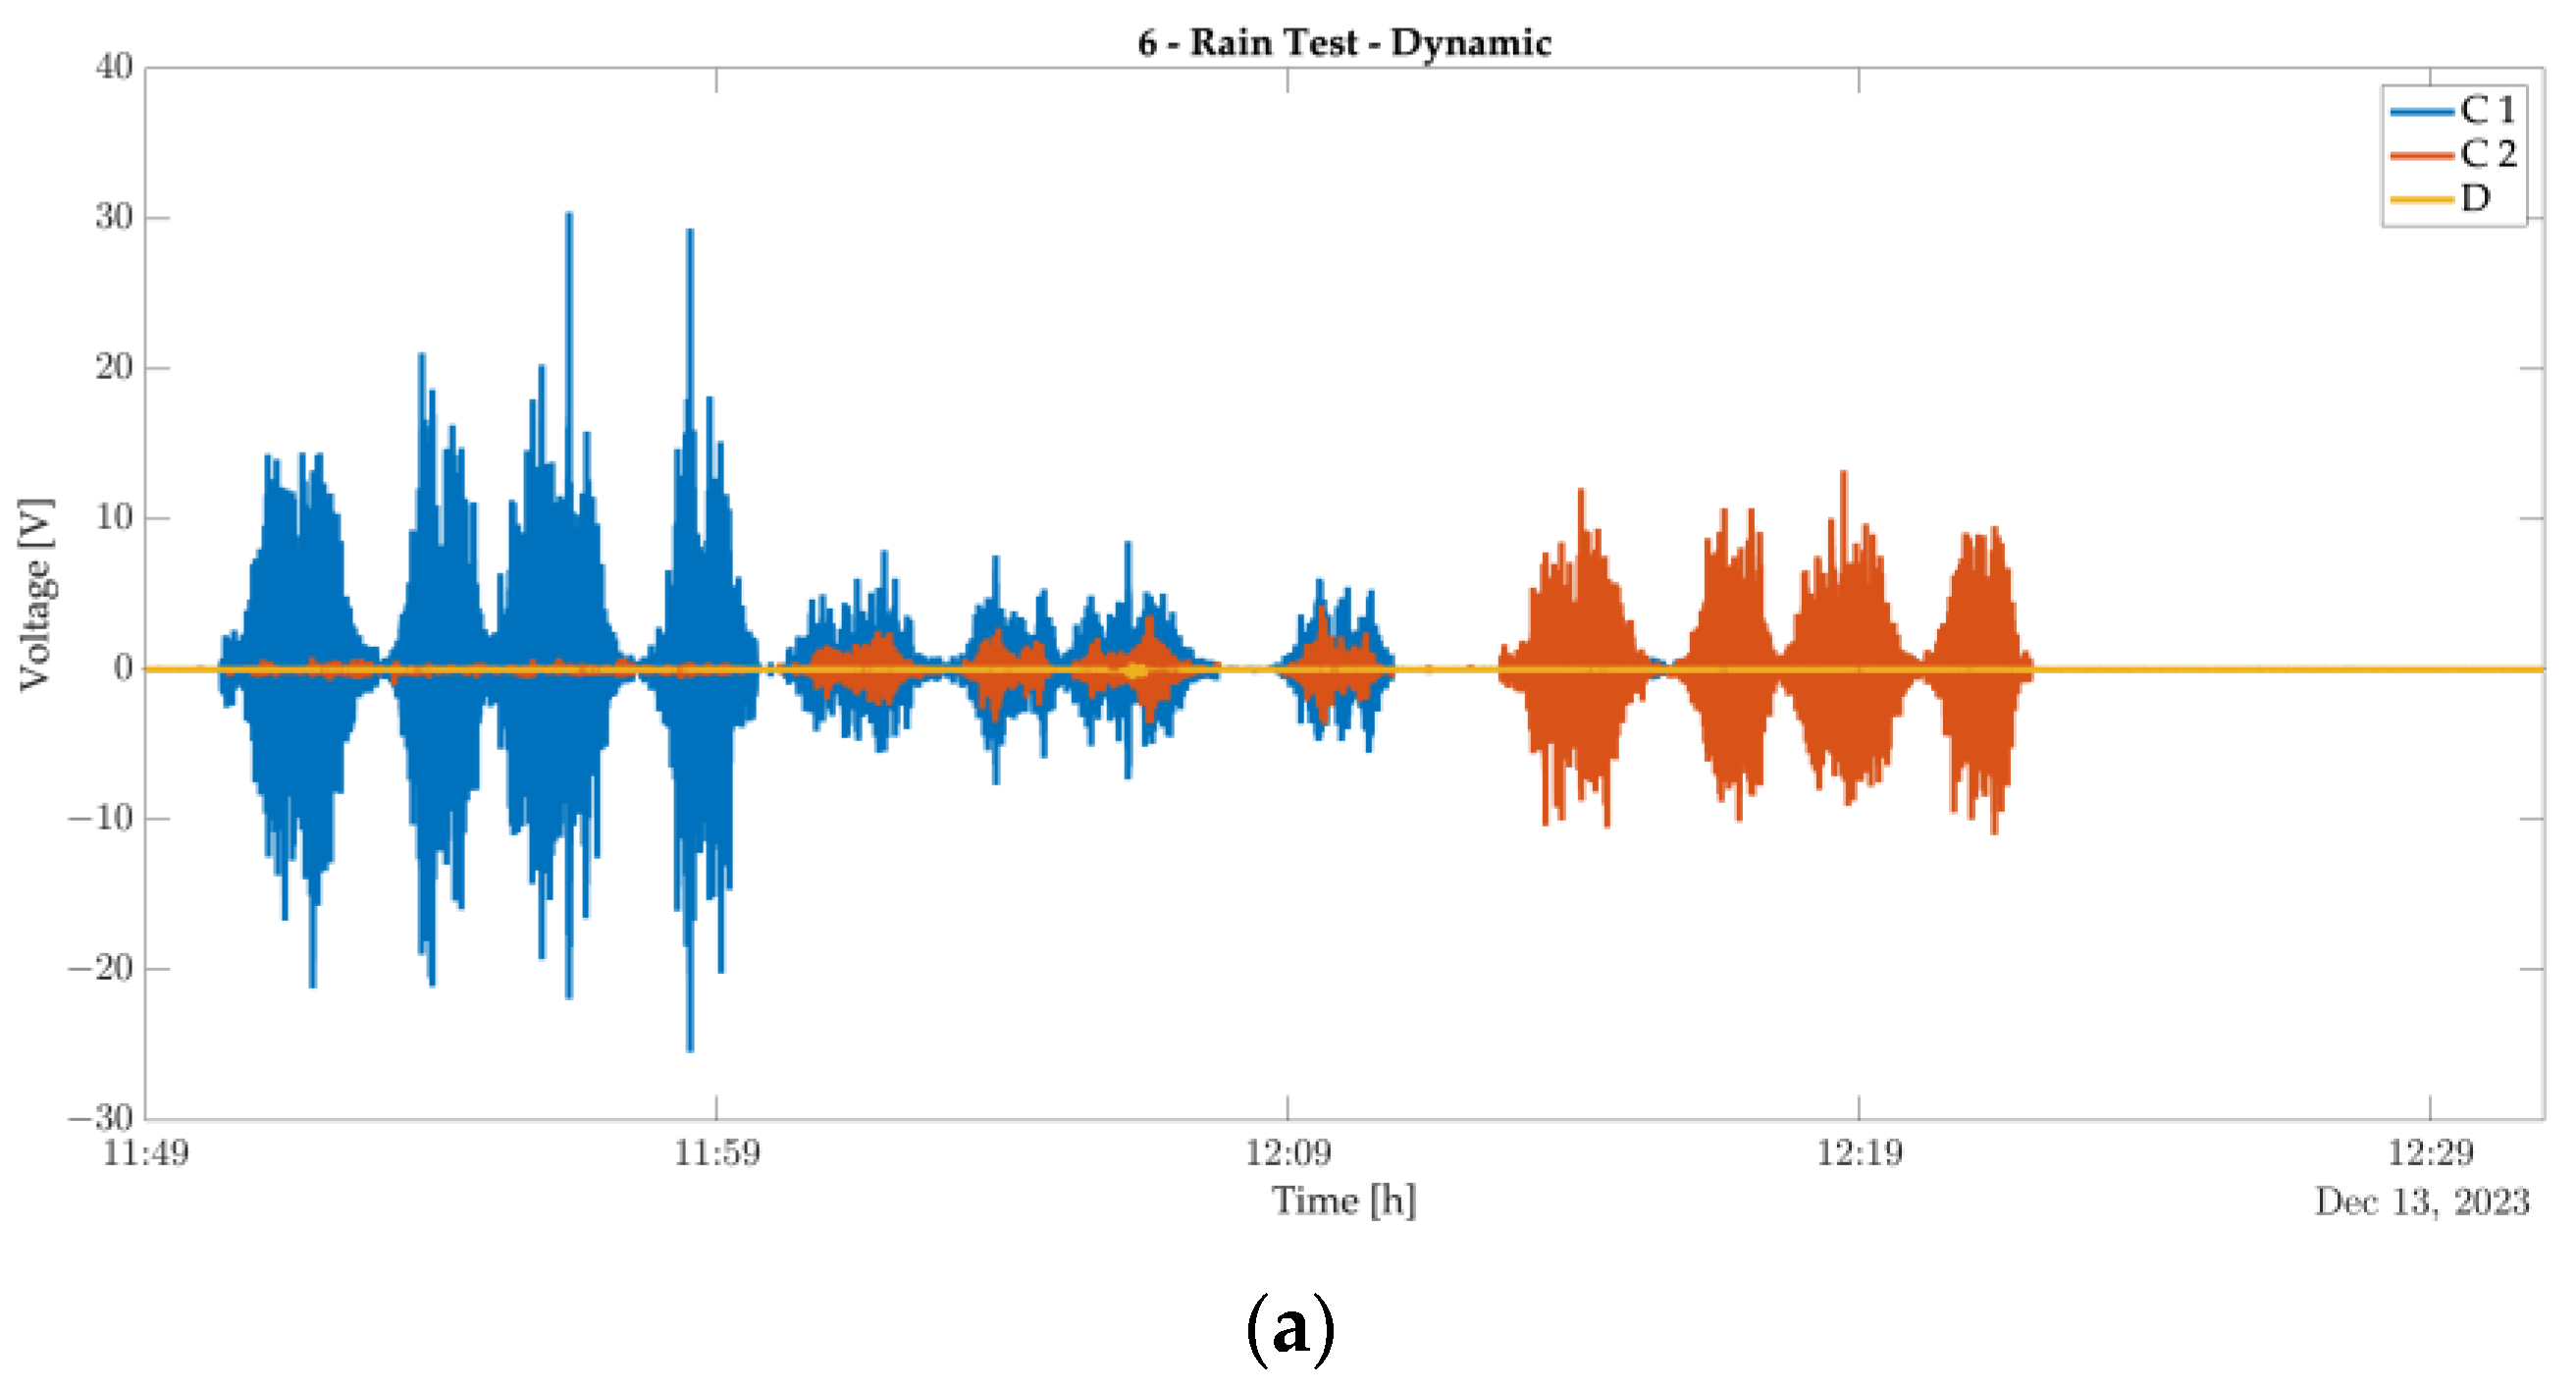
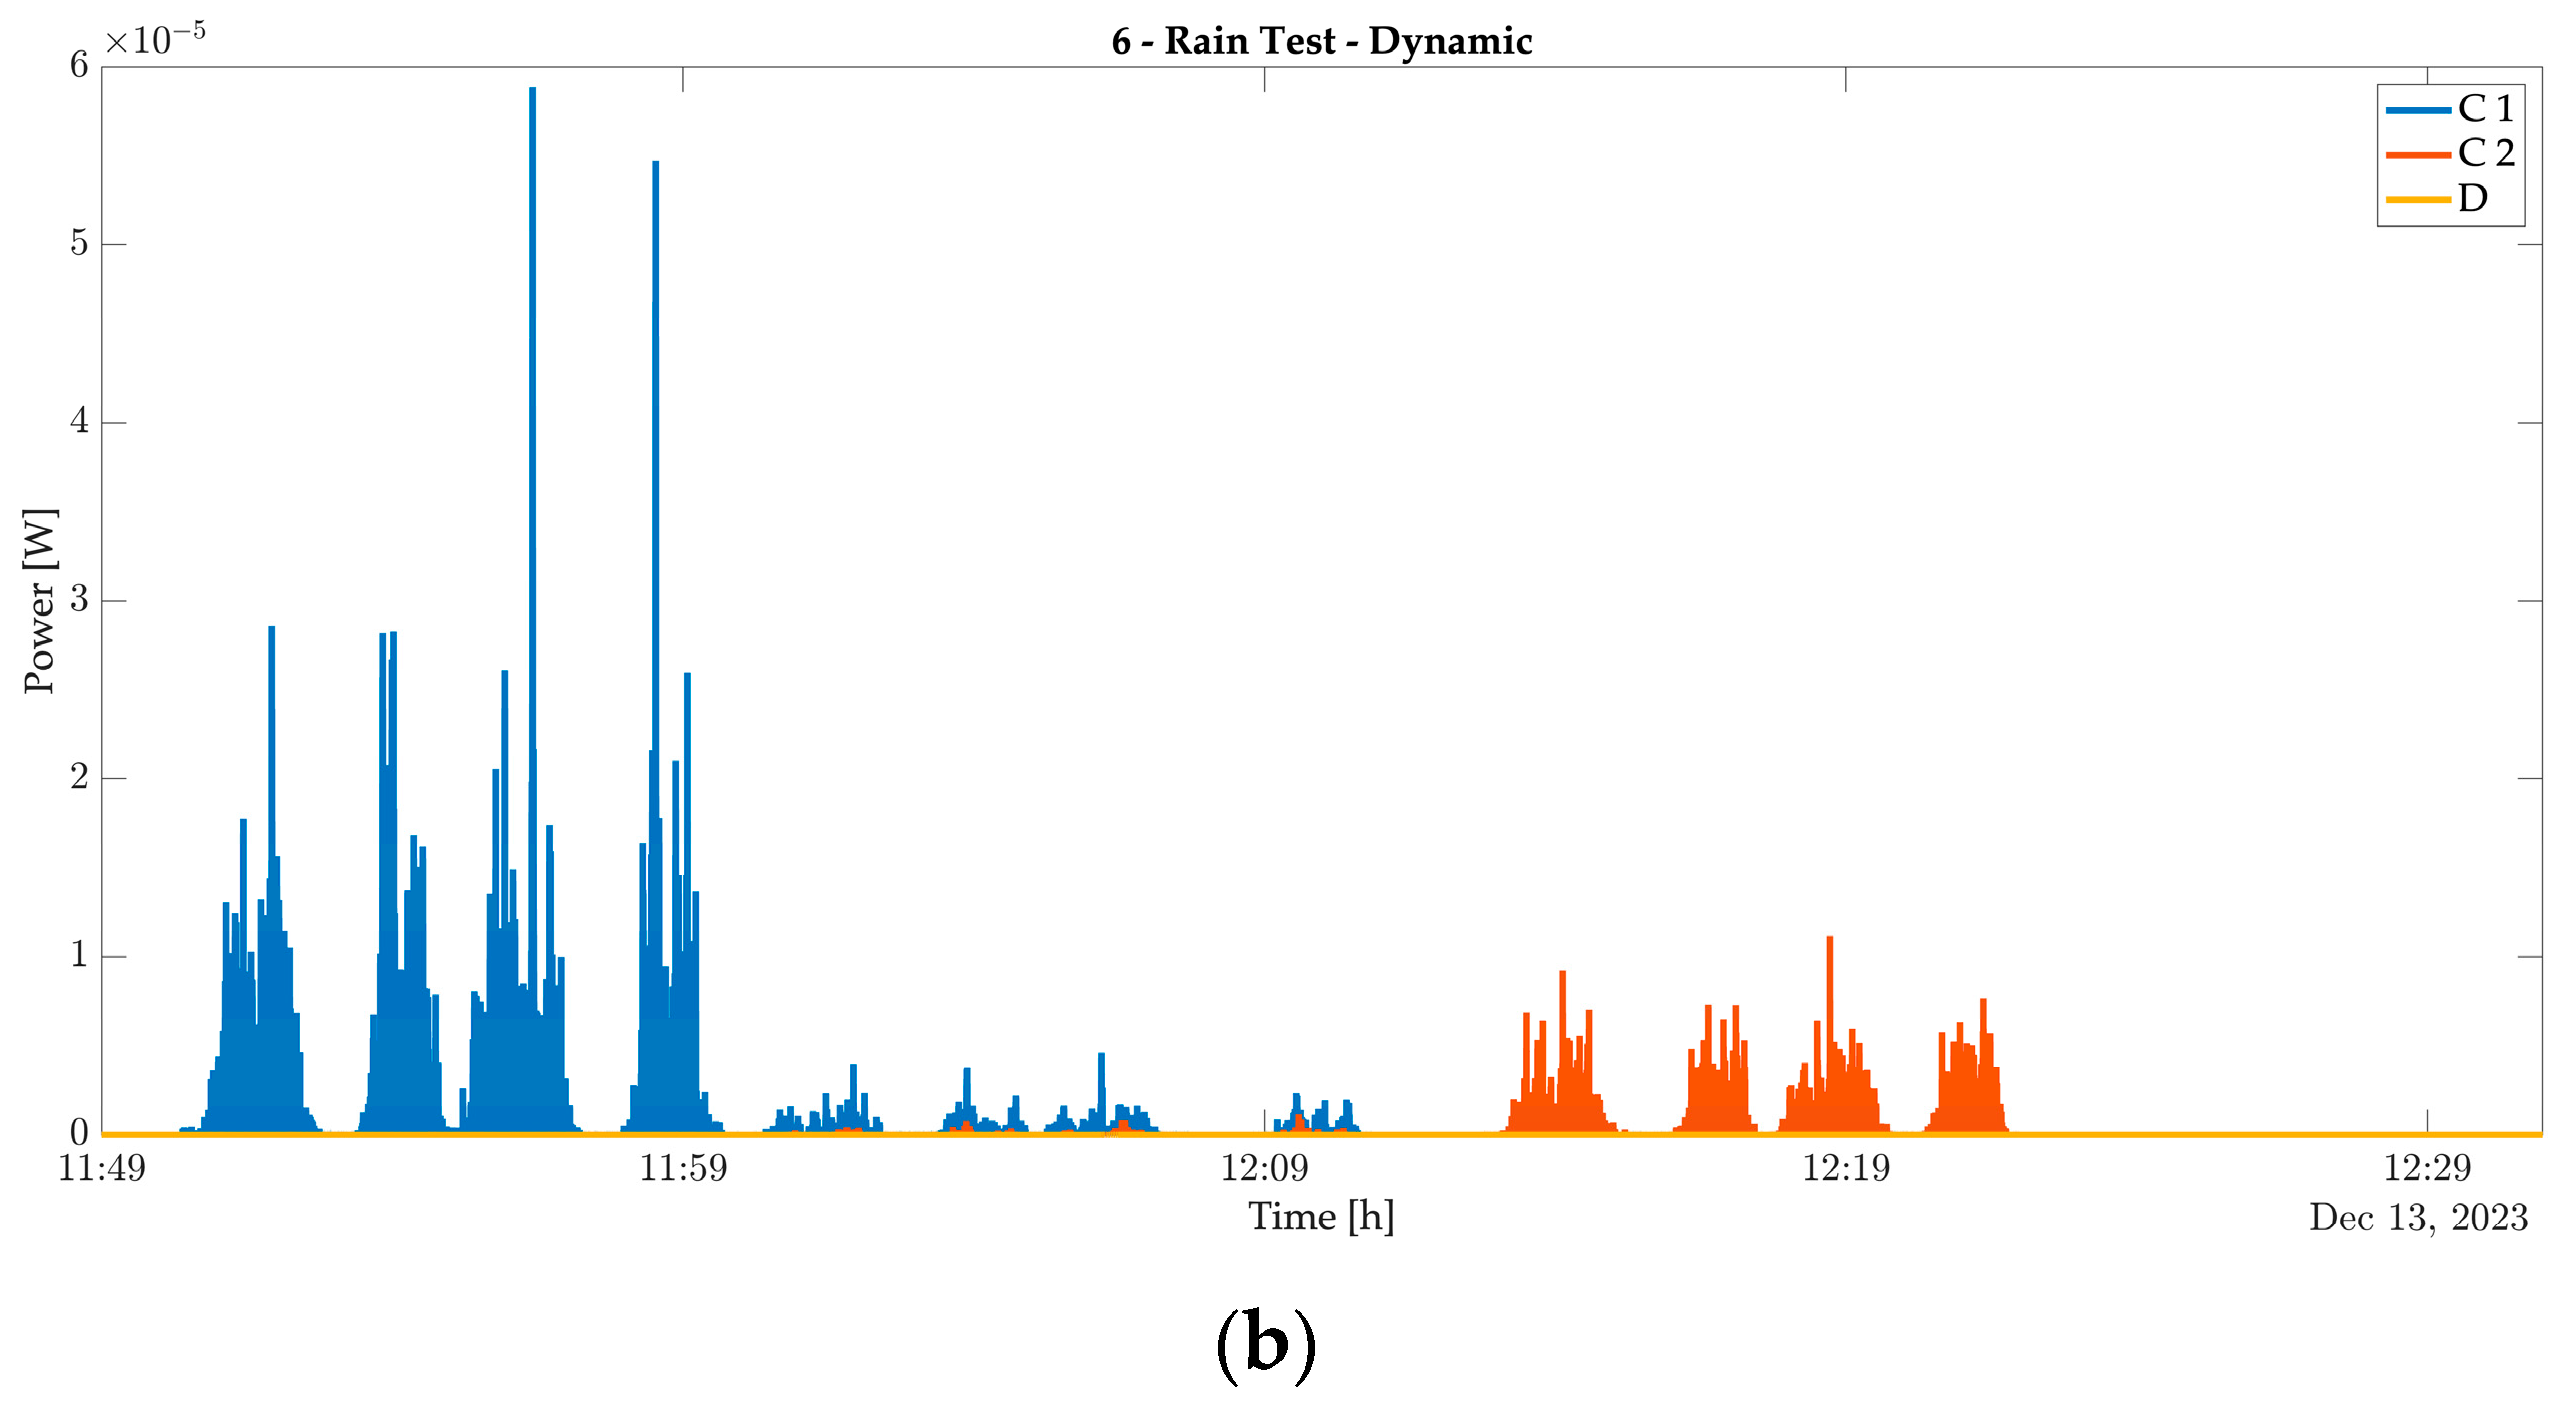
    Dynamic Rain Test: This test simulates wind gusts by generating pulsating pressure variations every 3 s. The pressure fluctuates between 750 Pa and 250 Pa, mimicking the dynamic nature of wind-induced pressure changes;
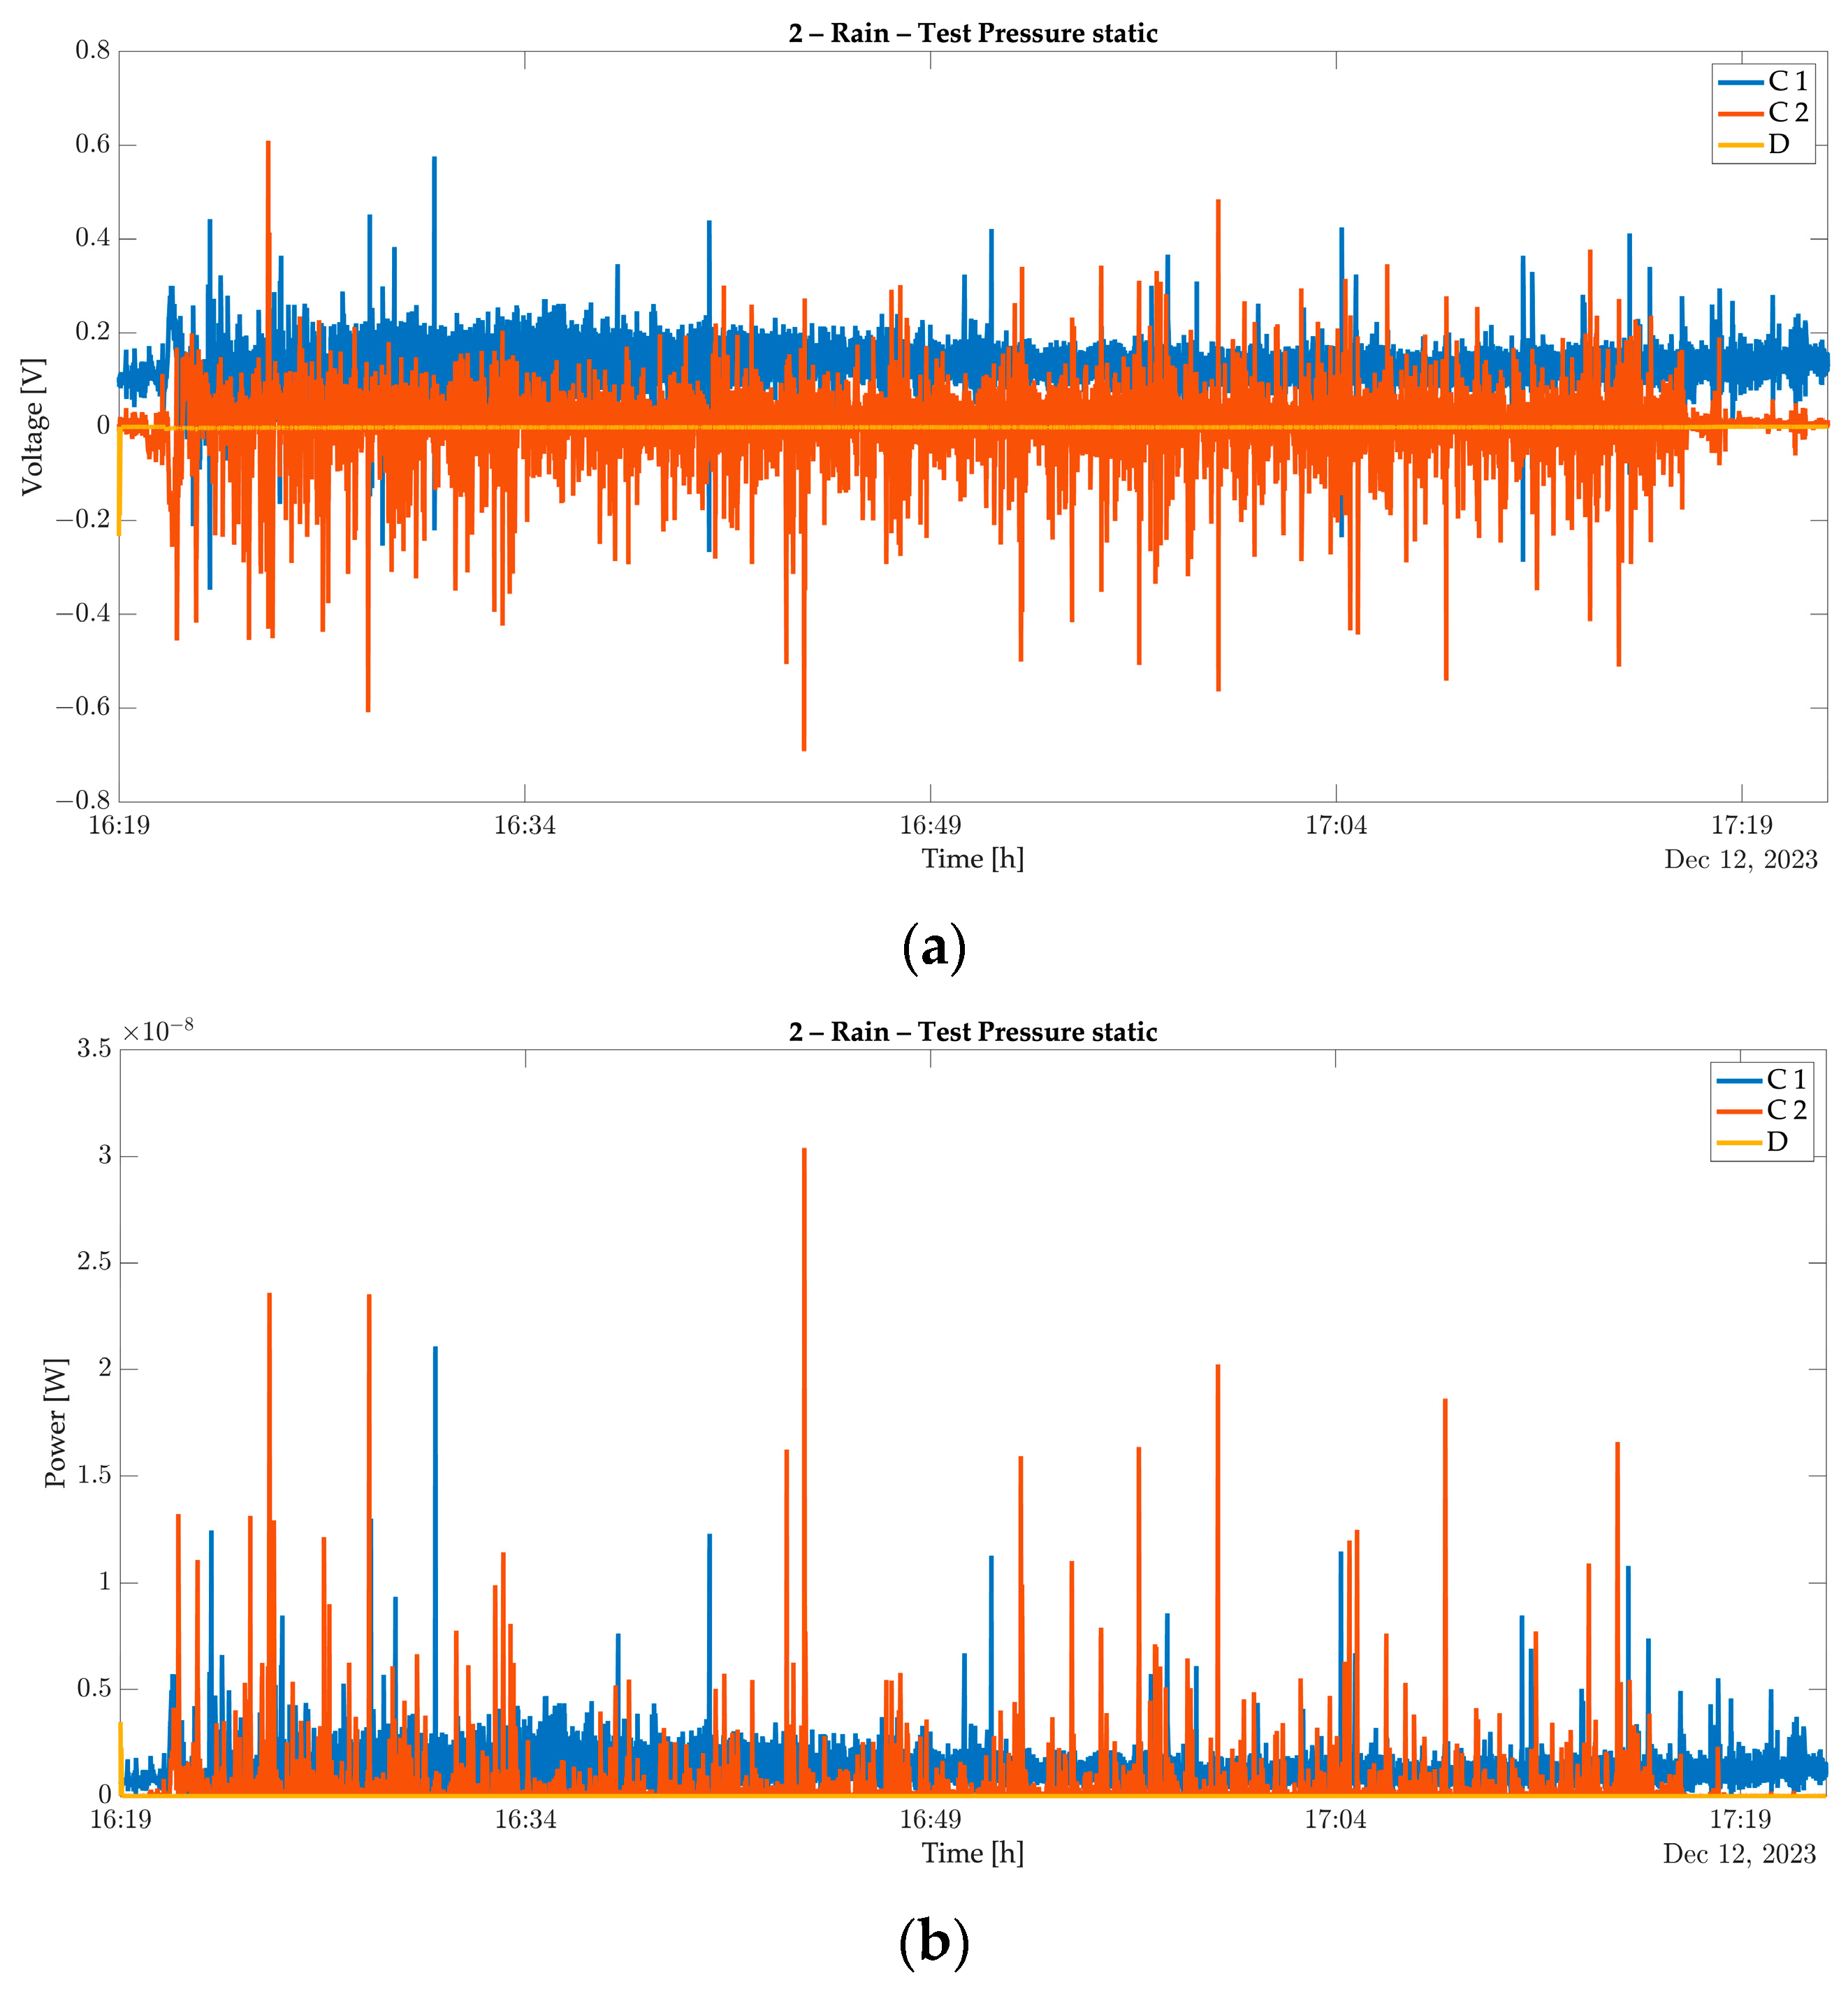
    Static Rain Test: This test aims to understand the behavior under constant rain conditions. A constant pressure of 600 Pa is maintained throughout the test duration.
These simulated rain tests provided valuable insights into the performance of the PE-EHS under conditions representative of real-world façade scenarios, complementing the wind tunnel and airflow-based testing.

3. Results

3.1. Preliminary PE-EHS Configurations and Tests

Based on the InComEss system architecture conceptualization (Figure 1) and façade integration purposes, the PE-EHS cantilever was designed to demonstrate its integrability within a prefabricated ventilated façade.
The ventilated façade [50,51] is a building envelope system that consists of a double-layered wall with an air cavity separating an outer cladding layer from the main building structure. This air cavity allows for natural ventilation, facilitating the circulation of air within the cavity and removing heat build-up during warm seasons. In colder climates, the air cavity acts as an additional layer of insulation, reducing heat loss and improving building energy efficiency. Beyond their thermal benefits, ventilated façades enhance acoustic insulation, dampening external noise and contributing to a more comfortable indoor environment. Additionally, the outer cladding provides aesthetic appeal, offering architects a broader design palette for creating striking and visually appealing building exteriors. Furthermore, ventilated façades can improve durability by protecting the primary wall from harsh weather conditions, extending the building’s lifespan and reducing maintenance needs. The PE-EHS cantilevers are strategically positioned within the cavity; they can harness ambient wind-induced vibrations or pressure fluctuations to generate electricity. The design of these integrated cantilevers requires analysis of various factors. The placement and orientation of the cantilevers optimized to maximize exposure to these vibrations while ensuring structural integrity and aesthetics within the façade design are presented here.
The airflow entering the ventilated façade cavity plays a critical role in the functionality of the integrated piezoelectric cantilevers. Ideally, the airflow should possess certain characteristics to optimize energy harvesting, such as sufficient velocity with a minimum wind speed that is necessary to generate meaningful vibrations in the cantilevers, enabling them to produce a usable amount of electricity or stability and directionality due to the fact that turbulent or non-parallel airflow patterns can significantly reduce the efficiency of energy harvesting. Therefore, understanding the behavior of the airflow entering the ventilated cavity is essential for designing and optimizing the integration of piezoelectric cantilevers. Figure 2 shows the behavior at different airflow velocities to the façade (2.5 m/s and 10 m/s) of the airflow within the ventilated cavity. The model demonstrates that the airflow inside the ventilation space remains consistently laminar, presenting an opportunity to maintain a constant frequency in the vibration of PE-EHS cantilevers. Consequently, the PE cantilevers are specifically designed to align with the cavity within the façade.
The early-stage conceptualization is based on the utilization of PE-EHSs based on cantilever- and vortex-induced vibration [52]. This configuration is founded in the physical field of fluid–structure interaction based on impacting bluff bodies subjected to a continuous flow of fluid; for façade application, the excitation mechanism of the vortex shedding phenomenon is enabled by the wind-induced vibration with vortices periodically shredded from the cylindrical bluff body. This design includes a PLA cylinder at the extremity of the PE, specifically conceived to be responsive to a wind speed of 1.5 m/s. The dimensions of the PE cantilever are 110 × 35 mm, while the designed cylinder features an outer diameter of 10 mm constructed from PLA material. In line with this concept (Figure 3), two configurations have been supposed for façade integrability (Figure 3a,b). While configuration “A1” is more conventional, concerns arise regarding its dimensions for façade integration. The cantilever, with a length of 110 mm, proves challenging to apply seamlessly into a façade. Consequently, an alternative configuration based on a vertical cantilever (“B1”) was devised, featuring an overall width of 25 mm, making it more practical for integration into a façade, particularly one with a possible ventilated cavity of 35/40 mm. The consideration of a ventilated cavity stems from an architectural requirement for the complete integration of the PE-EHS within the façade, anticipating the concealment of the PE-EHS visioning with a cladding material. For this reason, two more configurations have been defined for horizontal cantilever configuration with external cladding “A2” and vertical cantilever configuration with external cladding “B2”. These configurations generate energy voltage by directly stimulating the cantilever with the wind flow, creating a vortex effect (configurations “A1” and “B1”), or by harnessing airflow entering the ventilated cavity of the façade (configurations “A2” and “B2”).
The PE-EHS testing beds (Figure 4) were installed in Focchi premises in Italy (coordinates 44.04671, 12.41286) into an existing façade (real environment) at 5 m in height from the ground and with a range of wind direction of 0.5 m/s to 3 m/s monitored by an anemometer installed in the Focchi premise (11 m height) for a period of 2 weeks for each configuration (22 November 2021–04 December 2021, weather data available at [53,54]). Considering days without precipitation, Table 1 reports the average energy produced in a time stamp of 2 h for two different days with a wind velocity average of 2–3 m/s by vertical configuration “A”. The results demonstrate a low voltage output from the PE-EHS, which is insufficient to power the FOS monadgator. The results obtained using configuration “B” were even lower and deemed nonrelevant and, therefore, not reported.
Based on the results obtained using configuration “B” but considering the integration into the façade’s small cavity to be crucial for the InComEss architecture, an additional set of configurations was designed (Figure 5). These configurations were designed to investigate the chance of adopting the PE-EHS in a small cavity by harnessing not only the airflow entering the ventilated cavity of the façade but also the wind load on a façade’s cladding realized in a metal sheet of 30/10 mm to exploit the related frequency of vibration.
The two configurations selected for further investigation that were considered to have a more promising combined effect for harnessing both airflow within the cavity and the vibration of the metal sheet cladding are configurations in Figure 5b, named “C1”, and Figure 5c, named “C2”. To validate these configurations, the one with the lower potential for electrical energy generation, configuration “C2”, was tested in the Focchi premise (Figure 6). The test was conducted by installing a metal sheet cladding in an existing façade at 3 m in height from the ground and with a range of wind direction of 0.5 m/s to 3 m/s for a period of 2 weeks for each configuration (6 June 2023–20 June 2023, weather data available at [55]). Considering days without precipitation, Table 2 reports the average energy produced in a time stamp of 2 h for two different days with a wind velocity average of 2–3 m/s by configuration “C1”. Despite the lower voltage output, which is insufficient to directly power the FOS monadgator, the results confirm that PE-EHS configuration “C1” can effectively address façade integration requirements within an air-ventilated cavity.
During the development of the PE-EHS, a paradigm shift was explored based on cantilever stimulation using magnetic forces activated by wheel rotation. The concept involved affixing permanent magnets to both the end of the cantilever and the wheel, thereby inducing a continuous and stable deformation of the cantilever throughout the wheel’s rotation. To investigate the concept of using wheel rotation to induce mechanical deformation, multiple different wheel configurations were simulated and tested in CeNTI premises, moving from an initial wheel configuration to the final one (Figure 6). The first configuration was obtained through the adaptation of a typical side windmill. The concept was to gather as much wind as possible, covering the largest area. Due to the sheer size of the structure, the windmill was not capable of jumpstarting with low-velocity winds. With the reduction in size in mind, a four-legged wind blade with a thin support structure in the middle was developed using SolidWorks.
While the theoretical vortex-based cantilever is well established in the literature for its vortex simulation concepts, due to the complexity and innovative nature of this design, a three-dimensional fluid dynamics simulation tool [56] was employed to analyze the airflow patterns around the wheels.
The findings supported the idea that air diversion could effectively increase the force generated by the wheel, but it was necessary to adopt a lighter wheel to be able to start rotating under low wind velocities. To address this weight issue and minimize the risk of airflow stagnation, which could affect the wheel’s rotation, a series of iterations were conducted to optimize the number of blades.
Figure 7 demonstrates the effect of wind on both types of wheels. The selected configuration for prototype implementation was configuration “D” (Figure 8b) since it allowed the reduction of the initial configuration’s force from 0.268 N/m to the final configuration’s force at 0.160 N/m while reducing the weight from 0.548 Kg to 0.123 Kg. The consequence is that despite the lower force applied by the wind on the surface, the required force to start the turbine is lower due to the reduced weight.
The final wheel configuration, “D”, (Figure 9) was tested in a wind tunnel setup (airflow minimum 2 m/s in the direction parallel to wheel rotation forces), integrating the PE-EHS cantilever with permanent magnets to overcome the challenges of the blind spot at the tips of both the blades and the cantilever. This setup is based on the utilization of the repulsion and attraction forces between the permanent magnets, along with the elastic properties of the PVDF-based one.
The final wheel configuration was tested in a wind tunnel setup (airflow minimum 2 m/s in the direction parallel to wheel rotation forces), integrating the PE-EHS cantilever with permanent magnets to overcome the challenges of the blind spot at the tips of both the blades and the cantilever. This setup is based on the utilization of the repulsion and attraction forces between the permanent magnets, along with the elastic properties of the cantilever, to generate continuous motion of the cantilever synchronized with the rotation of the wheel. This design aims to optimize the energy harvesting process by efficiently converting the kinetic energy of wind into electrical energy.
The results demonstrate a peak voltage of 20 V and an average close to 5 V, demonstrating effective operation in controlled laboratory conditions with an airflow from 2 m/s to 5 m/s with wind entering the cavity directly so that airflow is aligning perpendicularly to the blade surfaces. However, the result also showed that in cases where the airflow did not enter the cavity directly, the wheel failed to rotate.
Based on the voltage achieved with the PE-EHS configuration using a wheel, this final configuration is the one adopted in the InComEss system architecture for integration into the façade and for testing in the laboratory under façade stress conditions.

3.2. Final PE-EHS Configurations and Tests of InComEss System Architecture

The PE-EHS wheel configuration was designed and prototyped for integration into the prefabricated façade so as to be part of the InComEss architecture system developed and implemented for the final laboratory tests. The integrability of the wheel was demonstrated during the façade manufacturing stages (Figure 10), allowing for integration into a cavity with a dimension of 60 mm and its proper installation in a laboratory testing facility (Figure 11).
In addition to PE-EHS configuration “D”, also the PE-EHS configurations “C1” and “C2” were installed in the façade to collect information in the lab environment about the energy generation from the combined effect already preliminary investigated. For this purpose, an acquisition system for the PE-EHS was specifically set up to collect data about energy voltage production independent of the InComEss architecture (Figure 12).
Before the test commenced, as described in Appendix A, the performance of PE-EHS configuration “D”, intended to power the InComEss system, was evaluated. A laboratory fan was positioned at two distances from the air inlet cavity: 1490 mm and 490 mm. The air velocity varied from 5 to 8 m/s. The aim was to assess the achievable performance and determine if the generated voltage was sufficient to power the FOS monadgator. However, the results (Figure 13 and Figure 14) were not promising and showed inconsistencies, with a wide range of variation from 0.05 V to 5 V based on fan air source generation. Consequently, the decision was made to power the InComEss system using the laboratory’s local energy grid.
Before testing activities, the laboratory environment was also used to test the overall InComEss system architecture functionality (Figure 15).
To ensure the proper functioning of the InComEss architecture, a comprehensive testing procedure was conducted to validate each single technology before the overall system functionality testing. The components were individually evaluated using standard equipment, such as multimeters, batteries, and grid energy supply. The PCC was first tested by supplying it with power from the laboratory’s local energy supply and with a battery. This activity allowed monitoring of the charging time of the supercapacitor using a multimeter, confirming that the PCC circuit recharged the supercapacitor. Similarly, the monadgator was tested using the external power supply to validate its capability to measure FBG sensors, demonstrating the functionality of both the FBG sensor and the monadgator. Next, the Bluetooth low-energy (BLE) wireless connection between the monadgator and the IoT gateway (ICCS) was evaluated. For this validation, an Arduino Nano, integrated by PHTN into the PCC, facilitated the rapid start-up of the monadgator and execution of FBG wavelength measurements. Thanks to a broadband light source (laser) operating for 70 milliseconds, the FBG sensor was read, and data were acquired by the Arduino. The data were transmitted via BLE to the IoT gateway. The Arduino was powered by the PCC, which was charged using energy harvested from connected energy harvesters. Once the circuit reached sufficient charge, the Arduino initiated FBG sensor measurements via the monadgator. The entire measurement cycle, including wireless data transfer, required less than 150 milliseconds and consumed 0.08 W/s of energy. The measured values were successfully displayed on the gateway’s LCD screen, indicating that the BLE connection was operational. Finally, the 4G connection between the gateway and the IoT platform was tested, and its functionality was confirmed (Figure 16).
The InComEss’s IoT gateway acts as a bridge between the sensor field (edge) and the application user’s interface (cloud), connecting wireless sensor networks (WSNs) and the IoT platform. Its primary role is to aggregate sensor data from various WSNs. It also functions as short-term storage for collected data to ensure lossless transmission while offering data processing and transformation/harmonization capabilities. The gateway transmits data using both wired and wireless protocols like Ethernet, Wi-Fi, and LTE. Among its competitors, the Raspberry Pi 4 Model B was chosen as the physical IoT gateway due to its numerous advantages. It has built-in Wi-Fi and Ethernet for transmitting data to the cloud or backend servers, Bluetooth communication for connecting with WSNs and gathering measurements, and the ability to readily extend to other protocols like LTE and LoRaWAN. Additionally, a powerful operating system can be installed, offering flexibility for software usage and development. The IoT gateway software primarily consists of Python (version 3.10.11) scripts utilizing various libraries and EdgeXFoundry (version 3.1), simplifying and accelerating deployment. A Python script based on the Bleak library (version 0.21.1) was developed to discover WSN devices and retrieve advertised sensor data. The measurement data were then harmonized and sent to EdgeXFoundry in JSON format using appropriate REST API endpoints. Data were temporarily stored in EdgeXFoundry’s REDIS database and then exported to the desired MQTT topic. To enable LTE communication, an extra 4G component (Waveshare 4G HAT) was added. This component features a SIM card port and sits atop the Raspberry Pi 4 Model B. Upon configuration, the Waveshare 4G HAT allows the IoT gateway to communicate with the cloud using wireless LTE. A 50,000 mAh power bank serves as the power supply for the IoT gateway, which is housed in an IP66 protective enclosure for dust and water resistance.
The IoT platform is the data’s final destination. Its primary function is to present measurement data in a user-friendly and meaningful way using graphs and charts. It functions as a robust web user interface (UI) leveraging well-known and widely used software libraries for data visualization and representation. The platform is implemented using popular languages like HTML, PHP (version 8.1.6), and Javascript. HighCharts Javascript library (version 11.4.1) is used for data visualization, while the Datatables JQuery plug-in (version 2.0.3) is used for data exploration. Measurement data arrive at the IoT platform through the MQTT message broker. A client within the IoT platform acts as a subscriber to the WSNData topic. The MQTT client collects messages, parses them, and then permanently stores them in a remote relational or time-series database on the IoT platform side. This database makes the measurement data readily available for both visualization and control purposes. Users can send feedback to the sensor field through the IoT platform to execute control actions or activate actuators to prevent undesirable situations.
During tests (see Appendix A), the PE-EHS energy production was collected for the configurations integrated into the façade. The results achieved during the tests conducted are reported in Figure 17, Figure 18, Figure 19 and Figure 20. For the understanding of the results, a variable curve for wind pressure against the façade with values from 50 Pa to 600 Pa and intervals of 50 Pa must be considered. These air pressures refer to an air velocity from 9.03 m/s to 31.30 m/s on the façade.
In all the tests, configurations “C1” and “C2” were demonstrated to be more efficient than configuration “D”. However, voltage generation in tests with only air load against the façade achieved an average value of 0.5 V, too low to run an FOS monadgator. On the other side, interesting results were achieved when the façade was stimulated with a dynamic load of wind and rain: the results achieved an average voltage close to 6–8 V. The EP-EHS results will be specifically discussed in the next chapter. The results achieved demonstrate that during the testing activities, the InComEss system performed properly for what concerns the data collection and transmission from the FBG and FOS monadgator, PCC/PCB, and IoT gateway to the IoT platform within.
To facilitate understanding of the different PE-EHS configurations, the configurations are outlined in Table 3. For the lab test, the configurations reported the highest voltage generation during test “6—Rain—Dynamic”.

4. Discussion

The test results for InComEss architecture and PE-EHSs provide insights, even if not completely satisfying. The results demonstrate the following:
  • PE-EHS integration into a façade:
    The feasibility of integrating PE-EHS within a building envelope’s ventilated cavity is confirmed by configurations “C1”, “C2”, and “D”, as the lab integration into a full-scale façade demonstrates. This opens doors for real-world implementations;
    Balancing architectural requirements with energy harvesting efficiency remains a challenge. While exposed configurations may offer higher energy output, as demonstrated in the preliminary test in the case of perpendicular airflow against the wheel’s blades, they often fall short of aesthetic acceptability. Finding an optimal balance is crucial.
  • PE-EHS energy generation:
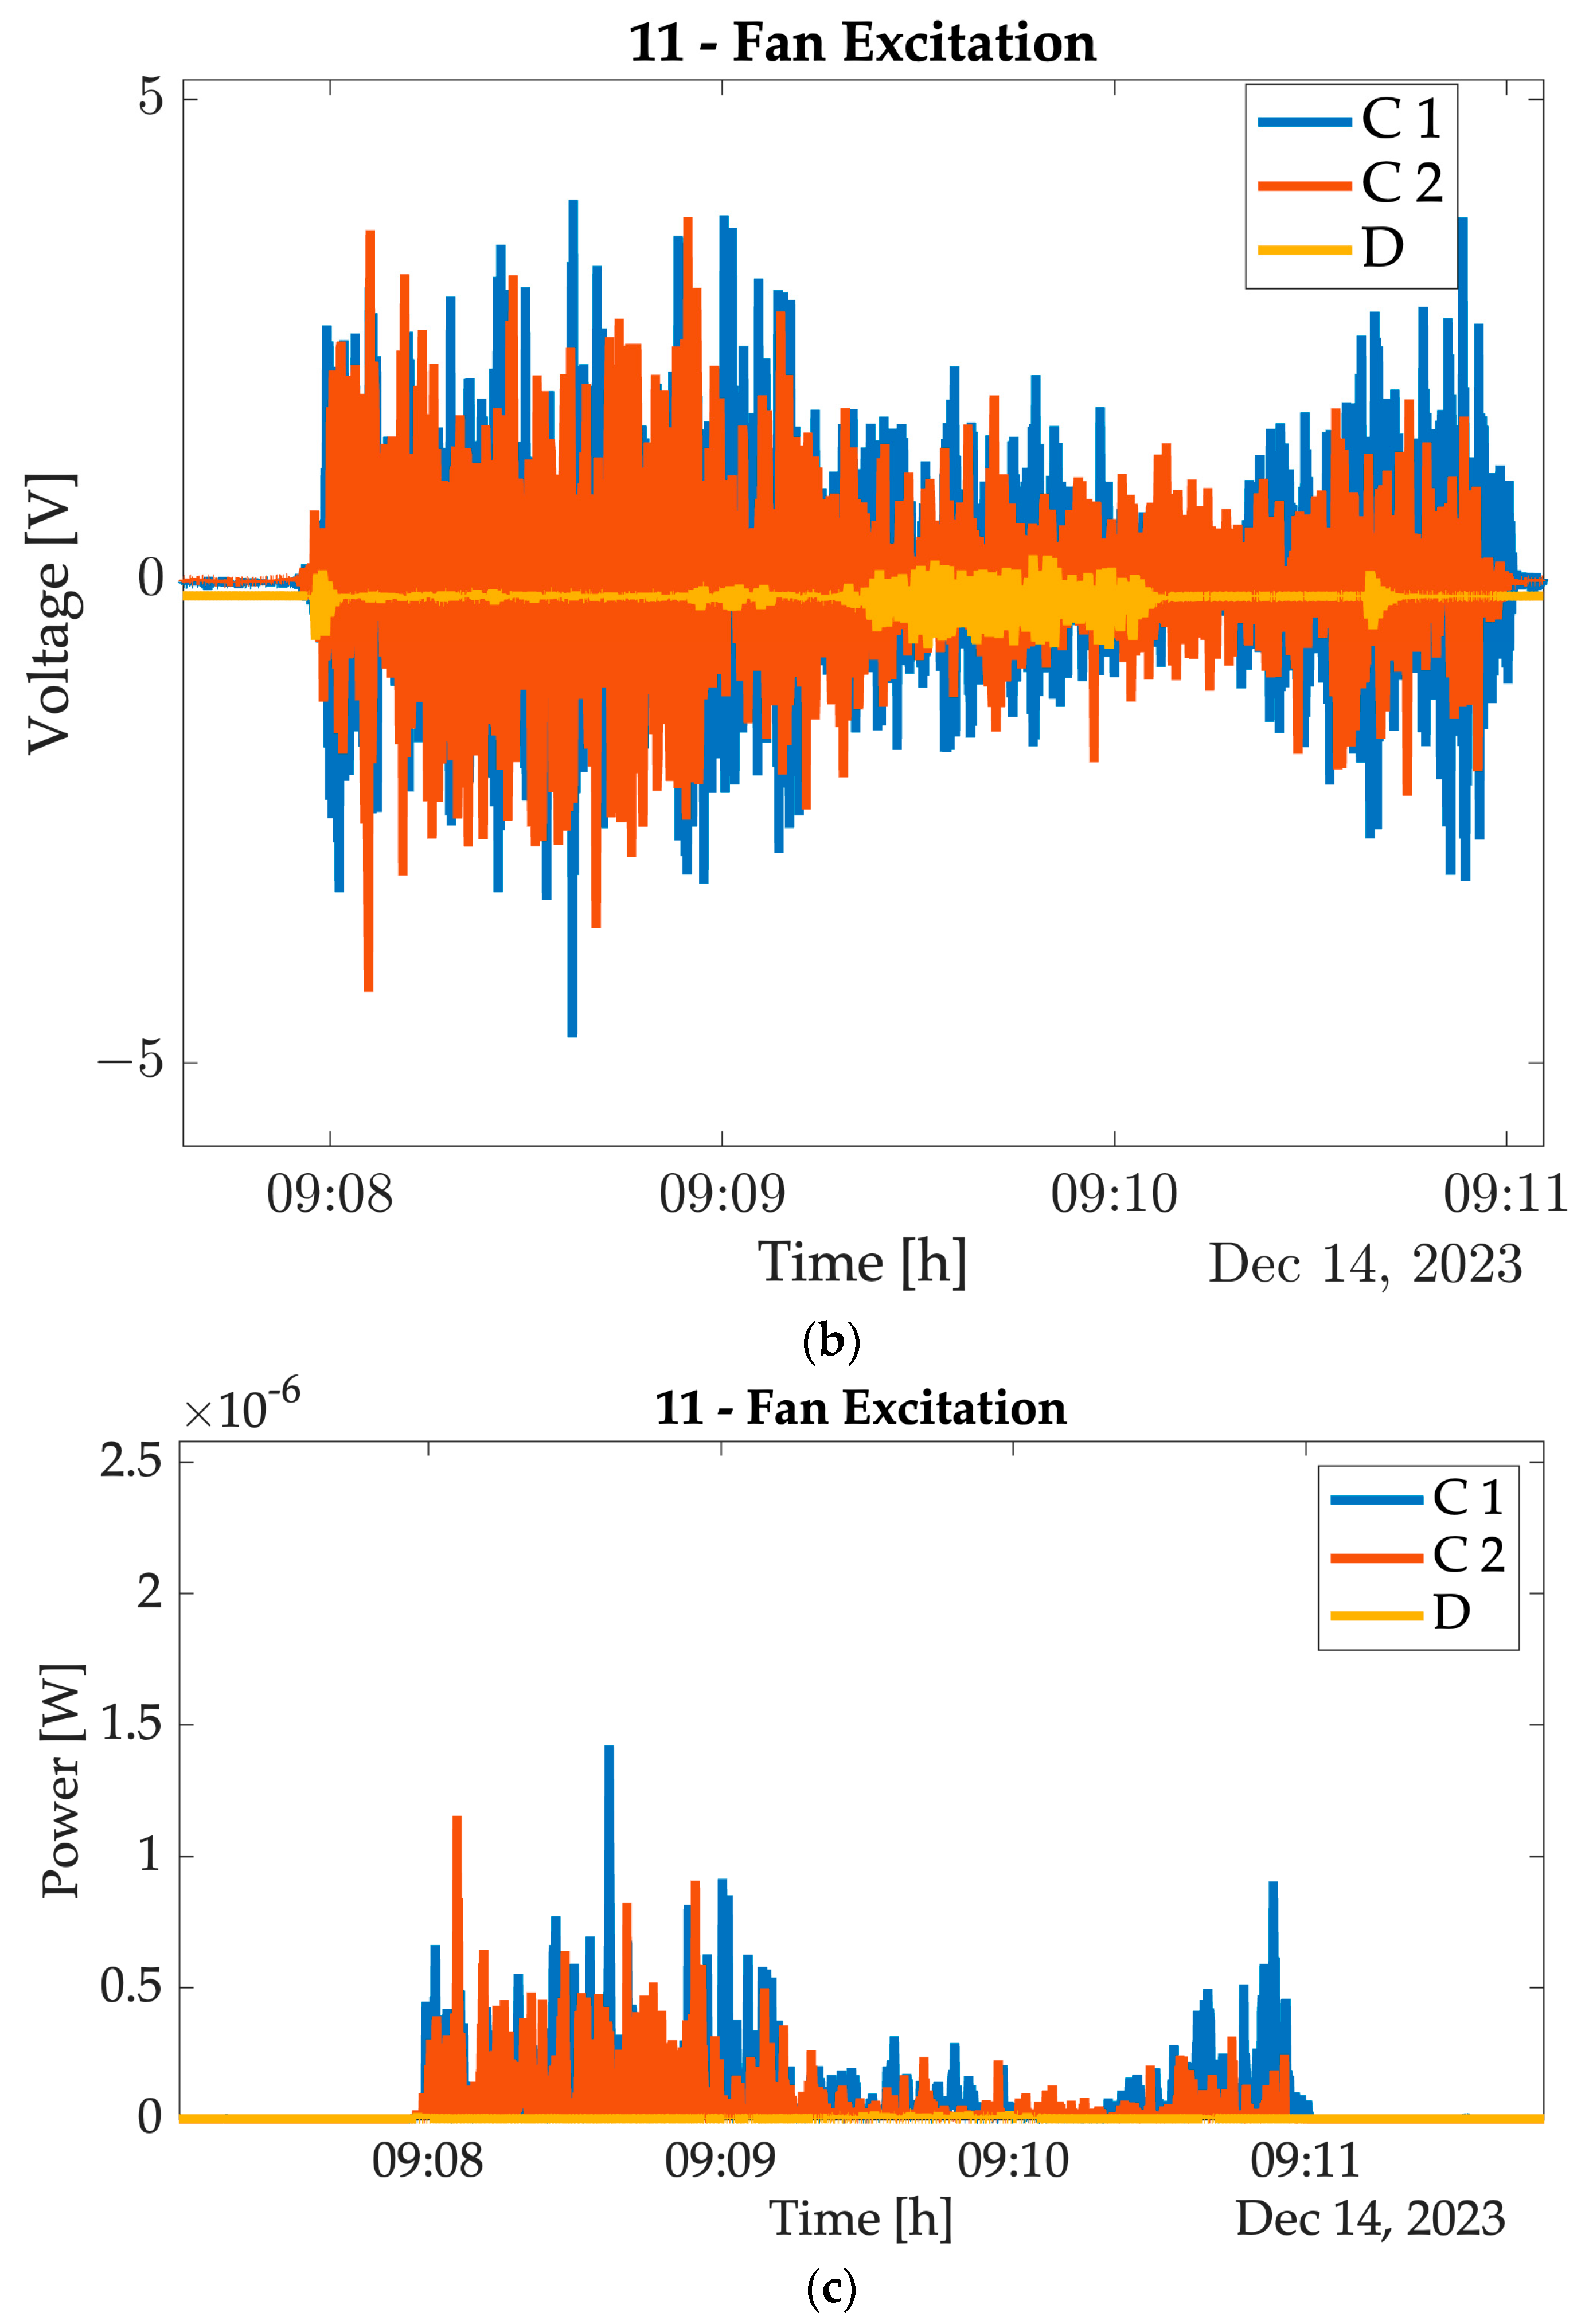
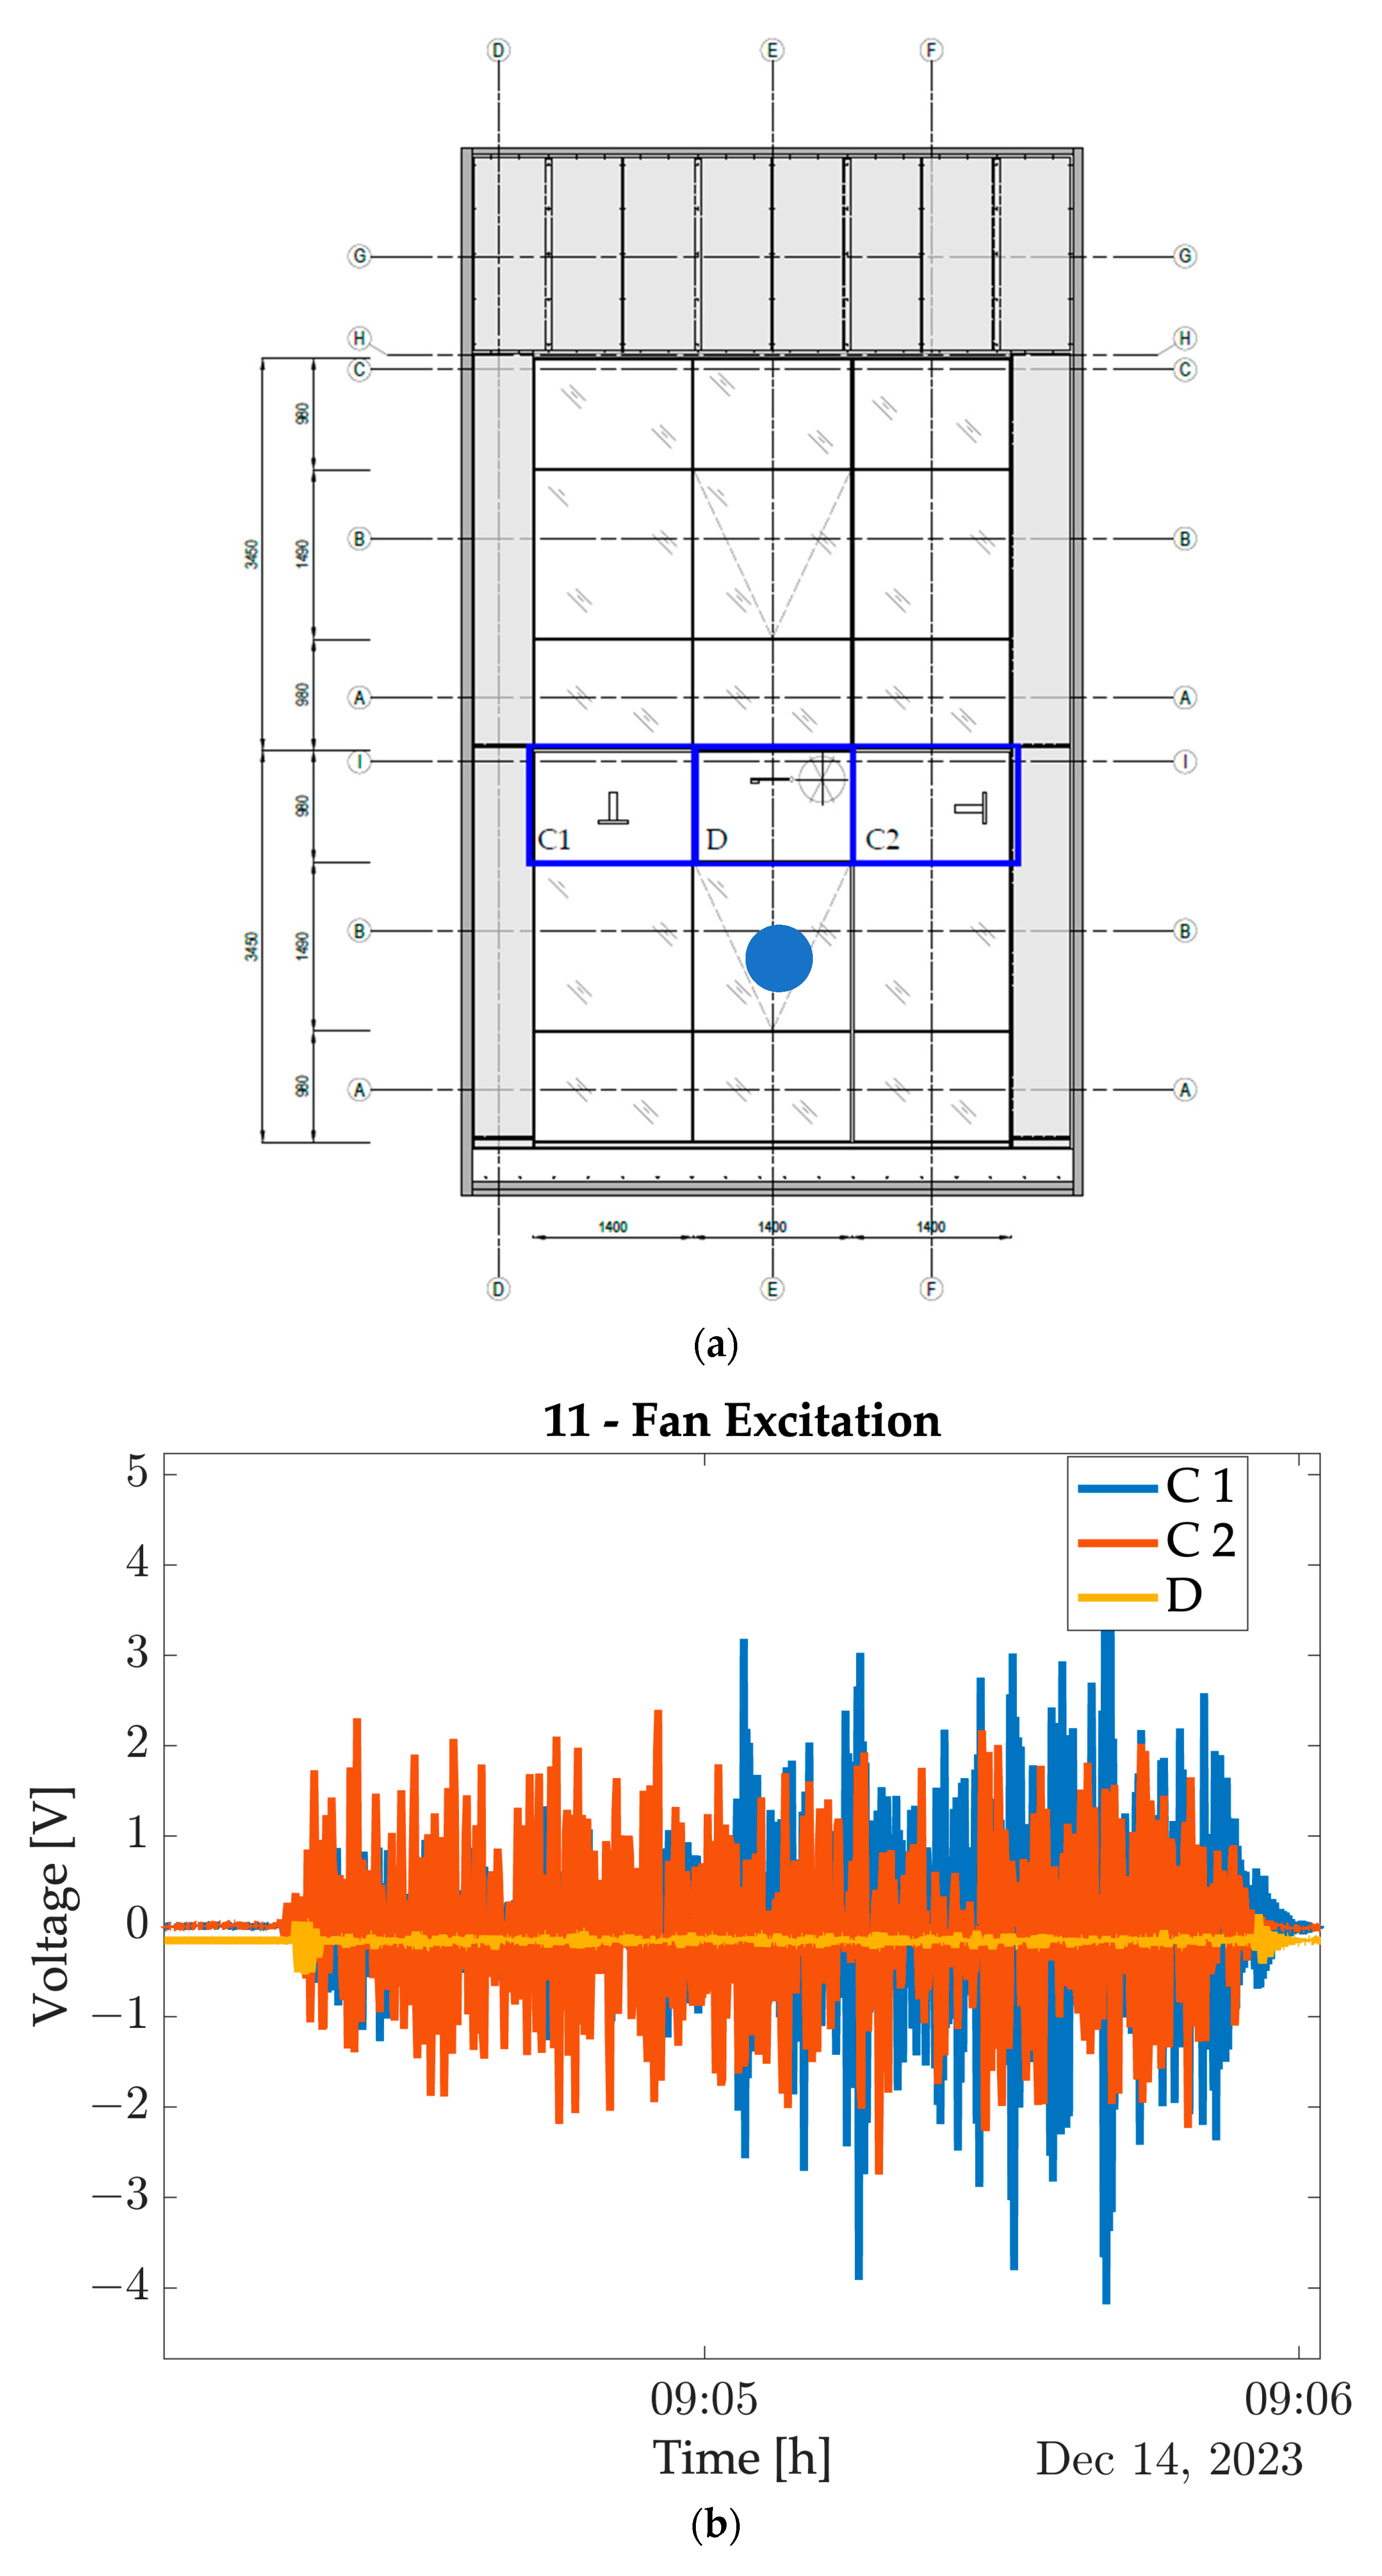
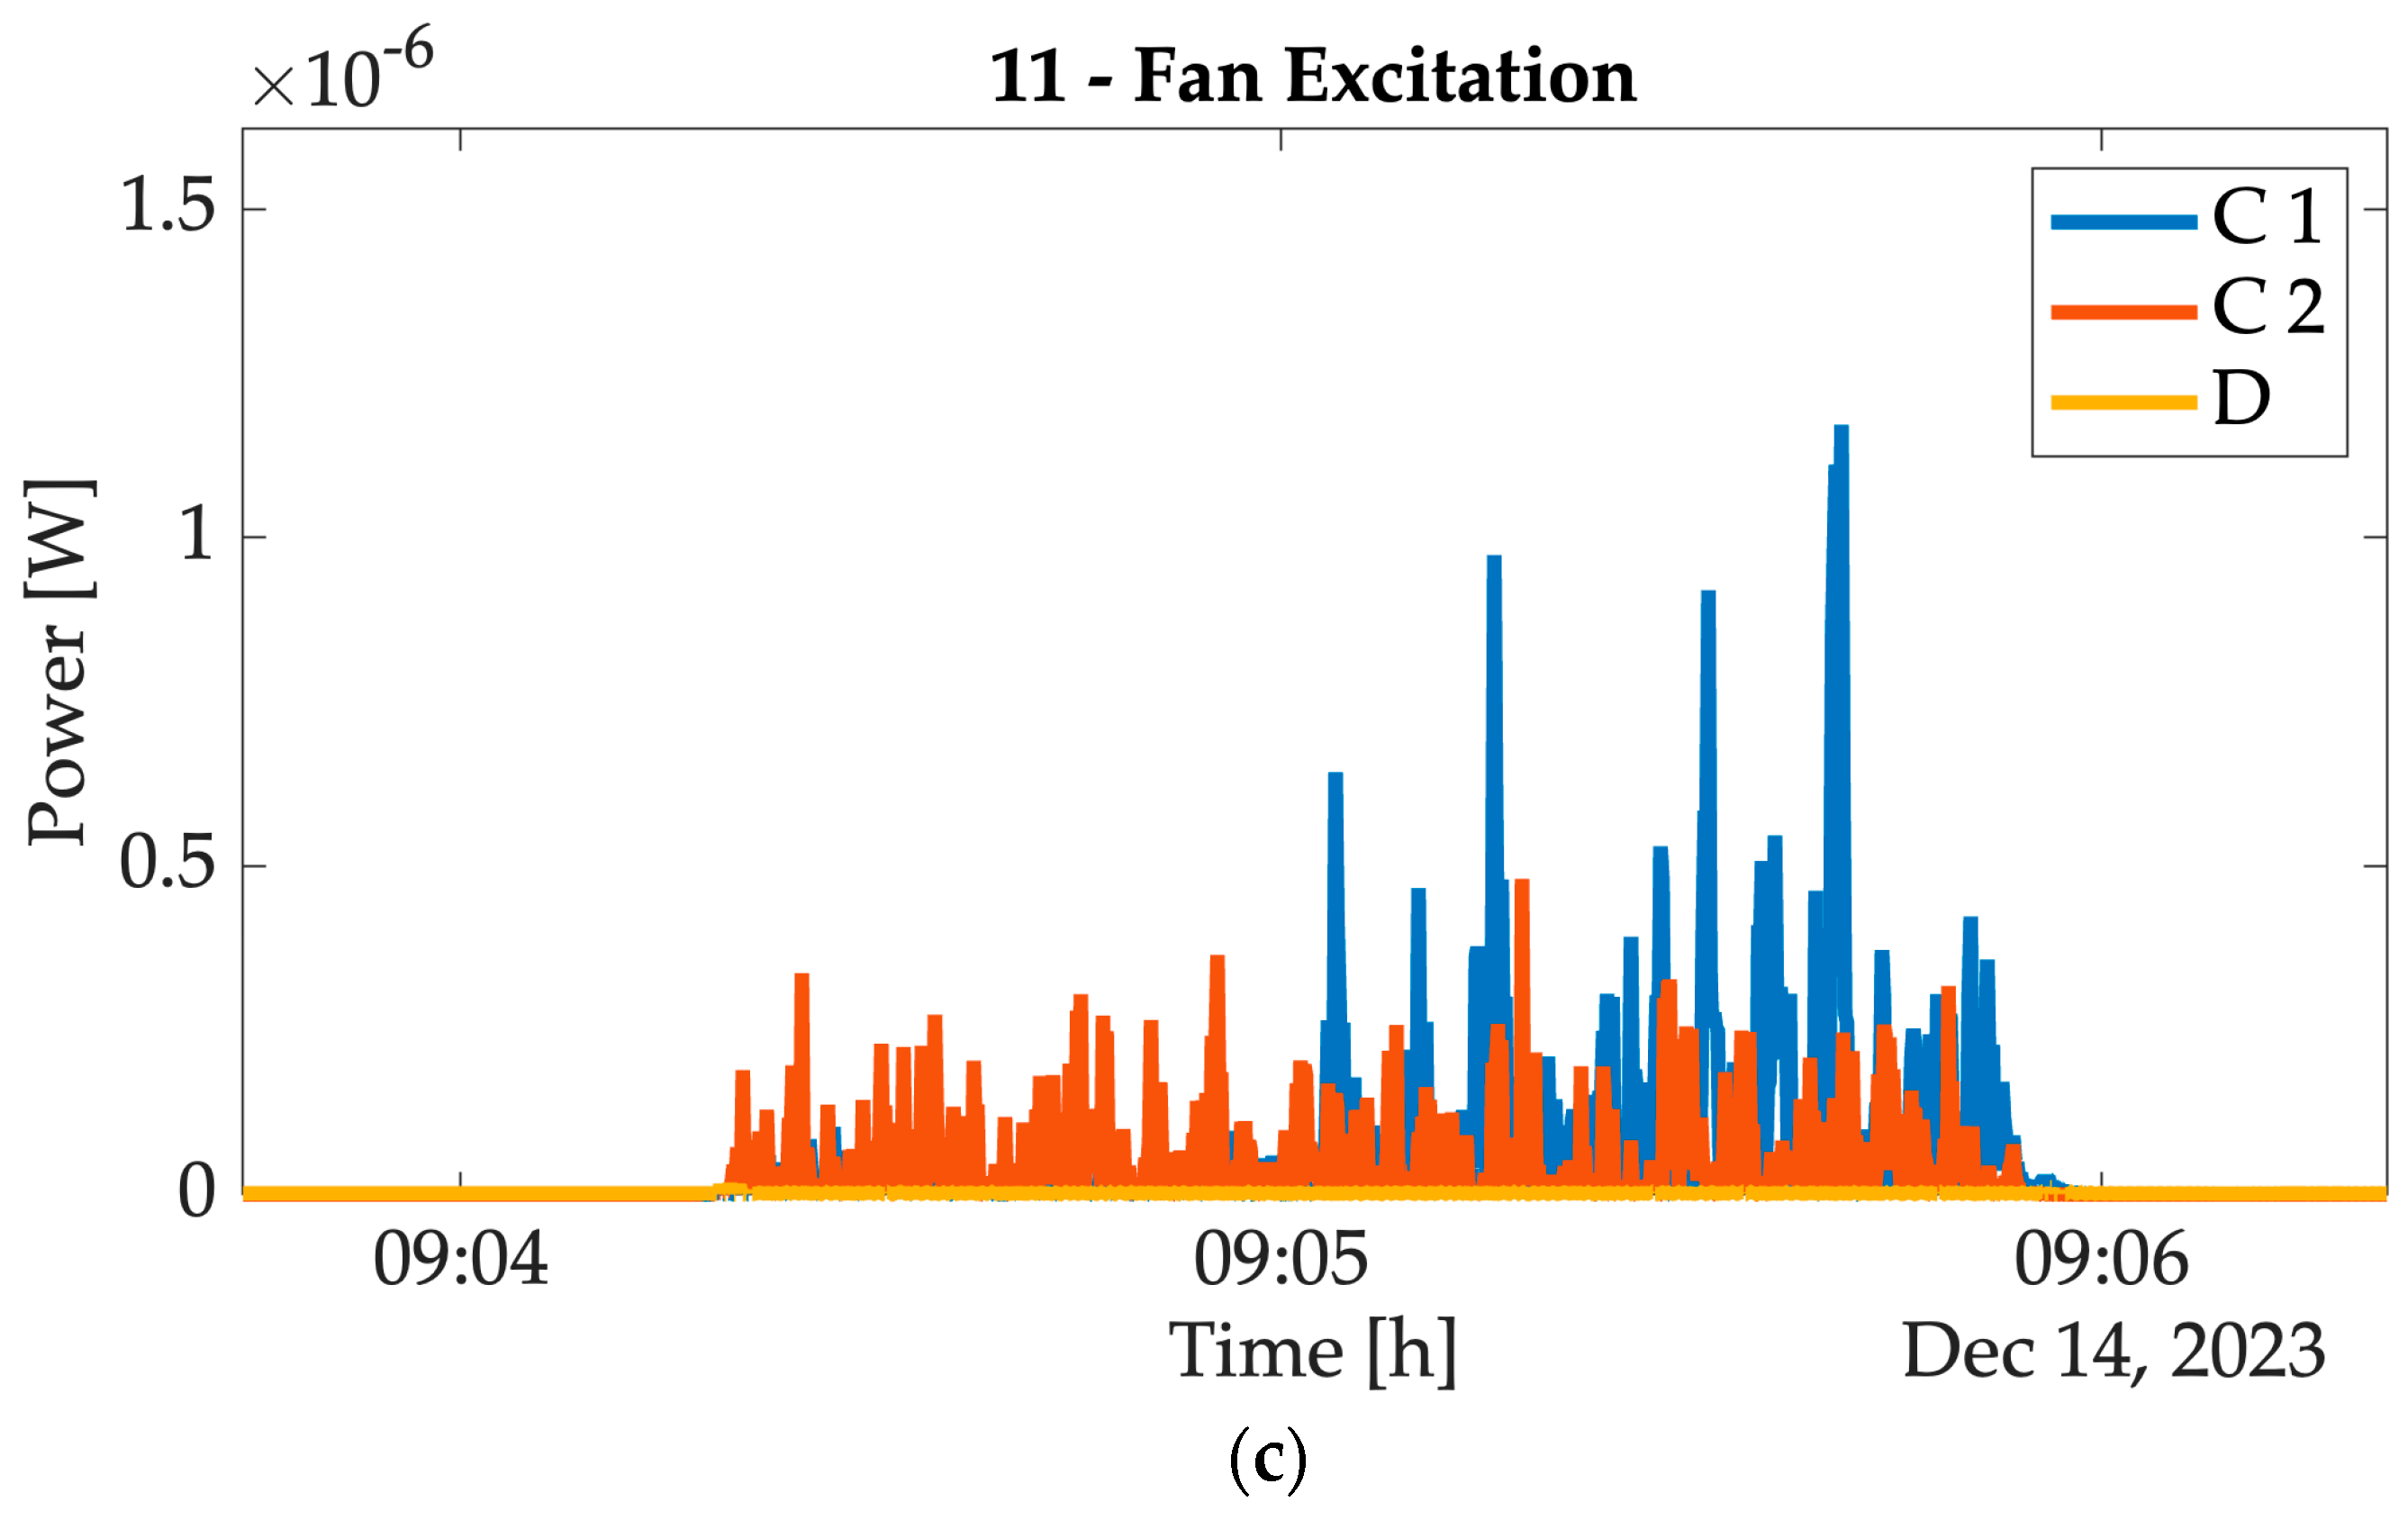
    In the lab test, configurations “C1” and “C2” demonstrate the potential to combine the vortex effect with cladding vibration for enhanced energy harvesting, especially during wind–rain events. The voltage generated would have been capable of activating the PCC (5 V) and starting to charge the supercapacitor. Additionally, these configurations are promising because their combination, parallel with 2/3 PE-EHS, could increase the power generation and consequently activate within wind conditions comparable to the fan test;
    Configuration “D” showed unexpected performance variations compared to preliminary tests. The discrepancies observed between the wind tunnel and laboratory testing environments can be attributed largely to the wind direction during testing. Performance appears sensitive to wind direction and airflow stability, confirming preliminary tests’ boundary conditions even under higher wind loads. In the controlled setting of the wind tunnel, the wind direction aligned perfectly with the rotational direction of the wheel, maximizing its efficiency. However, in the laboratory environment, the fan simulates real-world wind conditions where the wind typically blows perpendicular to the façade. This necessitates the airflow entering the ventilated cavity from the bottom, leading to a reduction in air velocity compared to the wind tunnel scenario. This difference in air velocity directly impacts the performance of the proposed PE-EHS system activated by wheel rotation. In laboratory tests with non-parallel and turbulent airflow, the wheel struggled to initiate rotation at wind velocities between 5 and 8 m/s. This highlights the need for a more stable wind regime, even at lower speeds. This is also the reason why configuration “D” did not achieve the expected 5 V planned for the PCC. Lower air velocity translates to reduced rotational force on the wheel, consequently decreasing the efficiency of energy harvesting. Addressing this challenge is crucial for ensuring the system’s effectiveness in real-world applications, with further activities needed to optimize wheel design to improve further responsiveness and performance at lower air velocities and to investigate alternative airflow channeling strategies within the ventilated cavity to enhance air velocity and maintain efficient wheel rotation despite the perpendicular wind direction recommended to identify blind spots and improve performance in variable wind conditions.
  • InComEss system architecture:
    The data collection and transmission functionality of the InComEss architecture for building envelope monitoring was successfully demonstrated using a battery-replacing energy harvesting solution based on the PE-EHS;
    The low energy generated by the PE-EHS did not allow for validation of the self-powered system to supply the FOS monadgator and enable continuous data collection. Additional PE-EHS units are required to achieve self-powered functionality. The PE-EHS can produce sufficient voltage in an open circuit, but this voltage drops significantly once connected to the PCC due to its low internal resistance. This was observed in lab testing for C1, where the peak voltage dropped from 14 V to 1.4 V upon connection to the PCB, falling short of the minimum required voltage to charge the supercapacitor and power the FOS. The wheel configuration never reached this voltage during testing. The maximum power generated was 4 mA × 1.4 V = 5.6 mW, which needed 20 mW, not enough to start the charging of the supercapacitor and consequently run the FOS monadgator. Power management was part of the InComEss project, but the selection of alternative on-market power management with lower power consumption could support lower starting voltages and, consequently, the adoption of PE-EHSs.
  • Testing procedure:
    While the testing procedure appears adequate for SHM sensing (not the focus of this paper), it requires further refinement, small environments, further tests, and parameter optimization for PE-EHS evaluation. Addressing the identified challenges and establishing robust testing protocols is crucial for future iterations.

5. Conclusions

This study successfully demonstrates the potential of PE-EHS integration within building envelopes for low-wind energy harvesting and SHM applications. However, addressing the identified challenges through further research and design improvements is essential for achieving widespread adoption. While confirming the valuable investigation of stand-alone solutions to enable smart components for building envelopes using PE-EHSs as energy harvesting technology, more specific investigations must include wind directions and instability of the airflow. More specific analysis should be included before tests in a real-scale façade to identify boundary conditions for PE-EHS applications within nonstable wind direction, confirming the issue of blind spot affecting its rotation that emerged during the preliminary testing phase. This activity should be mainly conducted with more comprehensive simulations and wind tunnel testing to evaluate performance under various wind conditions and directions. It is also useful to investigate alternative configurations to improve low wind speed performance and, in particular, work on solutions to reduce wind pressure loss and consequently exploit air velocity more efficiently. Further research and development efforts focused on these areas hold promise for bridging the gap between controlled and real-world testing conditions, ultimately leading to a more robust and adaptable PE-EHS system for ventilated façades. Additionally, a cost analysis should be conducted to understand the economic sustainability of the introduction of multiple PE-EHSs instead of a replaceable battery or a connection with the building’s electrical grid system.
Despite the PE-EHS research activities should be further investigated, this research demonstrates how relevant it can be to enable self-powered structural monitoring system. While traditional renewable energy sources like solar panels or wind generators may offer a higher energy generation capacity for building nanogrids, PE-EHSs provide a valuable alternative for powering individual smart components that do not necessitate or cannot be readily connected to the nanogrid. This self-powered approach offers increased flexibility and can be particularly advantageous in scenarios with limited space or challenging installation conditions for traditional solutions. Further research and development efforts focused on optimizing PE-EHS efficiency and integrating it with diverse building elements hold significant promise for fostering a more sustainable and interconnected smart building ecosystem to address challenges that emerged for maximizing the energy harvesting potential of piezoelectric cantilevers within ventilated façades, paving the way for powering a range of smart building components in a sustainable and self-sufficient manner.
The investigated concept of PE cantilevers with magnets activated by a rotating wheel equipped with magnets holds significant promise for optimizing PE-EHS applications within ventilated façades, potentially leading to a more reliable and efficient method of powering smart building components. Further research and development are needed to refine the design and evaluate its performance under real-world conditions. However, this paradigm shift has the potential to unlock new possibilities for harnessing renewable energy within the built environment.
While the ventilated cavity offers a favorable environment for integrating PE-EHSs within building façades, it also presents a challenge. The pressure drop experienced as airflow transitions from the external environment to the cavity is beyond our direct control. However, this challenge can potentially be addressed through specific design strategies for the ventilated cavity. The channel solution designed within the cavity to manipulate airflow and optimize energy harvesting potential has this purpose, but it asks for further implementation. However, it is important to remember that a key benefit of ventilated façades lies in their ability to leverage temperature differences to induce natural ventilation. Therefore, further investigations are warranted to explore and potentially integrate this aspect into the design, potentially mitigating the impact of low wind pressure conditions using temperature differences to have naturally ventilated air. This thermal-based ventilation analysis should specifically guide the design of the wheel.
The InComEss architecture validated during the test demonstrates that a data-driven approach can enable a comprehensive understanding of how the building envelope structure behaves under mechanical and thermal stresses due to wind load, seismic actions, material stress, temperature fluctuations, and other dynamic loads. The data analysis could allow to make informed choices within the SHM field regarding maintenance schedules, retrofitting requirements and overall design improvements, foreseeing unexpected failures, and minimizing the environmental impact associated with structural repairs. However, a critical point that necessitates further investigation is the PE configuration, optimizing the design and performance of the PE to ensure it generates sufficient current even under the current limitations of the PCC. Similarly, it is necessary to investigate alternative approaches to enhance the overall system’s energy output and identify solutions to achieve the desired power levels effectively. This could involve exploring different PCC designs or implementing alternative methods for power management.
In conclusion, this research proposes a promising paradigm shift in PE-EHS technology for ventilated façades, offering a potentially more reliable and efficient approach to powering smart building components. While challenges exist, the proposed solutions and future research directions outlined hold significant promise for realizing the full potential of this innovative technology in the context of sustainable building design.

Author Contributions

Conceptualization, A.P., L.V., D.S.E. and A.R.A.M.; methodology, A.P.; IoT design (gateway, platform), hardware and software development, M.V. and A.A.; validation, A.P., L.V., F.B., D.S.E. and A.R.A.M.; formal analysis, A.P. and L.V.; investigation, A.P., L.V., D.S.E. and A.R.A.M.; resources, A.P., L.V., F.B., D.S.E. and A.R.A.M.; data curation, A.P. and L.V.; writing—original draft preparation, A.P.; writing—review and editing, A.P., L.V., F.B., D.S.E., A.R.A.M., M.V., M.T.C. and A.A.; visualization, A.P., L.V., F.B., D.S.E., M.T.C. and A.R.A.M.; supervision, A.P.; project administration, A.P.; funding acquisition, A.P. All authors have read and agreed to the published version of the manuscript.

Funding

This research was funded by the European Project “InComEss” under the European Union’s Horizon 2020 Research and Innovation Programme, grant number 862597.

Data Availability Statement

No data are available due to privacy restrictions.

Acknowledgments

The authors thank the Mechanical and Thermal Measurements Group from Università Politecnica delle Marche for their active support and involvement during laboratory testing activities.

Conflicts of Interest

Author Maria Teresa Calcagni, affiliated with Università Politecnica delle Marche, was engaged with a service contract by the company Focchi S.p.A. The remaining authors declare that the research was conducted in the absence of any commercial or financial relationships that could be construed as a potential conflict of interest.

Appendix A

Table A1. Laboratory environment’s test method statement. n.a.—not available.
SequenceTestActivity—Range ValuesTest Time
1AAir—infiltrationTest pressure: + 600 Pa (Class A4)45′
1BAir—exfiltrationTest pressure: −600 Pa (Class A4)1 h 15′
2Rain—test staticTest pressure: 600 Pa (Class R7)55′
3AWind—pressionTest pressure: +1750 Pa8′
3BWind—depressionTest pressure: −2000 Pa8′
4AAir—infiltrationTest pressure: + 600 Pa (Class A4)8′
4BAir—exfiltrationTest pressure: −600 Pa (Class A4)8′
5Rain—test staticTest pressure: 600 Pa (Class R7)1 h 5′
6Rain—test dynamicDynamic water penetration test with fan with a pulse every 3 s from 750 Pa to 250 Pa36′
7ABuilding movement—vertical1. Vertical offset of the intermediate unit: uz = ±7 [mm]—2 cyclesn.a.
7BBuilding movement—horizontal2. Horizontal offset of the intermediate beam: uz = ±7 [mm]—2 cyclesn.a.
8AAir—infiltrationTest pressure: + 600 Pa (Class A4)7′30″
8BAir—exfiltrationTest pressure: −600 Pa (Class A4)7′30″
9Rain—test staticTest pressure: 600 Pa (Class R7)1 h
10AWind—pressionTest pressure: 2625 Pa2′
10BWind—depressionTest pressure: −3000 Pa2′
11Fan excitationDynamic test1 h 35′
12AImpact test—hard body6 J (1.224 mm height with 0.5 kg steel ball)10 J (1.020 mm height with 1.0 kg steel ball)n.a.
12BImpact test—soft body120 J (245 mm height)500 J (1020 mm height)n.a.
12CImpact test—double type343 J (700 mm height)n.a.

References

  1. Blum, D.; Candanedo, J.; Chen, Z.; Fierro, G.; Gori, V.; Johra, H.; Madsen, H.; Marszal-Pomianowska, A.; O’Neill, Z.; Pradhan, O.; et al. Data-Driven Smart Buildings: State-of-the-Art Review; CSIRO: Newcastle, Australia, 2023; 103p. [Google Scholar]
  2. Karimi, R.; Farahzadi, L.; Sepasgozar, S.M.E.; Sargolzaei, S.; Sepasgozar, S.M.E.; Zareian, M.; Nasrolahi, A.; Karimi, R.; Farahzadi, L.; Sepasgozar, S.M.E.; et al. Smart Built Environment Including Smart Home, Smart Building and Smart City: Definitions and Applied Technologies. In Advances and Technologies in Building Construction and Structural Analysis; IntechOpen: London, UK, 2021; ISBN 978-1-83881-141-9. [Google Scholar]
  3. Politecnico di Milano; Energy & Strategy Group. Smart Building Report 2022; Efficienza Energetica e Trasformazione Digitale nel Settore degli Edifici; Dipartimento di Ingegneria Gestionale Collana Quaderni AIP: Milan, Italy, 2022. [Google Scholar]
  4. Verbeke, S.; Aerts, D.; Reynders, G.; Ma, Y.; Waide, P. Final Report on the Technical Support to the Development of a Smart Readiness Indicator for Buildings: Summary; Publications Office of the European Union: Luxembourg, 2020; ISBN 978-92-76-19978-6. [Google Scholar]
  5. Zaffagnini, T.; Pracucci, A. Dalla Città Intelligente Alla Responsive City. Applicativi IoT e Tecnologie Innovative Human-Centric Based per Edifici Intelligenti Di Nuova Generazione. L’Ufficio Tec. 2023, 1–2, 17. [Google Scholar]
  6. Intelligent Buildings—An Overview|ScienceDirect Topics. Available online: https://www.sciencedirect.com/topics/engineering/intelligent-buildings (accessed on 29 January 2024).
  7. Smart Readiness Indicator. Available online: https://energy.ec.europa.eu/topics/energy-efficiency/energy-efficient-buildings/smart-readiness-indicator_en (accessed on 29 January 2024).
  8. Energy Performance of Buildings Directive. Available online: https://energy.ec.europa.eu/topics/energy-efficiency/energy-efficient-buildings/energy-performance-buildings-directive_en (accessed on 29 January 2024).
  9. European Parliament. Directive (EU) 2018/ of the European Parliament and of the Council of 30 May 2018 Amending Directive 2010/31/EU on the Energy Performance of Buildings and Directive 2012/27/EU on Energy Efficiency; European Parliament: Strasbourg, France, 2018. [Google Scholar]
  10. Actions to Digitalise the Energy Sector. Available online: https://ec.europa.eu/commission/presscorner/detail/en/ip_22_6228 (accessed on 29 January 2024).
  11. Overview Article-Smart Buildings and Smart Technologies in Europe: State of Play and Perspectives|BUILD UP. Available online: https://build-up.ec.europa.eu/en/resources-and-tools/articles/overview-article-smart-buildings-and-smart-technologies-europe-state (accessed on 29 January 2024).
  12. The EU Smart Building Innovation Platform|SMARTBUILT4EU Project|Fact Sheet|H2020. Available online: https://cordis.europa.eu/project/id/956936 (accessed on 29 January 2024).
  13. Intelligent Building Energy Assets Control for Comfort, Energy and Flexibility Optimisation|iBECOME Project|Fact Sheet|H2020. Available online: https://cordis.europa.eu/project/id/894617/it (accessed on 29 January 2024).
  14. Zeng, Z.; Zhao, R.; Yang, H. Micro-Sources Design of an Intelligent Building Integrated with Micro-Grid. Energy Build. 2013, 57, 261–267. [Google Scholar] [CrossRef]
  15. Shinisha, A.; Devi, S.; Murugasan, D.; Solomon Simon, E. Future Nano-Grid Technologies and Its Implementation Challenges for Smart Cities. IOP Conf. Ser. Mater. Sci. Eng. 2020, 955, 012002. [Google Scholar] [CrossRef]
  16. Saeed, M.; Fangzong, W.; Kalwar, B.; Iqbal, S. A Review on Microgrids’ Challenges & Perspectives. IEEE Access 2021, 9, 166502–166517. [Google Scholar] [CrossRef]
  17. Shakeri, M.; Pasupuleti, J.; Amin, N.; Rokonuzzaman, M.; Low, F.W.; Yaw, C.T.; Asim, N.; Samsudin, N.A.; Tiong, S.K.; Hen, C.K.; et al. An Overview of the Building Energy Management System Considering the Demand Response Programs, Smart Strategies and Smart Grid. Energies 2020, 13, 3299. [Google Scholar] [CrossRef]
  18. Khan, S.; Sudhakar, K.; Hazwan Yusof, M.; Sundaram, S. Review of Building Integrated Photovoltaics System for Electric Vehicle Charging. Chem. Rec. 2024, 24, e202300308. [Google Scholar] [CrossRef] [PubMed]
  19. Fiorotti, R.; Yahyaoui, I.; Rocha, H.R.O.; Honorato, Í.; Silva, J.; Tadeo, F. Demand Planning of a Nearly Zero Energy Building in a PV/Grid-Connected System. Renew. Energy Focus 2023, 45, 220–233. [Google Scholar] [CrossRef]
  20. Wei, W.; Ye, L.; Fang, Y.; Wang, Y.; Chen, X.; Li, Z. Optimal Allocation of Energy Storage Capacity in Microgrids Considering the Uncertainty of Renewable Energy Generation. Sustainability 2023, 15, 9544. [Google Scholar] [CrossRef]
  21. Saavedra, E.; Mascaraque, L.; Calderon, G.; del Campo, G.; Santamaria, A. The Smart Meter Challenge: Feasibility of Autonomous Indoor IoT Devices Depending on Its Energy Harvesting Source and IoT Wireless Technology. Sensors 2021, 21, 7433. [Google Scholar] [CrossRef]
  22. Sonbul, O.S.; Rashid, M. Towards the Structural Health Monitoring of Bridges Using Wireless Sensor Networks: A Systematic Study. Sensors 2023, 23, 8468. [Google Scholar] [CrossRef] [PubMed]
  23. Shokoor, F.; Shafik, W. Harvesting Energy Overview for Sustainable Wireless Sensor Networks. J. Smart Cities Soc. 2023, 2, 165–180. [Google Scholar] [CrossRef]
  24. Arnesano, M.; Bueno, B.; Pracucci, A.; Magnagni, S.; Casadei, O.; Revel, G.M. Sensors and Control Solutions for Smart-IoT Façade Modules. In Proceedings of the 2019 IEEE International Symposium on Measurements & Networking (M&N), Catania, Italy, 8–10 July 2019; pp. 1–6. [Google Scholar]
  25. Giovanardi, M.; Baietta, A.; Belletti, F.; Magnani, S.; Casadei, O.; Pracucci, A. Exploiting the Value of Active and Multifunctional Façade Technology through the IoT and AI. Appl. Sci. 2024, 14, 1145. [Google Scholar] [CrossRef]
  26. Pracucci, A.; Dugué, A.; Richet, N.; Abdullah, T.; Başer, E.; Caneva, S.; Deneyer, A.; Dias, P.; Diygu, C.; Fakhari, M.; et al. IWG5 White Paper. IWG 5 Buildings. 2023. Available online: https://www.iwg5-buildings.eu/wp-content/uploads/2023/09/IWG5_Active-Module_white-paper_v3_Final.pdf (accessed on 27 March 2024).
  27. Guardigli, L.; Fornace, F.D.; Casadei, O.; Frani, F.; Nicolini, L.; Revel, G.M.; Arnesano, M. Development of a Curtain Wall Prototype with Dynamic Behaviour (SmartSkin). TECHNE-J. Technol. Archit. Environ. 2018, 16, 218–225. [Google Scholar] [CrossRef]
  28. Pracucci, A.; Vandi, L.; Magnani, S.; Baietta, A.; Casadei, O.; Uriarte, A.; Vavallo, M. Prefabricated Plug-and-Play Unitized Façade System for Deep Retrofitting: The RenoZEB Case Study. In Proceedings of the The 9th Annual Edition of Sustainable Places (SP 2021), Rome, Italy, 29 September–1 October 2021; p. 9. [Google Scholar]
  29. Infinite Building Renovation-Industrialised Envelope Solutions. Available online: https://infinitebuildingrenovation.eu/ (accessed on 16 June 2023).
  30. Thulasi, V.; Lakshmi, P.; Sahithya, A. High Performance of W-Shaped Piezo Electric Energy Harvester for Smart Building Application. Integr. Ferroelectr. 2024, 240, 149–162. [Google Scholar] [CrossRef]
  31. Zhou, W.; Du, D.; Cui, Q.; Lu, C.; Wang, Y.; He, Q. Recent Research Progress in Piezoelectric Vibration Energy Harvesting Technology. Energies 2022, 15, 947. [Google Scholar] [CrossRef]
  32. Wang, B.; Zhang, C.; Lai, L.; Dong, X.; Li, Y. Design, Manufacture and Test of Piezoelectric Cantilever-Beam Energy Harvesters with Hollow Structures. Micromachines 2021, 12, 1090. [Google Scholar] [CrossRef]
  33. Doria, A.; Fanti, G.; Filipi, G.; Moro, F. Development of a Novel Piezoelectric Harvester Excited by Raindrops. Sensors 2019, 19, 3653. [Google Scholar] [CrossRef] [PubMed]
  34. Doria, A.; Medè, C.; Fanti, G.; Desideri, D.; Maschio, A.; Moro, F. Development of Piezoelectric Harvesters with Integrated Trimming Devices. Appl. Sci. 2018, 8, 557. [Google Scholar] [CrossRef]
  35. Doria, A.; Medè, C.; Desideri, D.; Maschio, A.; Codecasa, L.; Moro, F. On the Performance of Piezoelectric Harvesters Loaded by Finite Width Impulses. Mech. Syst. Signal Process. 2018, 100, 28–42. [Google Scholar] [CrossRef]
  36. Students Harness Vibrations from Wind for Electricity. Available online: https://news.cornell.edu/stories/2010/05/researchers-harness-energy-wind-vibrations (accessed on 29 April 2020).
  37. Solaripedia|Green Architecture & Building|Projects in Green Architecture & Building. Available online: https://www.solaripedia.com/13/285/3171/solar_ivy_leaves.html (accessed on 29 April 2020).
  38. The 10th Annual Year in Ideas-Interactive Feature-NYTimes.Com. Available online: http://archive.nytimes.com/www.nytimes.com/interactive/2010/12/19/magazine/ideas2010.html#Turbine-Free_Wind_Power (accessed on 29 April 2020).
  39. Raudaschl, M.; Levak, T.; Riewe, R.; Triantafyllidis, G.; Drnda, E.; Popek, S.; Schlegl, D.; Funke-Kaiser, D.; Lund, A. Piezoelectric Textile Façade for the Energy Supply of Active Sensor Technology with Regard to Data Management for Circular Economy in Building Construction. IOP Conf. Ser. Earth Environ. Sci. 2022, 1078, 012037. [Google Scholar] [CrossRef]
  40. Structural Health Monitoring—An Overview|ScienceDirect Topics. Available online: https://www.sciencedirect.com/topics/chemical-engineering/structural-health-monitoring (accessed on 29 January 2024).
  41. Ferreira, P.M.; Machado, M.A.; Carvalho, M.S.; Vidal, C. Embedded Sensors for Structural Health Monitoring: Methodologies and Applications Review. Sensors 2022, 22, 8320. [Google Scholar] [CrossRef] [PubMed]
  42. Valinejadshoubi, M.; Bagchi, A.; Moselhi, O. Structural Health Monitoring of Buildings and Infrastructure. World Acad. Sci. Eng. Technol.-Int. J. Civ. Environ. Eng. 2016, 10, 731–738. [Google Scholar]
  43. Preethichandra, D.M.G.; Suntharavadivel, T.G.; Kalutara, P.; Piyathilaka, L.; Izhar, U. Influence of Smart Sensors on Structural Health Monitoring Systems and Future Asset Management Practices. Sensors 2023, 23, 8279. [Google Scholar] [CrossRef] [PubMed]
  44. Bremer, K.; Wollweber, M.; Weigand, F.; Rahlves, M.; Kuhne, M.; Helbig, R.; Roth, B. Fibre Optic Sensors for the Structural Health Monitoring of Building Structures. Procedia Technol. 2016, 26, 524–529. [Google Scholar] [CrossRef]
  45. InComEss. Available online: https://www.incomess-project.com (accessed on 29 January 2024).
  46. EN 13830:2003; Curtain Walling—Product Standard. SIST: Ljubljana, Slovenia, 2003. Available online: https://standards.iteh.ai/catalog/standards/cen/51c14384-e4c8-49ba-8658-6aac20f9ae1f/en-13830-2003 (accessed on 27 March 2024).
  47. Smart Material Company. Available online: https://www.smart-material.com/EH-MFC-generatorsV2.html (accessed on 26 February 2024).
  48. MacroFiberCompositeTM P2 Type. Available online: https://www.smart-material.com/MFC-product-P2V2.html (accessed on 26 February 2024).
  49. Vlachos, M.; Lopardo, R.; Amditis, A. Real Time Vehicle Status Monitoring under Moving Conditions Using a Low Power IoT System. J. Internet Things 2023, 4, 235–261. [Google Scholar] [CrossRef]
  50. Schabowicz, K.; Zawiślak, Ł.; Staniów, P. Efficiency of Ventilated Façades in Terms of Airflow in the Air Gap. Stud. Geotech. Mech. 2021, 43, 224–236. [Google Scholar] [CrossRef]
  51. Rahiminejad, M.; Khovalyg, D. Review on Ventilation Rates in the Ventilated Air-Spaces behind Common Wall Assemblies with External Cladding. Build. Environ. 2021, 190, 107538. [Google Scholar] [CrossRef]
  52. Tommasino, D.; Moro, F.; de Pablo Corona, E.; Vandi, L.; Baietta, A.; Pracucci, A.; Doria, A. Optimization of a Piezoelectric Wind-Excited Cantilever for Energy Harvesting from Façades. In Proceedings of the Advances in Italian Mechanism Science; Niola, V., Gasparetto, A., Quaglia, G., Carbone, G., Eds.; Springer International Publishing: Cham, Switzerland, 2022; pp. 848–856. [Google Scholar]
  53. Che Tempo Faceva a Poggio Torriana a Novembre 2021-Archivio Meteo Poggio Torriana » ILMETEO.It. Available online: https://www.ilmeteo.it/portale/archivio-meteo/Poggio+Torriana/2021/Novembre (accessed on 26 February 2024).
  54. Che Tempo Faceva a Poggio Torriana a Dicembre 2021-Archivio Meteo Poggio Torriana. Available online: https://www.ilmeteo.it/portale/archivio-meteo/Poggio+Torriana/2021/Dicembre (accessed on 26 February 2024).
  55. Che Tempo Faceva a Poggio Torriana a Giugno 2023-Archivio Meteo Poggio Torriana. Available online: https://www.ilmeteo.it/portale/archivio-meteo/Poggio+Torriana/2023/Giugno (accessed on 26 February 2024).
  56. Ansys 2023 R2 Release Highlights|Ansys Latest Release. Available online: https://www.ansys.com/products/release-highlights (accessed on 1 February 2024).
Figure 1. Scheme of InComEss system architecture with components integrated into façade and communication to IoT platform.
Energies 17 01789 g001
Figure 2. Speeds of air inflow simulating the wind [50]: wind at 2.5 m/s in the left; wind at 10 m/s in the right.
Energies 17 01789 g002
Figure 3. Drawing of PE-EHS cantilever with cylinder for vortex (a). Configuration with horizontal PE cantilever and cylinder “A1” and configuration with vertical PE cantilever and cylinder “B1” (b).
Energies 17 01789 g003
Figure 4. Test beds in Focchi premises for PE-EHS tests for configurations “A” and “B”: configurations installed (a); measuring system (b).
Energies 17 01789 g004
Figure 5. Set of possible configurations for the external cladding: PE-EHS vertical cantilever directly installed in the cladding (a); PE-EHS vertical cantilever distanced by cladding of 10 mm (b); PE-EHS horizontal cantilever distanced by cladding of 10 mm (c); PE-EHS patch glued at the cladding (d). Legend: façade’s spandrel; ventilated cavity; cladding; PE-EHS cantilever and attachment block to the cladding; PE-EHS cantilever’s cylinder for vortex effect.
Energies 17 01789 g005
Figure 6. Test beds in Focchi premises for PE-EHS tests for configuration “C2”: the test bed installation (a); detail of the air cavity with PE-EHS installed (b).
Energies 17 01789 g006
Figure 7. Wheel configurations designed by CENTI: initial wheel configuration (a); final wheel configuration (b). Each wheel has an outside diameter of 405 mm.
Energies 17 01789 g007
Figure 8. Wheel rotation analysis activated by a pressure density at a 2 m/s inlet: simulation with initial wheel configuration (a); simulation with final wheel configuration (b).
Energies 17 01789 g008
Figure 9. Test beds in Centi premises for PE-EHS tests with wheel configurations: wheel configuration in laboratory (a); test bed on Centi roof for real environment test (b); wheel configuration voltage results (c).
Energies 17 01789 g009
Figure 10. EP-EHS wheel configuration installed in the façade: metal sheet cladding with an air channel and wheel integrated (a); EP-EHS wheel configuration’s ventilated air cavity in the façade (b).
Energies 17 01789 g010
Figure 11. The PE-EHS cantilever, configured within the wheel setup, installed in the façade within a laboratory testing facility. The airflow within the cavity triggers the rotation of the wheel, and the magnets positioned at its extremities generate a magnetic force with the magnet located at the end of the PE cantilever, thereby enabling vibration.
Energies 17 01789 g011
Figure 12. The PE-EHS configurations “C1”, “C2”, and “D” integrating into façade spandrel within ventilated air cavity: façade prototype design for testing in laboratory (a); façade prototype ready for testing activity (b).
Energies 17 01789 g012
Figure 13. Preliminary voltage validation of the PE-EHS wheel configuration installed in the façade in a laboratory testing facility: fan placed at 1490 mm from the cavity inlet with an air velocity from 5 to 8 m/s (a); PE-EHS voltage generated (b); PE-EHS power generated (c).
Energies 17 01789 g013aEnergies 17 01789 g013b
Figure 14. Preliminary voltage validation of the PE-EHS wheel configuration installed in the façade in a laboratory testing facility: fan placed at 490 mm from the cavity inlet with an air velocity from 5 to 8 m/s (a); PE-EHS voltage generated (b); PE-EHS power generated (c).
Energies 17 01789 g014aEnergies 17 01789 g014b
Figure 15. The prototype integrating the InComEss architecture system’s components into the façade.
Energies 17 01789 g015
Figure 16. IoT gateway and IoT platform: IoT gateway with LED screens device reading and data communication to the IoT platform.
Energies 17 01789 g016
Figure 17. PE-EHS results during test “1A—Air Permeability—infiltration”: PE-EHS voltage generated (a); PE-EHS power generated (b).
Energies 17 01789 g017aEnergies 17 01789 g017b
Figure 18. PE-EHS results during test “1B—Air Permeability—exfiltration”: PE-EHS voltage generated (a); PE-EHS power generated (b).
Energies 17 01789 g018
Figure 19. PE-EHS results during test “2—Rain—Static”: PE-EHS voltage generated (a); PE-EHS power generated (b).
Energies 17 01789 g019
Figure 20. PE-EHS results during test “6—Rain—Dynamic”: PE-EHS voltage generated (a); PE-EHS power generated (b).
Energies 17 01789 g020aEnergies 17 01789 g020b
Table 1. Average voltage results achieved by PE-EHS “A1” and A2” configurations in one sample day over 2 weeks of testing with a wind range of 0.5 m/s to 3 m/s.
PE-EHS “A1” ConfigurationPE-EHS “A2” Configuration
TimePE Voltage [V]TimePE Voltage [V]
8:000.54768:000.5094
10:000.547310:000.3357
12:000.544912:000.5380
14:000.544214:000.5191
16:000.541916:000.4768
18:000.541718:000.5283
Table 2. Average voltage results achieved by PE-EHS “C2” configuration in one day sample over 2 weeks of testing with a wind range of 0.5 m/s to 3 m/s.
PE-EHS “C2” Configuration
TimePE Voltage [V]
08:000.6195
10:000.6140
12:000.6299
14:000.6427
16:000.6400
18:000.6321
Table 3. PE-EHS configurations comparison. PE-harvested power is calculated considering the InComEss’s PCC and a time period. Legend: DAF = direct airflow within the ventilated cavity; IAF = indirect airflow within the ventilated cavity; RE = rain excitation of cladding; AFS = airflow speed.
#DescriptionWorking PrincipleTesting FacilityAFS [m/s]PE Voltage [V]
DAFIAFRE
A1PE-EHS cantilever with cylinder to enable vortex effect without claddingX Focchi premises 0.5–3 Max. 0.55 Min. 0.54
A2PE-EHS cantilever with cylinder to enable vortex effect with claddingX Focchi premises 0.5–3 Max. 0.54 Min. 0.34
C1PE-EHS vertical cantilever with cylinder to enable vortex effect and position in external cladding to exploit cladding vibrationX XLab chamber fan excitation 490 mm5–8Max. 4.18
Min. 4.30
Lab chamber fan excitation 1490 mm5–8Max. 4.74
Min. 3.96
Lab chamber
(Rain—dynamic)
9.03–31.30Max. 30.45
Min. 25.46
C2PE-EHS horizontal cantilever with cylinder to enable vortex effect and position in external cladding to exploit cladding vibrationX XFocchi premises0.5–3Max. 0.64 Min. 0.61
Lab chamber fan excitation 490 mm5–8Max. 2.75
Min. 2.40
Lab chamber fan excitation 1490 mm5–8Max. 4.27
Min. 3.78
Lab chamber
(Rain—dynamic)
9.03–31.30Max. 13.25
Min. 11.00
DPE-EHS cantilever with magnet activated by magnet installed in a wheel rotating X CENTI premise2–5Max. 20
Min. 4
Lab chamber fan excitation 490 mm5–8Max. 0.54
Min. 0.13
Lab chamber fan excitation 1490 mm5–8Max. 0.71
Min. 0.27
Lab chamber
(Rain—dynamic)
9.03–31.30Max. 0.65
Min. 0.45
Disclaimer/Publisher’s Note: The statements, opinions and data contained in all publications are solely those of the individual author(s) and contributor(s) and not of MDPI and/or the editor(s). MDPI and/or the editor(s) disclaim responsibility for any injury to people or property resulting from any ideas, methods, instructions or products referred to in the content.

