
Are Local Commune Governments Interested in the Development of Photovoltaics in Their Area? An Inside View of Poland


Abstract
:1. Introduction
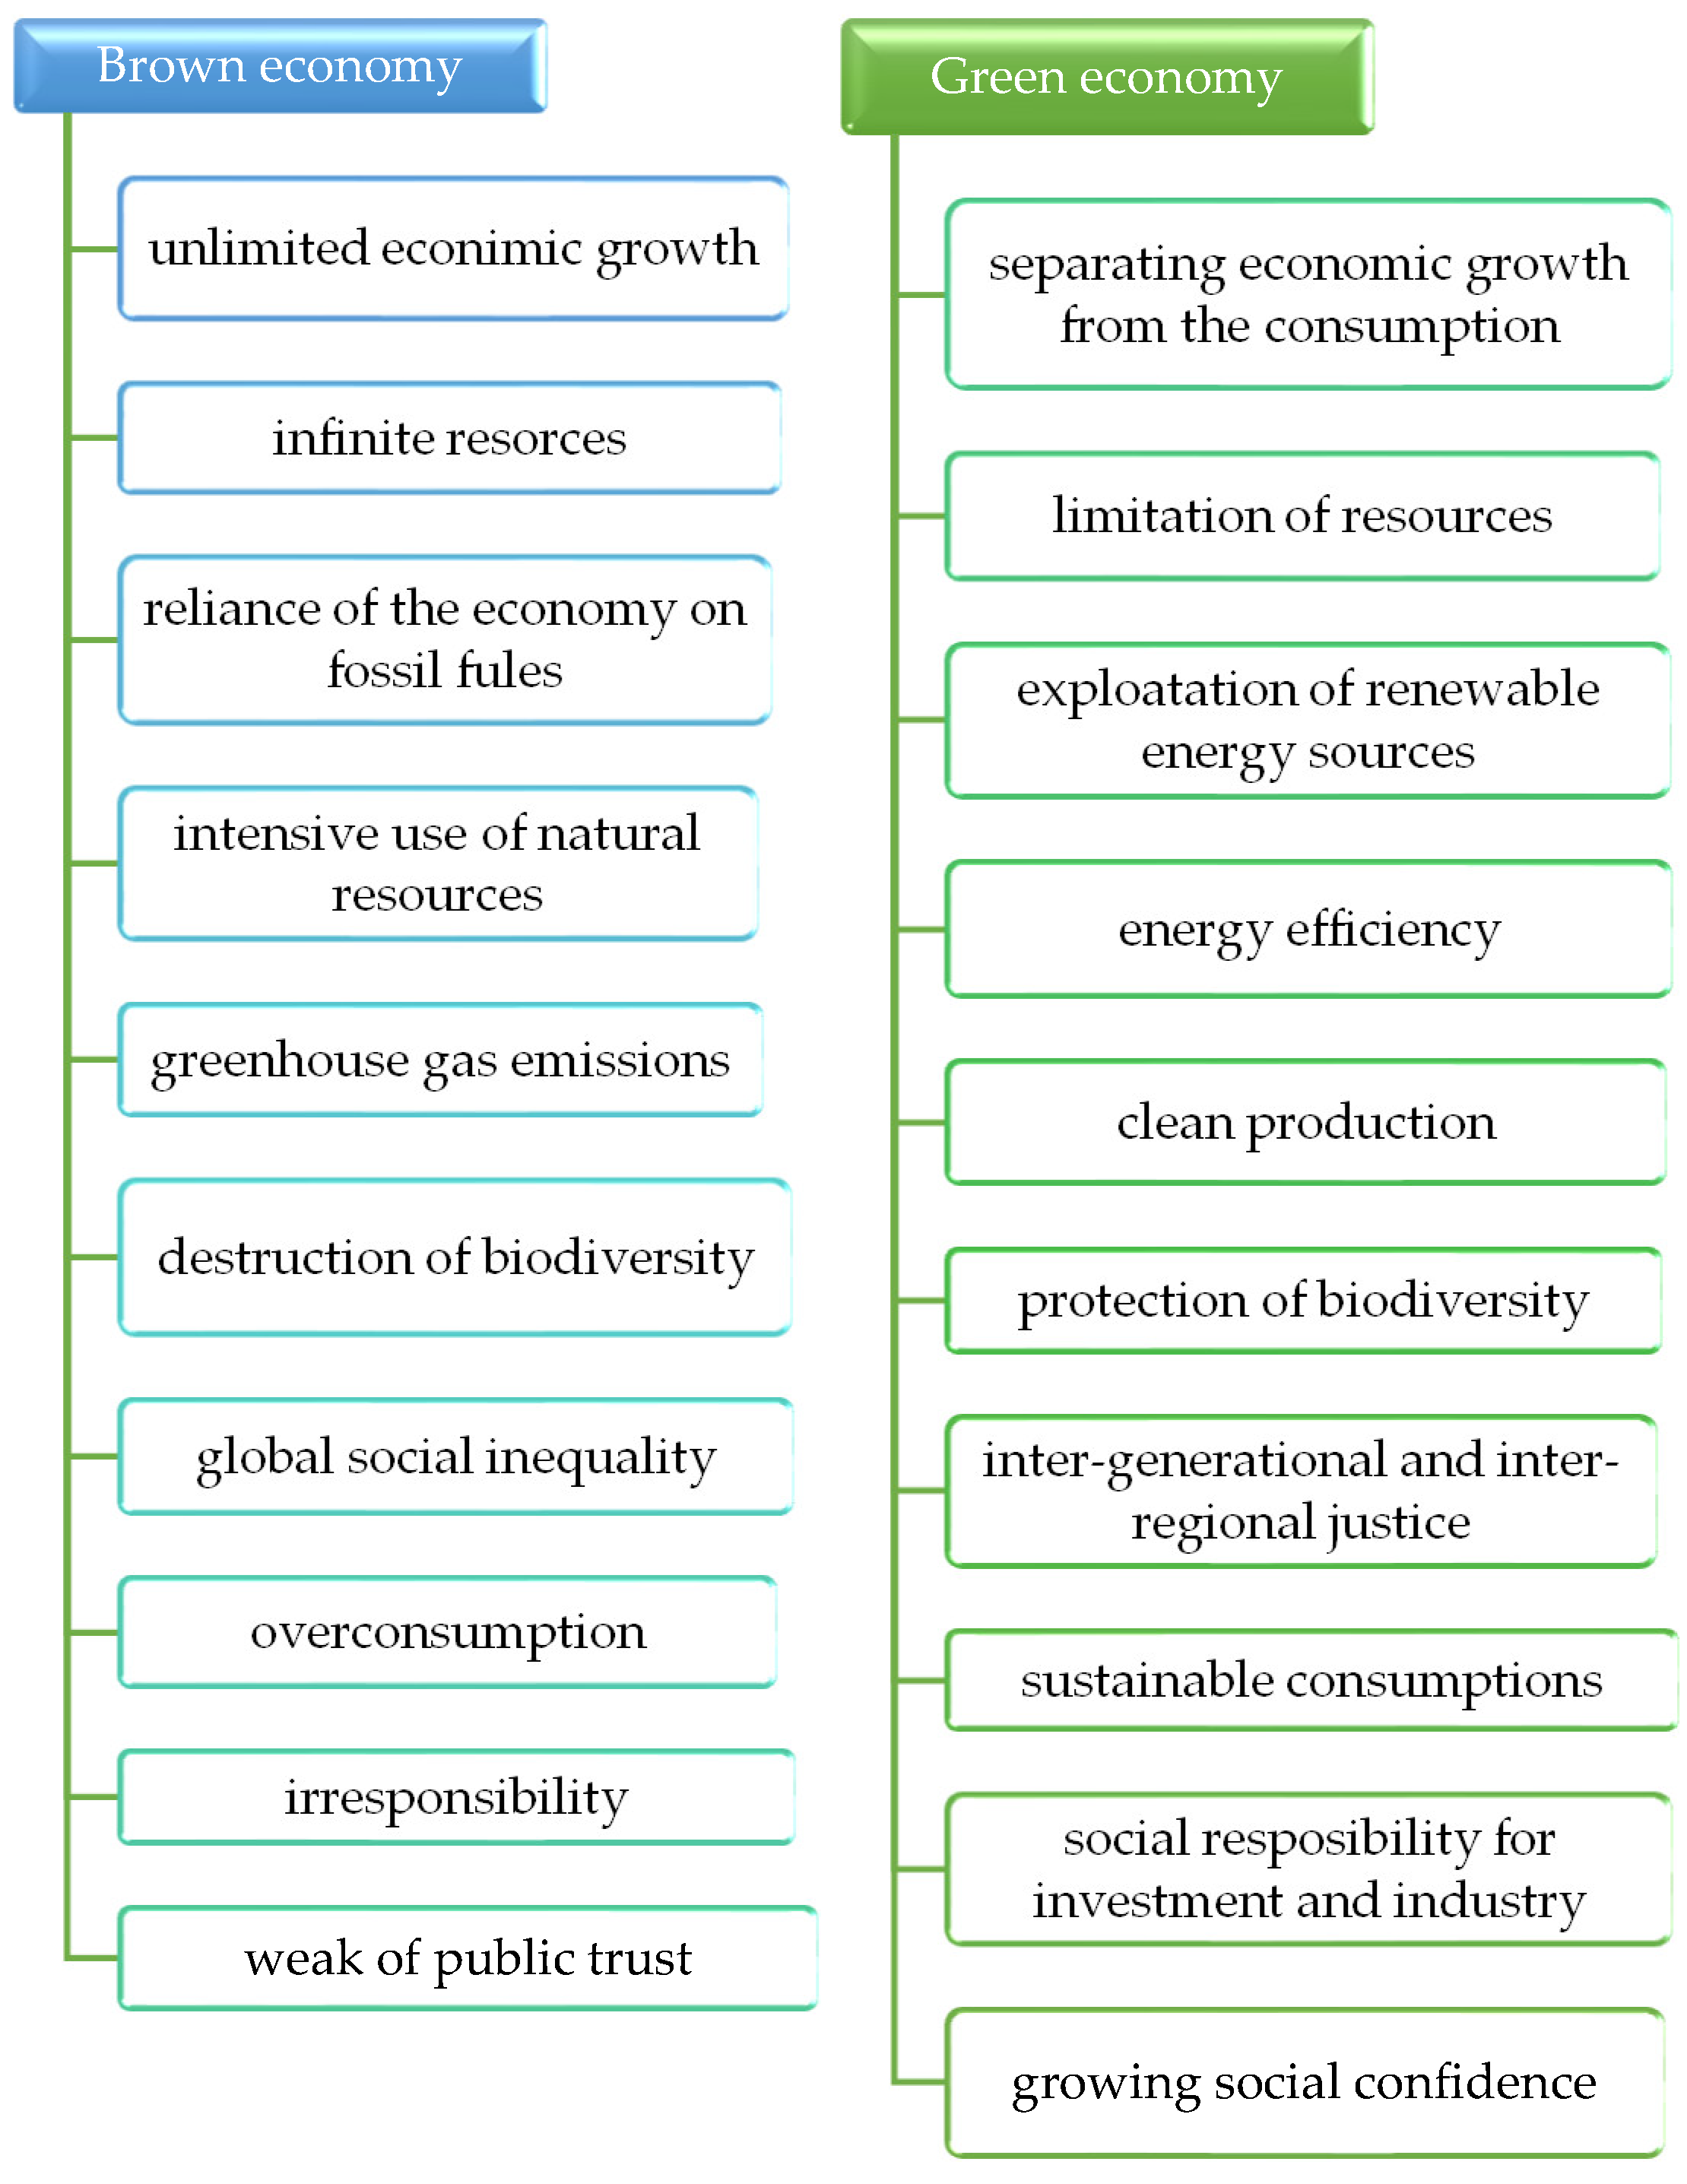
2. Theoretical Background
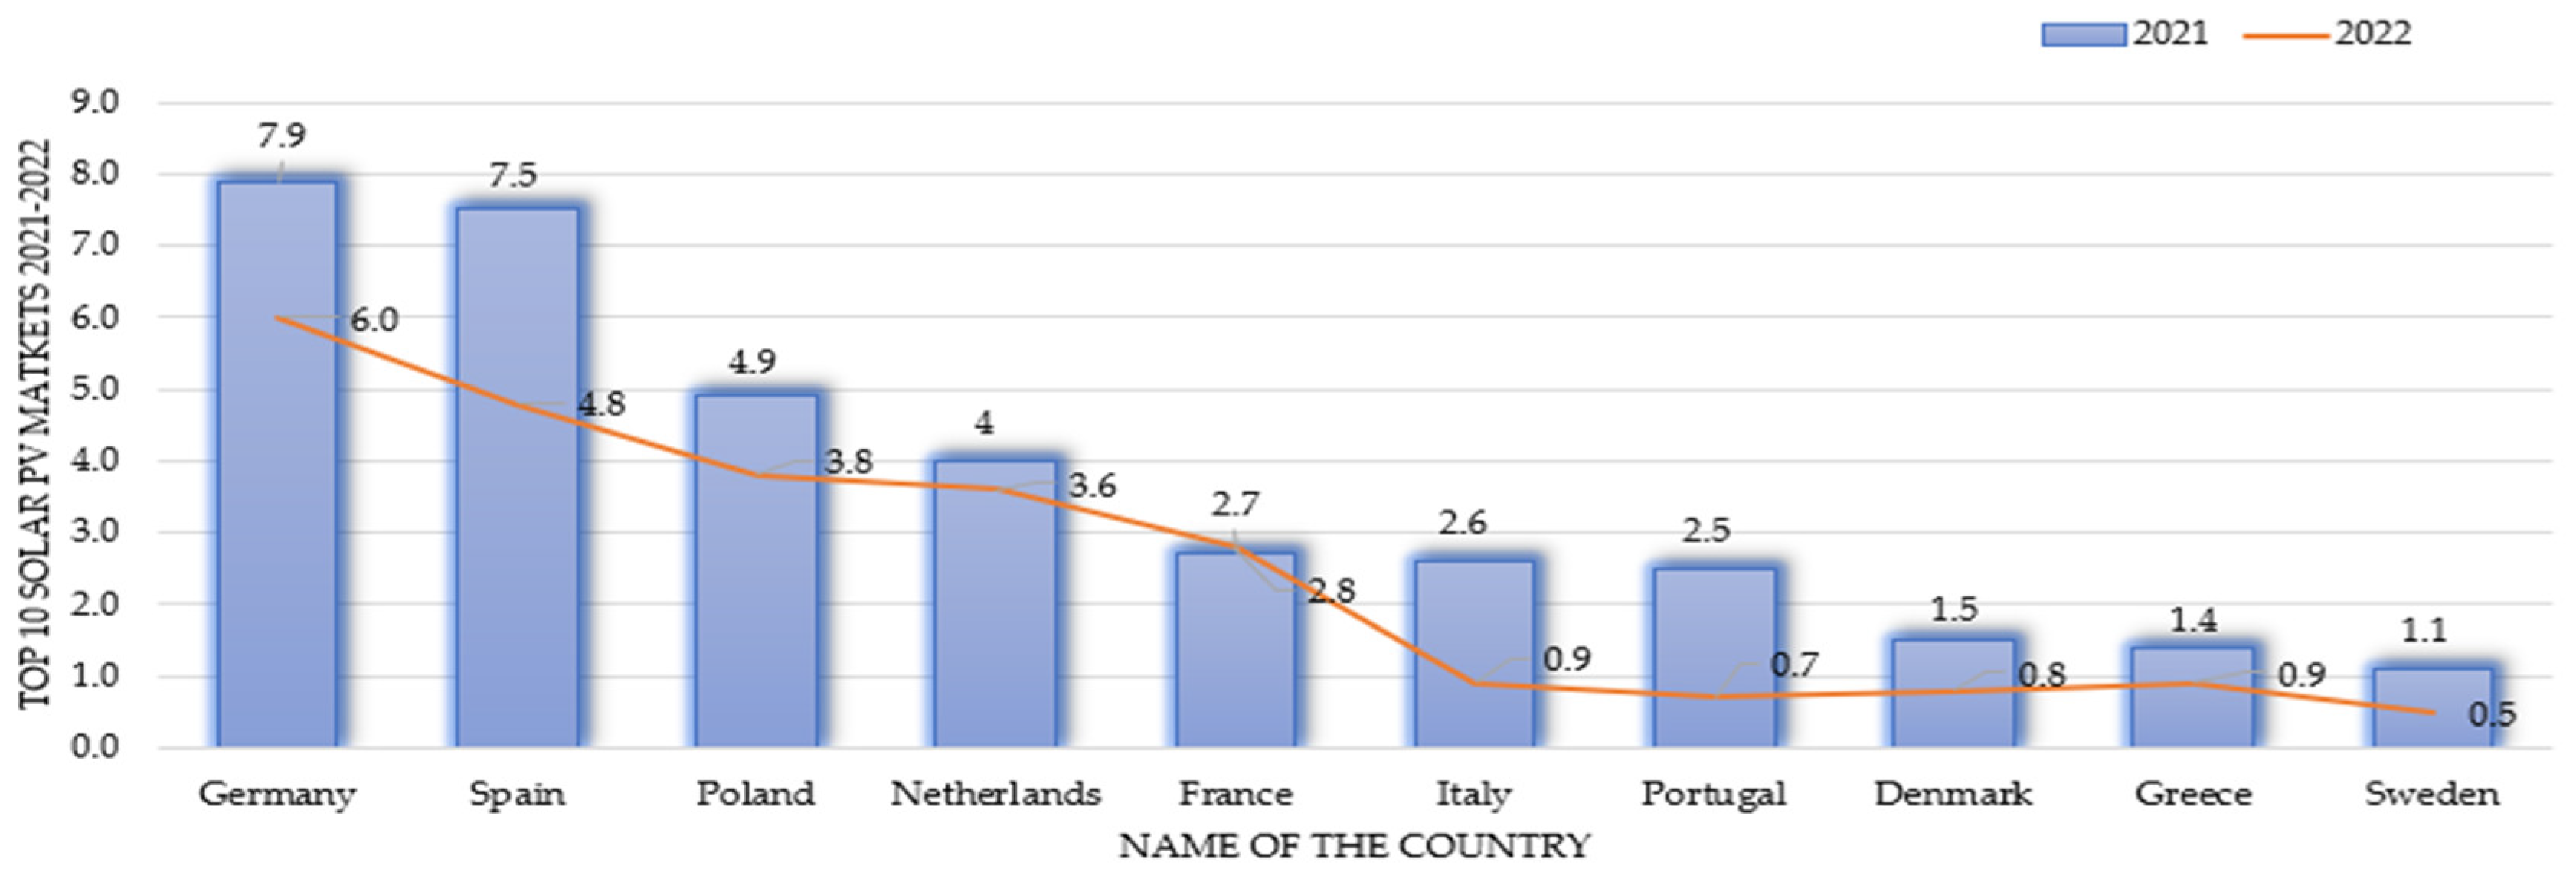
2.1. Development of Photovoltaic Projects
2.2. PV’s Impact on the Environment and on Humans
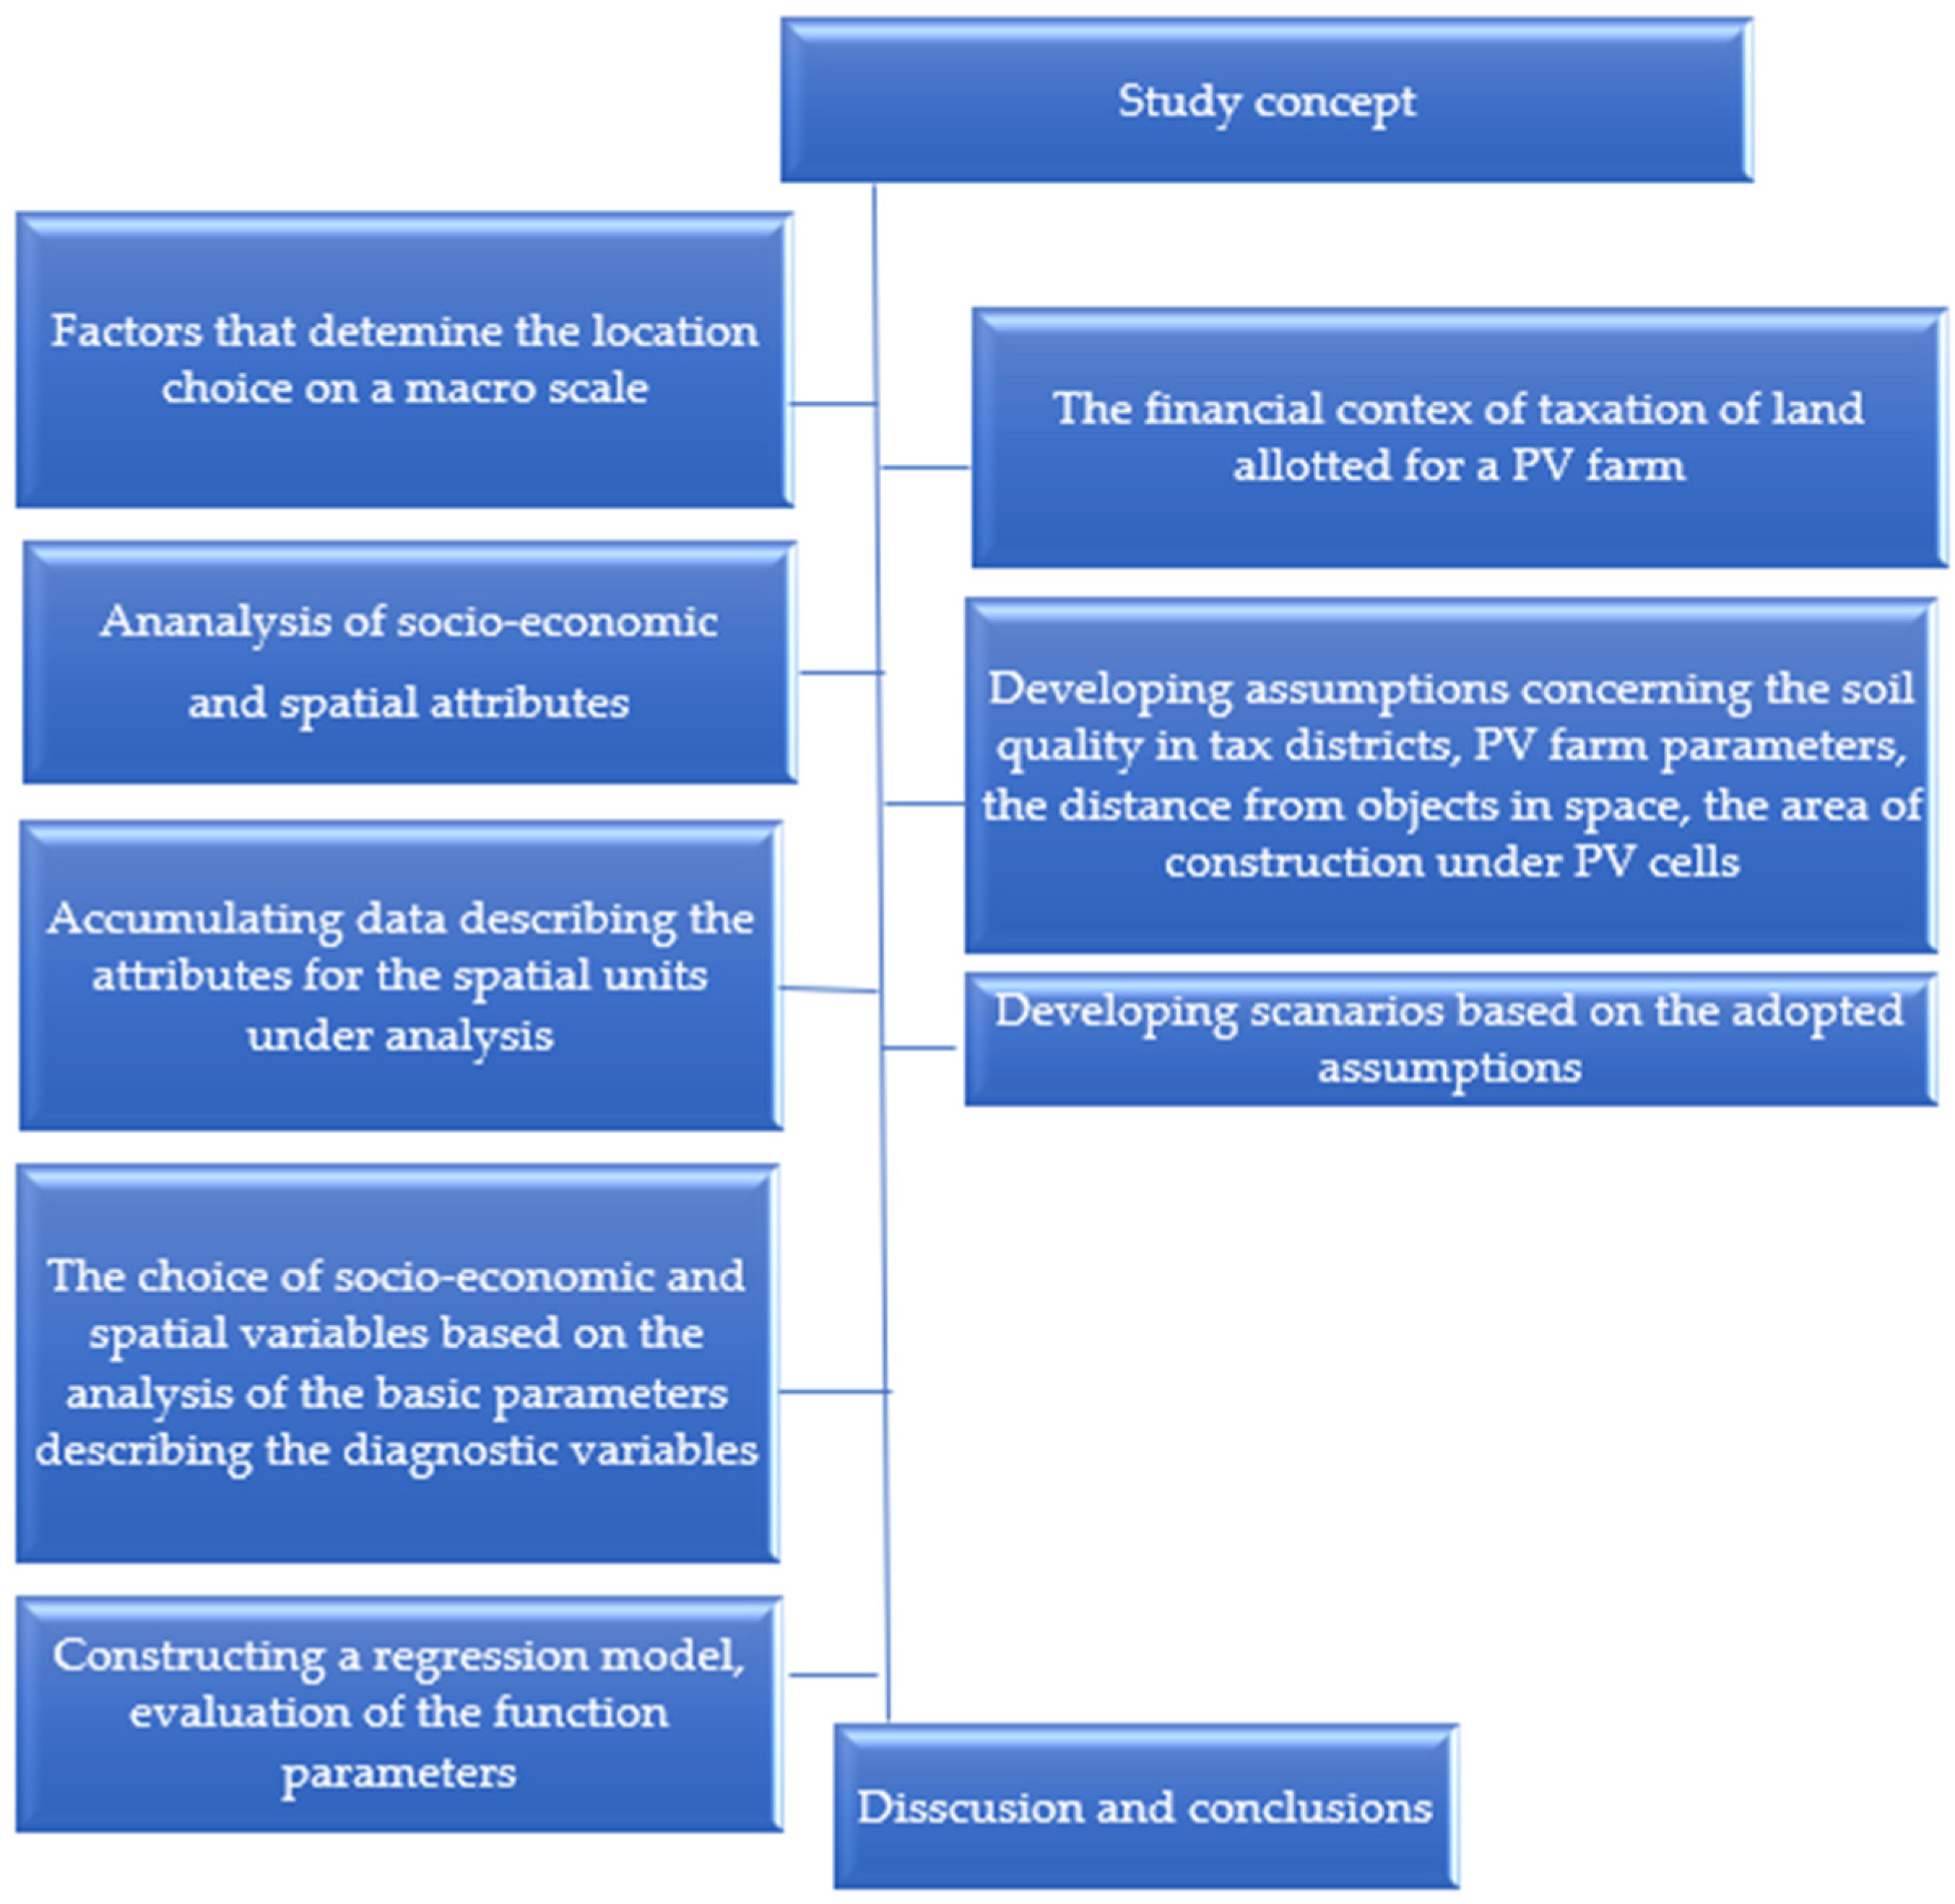
3. Materials and Methods
- —area of PV farm;
- —area of rural parcel;
- —area of service part of PV farm;
- —number of rows of PV. [The area of a PV cell is 1 m × 1.5 m, the slope is 35 degrees, and the distance between rows is 3.5 m].
- —area of rural parcel;
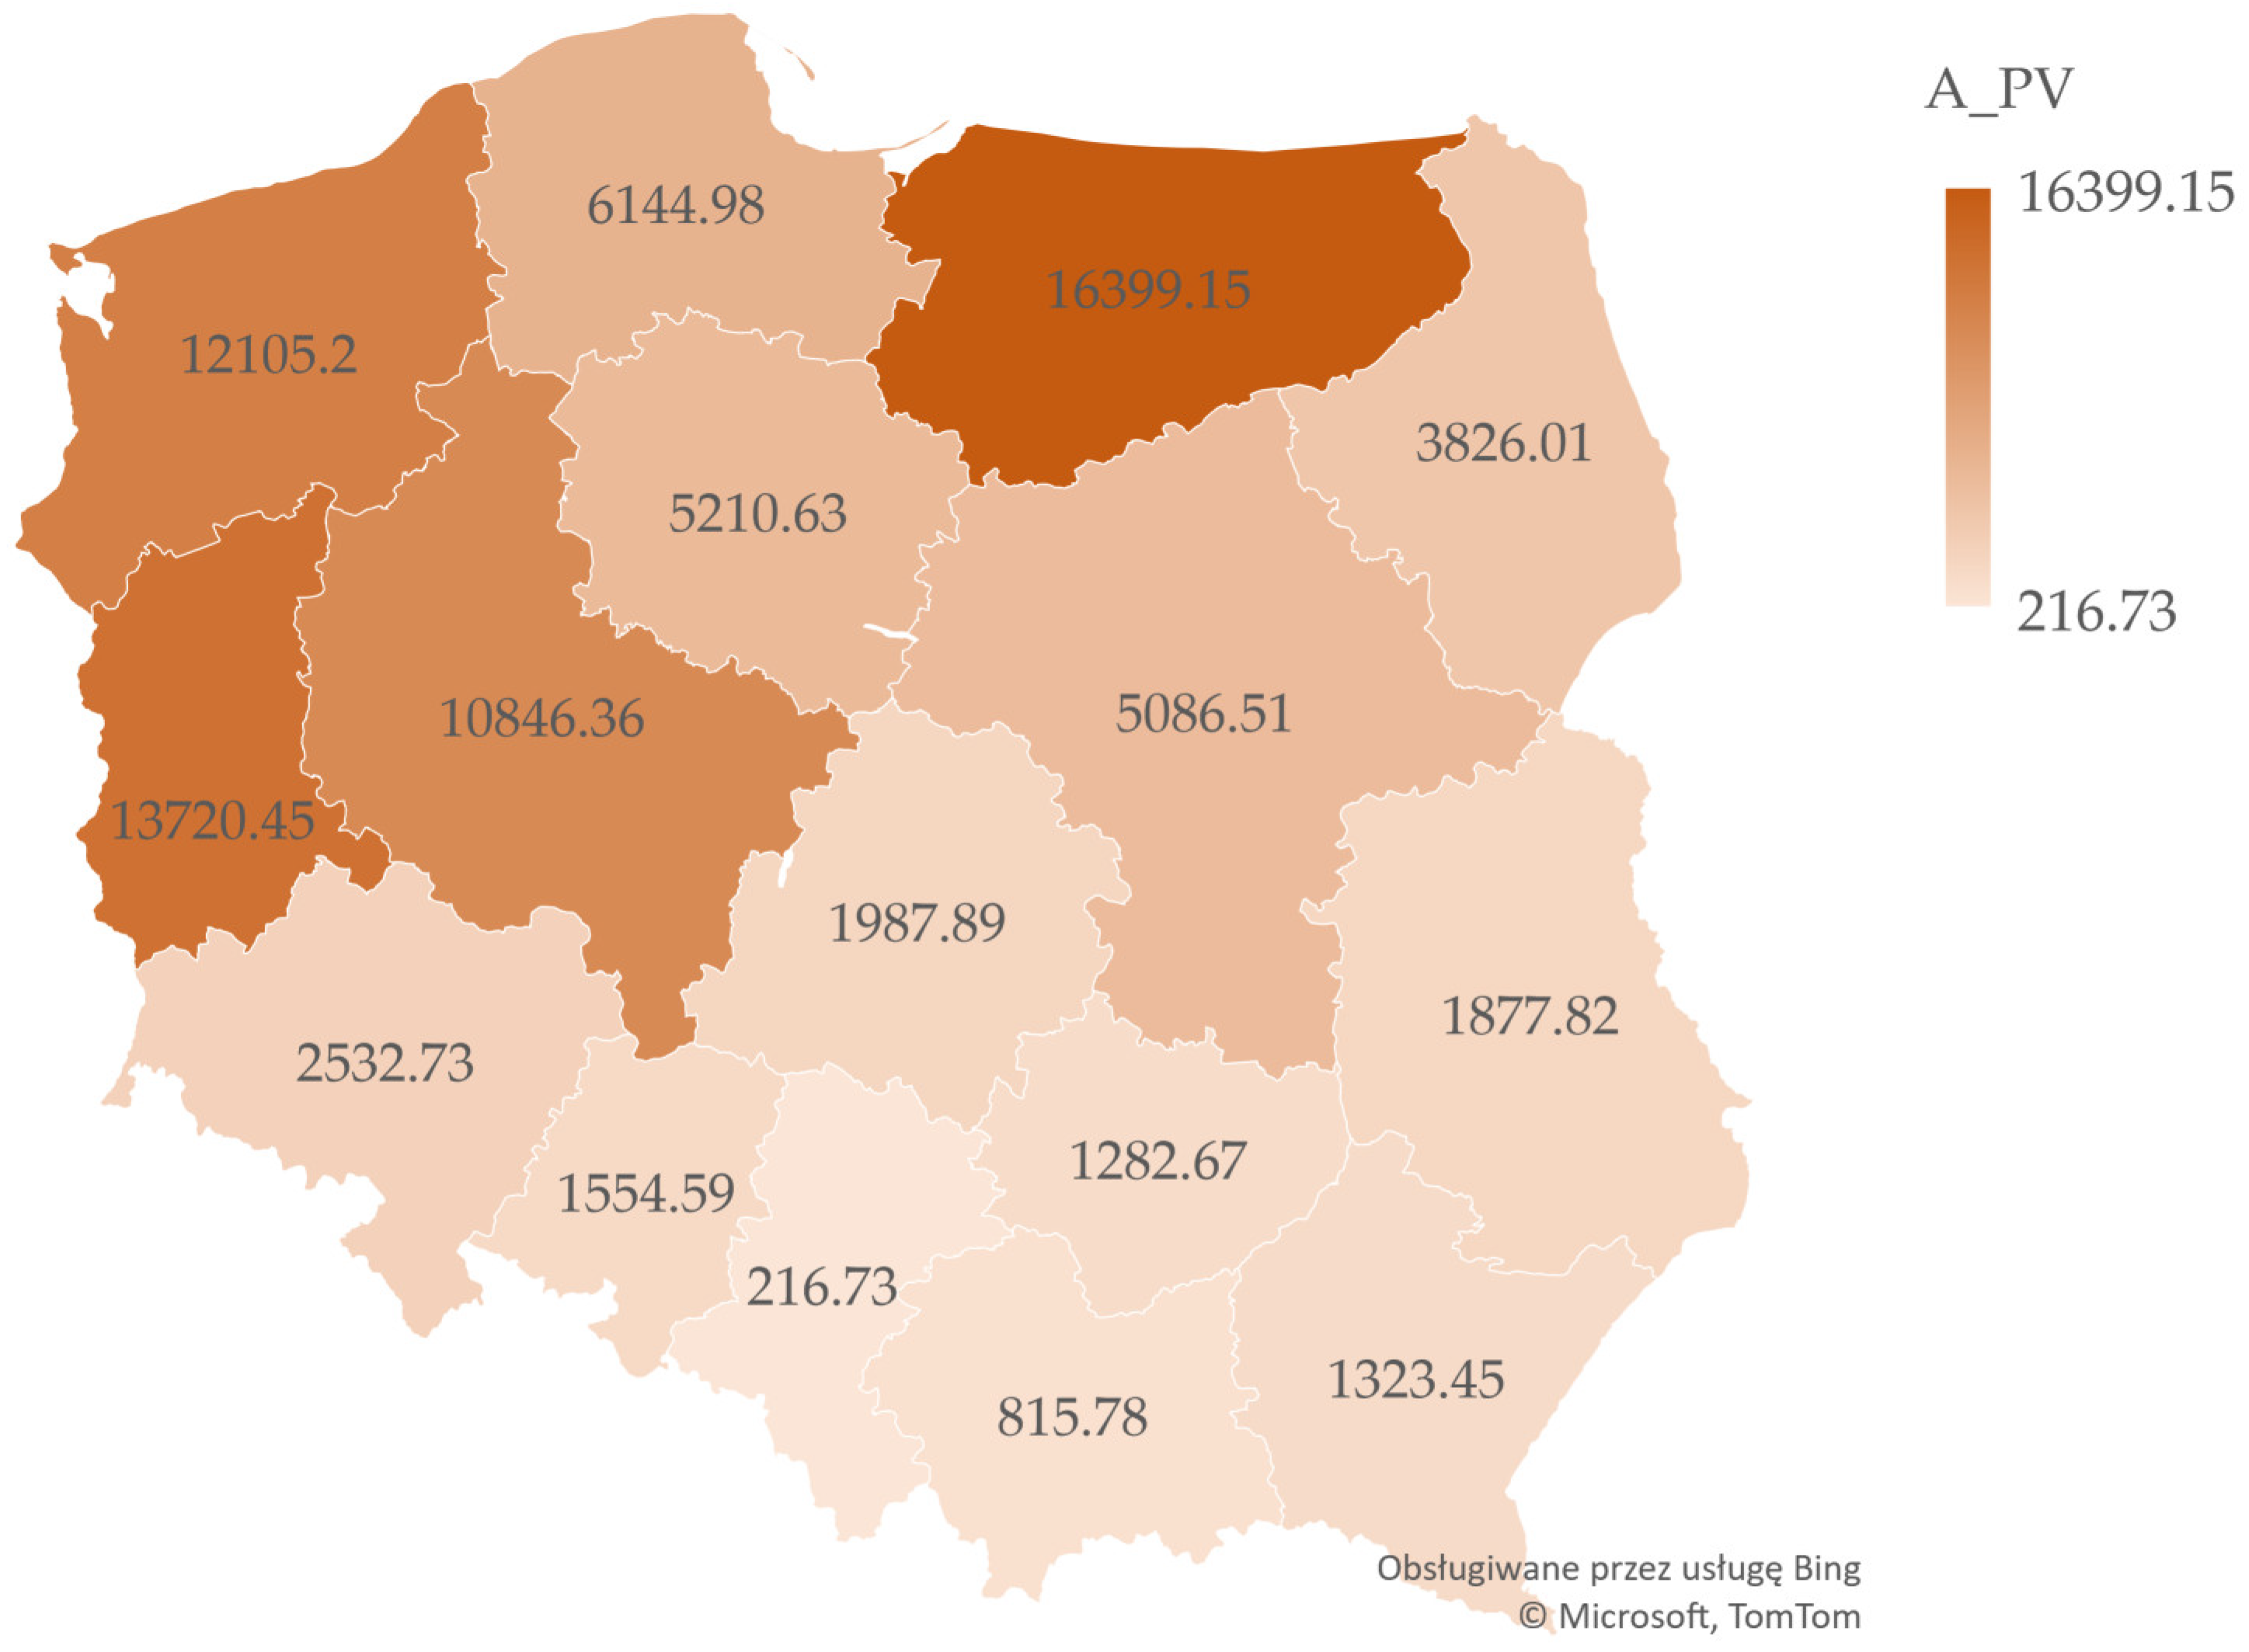
- —area of PV farms built in 2019–2020 in region/voivodeship.
- —area of rural parcel;
- —area of region/voivodeship.
- —multiple regression model, forecast dependent variable;
- —dependent variable, an attribute describing the socio-economic and spatial conditions;
- —random factor, difference between the observed value yi and the theoretical one, calculated from the model;
- —assessment of parameters of dependent variables.
4. Results
5. Discussion
6. Conclusions
Funding
Data Availability Statement
Conflicts of Interest
References
- Sulich, A. Znaczenie koncepcji ekonomii zrównoważonego rozwoju. Rynek-Społeczeństwo-Kultura 2018, 4, 24–27. [Google Scholar]
- From Brown Growth to Green: The Economic Benefits of Climate Action. 25 June 2013. Available online: https://www.worldbank.org/en/news/feature/2013/06/25/growing-green-europe-and-central-asia (accessed on 20 February 2024).
- Moorthy, S.K.; Patwa, N.; Gupta, S.Y. Breaking barriers in the deployment of renewable energy. Heliyon 2019, 5, e01166. [Google Scholar] [CrossRef]
- Jaworski, S.; Chrzanowska, M.; Zielińska-Sitkiewicz, M.; Pietrzykowski, R.; Jezierska-Thöle, A.; Zielonka, P. Evaluating the Progress of Renewable Energy Sources in Poland: A Multidimensional Analysis. Energies 2023, 16, 6431. [Google Scholar] [CrossRef]
- 2009/28/WE w Sprawie Promowania Stosowania Energii ze Źródeł Odnawialnych. Available online: https://eur-lex.europa.eu/legal-content/PL/ALL/?uri=CELEX%3A32009L0028 (accessed on 5 January 2024).
- Zielona Transformacja Może Przynieść Ponad 10 Bilionów Dolarów dla Światowej Gospodarki. 5 June 2023 Biomasa. Available online: https://magazynbiomasa.pl/zielona-transformacja-to-nie-tylko-koszty-ale-korzysci-dla-gospodarki/ (accessed on 25 February 2024).
- El-Sharkawi, M.A. (Ed.) Electric Energy; CRC Press: Boca Raton, FL, USA, 2005. [Google Scholar]
- Woolfson, M. The origin and evolution of the solar system. Astron. Geophys. 2000, 41, 1.12–1.19. [Google Scholar] [CrossRef]
- Broggini, C. Nuclear Processes at Solar Energy. 2003. Available online: https://arxiv.org/abs/astro-ph/0308537 (accessed on 20 February 2024).
- Zirker, J.B. Journey from the Center of the Sun; Princeton University Press: Princeton, NJ, USA, 2002. [Google Scholar]
- Tytko, R. Urządzenia i Systemy Energetyki Odnawialnej; Eco Investment: Kraków, Poland, 2017. [Google Scholar]
- Sala, K. Energetyka słoneczna jako czynnik rozwoju regionów i gmin w Polsce. Entrep.–Educ. 2018, 14, 125–138. [Google Scholar] [CrossRef]
- Hemetsberger, W.; Acke, D.; Schmela, M. SolarPower Europe. European Market Outlook for Solar Power 2022–2026. December 2022. Solar Power Europe. Available online: https://www.solarpowereurope.org (accessed on 10 December 2023).
- Zambrano-Asanza, S.; Quiros-Tortos, J.; Franco, J.F. Optimal site selection for photovoltaic power plants using a GIS-based multi-criteria decision-making and spatial overlay with electric loa. Renew. Sustain. Energy Rev. 2021, 143, 110853. [Google Scholar] [CrossRef]
- Kowalczyk, A.M.; Czyża, S. Optimising Photovoltaic Farm Location Using a Capabilities Matrix and GIS. Energies 2022, 15, 6693. [Google Scholar] [CrossRef]
- Kurowska, K.; Kryszk, H.; Bielski, S. Location and Technical Requirements for Photovoltaic Power Stations in Poland. Energies 2022, 15, 2701. [Google Scholar] [CrossRef]
- Ustawa z Dnia 13 Listopada 2003 r. o Dochodach Jednostek Samorządu Terytorialnego (Dz.U. z 2022 r. poz. 2267). Available online: https://isap.sejm.gov.pl/isap.nsf/download.xsp/WDU20032031966/U/D20031966Lj.pdf (accessed on 1 December 2023).
- Kocur-Bera, K.; Stachelek, M. Geo-Analysis of Compatibility Determinants for Data in the Land and Property Register (LPR). Geosciences 2019, 9, 303. [Google Scholar] [CrossRef]
- Kocur-Bera, K. Understanding information about agricultural land. An evaluation of the extent of data modification in the Land Parcel Identification System for the needs of area-based payments—A case study. Land Use Policy 2020, 94, 104527. [Google Scholar] [CrossRef]
- Kocur-Bera, K.; Frąszczak, H. Coherence of cadastral data in land management—A case study for rural areas in Poland. Land 2021, 10, 399. [Google Scholar] [CrossRef]
- Regulation of the Minister of Development, Labour and Technology of 27 July 2021 on the Land and Property Register. Available online: https://isap.sejm.gov.pl/isap.nsf/DocDetails.xsp?id=WDU20210001390 (accessed on 10 December 2023).
- Wyrok WSA w Warszawie z Dnia 7 Maja 2019 r. (III SA/Wa 1932/18). Available online: https://www.inforlex.pl/dok/tresc,WSA.2018.005.014028624,Wyrok-WSA-w-Szczecinie-z-dnia-24-maja-2018-r-sygn-I-SA-Sz-216-18.html (accessed on 10 December 2023).
- I SA/Sz 239/19—Wyrok WSA w Szczecinie z 11 Września 2019. Available online: https://www.orzeczenia-nsa.pl/wyrok/i-sa-sz-239-19/podatki_od_nieruchomosci/26da111.html (accessed on 20 February 2024).
- I SA/Sz 216/18, Wyrok Wojewódzkiego Sądu Administracyjnego w Szczecinie z dnia 24 of May 2018. Available online: https://kancelaria-skarbiec.pl/opodatkowanie-paneli-fotowoltaicznych-podatkiem-od-nieruchomosci/ (accessed on 10 December 2023).
- Chakraborty, S.; Sadhu, P.K.; Goswami, U. Barriers in the Advancement of Solar Energy in Developing Countries like India. Probl. Sustain. Dev. 2016, 11, 75–80. [Google Scholar]
- Aman, M.M.; Solangi, K.H.; Hossain, M.S.; Badarudin, A.; Jasmon, G.B.; Mokhlis, H.; Bakar, A.H.A.; Kazi, S.N. A review of Safety, Health and Environmental (SHE) issues of solar energy system. Renew. Sustain. Energy Rev. 2015, 41, 1190–1204. [Google Scholar] [CrossRef]
- Vrînceanu, A.; Grigorescu, I.; Dumitrașcu, M.; Mocanu, I.; Dumitrică, C.; Micu, D.; Kucsicsa, G.; Mitrică, B. Impacts of Photovoltaic Farms on the Environment in the Romanian Plain. Energies 2019, 12, 2533. [Google Scholar] [CrossRef]
- Buikema, E.; van der Ploeg, F.D.; Granneman, J.H. Active Noise Control in Practice: Transformer Station. Inter.noise 2014, 16–19 November 2014, Melbourne, Australia. Available online: https://www.acoustics.asn.au/conference_proceedings/INTERNOISE2014/papers/p540 (accessed on 20 December 2023).
- Tell, R.A.; Hooper, H.C.; Sias, G.G.; Mezei, G.; Hung, G.; Kavet, R. Electromagnetic Fields Associated with Commercial Solar Photovoltaic Electric Power Generating Facilities. J. Occup. Environ. Hyg. 2015, 12, 795–803. [Google Scholar] [CrossRef] [PubMed]
- Wang, D.; Ying, L.; Wang, W.; Pei Ch Wang, J. Indoor substation low-noise design and sound absorbing structure improvement considering power transformer acoustic radiation characteristics. Build. Environ. 2019, 149, 390–403. [Google Scholar] [CrossRef]
- Laskowska, A. Mieszkańcy Sprzeciwiają się Budowie Farmy Fotowoltaicznej. Gazeta Olsztyn, 28 February 2021. Available online: https://gazetaolsztynska.pl/721259,Mieszkancy-sprzeciwiaja-sie-budowie-farmy-fotowoltaicznej.html (accessed on 4 December 2023).
- Chiabrando, R.; Fabrizio, E.; Garnero, G. The territorial and landscape impacts of photovoltaic systems: Definition of impacts and assessment of the glare risk. Renew. Sustain. Energy Rev. 2009, 13, 2441–2451. [Google Scholar] [CrossRef]
- Armstrong, A.; Waldron, S.; Whitaker, J.; Ostle, N.J. Wind farm and solar park effects on plant-soil carbon cycling: Uncertain impacts of changes in ground-level microclimate. Glob. Chang. Biol. 2014, 20, 1699–1706. [Google Scholar] [CrossRef] [PubMed]
- Semeraro, T.; Scarano, A.; Santino, A.; Emmanuel, R.; Lenucci, M. An innovative approach to combine solar photovoltaic gardens with agricultural production and ecosystem services. Ecosyst. Serv. 2022, 56, 101450. [Google Scholar] [CrossRef]
- Scognamiglio, A. Photovoltaic landscapes: Design and assessment. A critical review for a new transdisciplinary design vision. Renew. Sustain. Energy Rev. 2016, 55, 629–661. [Google Scholar] [CrossRef]
- Hernandez, R.R.; Easter, S.B.; Murphy-Mariscal, M.L.; Maestre, F.T.; Tavassoli, M.; Allen, E.B.; Barrows, C.W.; Belnap, J.; Ochoa-Hueso, R.; Ravi, S.; et al. Environmental impacts of utility-scale solar energy. Renew. Sustain. Energy Rev. 2014, 29, 766–779. [Google Scholar] [CrossRef]
- Gonocruz, R.A.; Uchiyama, S.; Yoshida, Y. Modeling of large-scale integration of agrivoltaic systems: Impact on the Japanese power grid. J. Clean. Prod. 2022, 363, 132545. [Google Scholar] [CrossRef]
- Dupraz, C.; Marrou, H.; Talbot, G.; Dufour, L.; Nogier, A.; Ferard, Y. Combining solar photovoltaic panels and food crops for optimising land use: Towards new agrivoltaic schemes. Renew. Energy 2011, 36, 2725–2732. [Google Scholar] [CrossRef]
- Naspetti, S.; Mandolesi, S.; Zanoli, R. Using visual Q sorting to determine the impact of photovoltaic applications on the landscape. Land Use Policy 2016, 57, 564–573. [Google Scholar] [CrossRef]
- Torres-Sibille, C.; Cloquell-Ballester, V.-A.; Cloquell-Ballester, V.-A.; Ramírez, M.A.A. Aesthetic impact assessment of solar power plants: An objective and a subjective approach. Renew. Sustain. Energy Rev. 2009, 13, 986–999. [Google Scholar] [CrossRef]
- Kapetanakis, I.A.; Kolokotsa, D.; Maria, E.A. Parametric analysis and assessment of the photovoltaics’ landscape integration: Technical and legal aspects. Renew. Energy 2014, 67, 207–214. [Google Scholar] [CrossRef]
- Pasqualetti, M. Wind Power: Obstacles and Opportunities. Environ. Sci. Policy Sustain. Dev. 2004, 46, 22–38. [Google Scholar] [CrossRef]
- Sowers, J. Fields of Opportunity: Wind Machines Return to the Plains. Great Plains Q. 2006, 26, 99–112. [Google Scholar]
- Silva, L.; Sareen, S. Solar photovoltaic energy infrastructures, land use and sociocultural context in Portugal. Local Environ. 2021, 26, 347–363. [Google Scholar] [CrossRef]
- Argenti, N.; Knight, D. Sun, Wind, and the Rebirth of Extractive Economies: Renewable Energy Investment and Metanarratives of Crisis in Greece. J. R. Anthropol. Inst. 2015, 21, 781–802. [Google Scholar] [CrossRef]
- Howe, C. Anthropocenic Ecoauthority: The Winds of Oaxaca. Anthropol. Q. 2014, 87, 381–404. [Google Scholar] [CrossRef]
- Ryser, S. The Anti-Politics Machine of Green Energy Development: The Moroccan Solar Project in Ouarzazate and Its Impact on Gendered Local Communities. Land 2019, 8, 100. [Google Scholar] [CrossRef]
- Pasqualetti, M. Social Barriers to Renewable Energy Landscapes. Geogr. Rev. 2011, 101, 201–223. [Google Scholar] [CrossRef]
- Botelho, A.; Lourenço-Gomes, L.; Pinto, L.; Sousa, S.; Valente, M. Accounting for local impacts of photovoltaic farms: The application of two stated preferences approach to a case-study in Portugal. Energy Policy 2017, 109, 191–198. [Google Scholar] [CrossRef]
- Bank Danych Lokalnych. Available online: https://bdl.stat.gov.pl/bdl/start (accessed on 10 December 2023).
- Geoportal. Available online: https://www.geoportal.gov.pl (accessed on 3 December 2023).
- RO-SUN. Available online: https://pro-sun.pl/KAT/index.html (accessed on 10 December 2023).
- Rozporządzenie Ministra Finansów z Dnia 10 Grudnia 2001 r. w Sprawie Zaliczenia Gmin Oraz Miast Do Jednego z Czterech Okręgów Podatkowych. Available online: https://isap.sejm.gov.pl/isap.nsf/DocDetails.xsp?id=wdu20011431614 (accessed on 10 December 2023).
- Ustawa z Dnia 3 Lutego 1995 r. o Ochronie Gruntów Rolnych i Leśnych. Available online: https://isap.sejm.gov.pl/isap.nsf/DocDetails.xsp?id=wdu19950160078 (accessed on 6 December 2023).
- Watroba, J. Prosto o dopasowaniu prostych, czyli analiza regresji. Statsoft. Pol. 2011. Available online: https://statsoft.pl/czytelnia.html (accessed on 10 December 2023).
- Kunza, M.; Nienartowicz, A. Systemy Informacji Geograficznej w Zarzadzaniu Obszarami Chronionymi—od Teorii do Praktyki; Firma Usługowo-Wydawnicza “Daniel” Ewa Wierzchucka: Toruń, Poland, 2013; p. 250. ISBN 978-83-60019-59-7. Available online: https://bibliografia.bg.szczecin.pl/Works/Details/2692 (accessed on 10 December 2023).
- Jadczyszyn, J.; Smreczek, B. Mapa glebowo-rolnicza w skali 1:25,000 i jej wykorzystanie na potrzeby współczesnego rolnictwa. Stud. I Rap. IUNG-PIB 2017, 51, 9–27. [Google Scholar] [CrossRef]
- Podatek od Nieruchomości. 2023. Available online: https://www.muratorplus.pl/biznes/prawo/podatek-od-nieruchomosci-2023-zaplac-do-15-listopada-to-ostatnia-rata-w-tym-roku-aa-2xbd-woEA-brhz.html (accessed on 20 December 2023).
- Obwieszczenie Ministra Finansów z Dnia 21 Lipca 2023 r. w Sprawie Górnych Granic Stawek Kwotowych Podatków i Opłat Lokalnych na Rok. 2024. Available online: https://samorzad.pap.pl/sites/default/files/2023-08/M20 (accessed on 25 December 2023).
- Jezierska-Thöle, A.; Gwiaździńska-Goraj, M.; Dudzińska, M. Environmental, Social, and Economic Aspects of the Green Economy in Polish Rural Areas—A Spatial Analysis. Energies 2022, 15, 3332. [Google Scholar] [CrossRef]
- Ciuła, R.; Gajkowski, J.; Kowalak, T.; Grochowski, K.; Kalinowski, K.; Krzyżanowska, A.; Sulej, A.; Wiśniewski, K. Rynek Fotowoltaiki w Polsce. Instytut Energetyki Odnawialnej. 2023. Available online: https://www.cire.pl/files/portal/186/news/334162/cbf06a97d3d51dc783b5eda66ea6123a2e01638301db91fb316f383b7b3511ab.pdf (accessed on 15 December 2023).
- Wicki, L.; Pietrzykowski, R.; Kusz, D. Factors Determining the Development of Prosumer Photovoltaic Installations in Poland. Energies 2022, 15, 5897. [Google Scholar] [CrossRef]
- Fotowoltaika—Czym Jest i Czy to Się Opłaca? 27 February 2020. Available online: https://stiloenergy.pl/fotowoltaika-co-to-jest/ (accessed on 28 February 2024).
- Rogala, B. Raport: Rozszerzmy Obszary Chronione do 30% Planety, by Chronić Naturę i Odbudować Gospodarkę. 6 August 2020. Available online: https://300gospodarka.pl/300klimat/raport-rozszerzmy-obszary-chronione-do-30-planety-by-chronic-nature-i-odbudowac-gospodarke (accessed on 15 December 2023).
- Ministerstwo Pracy i Polityki Społecznej. 9 Lipca 2014 r., Znak: SPS-024-6925/14 w Sprawie Nadania Przez Urząd Pracy Statusu Bezrobotnego Osobie, Która Posiada Nieruchomość Rolną, Ale Nie Czerpie z Tego Tytułu Zysków. Available online: https://www.sejm.gov.pl/Sejm7.nsf/InterpelacjaTresc.xsp?key=7C90C374&view=2 (accessed on 10 January 2024).


| No. | Soil Quality | Soil Class in Arable Lands Group | Soil Class in Meadows/Pastures Group |
|---|---|---|---|
| 1 | High | IIIa, IIIb | III |
| 2 | Average | IVa, IVb | IV |
| 3 | Poor | V, VI | V, VI |
| Symbol | Name of Variable | Unit | Aver. | Median | Min. | Max. | Coeff. of Var. |
|---|---|---|---|---|---|---|---|
| A_PV | Area of PV farms in region/voivodeship 2019–2020 | ha | 5308.2 | 3179.4 | 216.7 | 16,399.2 | 96.8 |
| A_W | Index describing share of region/voivodeship area in the national area | % | 6.1 | 5.6 | 2.9 | 11.0 | 35.0 |
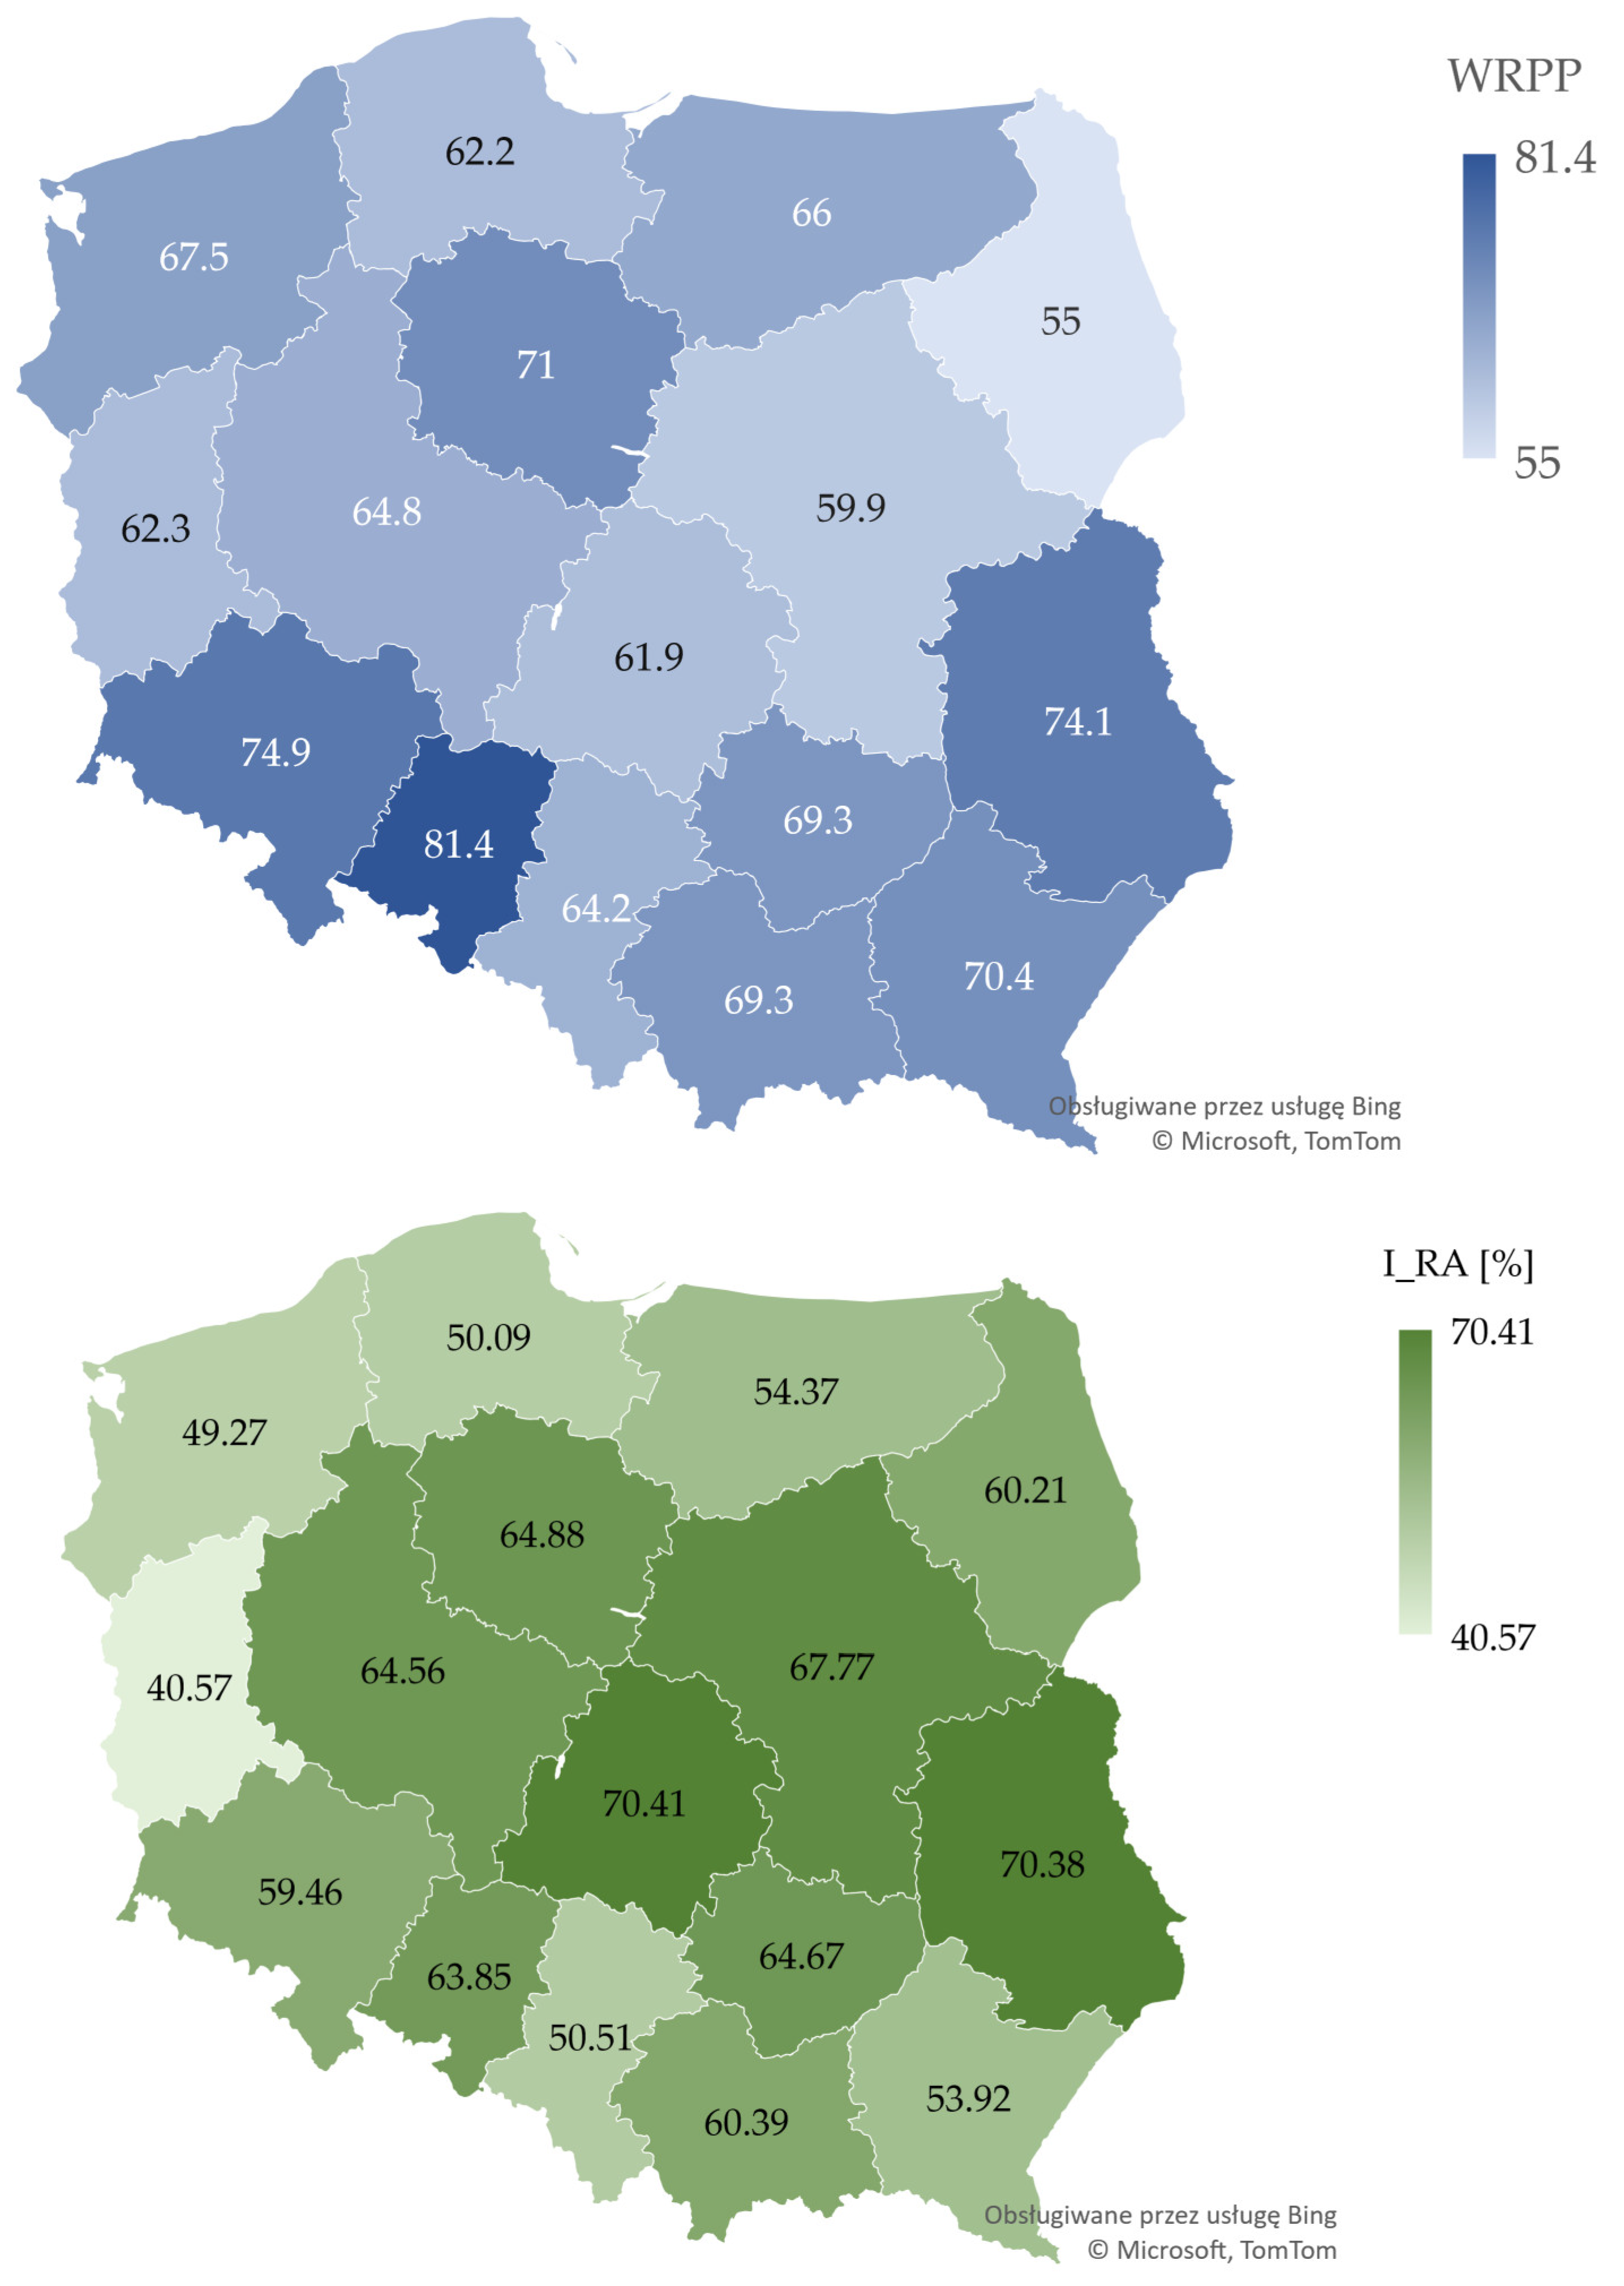
| I_RA | Share of arable land in region/voivodeship area [NUTS-2] | % | 59.1 | 60.3 | 40.6 | 70.41 | 43.1 |
| UA | Urban area | thousand ha | 112.8 | 104.7 | 58.4 | 220.4 | 39.5 |
| PA | Area under environmental protection | thousand ha | 615.0 | 590.9 | 259.5 | 1128.2 | 38.8 |
| LFS | Area where land management is hindered | thousand ha | 767.1 | 681.9 | 158.1 | 1700.6 | 51.2 |
| WA | Employed in agriculture | index | 4552.9 | 3785.0 | 1236.0 | 14,675.0 | 69.0 |
| UW | Unemployed who own an agricultural farm | number | 1797.8 | 798.0 | 24.0 | 8300.0 | 129.6 |
| GDP | Gross domestic product in region/voivodeship (2020) | PLN/person | 146,187.2 | 95,864.50 | 46,806.0 | 538,344.0 | 86.1 |
| WRPP | Index/potential of agricultural production space quality | index | 67.1 | 66.75 | 55.0 | 81.4 | 9.71 |
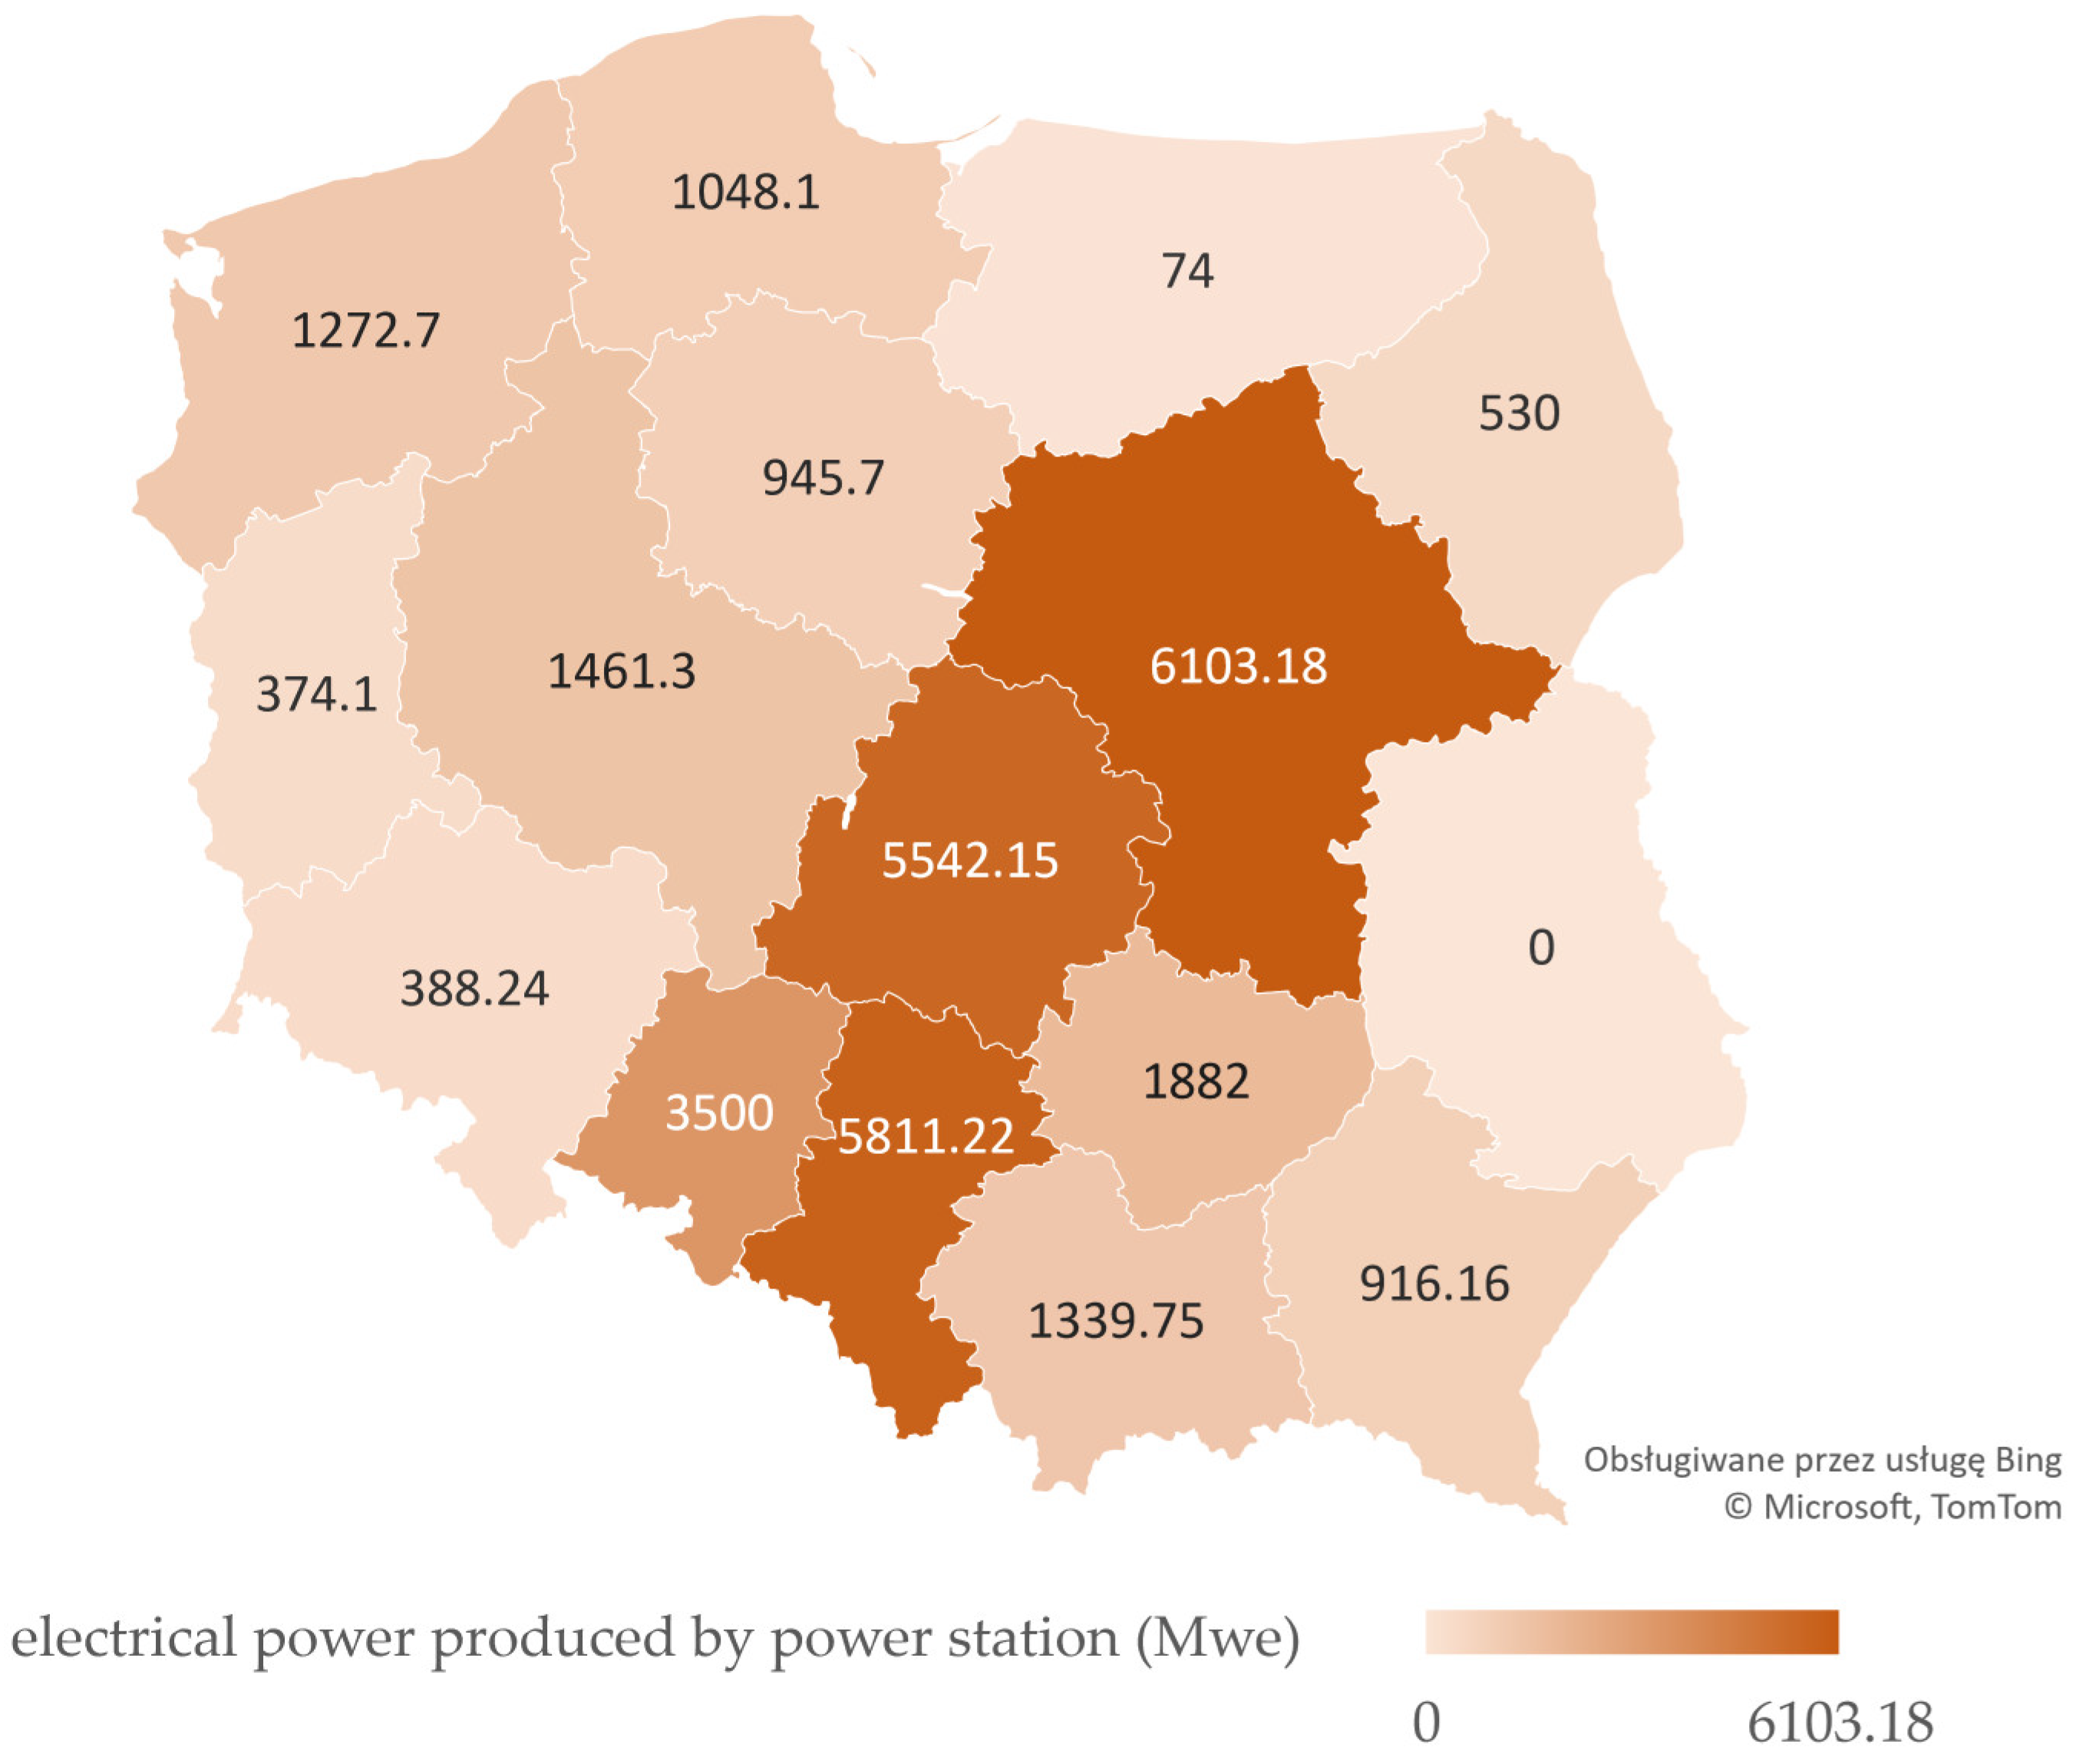
| MWe | Power generated from conventional sources in the region | MWe | 1949.3 | 1160.4 | 0.0 | 6103.2 | 107.36 |
| Nb of Scenario | A_PV [ha] | Area of Service Land [ha] | Soil Quality | Tax District | Adopted Price of 1 Quintal of Rye Grain | Real Estate Tax for Arable Land (PLN/Year) | Nb of Scenario | Real Estate Tax for PV Farm (PLN/Year) |
|---|---|---|---|---|---|---|---|---|
| 1 | 2 | 3 | 4 | 5 | 6 | 7 | 8 | 9 |
| S_1 | 1.7000 | 0.3000 | high | 1 | 185.12 PLN [47] | 519.0 | S_1pv | 38,500.0 |
| S_2 | average | 2 | 299.0 | S_2pv | 36,500.0 | |||
| S_3 | poor | 3 | 55.0 | S_3pv | 34,500.0 | |||
| S_4 | high | 4 | 403.0 | S_4pv | 38,500.0 | |||
| S_5 | average | 1 | 324.0 | S_5pv | 36,500.0 | |||
| S_6 | poor | 2 | 74.0 | S_6pv | 34,500.0 | |||
| S_7 | high | 3 | 440.0 | S_7pv | 38,500.0 | |||
| S_8 | average | 4 | 238.0 | S_8pv | 36,500.0 | |||
| S_9 | poor | 1 | 83.0 | S_9pv | 34,500.0 | |||
| S_10 | high | 2 | 476.0 | S_10pv | 38,500.0 | |||
| S_11 | average | 3 | 263.0 | S_11pv | 36,500.0 | |||
| S_12 | poor | 4 | 41.0 | S_12pv | 34,500.0 |
| Coefficient | A_PV | A_W | I_RA | UA | WA | PA | LFS | UW | GDP | WRPP | MWe |
|---|---|---|---|---|---|---|---|---|---|---|---|
| A_PV | 1.000 | 0.371 | −0.481 | −0.026 | 0.441 | 0.579 | 0.360 | −0.427 | −0.148 | −0.292 | −0.372 |
| A_W | 0.372 | 1.000 | 0.301 | 0.685 | 0.489 | 0.569 | 0.922 | 0.225 | 0.583 | −0.356 | 0.028 |
| I_RA | −0.481 | 0.301 | 1.000 | 0.215 | 0.037 | 0.002 | 0.375 | 0.298 | 0.247 | 0.219 | 0.280 |
| UA | −0.026 | 0.685 | 0.215 | 1.000 | 0.074 | 0.440 | 0.596 | 0.175 | 0.925 | −0.270 | 0.503 |
| WA | 0.441 | 0.489 | 0.037 | 0.074 | 1.000 | 0.289 | 0.558 | 0.290 | 0.069 | −0.258 | −0.369 |
| PA | 0.579 | 0.569 | 0.003 | 0.440 | 0.289 | 1.000 | 0.477 | −0.298 | 0.213 | −0.056 | −0.152 |
| LFS | 0.360 | 0.922 | 0.375 | 0.596 | 0.558 | 0.477 | 1.000 | 0.241 | 0.553 | −0.536 | 0.154 |
| UW | −0.427 | 0.225 | 0.298 | 0.175 | 0.290 | −0.298 | 0.242 | 1.000 | 0.291 | −0.009 | 0.218 |
| GDP | −0.148 | 0.583 | 0.247 | 0.925 | 0.069 | 0.213 | 0.553 | 0.291 | 1.000 | −0.290 | 0.640 |
| WRPP | −0.292 | −0.345 | 0.219 | −0.270 | −0.258 | −0.056 | −0.536 | −0.009 | −0.290 | 1.000 | −0.196 |
| MWe | −0.372 | 0.028 | 0.282 | 0.503 | −0.369 | −0.152 | 0.155 | 0.218 | 0.640 | 0.196 | 1.000 |
| Coefficient | Coefficient | t-Student | p |
|---|---|---|---|
| Const. | 8518.42 | ||
| A_W | 2249.33 | 3.81 | 0.008 |
| I_RA | −385.39 | −4.50 | 0.004 |
| UA | −65.49 | −1.37 | 0.217 |
| PA | 7.65 | 2.10 | 0.079 |
| WA | 0.33 | 1.06 | 0.330 |
| UW | −0.94 | −2.87 | 0.028 |
| GDP | −0.01 | −0.54 | 0.604 |
| WRPP | 116.15 | 0.99 | 0.358 |
| MWe | 1.22 | 2.32 | 0.059 |
| R | 0.96 | ||
| R2 Adjusted | 0.829 |
Disclaimer/Publisher’s Note: The statements, opinions and data contained in all publications are solely those of the individual author(s) and contributor(s) and not of MDPI and/or the editor(s). MDPI and/or the editor(s) disclaim responsibility for any injury to people or property resulting from any ideas, methods, instructions or products referred to in the content. |
© 2024 by the author. Licensee MDPI, Basel, Switzerland. This article is an open access article distributed under the terms and conditions of the Creative Commons Attribution (CC BY) license (https://creativecommons.org/licenses/by/4.0/).
Share and Cite
Kocur-Bera, K. Are Local Commune Governments Interested in the Development of Photovoltaics in Their Area? An Inside View of Poland. Energies 2024, 17, 1895. https://doi.org/10.3390/en17081895
Kocur-Bera K. Are Local Commune Governments Interested in the Development of Photovoltaics in Their Area? An Inside View of Poland. Energies. 2024; 17(8):1895. https://doi.org/10.3390/en17081895
Chicago/Turabian StyleKocur-Bera, Katarzyna. 2024. "Are Local Commune Governments Interested in the Development of Photovoltaics in Their Area? An Inside View of Poland" Energies 17, no. 8: 1895. https://doi.org/10.3390/en17081895