Article

Study on the Influence of Circulating Water Bypass on the Thermal and Anti-Freezing Characteristics of High-Level Wet Cooling Tower

1
Jining Huayuan Thermal Power Co., Ltd., Jining 272113, China
2
Ji’nan Lanchen Energy Technology Co., Jinan 250101, China
3
School of Energy and Power Engineering, Shandong University, Jinan 250061, China
*
Authors to whom correspondence should be addressed.
Energies 2024, 17(9), 2073; https://doi.org/10.3390/en17092073
Submission received: 26 February 2024 / Revised: 9 April 2024 / Accepted: 23 April 2024 / Published: 26 April 2024
(This article belongs to the Section J1: Heat and Mass Transfer)

Abstract

:
When heating units are operated in winter, the extreme conditions, such as deep peak regulation and large extraction, can easily lead to a low unit load and severe icing in the wet cooling tower, which threatens the safe operation of the unit. Therefore, it is necessary to study the anti-freezing characteristics of the wet cooling tower. In this paper, a three-dimensional numerical model of a high-level, natural draft wet cooling tower is developed based on the constant heat load method. The influence of withdrawing a certain percentage of circulating water into the bypass on the cooling performance and anti-freezing characteristics of the high-level, natural draft wet cooling tower is investigated. The results show that as the percentage of circulating water bypass extraction increases, the temperature drop of circulating water in the tower continues to increase, but the lowest and the average water temperatures at the bottom of the packing continue to decrease. At the same time, the amount of circulating water entering the tower decreases, the pressure difference between the inside and outside of the tower under the same environmental conditions decreases, and the pumping force of the cooling tower decreases. If the circulating water bypass extraction percentage is less than 10%, it can prevent the circulating water from freezing at the bottom of the packing and, at the same time, try to reduce the temperature of the circulating water entering the condenser to ensure the efficiency of the unit.

1. Introduction

Power generation units simultaneously undertaking heating and deep peak shaving tasks are prone to low cooling loads during winter operation. This can result in icing within the cooling tower [1], which mainly occurs at the air inlet of the support column, the packing bottom, and the boundary of partition water distribution in packing. Icing in the cooling tower can significantly impact its safety, shorten the lifespan of key facilities, and reduce economic efficiency [2]. Therefore, it is imperative to research anti-freezing measures for cooling towers.
The high-level water-collecting, natural draft wet cooling tower consists of the tower shell, water distribution system, packing, water tank, and supporting structure. The hot circulating water is evenly sprayed on the top surface of the packing by the water distribution system, then adheres to the wall of the packing and flows down in the form of a water film, and drips down in the form of water droplets at the bottom of the packing, falling into the collecting device [3]. As a high-level wet cooling tower with no rain area, the packing is the main heat and mass transfer area of the wet cooling tower. Its design method [4], type of packing shape [5], divided water distribution [6], and water spraying method all have a significant influence on the heat and mass transfer characteristics during the actual operation of the wet cooling tower.
Ambient temperature, humidity, and crosswinds also affect the heat and mass transfer of circulating water and air in the tower. Gilani and Parpanji [7] pointed out that the outlet water temperature of the wet cooling tower will increase with the increase in ambient temperature and humidity, and the higher the ambient temperature, the greater the effect on the outlet water temperature. Al-Waked and Behnia [8] pointed out that regardless of the direction of the crosswind, the outlet water temperature will increase by about 1.30 °C, when the crosswind speed exceeds 4 m/s. Chen et al. [9,10] investigated the effect of crosswind on the cooling performance of wet cooling towers through thermal experiments. The results showed that there was a critical value for the cooling performance with the change in the crosswind speed, and the dimensionless value of the critical crosswind speed was provided. For the reason that the crosswind deteriorates the cooling performance of the wet cooling tower, the current research believes that the existence of a crosswind destroys the symmetry of the temperature field and the pressure field distribution in the cooling tower, causing the aerodynamic field in the tower to be unbalanced [11,12,13,14,15]. Through laboratory experiments, Sharifullin [16] obtained an extreme form of dependence of the wind speed distribution over the cooling tower unit on the wind speed field near the air inlet.
Anti-frost measures for cooling towers at low winter temperatures tend to focus on the use of zoned water distribution, the installation of hot water bypasses, suspended windbreaks, etc. Williamson [17] proposed longitudinally spaced wind baffles and analyzed the effect of the wind baffle area on the water temperature in the tower, obtaining the optimum wind baffle area for a given ambient temperature and wind speed. Li et al. [18] and Zhang et al. [19] carried out a three-dimensional numerical study of a wet-cooled tower with different water distribution methods, and the results showed that zoned water distribution can improve the uniformity of water temperature distribution inside the tower. Through the division of regional water distribution, changing the cooling tower water density is commonly used to solve the small winter unit load, but the tower water temperature is too low, as caused by the anti-freezing problem [20].
The heat released from the turbine exhaust steam in the condenser varies slightly in a stable wet cooling unit. When the unit operates at a stable power and circulating water flow rate, the cooling tower can be considered to be operating under a fixed heat load condition, and the temperature drop of the circulating water throughout the cooling tower can be considered to be constant [21,22]. Therefore, increasing the inlet water temperature of the cooling tower can increase the outlet water temperature, thereby preventing the circulating water from freezing due to a too-low temperature in the cooling tower. Setting up a circulating water bypass makes use of this principle. In practice, a circulating water bypass is installed to divert some of the hot circulating water entering the tower. This means that before the hot circulating water enters the cooling tower, a certain proportion is drawn into the bypass, and the rest of the hot circulating water becomes cold circulating water after being cooled in the cooling tower. The temperature of the cold circulating water rises after mixing with the hot circulating water in the bypass, and it enters the next cycle after returning to the condenser.
This paper establishes a three-dimensional numerical model of a wet cooling tower based on a constant heat load method to study the freezing characteristics of the wet cooling tower under different water extraction ratios. The anti-freezing scheme of adopting circulating water bypass carried out and the feasibility of using circulating water bypass for anti-freezing has been investigated.

2. Models and Methods
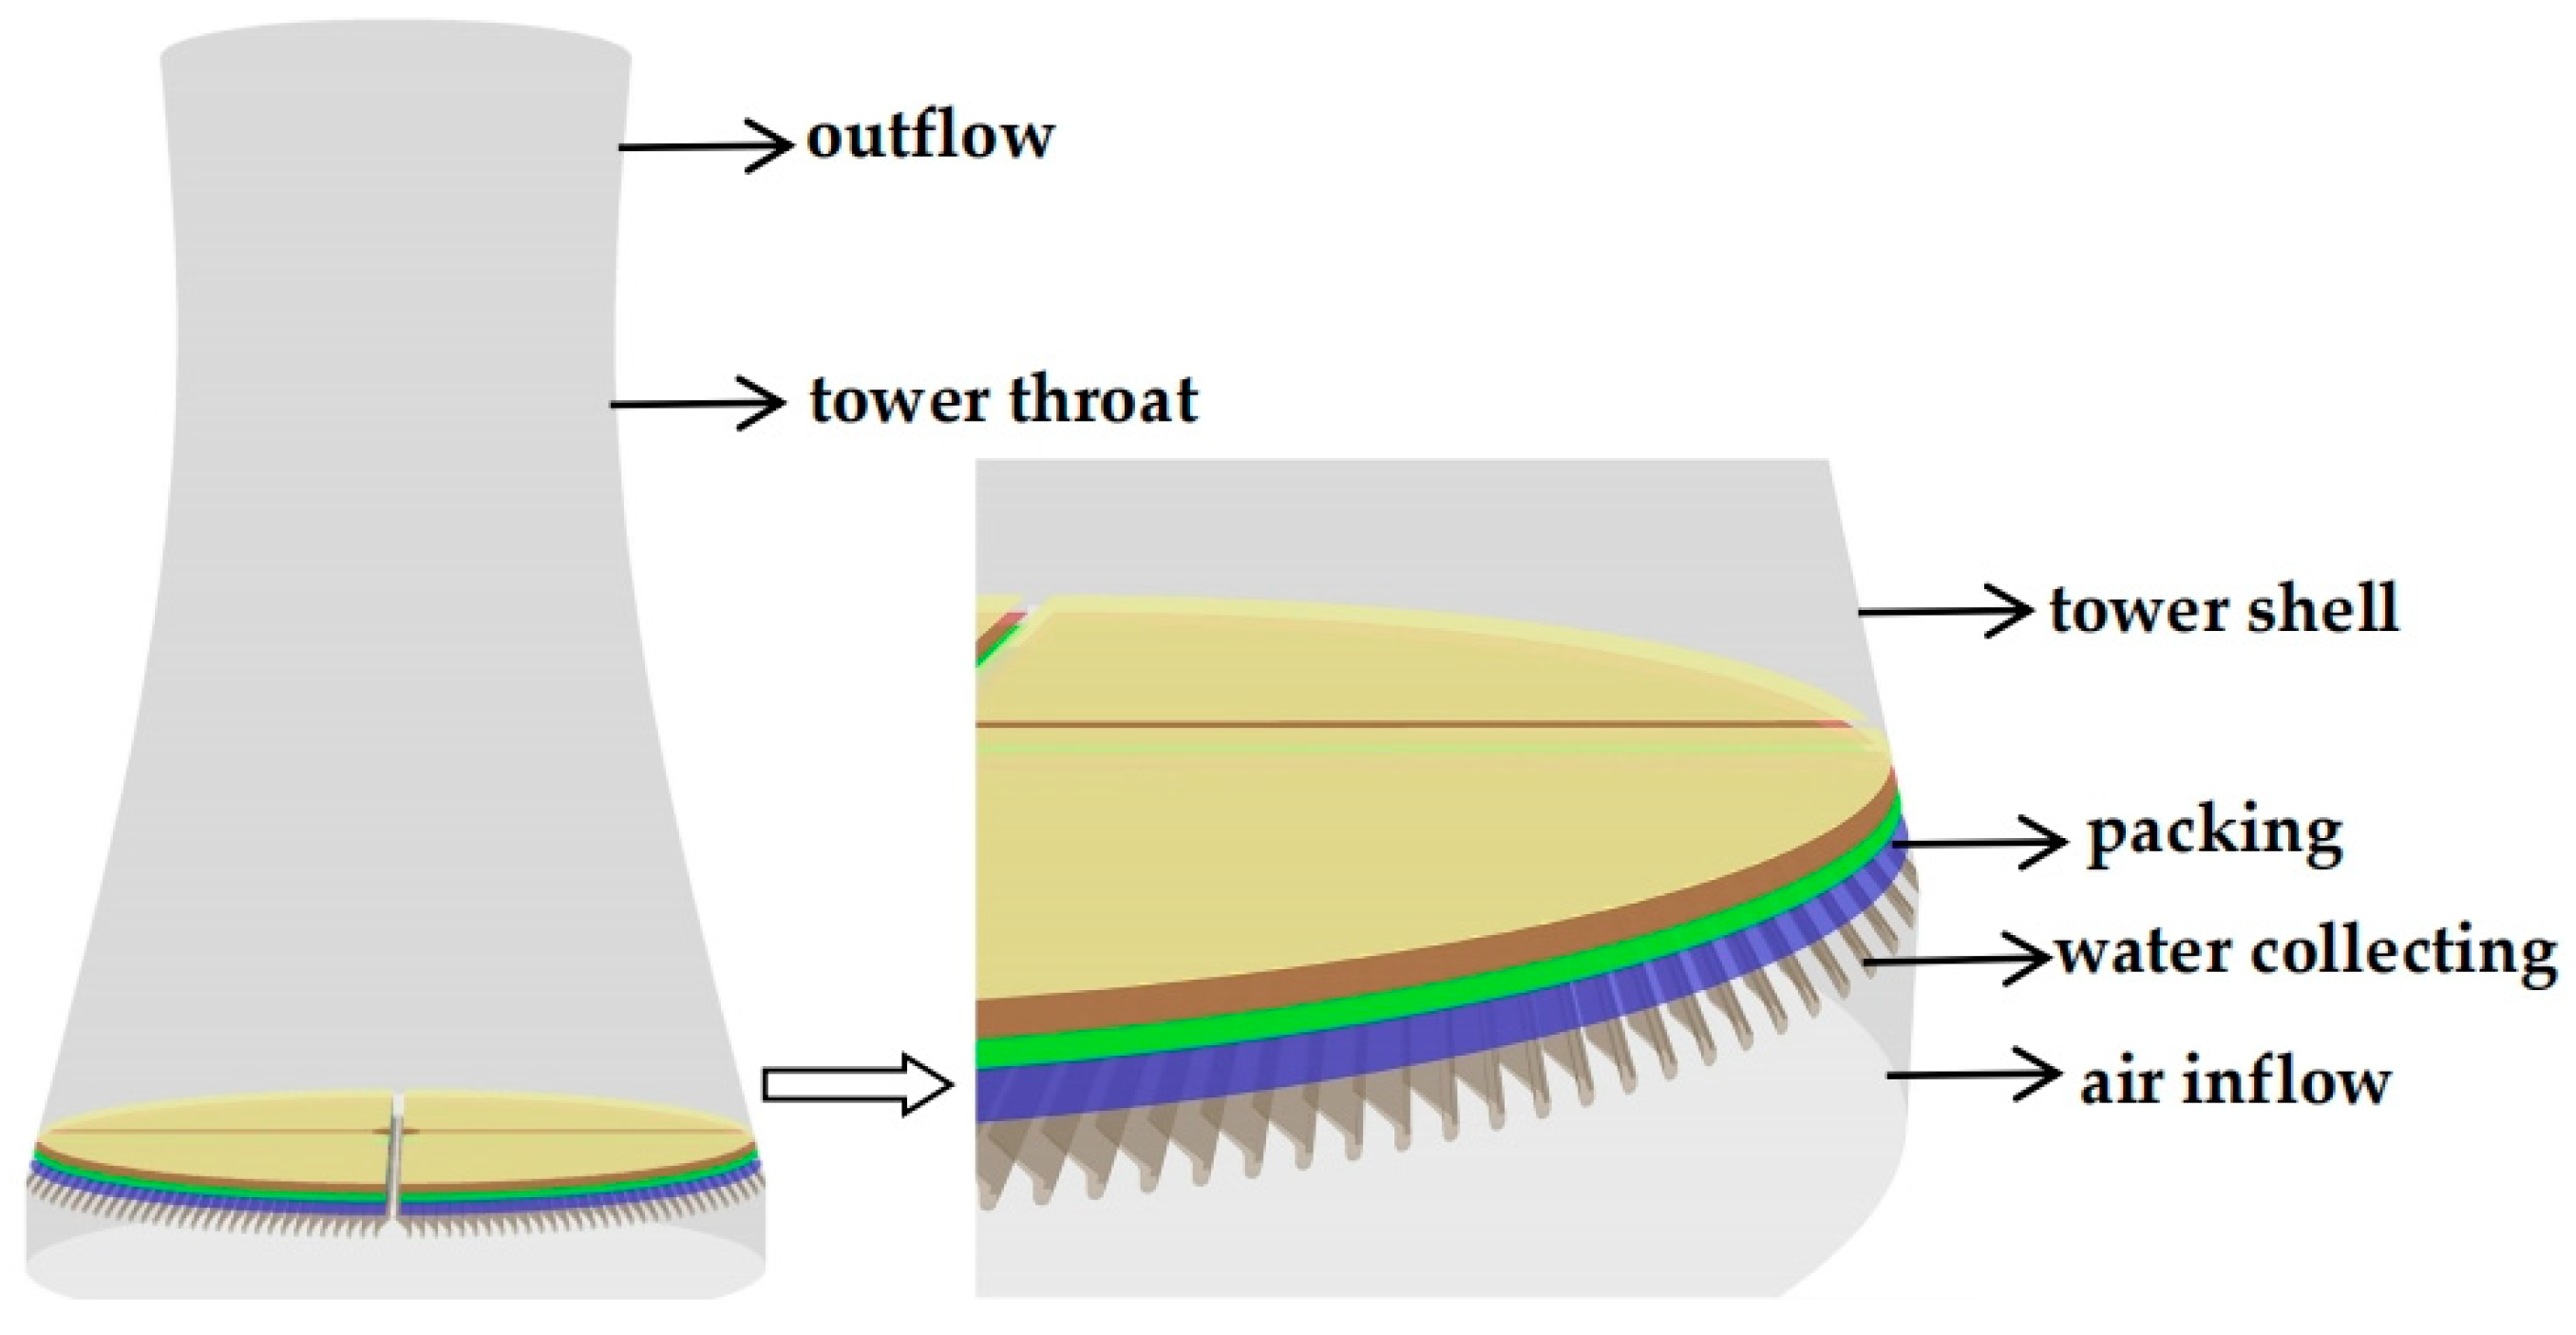
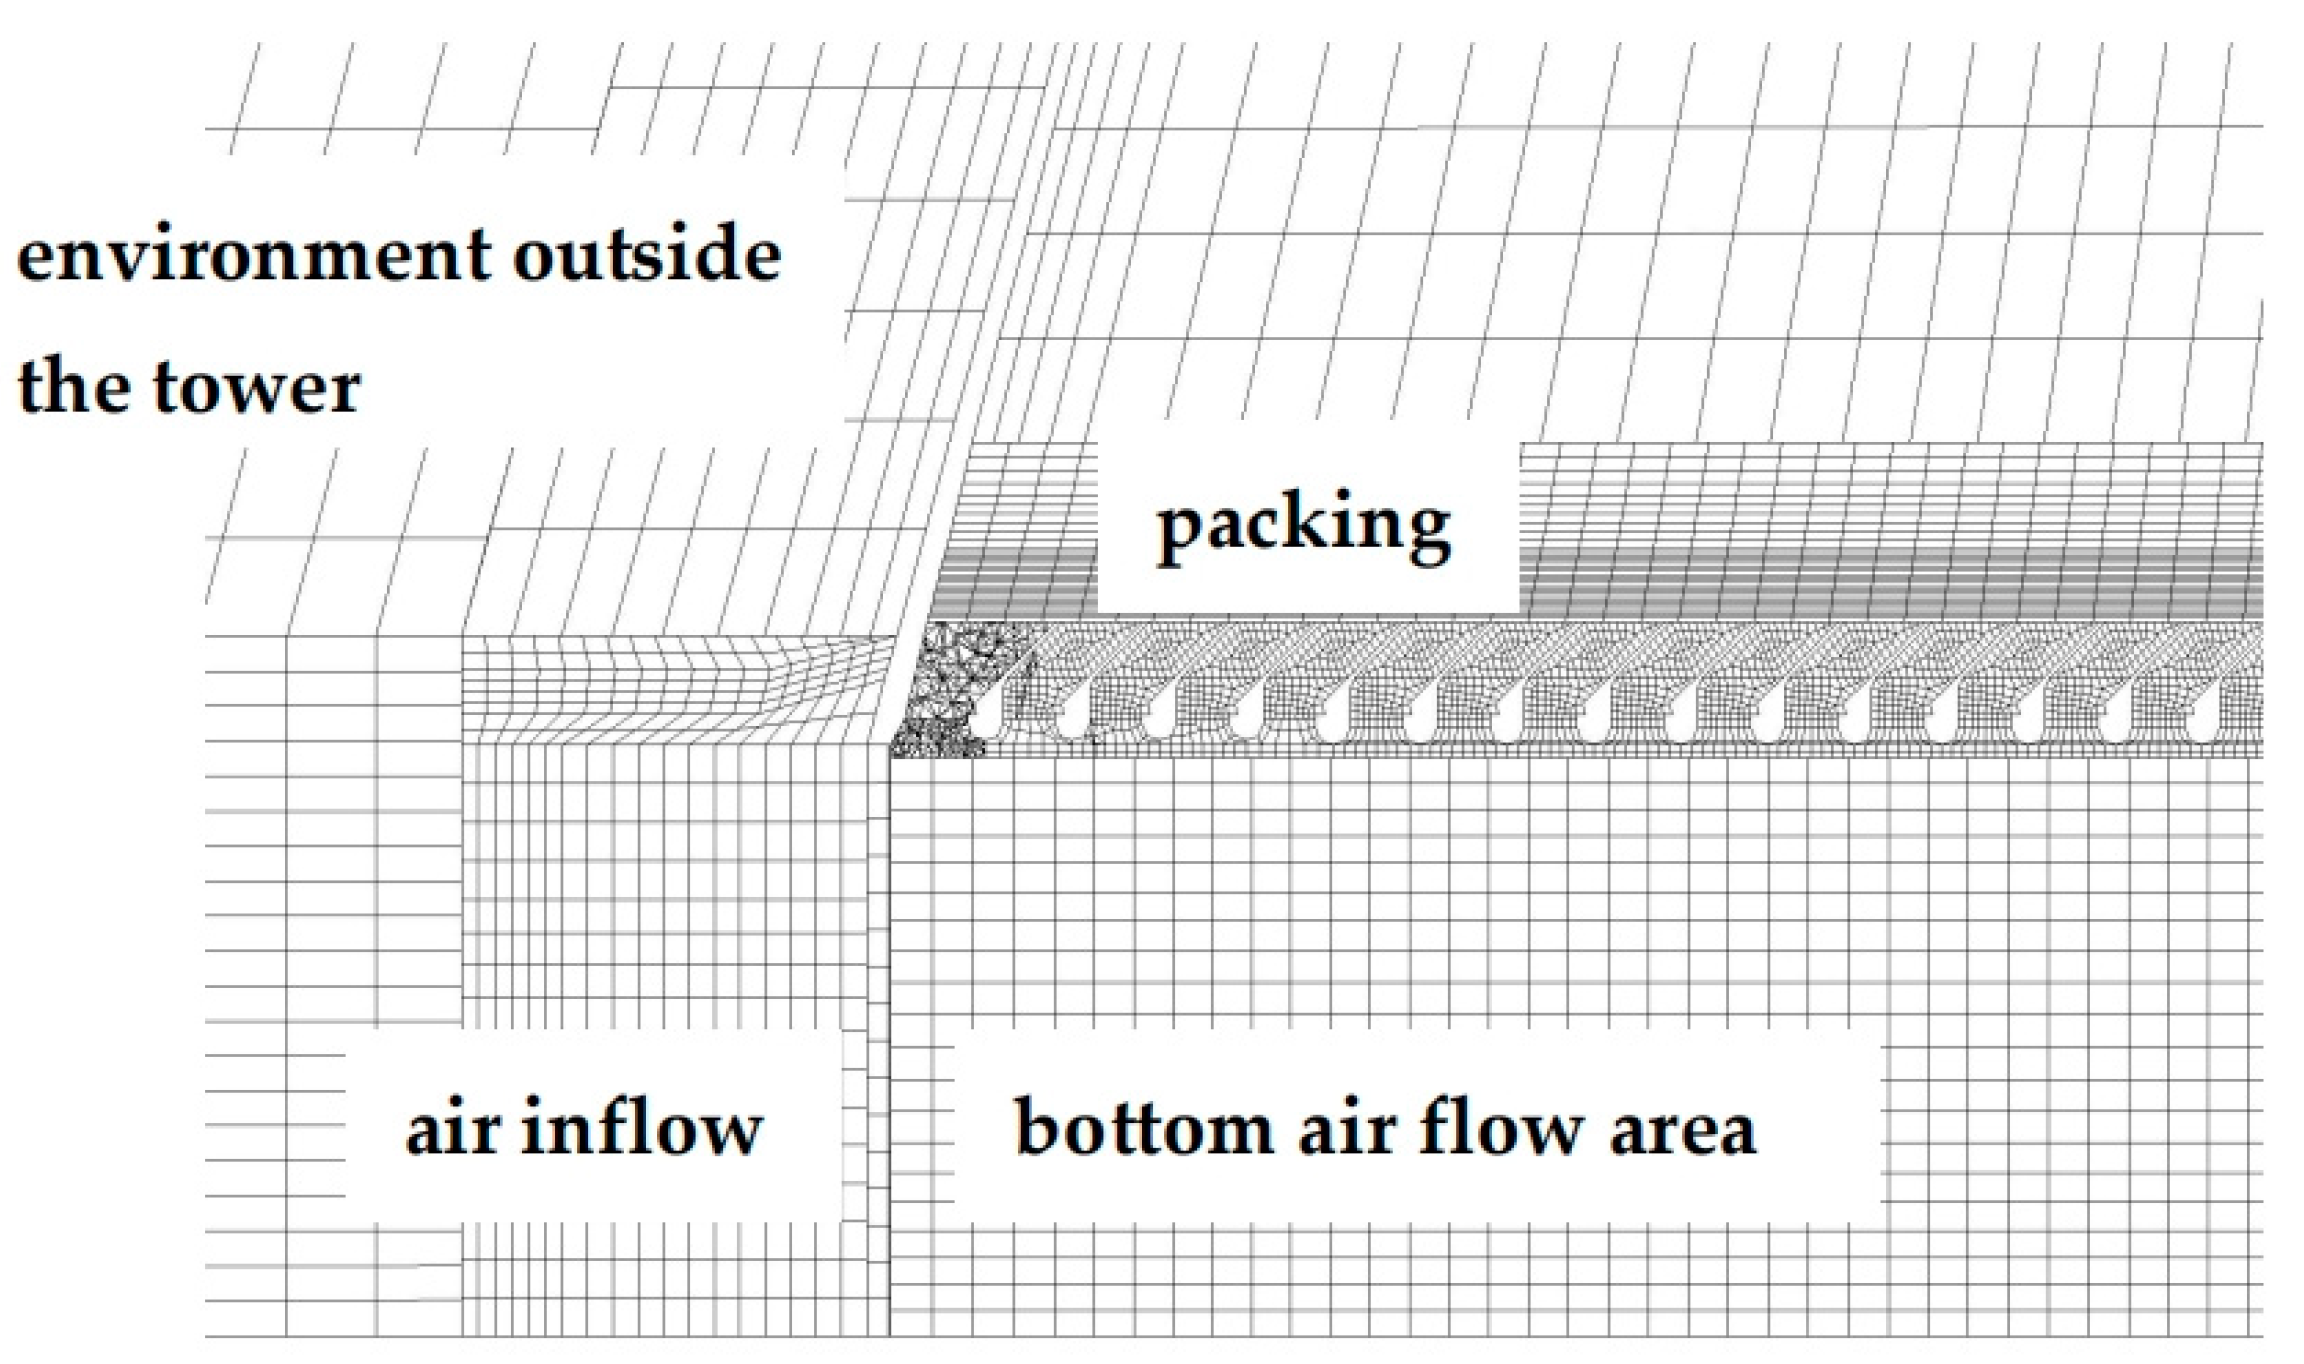
2.1. Model Geometry

This paper established a 1:1 geometry model for a high-level water-collecting, natural draft wet cooling tower with a height of 158.22 m and a packing top radius of 55.07 m. Specific geometric dimensions are detailed in Table 1, and the model schematic is detailed in Figure 1. To ensure that inflow of boundary conditions can fully develop before reaching the cooling tower, the size of the computational domain should be 5 to 10 times the size of the tower [23]. The computational domain is a cylinder with a height of 1000 m and a diameter of 700 m.
The spray area above the packing is composed of water distribution pipes, spray heads, and other devices, whose main function is to atomize the circulating water into droplets. Therefore, the spray area was simplified to a geometric body of the same size, and the equivalent diameter of the droplets in the spray area was determined by a user-defined equation.
Considering that the thickness of the packing is only 1.5 m, and the size of the computational domain reaches over one kilometer, a multi-scale grid division was adopted for different areas to ensure computational accuracy and speed. The packing area, water eliminator area, spray area, rain area, and other major heat and mass transfer areas use small-size grids, with emphasis on refining the grid in the packing area. The tower shell and the large environment outside the tower use large-sized grids, as illustrated in Figure 2.
In order to carry out the grid independence test, three sets of models were built for the research object and computational domain of this paper, and the number of grids was 2.8 million, 3.5 million, and 4.3 million, respectively. The calculation results of the three sets of models under the same working condition are shown in Table 2. It can be seen from the calculation results of the three sets of models that the absolute error was maximum 0.18 °C and minimum 0.16 °C. In order to ensure the accuracy of calculation at the same time, to improve the efficiency of calculation as much as possible, we selected the 3.5 million grid system.

2.2. Numerical Model

2.2.1. Heat and Mass Transfer Model

When the cooling tower is operating with constant parameters, the air inside and outside the tower can be considered to be in a steady-state non-equilibrium condition. The air flow around the cooling tower can be described by the steady-state Reynolds averaged Navier–Stokes equation, as shown in Equation (1) [24]:
ρ u φ Γ φ φ = S φ i + S φ
where ρ is air density, kg/m3, and φ represents a generic variable: in the continuity equation, it is 1; in the momentum equation, it corresponds to the air velocity components ( u x , u y , and u z ); in the energy equation, it stands for air temperature, Ta; in the component equation, it denotes the mass fraction of water. Γ φ and S φ i are the diffusion coefficients and internal sources associated with the generic variable φ , respectively. The source term S φ accounts for the influence of the liquid phase on the gas phase in the momentum, energy, and constituent equations.
The air momentum equation along the z-direction takes into account the cooling tower pumping force, i.e., the air flow dynamics due to the air density difference between the inside and outside of the tower, as shown in Equation (2) [25]:
P z ρ g = P z ( ρ 1 ρ ) g
In the equation, P′ = P − PJ, PJ = P0 ρ g z, P0 is the atmospheric pressure corresponding to a height of 0 m, kPa, ρ 1 is the ambient air density, kg/m3, and ρ is the air density inside the tower, kg/m3.
During the fall of the circulating water, it is assumed that the circulating water only has vertical motion, ignoring its inclined motion. The control equation for its vertical motion is shown in Equation (3) [26]:
d u ω , z d z = ρ w ρ g ρ w u w , z F z m w u w , z
where u ω , z is the vertical velocity of the raindrops, m/s, and the vertical downward is positive. ρ w and m w are the density (kg/m3) and quantity of raindrops (kg), g is the acceleration of gravity, kg/s2, and F z is the air resistance during the falling of the raindrops, N.
In the water distribution area and packing of the wet cooling tower, the circulating water falls in the form of droplets. The discrete phase model was used to describe the mass and energy transfer between the droplets and the air, which is calculated by Equations (4) and (5) [26]:
d q d z = S m
d d z c w T w q = S w e
where q is the water mass flow rate, kg/(m2·s); S m is the mass reduction of water, kg/(m3·s); c w is the specific heat of water, kJ/(kg·°C); T w is the temperature of water, °C; S w e is the energy reduction of circulating water, kW/(m3·s).
For the circulating water falling in the form of water film in the packing, the rate of evaporation of water to air per unit volume, the rate of energy reduction of circulating water per unit volume, and the rate of energy increase of air per unit volume are calculated by Equations (6)–(8) [26]. In addition, water below 0 °C is assumed to be supercooled, so the effect of water freezing can be ignored in this study.
S m = K a ( x w x a )
S w e = K h T w T a + S m r w
S a e = K h T w T a + S m c p v ( T w T a )
where K a is the mass transfer coefficient of packing, kg/(m3·s); x w is the moisture content of saturated moist air, kg/kg; x a is the moisture content of moist air, kg/kg; r w is the evaporation latent heat of water, kJ/kg; K h is the convective heat transfer coefficient of the air–water interface, W/(m3·°C); c p v is the constant-pressure-specific heat, kJ/(kg·°C).
The mixed temperature of circulating water, T m i x , cooled by the wet cooling tower and the bypass circulating water can be calculated according to the law of conservation:
T m i x = D p c w 1 T w 1 + ( D 0 D p ) c w 2 T w 2 D 0 c w 0
where D 0 and D p are the total mass of circulating water and the mass entered in the bypass (kg), and c w 0 , c w 1 , and c w 2 are the specific heat of circulating water under different mixed water temperature, T m i x , inlet temperature, T w 1 , and outlet temperature, T w 2 , respectively. The bypass pipe is typically covered with insulating material. It can be assumed that the circulating water within the bypass is in an adiabatic state; that is, the inlet temperature of the bypass is equal to the outlet water temperature.

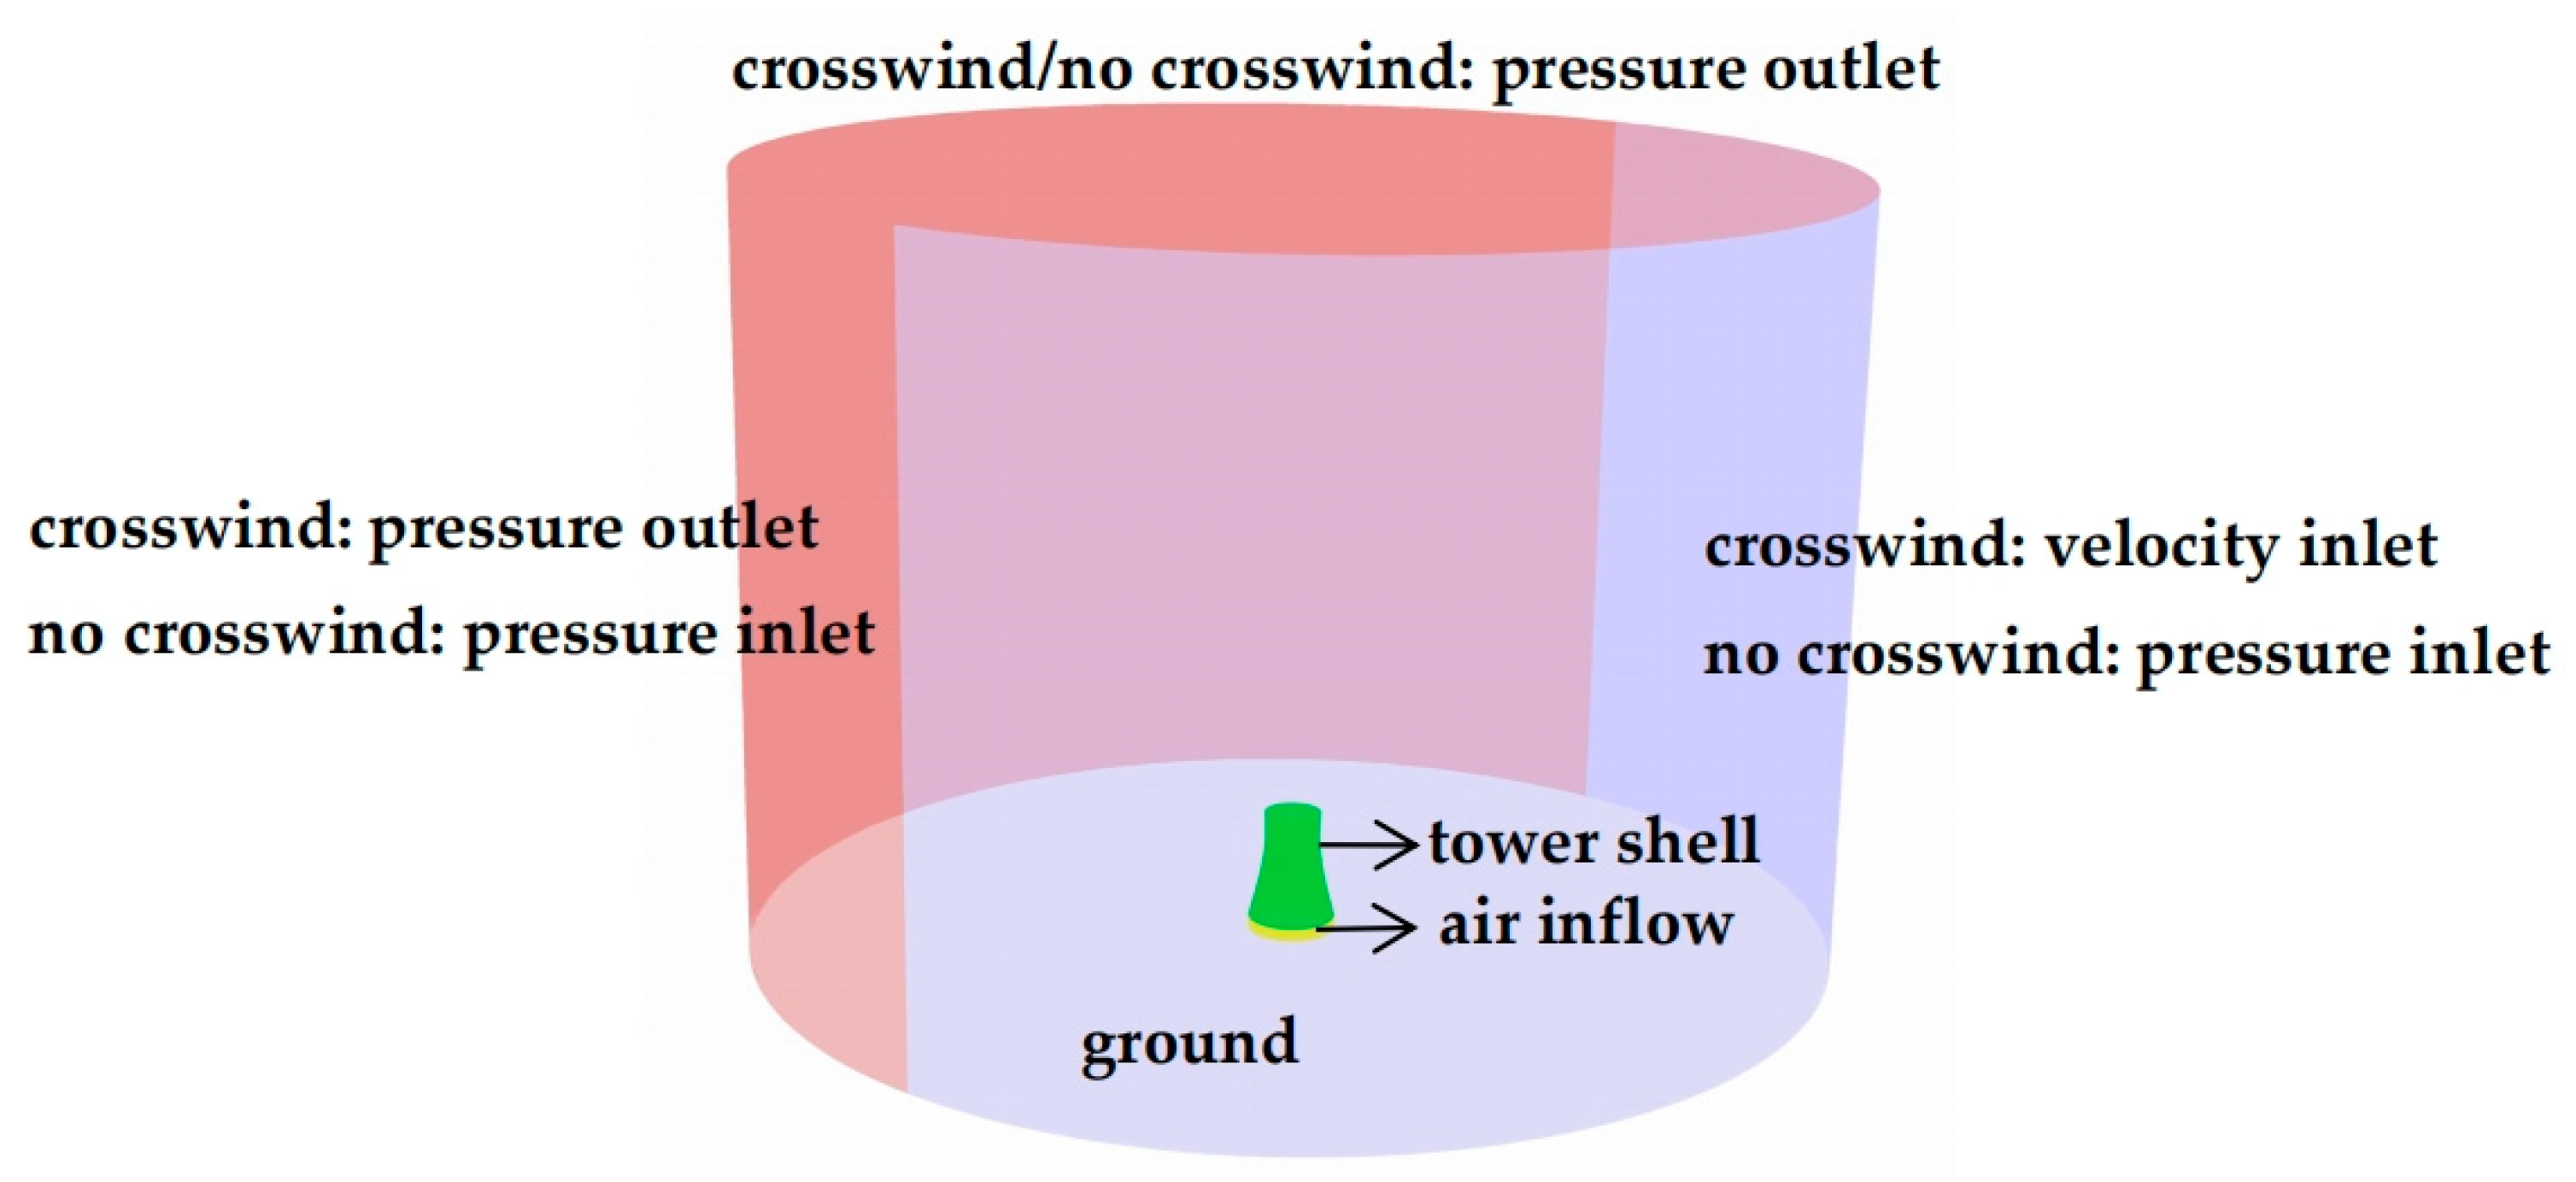
2.2.2. Boundary Conditions and Solution Methods

Under no crosswind conditions, the side of the cylindrical computational domain is set as the pressure inlet, and the top surface is set as the pressure outlet. Under crosswind conditions, the windward cylindrical surface is set as the velocity inlet, the leeward cylindrical surface and the top surface are set as the pressure outlet, and the ground and the cooling tower wall are set as non-slip wall boundary conditions, as illustrated in Figure 3.
The three-dimensional numerical model of the wet cooling tower was solved by the finite volume method to discretize the governing equation. The convection term adopted the second-order upwind scheme, the diffusion term adopted the central difference scheme, the pressure was interpolated by the body force weighted scheme, and the pressure and velocity were solved by the SIMPLE algorithm. When the calculation residual of the control equation was less than 10−4, or the change in bottom water temperature within 200 steps was less than 0.01 °C, the calculation was considered to be convergent.
The numerical model was validated under two operating conditions. The data of the operating conditions were from field tests. The field test condition (C1) and the design condition (C2) were each selected to verify the accuracy of the three-dimensional numerical model developed in this paper. Among them, C1 data were obtained from the monitoring system of the cooling tower operating power plant, and C2 data were obtained from the cooling tower design specification. Table 3 shows the calculation results under the two working conditions. Under the C1 working condition, the error between the calculation results and the test results of the outlet water temperature was 0.14 °C. The error between the calculation results and the design results of the outlet water temperature under the C2 working condition was 0.11 °C. These results showed that the high-level water-collecting, natural draft wet cooling tower model established in this paper is accurate. The three-dimensional numerical tower model can accurately describe the heat and mass transfer process inside the cooling tower.

3. Results and Discussion

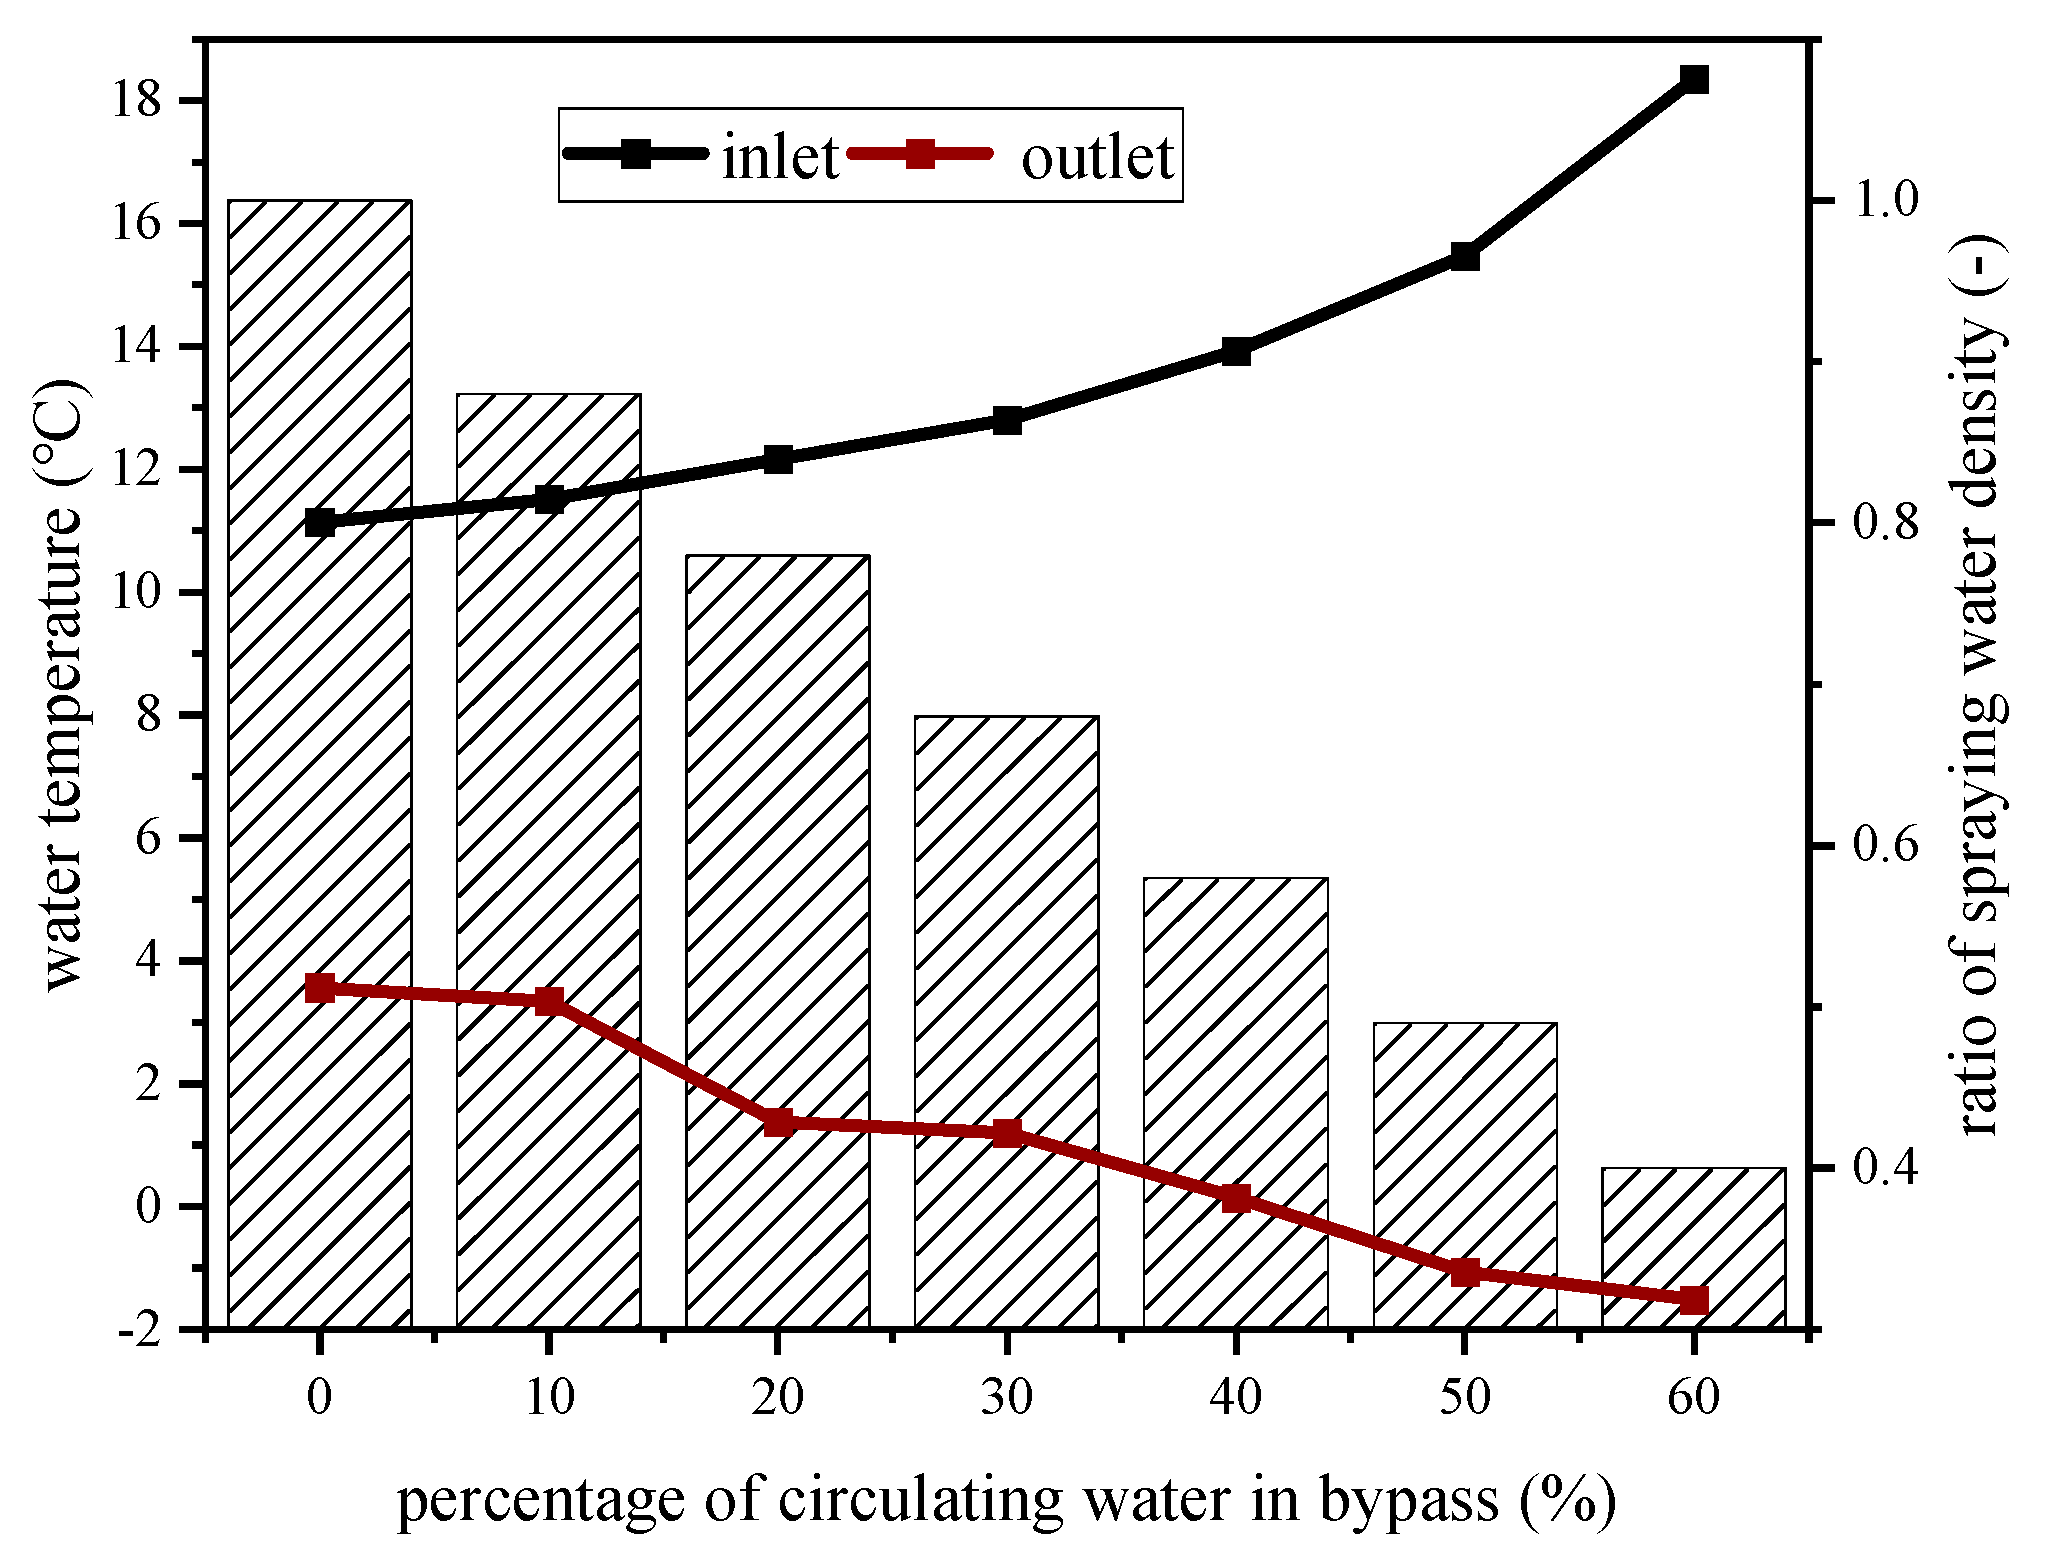
3.1. Impact of Water Bypass Percentage on the Cooling Performance

In this paper, a numerical simulation of the wet cooling tower was carried out under the conditions of an ambient temperature of −5 °C and an ambient wind speed of 0 m/s, with the unit operating at 50% load and using an outer ring water distribution method. When 100% circulating water entered the wet cooling tower, the water density in the packing area was 0.97 kg/(m2·s), the outlet water temperature was 3.56 °C, and the temperature drop of the circulating water in the wet cooling tower was 7.58 °C. A schematic illustration of the circulating water bypass design is shown in Figure 4. The water that circulates from the condenser outlet was divided into two parts. One part goes through the upper water pipeline into the central well of the cooling tower, where it is sprayed onto the packing for cooling. Finally, it is collected in the water collection sinks. The other part of the water goes directly into the water collection sinks without undergoing any cooling or heat exchange through the bypass. The two water components mentioned above are mixed in the water collection sinks and then re-enter the condenser for the next cycle through the cooling tower return piping. The arrows in the diagram indicate the direction of movement of the circulating water.
As shown in Figure 5, as the percentage of circulating water in the bypass increased from 0% to 60%, the amount of circulating water entering the wet cooling tower decreased. However, at a constant unit load, the turbine exhaust temperature and exhaust volume remained unchanged, so the heat absorbed by the circulating water in the condenser remained constant, and the heat that the cooling tower needs to take away was constant. Therefore, as the percentage of water in the bypass increased, the inlet water temperature in the wet cooling unit gradually increased from 11.40 °C to 18.35 °C. The water density in the packing area gradually decreased from 0.97 kg/(m2·s) to 0.39 kg/(m2·s), and the cooling tower outlet water temperature decreased from 3.56 °C to −1.51 °C. When the percentage of circulating water in the bypass reached 40%, the outlet water temperature was only 0.15 °C, and there was a risk of freezing throughout the entire wet cooling tower.
The water temperature distribution at the bottom of the packing for different percentages of bypass water is shown in Figure 6, and the pressure distribution in the cooling tower profile for different percentages of bypass water is shown in Figure 7. Overall, Figure 6 and Figure 7 show that the temperature field and pressure field in the cooling tower were symmetrically distributed in the absence of ambient wind. As the percentage of bypass water increased, the percentage of water entering the cooling tower decreased, the pressure value at the same point in the tower decreased, and the pressure difference between the inside and outside of the tower decreased. This means that the pumping force of the cooling tower, which is formed by the density of the air inside and outside the tower, was weakened, which is confirmed by the statistical results of the cooling tower air mass flow rate at different bypass water percentages, as shown in Table 4.

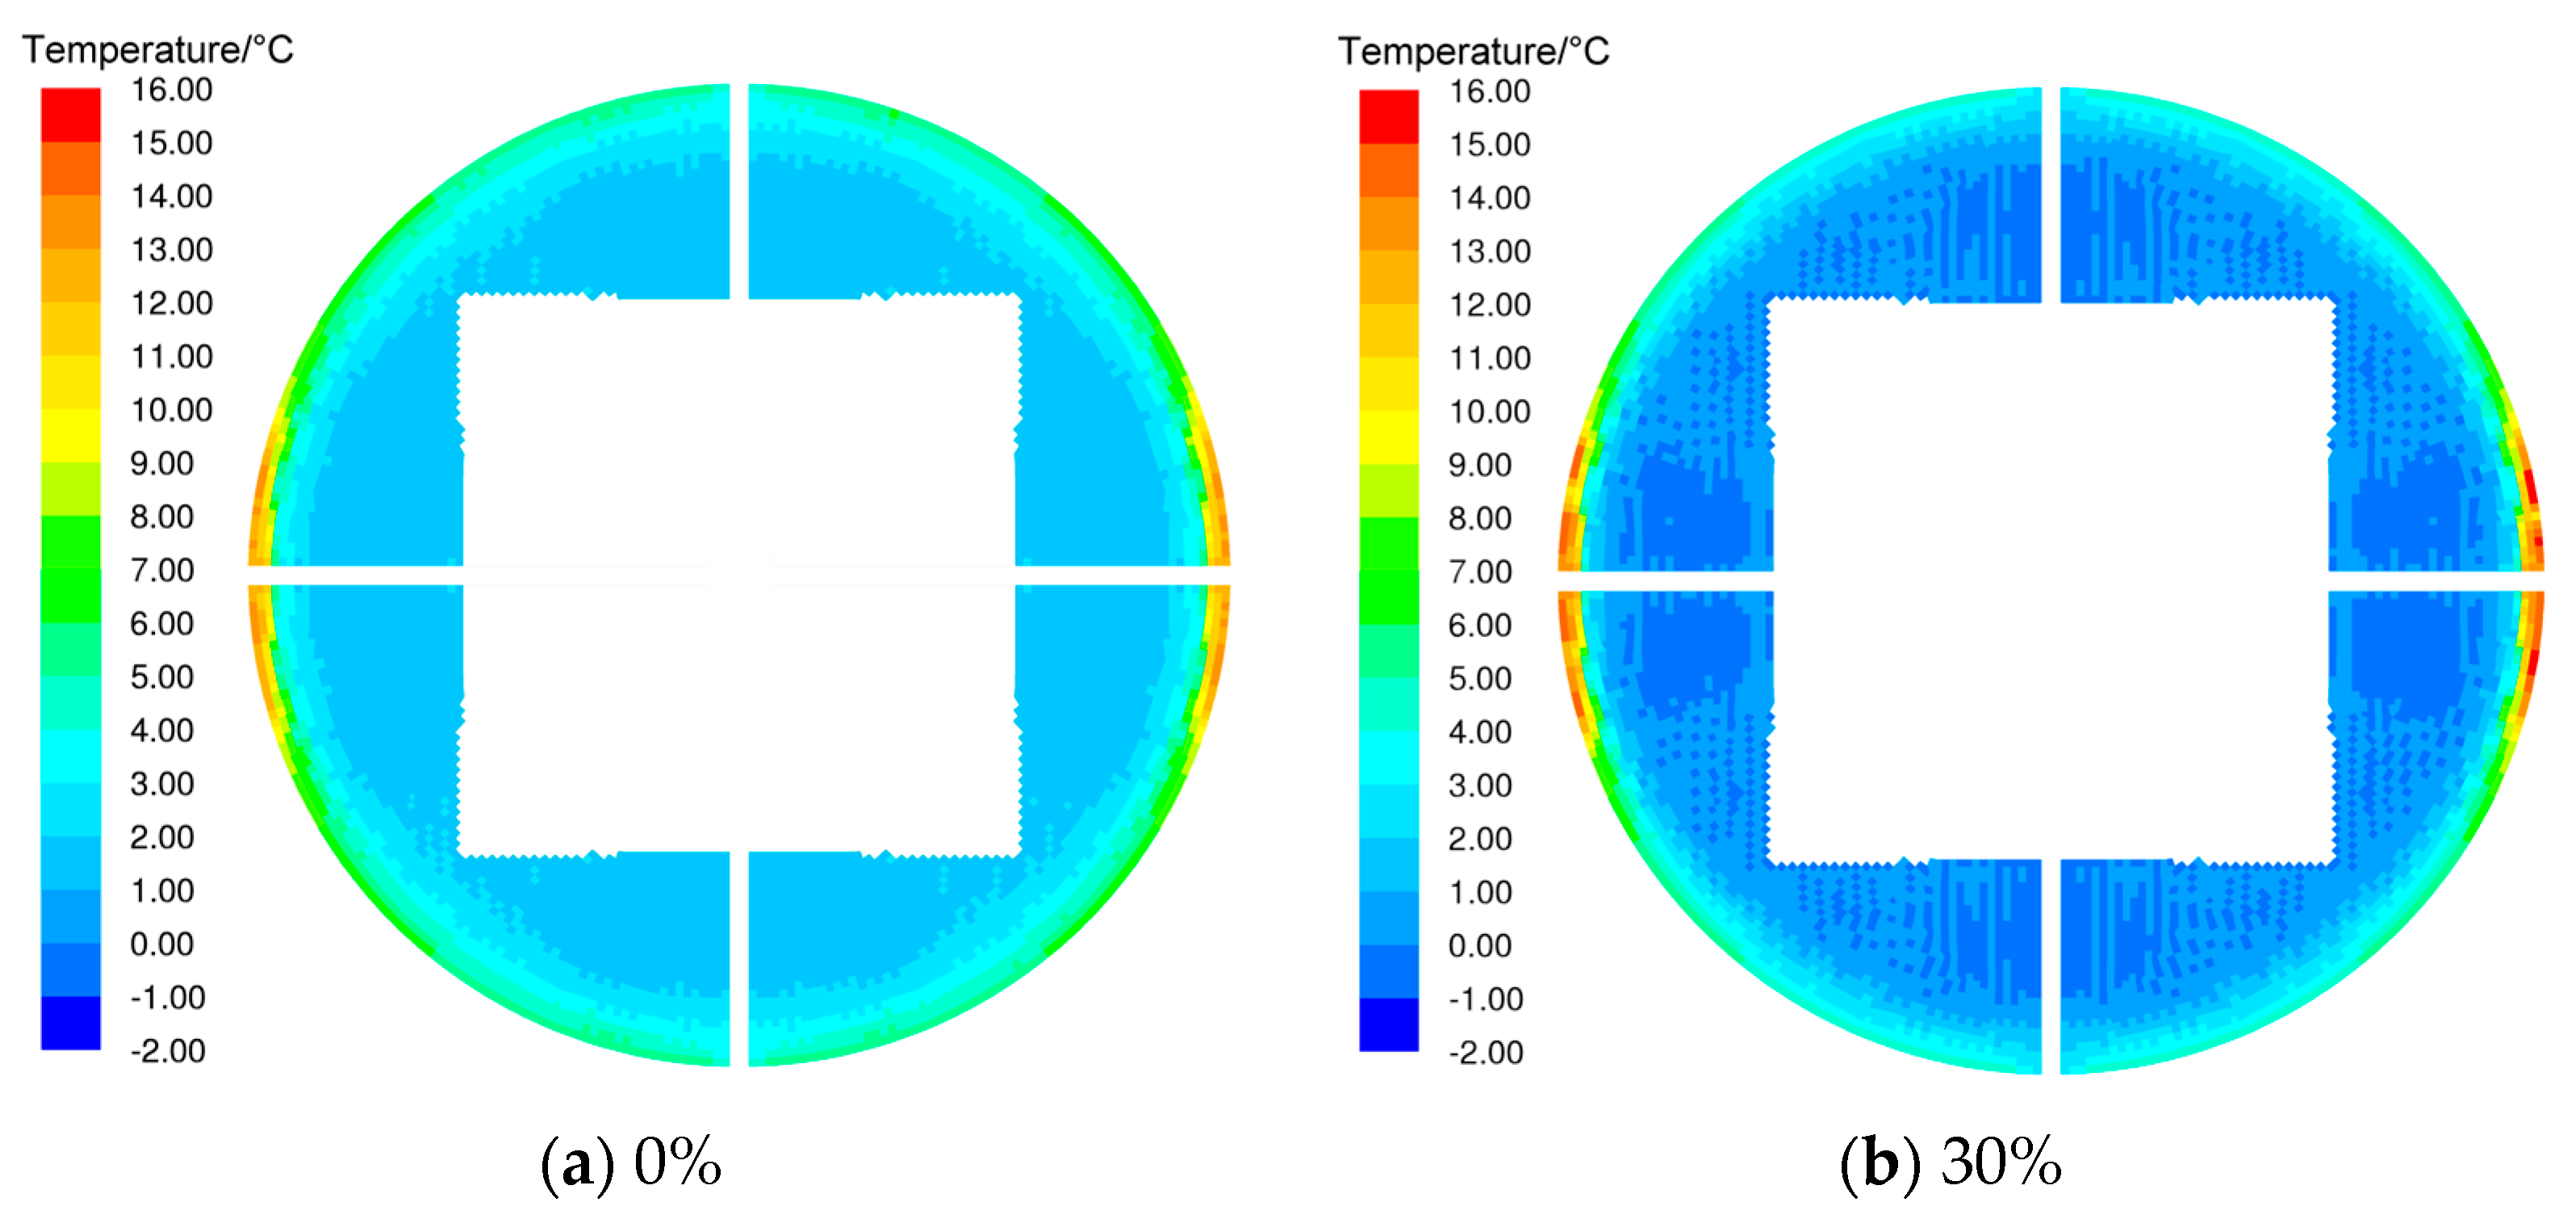
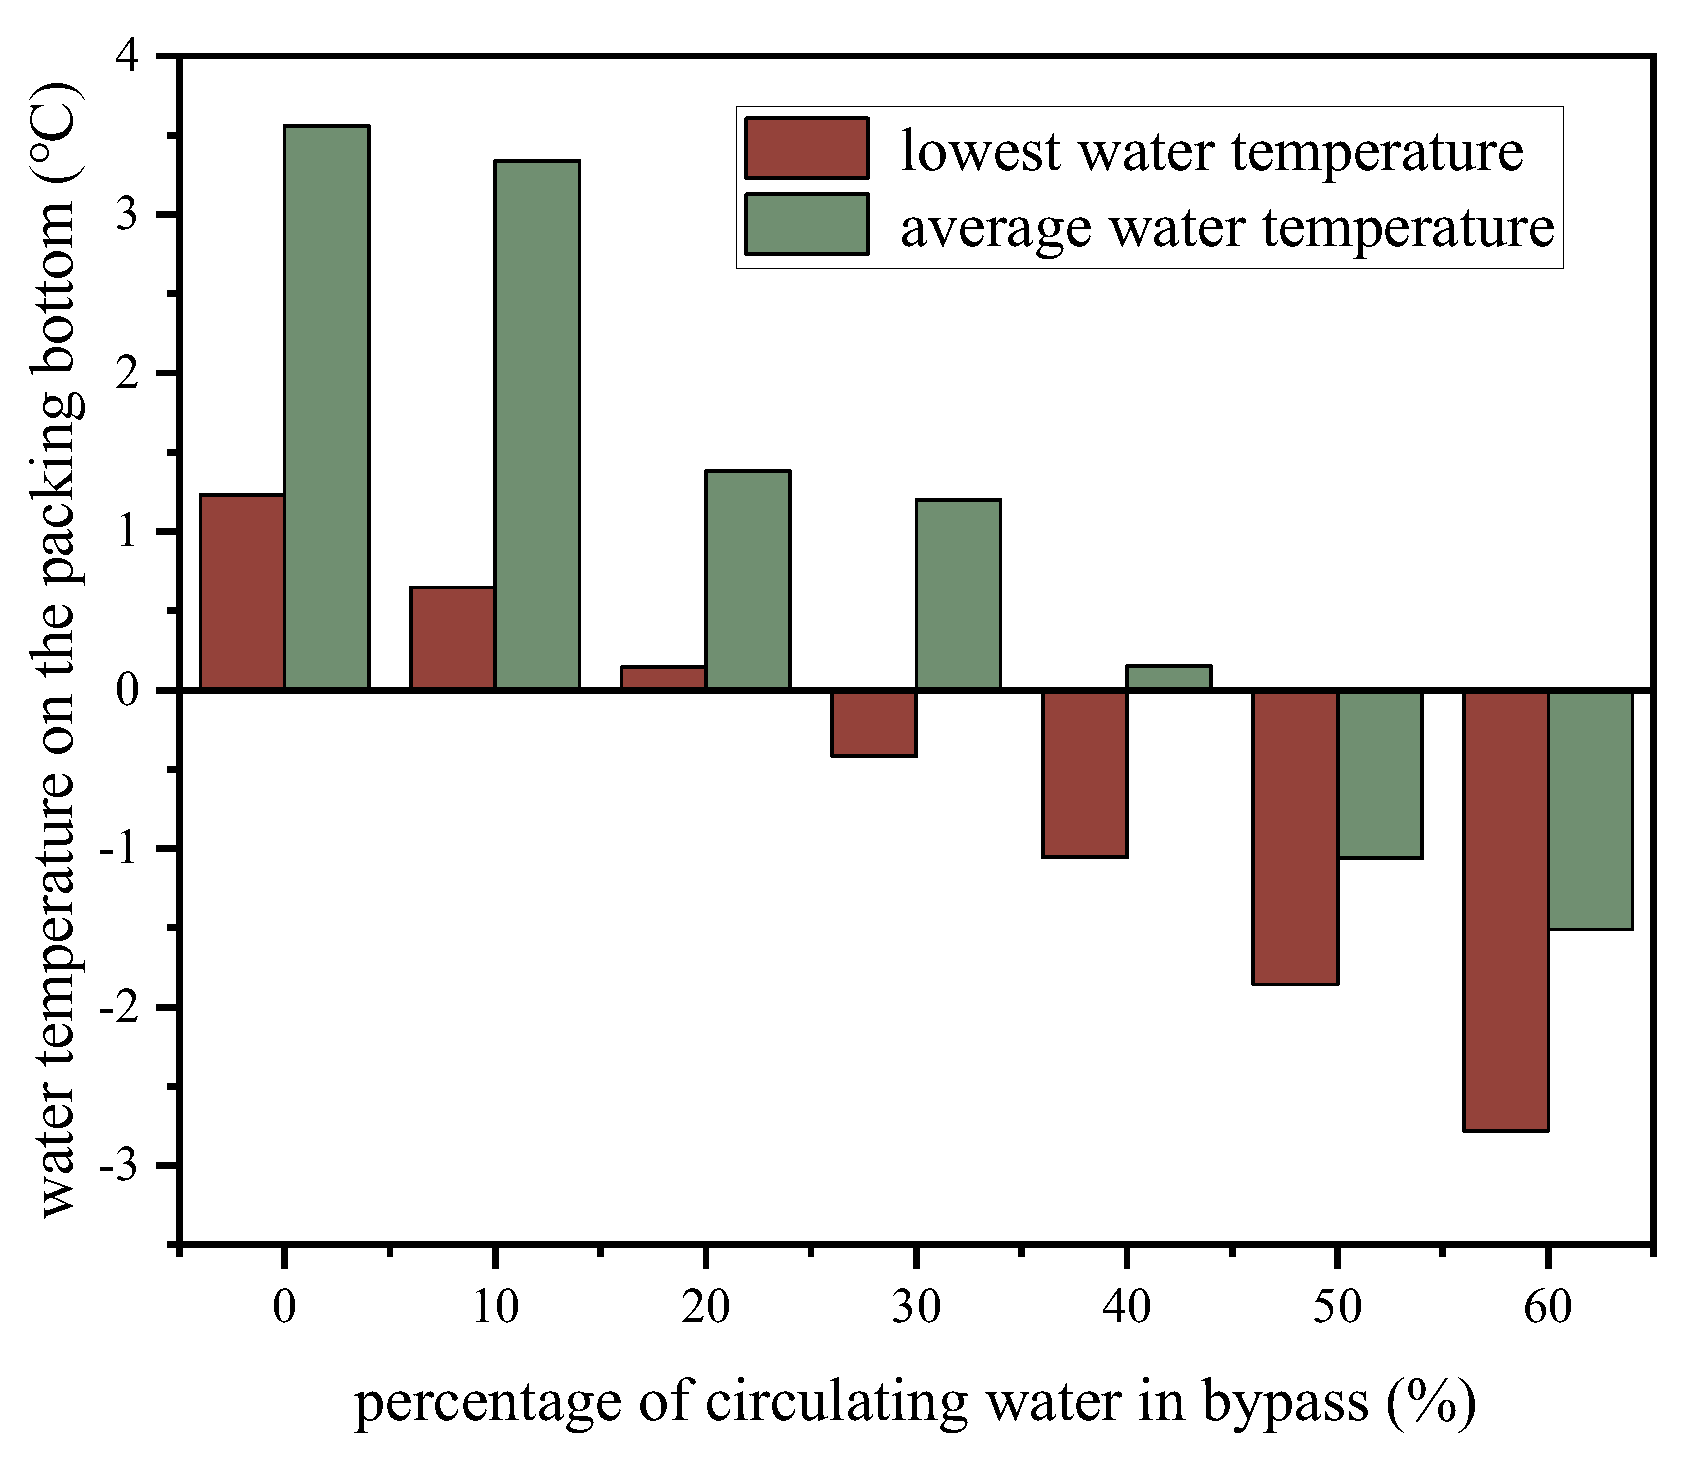
3.2. Impact of Water Bypass Percentage on the Anti-Freezing Characteristics

The packing is the main heat and mass transfer area in the wet cooling tower, and the packing bottom is the first to come into contact with cold air. Therefore, in this paper, the packing bottom was selected as the key surface to analyze the effect of the bypass on the anti-freezing performance of the wet cooling tower. As shown in Figure 8, when the percentage of circulating water entering the bypass was 0%, the average water temperature at the packing bottom was 3.56 °C, and the lowest water temperature at the packing bottom was 1.23 °C. As the percentage of circulating water in the bypass gradually increased, both the average water temperature and the lowest water temperature at the packing bottom showed a clear downward trend.
When 20% of the circulating water entered the bypass, the lowest water temperature at the packing bottom was only 0.14 °C, indicating a very high risk of freezing. When the circulating water in the bypass was 30%, the lowest water temperature at the bottom of the packing reached −0.42 °C, indicating that icing occurred at the packing bottom. At 50%, the average water temperature at the bottom of the packing was −1.06 °C, which means that a large area of freezing occurred at the packing bottom; thus, the cooling performance and safe operation of the wet cooling tower and the wet cooling unit were severely threatened.
The water from the circulating water bypass was mixed with the water cooled by the cooling tower and entered the condenser. As shown in Table 5, the higher the proportion of water pumped into the bypass, the higher the temperature of the mixed water and the higher the temperature drop of the circulating water in the cooling tower. However, when the percentage of circulating water in the bypass was 20%, the mixed water temperature was 3.54 °C, which is lower than the 3.56 °C temperature when there was no circulating water in the bypass. This is because when the percentage of circulating water in the bypass increased from 0% to 20%, the water temperature in the bypass increased from 11.14 °C to 12.16 °C, with an increase of 1.02 °C. However, the outlet temperature of the wet cooling tower decreased from 3.56 °C to 1.38 °C, with a drop of 2.18 °C. Therefore, the mixing temperature of the 20% water in the bypass was lower than that when there was no circulating water in the bypass.
If the bottom of the packing is to be controlled to avoid the risk of freezing, the percentage of bypass should not exceed 10%. At this time, the lowest temperature of the bottom of the packing should be between 1.23 and 0.65 °C, and the average temperature of the water at the bottom of the packing should be between 3.56 and 3.34 °C. As for the cooling of the water after mixing, the water temperature should not drop below 4.16 °C in the condenser to avoid the water temperature at the bottom of the filler becoming too cold.

4. Conclusions

In this paper, a three-dimensional numerical model based on a constant heat load was established for a high-level, natural draft wet cooling tower. The effects of different percentages of circulating water entering the bypass on the cooling performance and anti-freezing characteristics of the wet cooling tower were explored.
The results showed that when the unit load was constant, as the percentage of circulating water in the bypass increased, the inlet water temperature of the wet cooling tower increased from 11.14 °C to 18.35 °C, but the outlet water temperature decreased from 3.56 °C to −1.51 °C. The temperature of the water outside of the tower decreased, and the temperature drop of the circulating water increased, but the pressure difference between the inside and outside of the tower decreased, which means that the pumping force of the cooling tower decreased and, consequently, the air mass flow in the tower decreased.
However, with the increase of the percentage of circulating water in the bypass, the water spray density in the packing decreased, leading to the decrease of the average water temperature at the packing bottom from 3.56 °C to −1.51 °C, and the decrease of the lowest water temperature from 1.23 °C to −2.78 °C. When the percentage was 30%, the lowest water temperature at the packing bottom reached −0.42 °C, indicating that there was a great local freezing risk at the packing bottom. If the bottom of the packing is to be controlled to avoid the risk of freezing, the percentage of bypass water should not exceed 10% in the maximum reduction of the water temperature in the condenser to avoid the water temperature at the bottom of the filler becoming too cold.

Author Contributions

Conceptualization, Z.W.; methodology, Z.Y. and W.W.; software, C.M. and C.G.; validation, X.L.; formal analysis, Z.W.; investigation, Z.Y.; resources, W.W.; data curation, W.W.; writing—original draft preparation, Z.W. and X.L.; writing—review and editing, X.L. and Y.Z.; visualization, Z.Y. and C.M.; supervision, Y.Z.; project administration, Z.W.; funding acquisition, Z.W. and Y.Z. All authors have read and agreed to the published version of the manuscript.

Funding

This research was funded by both the Science and Technology Innovation Capability Improvement Project of Medium-sized Enterprises in Shandong Province (2022TSGC1026) and the Sci-Tech Project of China Huaneng Group Co., Ltd., China (HNKJ22-HF107).

Data Availability Statement

All results data are displayed in the article.

Conflicts of Interest

Authors Zhonghua Wang, Zenggang Yue, Wei Wang, Chenghui Ma, were employed by the company Jining Huayuan Thermal Power Co., Ltd. Authors Xiaoguang Li, Changmin Guo were employed by the company Ji’nan Lanchen Energy Technology Co. The remaining authors declare that the research was conducted in the absence of any commercial or financial relationships that could be construed as a potential conflict of interest.

References

  1. Lu, H.; Huang, S.; Li, H.; Cheng, Z.; Chang, X.; Dong, L.; Kong, D.; Jing, X. Numerical Simulation of Combustion Characteristics in a 660 MW Tangentially Fired Pulverized Coal Boiler Subjected to Peak-Load Regulation. Case Stud. Therm. Eng. 2023, 49, 103168. [Google Scholar] [CrossRef]
  2. Ezhov, V.; Zakharov, A.; Ezhova, T.; Kravchenko, S.; Amelin, V. Features of Calculation Technique of the Cooling Tower in the Winter Period Taking into Account the Desigh of the Head Wall. IOP Conf. Ser. Mater. Sci. Eng. 2020, 1001, 012066. [Google Scholar] [CrossRef]
  3. Ma, L.; Ren, J. The Influence and Analysis of Natural Crosswind on Cooling Characteristics of the High Level Water Collecting Natural Draft Wet Cooling Tower. In Proceedings of the 2017 3rd International Conference on Environmental Science and Material Application (ESMA2017), Singapore, 28–30 July 2017; IoP Publishing: Bristol, UK, 2018; Volume 108, p. 052116. [Google Scholar]
  4. Goshayshi, H.R.; Missenden, J.F. The Investigation of Cooling Tower Packing in Various Arrangements. Appl. Therm. Eng. 2000, 20, 69–80. [Google Scholar] [CrossRef]
  5. Shahali, P.; Rahmati, M.; Alavi, S.R.; Sedaghat, A. Experimental Study on Improving Operating Conditions of Wet Cooling Towers Using Various Rib Numbers of Packing. Int. J. Refrig. 2016, 65, 80–91. [Google Scholar] [CrossRef]
  6. Yang, J.; Gao, M.; Wang, M.; Wang, W.; He, S.; Jiang, G.; Sun, G. Synergistic Optimization of Partition Water Distribution, Non-Equidistant Fillings and Dry-Wet Hybrid Rain Zone for Wet Cooling Towers. Appl. Therm. Eng. 2023, 231, 120940. [Google Scholar] [CrossRef]
  7. Gilani, N.; Parpanji, F. Parametric Study on the Outlet Water Temperature in a Shower Cooling Tower and Its Application in Different Iranian Provincial Capitals. Int. J. Therm. Sci. 2018, 124, 174–186. [Google Scholar] [CrossRef]
  8. Al-Waked, R.; Behnia, M. Enhancing Performance of Wet Cooling Towers. Energy Convers. Manag. 2007, 48, 2638–2648. [Google Scholar] [CrossRef]
  9. Chen, Y.L.; Shi, Y.F.; Hao, J.G.; Chang, H.; Sun, F.Z. Crosswinds Effect on the Thermal Performance of Wet Cooling Towers Under Variable Operating Conditions. In Proceedings of the 2017 International Conference on Power and Energy Engineering, Ottawa, ON, Canada, 13–15 September 2017; IOP Conference Series: Earth and Environmental Science. IOP Publishing: Bristol, UK, 2018; Volume 114, p. 012007. [Google Scholar]
  10. Chen, G.; Zhao, Y.; Li, W.; Ge, W. The Efficiency of High-Level Water Collecting Cooling Tower with the Installation of Cross Wall Affect by the Evolution of Aerodynamic Field. Appl. Therm. Eng. 2019, 161, 114181. [Google Scholar] [CrossRef]
  11. Zhao, S.-A.; Wang, M.-R.; Li, L.-J.; Du, C.-Q. Effect of Cross Wind on Performances of Natural Draft Counterflow Cooling Tower Outlet. Heat Transf. Eng. 2017, 38, 1108–1116. [Google Scholar] [CrossRef]
  12. Mondal, P.K.; Mukherjee, S.; Kundu, B.; Wongwises, S. Investigation of the Crosswind-Influenced Thermal Performance of a Natural Draft Counterflow Cooling Tower. Int. J. Heat Mass Transf. 2015, 85, 1049–1057. [Google Scholar] [CrossRef]
  13. Alavi, S.R.; Rahmati, M. Experimental Investigation on Thermal Performance of Natural Draft Wet Cooling Towers Employing an Innovative Wind-Creator Setup. Energy Conv. Manag. 2016, 122, 504–514. [Google Scholar] [CrossRef]
  14. Rahmati, M.; Alavi, S.R.; Sedaghat, A. Thermal Performance of Natural Draft Wet Cooling Towers under Cross-Wind Conditions Based on Experimental Data and Regression Analysis. In Proceedings of the 2016 6th Conference on Thermal Power Plants (CTPP), Tehran, Iran, 19–20 January 2016; IEEE: New York, NY, USA, 2016; pp. 1–5. [Google Scholar]
  15. Al-Waked, R. Crosswinds Effect on the Performance of Natural Draft Wet Cooling Towers. Int. J. Therm. Sci. 2010, 49, 218–224. [Google Scholar] [CrossRef]
  16. Sharifullin, V.N.; Badriev, A.I. Aerodynamic Characteristics of the Cooling Tower under the Nonuniform Distribution of the Water and Air Flows. Therm. Eng. 2019, 66, 569–574. [Google Scholar] [CrossRef]
  17. Williamson, N.; Armfield, S.; Behnia, M. Numerical Simulation of Flow in a Natural Draft Wet Cooling Tower—The Effect of Radial Thermofluid Fields. Appl. Therm. Eng. 2008, 28, 178–189. [Google Scholar] [CrossRef]
  18. Li, H.-W.; Duan, W.-B.; Wang, S.-B.; Zhang, X.-L.; Sun, B.; Hong, W.-P. Numerical Simulation Study on Different Spray Rates of Three-Area Water Distribution in Wet Cooling Tower of Fossil-Fuel Power Station. Appl. Therm. Eng. 2018, 130, 1558–1567. [Google Scholar] [CrossRef]
  19. Zhang, D.; Zhang, Z.; Han, Q.; Wu, F.; He, S.; Gao, M. Numerical Simulation on Synergetic Optimization of Non-Equidistant Fillings and Non-Uniform Water Distribution for Wet Cooling Towers. Int. J. Heat Mass Transf. 2021, 179, 121676. [Google Scholar] [CrossRef]
  20. Li, J.-Y.; Wang, H.; Chen, Z.-C.; Sheng, W. The full model numerical simulation of super large-scale cooling tower for partition water distribution system. J. Eng. Thermophys. 2016, 37, 1888–1894. (In Chinese) [Google Scholar]
  21. Dong, H.; Wan, D.; Liu, M.; Chen, T.; Gao, S.; Zhao, Y. Evaluation of the Hot Air Recirculation Effect and Relevant Empirical Formulae Applicability for Mechanical Draft Wet Cooling Towers. Energies 2020, 13, 3347. [Google Scholar] [CrossRef]
  22. Zhao, Y.; Sun, F.; Li, Y.; Long, G.; Yang, Z. Numerical Study on the Cooling Performance of Natural Draft Dry Cooling Tower with Vertical Delta Radiators under Constant Heat Load. Appl. Energy 2015, 149, 225–237. [Google Scholar] [CrossRef]
  23. Wang, Z.; Yue, Z.; Wang, W.; Ma, C.; Li, X.; Guo, C.; Zhao, Y. Anti-Freezing Study of High-Level Water-Collecting Natural Draft Wet-Cooling Tower Based on Its Water Temperature Distribution Characteristics. Energies 2024, 17, 651. [Google Scholar] [CrossRef]
  24. Zheng, S.; Jin, T.; Fan, J. Numerical Study of Natural Draft Wet Cooling Tower. In Proceedings of the Mems, Nano and Smart Systems, PTS 1–6; Yuan, L., Ed.; Trans Tech Publications Ltd.: Stafa, Switzerland, 2012; Volume 403–408, pp. 3191–3194. [Google Scholar]
  25. Al-Waked, R.; Behnia, M. CFD Simulation of Wet Cooling Towers. Appl. Therm. Eng. 2006, 26, 382–395. [Google Scholar] [CrossRef]
  26. Chen, G.; Zhao, Y.; Ge, W.; Li, W. Critical Guidelines to Cope with the Adverse Impacts of the Inner Peripheral Vortex in the High-Level Water Collecting Natural Draft Wet Cooling Tower. Appl. Therm. Eng. 2020, 168, 114819. [Google Scholar] [CrossRef]
Figure 1. Schematic of High-Level Wet Cooling Tower.
Energies 17 02073 g001
Figure 2. Grid division diagram.
Energies 17 02073 g002
Figure 3. Schematic of the computational domain.
Energies 17 02073 g003
Figure 4. Schematic illustration of the circulating water bypass design.
Energies 17 02073 g004
Figure 5. Effect of the water bypass percentage on the inlet and outlet temperatures and the spray density.
Energies 17 02073 g005
Figure 6. Distribution of the water temperature at the bottom of the packing at different bypass water percentages, (a): 0%, (b): 30%.
Energies 17 02073 g006
Figure 7. Cooling tower profile pressure distribution for different bypass water percentages, (a): 0%, (b): 30%.
Energies 17 02073 g007
Figure 8. Effect of water bypass percentage on the lowest and average water temperatures on the packing bottom.
Energies 17 02073 g008
Table 1. Geometric parameter.
Projects UnitRealm
Area available for water sprayingm29000
Cooling tower top elevationm158.22
Throat elevationm126.58
Packing top elevationm18.05
Packing bottom elevationm16.55
Height of air inletm13.55
Diameter of zero-meter layerm121.66
Throat diameterm71.68
Diameter of air outlet at the top of the towerm73.57
Radius of top layer of packingm55.07
Radius of bottom layer of packingm55.45
Table 2. Grid independence validation.
Grid Number 2.8 Million3.5 Million4.3 Million
Outlet water temperature, °C15.3815.3515.35
Absolute error, °C0.150.120.12
Circulating water temperature drop, °C8.678.678.67
Table 3. Numerical model validation.
Operation ConditionsC1C2
Ambient temperature, °C1.225.4
Relative humidity, %6864
Crosswind velocity, m/s2.93.4
Atmosphere pressure, kPa102.22100.04
Circulating water flow rate, m3/h20,70082,776
Water distribution modesOuter ringFull
Test/design inlet water temperature, °C20.0835.13
Test/design outlet water temperature, °C15.1227.12
Circulating water temperature drop, °C4.968.01
Outlet water temperature calculated by numerical model, °C14.9827.01
Absolute error, °C0.140.11
Table 4. Effect of the water bypass percentage on the cooling tower air mass flow.
Percentage of circulating water in bypass (%)0102030405060
Air mass flow (kg/s)15,32415,22115,19815,08414,95714,84514,752
Table 5. Effect of the water bypass percentage on the water temperature drop and mixed temperature.
Percentage of circulating water in bypass (%)0102030405060
Temperature drop (°C)7.588.1710.7811.6013.7816.5319.86
Mixed temperature (°C)3.564.163.544.685.667.2110.41
Disclaimer/Publisher’s Note: The statements, opinions and data contained in all publications are solely those of the individual author(s) and contributor(s) and not of MDPI and/or the editor(s). MDPI and/or the editor(s) disclaim responsibility for any injury to people or property resulting from any ideas, methods, instructions or products referred to in the content.

