1. Introduction
The human eye corresponds to the target object of the light emitted by most visible-spectrum LEDs. Each person is able to identify different colours in the light emitted by a given light source. This is explained by the science of colourimetry, which quantifies and physically describes human colour perception. The light-sensitive part of the eye, called the retina, is composed of rod cells, which are sensitive over the entire visible spectrum; cone cells, of which there are three, each one sensitive to each primary colour (red, green and blue); and the nerves transmitting the information to the brain [
1,
2,
3]. Depending on the light source, this causes different levels of excitation of the three different cones. However, the colour of light is a subjective factor that cannot be precisely measured because colour perception varies from person to person.
In 1931, the International Commission for Illumination (
Commission Internationale de l’éclairage)—CIE—created the first system that standardised the measurement of colour, through colour matching functions (CMFs) [
3,
4,
5]. These functions, known as CIE 1931, are the result of a group of functions experimentally derived by Wright in 1929 and by Guild himself earlier [
4]. The created system is composed of three colour-matching functions,
,
and
, and each one corresponds, approximately, to the eye sensitivity curves of the red, green and blue cones, respectively. Besides this, the perception of light colour is analysed according to the degree to which the light stimulates the three different cones, and it involves characterising all possible colours, corresponding to an electromagnetic spectrum.
Light is electromagnetic radiation and the Sun is the main source of natural light on Earth. Since the second half of the XX century, due to several historical events, concerns about the environment have become an important topic and the use of the Earth’s resources as renewable sources has been considered, particularly solar energy, because of its relatively low cost of production, operation and maintenance [
6,
7,
8,
9,
10,
11,
12]. With the discovery of the photovoltaic effect, the working principle of solar devices began to be studied, which led to their evolution in subsequent years, both in terms of efficiency values and in terms of the manufacturing processes and materials used, evolving into different photovoltaic generation systems.
The physical phenomena behind the working principle of a solar cell explain the creation of an electric current in a semiconductor material when exposed to a certain frequency of light radiation, which has an inverse relationship with the wavelength of the incident radiation and, consequently, with the colour of the incident light. Silicon solar cells are made from a material that is abundant on Earth, and this is one of the most commonly used technologies in a wide range of applications [
11,
13].
The photovoltaic industry’s rapid evolution demands a thorough examination of solar cells’ performance under conditions that closely resemble their intended real-world application. While laboratory experiments often utilise artificial light sources to control specific parameters, the ultimate application of solar cells—whether silicon-based (Si), emerging perovskite or organic—relies predominantly on natural sunlight. Natural sunlight presents a broad spectrum of wavelengths, significantly differing from the narrow spectral output of many artificial light sources, such as RGB LEDs [
14]. The spectral match or mismatch between the irradiance in testing environments and the solar spectrum can profoundly influence the photovoltaic performance metrics. Therefore, discussing and analysing the implications of using RGB LED light in contrast to sunlight is imperative, especially considering the spectral sensitivity of different solar cell technologies. This analysis will not only aid in understanding laboratory findings but also in predicting the field performance more accurately. The selection of artificial light sources is critical for laboratory testing that aims to replicate natural sunlight conditions closely. Light sources with a spectral distribution closely matching the AM1.5G solar spectrum are preferable. These include, but are not limited to, xenon arc lamps and metal halide lamps, which have been shown to provide a better approximation of sunlight than narrowband LEDs. Incorporating such light sources in experimental setups can bridge the gap between controlled laboratory measurements and expected real-world solar cell performance. The choice of light source for performance testing is particularly relevant to developing and optimising emerging solar cell technologies such as perovskite and organic solar cells. These technologies exhibit distinct spectral sensitivities compared to traditional Si solar cells, necessitating a nuanced approach to light source selection. For instance, perovskite solar cells’ broader spectral absorption range may lead to different performance characteristics under artificial light than natural sunlight. Consequently, this paper will delve into the spectral considerations and adaptation strategies necessary to accurately evaluate and enhance the performance of various solar cell technologies in real-world applications. Adopting light sources that closely mimic the solar spectrum for solar cell testing is not merely a technical requirement but a critical step towards aligning laboratory research with practical applications. By providing detailed insights into the selection and implications of different light sources, this work aims to serve as a comprehensive guide for researchers and industry practitioners alike, facilitating the development of solar cells that perform optimally under the very essence of their intended use—natural sunlight.
The relationship between the light wavelength and the efficiency of photovoltaic (PV) systems, particularly silicon-based solar cells, forms the basis of this investigation. Previous research has extensively documented that photons with energies close to the semiconductor bandgap are most effectively converted into electricity. Conversely, photons with wavelengths too long for the bandgap energy are insufficiently absorbed, and those with significantly shorter wavelengths primarily contribute to thermal energy rather than electrical power, thereby reducing the overall efficiency of solar cells. Building upon this established knowledge, our study ventures into the less explored domain of the colour temperature’s impact on PV efficiency. Given that colour perception is inherently linked to the spectrum of light wavelengths emitted or reflected by an object, it follows that there should exist a correlational framework between the colour characteristics and solar cell efficiency. This study seeks to bridge this gap by not only presenting empirical data but also situating these findings within a solid theoretical framework.
To substantiate the experimental observations, we consider theoretical models that describe the interaction between light and semiconductor materials. Specifically, we examine the principles underlying the photovoltaic effect and how it varies with changes in the incident light’s spectral composition. Leveraging theoretical insights into semiconductor physics, we propose a model that predicts the efficiency of solar energy conversion based on the colour temperature of the incident light. This model posits that optimal energy conversion efficiency in silicon-based solar cells is achieved under light conditions that closely match the spectral sensitivity of the cell’s semiconductor material.
Moreover, the exploration of the colour temperature and its relation to efficiency is not merely academic. Given the increasing prevalence of LED lighting and its wide range of colour temperatures, understanding how different light qualities affect the PV efficiency could have significant implications for both indoor and outdoor solar energy harvesting. Therefore, our study not only contributes to the theoretical discourse on light–matter interactions in solar cells but also addresses practical considerations in optimising solar energy systems for diverse lighting environments.
In conclusion, integrating theoretical models with empirical data allows us to obtain a more comprehensive understanding of how the colour temperature influences the solar cell efficiency. This approach not only enhances the scientific rigour of our findings but also provides a valuable framework for future research and applications in the field of solar energy conversion.
In this work, an experimental study has been performed, using an RGB LED, with three different types of LEDs emitting in red, green and blue, and a silicon solar cell. We aimed to analyse the behaviour of the photovoltaic device when the incident light source has different colours. With the three different LEDs, three different colours were mixed, to conduct an experimental analysis of the different colours. According to the literature, there are no similar studies and, therefore, the presented results are not compared to others.
3. Results
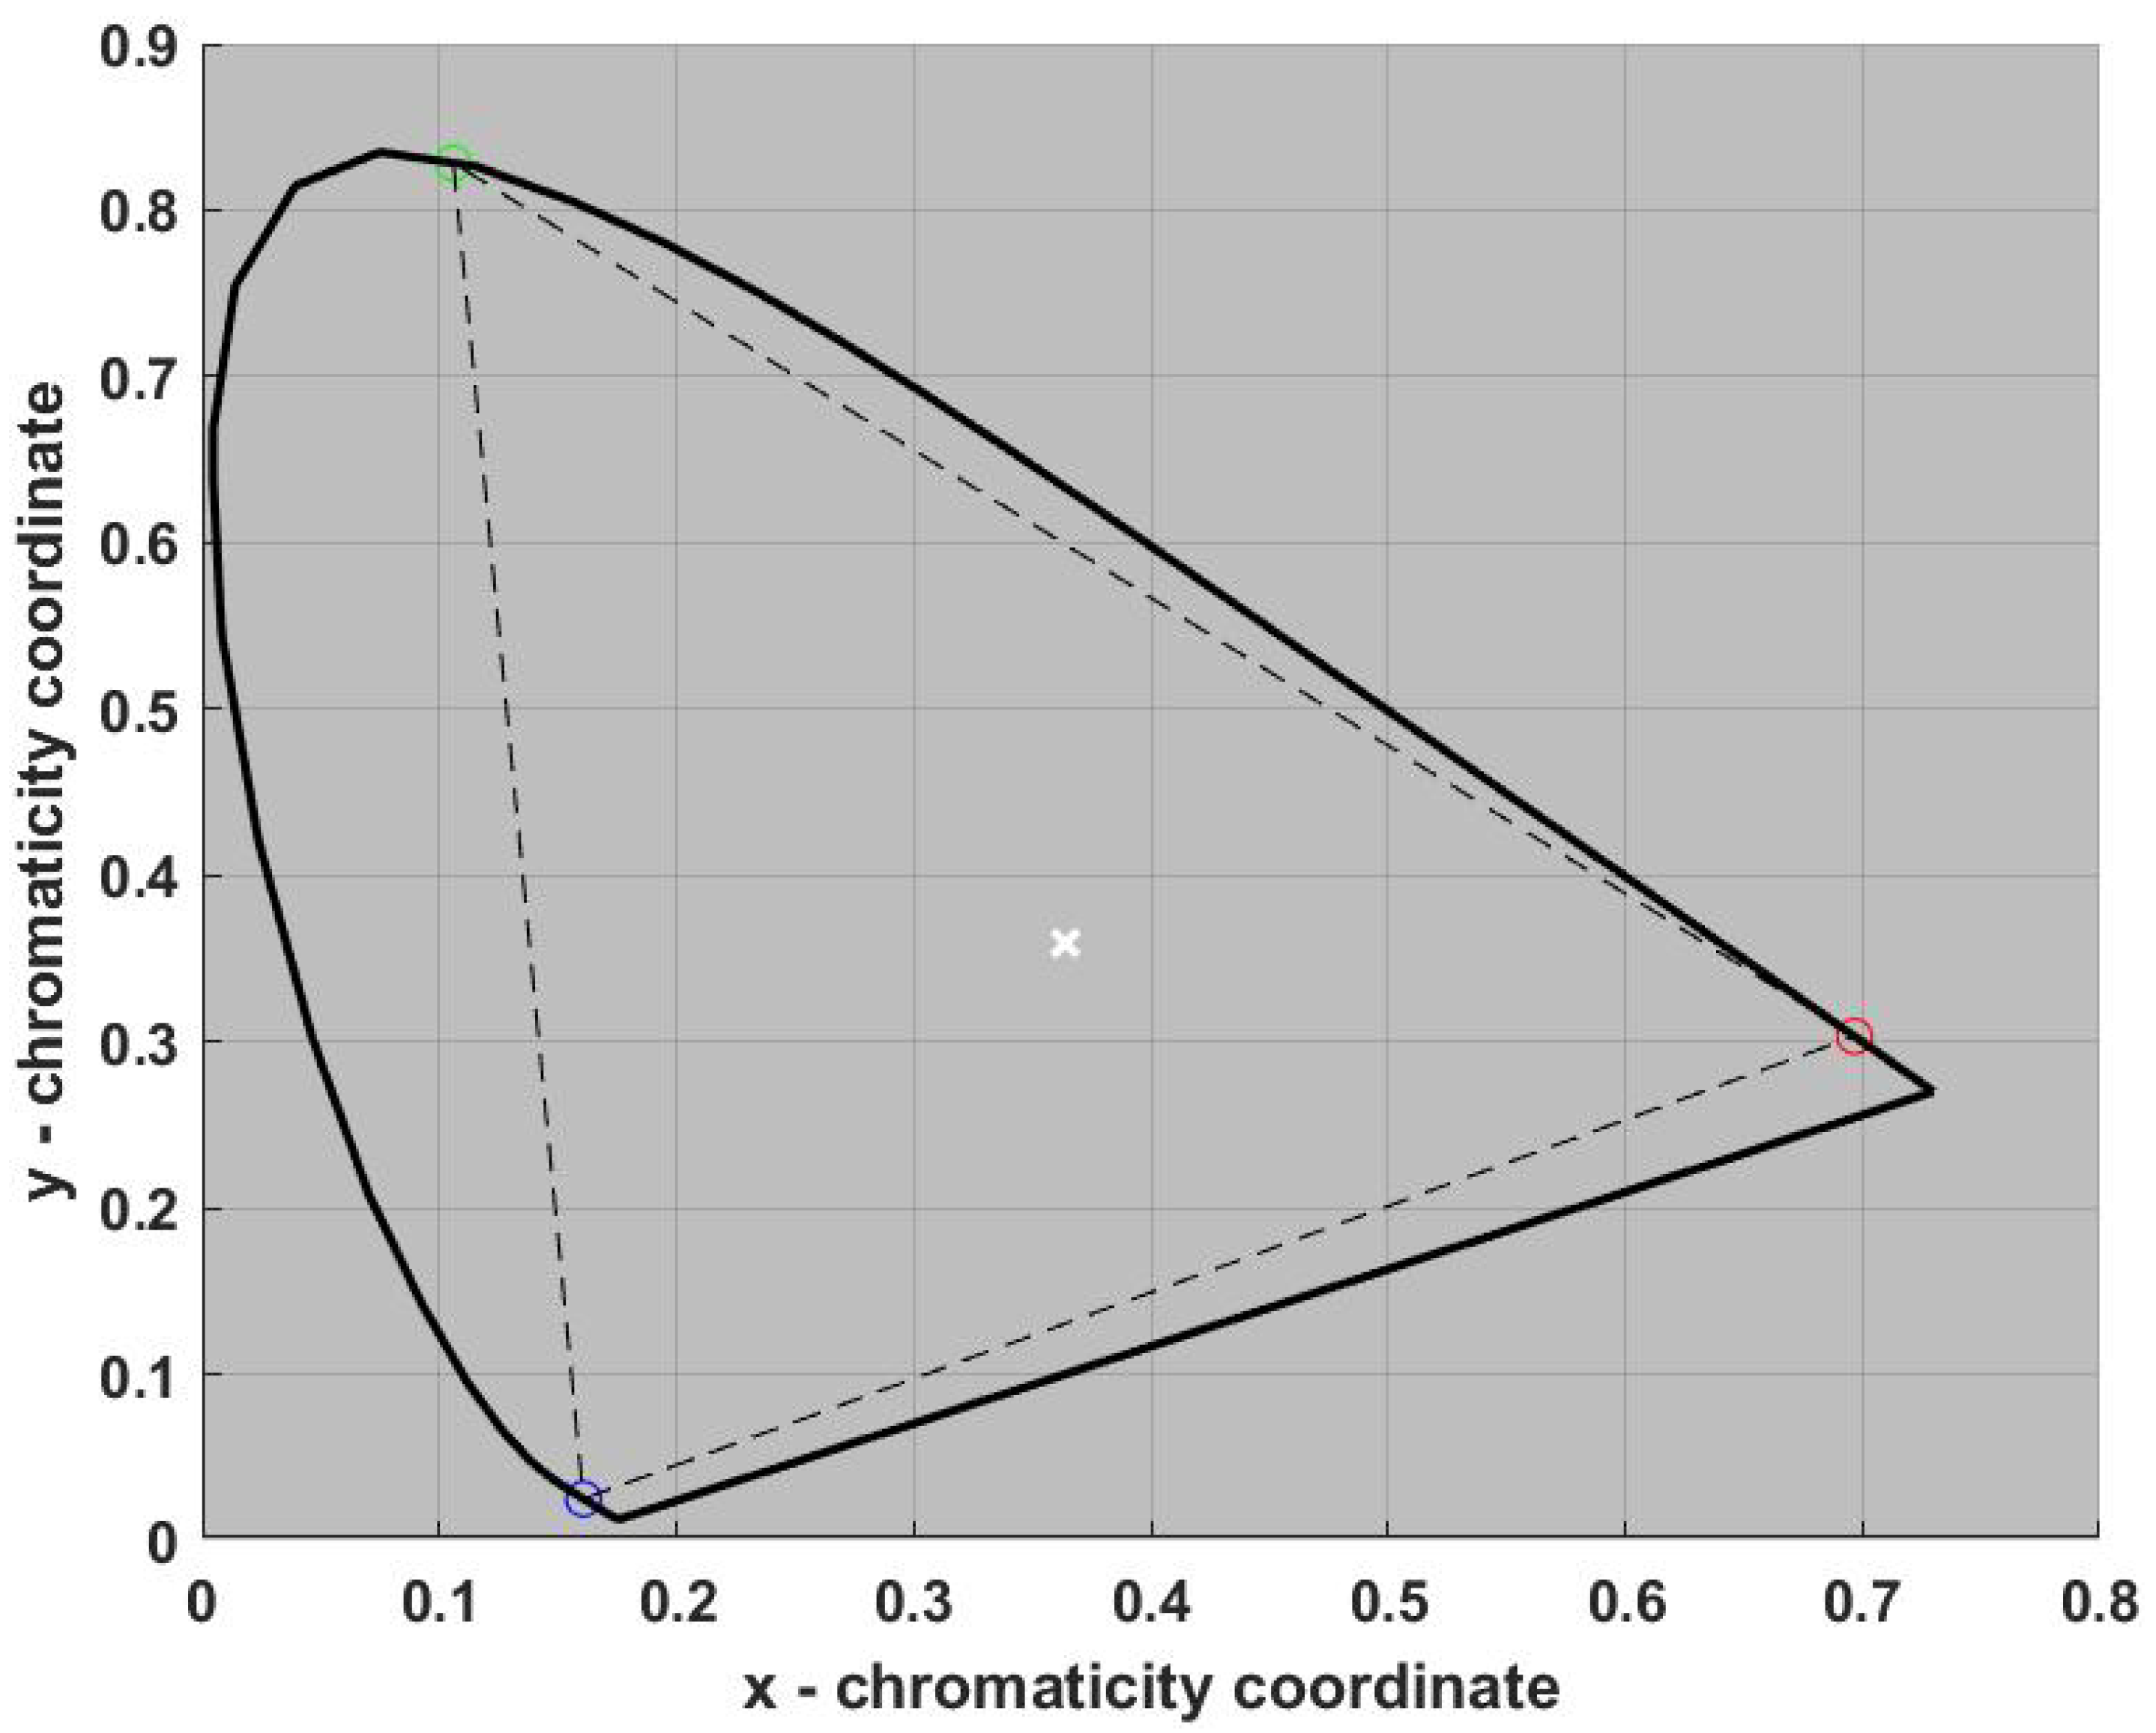
Figure 8 shows the chromaticity diagram of the light LED source. In the figure, the points of the primary colours are shown, each one with the corresponding colour, and, in the centre of the diagram, we plot the white light. This chromaticity diagram is the result of applying Equations (
3) and (
4), where the peak wavelengths and the optical power emitted by every source are the coordinates of the maximum points of the spectrum presented in
Figure 2.
Although 110 experimental tests were carried out, only the results of 100 experimental tests are presented, as the remaining tests had redundant results for the analysis.
For each of the 100 experimental tests carried out, the chromaticity coordinates were obtained and plotted in the diagram.
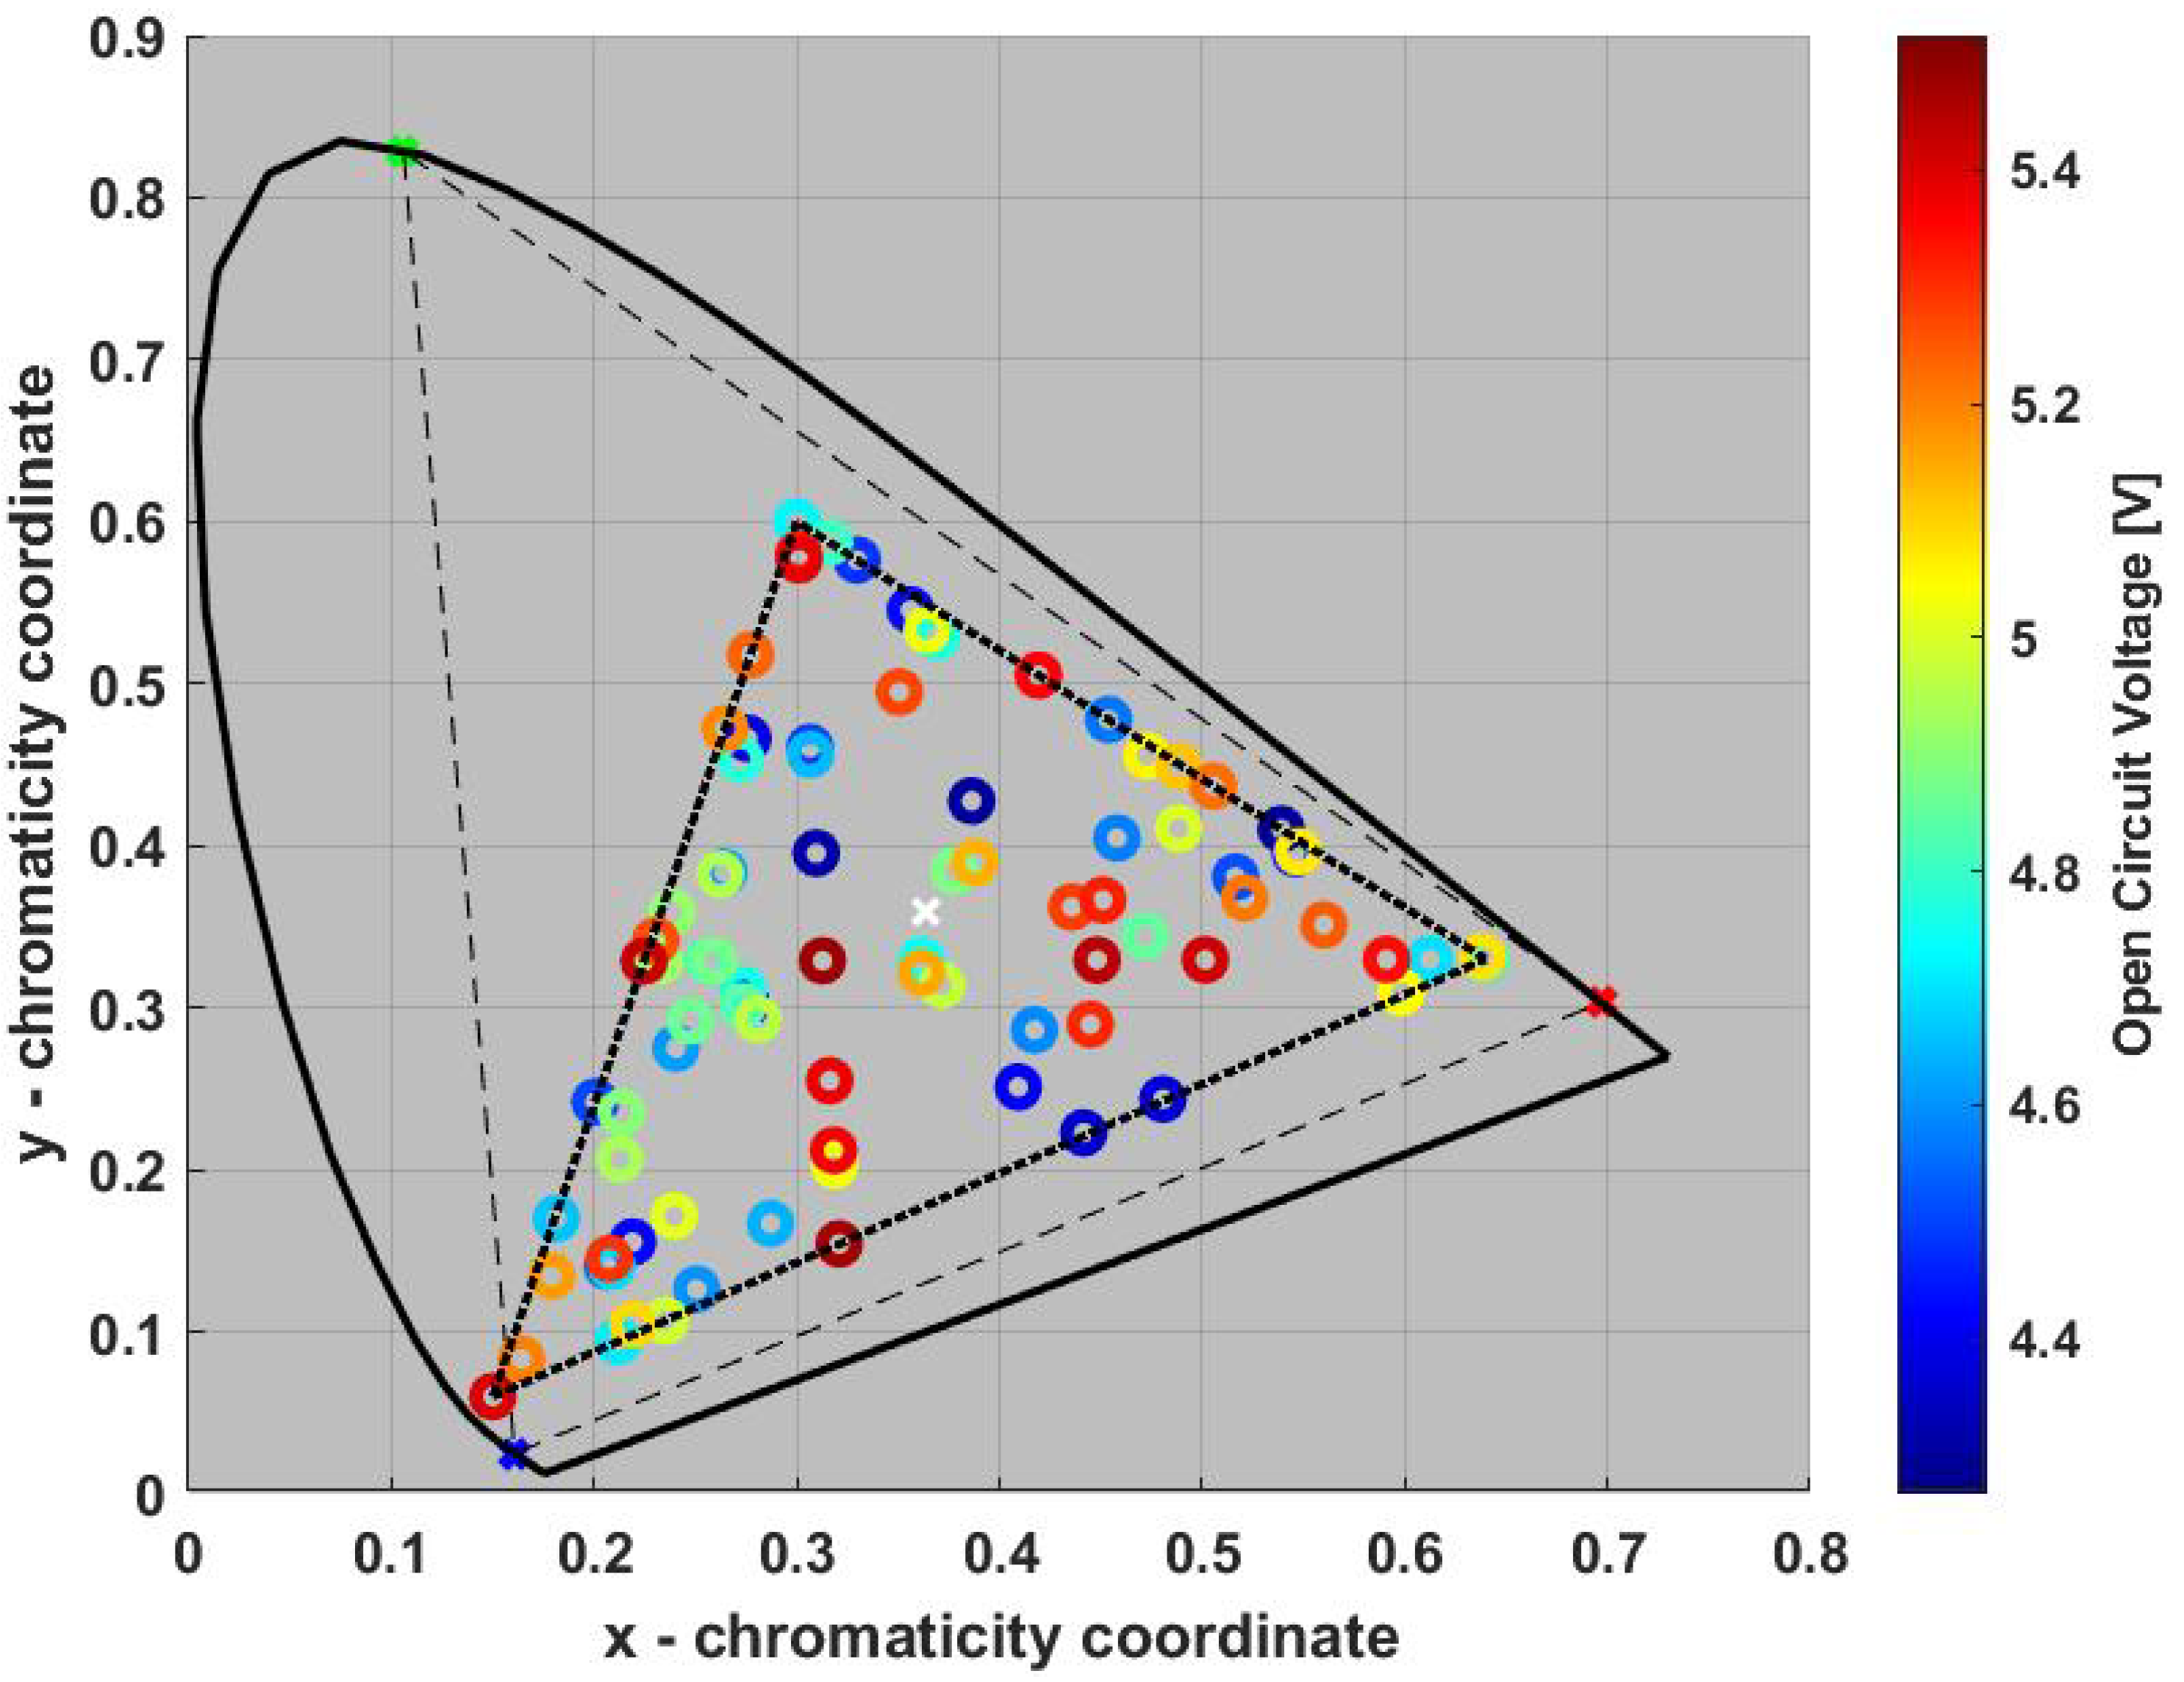
Figure 9 and
Figure 10 show the plots of each colour in the diagram and they also present the short circuit current and the open circuit voltage of each test, respectively, through a colour code shown in both figures.
The first aspect that is noticed from the figures is that all points of the tests carried out are inside the triangle that connects the three theoretical primary colours of the RGB light source. It is important to note that the points are not only inside the theoretical triangle but also inside the experimental one that connects the three experimental primary colours of the RGB light source. This is an expected result since all experimental tests resulted from a combination of the primary colours and, because of this, the points in the diagram would be always inside the triangle. Moreover, the used LED was not physically monochromatic (in this case, the points of the tests were in the perimeter of the chromaticity diagram), although, to the human eye, it appeared as such. As the light source emitted light over a range of wavelengths, the point’s location moved towards the centre of the diagram. Because of this, the triangle connecting the points of the experimental primary colours was smaller than the one that connected the theoretical points of the primary colours.
Regarding the obtained values, the maximum and minimum registered short circuit currents are 0.0112 A and 4 A, respectively, and the maximum and minimum open circuit voltages are 5.5148 V and 4.2673 V, respectively. Since the light source and solar cell were the same in all experimental tests, the discrepancy in the extreme values of the obtained values was due to the intensity of the light, for the short circuit current; for the open circuit voltage, it was due to the temperature associated with the colour of the light. The maximum values were registered with white light at its maximum intensity and the minimum with the same light but at its minimum intensity.
Regarding the current value, the higher the intensity of the light, the higher the short circuit current. Since white is the colour that the light source can produce with the maximum intensity, the highest average irradiance value of 39.6 W/m2 was recorded and, consequently, the highest short circuit current value.
According to the colour temperature scale, blue/violet light are the ones with higher temperatures (associated with higher frequencies). However, because this light source was an RGB LED, the blue LED had other wavelengths incorporated within it, resulting in a less pure tone and therefore not reaching the highest temperatures.
Figure 11 and
Figure 12 show the behaviour of the solar cell in terms of power. In the first one, we can see the maximum power reached by the photovoltaic device according to the light colour. The second one relates to the power achieved by all experimental tests carried out for the same resistance value, the maximum resistance of the white light at its maximum intensity,
. This could be obtained due to the modelling of the experimental curves using the discrete model. The value of the referred resistance was approximately 458
.
As expected, the highest maximum power value, which was 0.044 W, was verified with white light at its maximum intensity. Regarding the lowest maximum power value, it was recorded with blue light, with a value of 2.2 mW. It is important to note that the referred blue colour was a low-intensity colour. Concerning the second analysis, for the maximum resistance, the minimum power value was obtained for the white light, but at its minimum intensity, with a value of approximately 0.0732 mW.
Once the maximum power was obtained, the maximum current and voltage could be registered and plotted in the diagram, as can be seen in
Figure 13 and
Figure 14, respectively.
The efficiency achieved by the solar cell in each experimental test can be related to both the colour purity and the dominant wavelength, as can be seen in
Figure 15 and
Figure 16. The represented efficiency is computed through the ratio between the maximum produced power and the incident one, which considers the useful area of the used Si solar cell and the incident irradiation. Concerning the purity, two different analyses were carried out. The first one, presented in
Figure 17, concerned the maximum power as a function of the colour purity, and the second one, shown in
Figure 18, considered the dominant wavelength as a function of the purity.
Figure 15 shows two regions, which are within the areas of the black lines. The dashed lines show the maximum value of efficiency of each interval. The points numbered 1 to 10 correspond to the extremes of each of the intervals. These numbered points can be seen in
Figure 16,
Figure 17 and
Figure 18 to facilitate an understanding of the results.
Table 1 presents the parameter values obtained for each numbered point.
As can be verified, most of the experimental colours present purity between 20% and 60%, meaning that the light source emits a relatively impure or mixed colour, i.e., additional wavelengths mixed with the desired colour. However, it is within this purity range that the maximum power is achieved within these experimental tests.
Additionally, it is possible to verify that, depending on the range of frequencies considered, the efficiency and colour purity have different relationships, which are easier to visualise through a comparative analysis between
Figure 15 and
Figure 18. Among the high-frequency results, it is verified that the lower the purity, the higher the efficiency. This is due to the fact that, in this spectral region, silicon’s absorption is much higher than others within the visible range. Thus, adding other non-dominant wavelengths does not increase the efficiency. On the contrary, it will decrease due to the solar cell’s temperature, which increases with the absorption of the energy surplus. For higher frequencies, in points 1 and 2, it is verified that there is an efficiency increase and a decrease in the colour purity. Nevertheless, in the case of points 3 and 4, this is not verified because, as seen in
Figure 2 and
Figure 5, the dominant wavelength of the points is within the peak regions of the blue region and the
curve (the eye sensitivity curve of the blue cone), respectively. Thus, the silicon absorbs more selectively the blue colour’s frequencies, which translates into higher colour purity.
On the other hand, for lower frequencies, in points 5 and 6 and points 9 and 10, it is verified that there is an increase in the efficiency with an increase in the colour purity. However, this does not occur in the case of points 7 and 8. Once again, through
Figure 2 and
Figure 5, it is possible to verify that these points are within the peak regions of the
/
curve (the eye sensitivity curve of the green/red cones). Thus, the silicon starts to absorb the green colour’s frequencies, increasing the range of frequencies that the cell can absorb, resulting in a decrease in the purity of the colour.
In the blue spectrum region, an increase in colour purity leads to a decrease in efficiency. Exceptions are verified near the peak wavelengths of the light source spectrum and eye sensitivity, represented by points 3 and 4. In the red spectrum region, the efficiency increases with the colour purity, except in the near-peak wavelengths of the light source spectrum and eye sensitivity, which is demonstrated by points 7 and 8.
To obtain the colour’s dominant wavelength, we drew the line containing the centre, passing through the coordinate point representing each colour.
Figure 19 shows the chromaticity diagram with the lines that allow us to obtain the dominant wavelength values of the points numbered 1 to 10.
As can be seen, lines 1 and 2, lines 5 and 6 and lines 9 and 10 intersect the perimeter of the diagram very closely to each other, which demonstrates the proximity of the values of the dominant wavelength of the presented coordinate points. The more closely the lines intersect the perimeter of the diagram, the closer the dominant wavelength of the colour under test will be. Thus, lines 1 and 2, lines 5 and 6 and lines 9 and 10 present dominant wavelength values that are very close to each other, according to
Figure 18. It is possible to state that points that are on the same horizontal line in
Figure 18 have the same (or a very close) dominant wavelength, which means that they cross the perimeter of the chromaticity diagram in very similar places.
With the analysis carried out, it is possible to obtain some parameters that characterise the primary colour LEDs. This is demonstrated in
Table 2.
As can be seen, the dominant wavelengths presented in
Table 2 are in accordance with the peak wavelengths represented in the spectrum of
Figure 2 and to the CIE colour matching functions (
Figure 5). This means that the colour that the human eye sees and the one emitted optically from the LED are not notably different, which translates into higher colour purity. Besides this, it is important to note that, comparing
Table 1 and
Table 2, the blue primary colour corresponds to point number 3, which is the one with higher efficiency. This is an expected result because the silicon presents a higher absorption coefficient in this region.
Finally, two different analyses were carried out, taking into account the solar spectrum, presented in
Figure 20 and
Figure 21.
On one hand,
Figure 20, which corresponds to the first analysis, shows the normalised solar spectrum and the normalised maximum irradiance of each experimental test. On the other hand,
Figure 21 also shows the normalised solar spectrum, but it shows the normalised irradiance of each experimental test for the same resistance value,
, which is possible due to the novel model d1MxP [
8].
4. Conclusions
In this work, several experimental tests were carried out using a silicon solar cell and an RGB LED light as the light source. The aim was to verify the impact of the colour of the light on the behaviour of photovoltaic devices.
In the laboratory, 100 experimental tests were carried out, with 100 different colours of light. Through the theory of colourimetry, each one of the tested colours could be characterised by chromaticity coordinates, which allowed us to represent every colour in a diagram, in order to carry out a more in-depth analysis of each colour. All experimental points of the tests carried out were inside the triangle that connected the three theoretical primary colours of the RGB light source, as well as inside the triangle that connected the experimental primary ones. This was because all experimental tests were the result of a combination of the primary colours. Other tests that could be conducted with the same light source, with different colour combinations, will be within both of the above-mentioned triangles.
With the chromaticity diagram, characteristics like the colour purity and dominant wavelength can be obtained. It was verified that none of the experimental tests corresponded to pure colours, since none of them were located on the perimeter of the diagram, which was as expected. The used light source was composed of three different types of LEDs emitting in the red, green and blue regions. However, there existed additional wavelengths mixed with the selected colour, in such a way that most of the tested colours had purity between 20% and 60%.
Besides the above, the colour of the light and its intensity influenced the performance of the Si solar cell. The higher the light intensity, the higher the power, due to the larger values of irradiance. It was also verified that there was an increase in the solar cell’s efficiency because the relative increase in the power was higher than that of the irradiance. Regarding the temperature, this is a parameter that causes a voltage variation. On the one hand, in any experimental test with solar cells, this is a parameter that has to be taken into consideration, as is well known. On the other hand, in this case, the colour of the light led to the warming of the cell, as defined in the colour temperature scale.
Based on the results achieved in the experimental tests, and since the light source was composed of three different LEDs emitting in three different regions, the characteristics of the primary colours could be identified. The dominant wavelengths of the primary colours were in accordance with the peak wavelengths, which translated into higher purity. This means that, in terms of their positions in the diagram, these colours were closer to the chromaticity diagram’s perimeter, and, in physical terms, the colour of light perceived by the human eye corresponds almost exactly to that emitted by the LED.
The results of this study show that different-coloured light, used as the light source of a photovoltaic system, results in different maximum power achieved by the photovoltaic device and, consequently, in different energy conversion power. However, the maximum power is achieved with white light at its maximum intensity. Theoretically, the white colour corresponds to the sum of all wavelengths of the visible spectrum, and, as the sun is capable of producing all wavelengths of visible radiation, due to the nuclear fusion reactions that take place in its core, the light of the sun is commonly referred to as white light. The sun’s spectrum is mainly treated as a unitary function, independent of the wavelength.
However, the results presented in this research work suggest that mixing colours (adding wavelengths) may not lead to an increase in the cell’s output power. Other phenomena, such as the cell’s temperature, may be observed, mainly because the surplus absorbed energy is converted into heat, warming up the semiconductor and reducing the power efficiency.
Thus, analyses such as the one presented in this article are quite important, because non-uniform incident spectra (non-white light) may produce different electrical responses.


 ,
, 


