
Research Progress and Prospect of Condition Assessment Techniques for Oil–Paper Insulation Used in Power Systems: A Review

 , ,
, , 
Abstract
:1. Introduction
2. The Background of Condition Assessments for Oil–Paper Insulation
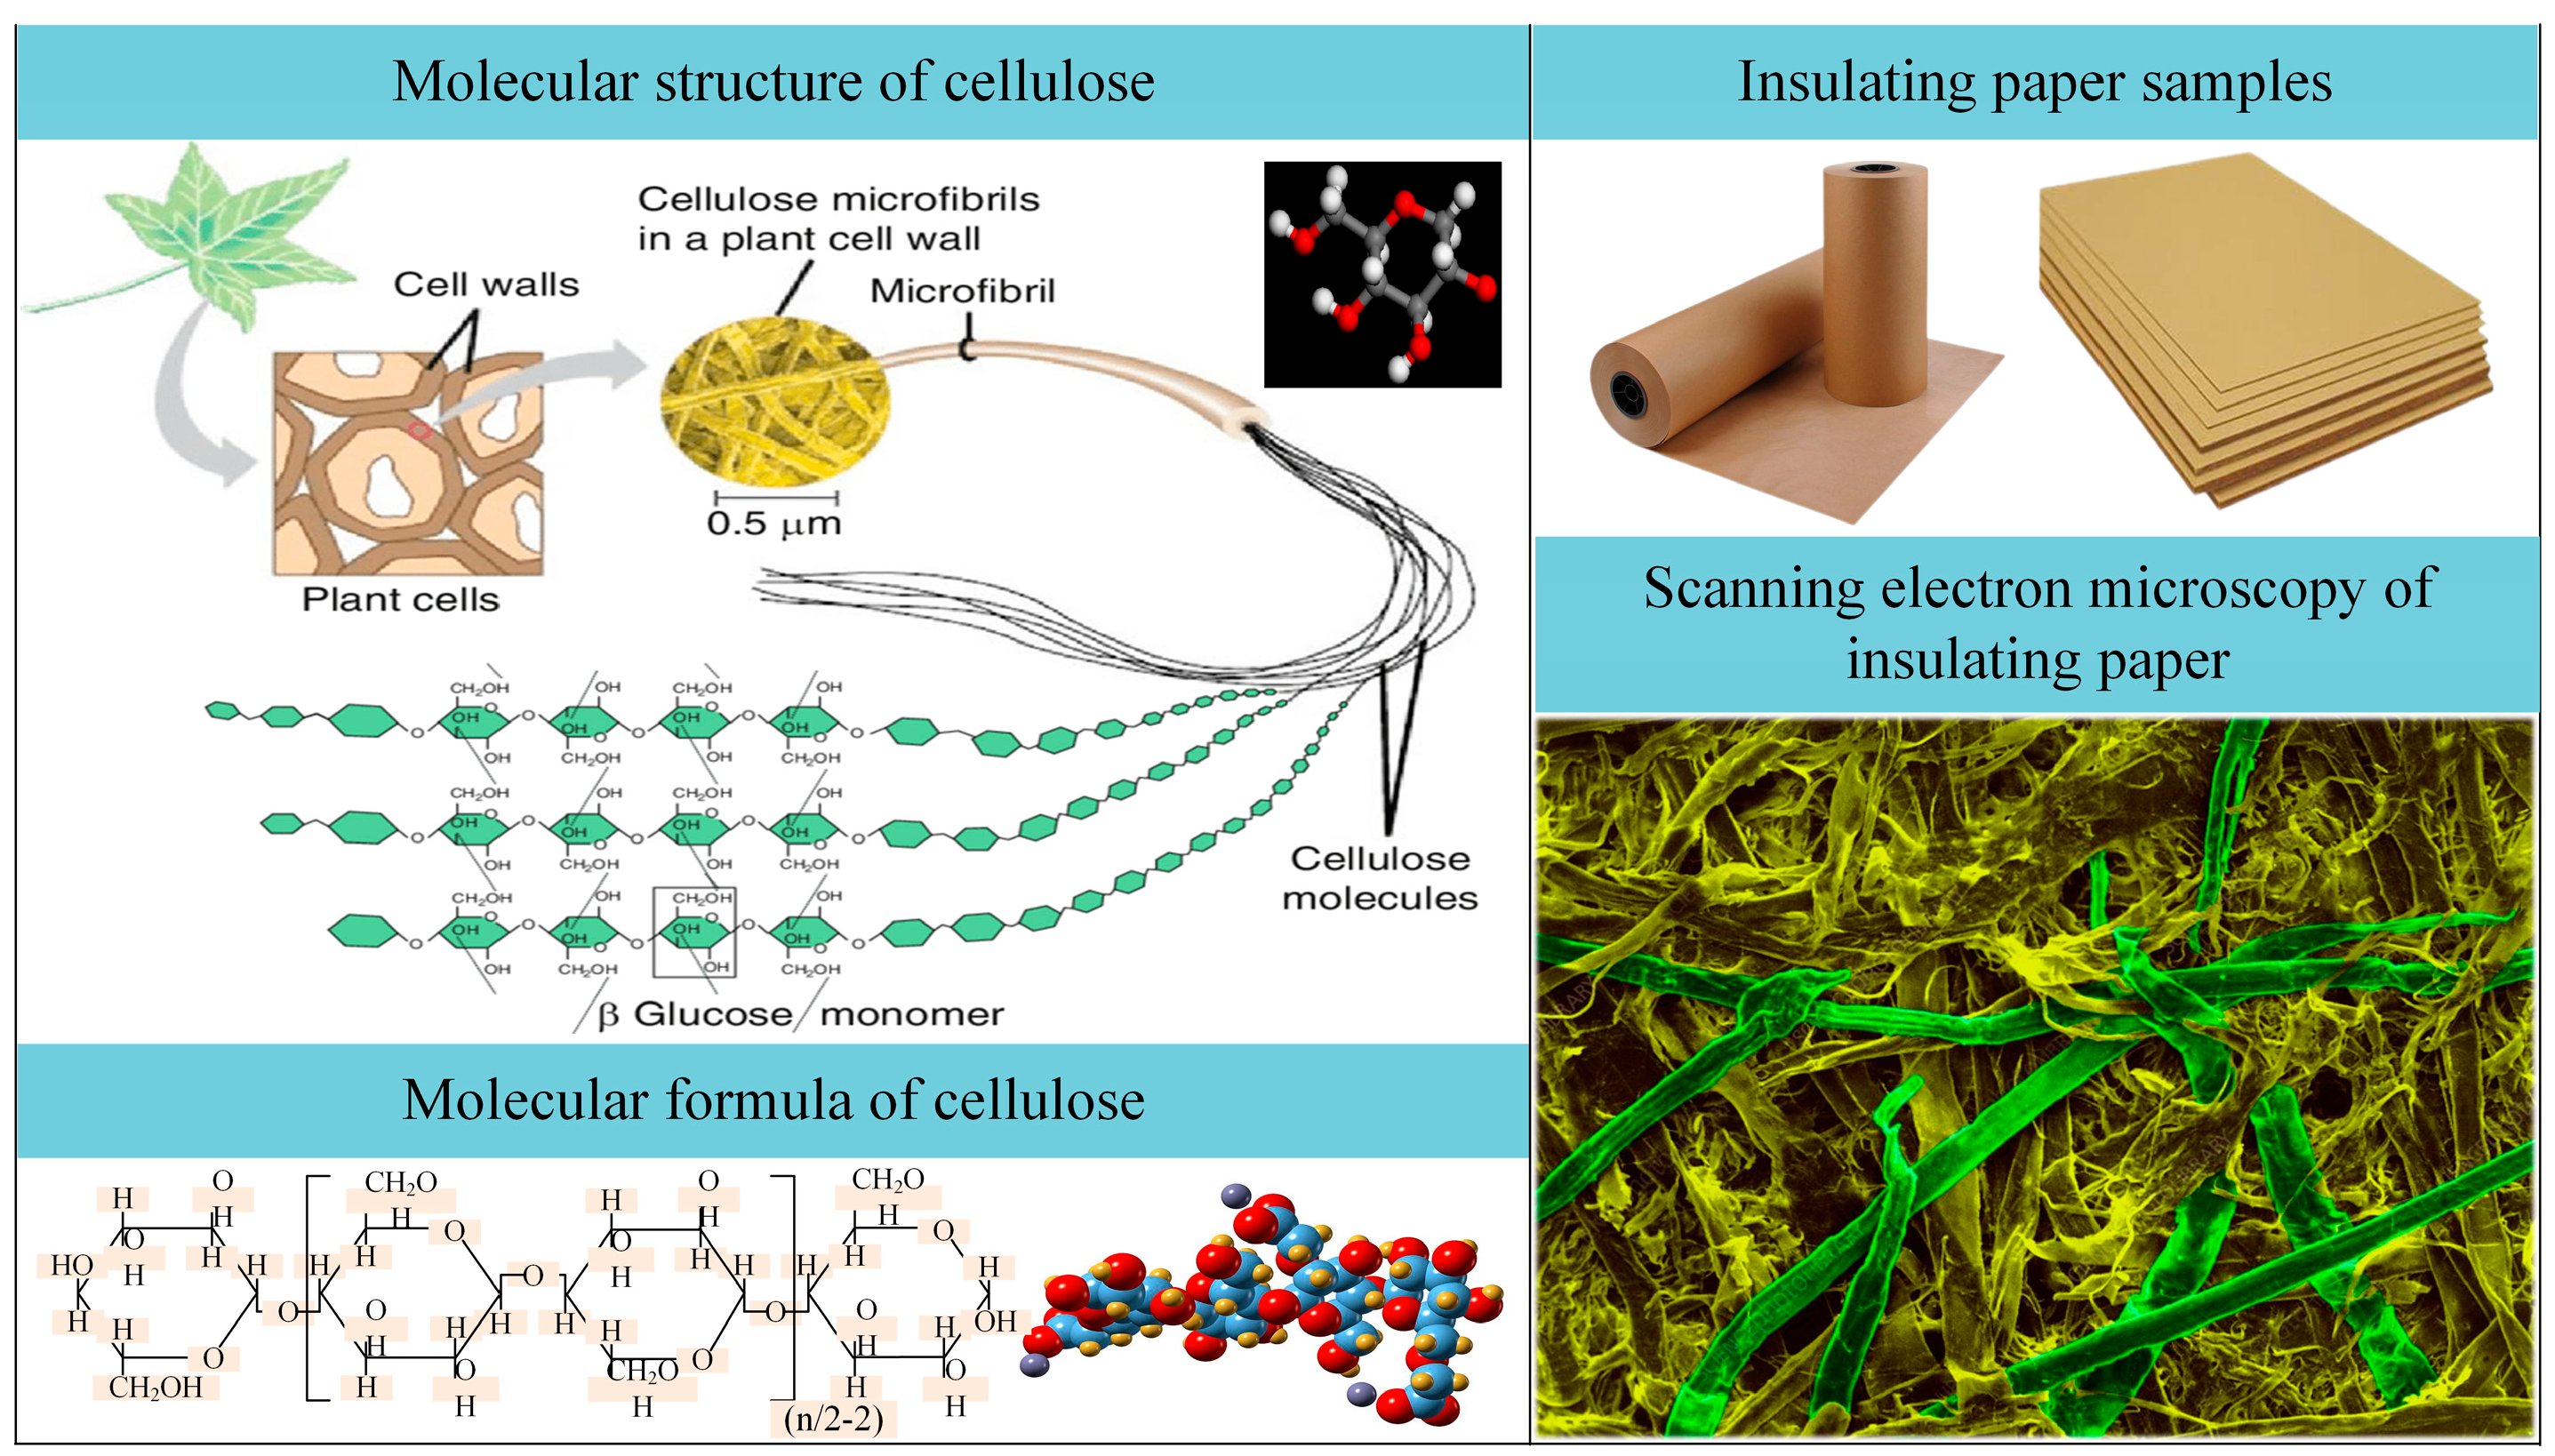
2.1. The Composition of Oil–Paper Insulation
2.1.1. Insulating Paper
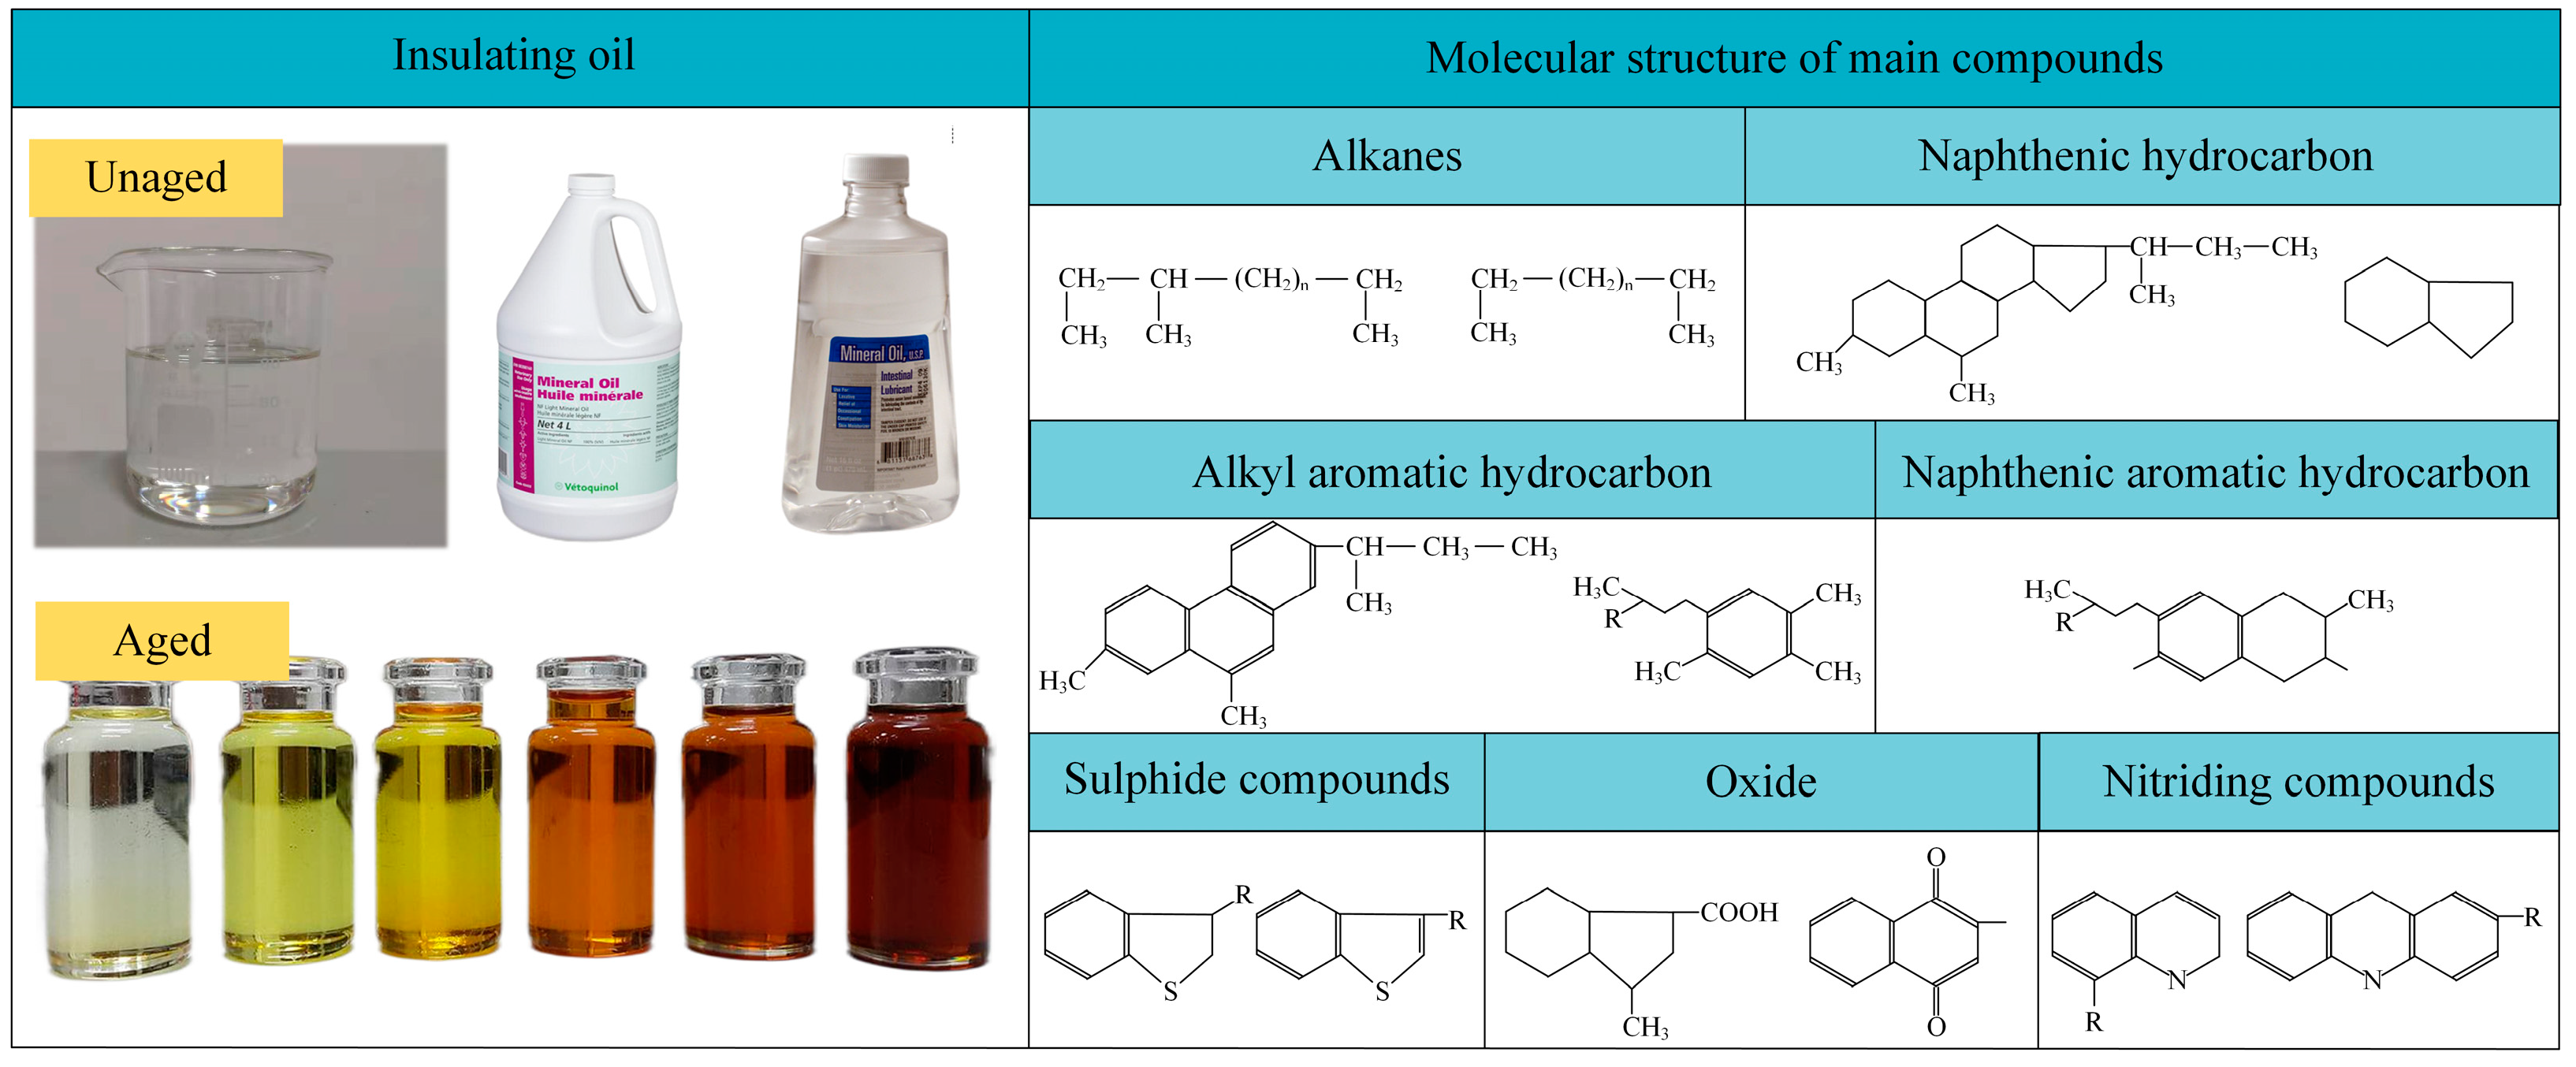
2.1.2. Insulating Oil
2.2. The Degradation of Oil–Paper Insulation
2.2.1. Temporary Deterioration
2.2.2. Cumulative Deterioration: Aging
2.2.3. Cumulative Deterioration: Dampness
2.3. The Possibility of Electrical Accidents
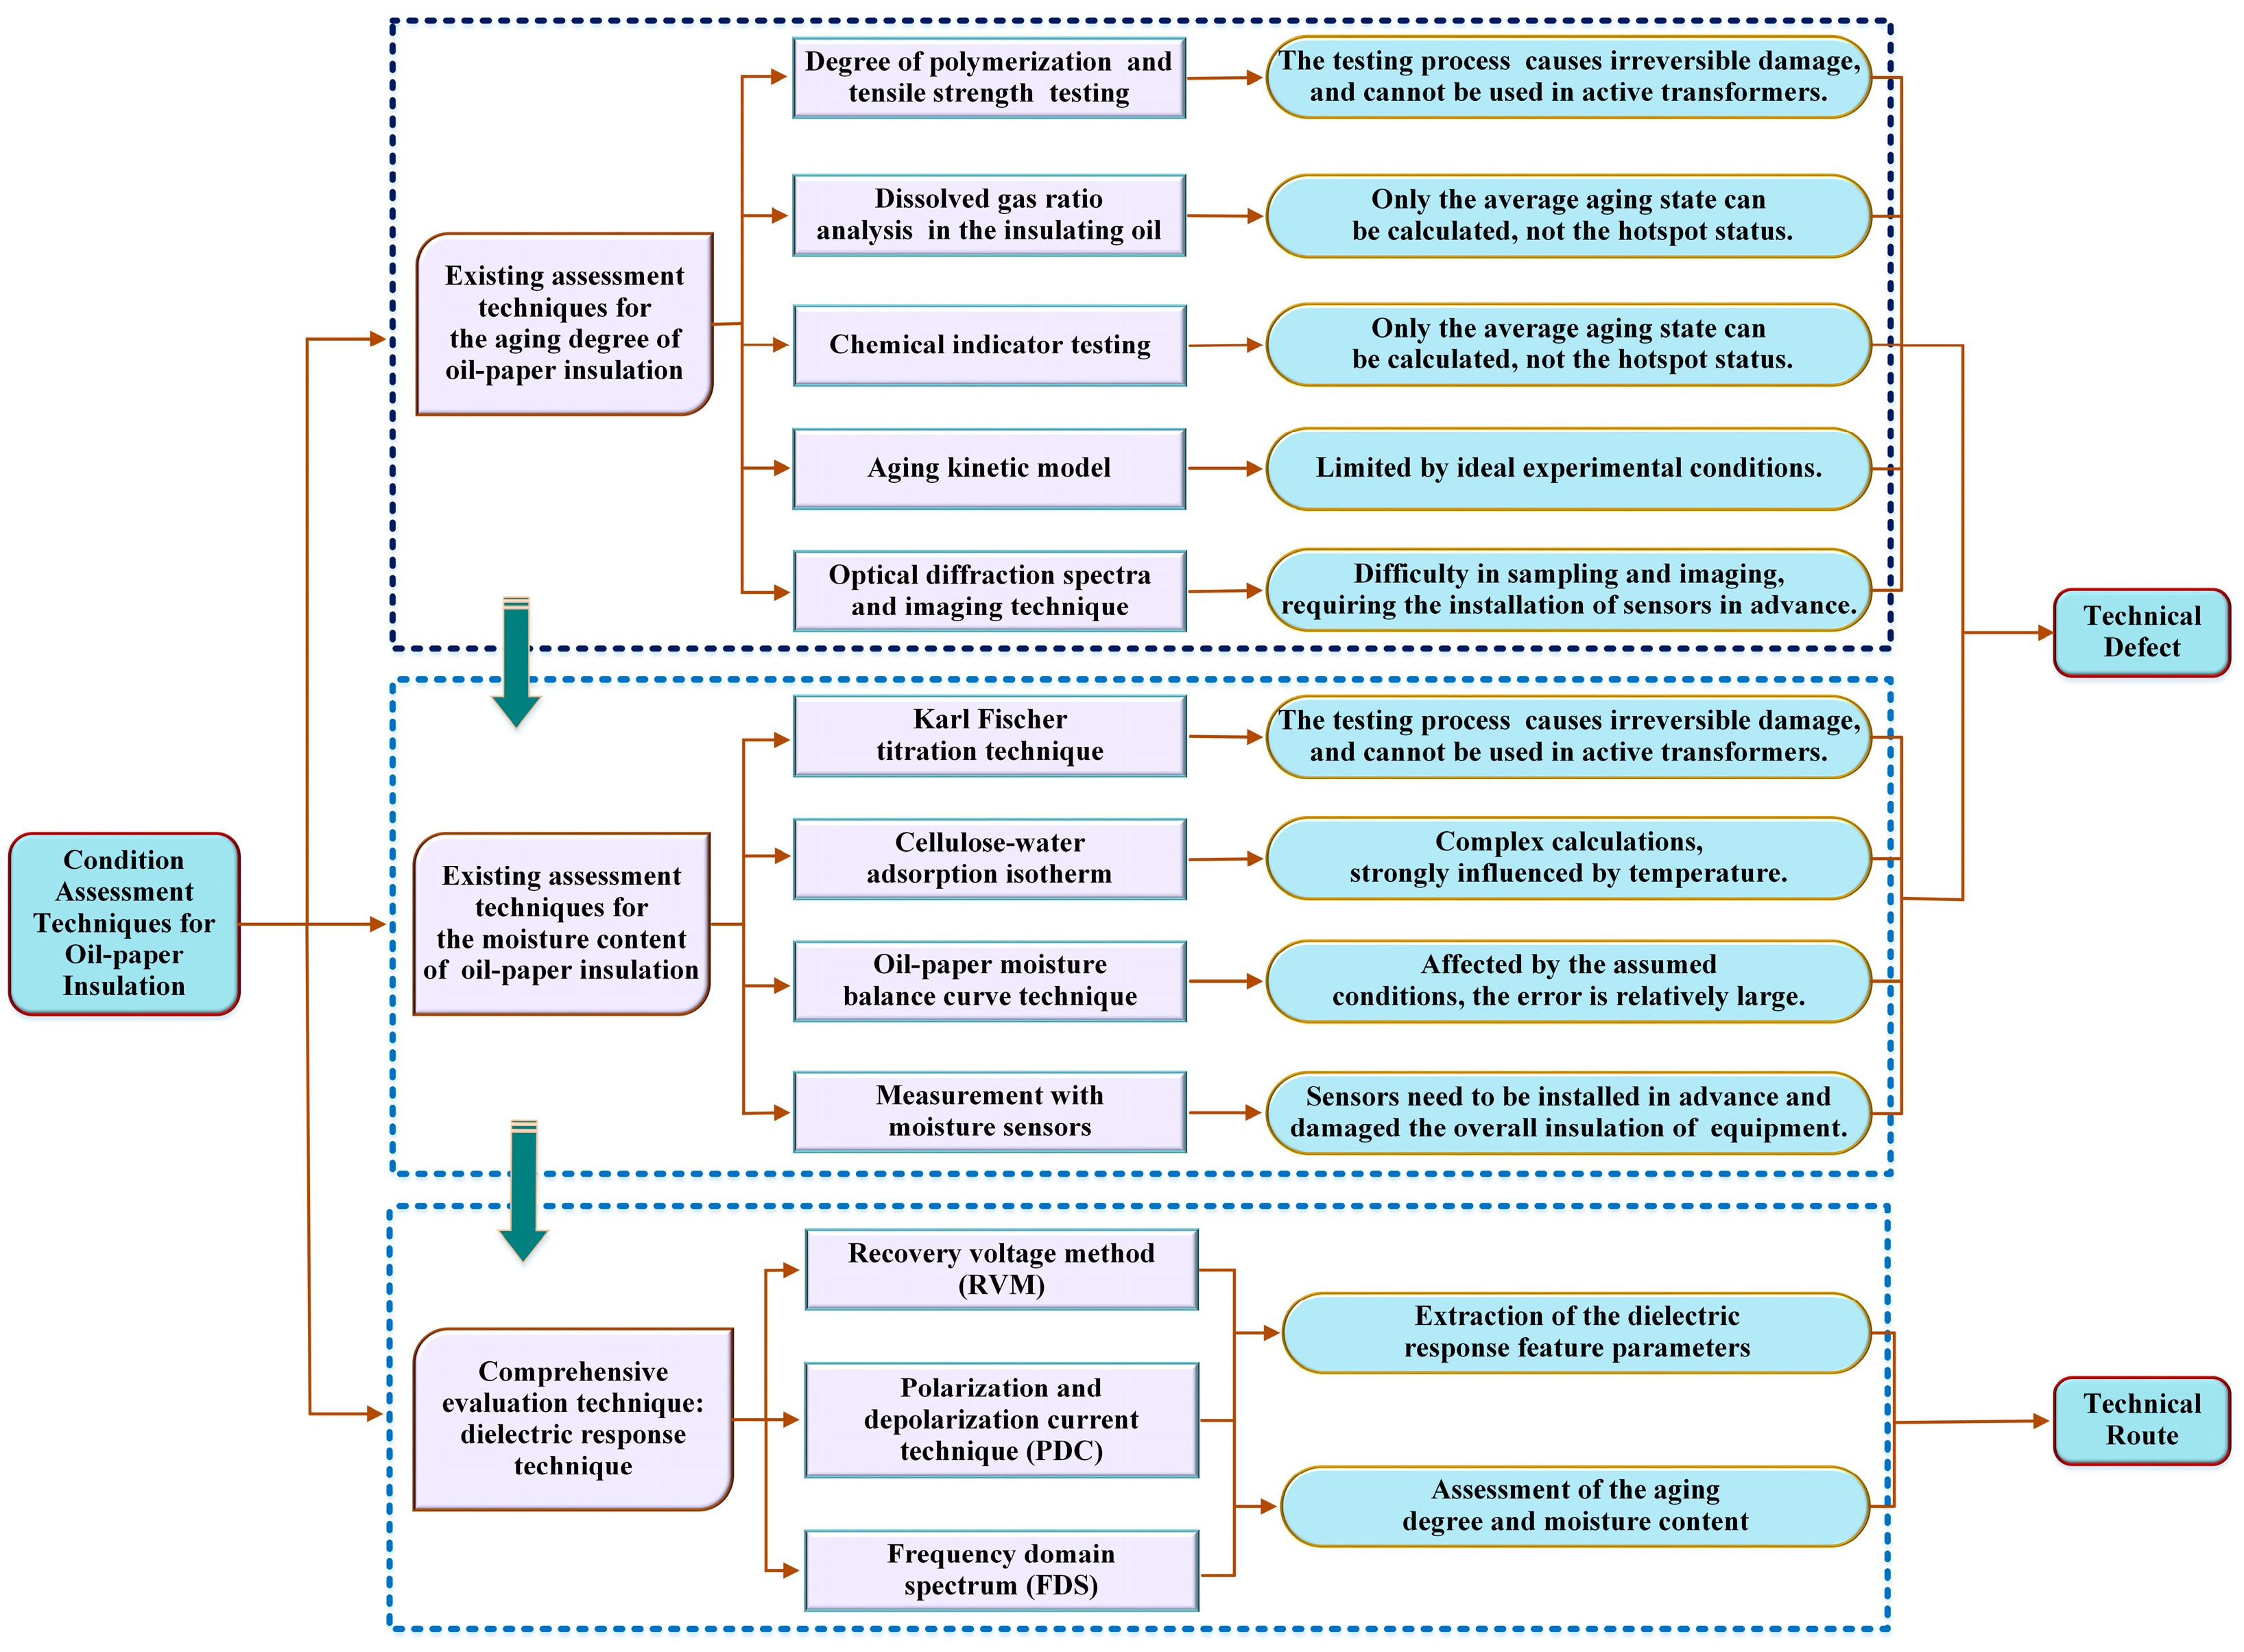
3. Techniques for Evaluating the Aging State of Oil–Paper Insulation
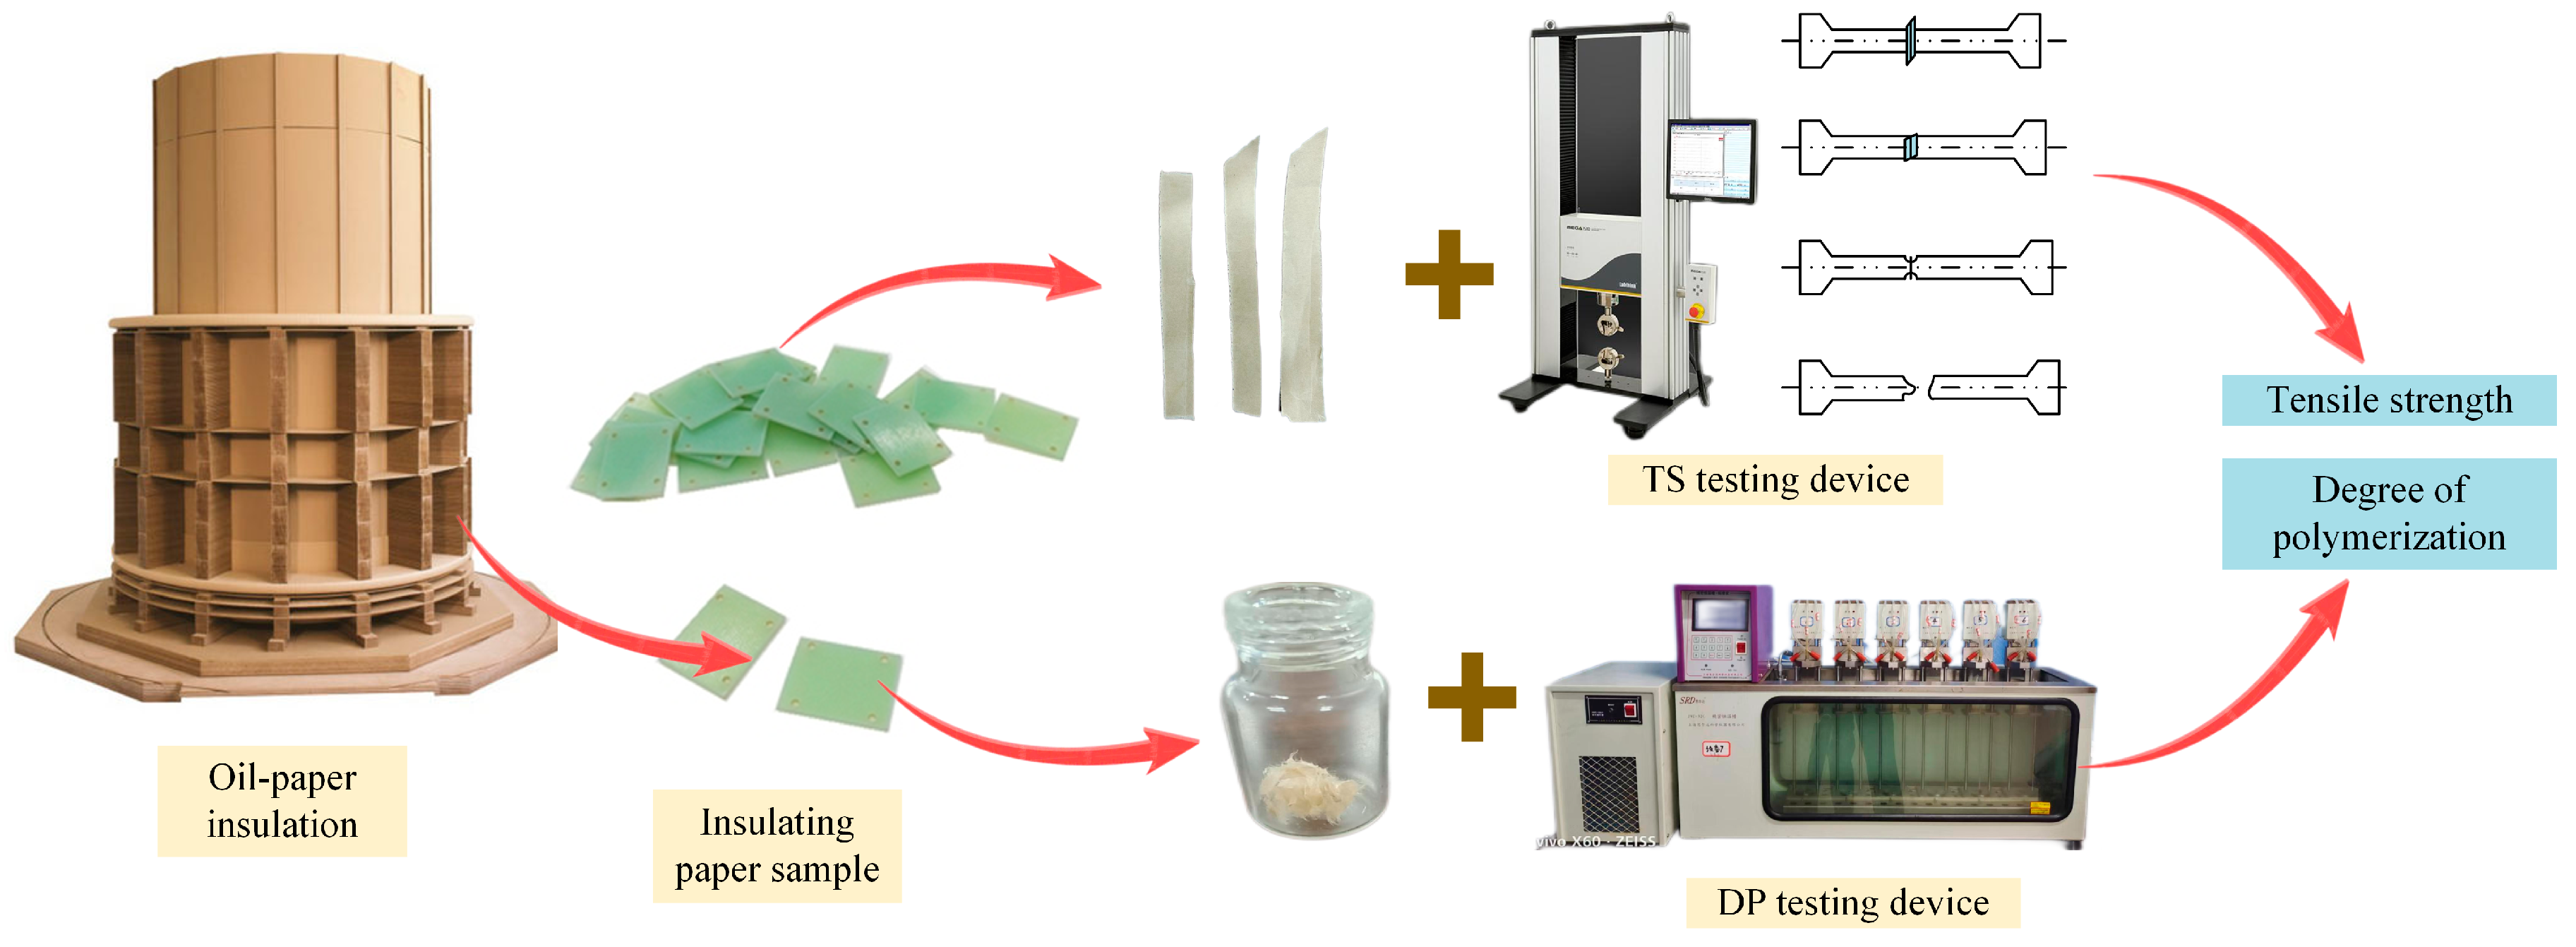
3.1. Degree of Polymerization (DP) and Tensile Strength (TS) Testing
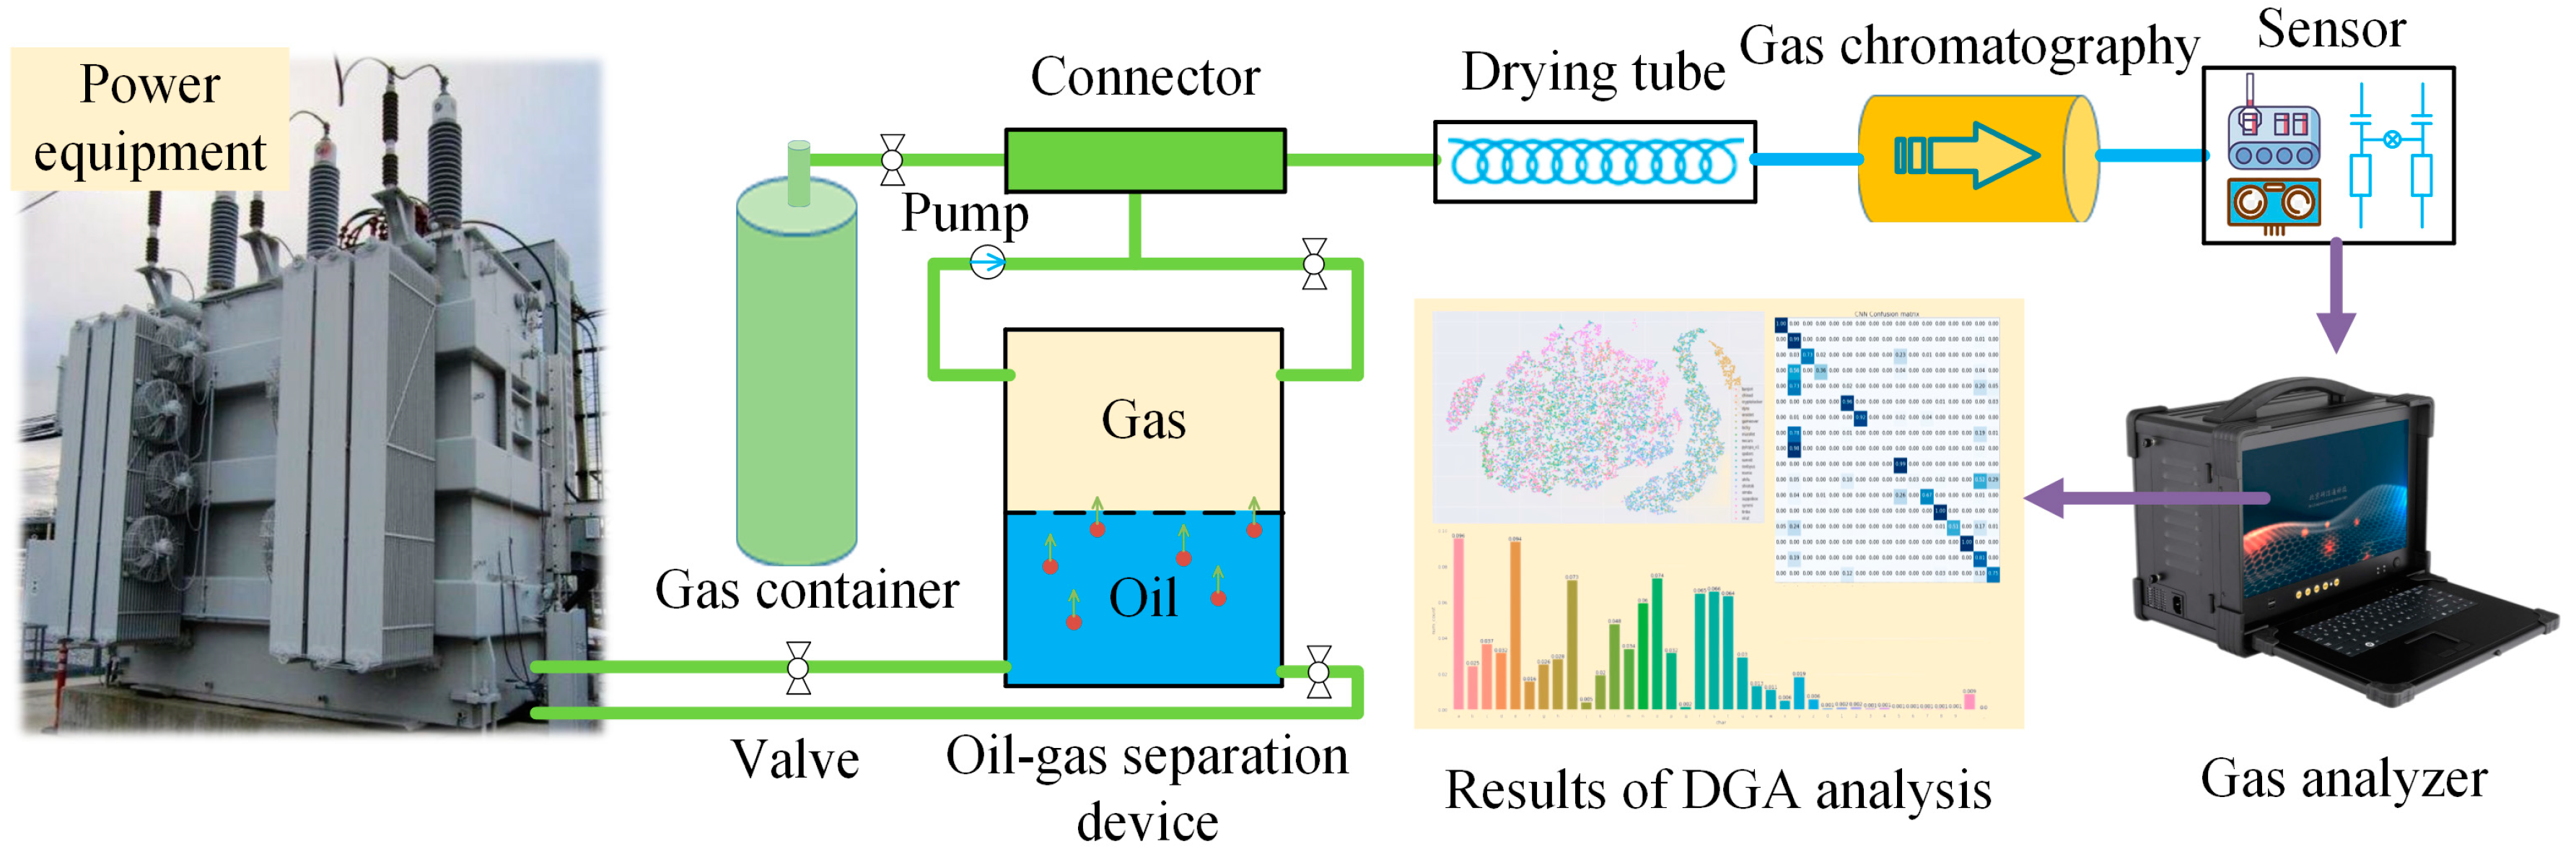
3.2. Dissolved Gas Ratio Analysis (DGA) in Insulating Oil
- (1)
- CO2/CO > 7: Oil–paper insulation is in the normal operating state.
- (2)
- CO2/CO < 6: Oil–paper insulation is in the stage of accelerated aging.
- (3)
- CO2/CO < 2: Oil–paper insulation is at a serious aging degree.
- (1)
- CO + CO2 ≈ 1 mL/g: The residual rate of DP is about 50%, and the insulating paper is in the middle aging degree.
- (2)
- CO + CO2 ≈ 3 mL/g: The residual rate of DP is about 30%, and the insulating paper is in the serious aging degree.
- (1)
- Some of the gaseous compounds are lost during the operation of pressure oil filtration and high vacuum oil filtration, which causes a deviation in the evaluation results.
- (2)
- The oxidative cracking of insulating oil and the aging of insulating paper produce the same gaseous compounds. Thus, DGA technology cannot independently evaluate the aging state of the insulating paper or the insulating oil.
- (3)
- DGA technology is effective to evaluate the average aging state of the whole insulating paper. However, it is unable to reveal the aging state of insulating paper in specific regions.
3.3. Chemical Indicator Testing
3.3.1. Furfural
3.3.2. Methanol and Ethanol
3.3.3. Formic Acid and Acetic Acid
3.4. The Aging Kinetic Model
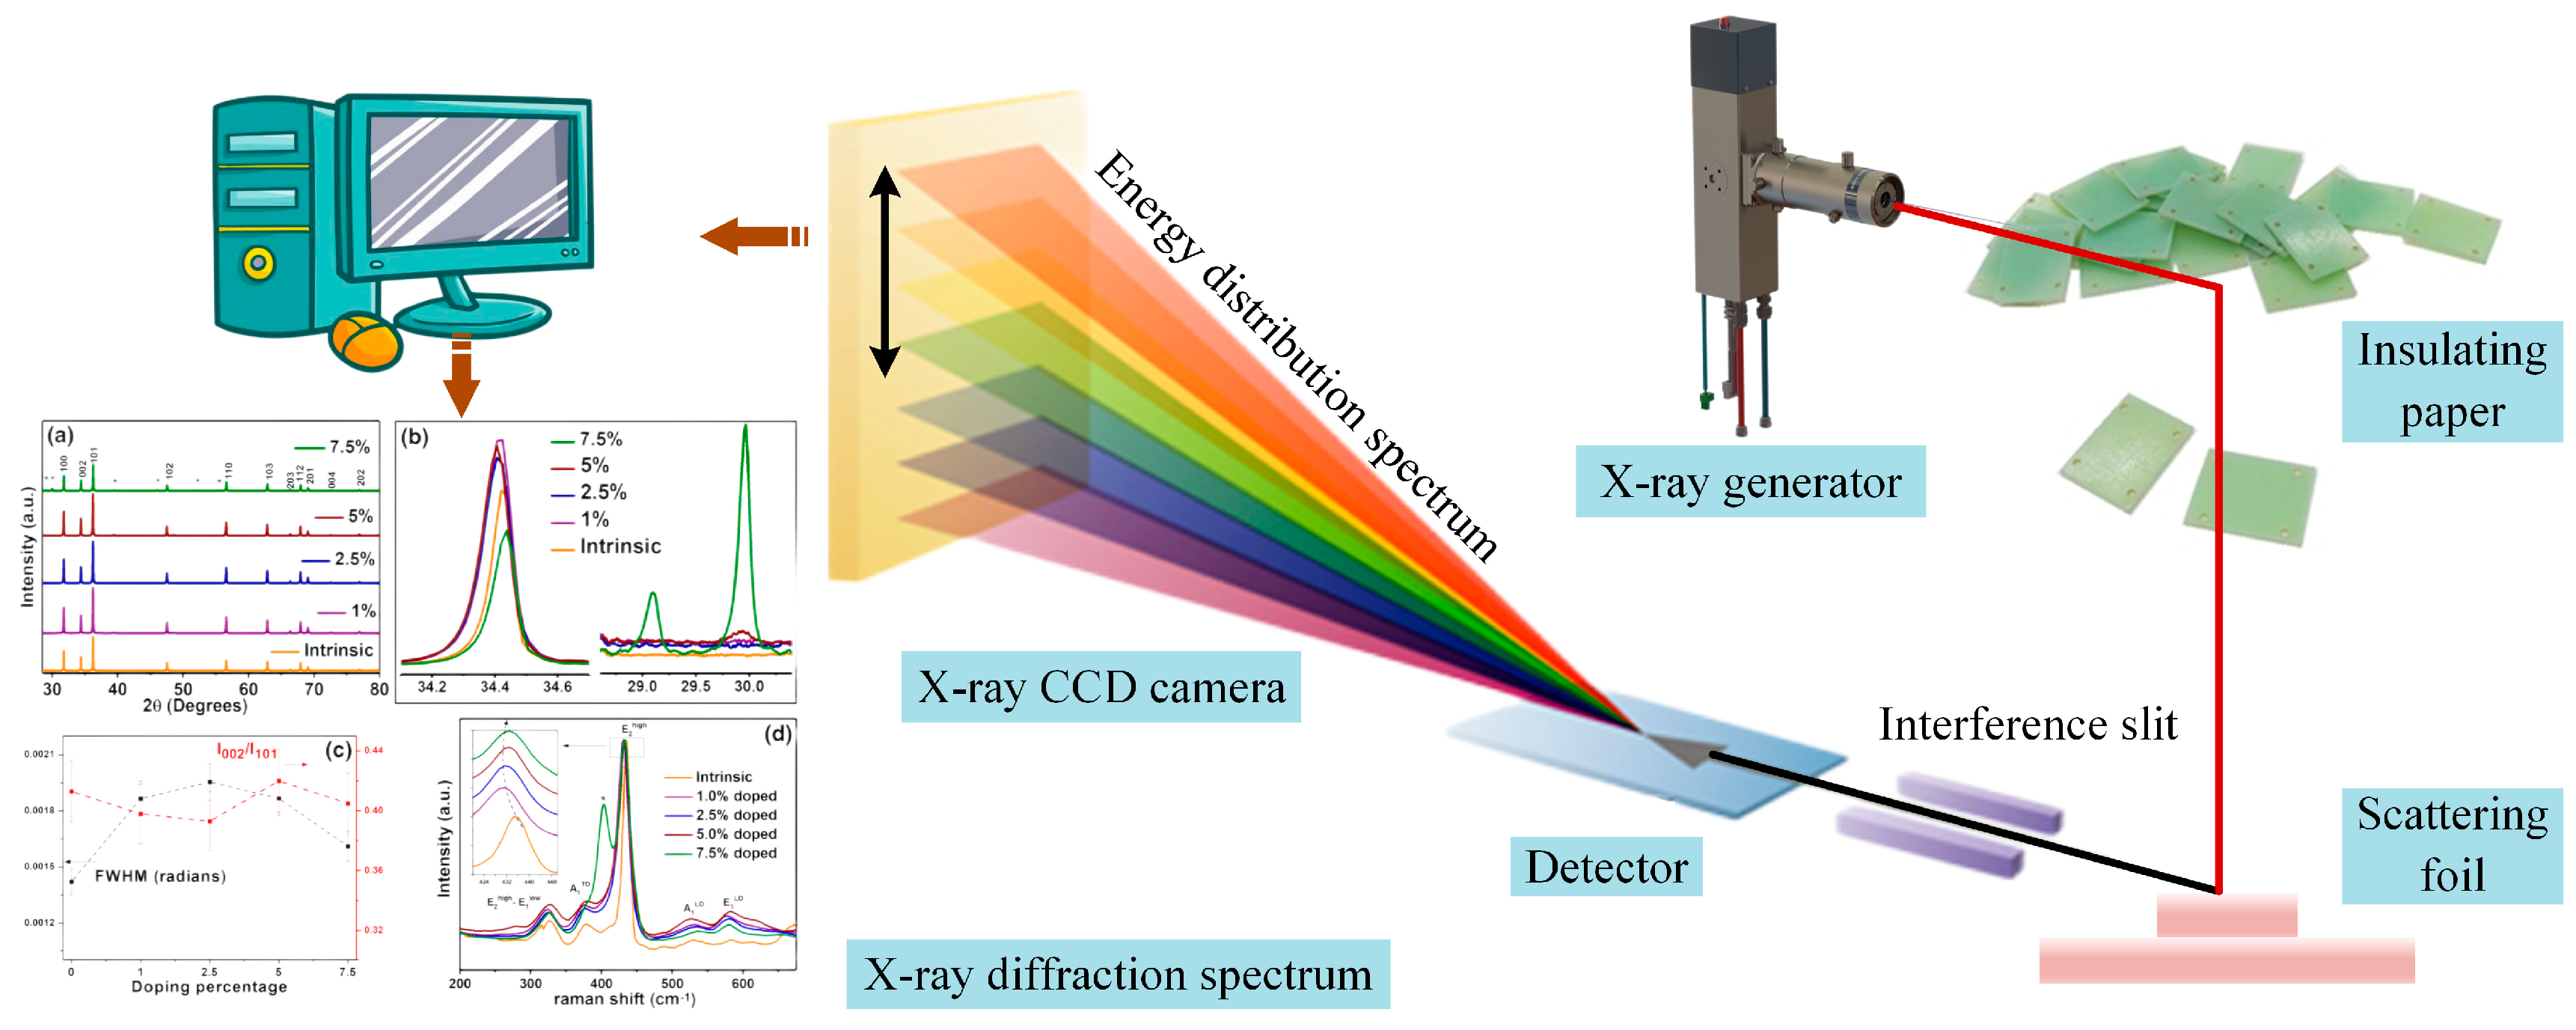
3.5. The Optical Diffraction Spectra and Imaging Technique
4. Techniques for Evaluating the Moisture Content of Oil–Paper Insulation
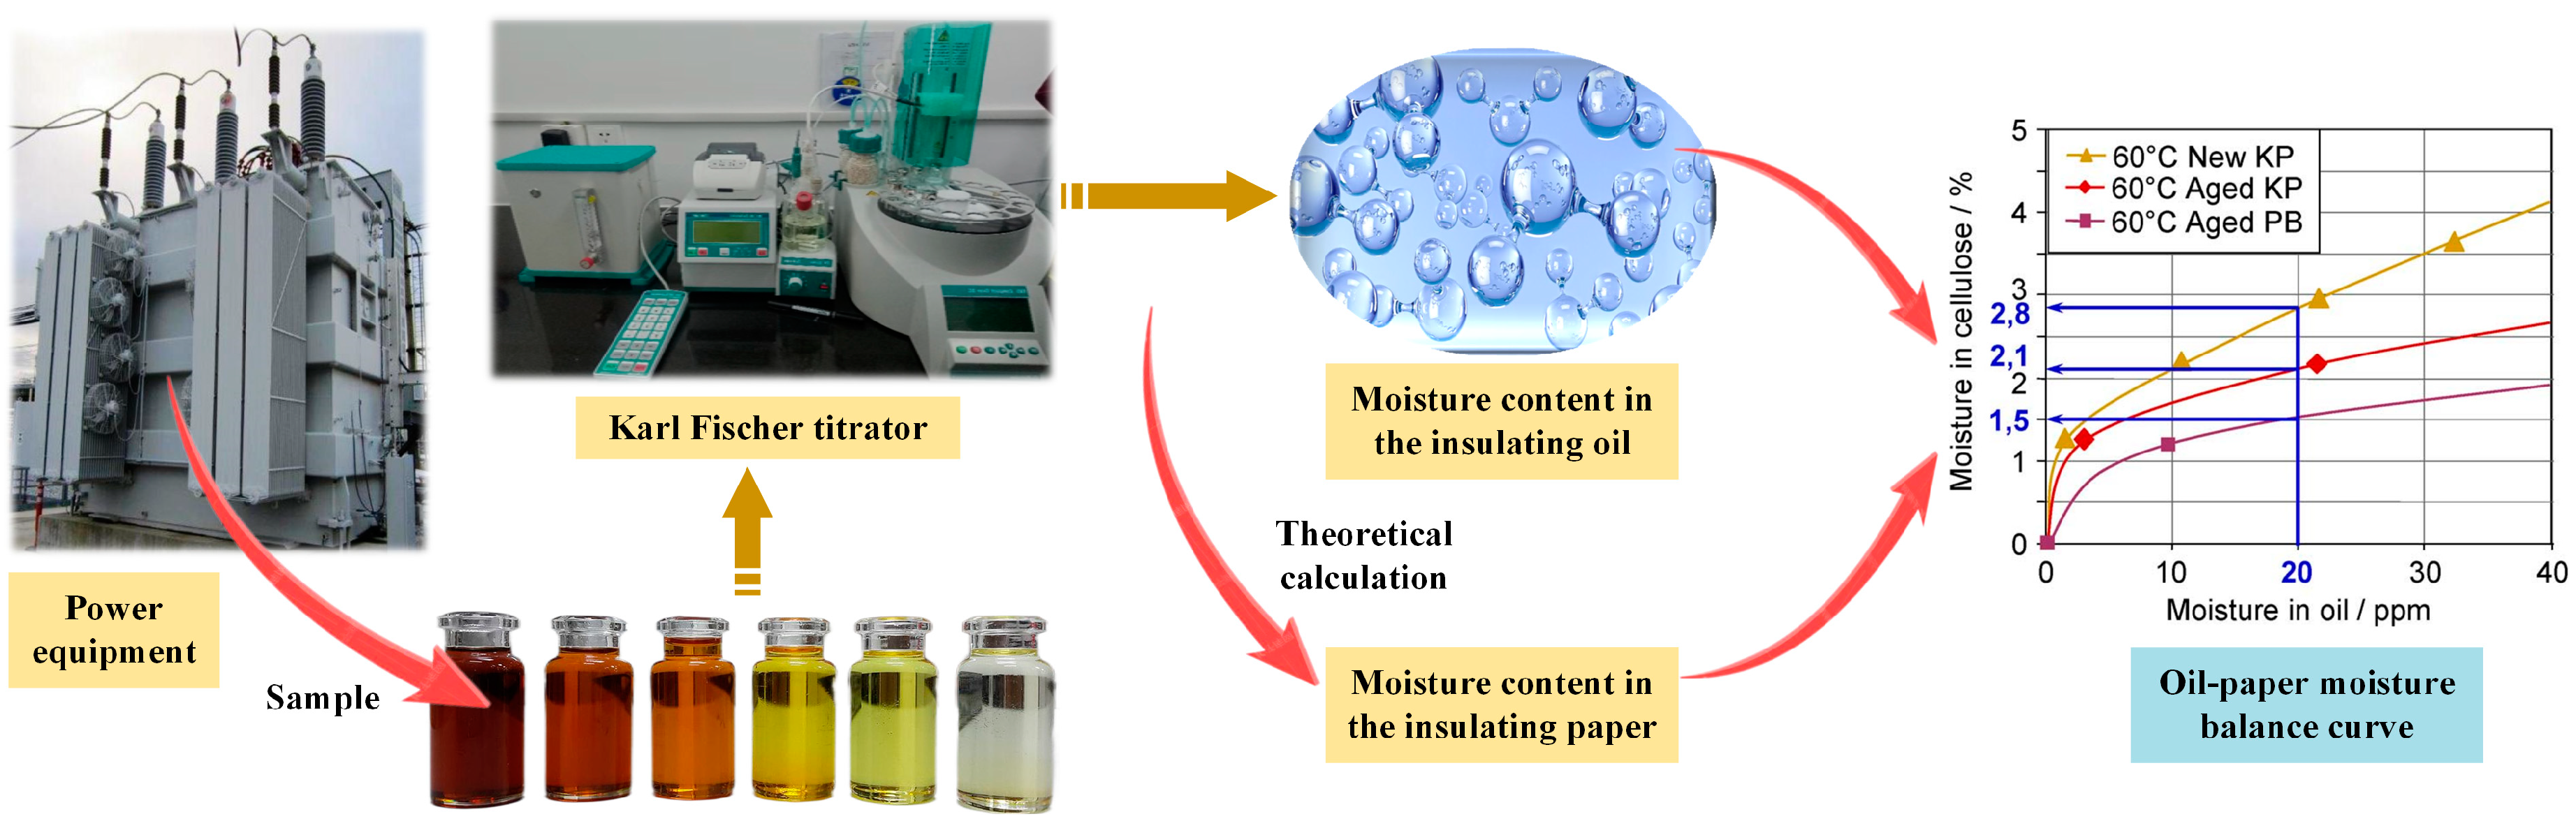
4.1. Karl Fischer Titration Technique
4.2. Cellulose–Water Adsorption Isotherm
4.3. Oil–Paper Moisture Balance Curve Technique
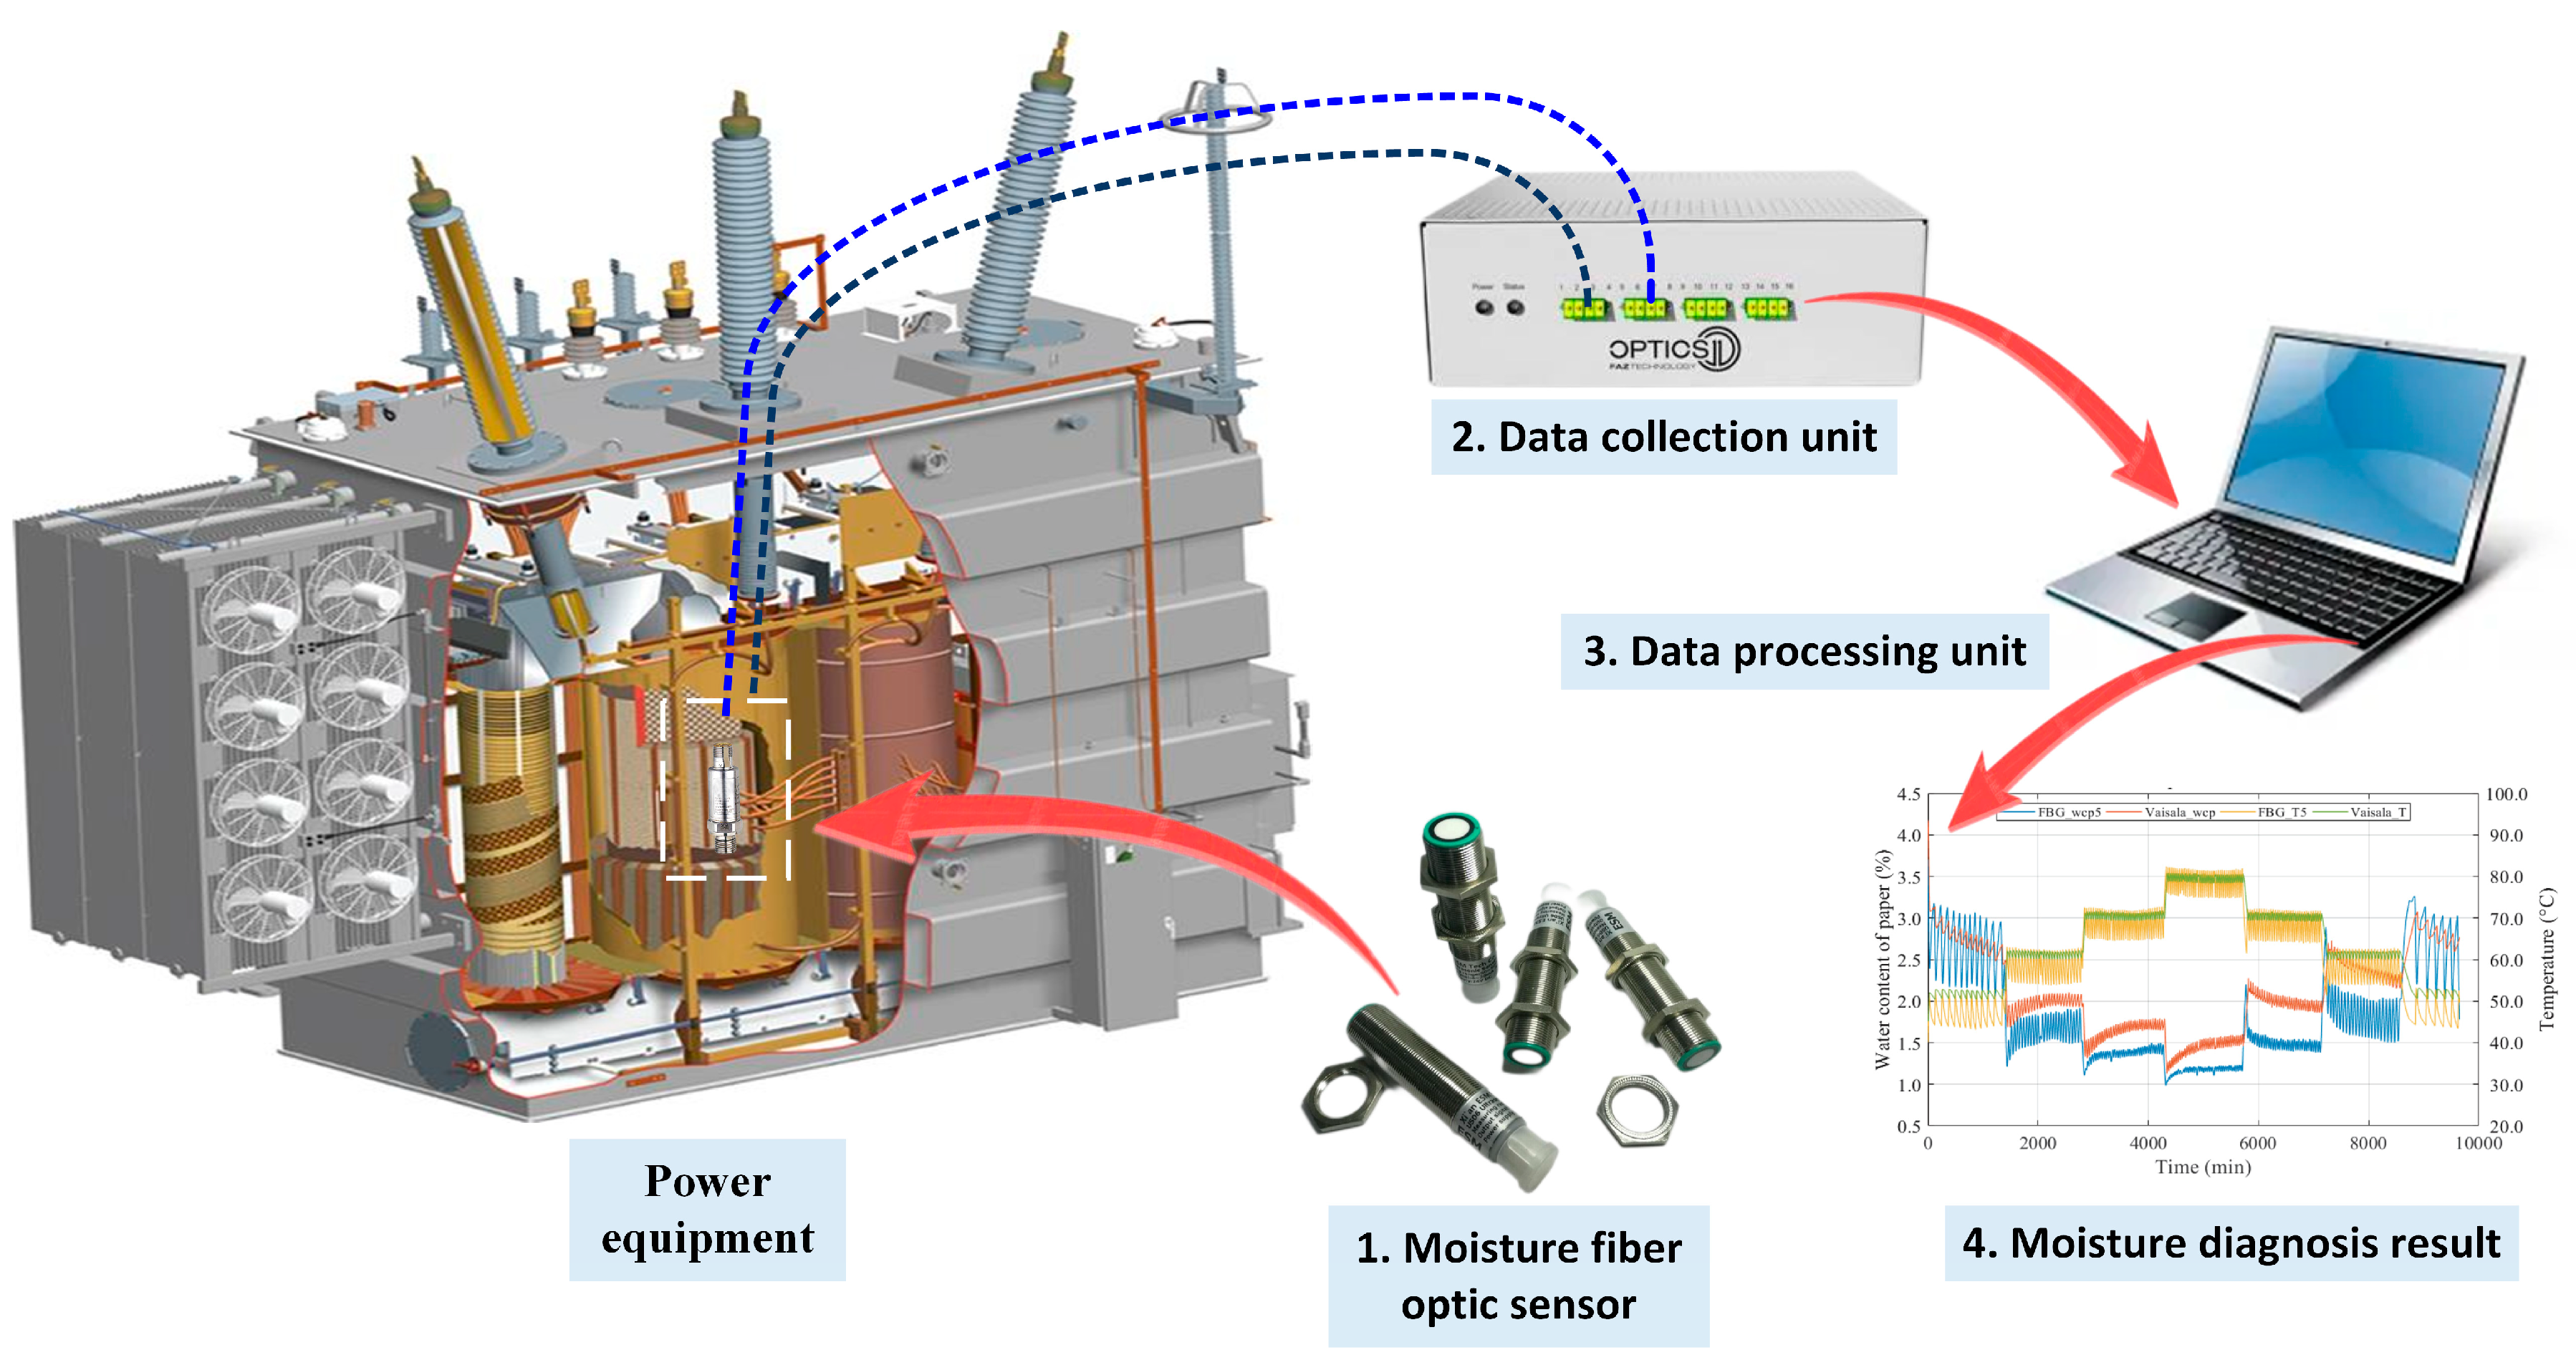
4.4. Measurement with Moisture Sensors
5. A Comprehensive Evaluation Technique: Dielectric Response Technique
5.1. Introduction of the Dielectric Response Technique
5.1.1. Recovery Voltage Method (RVM)
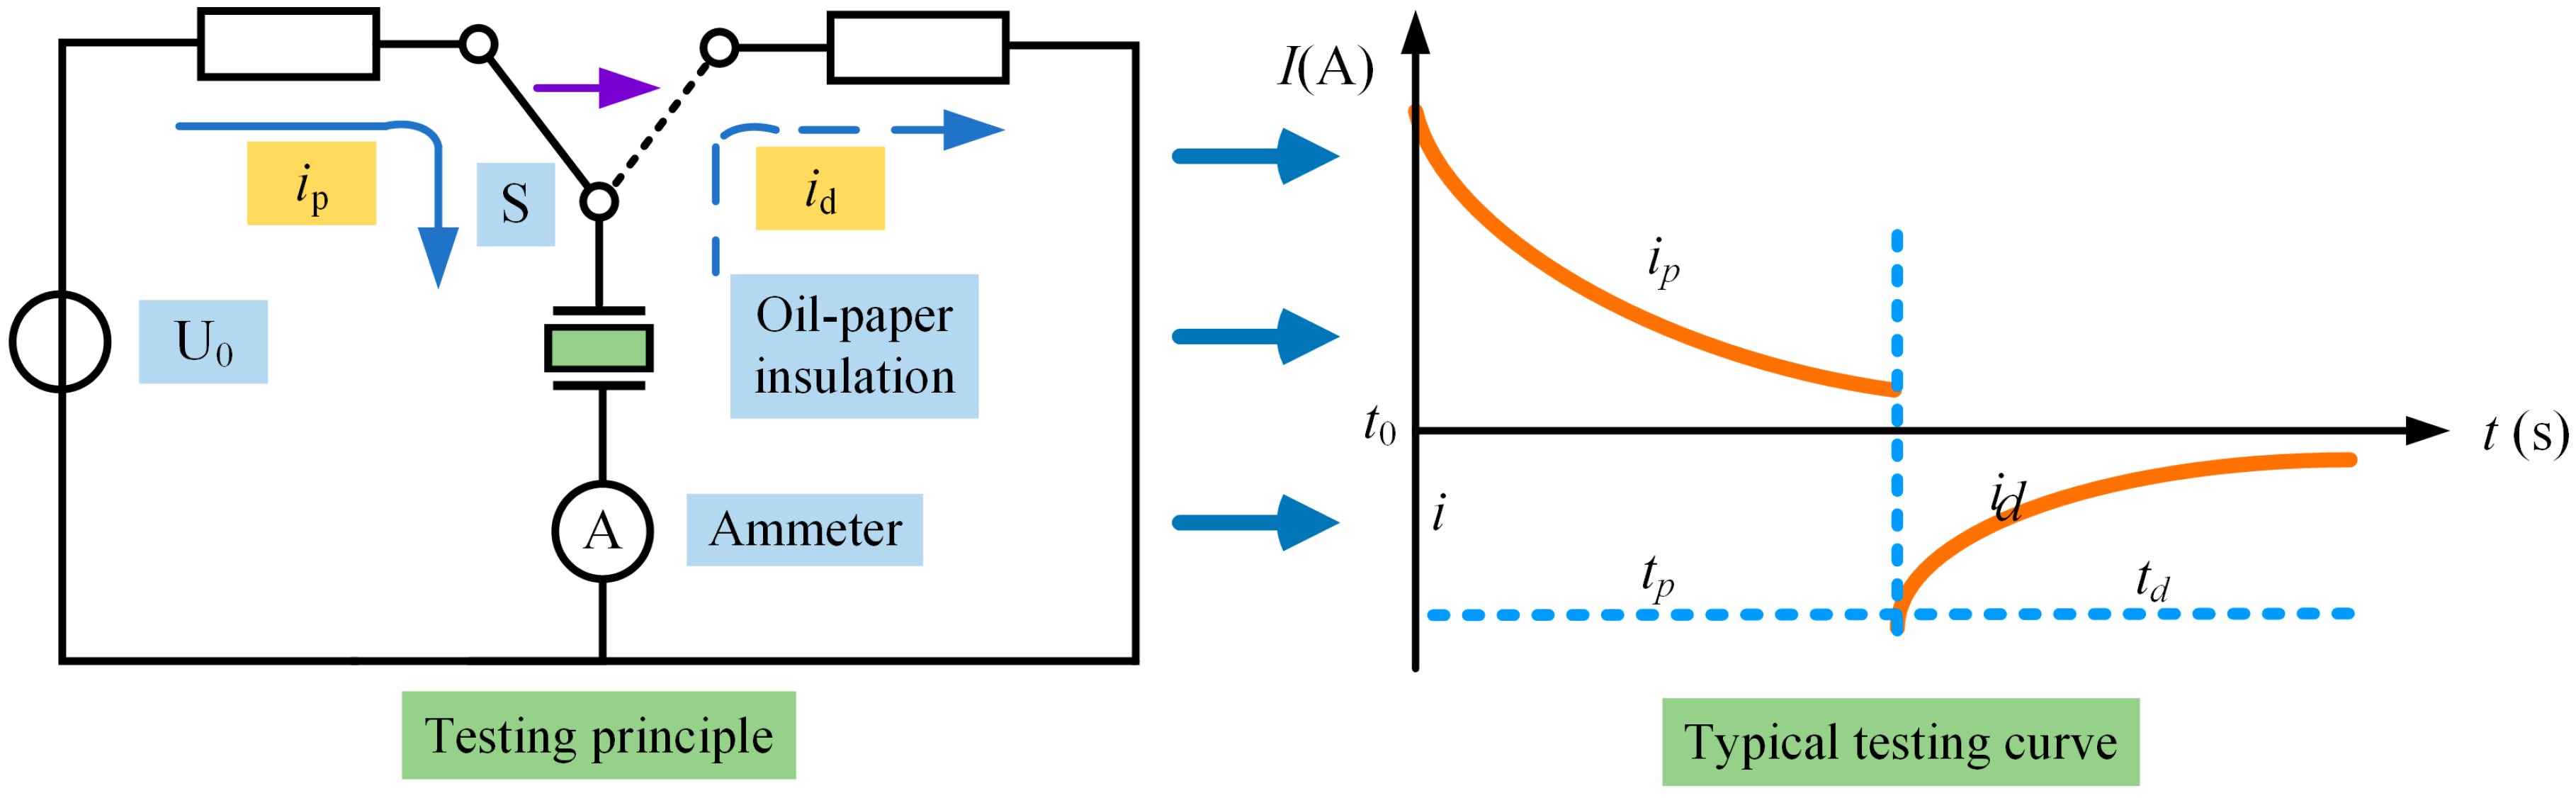
5.1.2. Polarization and Depolarization Current (PDC) Technique
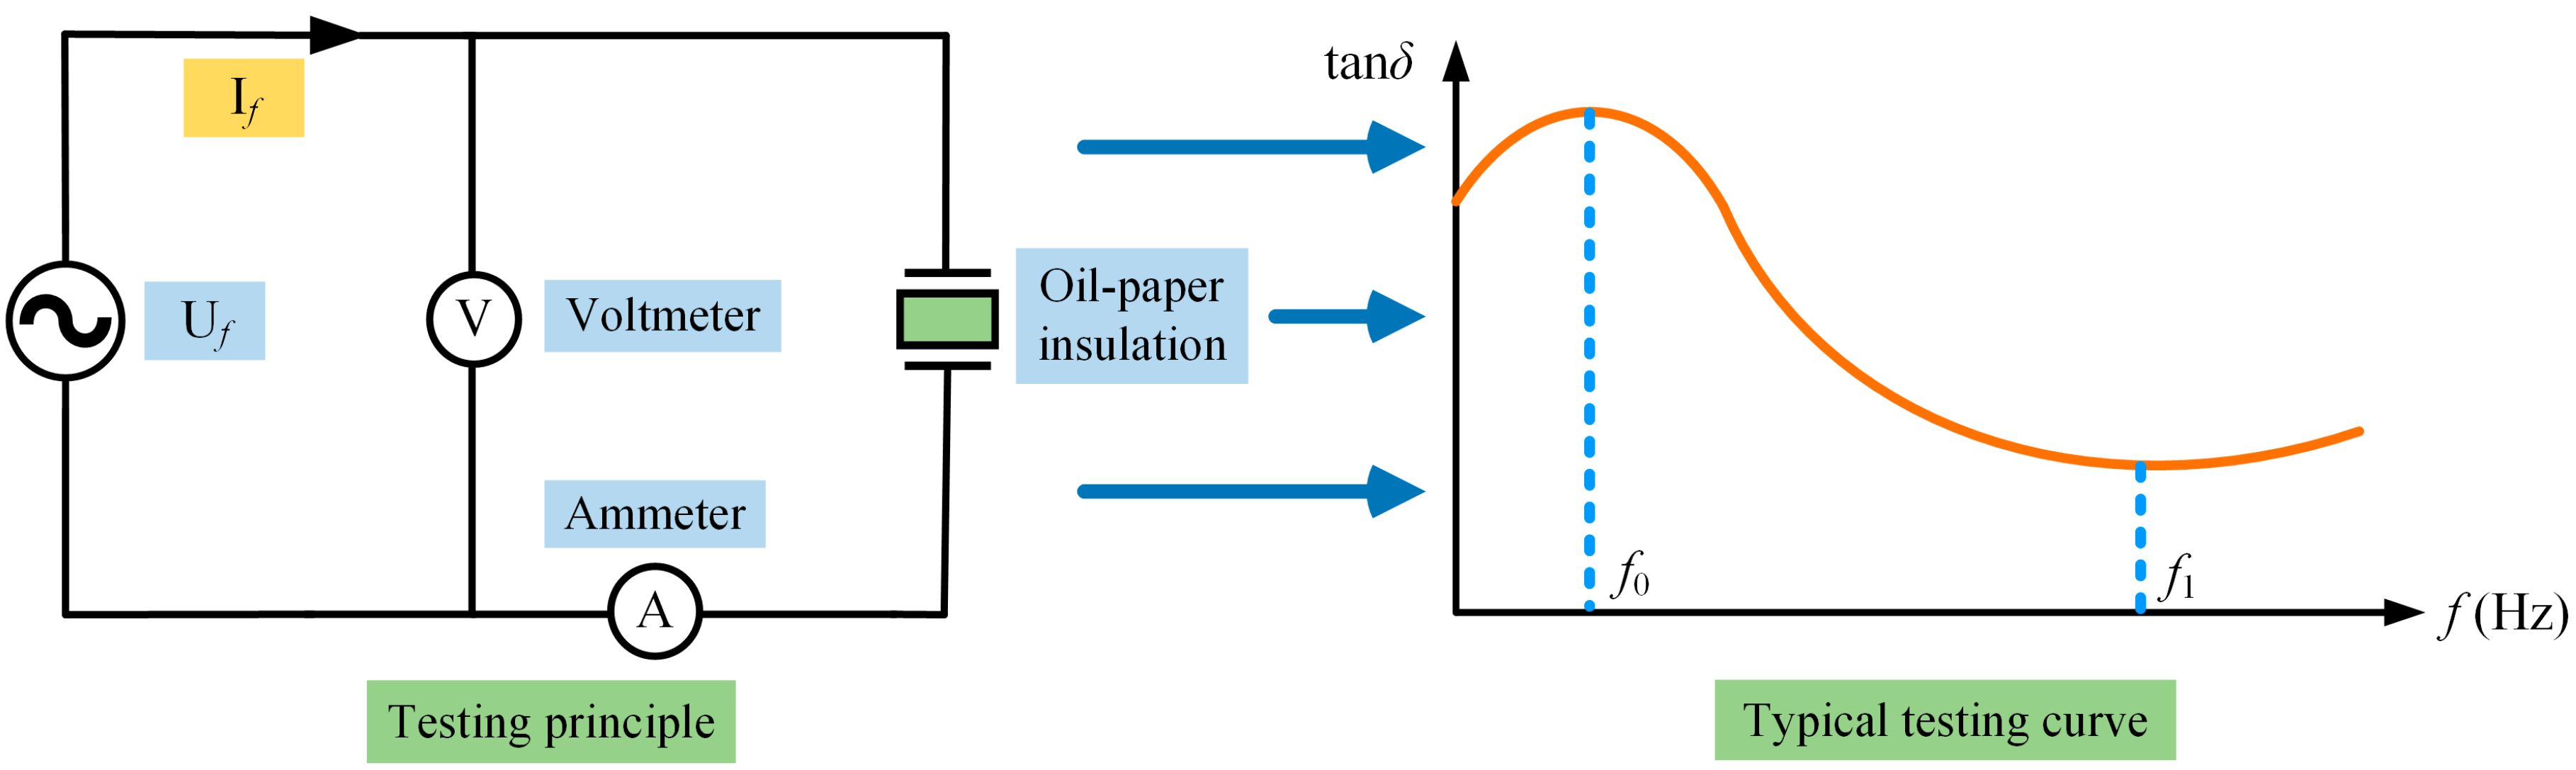
5.1.3. Frequency Domain Spectrum (FDS)
5.2. Extraction of the Dielectric Response Feature Parameters
5.2.1. Extracting the Shape Characteristics and Geometric Parameters of the FDS Curve
5.2.2. Processing the FDS Curve Based on the Mathematical Methods
5.2.3. Fitting the FDS Curve Based on the Frequency Dielectric Equivalent Circuit Models
5.3. Assessment of the Aging Degree and Moisture Content
5.3.1. Insulation States Evaluation Using Curve and Surface Fitting Techniques
5.3.2. Insulation States Evaluation Using Machine Learning Techniques
6. Prospects for the Future Research
6.1. Research on Hotspots’ Oil–Paper Insulation System
6.1.1. The Engineering Significance of the Hotspot Research
6.1.2. Existing Results of Hotspot Research
6.1.3. Potential Issues with Hotspot Research
6.2. Research on the Joint Evaluation Technique of Electrical–Chemical Feature Parameters
6.2.1. The Engineering Significance of the Joint Evaluation Technique
6.2.2. Existing Results on the Joint Evaluation Technique
6.2.3. Potential Issues of the Joint Evaluation Technique
7. Conclusions
- The oil–paper insulation system in the power equipment is made up of insulating paper and insulating oil, and the geometry structure of the oil–paper insulation has been shown in Section 2. Also, the preparation process and microscopic structure of the insulating paper and insulating oil have been introduced. Meanwhile, the internal reason for the great insulation performance of the oil–paper insulation has been revealed. Finally, the main reasons for and forms of the oil-–paper insulation’s degradation process have been discussed.
- The techniques for evaluating the oil–paper insulation’s aging degree and moisture content have been reported in Section 3 and Section 4, respectively. These techniques can be divided into destructive techniques (such as DP and TS testing) and non-destructive techniques (such as chemical indicators testing). Meanwhile, they can be divided into direct measurement techniques (such as the Karl Fischer titration technique) and indirect calculation techniques (such as the cellulose–water adsorption isotherm technique). The technical principles of these techniques have been introduced, and the development process and research results of these techniques have been reported in detail. Finally, the main advantages and limitations of these techniques have been discussed and analyzed.
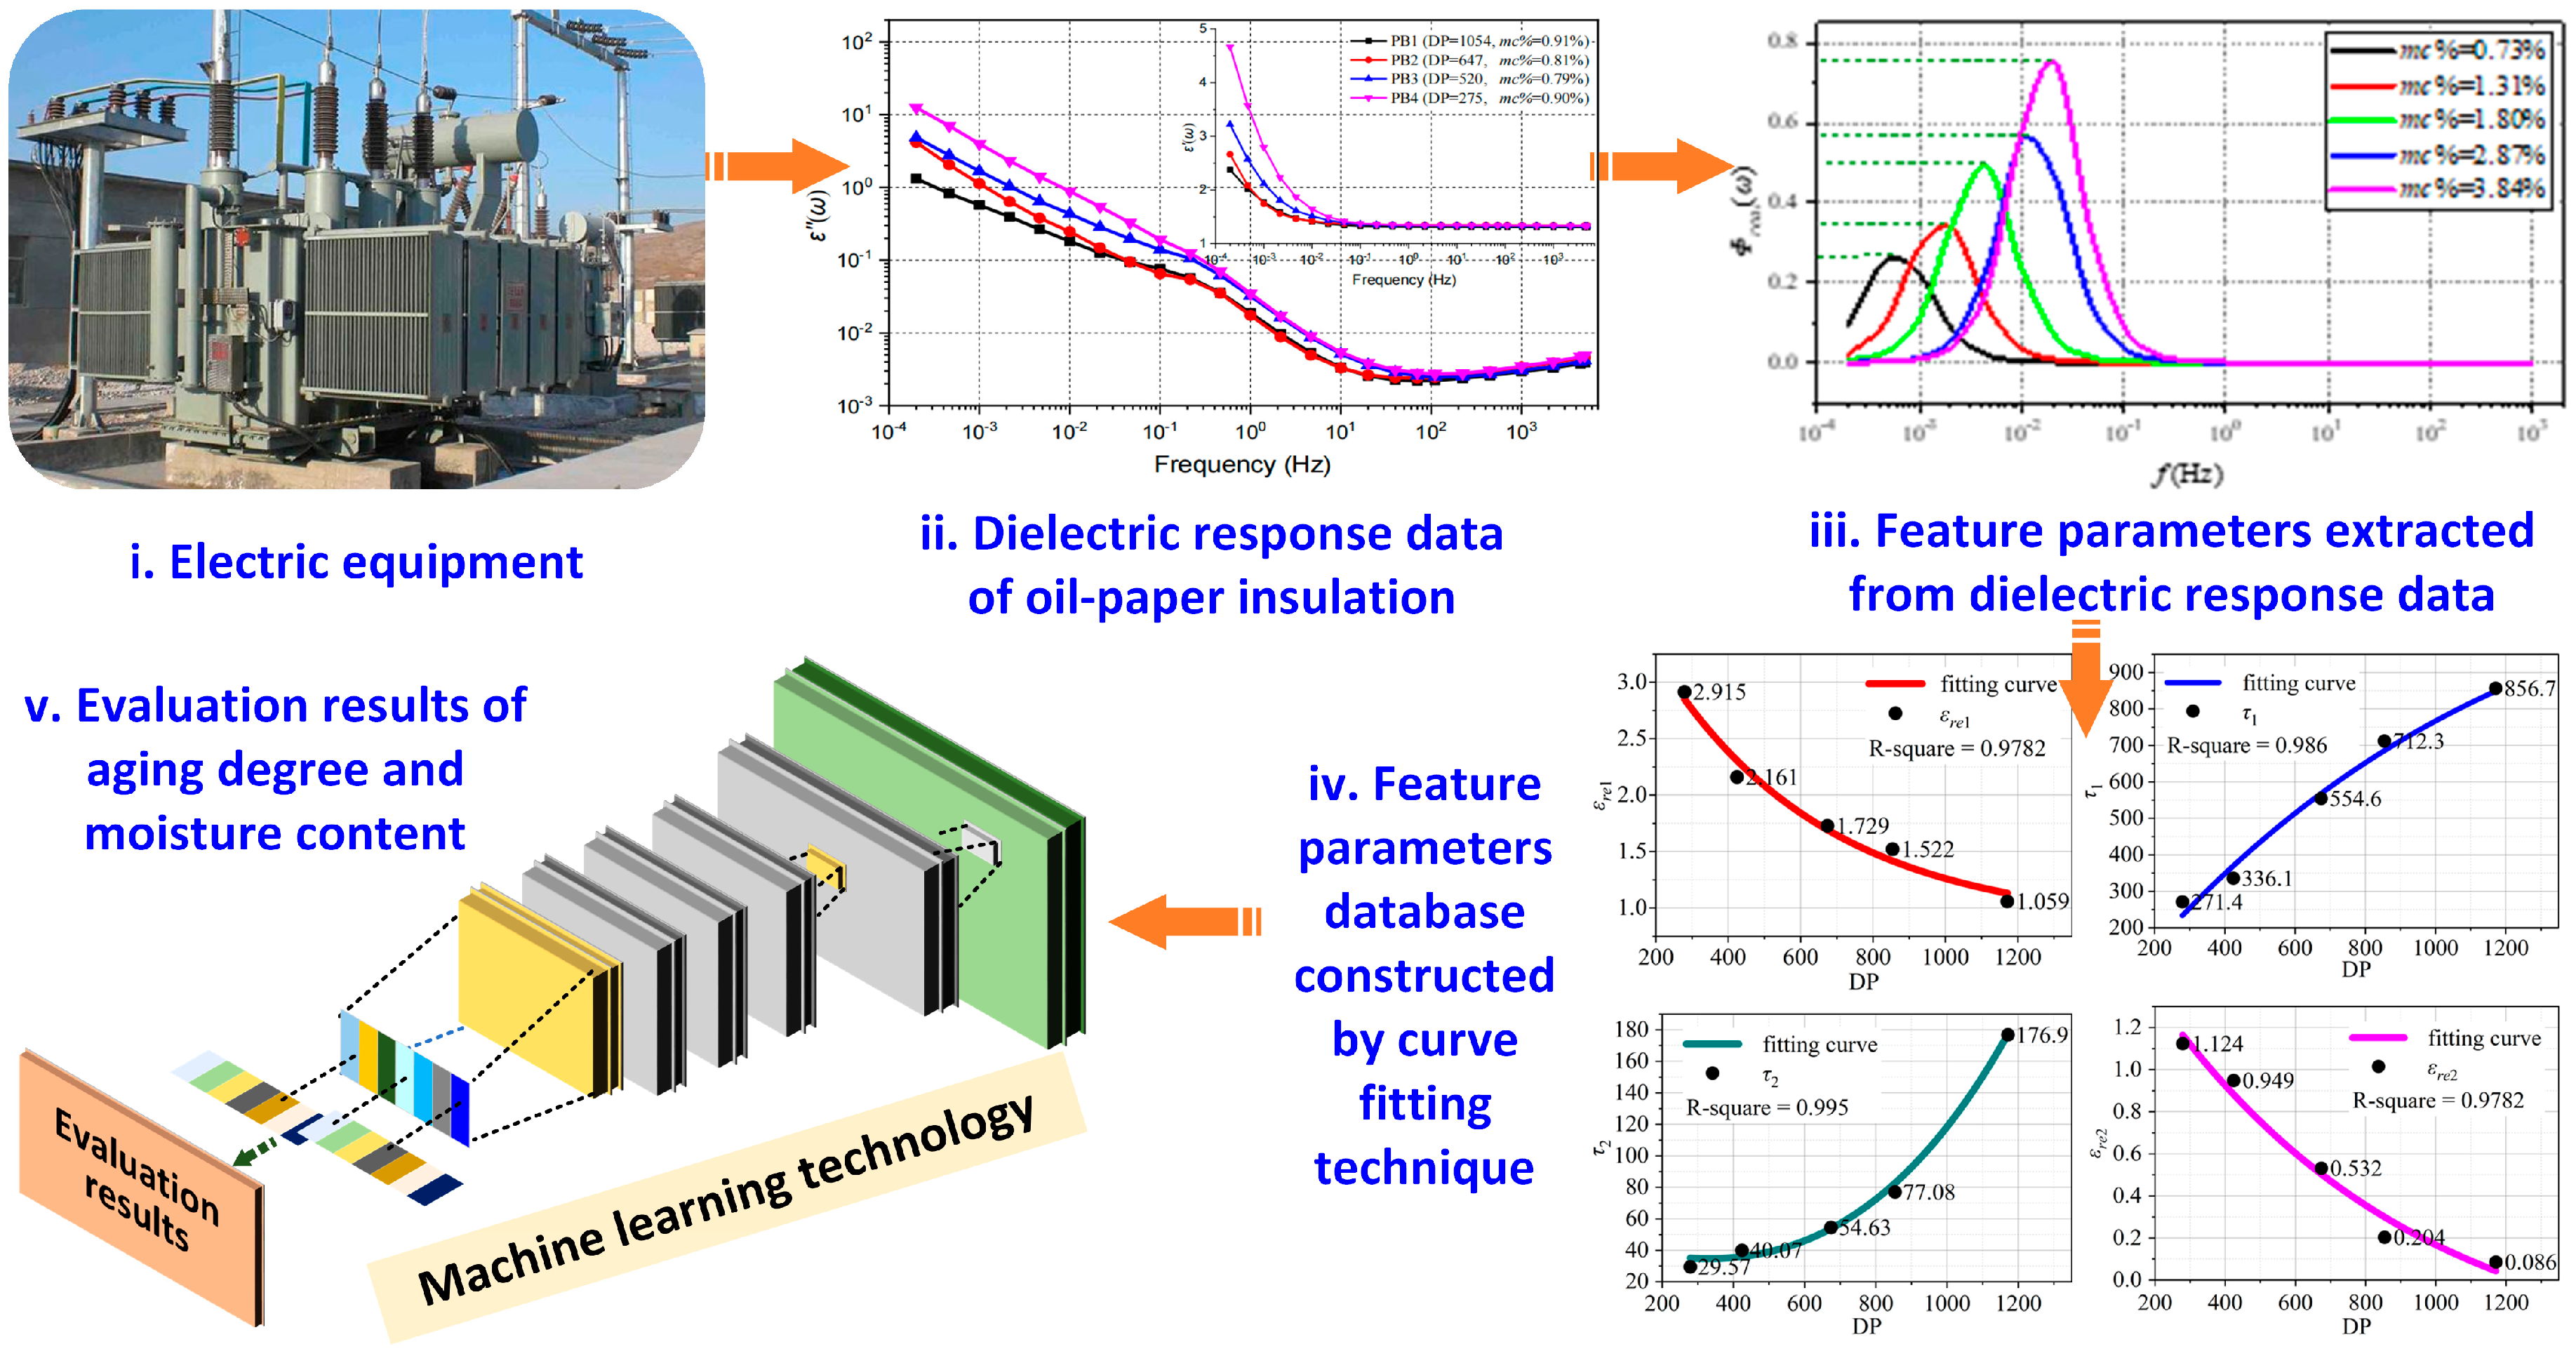
- The techniques introduced in Section 3 and Section 4 are only effective for evaluating a single insulation state (aging degree and moisture content) of oil–paper insulation. However, the dielectric response technique introduced in Section 5 can be adopted to evaluate the aging degree and moisture content of oil–paper insulation simultaneously. The whole evaluation process based on the dielectric response technique can be divided into three parts: (1) collecting the dielectric response data of oil–paper insulation (RVM, PDC, and FDS), (2) extracting the feature parameters from the collected dielectric response data, which are related to the aging degree and moisture content of the oil–paper insulation, and (3) establishing insulation state evaluation models based on the curve/surface fitting techniques and machine learning techniques.
- Two full potential topics have been introduced in Section 6, which are research on hotspots’ oil–paper insulation systems and research on the joint evaluation technique of electrical–chemical feature parameters. The existing research on the hotspot focuses on the extraction of feature parameters, which can reflect the aging degree and moisture content of the hotspot’s oil–paper insulation. In future work, it is important to reveal the practical physical meaning of the extracted feature parameters and establish an insulation state evaluation model for the hotspot’s oil–paper insulation. As for the electrical–chemical joint evaluation technique, it is critical to improve its ability to process complex input data and uncover effective feature information, so a deep learning technique is an ideal choice.
Author Contributions
Funding
Conflicts of Interest
References
- Shu, Y.; Chen, W. Research and application of UHV power transmission in China. High Volt. 2018, 3, 1–13. [Google Scholar] [CrossRef]
- Tenbohlen, S.; Coenen, S.; Djamali, M.; Müller, A.; Samimi, M.H.; Siegel, M. Diagnostic measurements for power transformers. Energies 2016, 9, 347. [Google Scholar] [CrossRef]
- Wang, M.; Vandermaar, A.J.; Srivastava, K.D. Review of condition assessment of power transformers in service. IEEE Electr. Insul. Mag. 2002, 18, 12–25. [Google Scholar] [CrossRef]
- Li, S.; Li, J. Condition monitoring and diagnosis of power equipment: Review and prospective. High Volt. 2017, 2, 82–91. [Google Scholar] [CrossRef]
- Liao, R.; Liu, J.; Yang, L.; Wang, K.; Hao, J.; Ma, Z.; Gao, J.; Lv, Y. Quantitative analysis of insulation condition of oil-paper insulation based on frequency domain spectroscopy. IEEE Trans. Dielectr. Electr. Insul. 2015, 22, 322–334. [Google Scholar] [CrossRef]
- Tang, C.; Huang, B.; Hao, M.; Xu, Z.; Hao, J.; Chen, G. Progress of space charge research on oil-paper insulation using pulsed electroacoustic techniques. Energies 2016, 9, 53. [Google Scholar] [CrossRef]
- Liao, R.; Yang, L.; Li, J.; Grzybowski, S. Aging condition assessment of transformer oil-paper insulation model based on partial discharge analysis. IEEE Trans. Dielectr. Electr. Insul. 2011, 18, 303–311. [Google Scholar] [CrossRef]
- Song, R.; Chen, W.; Yang, D.; Zhang, R.; Wang, Z. Aging assessment of oil–paper insulation based on visional recognition of the dimensional expanded Raman spectra. IEEE Trans. Instrum. Meas. 2021, 70, 1–10. [Google Scholar] [CrossRef]
- Dong, M.; Ren, M.; Wen, F.; Zhang, C.; Liu, J. Explanation and analysis of oil-paper insulation based on frequency-domain dielectric spectroscopy. IEEE Trans. Dielectr. Electr. Insul. 2015, 22, 2684–2693. [Google Scholar] [CrossRef]
- Przybylek, P. The influence of temperature and aging of cellulose on water distribution in oil-paper insulation. IEEE Trans. Dielectr. Electr. Insul. 2013, 20, 552–556. [Google Scholar] [CrossRef]
- Zhang, E.; Liu, J.; Zhang, C.; Zheng, P.; Nakanishi, Y.; Wu, T. State-of-Art Review on Chemical Indicators for Monitoring the Aging Status of Oil-Immersed Transformer Paper Insulation. Energies 2023, 16, 1396. [Google Scholar] [CrossRef]
- Yan, J.; Liao, R.; Yang, L.; Li, J. Study on microstructure and electrical properties of oil-impregnated paper insulation after exposure to partial discharge. Eur. Trans. Electr. Power 2012, 22, 733–746. [Google Scholar] [CrossRef]
- Mo, Y.; Yang, L.; Hou, W.; Zou, T.; Huang, Y.; Zheng, X.; Liao, R. Preparation of cellulose insulating paper of low dielectric constant by OAPS grafting. Cellulose 2019, 26, 7451–7468. [Google Scholar] [CrossRef]
- Jalbert, J.; Rodriguez-Celis, E.M.; Arroyo-Fernández, O.H.; Duchesne, S.; Morin, B. Methanol marker for the detection of insulating paper degradation in transformer insulating oil. Energies 2019, 12, 3969. [Google Scholar] [CrossRef]
- Okabe, S.; Kaneko, S.; Kohtoh, M.; Amimoto, T. Analysis results for insulating oil components in field transformers. IEEE Trans. Dielectr. Electr. Insul. 2010, 17, 302–311. [Google Scholar] [CrossRef]
- Wang, X.; Tang, C.; Huang, B.; Hao, J.; Chen, G. Review of research progress on the electrical properties and modification of mineral insulating oils used in power transformers. Energies 2018, 11, 487. [Google Scholar] [CrossRef]
- Han, S.; Li, Q.; Li, C.; Yan, J. Electrical and mechanical properties of the oil-paper insulation under stress of the hot spot temperature. IEEE Trans. Dielectr. Electr. Insul. 2014, 21, 179–185. [Google Scholar] [CrossRef]
- He, Y.; Yang, L.; Cheng, L.; Chen, Q.; Yu, H.; Hou, W. Cellulose hydrogen bond detection using terahertz time-domain spectroscopy to indicate deterioration of oil–paper insulation. Cellulose 2023, 30, 727–740. [Google Scholar] [CrossRef]
- Zhou, Y.; Huang, M.; Chen, W.; Lu, L.; Jin, F.; Huang, J. Space charge behavior evolution with thermal aging of oil-paper insulation. IEEE Trans. Dielectr. Electr. Insul. 2015, 22, 1381–1388. [Google Scholar] [CrossRef]
- Zhou, L.J.; Wu, G.N.; Liu, J. Modeling of transient moisture equilibrium in oil-paper insulation. IEEE Trans. Dielectr. Electr. Insul. 2008, 15, 872–878. [Google Scholar] [CrossRef]
- Batra, P.E.; Ioannides, M.G. Assessment of Electric Accidents in Power Industry. Hum. Factors Ergon. Manuf. 2002, 10, 1002. [Google Scholar] [CrossRef]
- Zhang, X.; Ren, L.; Yu, H.; Xu, Y.; Lei, Q.; Li, X.; Han, B. Dual-Temperature Evaluation of a High-Temperature Insulation System for Liquid-Immersed Transformer. Energies 2018, 11, 1957. [Google Scholar] [CrossRef]
- Vasovic, V.; Lukic, J.; Mihajlovic, D.; Pejovic, B.; Radakovic, Z.; Radoman, U.; Orlovic, A. Aging of transformer insulation—Experimental transformers and laboratory models with different moisture contents: Part I—DP and furans aging profiles. IEEE Trans. Dielectr. Electr. Insul. 2019, 26, 1840–1846. [Google Scholar] [CrossRef]
- Ekenstam, A. The behavior of cellulose in mineral acid solutions: Kinetics study of the decomposition of cellulose in acid solutions. Ber 1936, 69, 540–553. [Google Scholar]
- Peng, L.; Fu, Q.; Li, L.; Lin, M. Indirect detection of DP for insulating paper based on methanol content in transformer oil by spectroscopic approach. IEEE Trans. Dielectr. Electr. Insul. 2019, 26, 90–94. [Google Scholar] [CrossRef]
- Arroyo, O.H.; Jalbert, J.; Fofana, I.; Ryadi, M. Temperature dependence of methanol and the tensile strength of insulation paper: Kinetics of the changes of mechanical properties during ageing. Cellulose 2017, 24, 1031–1039. [Google Scholar] [CrossRef]
- Hill, D.J.T.; Le, T.T.; Darveniza, M. A study of degradation of cellulosic insulation materials in a power transformer. Part 2: Tensile strength of cellulose insulation paper. Polym. Degrad. Stab. 1995, 49, 429–435. [Google Scholar] [CrossRef]
- N’cho, J.S.; Fofana, I.; Hadjadj, Y.; Beroual, A. Review of physicochemical-based diagnostic techniques for assessing insulation condition in aged transformers. Energies 2016, 9, 367. [Google Scholar] [CrossRef]
- IEEE Std C57.104-1991; IEEE Guide for the Interpretation of Gases Generated in Oil-Immersed Transformers. IEEE: New York, NY, USA, 1992.
- IEC 60599-1999; Mineral Oil-filled Electrical Equipment in Service-Guidance on the Interpretation of Dissolved and Free Cases. IEC: New York, NY, USA, 1999.
- Rogers, R.R. IEEE and IEC codes to interpret incipient faults in transformers, using gas in oil analysis. IEEE Trans. Dielectr. Electr. Insul. 1978, EI-13, 349–354. [Google Scholar] [CrossRef]
- Duval, M.; DePabla, A. Interpretation of gas-in-oil analysis using new IEC publication 60599 and IEC TC 10 databases. IEEE Electr. Insul. Mag. 2001, 17, 31–41. [Google Scholar] [CrossRef]
- Tamura, R.; Anetai, H.; Ishii, T. The diagnosis on the aging deterioration of insulating paper in transformers by gas analysis. Trans. Inst. Electr. Eng. 1981, 101, 30–36. [Google Scholar]
- Lelekakis, N.; Martin, D.; Guo, W.; Wijaya, J. Comparison of dissolved gas-in-oil analysis methods using a dissolved gas-in-oil standard. IEEE Electr. Insul. Mag. 2011, 27, 29–35. [Google Scholar] [CrossRef]
- Matharage, S.; Liu, Q.; Wang, Z.; Wilson, G.; Krause, C. Aging assessment of synthetic ester impregnated thermally non-upgraded kraft paper through chemical markers in oil. IEEE Trans. Dielectr. Electr. Insul. 2018, 25, 507–515. [Google Scholar] [CrossRef]
- Lin, Y.; Wei, C.; Tao, F.; Li, J. Aging assessment of oil-paper insulation of power equipment with furfural analysis based on furfural generation and partitioning. IEEE Trans. Power Deliv. 2019, 34, 1626–1633. [Google Scholar] [CrossRef]
- Zhang, Z.; Cheng, D.; Xu, H.; Wu, Y.; Fan, J. Bioactivities and mechanism of spiro enol ether analogues against Pieris rapae. Insect Sci. 2004, 11, 19–26. [Google Scholar] [CrossRef]
- Es-Safi, N.E.; Cheynier, V.; Moutounet, M. Study of the reactions between (+)-catechin and furfural derivatives in the presence or absence of anthocyanins and their implication in food color change. J. Agric. Food Chem. 2000, 48, 5946–5954. [Google Scholar] [CrossRef]
- Liu, J.; Song, B.; Zhang, E.; Zhang, H.; Zhang, Y.; Goh, H.H. Two-stage Residual Lifespan Prediction Model for Oil-paper Insulation Based on Analysis of Furfural and Methanol in Oil. IEEE Trans. Power Deliv. 2022, 38, 432–441. [Google Scholar] [CrossRef]
- DL/T596-1996; Preventive Test for Electric Power Equipment. National Energy Administration: Wuhan, China, 1996.
- Hao, J.; Feng, D.; Liao, R.; Yang, L.; Lin, Y. Effect of temperature on the production and diffusion behaviour of furfural in oil–paper insulation systems. IET Gener. Transm. Distrib. 2018, 12, 3124–3129. [Google Scholar] [CrossRef]
- Jalbert, J.; Gilbert, R.; Tétreault, P.; Morin, B.; Lessard-Déziel, D. Identification of a chemical indicator of the rupture of 1,4-β-glycosidic bonds of cellulose in an oil-impregnated insulating paper system. Cellulose 2007, 14, 295–309. [Google Scholar] [CrossRef]
- Matharage, S.; Liu, Q.; Wang, Z. Aging assessment of kraft paper insulation through methanol in oil measurement. IEEE Trans. Dielectr. Electr. Insul. 2016, 23, 1589–1596. [Google Scholar] [CrossRef]
- Zheng, H.; Shi, K.; Yang, T.; Li, Y.; Zhang, E.; Zhang, C.; Shao, G.; Shi, Z.; Zhang, C. Investigation on the equilibrium distribution of methanol in transformer oil-immersed cellulosic insulation. Cellulose 2021, 28, 1703–1714. [Google Scholar] [CrossRef]
- Schaut, A.; Autru, S.; Eeckhoudt, S. Applicability of methanol as new marker for paper degradation in power transformers. IEEE Trans. Dielectr. Electr. Insul. 2011, 18, 533–540. [Google Scholar] [CrossRef]
- Laurichesse, D.; Bertrand, Y.; Tran-Duy, C.; Murin, V. Ageing diagnosis of MV/LV distribution transformers via chemical indicators in oil. In Proceedings of the 2013 IEEE Electrical Insulation Conference (EIC), IEEE, Ottawa, ON, Canada, 2–5 June 2013; pp. 464–468. [Google Scholar]
- Zhang, E.; Zheng, H.; Zhang, Y.; Liu, J.; Shi, Z.; Shi, K.; Zhang, C.; Shao, G.; Zhang, C.; Schwarz, H. Lifespan Model of the Relationships between Ethanol Indicator and Degree of Polymerization of Transformer Paper Insulation. IEEE Trans. Dielectr. Electr. Insul. 2021, 28, 1859–1866. [Google Scholar] [CrossRef]
- Zhang, E.; Liu, J.; Fan, X.; Zhang, Y.; Zhang, C. Reduction Mechanism of Alcohols Contents Caused by Acids During Oil-Paper Insulation Aging. IEEE Trans. Dielectr. Electr. Insul. 2021, 28, 1867–1874. [Google Scholar] [CrossRef]
- Wang, J.; Zhou, Y.; Liu, J.; Wang, Z.; Bai, S.; Lu, J. A new method for the aging evaluation of oil-paper insulation by n-butanol and methanol. CSEE J. Power Energy Syst. 2022, 10, 717–726. [Google Scholar]
- Lundgaard, L.; Hansenm, W.; Ingebrigtsen, S. Aging of mineral oil impregnated cellulose by acid catalysis. IEEE Trans. Dielectr. Electr. Insul. 2008, 15, 540–546. [Google Scholar] [CrossRef]
- Yang, E.; Zheng, H.; Yang, T.; Yao, W.; Wang, Z.; Li, X.; Liu, C.; Feng, Y. Investigation on formation and solubility of formic acid, acetic acid and levulinic acid in insulating oil using COSMO-RS. J. Mol. Liq. 2022, 346, 118256. [Google Scholar] [CrossRef]
- Cong, H.; Pan, H.; Qian, D.; Zhao, H.; Li, Q. Reviews on sulphur corrosion phenomenon of the oil–paper insulating system in mineral oil transformer. High Volt. 2021, 6, 193–209. [Google Scholar] [CrossRef]
- Matharage, S.; Liu, Q.; Wang, Z. Generation of methanol and ethanol from inhibited mineral oil. In Proceedings of the 2017 INSUCON-13th International Electrical Insulation Conference (INSUCON), Birmingham, UK, 16–18 May 2017; pp. 1–4. [Google Scholar]
- Emsley, A.M.; Stevens, G.C. Kinetics and mechanisms of the low-temperature degradation of cellulose. Cellulose 1994, 1, 26–56. [Google Scholar] [CrossRef]
- Emsley, A.M. On the kinetics of degradation of cellulose. Cellulose 1997, 4, 1–5. [Google Scholar] [CrossRef]
- Urzhumtsev, Y.S. Time-temperature superposition. Rev. Mech. Compos. Mater. 1975, 11, 57–72. [Google Scholar]
- Heywood, R.J.; Stevens, G.C.; Ferguson, C.; Emsley, A.M. Life assessment of cable paper using slow thermal ramp methods. Therm. Acta 1999, 332, 189–195. [Google Scholar] [CrossRef]
- Ding, H.Z.; Wang, Z.D. On the degradation evolution equations of cellulose. Cellulose 2008, 15, 205–224. [Google Scholar] [CrossRef]
- Gillen, K.T.; Celina, M. The wear-out approach for predicting the remaining lifetime of materials. Polym. Degrad. Stab. 2000, 71, 15–30. [Google Scholar] [CrossRef]
- Teymouri, A.; Vahidi, B. Estimation of power transformer remaining life from activation energy and pre-exponential factor in the Arrhenius equation. Cellulose 2019, 26, 9709–9720. [Google Scholar] [CrossRef]
- Yang, L.J.; Liao, R.J.; Sun, C.X.; Zhu, M.Z. Influence of vegetable oil on the thermal aging of transformer paper and its mechanism. IEEE Trans. Dielectr. Electr. Insul. 2011, 18, 692–700. [Google Scholar] [CrossRef]
- Mezgebo, B.; Sherif, S.S.; Fernando, N.; Senior, M.; Kordi, B. Paper Insulation Aging Estimation Using Swept-Source Optical Coherence Tomography. IEEE Trans. Dielectr. Electr. Insul. 2022, 29, 30–37. [Google Scholar] [CrossRef]
- Liao, R.; Guo, C.; Wang, K.; Yang, L.; Grzybowski, S.; Sun, H. Investigation on thermal aging characteristics of vegetable oil-paper insulation with flowing dry air. IEEE Trans. Dielectr. Electr. Insul. 2013, 20, 1649–1658. [Google Scholar] [CrossRef]
- Jacob, N.D.; Hassanzadeh, H.; Oliver, D.R.; Sherif, S.S.; Kordi, B. Classification of degradation in oil-impregnated cellulose insulation using texture analysis of optical microscopy images. Electr. Power Syst. Res. 2016, 133, 104–112. [Google Scholar] [CrossRef]
- Jacob, N.D.; Kordi, B.; Sherif, S.S. Assessment of power transformer paper ageing using wavelet texture analysis of microscopy images. IEEE Trans. Dielectr. Electr. Insul. 2020, 27, 1898–1905. [Google Scholar] [CrossRef]
- Harris, D.C. Quantitative Chemical Analysis, 6th ed.; W. H. Freeman and Company: New York, NY, USA, 2003. [Google Scholar]
- Arakelian, V.G.; Fofana, I. Water in oil-filled high-voltage equipment part II: Water content as physicochemical tools for insulation condition diagnostic. IEEE Electr. Insul. Mag. 2007, 23, 15–24. [Google Scholar] [CrossRef]
- Schärtl, W.; Xie, R.; Ren, T.; Sejfic, M.; Wenz, G.; Heisel, R.; Scherer, C.; Maskos, M.; Fischer, K.; Basché, T. Water-soluble, cyclodextrin-functionalized semiconductor nanocrystals: Preparation and pH-dependent aggregation and emission properties. J. Lumin. 2009, 129, 1428–1434. [Google Scholar] [CrossRef]
- Liu, Y. Some consideration on the Langmuir isotherm equation. Colloids Surf. 2006, 274, 34–36. [Google Scholar] [CrossRef]
- Langmuir, I. The constitution and fundamental properties of solids and liquids. Part I. Solids. J. Am. Chem. Soc. 1916, 38, 2221–2295. [Google Scholar] [CrossRef]
- Chung, H.K.; Kim, W.H.; Park, J.; Cho, J.; Jeong, T.; Park, P. Application of Langmuir and Freundlich isotherms to predict adsorbate removal efficiency or required amount of adsorbent. J. Ind. Eng. Chem. 2015, 28, 241–246. [Google Scholar] [CrossRef]
- Martin, D.; Perkasa, C.; Lelekakis, N. Measuring paper water content of transformers: A new approach using cellulose isotherms in nonequilibrium conditions. IEEE Trans. Power Deliv. 2013, 28, 1433–1439. [Google Scholar] [CrossRef]
- Guidi, W.; Fullerton, H. Mathematical methods for prediction of moisture take-up and removal in large power transformers. IEEE Winter Power Meet. 1974, 74, 242–244. [Google Scholar]
- Yang, L.; Zou, T.; Deng, B.; Zhang, H.; Mo, Y.; Peng, P. Assessment of oil-paper insulation aging using frequency domain spectroscopy and moisture equilibrium curves. IEEE Access 2019, 7, 45670–45678. [Google Scholar] [CrossRef]
- Ward, B.W.; Oommen, T.V.; Thompson, J.A. Moisture estimation in transformer insulation. In Proceedings of the IEEE/PES Transformers Committee, Las Vegas, NV, USA, 24–28 October 2004. [Google Scholar]
- Oommen, T.V. Moisture equilibrium charts for transformer insulation drying practice. IEEE Trans. Power Appl. Syst. 1984, 103, 3063–3067. [Google Scholar]
- Wang, D.; Zhou, L.; Li, X.; Cui, Y.; Li, H.; Wang, A.; Liao, W. Effects of thermal aging on moisture equilibrium in oil-paper insulation. IEEE Trans. Dielectr. Electr. Insul. 2018, 25, 2340–2348. [Google Scholar] [CrossRef]
- Ansari, M.A.; Martin, D.; Saha, T.K. Investigation of Distributed Moisture and Temperature Measurements in Transformers Using Fiber Optics Sensors. IEEE Trans. Power Deliv. 2019, 34, 1776–1784. [Google Scholar] [CrossRef]
- Ansari, M.A.; Martin, D.; Saha, T.K. Advanced Online Moisture Measurements in Transformer Insulation Using Optical Sensors. IEEE Trans. Dielectr. Electr. Insul. 2020, 27, 1803–1810. [Google Scholar] [CrossRef]
- Zhang, M.; Lei, S.; Liu, H.; Shen, Y.; Liu, J.; Shi, Y.; Jia, H.; Li, L. Research on nonlinear characteristics for frequency domain dielectric response of transformer oil-paper insulation. Measurement 2022, 204, 112103. [Google Scholar] [CrossRef]
- Saha, T.K. Review of time-domain polarization measurements for assessing insulation condition in aged transformers. IEEE Trans. Power Deliv. 2003, 18, 1293–1301. [Google Scholar] [CrossRef]
- Jota, P.R.S.; Islam, S.M.; Jota, F.G. Modeling the polarization spectrum in composite oil/paper insulation systems. IEEE Trans. Dielectr. Electr. Insul. 1999, 6, 145–151. [Google Scholar] [CrossRef]
- Liu, Q.; Cai, C.; Wu, L. A novel characteristic optimization method based on combined statistical indicators and random forest for oil-paper insulation state diagnosis. CSEE J. Power Energy Syst. 2021. early access. [Google Scholar]
- Wolny, S. Aging degree evaluation for paper-oil insulation using the recovery voltage method. IEEE Trans. Dielectr. Electr. Insul. 2015, 22, 2455–2462. [Google Scholar] [CrossRef]
- Martínez, M.; Pleite, J. Improvement of RVM test interpretation using a Debye equivalent circuit. Energies 2020, 13, 323. [Google Scholar] [CrossRef]
- Yang, F.; Tang, C.; Zhou, Q.; Du, L.; Wan, H.; Chen, J. Novel characteristic quantities for determining the moisture state of Oil-impregnated cellulose insulation using the extended debye model. IEEE Trans. Dielectr. Electr. Insul. 2022, 29, 1087–1094. [Google Scholar] [CrossRef]
- Sarkar, S.; Sharma, T.; Baral, A.; Chatterjee, B.; Dey, D.; Chakravorti, S. An expert system approach for transformer insulation diagnosis combining conventional diagnostic tests and PDC, RVM data. IEEE Trans. Dielectr. Electr. Insul. 2014, 21, 882–891. [Google Scholar] [CrossRef]
- Saha, T.K.; Purkait, P. Investigation of an expert system for the condition assessment of transformer insulation based on dielectric response measurement. IEEE Trans. Power Deliv. 2004, 19, 1127–1134. [Google Scholar] [CrossRef]
- Saha, T.K.; Prithwiraj, P. Investigations of temperature effects on the dielectric response measurements of transformer oil-paper insulation system. IEEE Trans. Power Deliv. 2007, 23, 252–260. [Google Scholar] [CrossRef]
- Liao, R.; Du, Y.; Yang, L.; Gao, J. Quantitative diagnosis of moisture content in oil-paper condenser bushing insulation based on frequency domain spectroscopy and polarisation and depolarisation current. IET Gener. Transm. Distrib. 2017, 11, 1420–1426. [Google Scholar] [CrossRef]
- Mishra, D.; Haque, N.; Baral, A.; Chakravorti, S. Assessment of interfacial charge accumulation in oil-paper interface in transformer insulation from polarization-depolarization current measurements. IEEE Trans. Dielectr. Electr. Insul. 2017, 24, 1665–1673. [Google Scholar] [CrossRef]
- Saha, T.K.; Purkait, P.; Müller, F. Deriving an Equivalent Circuit of Transformers Insulation for Understanding the Dielectric Response Measurements. IEEE Trans. Power Deliv. 2005, 20, 149–157. [Google Scholar] [CrossRef]
- Saha, T.K.; Purkait, P. Understanding the Impacts of Moisture and Thermal Ageing on Transformer’s Insulation by Dielectric Response and Molecular Weight Measurements. IEEE Trans. Dielectr. Electr. Insul. 2008, 15, 568–582. [Google Scholar] [CrossRef]
- Saha, T.K.; Prithwiraj, P. Investigation of polarization and depolarization current measurements for the assessment of oil-paper insulation of aged transformers. IEEE Trans. Dielectr. Electr. Insul. 2004, 11, 144–154. [Google Scholar] [CrossRef]
- Wei, J.; Zhang, G.; Xu, H.; Peng, H.; Wang, S.; Dong, M. Novel characteristic parameters for oil-paper insulation assessment from differential time-domain spectroscopy based on polarization and depolarization current measurement. IEEE Trans. Dielectr. Electr. Insul. 2011, 18, 1918–1928. [Google Scholar] [CrossRef]
- Zhang, T.; Wang, S.; Zhang, C.; Siada, A.; Li, L.; Han, J.; Du, Z. Investigating a new approach for moisture assessment of transformer insulation system. IEEE Access. 2020, 8, 81458–81467. [Google Scholar] [CrossRef]
- Zhang, D.N.; Yun, H.; Zhan, J.Y.; Sun, X.; He, W.L.; Niu, C.B.; Mu, H.B.; Zhang, G.J. Insulation Condition Diagnosis of Oil-Immersed Paper Insulation Based on Non-linear Frequency-Domain Dielectric Response. IEEE Trans. Dielectr. Electr. Insul. 2018, 25, 1980–1988. [Google Scholar] [CrossRef]
- Liu, J.; Zhang, H.; Fan, X.; Zhang, Y.; Zhang, C. Aging evaluation for transformer oil-immersed cellulose insulation by using frequency dependent dielectric modulus technique. Cellulose 2021, 28, 2387–2401. [Google Scholar] [CrossRef]
- Liu, J.; Fan, X.; Zhang, Y.; Zhang, C.; Wang, Z. Aging evaluation and moisture prediction of oil-immersed cellulose insulation in field transformer using frequency domain spectroscopy and aging kinetics model. Cellulose 2020, 27, 7175–7189. [Google Scholar] [CrossRef]
- Laidler, K.J. The development of the Arrhenius equation. J. Chem. Educ. 1984, 61, 494–498. [Google Scholar] [CrossRef]
- Zhang, M.; Liu, J.; Jia, H.; Chen, Q.; Lv, J.; Chen, X. Modelling the low-frequency electrode dielectric response based on transformer equivalent oil-paper insulation model. IET Sci. Meas. Technol. 2019, 13, 700–707. [Google Scholar] [CrossRef]
- Boss, P.; Csepes, G.; Der, H.V.; Filippini, J.; Guuinic, P.; Gäfvert, U.; Karius, V.; Lapworth, J.; Urbani, G.; Werelius, P.; et al. Dielectric response methods for diagnostics of power transformers. IEEE Electr. Insul. Mag. 2003, 19, 12–18. [Google Scholar]
- Liu, J.; Fan, X.; Zhang, Y.; Zheng, H.; Zhang, C. Condition prediction for oil-immersed cellulose insulation in field transformer using fitting fingerprint database. IEEE Trans. Dielectr. Electr. Insul. 2020, 27, 279–287. [Google Scholar] [CrossRef]
- Jonscher, A.K. Dielectric relaxation in solids. J. Phys. D Appl. Phys. 1999, 32, 57–70. [Google Scholar] [CrossRef]
- Das, A.K.; Dalai, S.; Chatterjee, B. A Novel Approach to Estimate the Quantity of Ingressed Moisture Content Inside Metal Oxide Surge Arrester Using Dielectric Modulus Technique. IEEE Trans. Dielectr. Electr. Insul. 2021, 28, 2178–2185. [Google Scholar] [CrossRef]
- Liu, J.; Fan, X.; Zhang, Y.; Lai, B.; Jiao, J. Analysis of low-frequency polarisation behaviour for oil-paper insulation using logarithmic-derivative spectroscopy. High Volt. 2021, 6, 460–469. [Google Scholar] [CrossRef]
- Liu, J.; Fan, X.; Zhang, Y.; Zheng, H.; Zhu, M. Quantitative evaluation for moisture content of cellulose insulation material in paper/oil system based on frequency dielectric modulus technique. Cellulose 2020, 27, 2343–2356. [Google Scholar] [CrossRef]
- Yang, F.; Du, L.; Yang, L.; Wei, C.; Wang, Y.; Ran, L.; He, P. A parameterization approach for the dielectric response model of oil paper insulation using FDS measurements. Energies 2018, 11, 622. [Google Scholar] [CrossRef]
- Sumranbumrung, R.; Khunkitti, P.; Siritaratiwat, A.; Kruesubthaworn, A. Characterization Model of Dielectric Properties of Cane Sugar Solution Over 0.5–14 GHz. IEEE Trans. Instrum. Meas. 2021, 70, 8003908. [Google Scholar] [CrossRef]
- Morsalin, S.; Phung, B.T. Modeling of Dielectric Dissipation Factor Measurement for XLPE Cable Based on Davidson-Cole Model. IEEE Trans. Dielectr. Electr. Insul. 2019, 26, 1018–1026. [Google Scholar] [CrossRef]
- Das, A.K.; Haque, N.; Pradhan, A.K.; Dalai, S.; Chatterjee, B.; Mukherjee, A. Estimation of Moisture Content in XLPE Insulation in Medium Voltage Cable by Frequency Domain Spectroscopy. IEEE Trans. Dielectr. Electr. Insul. 2020, 27, 1811–1819. [Google Scholar] [CrossRef]
- Xia, G.; Wu, G.; Gao, B.; Yin, H.; Yang, F. A new method for evaluating moisture content and aging degree of transformer oil-paper insulation based on frequency domain spectroscopy. Energies 2017, 10, 1195. [Google Scholar] [CrossRef]
- Zhou, L.; Wang, D.; Guo, L.; Wang, L.; Jiang, J.; Liao, W. FDS analysis for multilayer insulation paper with different aging status in traction transformer of high-speed railway. IEEE Trans. Dielectr. Electr. Insul. 2017, 24, 3236–3244. [Google Scholar] [CrossRef]
- Hao, J.; Liao, R.; Chen, G.; Ma, Z.; Yang, L. Quantitative analysis ageing status of natural ester-paper insulation and mineral oil-paper insulation by polarization/depolarization current. IEEE Trans. Dielectr. Electr. Insul. 2012, 19, 188–199. [Google Scholar]
- Liao, R.; Liu, J.; Yang, L.; Gao, J.; Zhang, Y.; Lv, Y.; Zheng, H. Understanding and analysis on frequency dielectric parameter for quantitative diagnosis of moisture content in paper–oil insulation system. IET Electr. Power Appl. 2015, 9, 213–222. [Google Scholar] [CrossRef]
- Gao, J.; Yang, L.; Wang, Y.; Qi, C.; Hao, J.; Liu, J. Quantitative evaluation of ageing condition of oil-paper insulation using frequency domain characteristic extracted from modified cole-cole model. IEEE Trans. Dielectr. Electr. Insul. 2015, 22, 2694–2702. [Google Scholar] [CrossRef]
- Zhang, M.; Liu, J.; Yin, M.; Jia, H.; Lv, J. Assessment on oil-paper insulation aging of transformer based on dielectric response model. Electr. Power Compon. Syst. 2019, 47, 1145–1155. [Google Scholar] [CrossRef]
- Yang, D.; Chen, W.; Wan, F.; Zhou, Y.; Wang, J. Identification of the aging stage of transformer oil-paper insulation via Raman spectroscopic characteristics. IEEE Trans. Dielectr. Electr. Insul. 2020, 27, 1770–1777. [Google Scholar] [CrossRef]
- Zhou, Y.; Chen, W.; Yang, D.; Zhang, R. Raman spectrum characteristics and aging diagnosis of oil-paper insulation with different oil-paper ratios. IEEE Trans. Dielectr. Electr. Insul. 2020, 27, 1587–1594. [Google Scholar] [CrossRef]
- Ashkezari, A.D.; Ma, H.; Saha, T.K.; Ekanayake, C. Application of fuzzy support vector machine for determining the health index of the insulation system of in-service power transformers. IEEE Trans. Dielectr. Electr. Insul. 2013, 20, 965–973. [Google Scholar] [CrossRef]
- Liu, J.; Fan, X.; Zhang, C.; Lai, C.; Zhang, Y.; Zheng, H.; Lai, L.; Zhang, E. Moisture diagnosis of transformer oil-immersed insulation with intelligent technique and frequency-domain spectroscopy. IEEE Trans. Ind. Inform. 2020, 17, 4624–4634. [Google Scholar] [CrossRef]
- Cui, Y.; Ma, H.; Saha, T. Improvement of power transformer insulation diagnosis using oil characteristics data preprocessed by SMOTEBoost technique. IEEE Trans. Dielectr. Electr. Insul. 2014, 21, 2363–2373. [Google Scholar] [CrossRef]
- Li, Y.; Zhang, Y.; Zhang, W.B.; Xu, Y.; Zhang, G. Comparative study of partial least squares and neural network models of near-infrared spectroscopy for aging condition assessment of insulating paper. Meas. Sci. Technol. 2020, 31, 045501. [Google Scholar] [CrossRef]
- Fan, X.; Liu, J.; Lai, B.; Zhang, Y.; Zhang, C. FDS measurement-based moisture estimation model for transformer oil-paper insulation including the aging effect. IEEE Trans. Instrum. Meas. 2021, 70, 1–10. [Google Scholar] [CrossRef]
- Yutthago, P. Effective Oil-Immersed Paper Insulation Condition Assessment of Power Transformers. SSRN 2022. [Google Scholar] [CrossRef]
- Xie, Y.; Ruan, J.; Shi, Y.; Jin, S.; Tian, Y.; Zhu, L. Inversion detection method for resistivity of oil-immersed paper in transformer. IEEE Trans. Power Deliv. 2019, 34, 1757–1765. [Google Scholar] [CrossRef]
- Yang, Z.; Zhou, Q.; Wu, X.; Zhao, Z.; Tang, C.; Chen, W. Detection of water content in transformer oil using multi frequency ultrasonic with PCA-GA-BPNN. Energies 2019, 12, 1379. [Google Scholar] [CrossRef]
- Liu, J.; Ding, Z.; Fan, X.; Geng, C.; Song, B.; Wang, Q.; Zhang, Y. A BPNN model-based AdaBoost algorithm for estimating inside moisture of oil–paper insulation of power transformer. IEEE Trans. Dielectr. Electr. Insul. 2022, 29, 614–622. [Google Scholar] [CrossRef]
- Zhang, M.; Li, L.; Liu, H.; Jia, H.; Meng, F. Method for quantitative assessment of transformer oil-paper insulation non-uniform ageing parameters based on frequency domain dielectric response. IET Sci. Meas. Technol. 2022, 16, 118–129. [Google Scholar] [CrossRef]
- Baral, A.; Chakravorti, S. A modified Maxwell model for characterization of relaxation processes within insulation system having non-uniform aging due to temperature gradient. IEEE Trans. Dielectr. Electr. Insul. 2013, 20, 524–534. [Google Scholar] [CrossRef]
- Jalbert, J.; Lessard, M.C.; Ryadi, M. Cellulose chemical markers in transformer oil insulation Part 1: Temperature correction factors. IEEE Trans. Dielectr. Electr. Insul. 2013, 20, 2287–2291. [Google Scholar] [CrossRef]
- Zhang, E.; Liu, J.; Song, B.; Zhang, H.; Fan, X.; Zhang, Y.; Fu, Q. Influence of Operational Defects and Hotspot Temperature on Methanol Concentration in Transformer Oil. IEEE Trans. Power Deliv. 2022, 38, 1859–1867. [Google Scholar] [CrossRef]
- Sun, W.; Yang, L.; Zare, F.; Lin, Y.; Cheng, Z. Improved method for aging assessment of winding hot-spot insulation of transformer based on the 2-FAL concentration in oil. Inter J. Electr. Power Energy Syst. 2019, 112, 191–198. [Google Scholar] [CrossRef]
- Zhou, L.; Wang, D.; Cui, Y.; Zhang, L.; Wang, L.; Guo, L. A method for diagnosing the state of insulation paper in traction transformer based on FDS test and CS-DQ algorithm. IEEE Trans. Transport. Electrif. 2020, 7, 91–103. [Google Scholar] [CrossRef]
- Zhang, Y.; Yang, L.; Su, Z.; Wei, W.; Dong, C.; Huang, Z.; Hua, J. Time Domain Dielectric Response Characteristics of Oil-Immersed Paper Bushings Under Radial Nonuniform Moisture. IEEE Trans. Dielectr. Electr. Insul. 2023, 31, 1079–1086. [Google Scholar] [CrossRef]
- Liu, J.; Sun, T.; Fan, X.; Zhang, Y.; Lai, B. A modified simulation model for predicting the FDS of transformer oil-paper insulation under nonuniform aging. IEEE Trans. Instrum. Meas. 2021, 70, 1–9. [Google Scholar] [CrossRef]
- Liu, J.; Wang, Q.; Fan, X.; Zhang, Y.; Goh, H.H. Effects of Temperature Gradient Induced Aging and Moisture Distribution on Dielectric Response Measurement for Transformer Insulation. IEEE Trans. Instrum. Meas. 2022, 71, 1–10. [Google Scholar] [CrossRef]
- Baral, A.; Chakravorti, S. Condition assessment of cellulosic part in power transformer insulation using transfer function zero of modified Debye model. IEEE Trans. Dielectr. Electr. Insul. 2014, 21, 2028–2036. [Google Scholar] [CrossRef]
- Fan, X.; Liu, J.; Goh, H.H.; Zhang, Y.; Zhang, C.; Rahman, S. Acquisition of FDS for oil-immersed insulation at transformer hotspot region based on multiconstraint NSGA model. IEEE Trans. Ind. Electron. 2022, 69, 13625–13635. [Google Scholar] [CrossRef]
- Islam, M.M.; Lee, G.; Hettiwatte, S.N. A review of condition monitoring techniques and diagnostic tests for lifetime estimation of power transformers. Electr. Eng. 2018, 100, 581–605. [Google Scholar] [CrossRef]
- Hosier, I.L.; Koilraj, J.E.A.; Vaughan, A.S. Effect of aging on the physical, chemical and dielectric properties of dodecylbenzene. IEEE Trans. Dielectr. Electr. Insul. 2016, 23, 3389–3396. [Google Scholar] [CrossRef]
- Jadav, R.B.; Ekanayake, C.; Saha, T.K. Understanding the impact of moisture and ageing of transformer insulation on frequency domain spectroscopy. IEEE Trans. Dielectr. Electr. Insul. 2014, 21, 369–379. [Google Scholar] [CrossRef]
- Teymouri, A.; Vahidi, B.; Wielen, P. A novel life management model consists of chemical aging model and electrical-thermal aging model for power transformers using a new activation energy calculation method. Cellulose 2022, 29, 4455–4473. [Google Scholar] [CrossRef]
- Deng, Y.; Fan, X.; Luo, H.; Wang, Y.; Wu, K.; Liang, F.; Li, C. Impact of Air Gap Defects on the Electrical and Mechanical Properties of a 320 kV Direct Current Gas Insulated Transmission Line Spacer. Energies 2023, 16, 4006. [Google Scholar] [CrossRef]


| Number | Research Indicator | Detailed Information |
|---|---|---|
| 1 | Keywords | Oil–paper insulation and condition assessment |
| 2 | Data source | Web of science |
| 3 | Time span | 2010–2023 |
| 4 | Literature type | Article |
| 5 | Literature quantity | 1962 |
| 6 | Total citation | 19,851 |
| Number | Equation Name | The Expression of Equation |
|---|---|---|
| 1 | Chengdong | |
| 2 | Burton | |
| 3 | Vuarchex |
| Method | Equation | Illustration |
|---|---|---|
| integral spectrum | 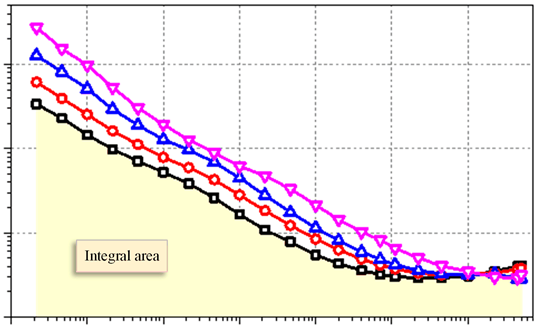 | |
| dielectric modulus | 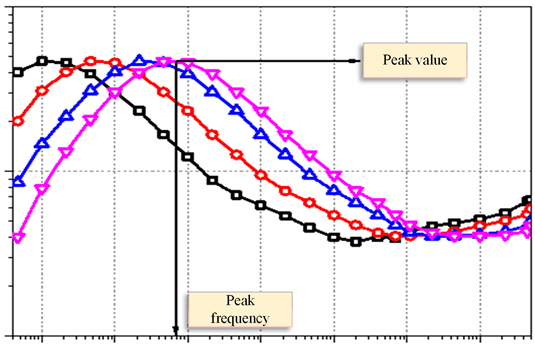 | |
| Logarithmic derivative spectroscopy |  |
| Model | Math Expression | Complex Plane |
|---|---|---|
| Debye Model | 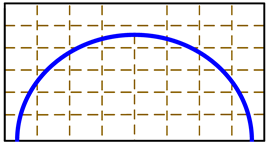 | |
| Cole–Cole Model | (0 < α < 1) |  |
| Davidson–Cole Model | (0 < β < 1) | 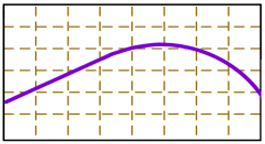 |
| Havriliak–Negami Model | (0 < α < 1, 0 < β < 1) | 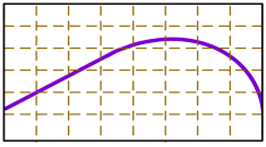 |
Disclaimer/Publisher’s Note: The statements, opinions and data contained in all publications are solely those of the individual author(s) and contributor(s) and not of MDPI and/or the editor(s). MDPI and/or the editor(s) disclaim responsibility for any injury to people or property resulting from any ideas, methods, instructions or products referred to in the content. |
© 2024 by the authors. Licensee MDPI, Basel, Switzerland. This article is an open access article distributed under the terms and conditions of the Creative Commons Attribution (CC BY) license (https://creativecommons.org/licenses/by/4.0/).
Share and Cite
Jiang, Z.; Li, X.; Zhang, H.; Zhang, E.; Liu, C.; Fan, X.; Liu, J. Research Progress and Prospect of Condition Assessment Techniques for Oil–Paper Insulation Used in Power Systems: A Review. Energies 2024, 17, 2089. https://doi.org/10.3390/en17092089
Jiang Z, Li X, Zhang H, Zhang E, Liu C, Fan X, Liu J. Research Progress and Prospect of Condition Assessment Techniques for Oil–Paper Insulation Used in Power Systems: A Review. Energies. 2024; 17(9):2089. https://doi.org/10.3390/en17092089
Chicago/Turabian StyleJiang, Zaijun, Xin Li, Heng Zhang, Enze Zhang, Chuying Liu, Xianhao Fan, and Jiefeng Liu. 2024. "Research Progress and Prospect of Condition Assessment Techniques for Oil–Paper Insulation Used in Power Systems: A Review" Energies 17, no. 9: 2089. https://doi.org/10.3390/en17092089
APA StyleJiang, Z., Li, X., Zhang, H., Zhang, E., Liu, C., Fan, X., & Liu, J. (2024). Research Progress and Prospect of Condition Assessment Techniques for Oil–Paper Insulation Used in Power Systems: A Review. Energies, 17(9), 2089. https://doi.org/10.3390/en17092089