Article

The Formation–Structure–Functionality Relationship of Catalyst Layers in Proton Exchange Membrane Fuel Cells

Department of Mechanical Engineering, University of California, 5200 N Lake Rd, Merced, CA 95343, USA
*
Author to whom correspondence should be addressed.
These authors contributed equally to this work.
Energies 2024, 17(9), 2093; https://doi.org/10.3390/en17092093
Submission received: 13 March 2024 / Revised: 6 April 2024 / Accepted: 22 April 2024 / Published: 27 April 2024
(This article belongs to the Special Issue Advances in Hydrogen Energy III)

Abstract

:
Understanding the relationship between the formation, structure, and functionality of catalyst layers is crucial for designing catalyst layers with specific high-current-density operations. In this study, we investigated the impact of the ionomer-to-carbon (I/C) ratio and solid content on transport properties. We conducted fuel cell performance and diagnostic measurements to demonstrate the combined effects of the I/C ratio and solid content on the mass transport, particularly oxygen transport. To elucidate the roles of the I/C ratio and solid content in catalyst layer formation, we utilized dynamic light scattering and rheological measurements. By analyzing the local and global structure of ionomer-Pt/C assemblages in the catalyst inks, we observed that the I/C ratio and solid content influence the competition between homo-aggregation and hetero-aggregation, the strengths of inter- and intra-cluster bonds, and the rigidity and connectivity of the particulate structure. Additionally, high-shear-application simulations tend to reduce the connectivity of the particulate network and induce cluster densification, unless the global structure is mechanically stable and resilient. Based on this understanding, we established the formation–structure–functionality relationship for catalyst layers, thereby providing fundamental insights for designing catalyst layers tailored to specific functionalities.

1. Introduction

At high-current densities, the transport resistance in the catalyst layer degrades fuel cell performance and durability [1,2,3]. This resistance has been shown to be predominantly associated with oxygen transport in the catalyst layer [4]. Catalyst layers are thin-film composite electrodes composed of supported-catalyst nanomaterials and ionomers. The transport resistance due to oxygen diffusion in the catalyst layer is strongly related to the microstructure of the catalyst layer. Oxygen transport, particularly permeation via ionomer thin layers that cover the reaction sites, causes a local transport resistance in the catalyst layer [5,6,7,8]. In terms of catalyst layer structure, structural heterogeneities such as inhomogeneous ionomer coverage and variable agglomerates have a significant impact on the efficacy of both reaction sites and transport channels for not only oxygen molecules but also protons [9,10,11]. Since standard catalyst layers are fabricated by ink casting methods that involve constant high-shear exposure, understanding the formation–structure–functionality relationship of the catalyst layers is critical in facilitating the design and optimization of catalyst layers with tailored transport properties [12]. By delving into the intricate relationship between the fabrication process, i.e., the resulting structure and functionality of these layers, researchers can gain valuable insights into how different processing parameters affect the final performance of PEMFCs. Understanding this relationship enables the deliberate design and optimization of catalyst layers with tailored transport properties, such as improved proton and electron conductivity, enhanced gas diffusion, and minimized mass transport limitations. Ultimately, this knowledge can lead to the development of more efficient and durable PEMFCs for various applications.
Two factors, the ionomer-to-carbon (I/C) weight ratio and solid content (SC), are commonly involved in the catalyst layer design process. In particular, the I/C ratio has been found to strongly impact the transport resistance via ionomer thin-film morphology and the agglomerate size [13,14,15,16,17,18]. The solid content, which governs the particle concentration, is often overlooked as its influence can be negligible under certain conditions. Since the particle concentration has a dominant impact on the packing of the particulate structure, it is rational to hypothesize that the I/C ratio and the solid content have a compound effect on the catalyst layer microstructure and consequently the transport properties [19,20,21].
Inside the cathodic catalyst layer of an operating fuel cell, oxygen molecules migrate to the reaction sites through multiple phases, including pores, ionomer thin films, and liquid water, if any. In the pores, oxygen molecules diffuse through different mechanisms depending on the pore size. In pores larger than the oxygen molecule mean free path, molecule–molecule collisions control transport. In smaller pores, Knudsen diffusion dominates due to molecule–solid collisions. The geometrical details of the pore structure significantly impact gas self-diffusion in the Knudsen regime [22,23]. As for the ionomer phase, oxygen molecules firstly need to be adsorbed and dissolved at the void/ionomer interface, then diffuse through the ionomer phase and finally reach the catalyst surface to be adsorbed on the reaction sites [24,25,26]. By manipulating the local morphology of the ionomer thin film, oxygen transport can be improved significantly [11,27]. The presence of liquid water complicates oxygen transport. It can create shortcuts in the ionomer phase while simultaneously blocking pores [6,8,28]. Since the pore structure and the ionomer spatial distribution are governed by the microstructure of the catalyst layer, the oxygen transport can be affected by the microstructural details of the catalyst layers as a function of not only the I/C ratio, but also the solid content.
In this work, we qualitatively explored the effect of the I/C ratio and the solid content on the formation–structure–functionality relationship of the catalyst layers. Our objective in this work was twofold: (1) to demonstrate the compound effect of the I/C ratio and the solid content on the mass transport, in particular the oxygen transport, and (2) to elucidate the roles of the I/C ratio and the solid content in the formation of the catalyst layer structure. The results showcase the compound effect of the I/C ratio and the solid content on the transport properties as the result of the originated structure, which provide fundamental insights for the design of the catalyst layer.

2. Experimental Details

2.1. Materials and Sample Preparation

Pt/C (40 w.% Pt on Vulcan, JM HiSPEC 4000), PFSA ionomer (20 w.% Nafion, Dupont D2020, The Chemours Company, Wilmington, DE, USA), and a water-isopropyl alcohol (IPA, HPLC grade, Sigma Aldrich, St. Louis, MO, USA) binary mixture were used to prepare the catalyst inks. The volume fraction of IPA in the binary solvent was 0.25. As shown in Table 1, the ionomer-Pt/C assemblages were labeled based on the design parameters, the I/C weight ratio, and the solid content (by weight), which were controlled and ranged from 0.5 to 1.5 and from 6% to 20%, respectively. For instance, the ionomer-Pt/C assemblage generated by an I/C ratio of 0.5 and a solid content of 6% was labeled IC05SC06. Due to the physisorption of ionomers on carbon surfaces in aqueous environments [29], the volume fraction of the carbon ( φ c ) and the ionomer ( φ i ) are also presented in Table 1 for reference. All the samples were prepared by a high-shear mixer (AR-100, Thinky, Laguna Hills, CA, USA) operating at 2000 rpm for 4 min with 7 zirconia beads (dia. 5 mm) in a 12 mL ointment container loaded on an 100AD-NAN-U adaptor.

2.2. Particle Characterization

Dynamic light scattering was used to measure the hydrodynamic size of the particles. The measured size distributions characterizing the interaction dynamics between the ionomer and Pt/C aggregates were used to interpret the ionomer-Pt/C assembly local structure. The dilution was conducted by sonicating 2 mg of each prepared sample in 5 mL of the corresponding liquid medium for 10 min. The measurement was taken after equilibrating 1 mL of the dilute sample for 2 min. Considering the particle assembling phenomena, the data of first measurements were used here. All the present data were normalized against the peak intensity.

2.3. Rheological Measurements

All the measurements were performed using a high-performance rotational rheometer (Kinexus Ultra+, Malvern Panalytical Inc., Westborough, MA, USA) equipped with a temperature controlled at 25.00 ± 0.02 °C. Roughened parallel plates (dia. 40 mm) with a solvent trap were used to prevent the wall slip effect and solvent evaporation. Non-destructive small amplitude oscillatory shear was employed to characterize the elasticity of the particulate network in the catalyst inks. Steady-state viscometry was used to profile the flow property of the samples and to extract the parameters from the Herschel–Bulkley model fitting. After a gap of 250 µm was reached, the sample was then stabilized for 10 min prior to the measurements.

2.4. Catalyst Layer Characterization

The catalyst layers were prepared on a piece of ETFE substrate from the catalyst inks using a Mayer rod with various numbers for film thickness control, which were then dried under gentle ventilation at room temperature. The coating was performed at a shear rate of 1000 1/s. The structural characteristics of the catalyst layers were observed using a field emission SEM (Gemini 500, Zeiss, Jena, Germany) operating at 500 V to avoid ionomer degradation.

2.5. Fuel Cell Operation

Membrane electrode assemblies (MEAs) were prepared as follows: The anodes were prepared by coating a catalyst layer onto the gas diffusion layer (Freudenberg H23C8, Freudenberg SE, Weinheim, Germany) with a Pt loading of 0.3 mgPt/ c m g e o 2 . The cathodes were prepared by decal, transferring the prepared catalyst layers onto a piece of Nafion membrane (NR-211, Dupont) at 140 °C with Gylon protectors under a pressure of 300 psi for 10 min. The Pt loadings of the cathode catalyst layers were determined by weight measurements to be 0.2 mgPt/ c m g e o 2 . The active areas were 2 cm2. Each prepared MEA was then assembled into a single-cell hardware from Fuel Cell Technology Inc., Albuquerque, NM, USA. GDL compression was maintained at 17 ± 1.5% using PTFE gaskets.
Fuel cell tests were performed on a precise-controlled automated G20 fuel cell test station (Greenlight Innovation, Burnaby, BC, Canada). Electrochemical measurements were performed using a potentiostat (Gamry Reference 3000, Gamry Instruments, Warminster, PA, USA) coupled with a 30 k Booster. The detailed test protocols are listed in Table 2. Prior to the tests, all MEAs were firstly inspected by a cyclic voltammetry (CV) measurement for the initial electrochemically active surface area (ECSA) and then conditioned to steady state by cycling a voltage-controlled procedure sequence six times, which includes 0.6 V for 15 min, 0.85 V for 15 min, and open-cell voltage (OCV) for 5 min. The current density of each data point on the polarization curve was averaged over the last minute. High-frequency resistance data were collected at each polarization data point by AC impedance operating between 100 kHz and 1 Hz.

2.6. Fuel Cell Diagnosis

To approximate the reaction site density, the ECSA of each cathode was evaluated through CV scanning at 50 mV/s [30,31]. The proton transport resistance in the cathode, RH+, was determined by AC impedance measurements from 100 kHz to 0.1 Hz. The measurements were performed under a differential flow condition, which maintains constant gas partial pressure in the flow channels, thereby resulting in unchanged relative humidity (RH) since the proton transport is sensitive to the RH [32].
The pressure-dependent and pressure-independent oxygen transport resistances, R O 2 p , d and R O 2 p , i , were extracted from dry limiting current measurements [14,33,34]. Note that the R O 2 p , d in this study excludes the transport resistance in the flow channels and corresponds to the value measured at 300 psi. The dry mole fraction of the oxygen ranged from 1% to 4%.

3. Results

The influence of liquid water within the catalyst layer manifested intricate effects on the mass transport phenomena. Experimentally, the regulation of relative humidity (RH) and operational temperature serves to control the presence of liquid water. Polarization curves obtained under conditions devoid of water condensation, termed as dry polarization curves, stand in contrast to those generated under conditions conducive to water condensation, which were designated as wet polarization curves. Notably, the operating RH condition emerged as a pivotal factor governing proton transport, oxygen transport, and the electrochemically active surface area (ECSA) within the system [31,35,36]. Hence, the effect of the I/C ratio and solid content on both the dry and the wet polarization curves are shown in Figure 1a,b.
Under dry conditions, as shown in Figure 1a, the polarization curves in the mass transport regime, where the current density was larger than 1.25 A/cm2, showed a predominant nonlinear dependency on the I/C ratio. This dependency can be attributed to the roles of the ionomer in hampering the oxygen transport and masking reaction sites. Especially for the samples with a high I/C ratio, the onset of mass transport started at a remarkably low current density of ~0.7 A/cm2. Under such dry conditions, the slight effect of solid content on the mass transport was almost negligible.
Interestingly, under wet conditions (Figure 1b), the onset of mass transport shifts to a larger current density of about 2 A/cm2, and the I/C ratio dependency of the mass transport remains dominant; however, an evident influence of the solid content appears in the samples of low I/C ratio. Also, low solid content seems to promote mass transport. The mass transport is most promoted by a combination of a low solid content (6.25%) and low I/C ratio (0.5). These observations suggest a compound effect of the I/C ratio and solid content on mass transport under wet conditions.
The results presented in Figure 1 certainly confirm the RH dependence of the transport phenomena. Clearly, under dry conditions, proton transport seems to be more critical to the cell performance than oxygen transport. In dry conditions, proton transport in the ionomer’s ionic channels is hindered because an adequate amount of water is necessary for the efficient hopping of protons around the sulfonate groups in the ionomer’s side chain [37]. The impact of solid content on mass transport becomes particularly noticeable under wet conditions (Figure 1b). The effects of the solid content can be better understood with the aid of fuel cell diagnoses.
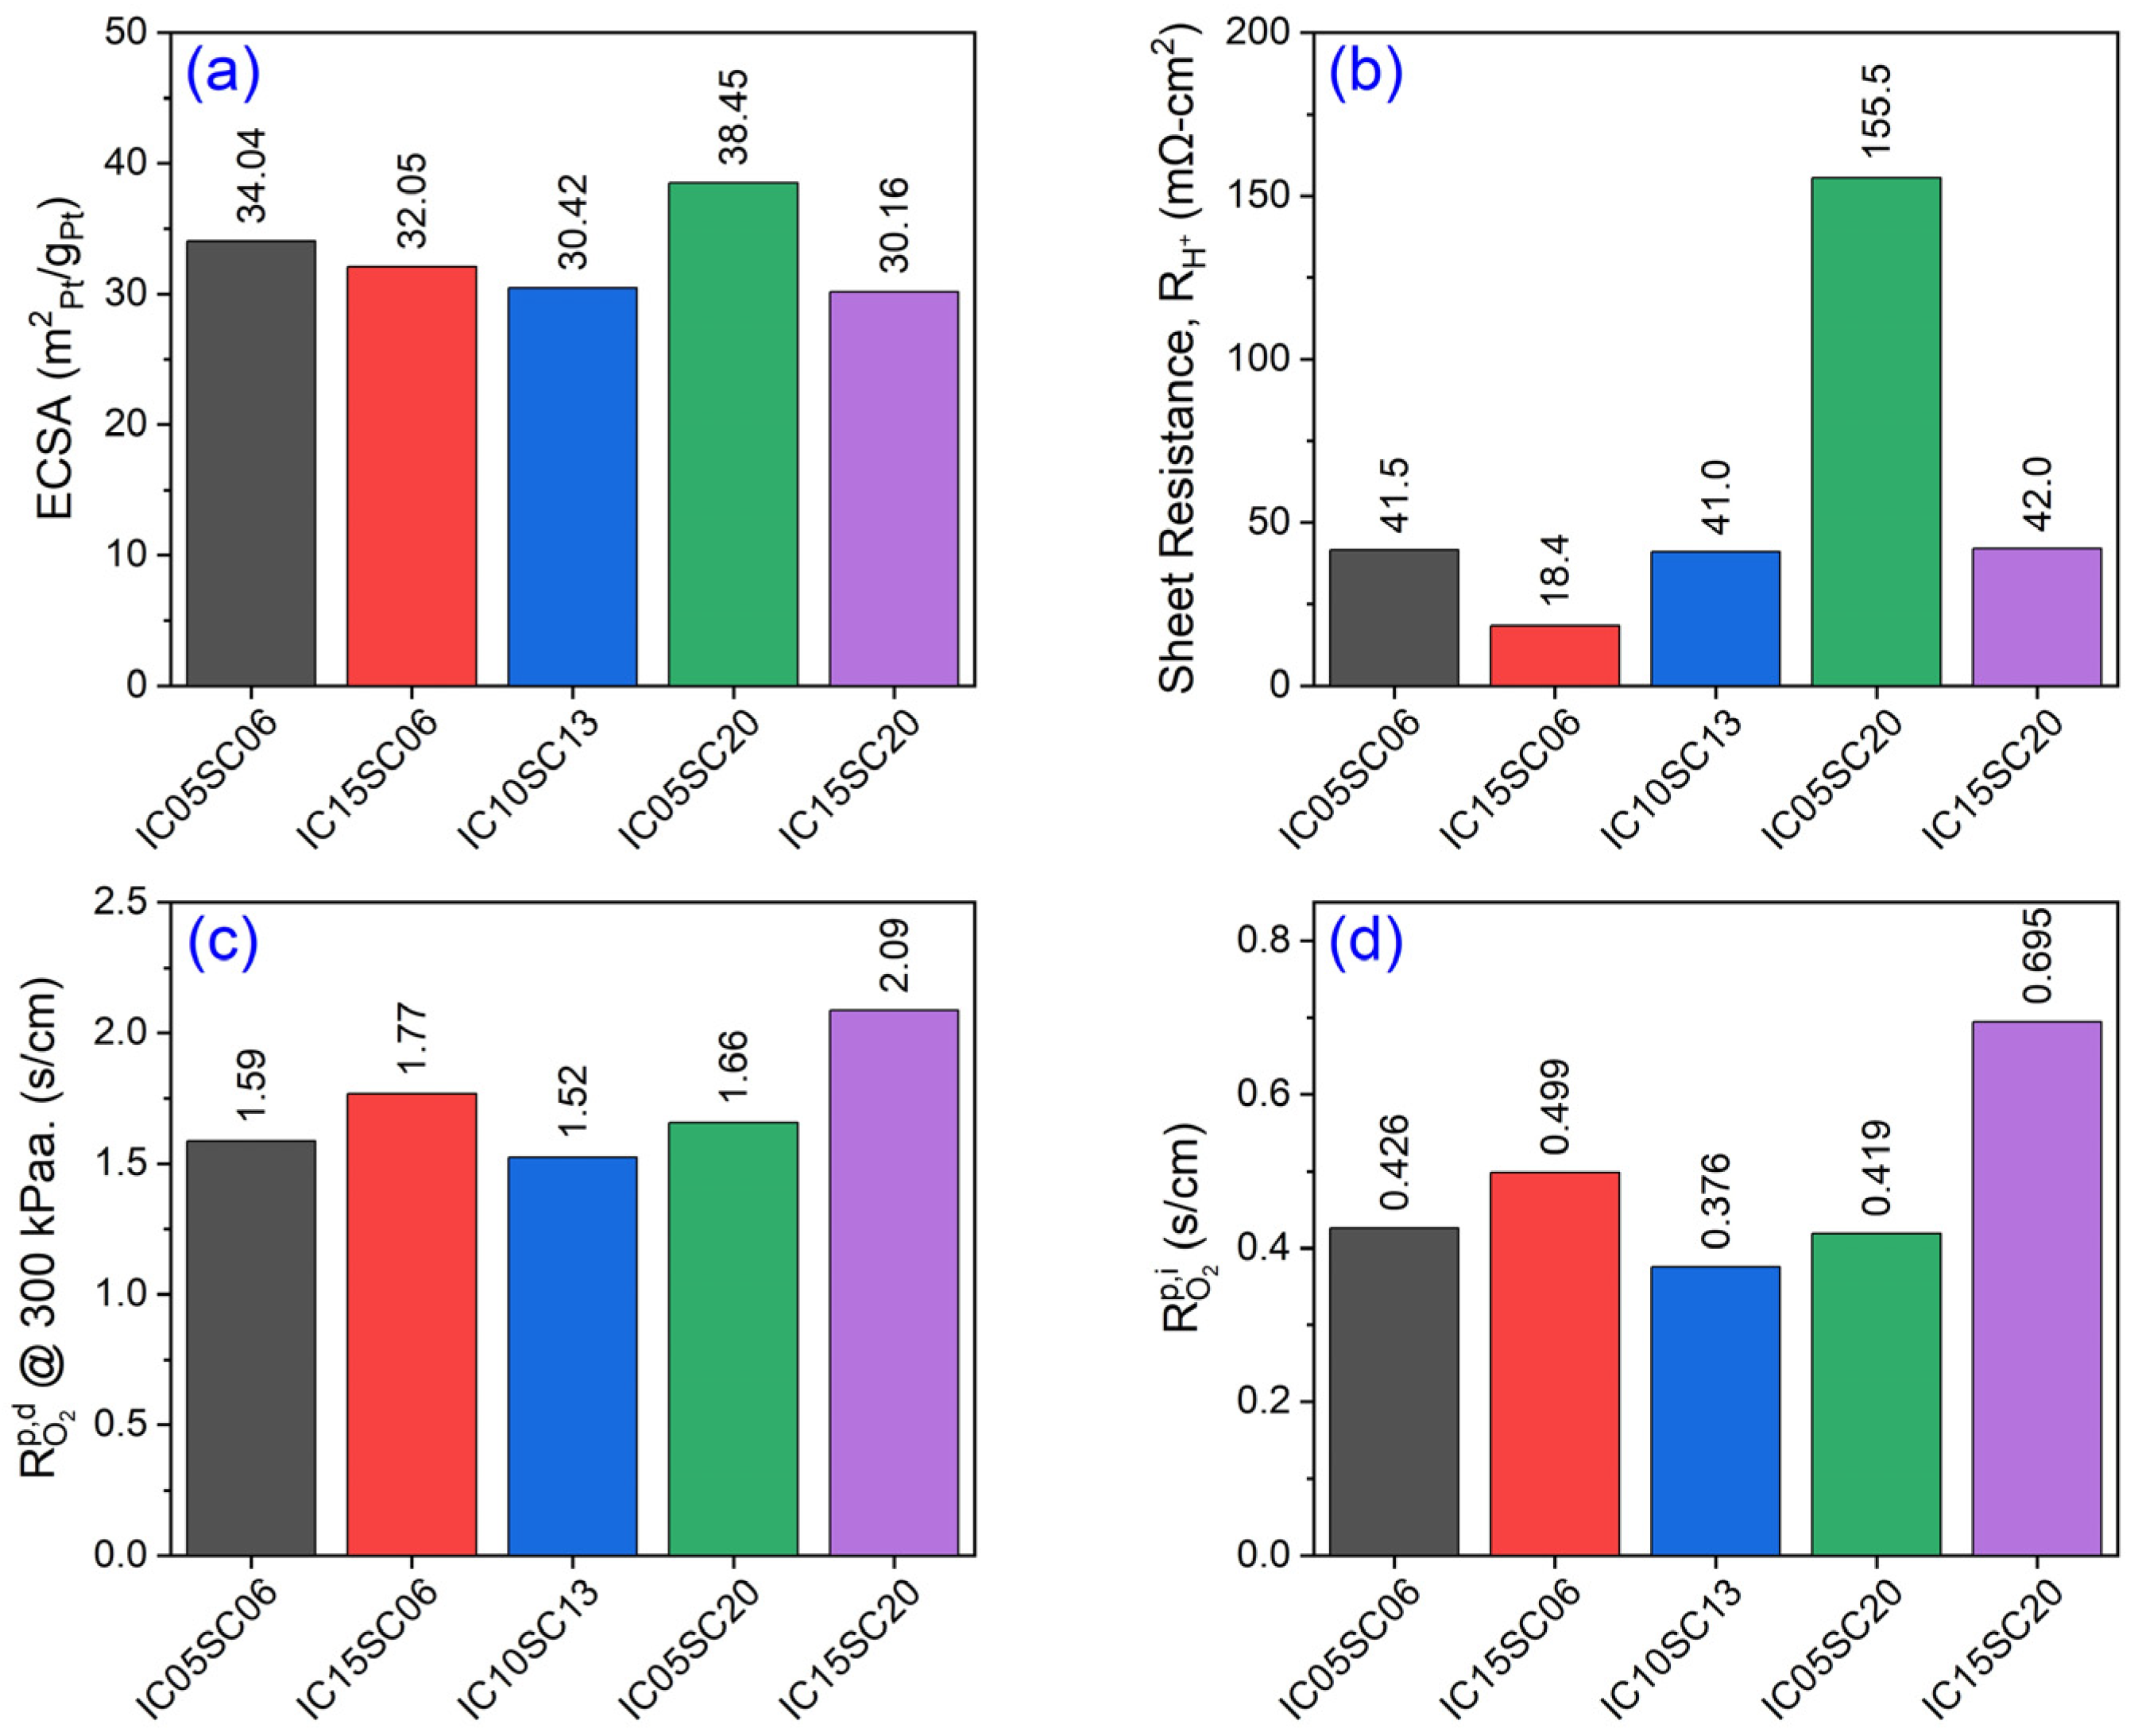
A more detailed portrayal of the roles of the I/C ratio and solid content on the transport properties that were extracted from the fuel cell diagnostic measurements are presented in Figure 2. To avoid the complexity caused by the RH dependence, the ECSA and sheet resistance were measured under wet conditions, while R O 2 p , d and R O 2 p , i were measured under dry conditions. The ECSA was measured through the cyclic voltammetry (CV) method by flowing hydrogen at the anode and nitrogen at the cathode. The ECSA was determined by the hydrogen adsorption and desorption (HAD) method using cyclic voltammetry (CV), which was achieved by measuring the charge associated with the hydrogen adsorption/desorption peaks (assuming that a known charge density is required to oxidize a monolayer of hydrogen on the catalyst surface (e.g., 210 µC/cm2 for platinum)). The total charge (Q) was obtained by integrating the area under the hydrogen adsorption/desorption peaks in the cyclic voltammogram after subtracting the background current. The ECSA was then calculated using the following formula:
ECSA = Q / ( q × L ) ,
where Q is the total charge for the hydrogen adsorption/desorption, q is the charge density per unit area, and L is the cathode catalyst loading.
As shown in Figure 2a, the ECSA values of all the samples were relatively close and ranged between 30 and 40 m2pt/gpt. However, a general trend can be observed that the ECSA increases with decreasing I/C ratio. In addition, when the I/C ratio is very low (I/C = 0.5), the solid content has a strong effect due to its microstructure. This observation is rather important because it suggests that more reaction sites can be achieved by using a low I/C ratio with high solid content. However, to minimize the sheet resistance, a moderate I/C ratio and solid content no greater than 13% would be preferred, as suggested in Figure 2b, where it is shown that the sheet resistance was surprisingly sensitive to the solid content. More surprisingly, as shown in Figure 2c,d, both the R O 2 p , d and R O 2 p , i depended on not only the I/C ratio, but also on the solid content. It is well understood that a high I/C ratio tends to result in surplus ionomers embedding in the catalyst layer microstructure, thus hampering oxygen transport [38]. However, the role of solid content in affecting oxygen transport needs further investigation to be fully understood.
To elucidate the compound effect of the I/C ratio and solid content on the transport properties from a structural perspective, the local and global structural characteristics of the ionomer-Pt/C assemblage with respect to the formation process of the catalyst layer microstructure was investigated and is presented in the following.
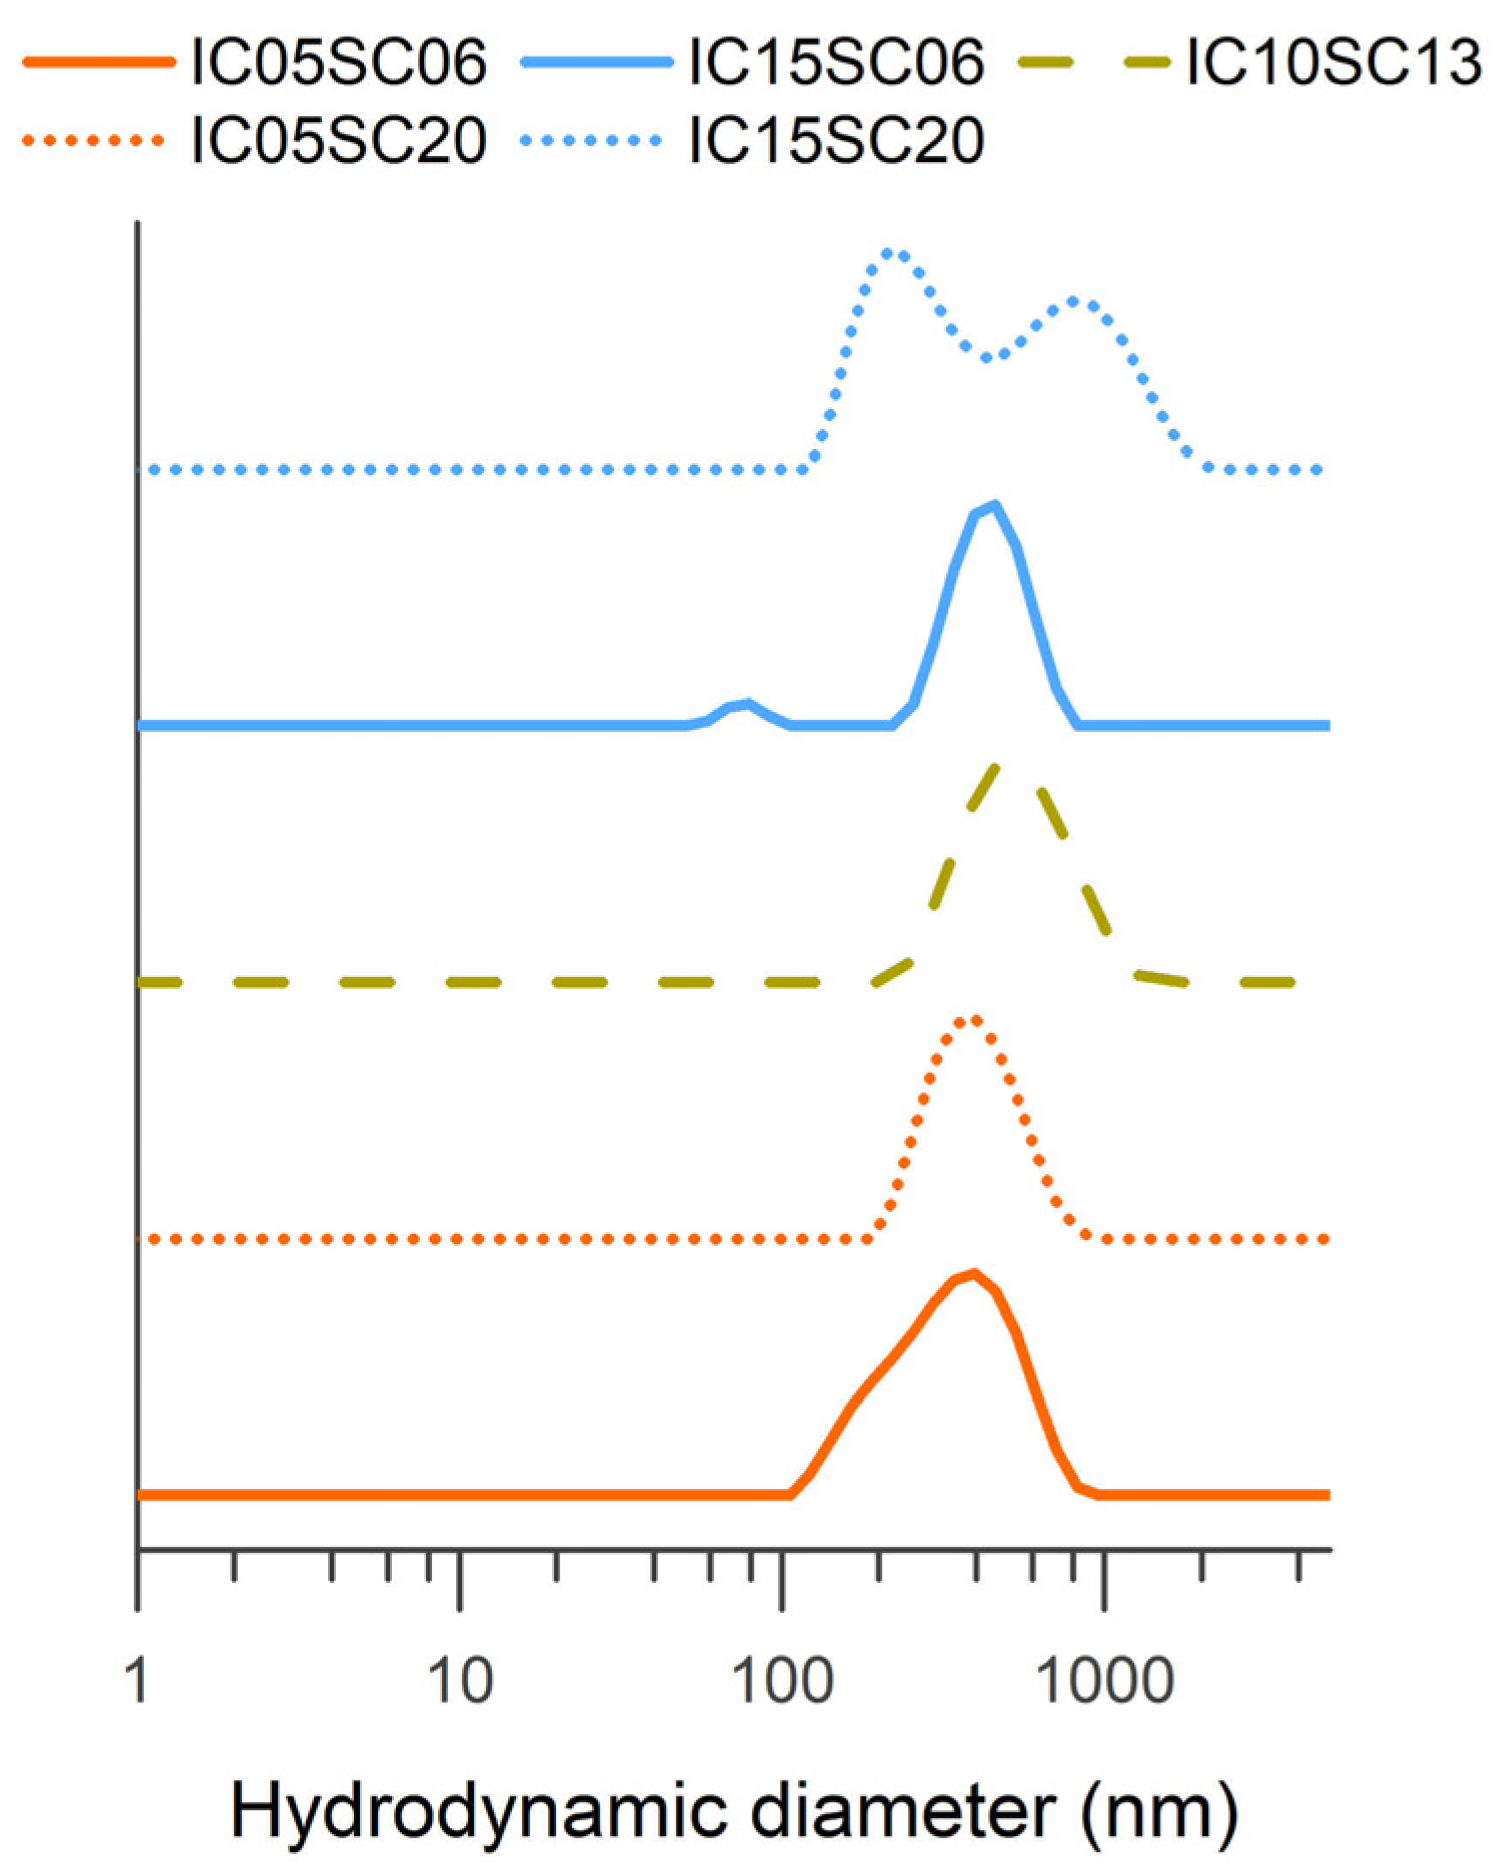
In the water-rich systems examined within this study, the intricate local structure of the self-associated ionomer-Pt/C assembly arose as a collective outcome of the ionomer aggregation, ionomer adsorption, and particle aggregation. This complex arrangement can be deduced from the size distribution of the particles observed in a dilute system. It is worth noting that the size distribution presented here offers insights into particle dynamics rather than portraying a static, steady-state observation. As shown in Figure 3, the systems with a high I/C ratio displayed a bimodal size distribution, which was attributed to the pronounced aggregation and adsorption of a significant quantity of ionomers. In systems featuring a low ionomer-to-carbon (I/C) ratio, the ionomer aggregation appeared to yield to the adsorption on Pt/C aggregates, thereby resulting in a unimodal size distribution with a relatively broad peak width. However, the influence of the solid content on determining the size distribution was not straightforward. As shown in Table 1, at low I/C ratios, such as 0.5, the solid content demonstrated a stronger correlation with the carbon volume fraction. Conversely, at relatively high I/C ratios, around 1.5, the solid content showed a closer association with the ionomer volume fraction. As depicted in Figure 3, increasing the solid content while maintaining a low ionomer concentration resulted in a narrow, unimodal size distribution of the ionomer-Pt/C assemblage, with no apparent peak shift. Conversely, when the ionomer concentration was high, increasing the solid content not only induces a broad, bimodal size distribution, but also leads to significant peak shifts, thus indicating a substantial alteration in the structure. The ionomer-Pt/C assemblage self-associates due to ionomer adsorption onto the outer surface of the Pt/C aggregates, thereby bridging and patching through aggregated backbones, as well as likely leading to the formation of a coarsely densified structure via diffusion-limited cluster aggregation. The detailed local structure formed by each combination of the I/C ratio and solid content will be discussed in the Discussion Section.
Apart from the local structure, the flow properties of the intact global structure of the ionomer-Pt/C assemblage in the catalyst inks of various I/C ratios and solid contents were depicted by Herschel–Bulkley parameters. The apparent yield stress, σ0, approximates the strength of the intact global structure of the ionomer-Pt/C as it represents the interparticle forces in the Brownian regime. As shown in Figure 4a, σ0 is sensitive to the solid content over I/C ratio, thereby indicating a direct contribution of Pt/C aggregates to the strength of the intact global structure of the ionomer-Pt/C assemblage, irrespective of the I/C ratios. Such an effect of the solid content also manifests in the consistency index, k, representing the structural crosslinking, as shown in Figure 4b. However, at a high solid content, both σ0 and k are diminished by increasing the I/C ratio, thus indicating severe structural mediation by ionomer aggregates in between the clusters. The interdependence between solid content and I/C ratio in affecting the σ0 and k becomes compound when it comes to the influence on the flow index, n. As shown in Figure 4c, the n values were positively proportional to both the solid content and the I/C ratio. Note that n, when less than 1, describes the extent of the shear-thinning nature of the sample. In this study, n was regarded as being associated with the intra-cluster strength of the ionomer-Pt/C assemblage within the catalyst ink. The data presented in Figure 4c indicate that there was an increase in the intra-cluster forces with higher concentrations of the ionomer and/or the Pt/C particles.
In addition to the flow properties, the shear-induced behavior of the global structure of the ionomer-Pt/C assemblage in the catalyst inks was also measured. High shear forces exerted during ink casting processes can influence the catalyst layer microstructures through several mechanisms. Firstly, the high shear forces can lead to the alignment and compaction of catalyst particles, resulting in cluster densification. This densification occurs as smaller particles are forced together, thus reducing interparticle distances and promoting closer packing. Additionally, high shear can affect the particulate network connectivity by promoting particle rearrangement and consolidation. The shear-induced alignment of particles can enhance interparticle contact and improve connectivity within the catalyst layer, thus facilitating efficient charge and mass transport pathways. Furthermore, shear forces can also influence the orientation and distribution of pore structures within the catalyst layer, which impacts gas diffusion and electrolyte penetration. Overall, understanding these mechanisms is crucial for optimizing catalyst layer fabrication processes and ultimately enhancing the performance of PEMFCs. Since the structural characteristics of an elastic space-filling gel were observed for all the samples, only the initial values and shear-induced percentage changes in the plateau elastic modulus, G’, of the networks were focused, as presented in Figure 5 [39]. As shown in Figure 5a, the values of the G’ of the networks were greatly dependent on the solid content as the Pt/C particles constituting the network were the primary contributor of G’. It is evident that increasing the I/C ratio consistently results in a softer network for the sample, regardless of the solid content.
The data from G’ revealed the morphological characteristics of the intact particulate network in each catalyst ink, and these characteristics can undergo significant changes due to shear processes. Figure 5b displays the percentage recovery of G’ after subjecting the samples to a simulated shear process at 1000 s⁻1 for 10 s. It is evident that the percentage recovery of G’ was jointly influenced by both the I/C ratio and the solid content. Generally, a high solid content enhances structural resilience to the shear process, likely due to the contribution from the Pt/C particles. However, the combination of a high I/C ratio and low solid content results in limited structural resilience to the simulated shear process.
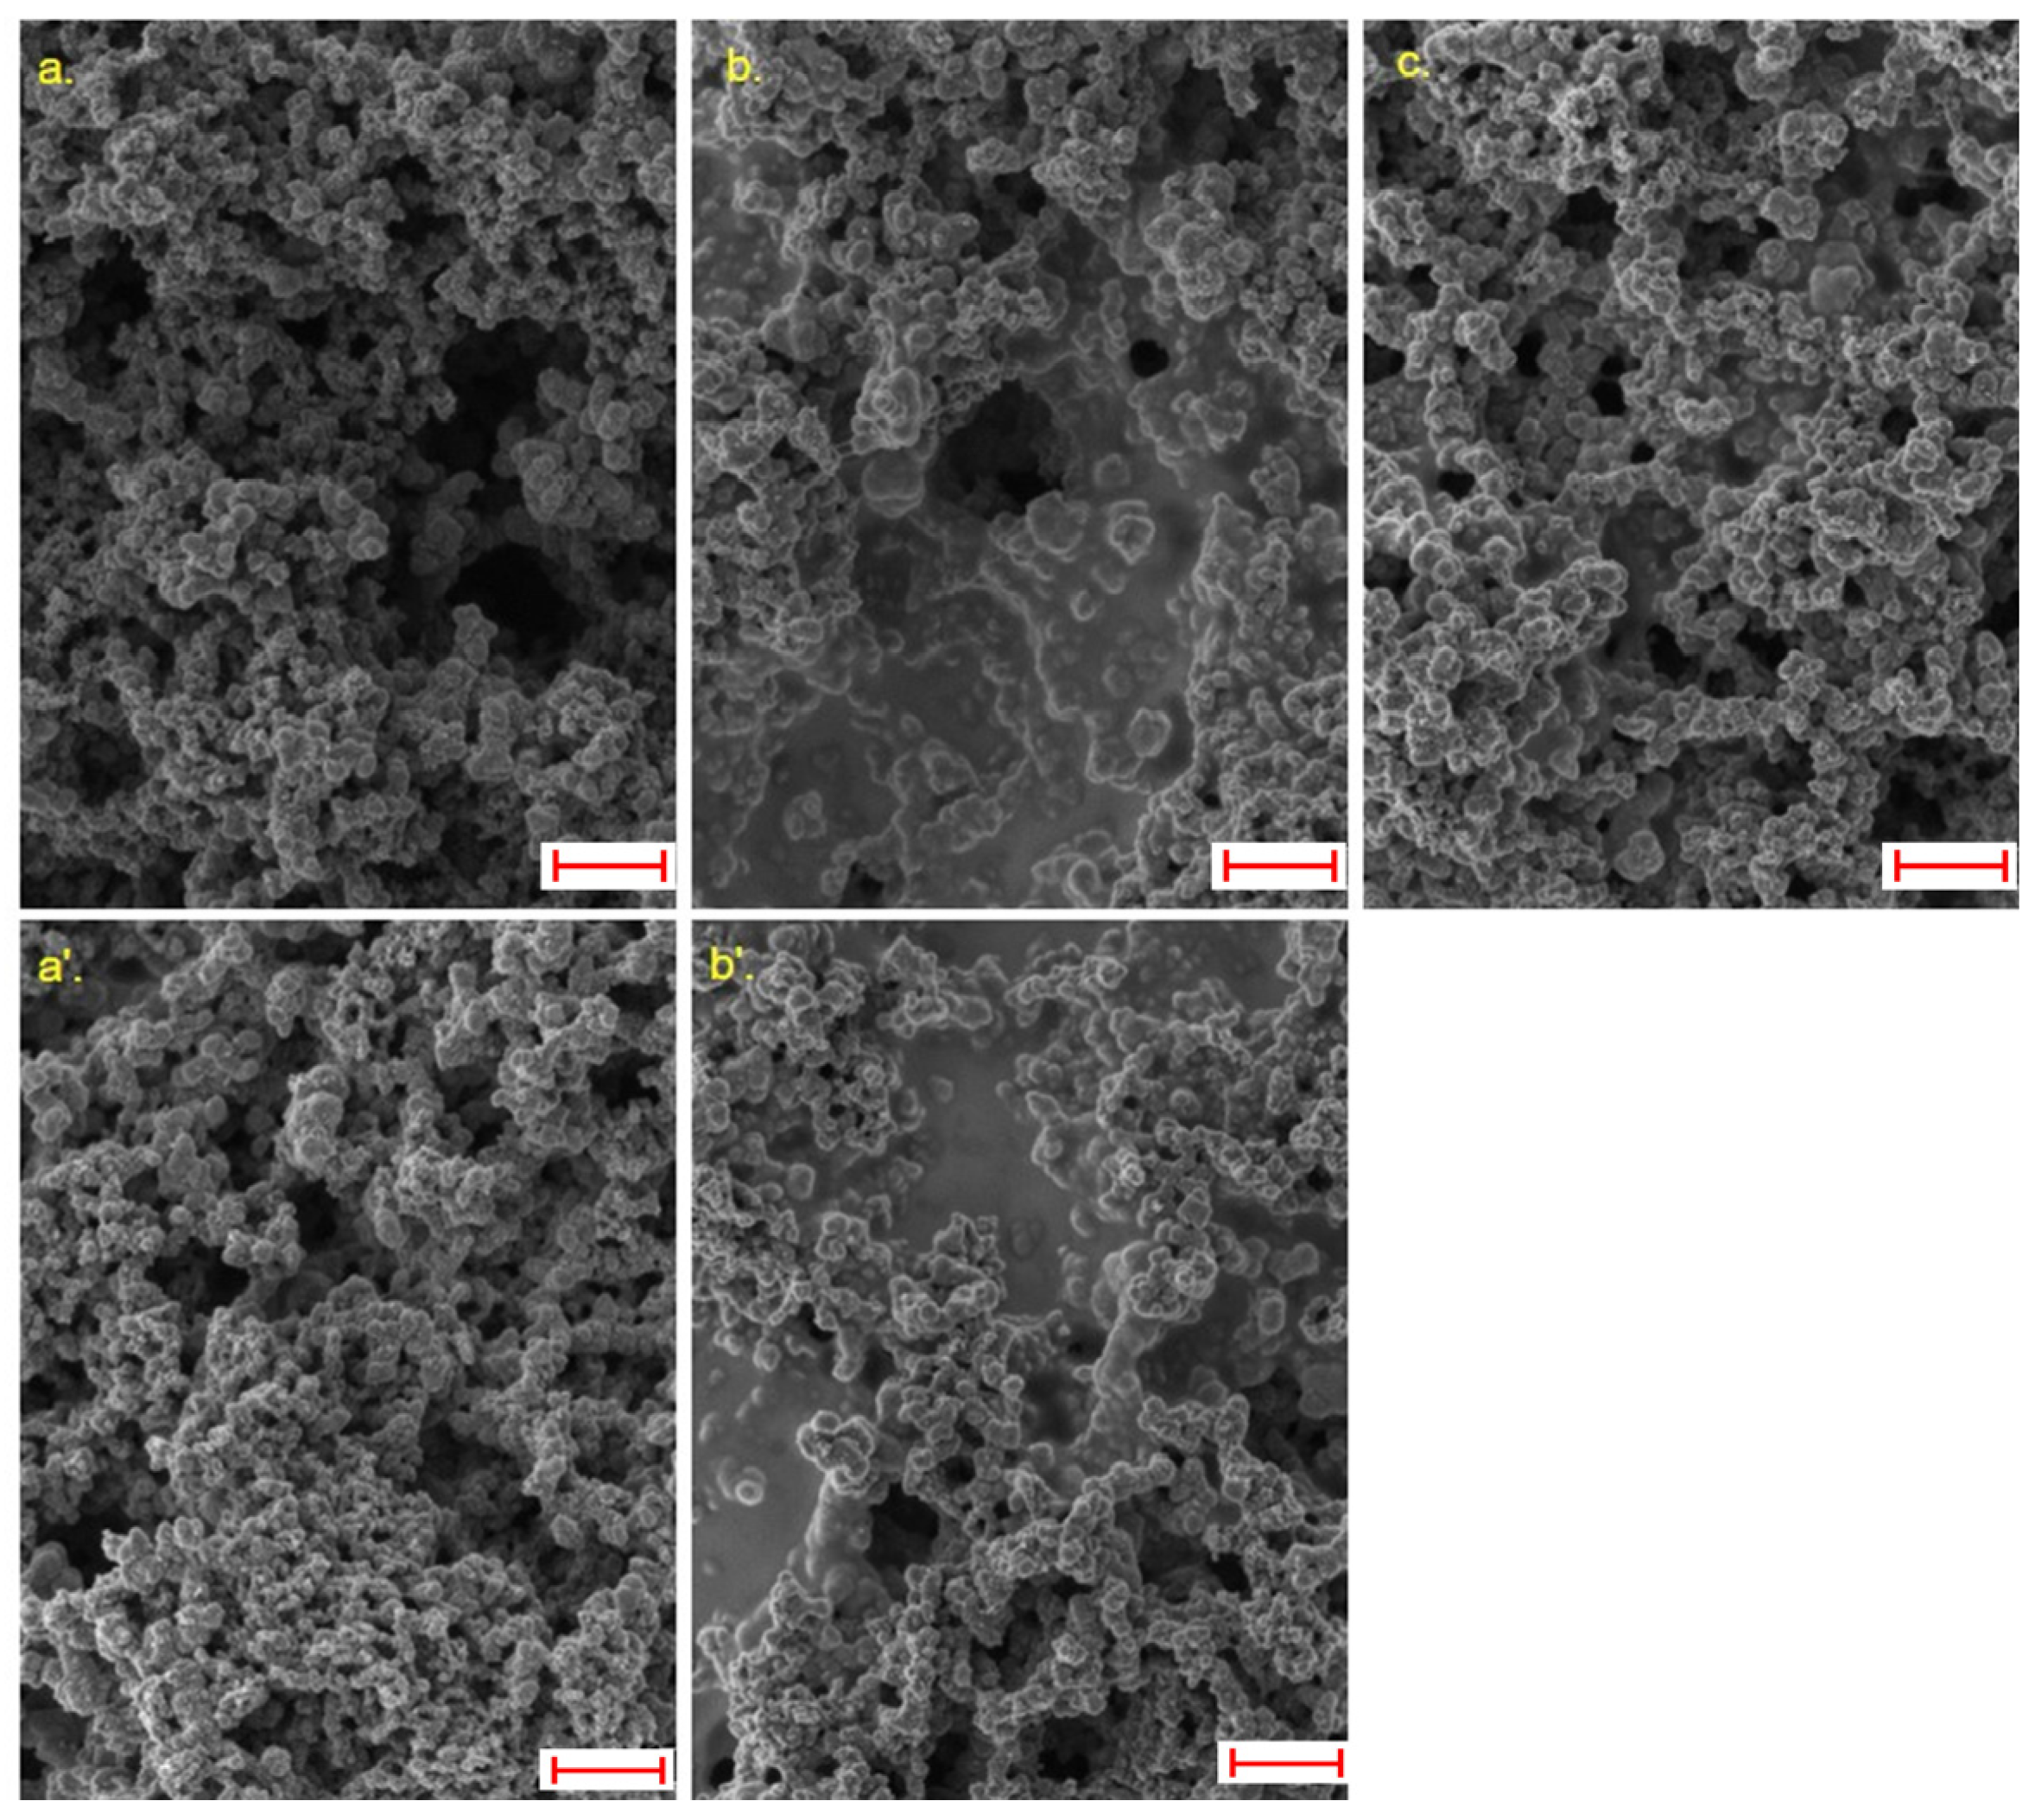
Figure 6 presents the FESEM images of the pristine catalyst layers. In addition to the noticeable presence of free ionomer bodies at high I/C ratios depicted in Figure 6b,b’, it is apparent that the texture of the particulate network becomes denser with increasing solid content. This observed structural densification, attributed to high solid content aligns with simulations from prior references, thus indicating that a higher volume fraction of solid particles in an attractive system leads to a more spatially homogeneous gel formation [21].

4. Discussion

The morphological characteristics of the ionomer-Pt/C assemblage play a crucial role in determining the electrochemical and transport properties of the catalyst layer. This ionomer-Pt/C assemblage structure serves as the foundation for the overall particulate arrangement within the catalyst layer. Both the shape and interconnection of the clusters, alongside the morphology and spatial arrangement of the ionomer, influence the distribution of sites for electrochemical reactions and the effectiveness of pathways for transporting reactants and products. In a water-rich liquid environment, the ionomer-Pt/C assemblage forms a self-associated attractive system, thus leading to the formation of clusters that are coarsely densified and loosely connected. PFSA ionomer molecules, composed of a hydrophobic perfluorocarbon backbone with hydrophilic sulfonated vinyl ether side chains, exhibit a tendency to form backbone-aggregated structures in water-rich liquid environments due to their low compatibility [40].
In this study, within the context of the water-rich environment, our focus lies on understanding the relationship between the ionomer volume fraction and the particle volume fraction, specifically regarding the I/C ratio and solid content. Consequently, we anticipate that the nature of the ionomer-Pt/C agglomerates and the mechanism of cluster aggregation will remain consistent. As a result, our analysis of the hydrodynamic size distribution and rheological data has provided clear insights into both local and overall structural attributes of the ionomer-Pt/C combinations within the catalyst inks. For IC05SC06, the low concentrations of the ionomer and the Pt/C particles do not promote a high extent of ionomer aggregation and Pt/C aggregation. The broad peak shown in Figure 3 indicates the dynamics of reversible particle self-association, which suggest a strong bridging and steric effect of ionomer aggregates at the carbon surface of the Pt/C aggregates [41,42]. As a result, the local structure primarily arises from strong ionomer adsorption, which occurs rapidly at the Pt/C surface. This process yields a local arrangement characterized by variably sized, fine Pt/C particles, with ionomer aggregates forming a covering layer on their outer surfaces. Based on the rheological data, IC05SC06 displays characteristics such as low interparticle force or hinderance within neighborhoods, restricted structural crosslinking, weak intra-cluster strength, and relatively low rigidity. These traits suggest a global structure reminiscent of highly fractal and loosely connected particulate arrangements.
In the case of IC05SC20, with the increase in the total volume fraction of ionomer and Pt/C, particularly the volume fraction of Pt/C, there is a greater promotion of Pt/C aggregation compared to ionomer aggregation. This results in the densification of Pt/C aggregates, while the ionomer is predominantly adsorbed on the outer surfaces. Consequently, as illustrated by the rheological data, IC05SC20 exhibits the highest interparticle force, the greatest extent of structural crosslinking, the highest rigidity, and relatively strong intra-cluster strength. These characteristics indicate the formation of a highly densified and extensively interconnected particulate network. In the case of IC15SC06, one can anticipate a spatially uneven distribution of the ionomer due to its higher volume fraction compared to carbon. Alongside adsorption, there is a significant likelihood of enhanced ionomer aggregation, which forms distinct entities separate from those adsorbed within the system. This phenomenon is indicated by the minor peak observed in Figure 3. Conversely, the combination of a low-carbon-volume fraction and robust ionomer adsorption may culminate in the formation of larger, finely sized ionomer-Pt/C clusters. Consequently, the overall structure of IC15SC06 manifests as having low interparticle force, restricted structural crosslinking, relatively weak intra-cluster strength, and the lowest level of rigidity. The particulate framework is anticipated to resemble that of IC05SC06, albeit with a greater presence of adsorbed ionomers that is randomly distributed throughout.
In the case of IC15SC20, where both more ionomers and more Pt/C are present, there is a simultaneous encouragement for ionomer aggregation, ionomer adsorption, and Pt/C aggregation. Notably, with the ionomer’s volume fraction being nearly double that of Pt/C, a robust ionomer aggregation is anticipated, thereby potentially mediating between the Pt/C aggregations in addition to adsorption. The combined bimodal size distribution depicted in Figure 3 indicates significant ionomer mediation between the variably sized Pt/C aggregates, which results in a highly heterogeneous local structure. The moderate interparticle force and structural crosslinking, along with the highest intra-cluster strength and decent rigidity, suggest a global structure characterized by densely packed clusters with a thick layer of adsorbed ionomer, as well as separate free bodies of ionomers. The morphological characteristics described above offer valuable insights into the hierarchical structure of the pristine catalyst layer. However, it is essential to note that the functional ionomer-Pt/C assemblages undergo restructuring during high shear processes of rod coating, unlike the intact structures mentioned previously. The electrochemical and transport properties of the restructured ionomer-Pt/C assemblages are determined by the restructured morphology of the Pt/C phase and the ionomer phase. As the data in Figure 5b suggested, after being subjected to the simulated shear condition of 1000 s−1 for 10 s, only IC15SC20 is free from the loss of elastic connectivity while the others have lost a certain extent of the elastic response after the restructuring. The loss of the elasticity of the ionomer-Pt/C assemblage in the catalyst inks can be attributed to a spatial redistribution of the ionomer when subjected to high shear [17]. Given the attractive nature of these assemblages, it is reasonable to expect that restructuring would favor coalescence primarily due to ionomer aggregation and adsorption. This process could result in the formation of interpenetrated clusters or densified agglomerates [39,43]. This explains the distinct percentage recovery of G’ for IC15SC06 and IC15SC20 as the adsorption equilibrium of ionomer on the carbon surface depends on both the surface area and surface roughness [44,45,46].
The ECSA profile based on the measured data agrees with the previously explained structures. Since the same amount of the Pt catalyst is used in the measured catalyst layers, the variation of the ECSA value can only be attributed to the difference in the structure of ionomer-Pt/C backbone in the catalyst layer. As indicated in Figure 2, achieving a desirable high ECSA value necessitates a structure characterized by greater particulate connectivity but lower ionomer content. However, proton transport favors a higher ionomer content to establish effective transport pathways rather than prioritizing particulate connectivity [47]. This dilemma underscores the inherent complexity of heterogeneous catalysis and the resulting multiphase transport phenomena. As for oxygen transport, both R O 2 p , d and R O 2 p , i reach the minima where the solid content and I/C ratio are moderate. R O 2 p , d is the resistance related to oxygen diffusion in the bulk regime, where Fickian diffusion dominates in certain pores, of which the mean pore diameter is larger than the mean free path of the oxygen molecules (38.46–39.58 nm, 70–80 °C, 300 kPa) [48,49]. The structures that provide minimal values of R O 2 p , d feature a combination of IC05SC06 and IC10SC13. The characteristics of such structures include low interparticle force, moderate structure crosslinking, low intra-cluster strength, and relatively high rigidity in the catalyst inks. Namely, the oxygen diffusion in a bulk regime favors percolating pores (dia. >> 40 nm), which are formed by highly connected and mechanically stable particulate structures.
R O 2 p , i represents the resistance related to the oxygen diffusion in small pores dominated by Knudsen diffusion and through ionomer and/or water vapor. Due to the application of the hydrophobic microporous layer, liquid water accumulation in the catalyst layer is not the primary concern [50]. In addition, a previous study showed that a significant reduction in catalyst utilization occurs only at a high current density with high relative humidity [51]. Therefore, the impact of liquid water in the catalyst layer is not considered in this study. As mentioned earlier, R O 2 p , i is sensitive to the geometric intricacies of the particulate structure. On the one hand, oxygen self-diffusion in the Knudsen regime can face significant hindrance due to the tortuosity and roughness of the pathways [52]. On the other hand, the resistance caused by oxygen permeation through ionomers is greatly affected by the spatial distribution of the ionomer phase within the particulate structure. Therefore, the non-pressure driven oxygen transport would favor the particulate structures characterized by high connectivity (i.e., a small fractal dimension and long strands) and limited ionomer presence. The ionomer-Pt/C structure in the catalyst ink, exhibiting low interparticle force, high structural crosslinking, low intra-cluster strength, and high rigidity, would be preferrable in this scenario. Lastly, considering the RH dependence of the polarization curves in Figure 1, it becomes evident that particulate networks featuring ample ionic pathways and, more importantly, mechanically stable, and highly fractal, long strands would enhance mass transport at high current densities.

5. Conclusions

In this work, we qualitatively explored the effect of the I/C ratio and the solid content on the formation–structure–functionality relationship of the catalyst layers. The RH-dependent polarization curves and the data of the fuel cell diagnostic measurements demonstrated the compound effect of the I/C ratio and solid content on the mass transport, especially oxygen transport. Oxygen transport resistance can be minimized by using an I/C ratio of 1.0 and a solid content of 13 w.%. However, only minimizing oxygen transport resistance does not guarantee improved mass transport, especially when liquid water is present. The non-destructive hydrodynamic size distribution and rheological measurements were employed to elucidate the roles of the I/C ratio and the solid content in the formation of the catalyst layer structure. An analysis of the local and global structures of ionomer-Pt/C assemblages in catalyst inks highlighted their influence on the competition between homo-aggregation and hetero-aggregation, inter- and intra-cluster strengths, and the rigidity and connectivity of the particulate structure. Furthermore, simulated high shear applications tended to reduce particulate network connectivity and induce cluster densification, unless the global structure exhibited mechanical stability and resilience. In our study, structure densification primarily promoted by high shear through ionomer redistribution, adsorption, and aggregation. We found that a gel structure with high structural crosslinking, low inter- and intra-cluster strengths, and sufficient rigidity in the catalyst ink would produce ionomer-Pt/C assemblages with optimal electrochemical and transport properties. Despite the limitations of our work, our findings suggest that catalyst layers featuring sufficient ionic pathways and, notably, mechanically stable with highly fractal and long strands would enhance mass transport at high current densities.

Author Contributions

Conceptualization, methodology, investigation, formal analysis, validation, and writing—original draft, D.Y. and N.K.; data curation, formal analysis, and writing—original draft, M.S.; data curation and formal analysis, F.M.; conceptualization, visualization, methodology, supervision, project administration, funding acquisition, and writing—review and editing, P.-Y.A.C. All authors have read and agreed to the published version of the manuscript.

Funding

This work was supported by the University of California Merced (United States); the CIPHER Program (IIID 2018-008) from the Commission on Higher Education—Philippine California Advanced Research Institutes (CHED-PCARI) of the Republic of the Philippines; and the Million Mile Fuel Cell Truck (M2FCT) consortium, which is funded by the Department of Energy (DoE), US, under contract no. DE-AC02-05CH11231.

Data Availability Statement

The original contributions presented in the study are included in the article, further inquiries can be directed to the corresponding authors.

Acknowledgments

The authors are sincerely grateful for the service provided by the IMF facility at UC Merced.

Conflicts of Interest

The authors declare no conflicts of interest.

References

  1. Liu, S.; Yuan, S.; Liang, Y.; Li, H.; Xu, Z.; Xu, Q.; Yin, J.; Shen, S.; Yan, X.; Zhang, J. Engineering the Catalyst Layers towards Enhanced Local Oxygen Transport of Low-Pt Proton Exchange Membrane Fuel Cells: Materials, Designs, and Methods. Int. J. Hydrogen Energy 2023, 48, 4389–4417. [Google Scholar] [CrossRef]
  2. Schneider, P.; Batool, M.; Godoy, A.O.; Singh, R.; Gerteisen, D.; Jankovic, J.; Zamel, N. Impact of Platinum Loading and Layer Thickness on Cathode Catalyst Degradation in PEM Fuel Cells. J. Electrochem. Soc. 2023, 170, 024506. [Google Scholar] [CrossRef]
  3. Lee, C.H.; Kort-Kamp, W.J.M.; Yu, H.; Cullen, D.A.; Patterson, B.M.; Arman, T.A.; Komini Babu, S.; Mukundan, R.; Borup, R.L.; Spendelow, J.S. Grooved Electrodes for High-Power-Density Fuel Cells. Nat. Energy 2023, 8, 685–694. [Google Scholar] [CrossRef]
  4. Kongkanand, A.; Mathias, M.F. The Priority and Challenge of High-Power Performance of Low-Platinum Proton-Exchange Membrane Fuel Cells. J. Phys. Chem. Lett. 2016, 7, 1127–1137. [Google Scholar] [CrossRef] [PubMed]
  5. Cetinbas, F.C.; Wang, X.; Ahluwalia, R.K.; Kariuki, N.N.; Winarski, R.P.; Yang, Z.; Sharman, J.; Myers, D.J. Microstructural Analysis and Transport Resistances of Low-Platinum-Loaded PEFC Electrodes. J. Electrochem. Soc. 2017, 164, F1596–F1607. [Google Scholar] [CrossRef]
  6. Muzaffar, T.; Kadyk, T.; Eikerling, M. Tipping Water Balance and the Pt Loading Effect in Polymer Electrolyte Fuel Cells: A Model-Based Analysis. Sustain. Energy Fuels 2018, 2, 1189–1196. [Google Scholar] [CrossRef]
  7. Schuler, T.; Chowdhury, A.; Freiberg, A.T.; Sneed, B.; Spingler, F.B.; Tucker, M.C.; More, K.L.; Radke, C.J.; Weber, A.Z. Fuel-Cell Catalyst-Layer Resistance via Hydrogen Limiting-Current Measurements. J. Electrochem. Soc. 2019, 166, F3020–F3031. [Google Scholar] [CrossRef]
  8. Mu, Y.T.; Weber, A.Z.; Gu, Z.L.; Schuler, T.; Tao, W.Q. Mesoscopic Analyses of the Impact of Morphology and Operating Conditions on the Transport Resistances in a Proton-Exchange-Membrane Fuel-Cell Catalyst Layer. Sustain. Energy Fuels 2020, 4, 3623–3639. [Google Scholar] [CrossRef]
  9. Yarlagadda, V.; Carpenter, M.K.; Moylan, T.E.; Kukreja, R.S.; Koestner, R.; Gu, W.; Thompson, L.; Kongkanand, A. Boosting Fuel Cell Performance with Accessible Carbon Mesopores. ACS Energy Lett. 2018, 3, 618–621. [Google Scholar] [CrossRef]
  10. Banham, D.; Choi, J.Y.; Kishimoto, T.; Ye, S. Integrating PGM-Free Catalysts into Catalyst Layers and Proton Exchange Membrane Fuel Cell Devices. Adv. Mater. 2019, 31, 1804846. [Google Scholar] [CrossRef]
  11. Ott, S.; Orfanidi, A.; Schmies, H.; Anke, B.; Nong, H.N.; Hübner, J.; Gernert, U.; Gliech, M.; Lerch, M.; Strasser, P. Ionomer Distribution Control in Porous Carbon-Supported Catalyst Layers for High-Power and Low Pt-Loaded Proton Exchange Membrane Fuel Cells. Nat. Mater. 2020, 19, 77–85. [Google Scholar] [CrossRef] [PubMed]
  12. Du, S.; Guan, S.; Mehrazi, S.; Zhou, F.; Pan, M.; Zhang, R.; Chuang, P.-Y.A.; Sui, P.-C. Effect of Dispersion Method and Catalyst on the Crack Morphology and Performance of Catalyst Layer of PEMFC. J. Electrochem. Soc. 2021, 168, 114506. [Google Scholar] [CrossRef]
  13. Xie, J.; Xu, F.; Wood, D.L.; More, K.L.; Zawodzinski, T.A.; Smith, W.H. Influence of Ionomer Content on the Structure and Performance of PEFC Membrane Electrode Assemblies. Electrochim. Acta 2010, 55, 7404–7412. [Google Scholar] [CrossRef]
  14. Cetinbas, F.C.; Ahluwalia, R.K. Agglomerates in Polymer Electrolyte Fuel Cell Electrodes: Part II. Transport Characterization. J. Electrochem. Soc. 2018, 165, F1059–F1066. [Google Scholar] [CrossRef]
  15. Inoue, G.; Ohnishi, T.; So, M.; Park, K.; Ono, M.; Tsuge, Y. Simulation of Carbon Black Aggregate and Evaluation of Ionomer Structure on Carbon in Catalyst Layer of Polymer Electrolyte Fuel Cell. J. Power Sources 2019, 439, 227060. [Google Scholar] [CrossRef]
  16. Mu, Y.T.; Weber, A.Z.; Gu, Z.L.; Tao, W.Q. Mesoscopic Modeling of Transport Resistances in a Polymer-Electrolyte Fuel-Cell Catalyst Layer: Analysis of Hydrogen Limiting Currents. Appl. Energy 2019, 255, 113895. [Google Scholar] [CrossRef]
  17. Mehrazi, S.; Homayouni, T.; Kakati, N.; Sarker, M.; Rolfe, P.; Chuang, P.Y.A. A Rheo-Impedance Investigation on the Interparticle Interactions in the Catalyst Ink and Its Impact on Electrode Network Formation in a Proton Exchange Membrane Fuel Cell. Appl. Energy 2024, 359, 122680. [Google Scholar] [CrossRef]
  18. Wang, Y.; Liu, T.; Sun, H.; He, W.; Fan, Y.; Wang, S. Investigation of Dry Ionomer Volume Fraction in Cathode Catalyst Layer under Different Relative Humilities and Nonuniform Ionomer-Gradient Distributions for PEM Fuel Cells. Electrochim. Acta 2020, 353, 136491. [Google Scholar] [CrossRef]
  19. Hosokawa, M.; Nogi, K.; Naito, M.; Yokoyama, T. Nanoparticle Technology Handbook; Elsevier: Amsterdam, The Netherlands, 2008; ISBN 9780444531223. [Google Scholar]
  20. Zaccarelli, E. Colloidal Gels: Equilibrium and Non-Equilibrium Routes. J. Phys. Condens. Matter 2007, 19, 323101. [Google Scholar] [CrossRef]
  21. Johnson, L.C.; Zia, R.N.; Moghimi, E.; Petekidis, G. Influence of Structure on the Linear Response Rheology of Colloidal Gels. J. Rheol. 2019, 63, 583–608. [Google Scholar] [CrossRef]
  22. Geier, O.; Vasenkov, S.; Kärger, J. Pulsed Field Gradient Nuclear Magnetic Resonance Study of Long-Range Diffusion in Beds of NaX Zeolite: Evidence for Different Apparent Tortuosity Factors in the Knudsen and Bulk Regimes. J. Chem. Phys. 2002, 117, 1935–1938. [Google Scholar] [CrossRef]
  23. Malek, K.; Coppens, M.O. Knudsen Self- and Fickian Diffusion in Rough Nanoporous Media. J. Chem. Phys. 2003, 119, 2801–2811. [Google Scholar] [CrossRef]
  24. Inoue, G.; Kawase, M. Understanding Formation Mechanism of Heterogeneous Porous Structure of Catalyst Layer in Polymer Electrolyte Fuel Cell. Int. J. Hydrogen Energy 2016, 41, 21352–21365. [Google Scholar] [CrossRef]
  25. Jinnouchi, R.; Kudo, K.; Kitano, N.; Morimoto, Y. Molecular Dynamics Simulations on O2 Permeation through Nafion Ionomer on Platinum Surface. Electrochim. Acta 2016, 188, 767–776. [Google Scholar] [CrossRef]
  26. Huang, J.; Li, Z.; Zhang, J. Review of Characterization and Modeling of Polymer Electrolyte Fuel Cell Catalyst Layer: The Blessing and Curse of Ionomer. Front. Energy 2017, 11, 334–364. [Google Scholar] [CrossRef]
  27. Ramaswamy, N.; Kumaraguru, S.; Koestner, R.; Fuller, T.; Gu, W.; Kariuki, N.; Myers, D.; Dudenas, P.J.; Kusoglu, A. Editors’ Choice—Ionomer Side Chain Length and Equivalent Weight Impact on High Current Density Transport Resistances in PEMFC Cathodes. J. Electrochem. Soc. 2021, 168, 024518. [Google Scholar] [CrossRef]
  28. Normile, S.J.; Sabarirajan, D.C.; Calzada, O.; De Andrade, V.; Xiao, X.; Mandal, P.; Parkinson, D.Y.; Serov, A.; Atanassov, P.; Zenyuk, I.V. Direct Observations of Liquid Water Formation at Nano- and Micro-Scale in Platinum Group Metal-Free Electrodes by Operando X-ray Computed Tomography. Mater. Today Energy 2018, 9, 187–197. [Google Scholar] [CrossRef]
  29. Malek, K.; Mashio, T.; Eikerling, M. Microstructure of Catalyst Layers in PEM Fuel Cells Redefined: A Computational Approach. Electrocatalysis 2011, 2, 141–157. [Google Scholar] [CrossRef]
  30. Mojica, F.; Rahman, M.A.; Sarker, M.; Hussey, D.S.; Jacobson, D.L.; LaManna, J.M.; Chuang, P.Y.A. Study of Converging-Diverging Channel Induced Convective Mass Transport in a Proton Exchange Membrane Fuel Cell. Energy Convers. Manag. 2021, 237, 114095. [Google Scholar] [CrossRef]
  31. Novitski, D.; Holdcroft, S. Determination of O2 Mass Transport at the Pt|PFSA Ionomer Interface under Reduced Relative Humidity. ACS Appl. Mater. Interfaces 2015, 7, 27314–27323. [Google Scholar] [CrossRef]
  32. Orfanidi, A.; Madkikar, P.; El-Sayed, H.A.; Harzer, G.S.; Kratky, T.; Gasteiger, H.A. The Key to High Performance Low Pt Loaded Electrodes. J. Electrochem. Soc. 2017, 164, F418–F426. [Google Scholar] [CrossRef]
  33. Baker, D.R.; Caulk, D.A.; Neyerlin, K.C.; Murphy, M.W. Measurement of Oxygen Transport Resistance in PEM Fuel Cells by Limiting Current Methods. J. Electrochem. Soc. 2009, 156, B991. [Google Scholar] [CrossRef]
  34. Harzer, G.S.; Schwämmlein, J.N.; Damjanović, A.M.; Ghosh, S.; Gasteiger, H.A. Cathode Loading Impact on Voltage Cycling Induced PEMFC Degradation: A Voltage Loss Analysis. J. Electrochem. Soc. 2018, 165, F3118–F3131. [Google Scholar] [CrossRef]
  35. Liu, Y.; Murphy, M.W.; Baker, D.R.; Gu, W.; Ji, C.; Jorne, J.; Gasteiger, H.A. Proton Conduction and Oxygen Reduction Kinetics in PEM Fuel Cell Cathodes: Effects of Ionomer-to-Carbon Ratio and Relative Humidity. J. Electrochem. Soc. 2009, 156, B970. [Google Scholar] [CrossRef]
  36. Cetinbas, F.C.; Ahluwalia, R.K.; Kariuki, N.N.; De Andrade, V.; Myers, D.J. Effects of Porous Carbon Morphology, Agglomerate Structure and Relative Humidity on Local Oxygen Transport Resistance. J. Electrochem. Soc. 2020, 167, 013508. [Google Scholar] [CrossRef]
  37. Shimoaka, T.; Wakai, C.; Sakabe, T.; Yamazaki, S.; Hasegawa, T. Hydration Structure of Strongly Bound Water on the Sulfonic Acid Group in a Nafion Membrane Studied by Infrared Spectroscopy and Quantum Chemical Calculation. Phys. Chem. Chem. Phys. 2015, 17, 8843–8849. [Google Scholar] [CrossRef] [PubMed]
  38. Kusoglu, A.; Weber, A.Z. New Insights into Perfluorinated Sulfonic-Acid Ionomers. Chem. Rev. 2017, 117, 987–1104. [Google Scholar] [CrossRef] [PubMed]
  39. Lazzari, S.; Nicoud, L.; Jaquet, B.; Lattuada, M.; Morbidelli, M. Fractal-like Structures in Colloid Science. Adv. Colloid Interface Sci. 2016, 235, 1–13. [Google Scholar] [CrossRef] [PubMed]
  40. Berlinger, S.A.; Dudenas, P.J.; Bird, A.; Chen, X.; Freychet, G.; McCloskey, B.D.; Kusoglu, A.; Weber, A.Z. Impact of Dispersion Solvent on Ionomer Thin Films and Membranes. ACS Appl. Polym. Mater. 2020, 2, 5824–5834. [Google Scholar] [CrossRef]
  41. Lee, S.J.; Yu, T.L.; Lin, H.L.; Liu, W.H.; Lai, C.L. Solution Properties of Nafion in Methanol/Water Mixture Solvent. Polymer 2004, 45, 2853–2862. [Google Scholar] [CrossRef]
  42. Mashio, T.; Ohma, A.; Tokumasu, T. Molecular Dynamics Study of Ionomer Adsorption at a Carbon Surface in Catalyst Ink. Electrochim. Acta 2016, 202, 14–23. [Google Scholar] [CrossRef]
  43. Kusano, T.; Hiroi, T.; Amemiya, K.; Ando, M.; Takahashi, T.; Shibayama, M. Structural Evolution of a Catalyst Ink for Fuel Cells during the Drying Process Investigated by CV-SANS. Polym. J. 2015, 47, 546–555. [Google Scholar] [CrossRef]
  44. Ma, S.; Chen, Q.; Jøgensen, F.H.; Stein, P.C.; Skou, E.M. 19F NMR Studies of NafionTM Ionomer Adsorption on PEMFC Catalysts and Supporting Carbons. Solid State Ion. 2007, 178, 1568–1575. [Google Scholar] [CrossRef]
  45. Andersen, S.M. Nano Carbon Supported Platinum Catalyst Interaction Behavior with Perfluorosulfonic Acid Ionomer and Their Interface Structures. Appl. Catal. B Environ. 2016, 181, 146–155. [Google Scholar] [CrossRef]
  46. Conchuir, B.O.; Harshe, Y.M.; Lattuada, M.; Zaccone, A. Analytical Model of Fractal Aggregate Stability and Restructuring in Shear Flows. Ind. Eng. Chem. Res. 2014, 53, 9109–9119. [Google Scholar] [CrossRef]
  47. Yakovlev, Y.V.; Lobko, Y.V.; Vorokhta, M.; Nováková, J.; Mazur, M.; Matolínová, I.; Matolín, V. Ionomer Content Effect on Charge and Gas Transport in the Cathode Catalyst Layer of Proton-Exchange Membrane Fuel Cells. J. Power Sources 2021, 490, 229531. [Google Scholar] [CrossRef]
  48. Nakauchi, M.; Mabuchi, T.; Hori, T.; Yoshimoto, Y.; Kinefuchi, I.; Takeuchi, H.; Tokumasu, T. Gas-Surface Interaction Study of Oxygen Molecules on Ionomer Surface in Catalyst Layer. ECS Trans. 2017, 80, 197. [Google Scholar] [CrossRef]
  49. Kinefuchi, I.; Oyama, J.; Yokoyama, K.; Kubo, N.; Tokumasu, T.; Matsumoto, Y. Direct Simulation Monte Carlo Analysis of Gas Transport in Microporous Structure Based on X-ray Computed Tomography. ECS Trans. 2013, 58, 71. [Google Scholar] [CrossRef]
  50. Sarker, M.; Rahman, M.A.; Mojica, F.; Mehrazi, S.; Kort-Kamp, W.; Chuang, P.A. Experimental and computational study of the microporous layer and hydrophobic treatment in the gas diffusion layer of a proton exchange membrane fuel cell. J. Power Sources 2021, 509, 230350. [Google Scholar] [CrossRef]
  51. Rahman, M.A.; Sarker, M.; Mojica, F.; Chuang, P.A. A physics-based 1-D PEMFC model for simulating two-phase water transport in the electrode and gas diffusion media. Appl. Energy 2022, 316, 119101. [Google Scholar] [CrossRef]
  52. Kaneko, T.; Yoshimoto, Y.; Hori, T.; Takagi, S.; Ooyama, J.; Terao, T.; Kinefuchi, I. Relation between Oxygen Gas Diffusivity and Porous Characteristics under Capillary Condensation of Water in Cathode Catalyst Layers of Polymer Electrolyte Membrane Fuel Cells. Int. J. Heat Mass Transf. 2020, 150, 119277. [Google Scholar] [CrossRef]
Figure 1. H2/air polarization curves of MEAs with various cathodic catalyst layers and corresponding high-frequency resistance (HFR) under (a) dry and (b) wet conditions.
Energies 17 02093 g001
Figure 2. (a) The electrochemically active surface area, ECSA. (b) The sheet resistance (proton transport resistance), (RH+). (c) The pressure-dependent oxygen transport resistance, R O 2 p , d , which, in this study, excludes the transport resistance in the flow channels and corresponds to the value measured at 300 psi. (d) The pressure-independent oxygen transport resistance, R O 2 p , i , as a function of both the I/C ratio and solid content.
Energies 17 02093 g002
Figure 3. The hydrodynamic diameter of the particles from dilute dispersions of the corresponding catalyst inks of various I/C ratios and solid contents.
Energies 17 02093 g003
Figure 4. The Herschel–Bulkley parameters of the ionomer-Pt/C assemblages in the catalyst inks of various I/C ratios and solid contents: (a) the apparent yield stress, σ0; (b) the consistency index, k; and (c) the flow index, n.
Energies 17 02093 g004
Figure 5. (a) The elastic modulus, G’, of the intact global structure of the ionomer-Pt/C assemblage in the catalyst inks of various I/C ratios and solid contents. (b) The percentage recovery of the G’ of the sample structure from an applied shear of 1000 s−1 for 10 s as a simulated coating process.
Energies 17 02093 g005
Figure 6. FESEM images of the pristine catalyst layers of various I/C ratios and solid contents: (a) IC05SC06; (a’) IC05SC20; (b) IC15SC06; (b’) IC15SC20; and (c) IC10SC13. The scale bars represent 300 nm.
Energies 17 02093 g006
Table 1. Sample code and control parameters.
SampleI/C RatioSolid Content (%) φ c (%) φ i (%)
IC05SC060.56.251.50.96
IC05SC200.520.05.13.95
IC15SC061.56.251.11.96
IC15SC201.520.03.66.84
IC10SC131.013.52.83.60
Table 2. Fuel cell test protocols.
TestTemp. (°C)InletLoad ControlStep Hold Time (min)
Gas (an/ca)Pressure (kPa)RH (%)Flow Rate (an/ca, L/min)
Dry polarization70H2/Air100600.4/0.2OCV-0.210
Wet polarization70H2/Air3001000.4/0.2OCV-0.210
CV30H2/N21001000.02/0.041.2–0.1 VN/A
EIS60H2/N23001000.1/0.10.2 V DC w/10 mV ACN/A
Dry limiting current80H2/Air&N2100, 150, 200, 300640.4/0.20.3–0.092
Disclaimer/Publisher’s Note: The statements, opinions and data contained in all publications are solely those of the individual author(s) and contributor(s) and not of MDPI and/or the editor(s). MDPI and/or the editor(s) disclaim responsibility for any injury to people or property resulting from any ideas, methods, instructions or products referred to in the content.