Article

Grid Quality Services from Smart Boilers: Experimental Verification on Realistic Scenarios for Micro-Grids with Demand-Side Management Oriented to Self-Consumption

by
Georgios S. Dimitrakakis
1,
Konstantinos G. Georgakas
1,
Evangelos S. Topalis
2 and
Panagis N. Vovos
3,*
1
Power Electronics Laboratory, Department of Electrical and Computer Engineering, University of Peloponnese, Megalou Alexandrou 1, 26334 Patras, Greece
2
Applied Electronics Laboratory, Department of Electrical and Computer Engineering, University of Patras, University Campus, 26504 Rion, Greece
3
Laboratory of Power Systems, Renewable and Distributed Generation, Department of Electrical and Computer Engineering, University of Patras, University Campus, 26504 Rion, Greece
*
Author to whom correspondence should be addressed.
Energies 2024, 17(9), 2096; https://doi.org/10.3390/en17092096
Submission received: 28 February 2024 / Revised: 15 April 2024 / Accepted: 19 April 2024 / Published: 27 April 2024
(This article belongs to the Special Issue Applications of High-Efficiency Converters)

Abstract

:
The deeper penetration of renewables in the energy mix is an intense requirement in order to reduce global carbon dioxide emissions. In addition, new technologies are being developed, such as electric mobility and Distributed Generation (DG) in urban areas. However, the unpredictable fluctuations in energy generation from roof-installed PVs and the switching operation of their inverters greatly aggravate the already-present grid quality problems. In this paper, the Smart Boiler (SB) concept for grid quality improvement is presented. Furthermore, its experimental verification is implemented on a flexible testbed that accurately emulates several realistic scenarios for the low voltage distribution grid, under complex operating conditions. The proposed low-cost electronic kit, which contains a converter of fairly simple topology and requires connection to the internet, is used to upgrade conventional domestic boilers to smart devices. The SB automatically regulate the local reactive power flow, helping to stabilize the voltage level and suppress the grid current harmonic content, with both services provided in a matter of seconds. The higher the active power consumed and the denser the SB cluster, the wider the beneficial impact on the affected network area. While this service is provided, excess energy generated by PVs is temporarily stored as heat in the boiler tanks, given the users’ hot water consumption habits. The whole application, as a powerful demand-side management tool, proves beneficial for both the network operator and the end-user, especially when self-consumption is desirable in order to achieve a Nearly Zero Energy Building.

1. Introduction

The global effort to reduce carbon dioxide emissions and the fact that the electric power industry is one of the greatest atmospheric pollutants has led to an increase in the generation of renewable power, with solar and wind power as leading sectors. This trend, based on national laws and international agreements, is politically supported and often subsidized and it is expected to intensify in the upcoming years [1].
An early finding from the study of the Renewable Energy Source (RES) applications has been that the traditional model of centralized generation from distant wind or photovoltaic (PV) farms is not the solution to the rising demand in urban and industrial areas. Since wind turbines are an acceptable option only in rural or isolated areas, PVs in several forms, especially on roofs, have been established as the most appropriate way to achieve DG [2,3,4]. However, the proximity of the generation units to the consumers has elevated from obscurity some actual grid quality problems. Recently, such issues have intensified due to the extreme length of the transmission lines, the generation strategies applied, and consumption patterns observed in a national grid scale.
One main problem is that electricity generation from most RESs is unpredictable, depending on weather conditions [5]. This fact, which in a national grid may be the cause of voltage and frequency fluctuations before automatic closed loop regulating counteraction is taken, may lead to extreme instability in small autonomous systems, with severe voltage dips or overvoltages. In the case of an autonomous or semi-autonomous micro-grid, this problem is magnified by irregular loading—irregular in terms of time (time discrepancy between generation and consumption peaks), space (locally increased demand), and nature (active and reactive, inductive or capacitive). A typical generation–consumption time mismatch example is related to the charging of electric vehicles, which normally takes place during night hours [6], a fact that, in the near future, will eventually lead to the termination of the low electricity night tariffs (where they exist). In another case, excess energy produced by RESs may have to be exported or rejected to dump loads or even prevented from being generated at all (shut-down of generation units) to avoid a voltage or frequency disorder.
The main strategies, so far, to overcome such problems are based on supply-side management (SSM), where active/reactive power generation fits the consumption profile and demand-side management (DSM), where, for example, lower electricity rates during low consumption hours squeeze the consumption peaks and shift consumption to hours with excess generation [7,8]. Another approach, currently under study and experimentally applied locally around the world, is energy storage in several forms, such as pump storage, compressed air, battery stacks (e.g., at RES generation sites), exploitation of the electric vehicle batteries as power banks, etc. However, these strategies are associated with high cost, technical difficulties, low efficiency, high environmental impact, low public acceptance, etc.; hence, the conception of other methods to achieve long- or short-term energy storage is still an open field.
Another major problem, currently magnified under DG conditions, is the harmonic distortion of the distribution grid voltage due to the distorted current flowing in the grid lines and distribution transformers. For decades, uneven load sharing between the three phases of the distribution grid was partially mitigated with the use of a Z connection at the low voltage side of the distribution transformers, whereas current and voltage distortion at the medium and high voltage networks were also partially dampened with the use of star/delta connections. However, in the past few decades the rapid increase in non-linear loads, especially those that incorporate power electronic converters, has led to a new status in the electricity networks: the distortion of the voltage provided to the consumers seems to be the rule rather than the exception. The use of inverters for the connection of rooftop PVs to the grid injects high order harmonics and, depending on the quality of the inverter, lower order harmonics may also be produced. However, the main concern in the present work is that, with DG in place, the path from generation to consumption does not always include buses that could be considered as “infinite”. This makes the low voltage distribution grid similar to an autonomous/semi-autonomous micro-grid and, therefore, more susceptible to irregularities and harmonic distortion effects due to the several non-linear loads.
A primary analysis of the concept of a SB is given in [9] along with the origin of the background idea [10,11] (use of controllable loads to provide grid quality services), plus some basic hardware considerations, as emerged at the initial stage of the work. The proof of concept in [9] was based on simulations, providing more than just encouraging results. In this paper, the SB concept for the provision of quality services to the grid and for short-term energy storage during excess generation is presented in detail. Both communication and power system layers are fully described. A widely adopted Internet of Things (IoT) protocol, Message Queuing Telemetry Transport (MQTT), has been chosen for implementation of the communication layer of the SB application. Another contribution of this work is that it proves that a typical internet infrastructure and an MQTT server of average processing power can fully cover the needs of the widespread operation of SBs, even if they are counted in the order of tens of thousands. This not only allows end-users to remotely control their SBs from anywhere around the world and optimize their operation (e.g., according to fluctuating electricity prices) but also enables the Distribution System Operator (DSO) to coordinate en masse operation of SBs, so as to provide grid quality services. The hardware involved in the device, seen as both a power converter and a telecommunication node, are also detailed, so that a full picture depicting the SBs as members of a powerful platform is provided.
The description of hardware, software, and communication aspects is followed by the detailed presentation of a thorough experimental investigation to verify the beneficial effect of the proposed system on the quality of the mains supply voltage. The outcome of this investigation not only validates but also outruns the former simulation results thanks to several improvements embedded in the latest version of the prototype kit used for the tests. A crucial element in this process has been the testbed created for the purposes of the present work, which offers great flexibility, allowing numerous and versatile scenarios to be examined.
The rest of the paper is structured as follows:
In Section 2, Smart Boiler Concept, there is a brief description of the SB concept for the provision of quality services to the grid and for short-term energy storage. In Section 3, Smart Boiler Hardware and Control, there is a brief description of the outline of the hardware components given along with the fundamentals of the kit’s control logic. Section 4, Telecommunication Aspects of the Widespread Application of Smart Boilers, gives a description of the communication network between the SB, the grid parameter metering units, and the system administrator along with a well-founded discussion about the suitability of the selected communication protocol for the specific application. Section 5, Testbed for the Experimental Investigation, lists the several interoperable hardware components that implement the testbed built for the proof of concept and for further experimental investigation of the SB application, which occurred as a presumable evolution following previous simulation results. The content of Section 6, Experimental Results, includes some indicative graphs and oscillograms, which support the success of the proposed approach for the provision of grid quality services with SBs but also give directions for further improvements to make the system faster and more effective. Section 7 concludes the paper and highlights the contribution of the presented work as a potential solution to the problem of low grid quality and excess energy storage.

2. Smart Boiler Concept

The concept of the present work is based on the idea to create a low-cost upgrade for electric water boilers, giving them the ability to provide services to both the DSO and the end-user. Electric boilers are non-critical loads of significant power, but they also provide thermal storage of high capacity. Because of their inexpensive and durable construction, developed over several decades, they can be found in most households of developed countries. This makes them an excellent device for DSM and RES self-consumption. However, SBs are more than upgraded electric boilers. They are a platform that accommodates such boilers in great numbers, extending in both communication and physical layers in order to allow the DSO to coordinate their operation. To the extent that appropriate sensors are installed at the distribution grid, the DSO can coordinate the operation of SBs throughout, in order to actively change active and reactive power flows, a tool which can improve operation much more efficiently than simple DSM. At the same time, when the SBs are active, they can provide additional services to the end-users, such as to alleviate harmonic distortion from other loads, reduce energy bills by exploiting cheaper tariffs during the day, or self-consume excess PV energy generation.
Figure 1 depicts the basic concept of SBs as a platform. The upper part is the communication layer. It provides the means of interaction between sensing equipment on the grid and the DSO, participating SBs and the DSO, as well as the SBs and the end-users. The decisions made by the DSO for the operation of the SBs, considering the constraints or preferences set by the end-user have an impact on the physical layer below. The physical layer contains the actual distribution grid, sensing equipment that provides a picture of its status to the DSO, SBs, and other loads. An optimization algorithm that will assist the DSO in the coordination of the “cluster” of available SBs is currently under research by the authors.
The suggested upgrade is easy to install and requires only minimum additional hardware. The SBs may perform instant and precise active and reactive power control, but their most significant feature is that they can mitigate line current harmonics. Active and reactive power control is achieved with the appropriate amplitude and phase regulation of a modulation reference waveform (rectified sinewave) in the control scheme of the adopted power electronics converter. This type of control is easily customizable in order to accommodate a variety of power quality targets, depending on the required level of services and available grid monitoring equipment. Moreover, the line current harmonic compensation is based on the injection of mirror harmonics created at the previously mentioned modulation stage of the converter. The success of the method proves to be independent of the current harmonic distortion cause: it is equally successful in mitigating harmonics caused by the power electronic converter of the SB itself or by other sources of current harmonics.
As will be demonstrated, the achieved grid services are clearly beyond the ON/OFF operation of simple electric boilers, currently implemented by existing or suggested DSM strategies in order to shift blocks of non-critical loads away from peak hours [12]. Similarly, the quality of the provided services is higher than the current harmonic compensation presented in [11], where operation of the converter is limited to just active power regulation in a narrow window of acceptable duty cycle values. The experimental outcome clearly proves that SBs, with continuous control of their operation in the full range of possible active/reactive power values, can assist voltage regulation at terminal buses, compensate reactive power (power factor correction), and suppress harmonic currents at the low-voltage (LV) electricity lines.
Electric boilers are devices already installed in the majority of buildings. With some compensation offered to the end-users, as an incentive to upgrade their boilers into smart devices; adoption of the upgrade by a wide portion of electricity customers may become the key element of a demand-side solution to reduced grid voltage quality, especially on a local or micro-grid scale. Solar heaters also contain resistors connected to the mains—an auxiliary power supply in the case of insufficient irradiation. Any household or business building (e.g., a hotel) with an electric boiler or solar heater may be converted to a controllable endpoint for the support of a smart-grid’s voltage quality services. The bigger the water tank and the higher the installed electric power, the longer and more effective the support to the grid. Therefore, the concept of SBs could be extended to higher power systems with even greater thermal inertia, e.g., in order to provide part of the energy needed for central heating, or to other electrical energy consuming applications without energy storage at all (e.g., ovens). However, the purpose of the present work is limited to identifying the operational capabilities of the suggested device, in terms of application on typical domestic boilers. Other domestic or industrial electric applications should also be investigated in the future, in order to maximize the prospective grid quality improvement.
Energy storage in the form of heat is generally considered to have a high self-discharge ratio, when compared to other forms of energy storage such as batteries. However, in terms of economics, heat storage in boilers is considered as an efficient alternative to batteries, which need to be replaced every few years and still have a high purchase and recycling cost. Boilers are domestic devices already present in most households. They may absorb electrical energy coming at low price from the grid or PV overproduction, which would otherwise be rejected or would even be prevented from being generated at all. Of course, the amount of PV energy that can be effectively stored in the SBs depends on their number and tank water temperature at the time of self-consumption. If the user/owner of the SB properly adjusts the device availability schedule, hot water will be stored for just a few hours prior to its consumption. Given the good thermal insulation of the boiler tank (see Section 5.10 further below) an approximate 10% heat loss is expected to occur in more than a few hours. With a converter efficiency of the order of 95%, it may be said that the efficiency of excess energy storage is in the range of 80% to 85%. This approximate result should be considered in contrast to the slightly higher efficiency of the much more expensive battery stacks (with their charger and inverter losses included, it may be 90%), which will have to be replaced every few years. In another comparison, large-scale energy utilization from SB clusters for short-term storage seems much more efficient compared to pumped storage schemes that have a round-trip average efficiency of 70% and a huge construction cost for tax payers.

3. Smart Boiler Hardware and Control

3.1. Hardware of the Smart Boiler Kit

The converter suggested as the upgrade kit for conventional boilers to turn into smart devices offering quality services to the grid is a full bridge rectifier, followed by a single switching element. Preferably, it is installed a short distance from the already-existent boiler (right next to it if possible). The option to install the kit far from the boiler leads to unfavorable EMI (Electromagnetic Interference) emission due to the high frequency (20 kHz) current train between the converter and the load resistor and is, therefore, not recommended. Further to that, passive filtering at the output of the converter in order to overcome this problem not only leads to a small, yet non-acceptable, drop in efficiency but also to an increase in construction cost; therefore, it is avoided. On the other hand, with the converter installed next to the boiler, a high-frequency distorted current path is limited in the resistor inside the boiler tank, which forms a Faraday cage that prevents any EMI diffusion to neighboring devices/circuits.
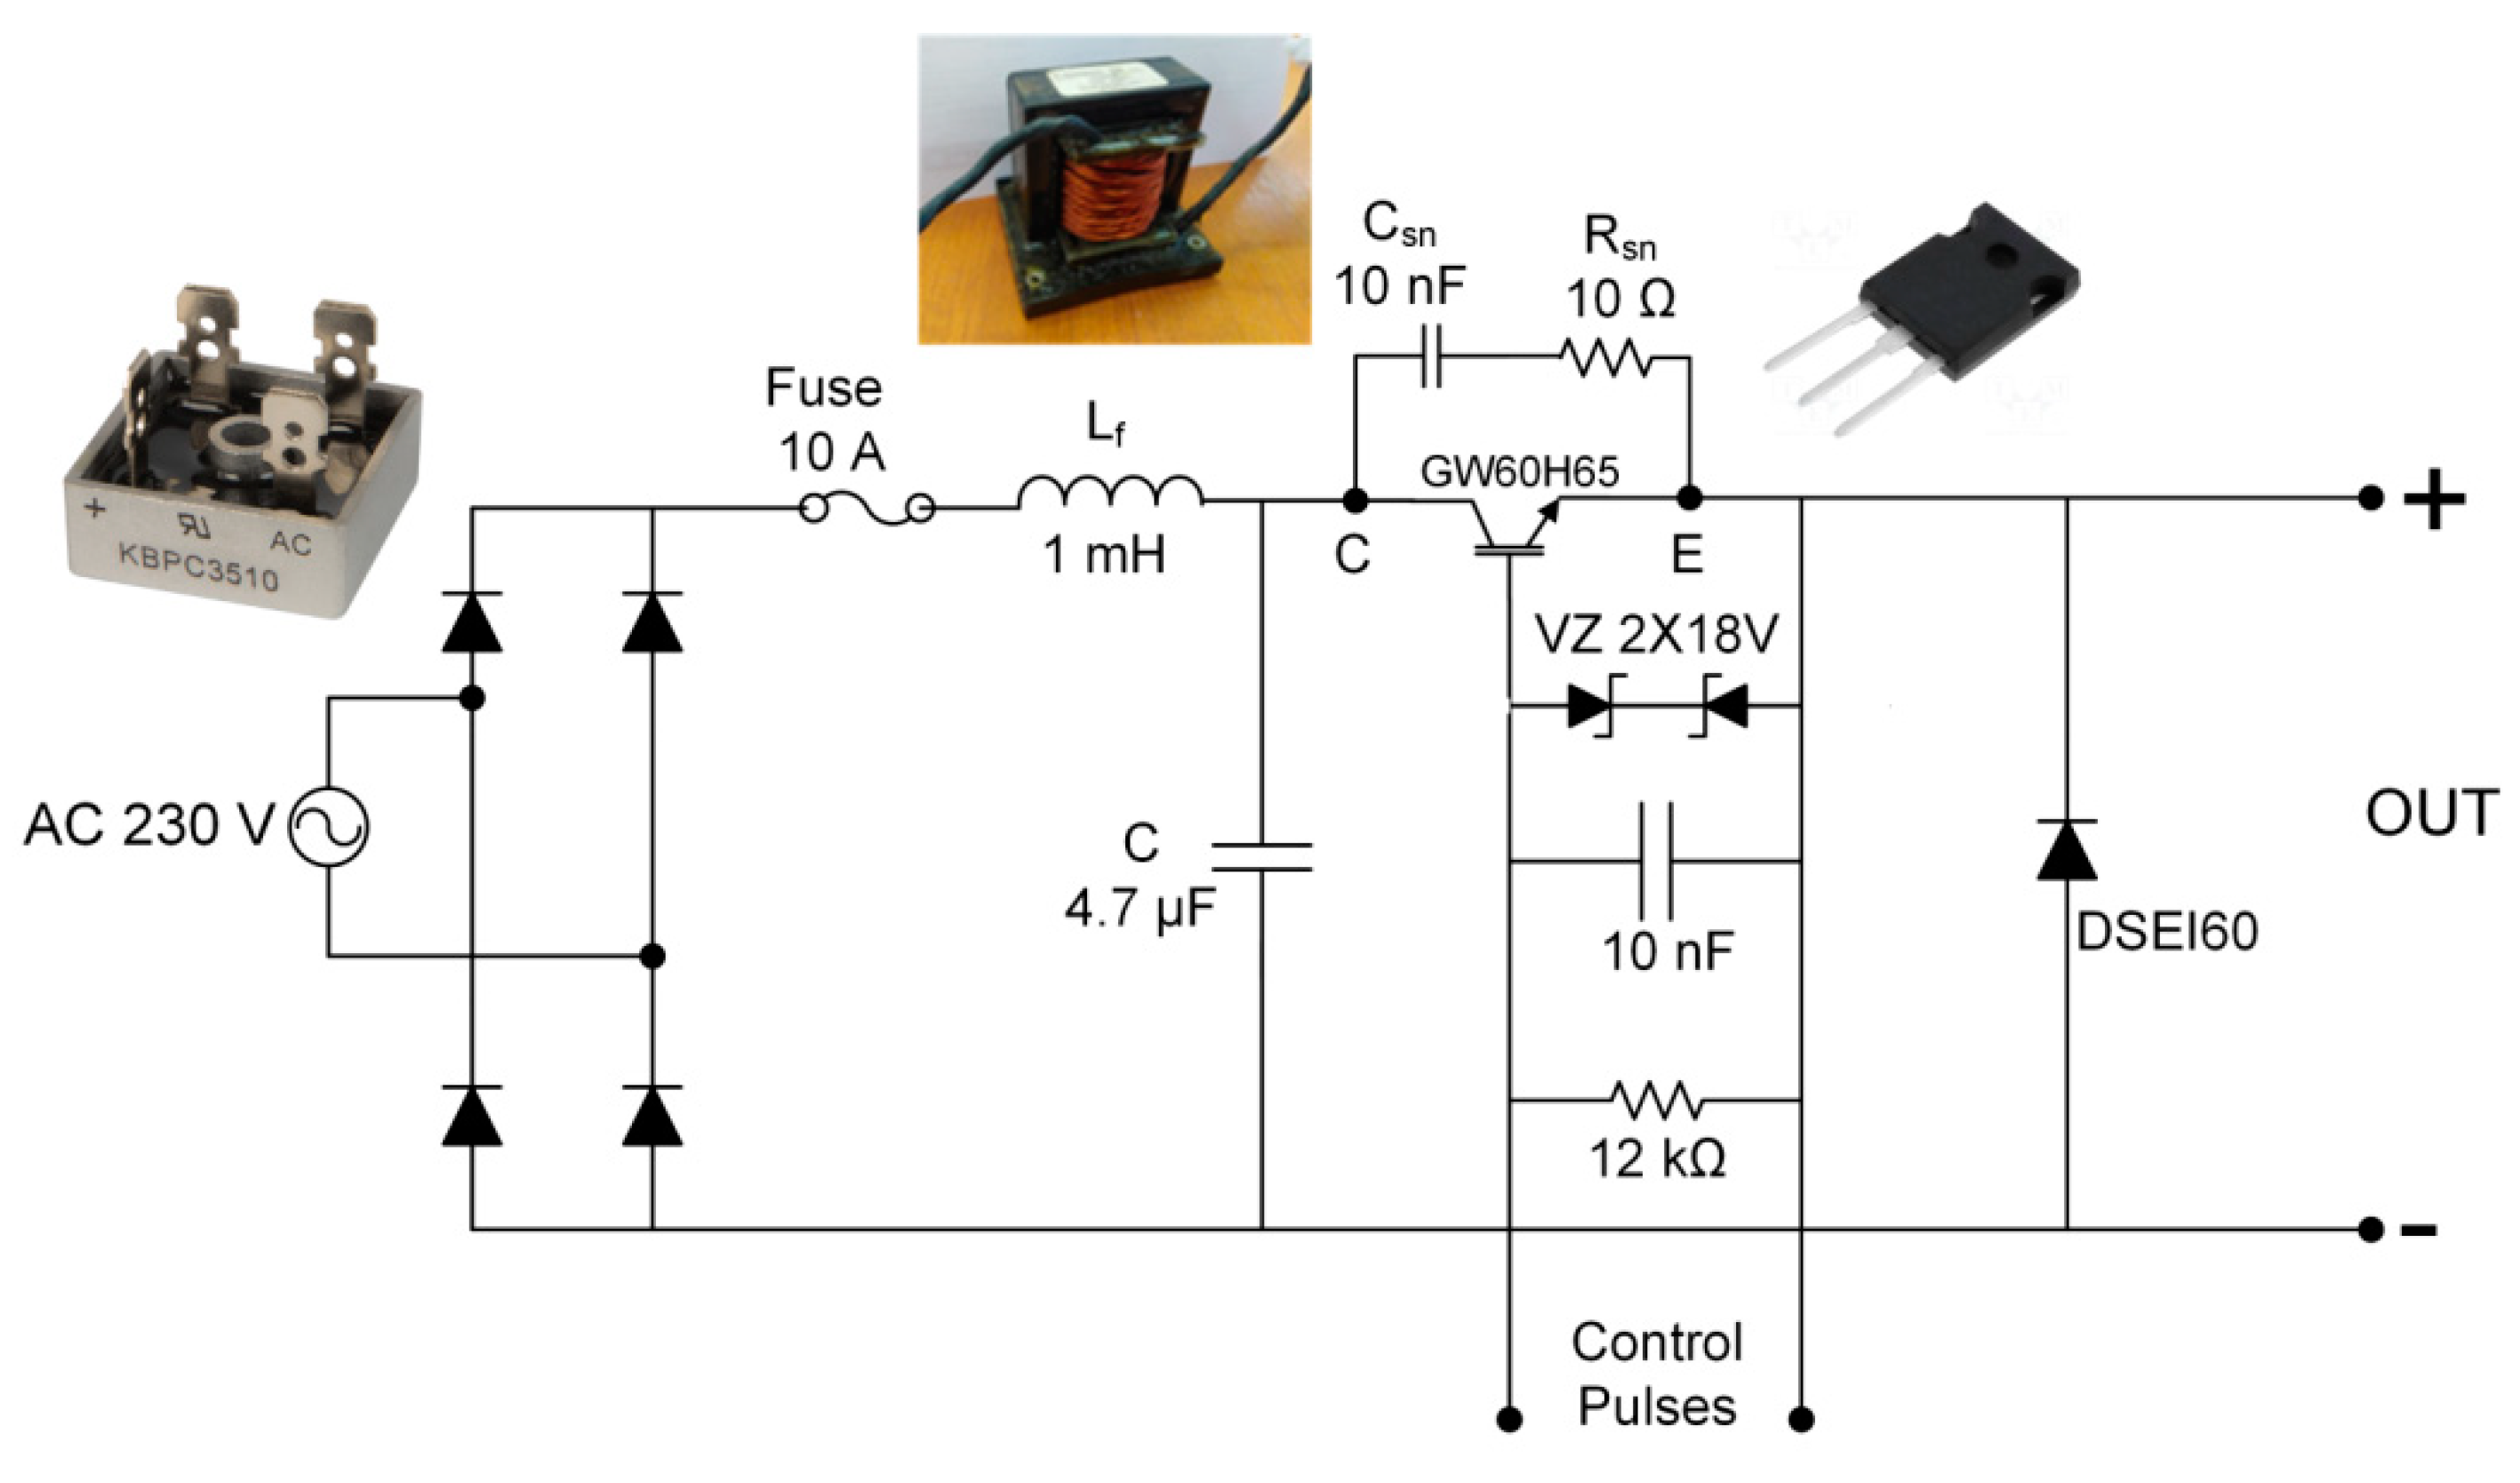
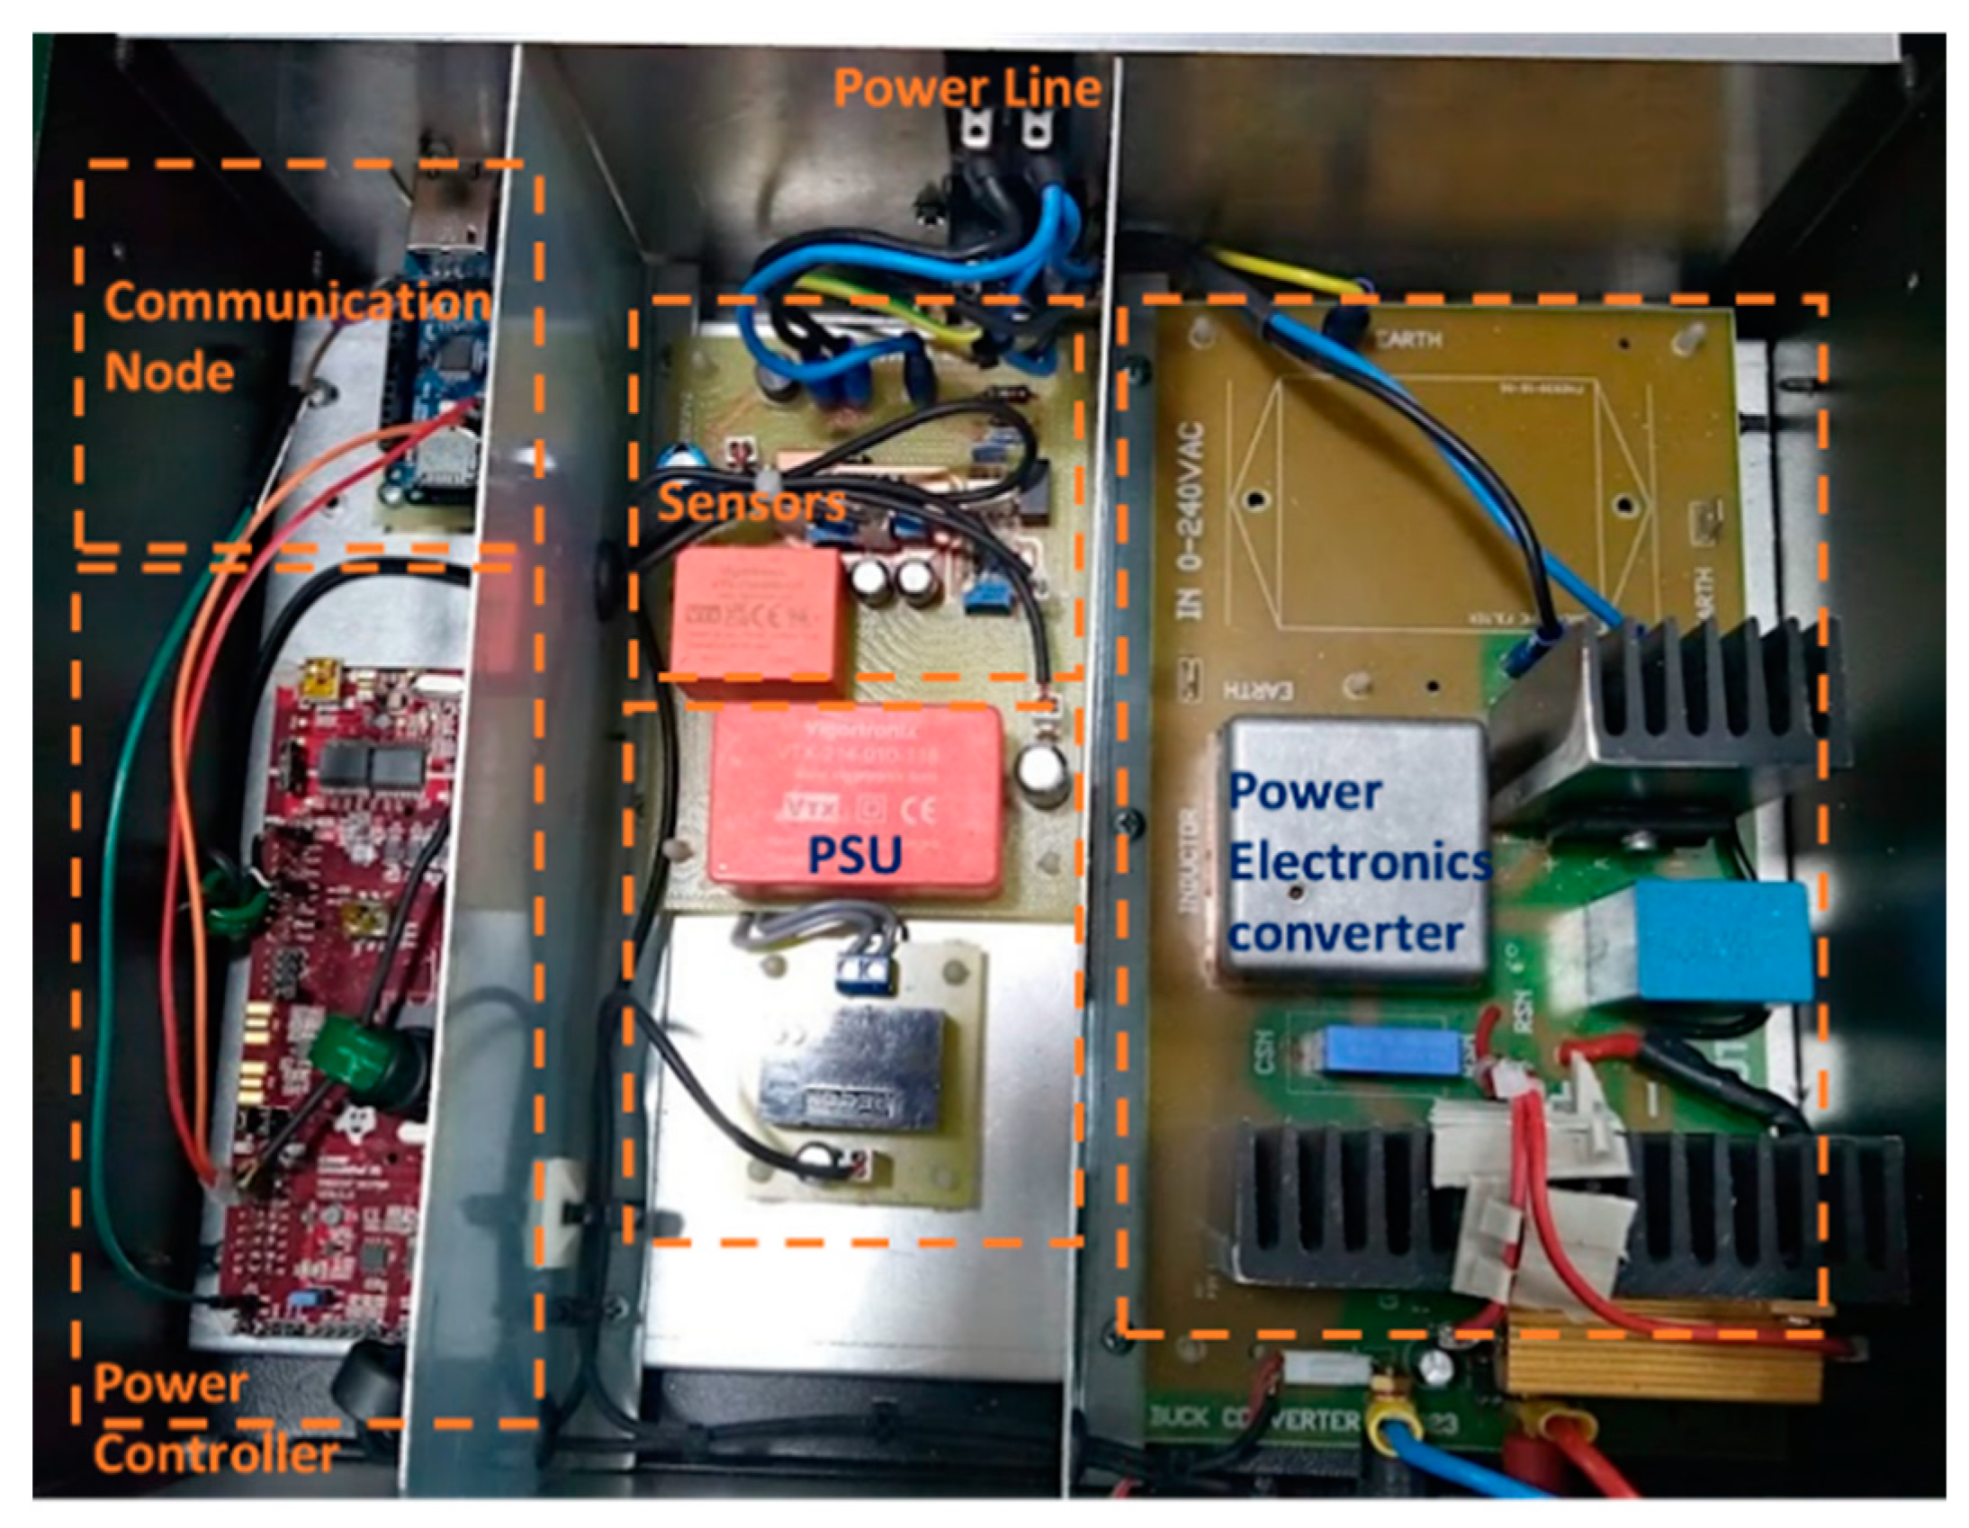
A simplified schematic of the power circuit of the converter is presented in Figure 2, whereas the prototype used in the tests that are presented further below is illustrated in the photo of Figure 3.
The converter consists of a bridge diode rectifier followed by an IGBT switch (Insulated Gate Bipolar Transistor). The switch chops the rectified sine wave according to an appropriate control logic, which makes the duty cycle of the switch the critical variable quantity that determines the form of the input current (see next subsection), whereas the switching frequency remains constant at 20 kHz.
Between the bridge and the IGBT there is a standard LC low-pass power filter, which allows the flow of current harmonics up to 2.3 kHz. This filter will allow the injection to the grid of harmonics up to the 50th order, although the conducted tests did not include harmonics of an order higher than 13, due to the modulation limitations imposed in practice by the 20 kHz carrier signal. Current components towards the grid at the IGBT switching frequency are blocked. Moreover, this filter seemingly makes the use of a power line input filter unnecessary, which is typical in grid-connected power electronic converters. The early prototypes had such an input filter; however, this accessory has been omitted in later versions of the converter. For the rectifier to be free of the high frequency switching currents and the consequent switching losses (Figure 4), the filter is placed on the DC side of the rectifier, rather than on the AC input. This scheme improves the overall efficiency by roughly 0.4%, letting overall efficiency surpass 95% at full power operation, and curtails the cost of the kit, since it makes diodes with special switching specifications (e.g., fast recovery) unnecessary. Moreover, the absence of high-frequency switching operation and the reduction in the encountered maximum current values greatly reduce the possibility of semiconductor failure, thus improving the reliability and endurance of the device. However, this configuration leaves the bridge unprotected in the case of an incoming voltage impulse due to a nearby lightning strike (some of the tests that will be conducted for the IEC certification of the device emulate such events). Hence, the necessity of the power line input filter is still under investigation, with an optional addition of a surge protector.
It is necessary to mention at this point that the primary purpose of the present work has been the development and construction of the SB kit and the proof of concept through experimental observations and test measurements, whereas corresponding simulation results have preceded [9]. Secondary targets have been the determination of the kit’s efficiency and study of several prototypes developed in order to build a final prototype in the near future, in conformity with international safety regulations (safe to the users and to the environment) and market needs (e.g., small volume and acceptable efficiency). With the input power measured using a power analyzer, the efficiency, at several power levels, has been determined via three methods with nearly matching results: (a) spice simulations; (b) heat losses estimation, based on surface temperature measurements of the converter’s power consuming parts, and (c) measurement using a power analyzer of the power delivered to the load.
A freewheeling diode is connected to the output terminals to cancel any surge voltages on the IGBT switch from parasitic inductance inherent to the load. Despite that, a passive snubber had to be connected across the collector and emitter terminals of the IGBT (marked as C and E, respectively, in Figure 2) in order to suppress the voltage overshoot and oscillations otherwise observed. The power loss on the snubber is not constant and depends on the loading of the device, yet it remains lower than 10W. Nevertheless, this happens in favor of reducing the IGBT switching losses and mitigating EMI issues that affect the control circuit and eventually the IGBT switching operation, thus forming a positive feedback loop. Other typical methods to minimize EMI interaction between the power and control circuits have also been applied: proper screening of sensitive signal wiring and power cords, capacitive filtering on the gate circuit of the IGBT (Figure 2), etc.
As mentioned above, the device built is a test prototype for the proof of concept. However, the ultimate target of the present project is to raise the SB kit to such a level of maturity that will allow the realization of a commercial product. Capstone of the latter aspect is the certification of the device, so as to comply with all the applicable standards and regulations. For this, the latest prototype version is currently under the certification process at the laboratories of the National Technical University of Athens, Greece, which is certified to conduct such tests and issue the relevant certificates. The tests and analyses carried out there will verify compliance of the kit with the following standards:
  • IEC 62477-1, which refers to safety requirements for power electronic converter systems and equipment [13].
  • IEC 61000-6 and specifically the parts referring to Electromagnetic Compatibility (EMC), which sets the required immunity standards for industrial environment and emission standards for equipment in residential environments, respectively [14,15].
  • IEC 63000, which provides a standard assessment process for electrical and electronic products with respect to the restriction of hazardous substances [16].
The results of the above process and the outcome recommendations will set the design outlines for the final, commercial device, which, of course, will go through the certification process again from the start.
On the other hand, the SB kit in no way comes in contact with the water supply network piping; however, in addition to the metal case of the device (that will protect it from dust, rain (if installed outdoor), moisture, insects, etc.), the kit should be positioned away from the water path in case of a possible leakage or a relief valve activation.
The hardware of the kit also includes other peripheral boards, used for sensors, control, and communication, which are described in Section 4, Telecommunication Aspects of the Widespread Application of Smart Boilers.
The SB upgrade kit may be attached to any electric or solar/electric heater. Hence, the reliability and durability of the SB as a complete system is a twofold issue depending on the features of two independent entities. On one hand is the boiler, with a typical lifespan of 20–30 years and typical failures stemming from corrosion. Boiler maintenance includes anode replacement that delays corrosion and tank cleaning from sediment, typically once every 4–6 years. On the other hand is the suggested SB kit, with its high power part (power electronics converter) and its low power part (microcontroller and communication hub, WiFi antenna, metering units, etc.). The converter has a simple Buck topology with just one switching element, a topology that has been tested and well established for decades. Redundant design for the IGBT switch and for the bridge rectifier, along with their heat sinks, further ensures long-term invariable performance. In a similar way, the metering units and the microcontroller circuitry are not expected to fail, as they are optically isolated from the power part. Other issues to be encountered are communication disturbance issues but, as described further below in Section 4, the communication protocol adopted is suitable for most typical networks, which are prone to such disturbances. Therefore, the SB device is designed to be a reliable and durable technical solution for short-term energy storage, with zero maintenance requirements for its electronic part and with an expected lifespan of several years. Strong support of this argument has been the continuous operation of the initial prototypes developed by the research team without any failure for years, yet actual statistics will be available only when industrial-scale production starts.

3.2. Control Scheme

The current harmonics mitigation control of the converter aims to create an input current such that the current waveform at a reference point of the grid, hereafter termed as Point of Common Coupling (PCC), becomes as close to a pure sine wave as possible. It should be noted at this point that a distorted current is the cause of other concomitant problems, namely distorted voltage due to the impedance of the lines and the distribution transformer (if any), excessive losses on the lines and the distribution transformer, and EMI emission.
On the other hand, the voltage regulation control aims to give to the input current of the converter such a phase shift that the converter will inject or absorb the proper amount of reactive power, so that the voltage at the PCC remains as close to its nominal value as possible (e.g., 230 V).
Further than any control strategy details and the active power availability margin for the converter, the success of the control (zero steady-state error if possible) greatly depends on other factors. Such factors are the distance of the converter from the PCC and the consequent impedance along this path, the impedance of the line from the distribution transformer to the PCC, and other loads connected near the PCC and their characteristics (induced current distortion, active/reactive power, and impedance between them and the PCC). Of course, the final result also depends on the number of other SBs near the PCC and the level of their contribution to the attempted quality services. Regarding the system’s response time, this is of the order of a few seconds for the active/reactive power/voltage level control, whereas for the harmonics control it remains within the range of some tens of seconds. This delay of the harmonics mitigation process is due to the time-consuming FFT (Fast Fourier Transform) calculations that have to be carried out by the metering equipment at the PCC and the transmission of the required information via the internet to the SB; yet, it is still acceptable for practical applications.
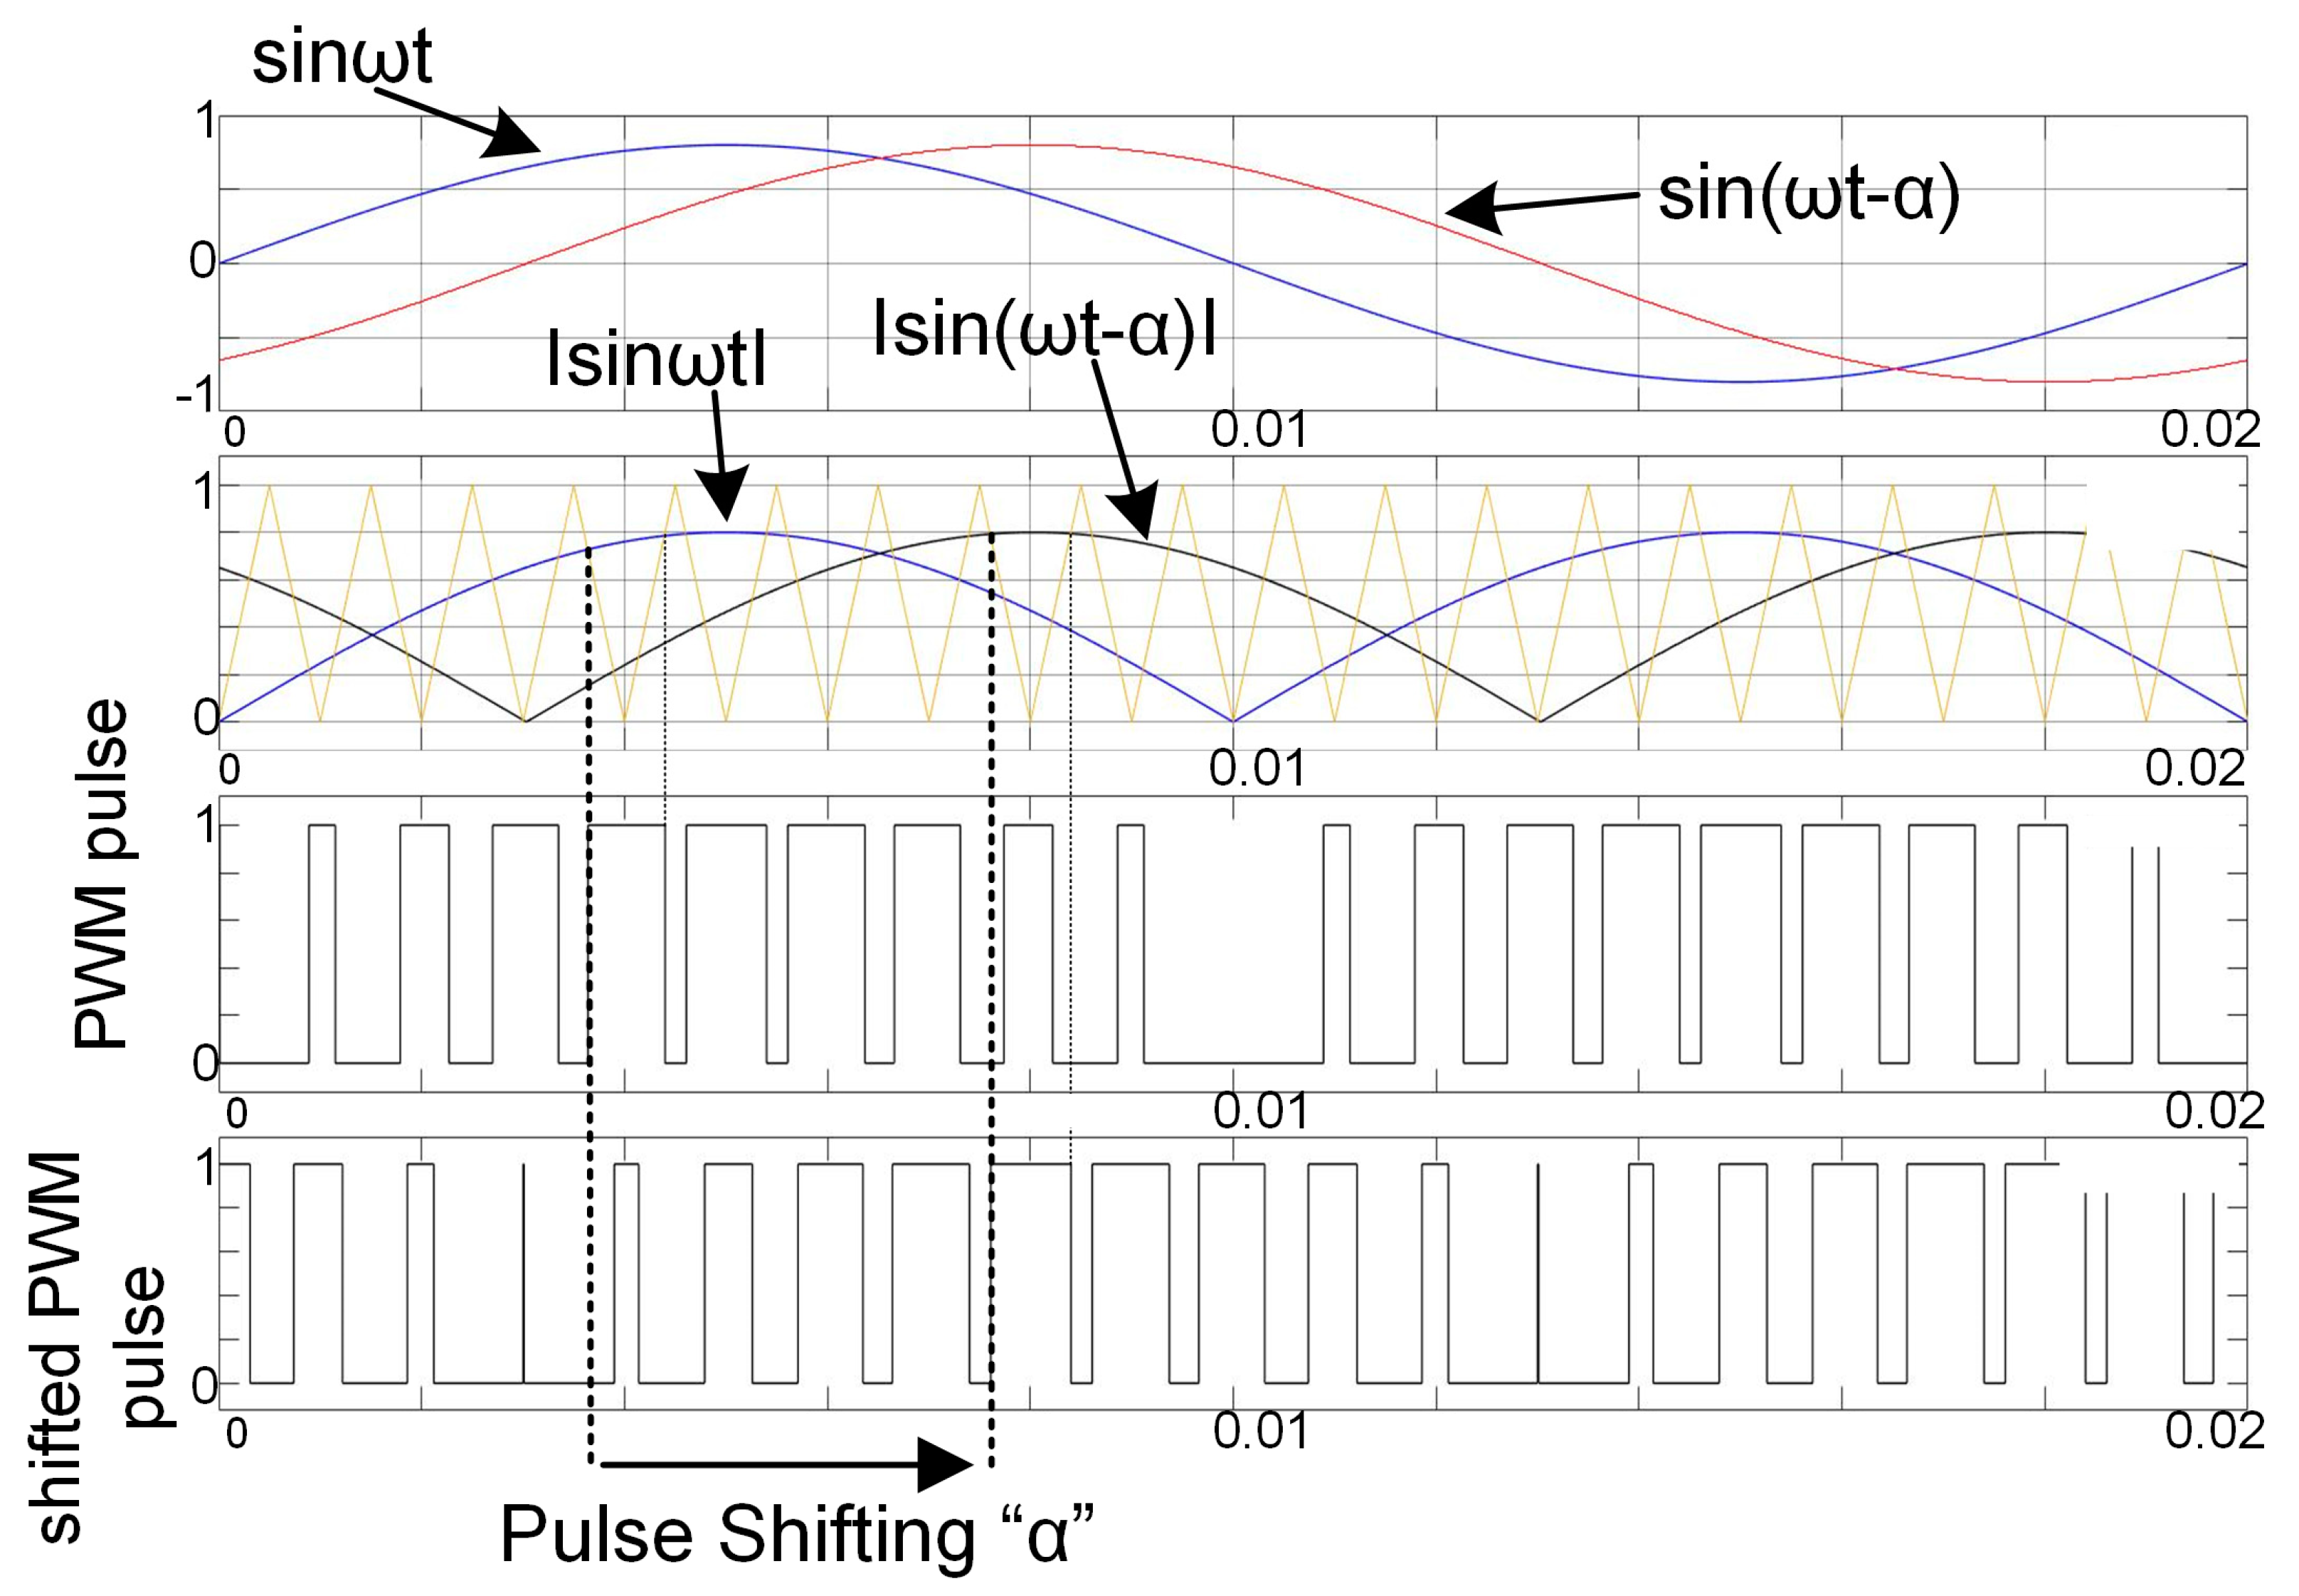
In Figure 5, there is a comprehensive illustration of the pulse feeding scheme for the control of active/reactive power. The pulse train generation follows the well-known process applied in converters operating under the SPWM (Sinusoidal Pulse Width Modulation) control logic. With the voltage waveform at the input of the converter being known (blue curve), a sine wave with the desirable phase shift (a [rad]) is created. The rectified version of this sine wave is used as the reference waveform that is compared with a high-frequency triangular wave (although, it could very well be a sawtooth) in order to create the width modulated control pulses fed to the IGBT.
The converter can inject/absorb a certain maximum amount of reactive power depending on its active absorbed power. This dependence is illustrated in Figure 6, where the capability curve of the converter is presented. It becomes clear from this graph that the higher the active power on the SB, the greater the capability of the system to regulate the voltage at the PCC (either to decrease or increase it).
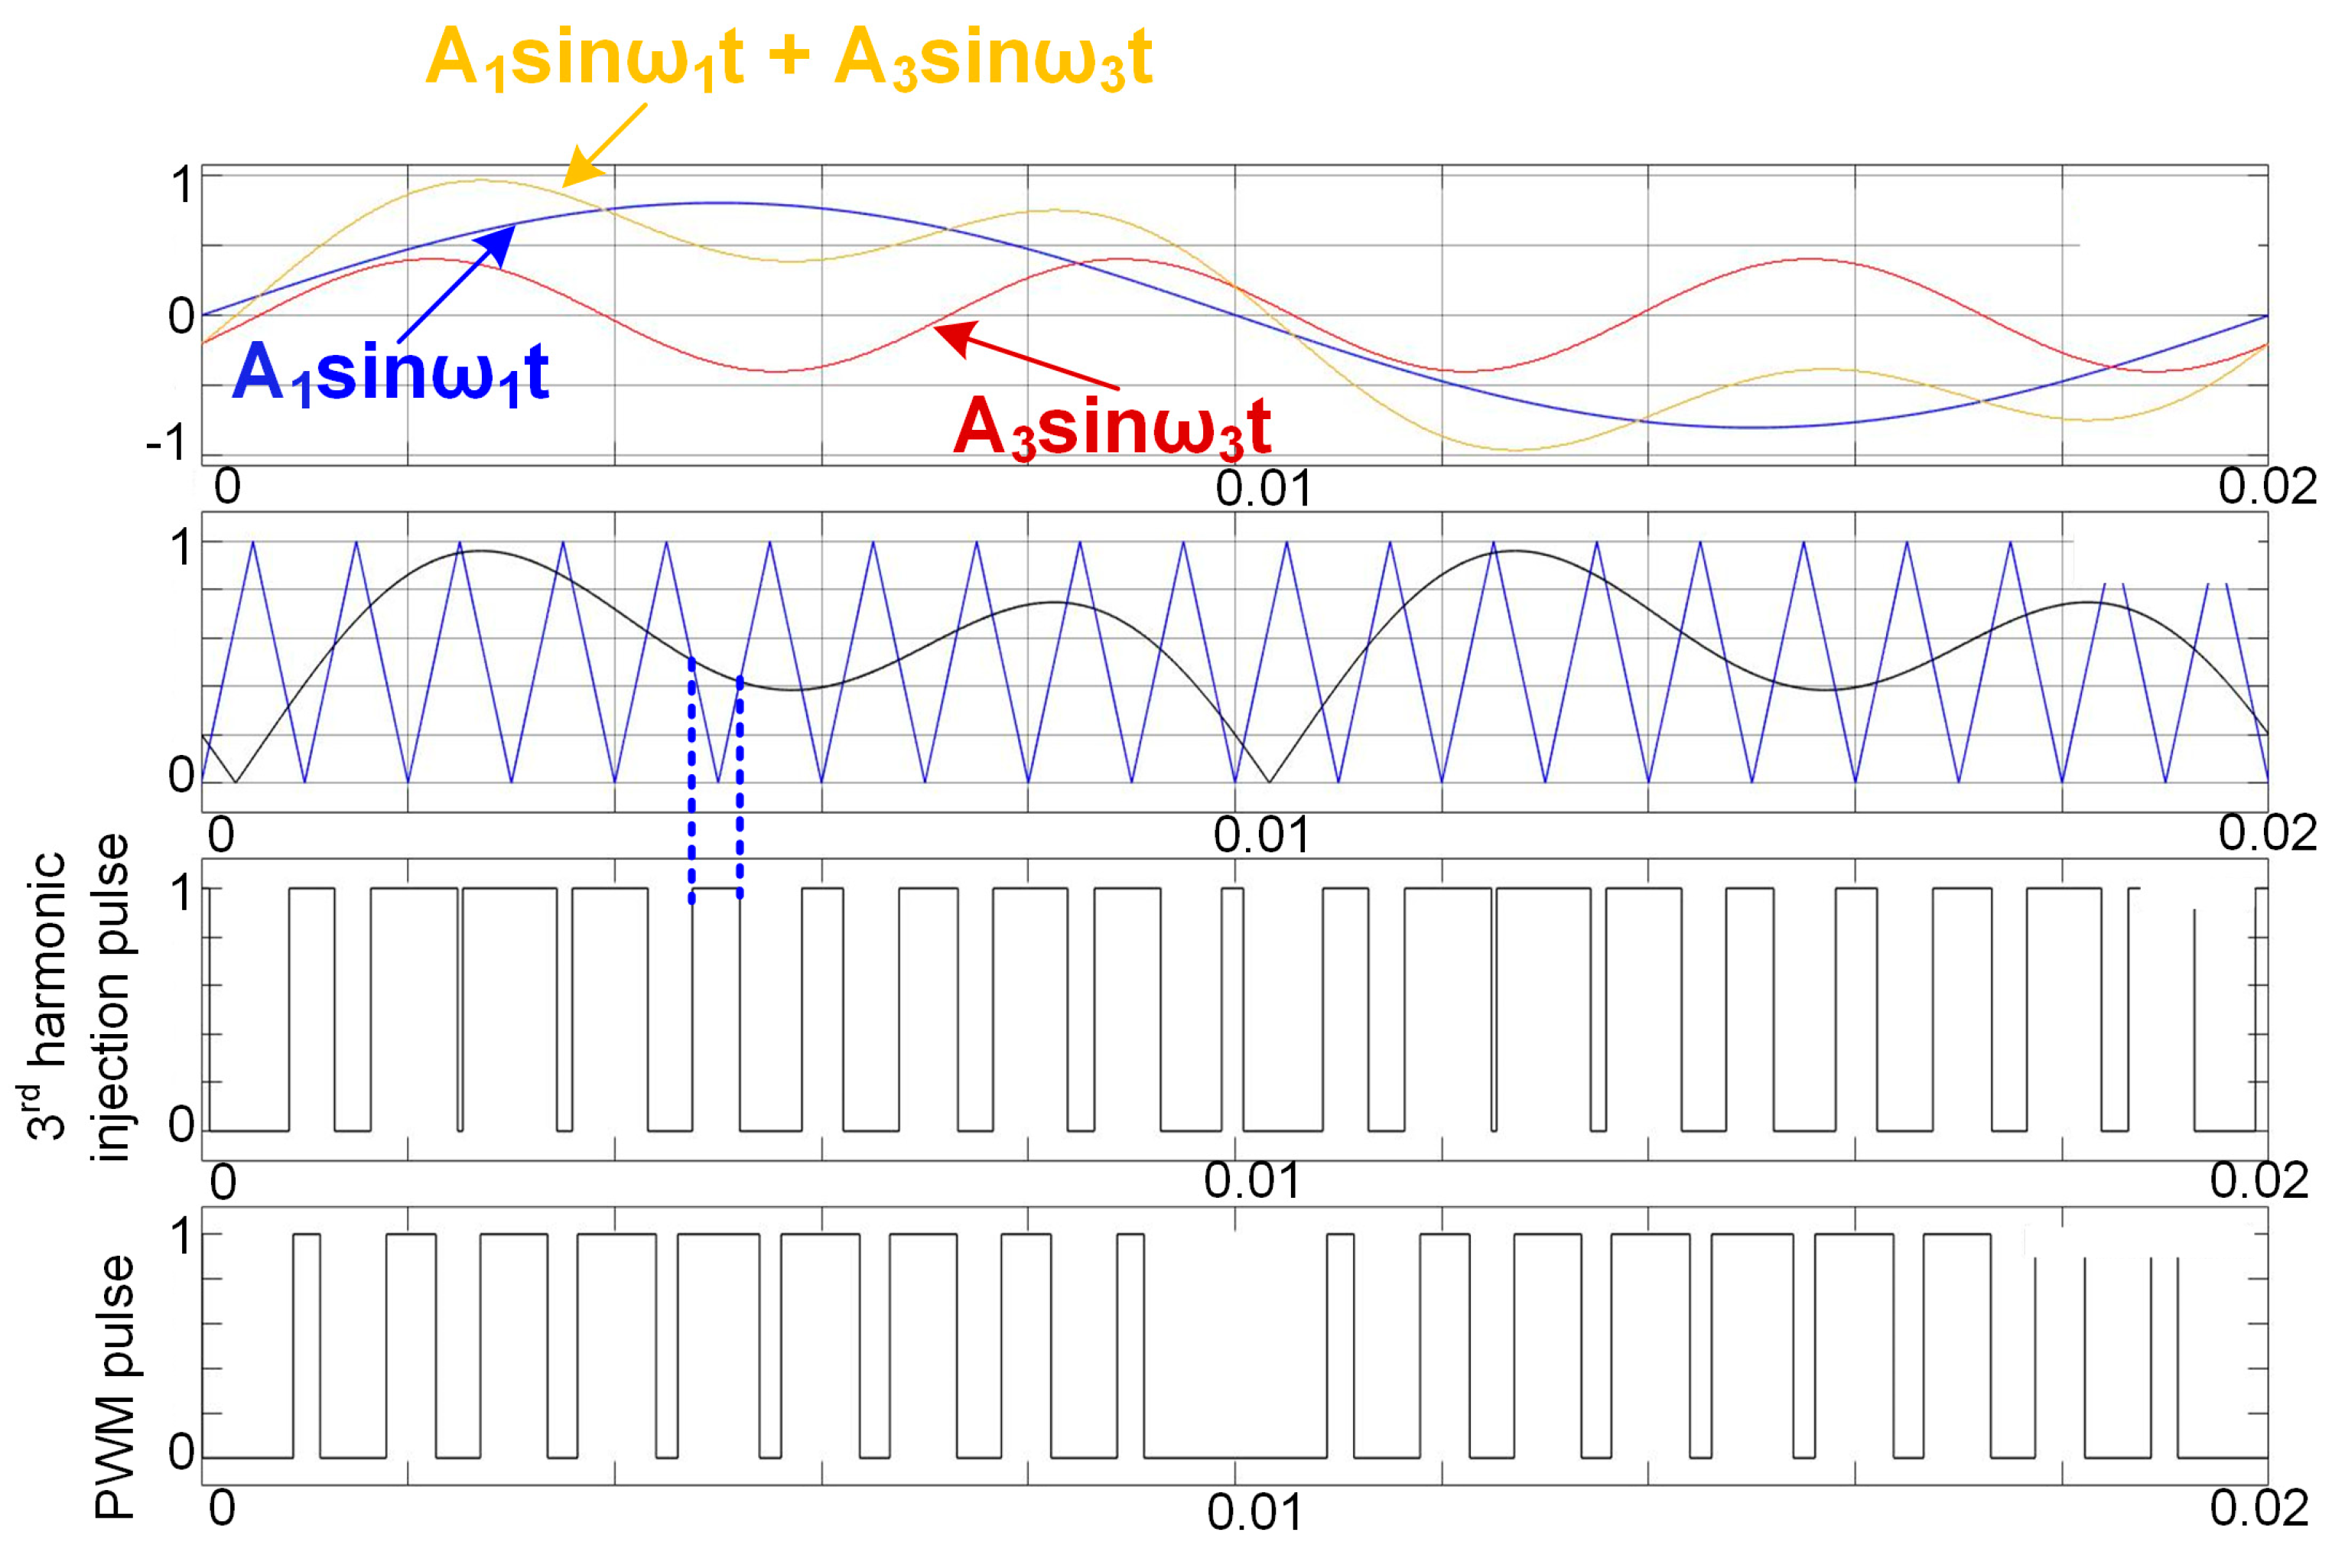
Similar to reactive power regulation, the converter can inject current harmonics after a request from the administrative center that monitors the grid condition at the PCC. The administrative center is expected to be under the authority of the DSO, as it will be considered hereafter. These converter-created harmonics are intended to be mirrors of the already-present harmonics that are to be canceled. Odd harmonics are mainly encountered in the grid, whereas even harmonics are generally negligible. The principle for the generation of mirror harmonics is based on the replacement of the reference rectified sine wave mentioned above with a properly distorted waveform, with the rest being the same as before (i.e., PWM pulse train generation) (Figure 7). Therefore, this mitigation technique is equally efficient against low-order odd or even harmonics.
In both control modes (active/reactive power control or current harmonics control) a Proportional–Integral (PI) control logic is applied with satisfactory results, since set point values are achieved in a matter of seconds, whereas variations on both sides of the SB (distribution grid condition and tank water temperature) typically experience time constants of the order of several minutes. However, the research team recently investigated the possible advantages of other, more sophisticated algorithms, namely adaptive or fuzzy control, the perturb-and-observe method (P&O), etc. However, it has to be clarified that, independent of the control algorithm implemented, its only target is the achievement of the requested set points from the DSO, who has the overall view of power flows via the respective sensors throughout the grid. For example, regarding the voltage level at the PCC, the SB is expected just to respond to the active or reactive power requests from the DSO (Pref or Qref) that the DSO estimates that will bring the voltage level closer to nominal. On the other hand, excess local energy generation, although possibly related to some voltage rise across the grid, is an issue separately treated by the DSO, with active power requests towards the available SBs. This is performed regardless of the fact that this active power may also act, at the same time, as the necessary carrier for reactive power regulation and mirror harmonics injection.

4. Telecommunication Aspects of the Widespread Application of Smart Boilers

An SB kit is not just a power electronics converter. The converter itself is surrounded by several local and remote units, which perform a variety of complicated tasks. All these units intercommunicate with each other, either directly or via intermediate nodes, with data exchange lines based on wireline or wireless transmission. All these units and intermediate data transmission paths form an IoT entity, which will be promptly described in this section.
Figure 8 contains a concise flow chart of the IoT components that constitute a typical SB application setup. MQTT plays a central role in this IoT setup; it is a lightweight publish/subscribe messaging protocol, that works on top of the TCP/IP protocol, for use in cases where clients need a small code footprint and are connected to unreliable networks or networks with limited bandwidth resources. This setup not only allows central coordination of the SB units for power grid services but also makes data logging and end-user automation simple and enables low-cost operations if open-source smart home platforms, such as Home Assistant, are used.
Currently, IoT protocols are at the heart of Machine-to-Machine (M2M) communication [17]. There are many application areas where connected devices offer value-added functionalities: smart power grids, smart cities, smart homes, smart health, smart agriculture, industrial plants, etc. [18,19,20]. One widely adopted IoT protocol is the MQTT. It has been chosen for the SB application as it stands out for its efficiency in consuming minimal resources and operates on a publish–subscribe communication model. It has emerged as one of the best IoT protocols due to its unique features and capabilities tailored to the specific needs of IoT systems. Some of the key reasons that MQTT fits the SB application include its lightweight, reliability, secure communication, bi-directionality, continuous–stateful sessions and large-scale IoT device support [17]. The aim of this section is to prove that a typical internet infrastructure and an MQTT server of average processing power can fully cover the needs of the SB application. First, typical MQTT services are presented as benchmarks. Then, the telecommunication burden for a single SB kit is presented and compared to the aforementioned MQTT services. The comparison shows that the current equipment can easily handle a telecommunication burden multiple times higher than the one imposed by a widespread operation of SBs, even if they are counted in the order of tens of thousands.
A recent MQTT broker comparison review [21] concluded that a public MQTT broker (such as EMQX) handles more than 28,000 message/s, while another MQTT broker (HiveMQ in Landshut, Germany) showed no message loss during tests. Their testbed was a StarlingXFootnote6 all-in-one duplex, bare-metal installation running on two identical servers in a redundant, high-available fashion. Each server had a Dual Intel Xeon CPU E5-2640 v3 running at 2.60 GHz with physical cores (32 threads), 128 GB of RAM, and Gigabit connectivity. More precisely, in their scenario, publishers try to send as many messages as possible to the broker instances and, ultimately, the subscribers. Their tests exchange between 1000 and 50,000 messages/s, which is higher than many real cases. For example, BMW’s connected car platform processes 1500 messages/s, while Bose’s messaging backend handled up to 9700 messages/s [22]. They used a fixed message payload size of 150 Bytes with random binary content. Payloads of 64 Bytes or 128 Bytes have been used in other benchmarks and in a previous work [23] it has been demonstrated that payload sizes up to 4096 Bytes have limited influence on the maximum sustainable throughput.
Another work [24] has evaluated the performance of six MQTT broker implementations through stress testing. The test environment was configured on the Google Cloud Platform (GCP), with three c2-standard-8 virtual machine (VM) instances that have eight vCPUs, 32 GB of memory, and 30 GB local SSD each to act as the publisher, subscriber, and server, respectively. All the brokers were configured to run on the same test conditions (number of topics and publishers: three; number of subscribers: fifteen; payload: 64 bytes) and are analyzed based on metrics such as CPU usage, latency, and message rate. In their test environment, with the combination of three different publishing threads (one topic per thread) and fifteen subscribers, they were able to push the broker to 100% process usage and limit the CPU usage of publisher and subscriber machines below 70% and 80%, respectively.
As illustrated in Figure 3, the SB kit includes five components. Its Power Controller (PC), implemented using a TI F28379, converts any P, Q, or current distortion mitigation requests to modulation signals for the power electronics converter. These requests occur as frequently as every 0.8192 s, either from the DSO for coordinated action of SBs or by the end-user automation platform in autonomous operation (see further below). They reach the PC from the MQTT broker via a communication node (CN). On the other hand, the PC transmits data related to the SB’s state of operation back to the MQTT broker every 0.8192 s, again, via the CN. These data include water temperature and converter operation data (achieved active and reactive power and injected harmonics), provided by the SB sensors to the PC. The CN processes data transmitted between the MQTT broker and the PC, so that they are compatible with the format expected by both ends and any corrupt messages are rejected. The CN communicates with the PC through low-speed serial communication at 115,200 bps. The CN has been implemented successfully both with an Arduino MKR Zero through Ethernet connectivity and with an esp32 though WiFi connectivity. Obviously, proper selection of the communication medium will depend on the building location where the SB kit is to be installed. However, a global solution seems to be the Power Line Communication option, since this communication path will always be accessible via the power line feeding the SB, regardless of whether it will be installed on top of a roof or deep down in a cellar. However, this solution is the target of future work, as further testing is required before equally reliable operation in comparison to the other options is achieved.
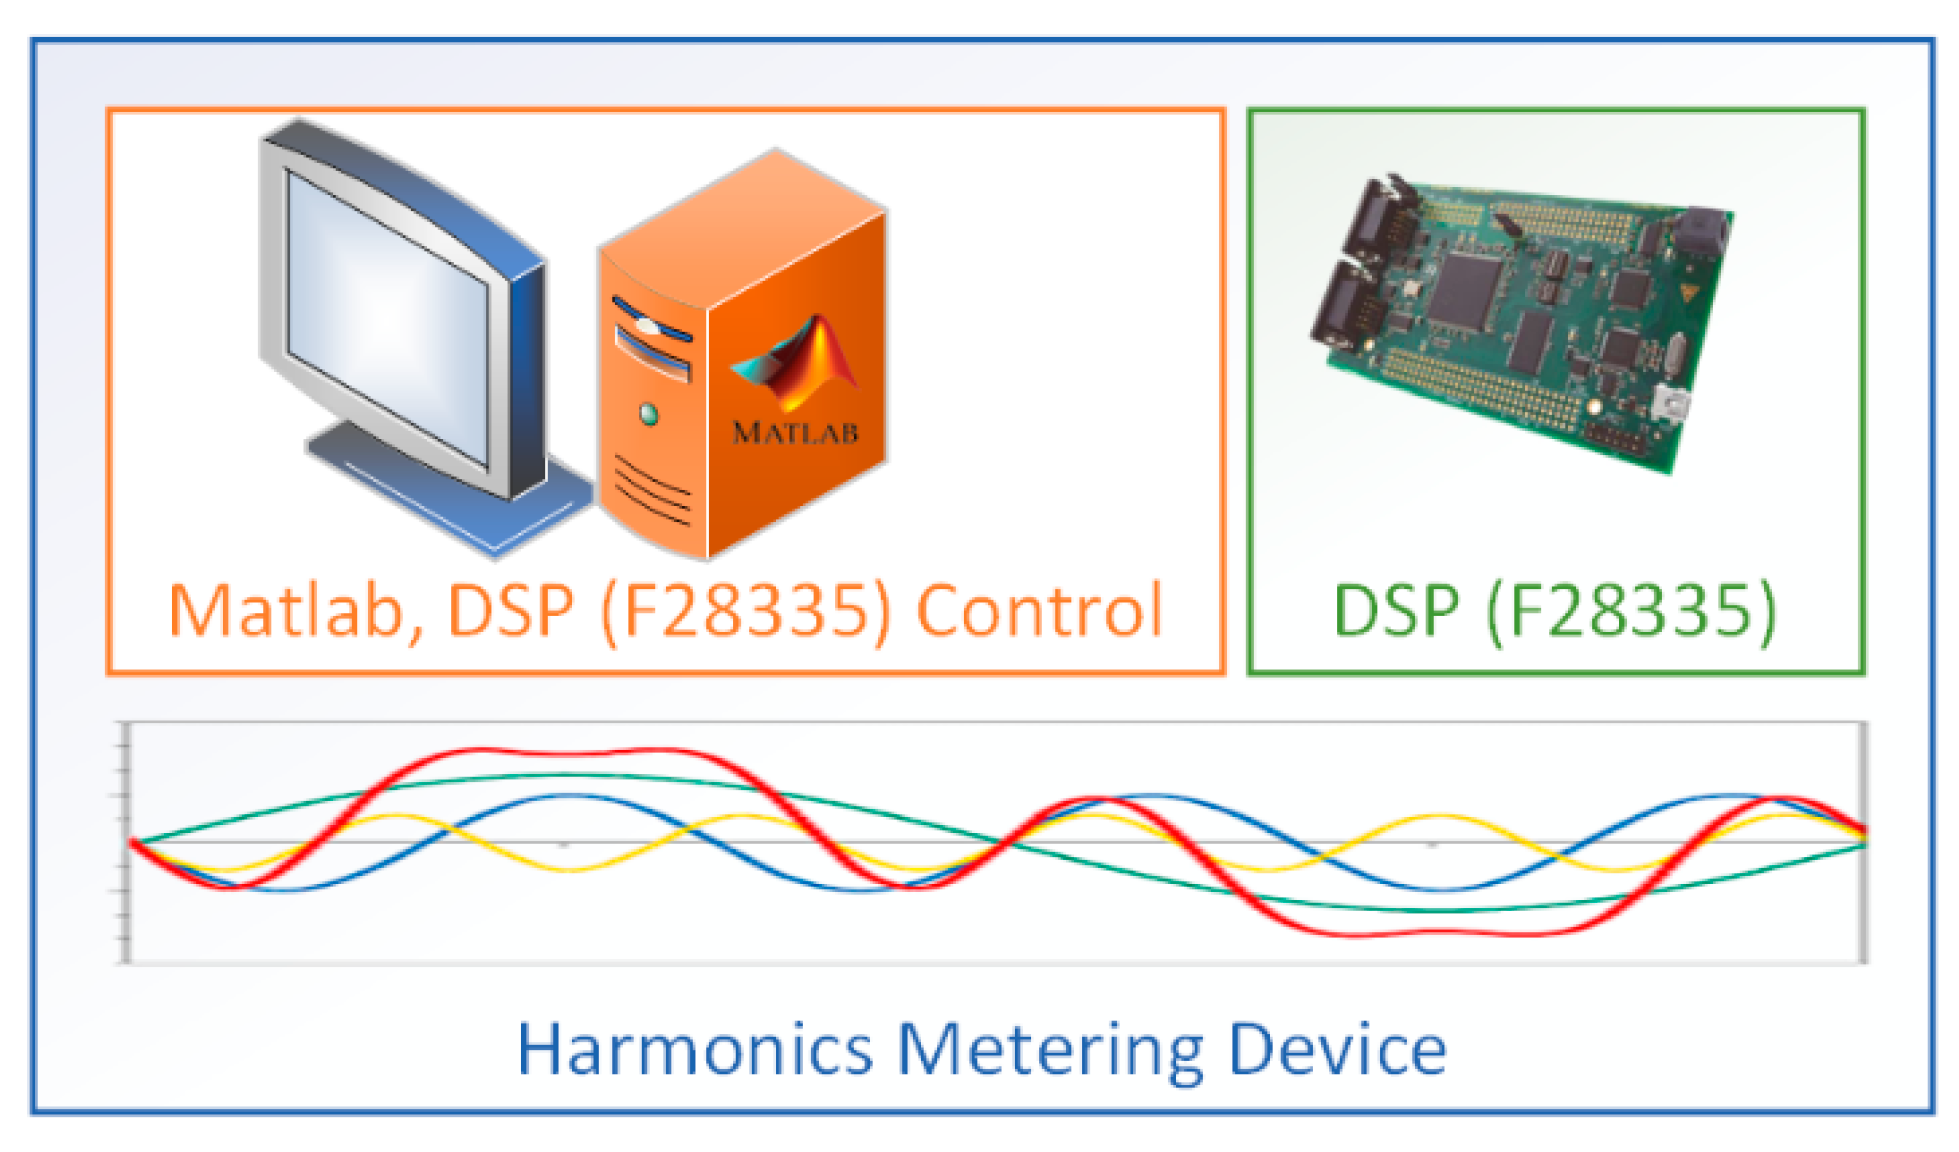
Raw data from the grid voltage and current measuring sensors at several points in the distribution grid (e.g., Points of Common Coupling to the utility grid) are also generated and transmitted to the broker. In our test case, these data are buffered for transmission via TI F28335 DSP (Figure 9). This DSP is not used only as a data repeater; it also calculates the RMS values of measured voltage and current from the respective sensors and calculates harmonics in terms of amplitude and phase. Transmitted information has a data length of 16 bytes, updated every 0.8192 s to the MQTT broker. The licensed users, i.e., the DSO or an end-user home automation platform, automatically receive these data as soon as they reach the broker. A final remark about this measuring setup, currently used as the interface between the sensors and the IoT, is that with the use of a computer-based application (Figure 10) the user may alter its operation parameters and select, e.g., which harmonics should be calculated, which data should be transmitted, etc.
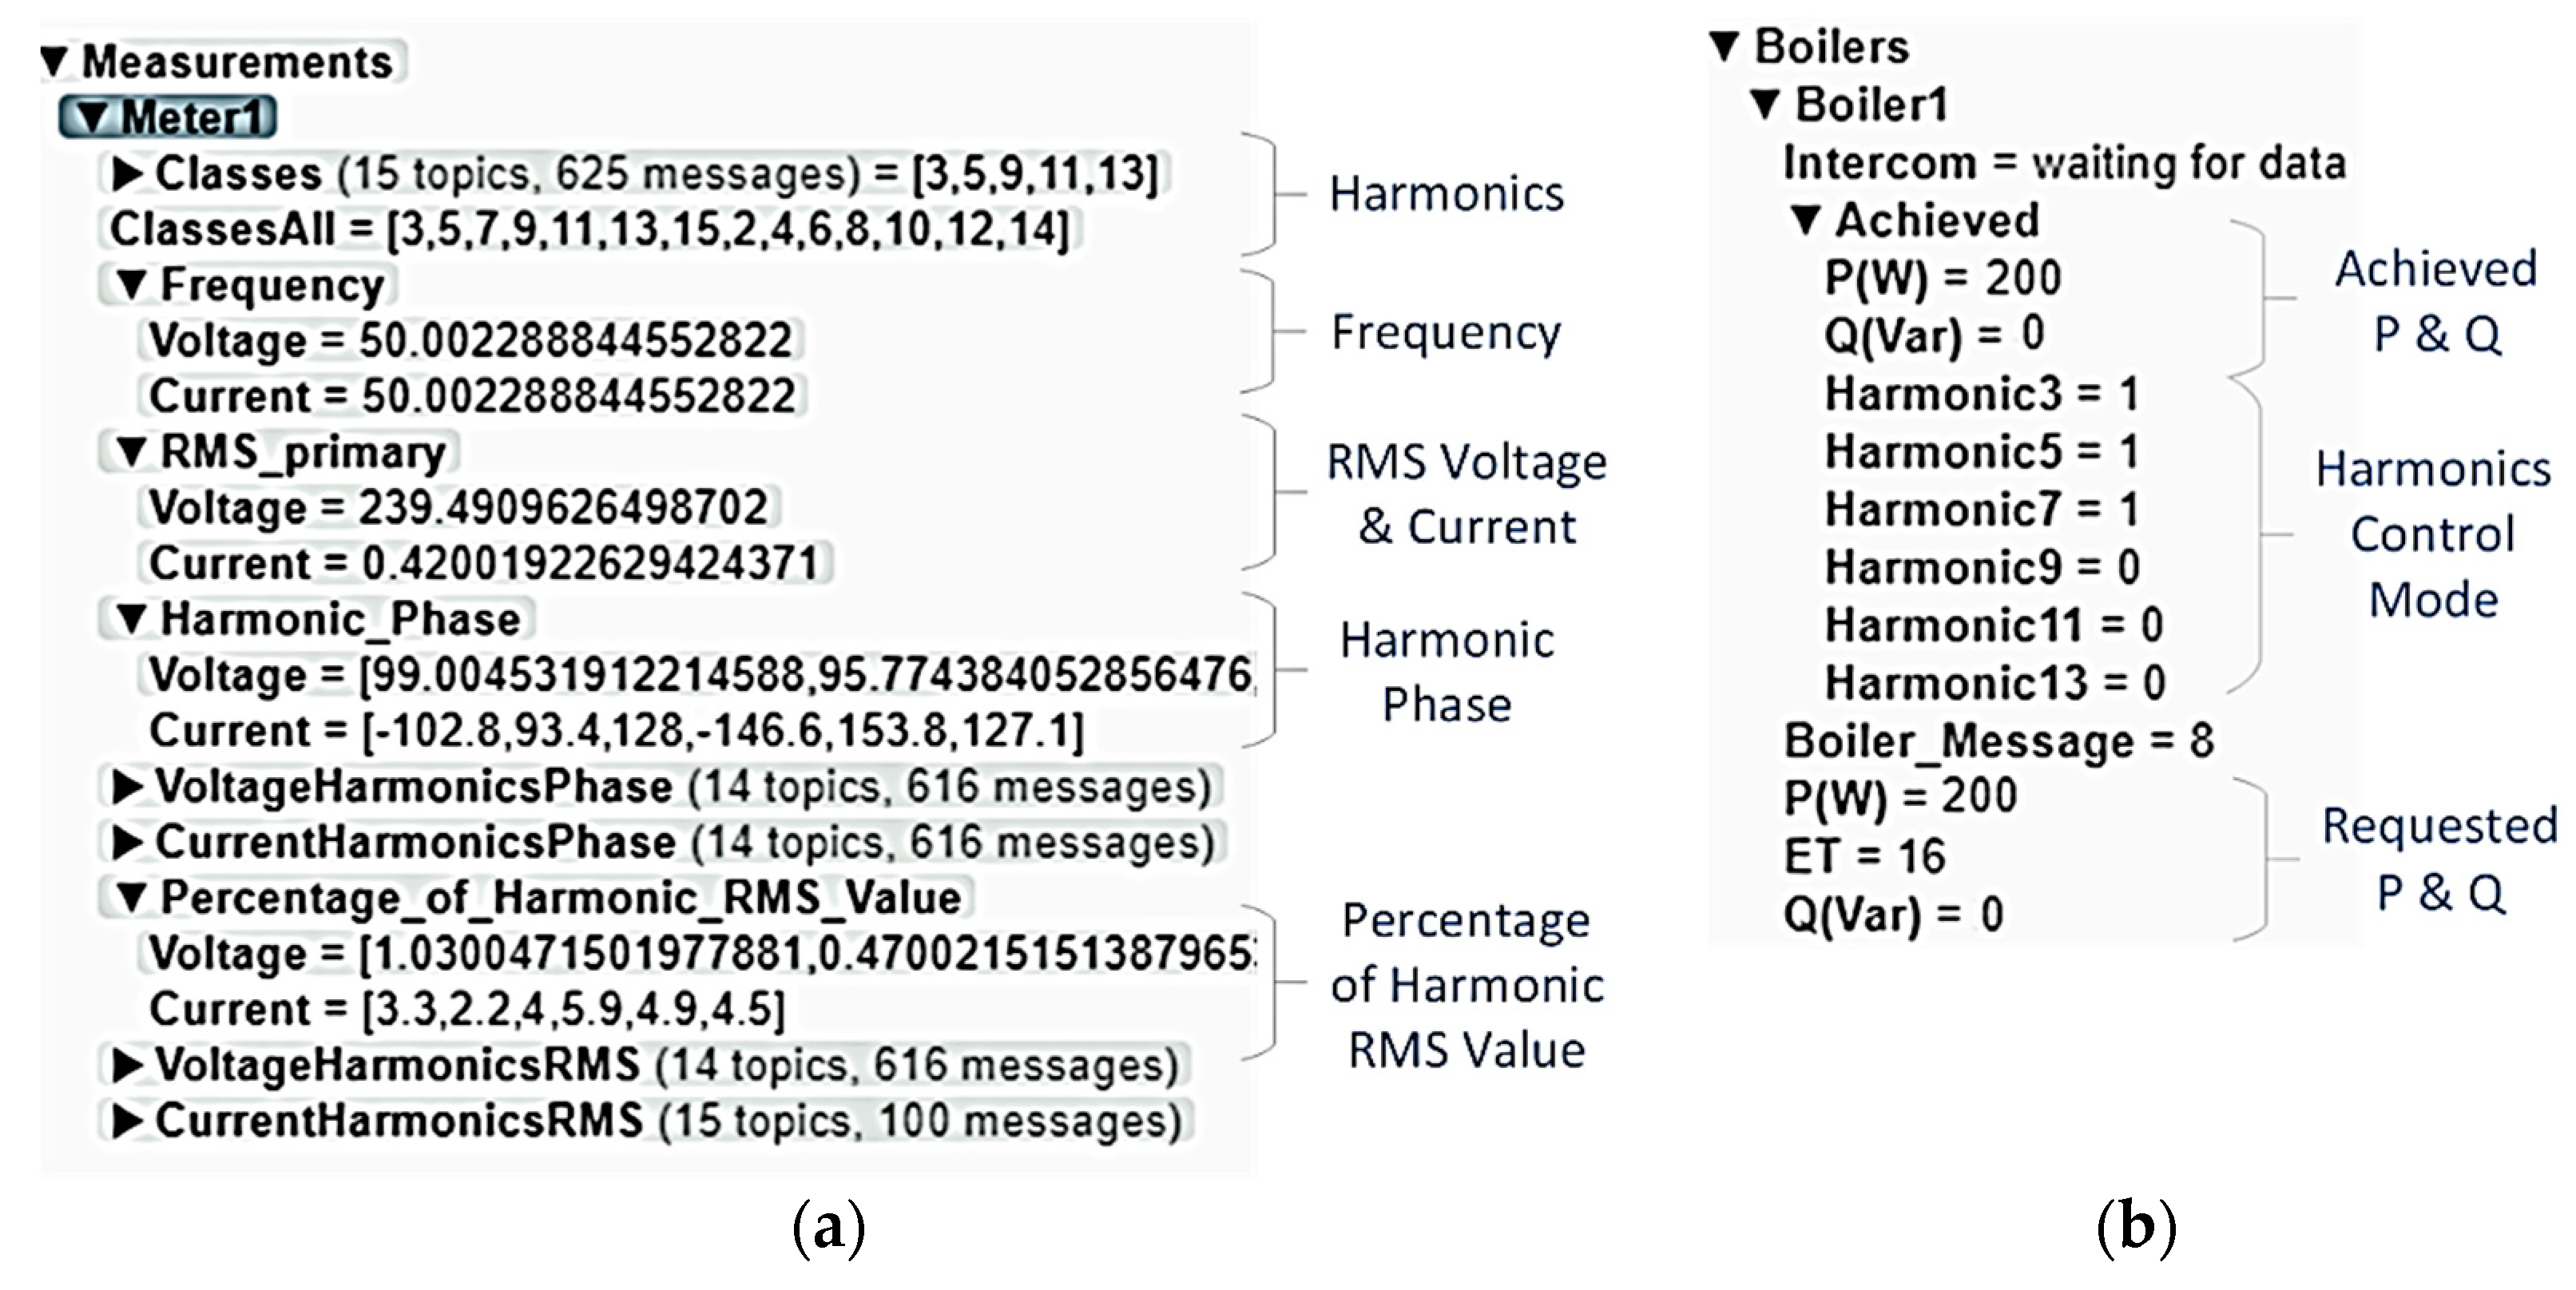
As mentioned above, an SB can intercommunicate with an end-user automation platform, such as the Home Assistant. Home Assistant is an open-source home automation platform, which is powered by a worldwide community of tinkerers and DIY enthusiasts [25]. In this platform, the SB can be monitored, controlled, or configured by the end-user for automatic operation (Figure 11a,b). Thus, the operation may be customized or automatically adjusted to the user’s hot water needs, while offering maximum economy, for example, by taking advantage of time-of-use tariffs or excess local PV generation. Moreover, a data logger can be installed on the same platform, so that all communication data are stored for future processing and analysis by the user itself or the DSO (Figure 11a,b). All data traffic can easily be monitored with an independent MQTT traffic monitoring software (such as MQTT Explorer v0.4.0) installed on a computer with internet access. In Figure 12 (a and b, respectively), there are two screenshots of the information sent to the MQTT broker from metering devices and two SBs in some instance.
The MQTT broker acts as a go-between for the clients who are sending messages and the subscribers receiving those messages. In more detail, the MQTT broker intercommunicates with an end-user automation platform for each SB, metering equipment spread all over the distribution grid and the DSO that processes their input in order to coordinate en masse operation of the SBs and provide grid quality services. The MQTT broker acts as the central hub in a star topology MQTT network and serves all data requests from all clients. The broker also has data-storing capabilities for future processing and exploitation. In Table 1, a summary of the intercommunicated traffic for such a broker, serving 10,000 SBs and 1000 measuring devices, is presented. Such traffic (up to 11,000 messages/s) and maximum message payload size (up to 16 Bytes) can easily be handled by typical MQTT platforms, as mentioned above [21], and is summarized in Table 1.

5. Testbed for the Experimental Investigation

5.1. Overview

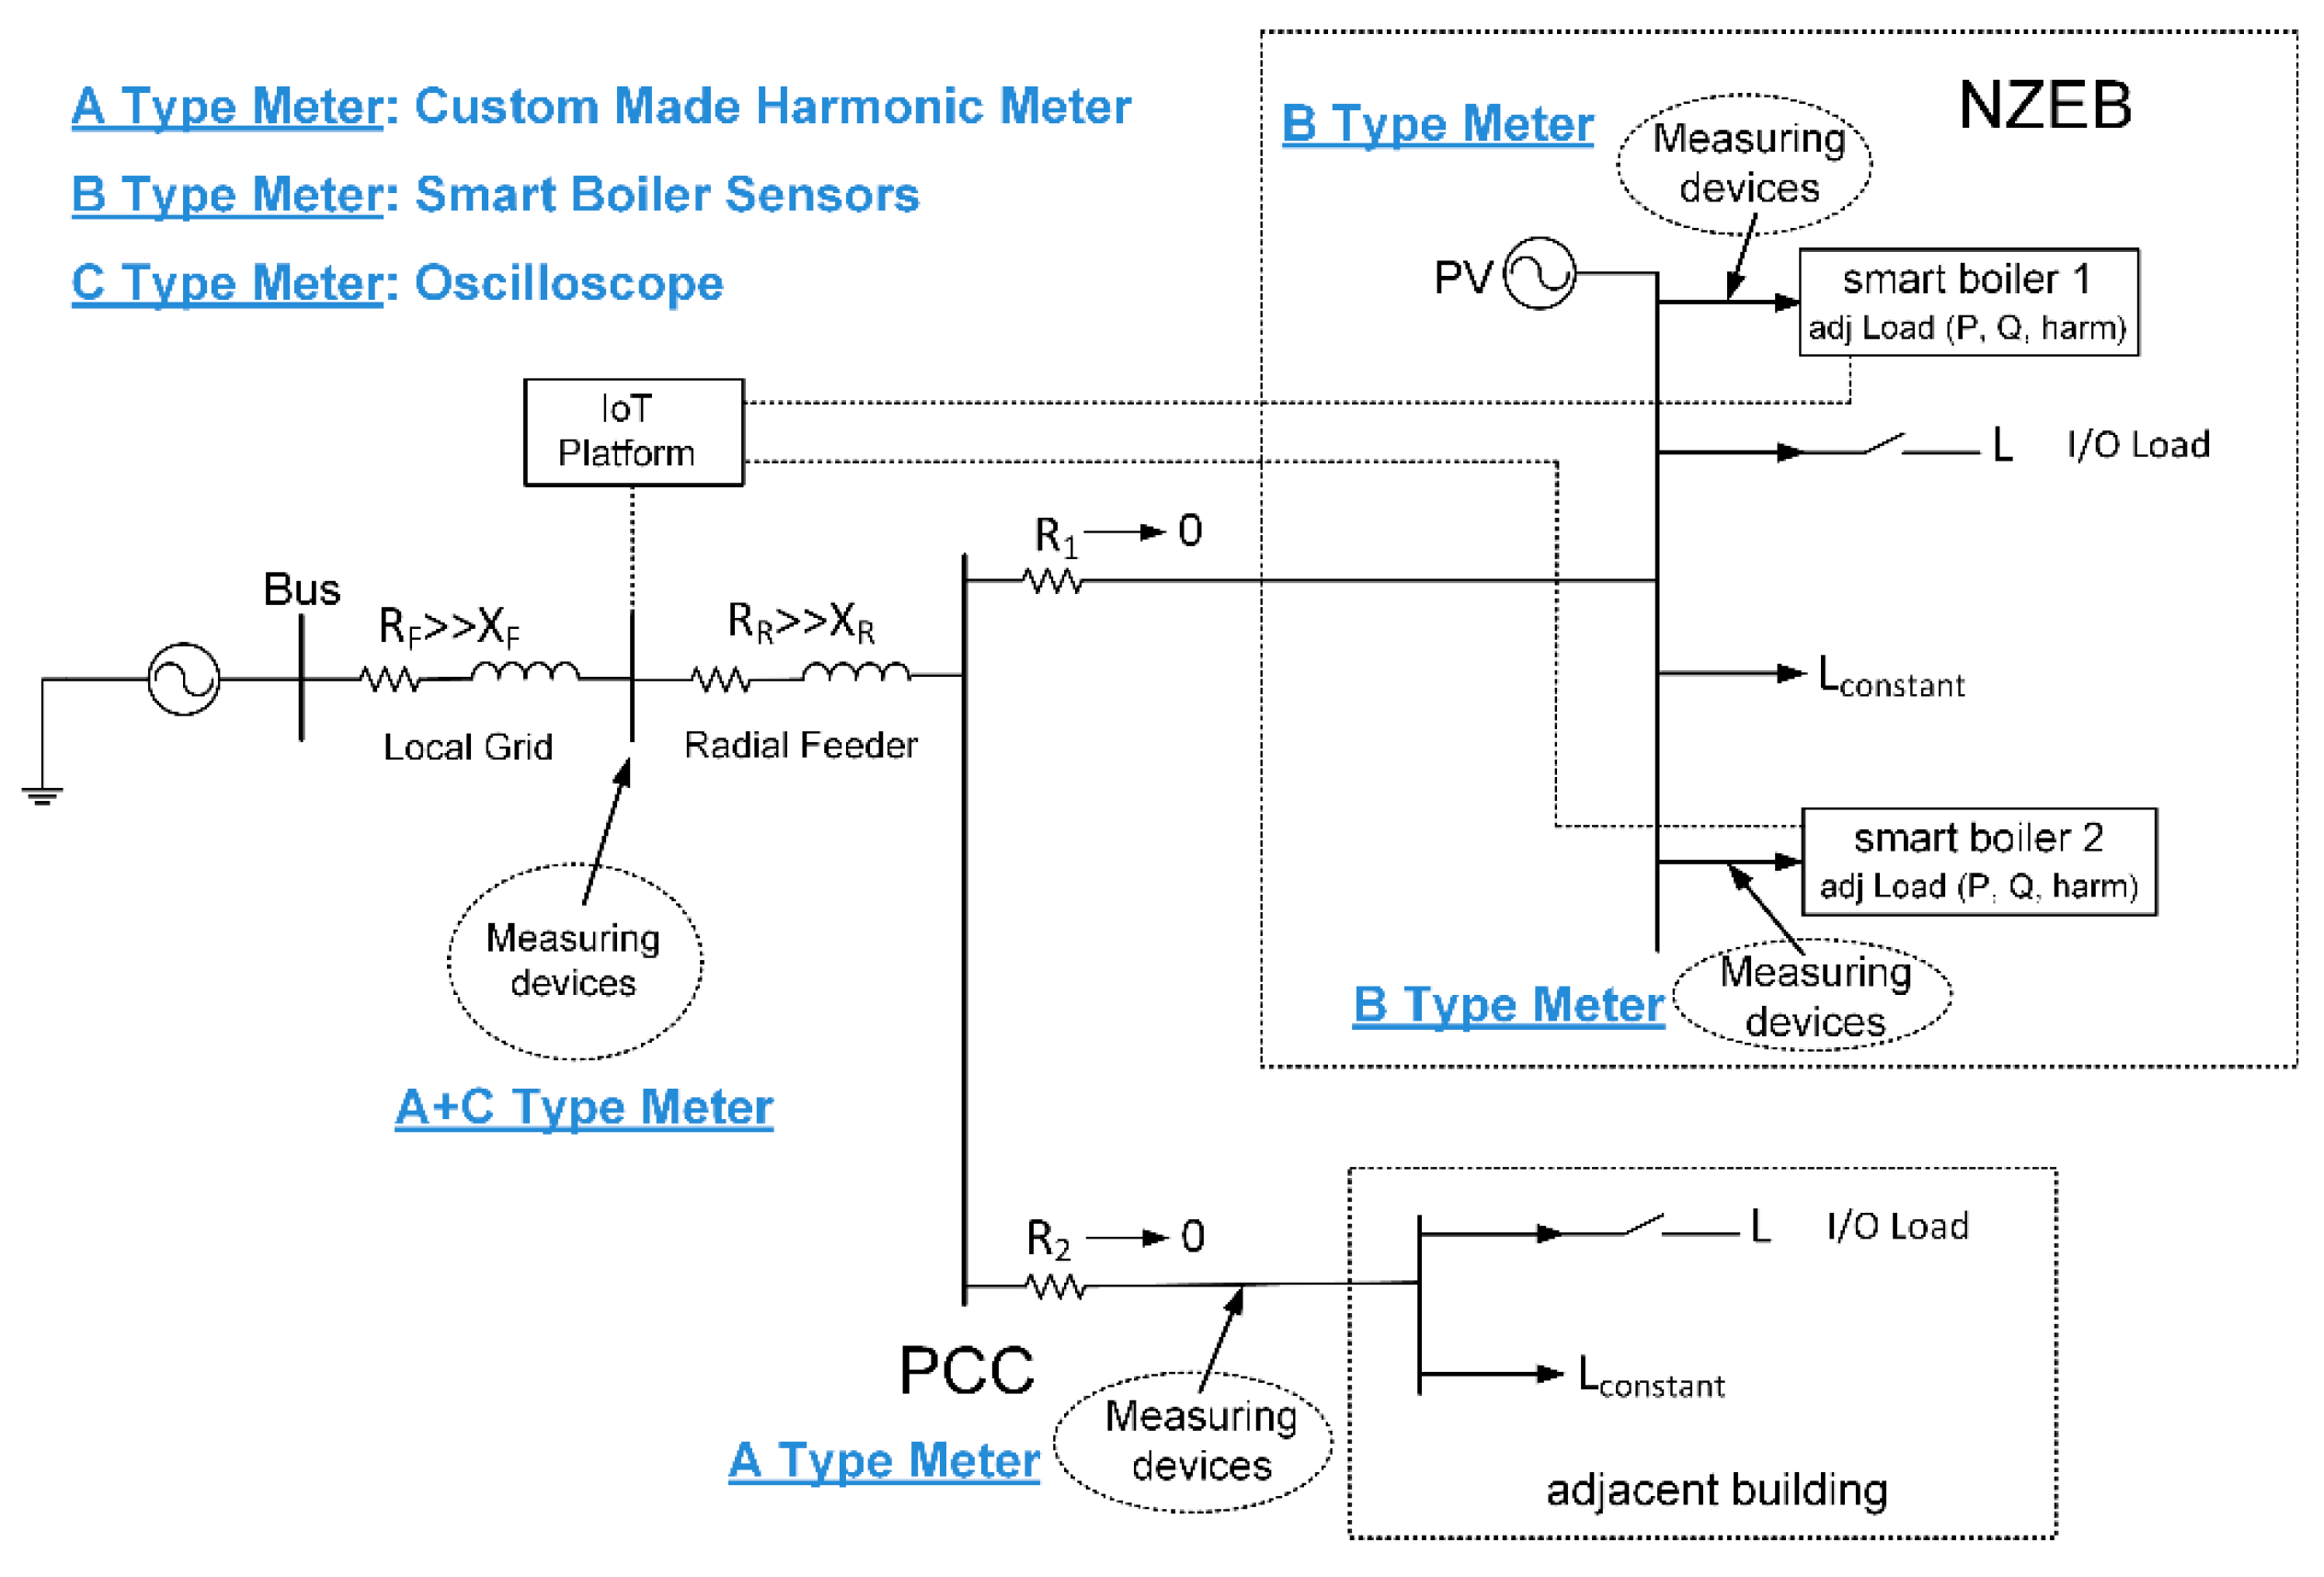
The testbed built for the SB application demonstration and verification is not a static configuration; it can be easily reconfigured or expanded. Figure 13 contains the schematic diagram of one of the numerous possible configurations; it is the one maintained during the tests that produced the results of the next section. Some of its main components are as follows:
  • A test network for the SBs, containing metering and supply equipment for the analysis of both their thermal and their electric response;
  • A PV array of 1.36 kWp;
  • Three power supplies (DC and AC) and miniature grid elements for the emulation of radial or meshed grids;
  • Grid analyzer;
  • Controllable converter for PV electricity generation with in-lab developed control software;
  • Two SB kits, one coupled with an actual 150lt boiler system and the other one with an equivalent, air-cooled, laboratory resistive load.
The whole setup consists of two interconnected and interoperable entities: the power flow circuitry and the control unit with its monitoring system (as described in the previous section). The power flow circuitry contains three parts (a feeder, a PCC, and two load groups) emulating variable demand of typical domestic buildings.

5.2. Feeder

The grid impedance greatly affects the voltage drop/rise with the loading variations, as well as the effect of the SB’s counteraction to these fluctuations with the injection/absorption of reactive power and active power consumption. Moreover, it affects the control scheme of the harmonics mitigation and, more specifically, the proper phase angle of the injected mirror harmonics [26]. Without ignoring the fact that its value is frequency dependent, it may be considered approximately constant for low-order harmonics. Nevertheless, the iteration process applied at the control scheme of the SB converter for harmonic mitigation does not require grid impedance to be a given, known quantity.
The feeder has typical LV grid characteristics, such as the ones expected to supply Near Zero Energy Buildings (NZEBs) [27,28,29]. It is simulated with the appropriate resistances and inductive reactance levels connected in series, as indicated in Figure 13. The RF and XF values correspond to the local grid supply line and RR and XR roughly simulate the lumped parameters of several grid scenarios. Capacitive elements of the LV distribution grid are considered to be negligible [30].
The impedance of the local grid at the demo site was measured as ZF = RF + jXF = (0.5 + j0.05) Ω at 50 Hz, with the distribution transformer located at a distance of about 200 m. In order to account for a longer distribution line (of the order of 1km extra length), the impedance ZR = RR + jXR = (0.4 + j0.31) Ω has been additionally connected. This allows for a realistic implementation of the test case scenario, where the grid voltage is regulated with the utilization of reactive power provided by the SB.

5.3. Point of Common Coupling

A typical bus bar with dispatching functionality simulates the PCC. A switchboard supplies dispatchable power to the load groups, with circuit breakers for SB1 and SB2, step loads of line 1 and loads of line 2, respectively (see Figure 13).

5.4. Load Groups

There are two load groups in the testbed’s power flow circuitry. The first group, corresponding to load line 1, is the main demonstration hardware for the SB operation. It simulates the operation of a smart building, such as a NZEB. This group contains a step ohmic-inductive/capacitive load (“L I/O” in Figure 13), a constant ohmic-inductive load (“Lconst” in Figure 13), and two SBs. The step load simulates the aggregated, incremental, non-controllable load of the building, assuming machines and devices are connected or disconnected according to the preferences of the users. It has a range of options for the manual set-up of its active and reactive power demand. The constant load simulates the base load of the building and it has a preset active power consumption (P = 400 W). The two SBs operate as the main controllable active and reactive power demand consumers. However, any of the two SBs can operate as a simple, adjustable active and reactive power demand device, depending on the demonstration scenario. The second group, which corresponds to load line 2, contains a step ohmic-inductive load and a constant one as a base load (P = 350 W).
The two step ohmic-inductive/capacitive loads (R-L/C) may simulate purely ohmic (R) loads on both load lines 1 and 2, to account for the fluctuating active power consumption in the local grid and several ohmic-inductive (R-L) and ohmic-capacitive (R-C) loads, within the local SBs reactive power compensation capability. In real-life scenarios, the SB’s setpoints of active or reactive power are expected to be transmitted by the DSO, which monitors the local grid’s metering equipment (e.g., SCADA) and receives information about the thermal status of the SBs in the vicinity of the PCC of interest (see Section 4, Telecommunication Aspects of the Widespread Application of Smart Boilers). In addition to the active/reactive power loading, for a more realistic micro-grid simulation with fluctuating local power generation too, a PV array capable of 1.36 kWp is also connected to load line 1.

5.5. PV Array and Inverter

The PV array connected to load line 1 is capable of delivering 1.36 kW peak power to the grid (17 monocrystalline cell panels of 80 Wp each, 22.5 V/4.66 A). However, in order to attain better testing flexibility, it was necessary to make this active power injection adjustable, rather than just dependent on the incident irradiation natural variations.
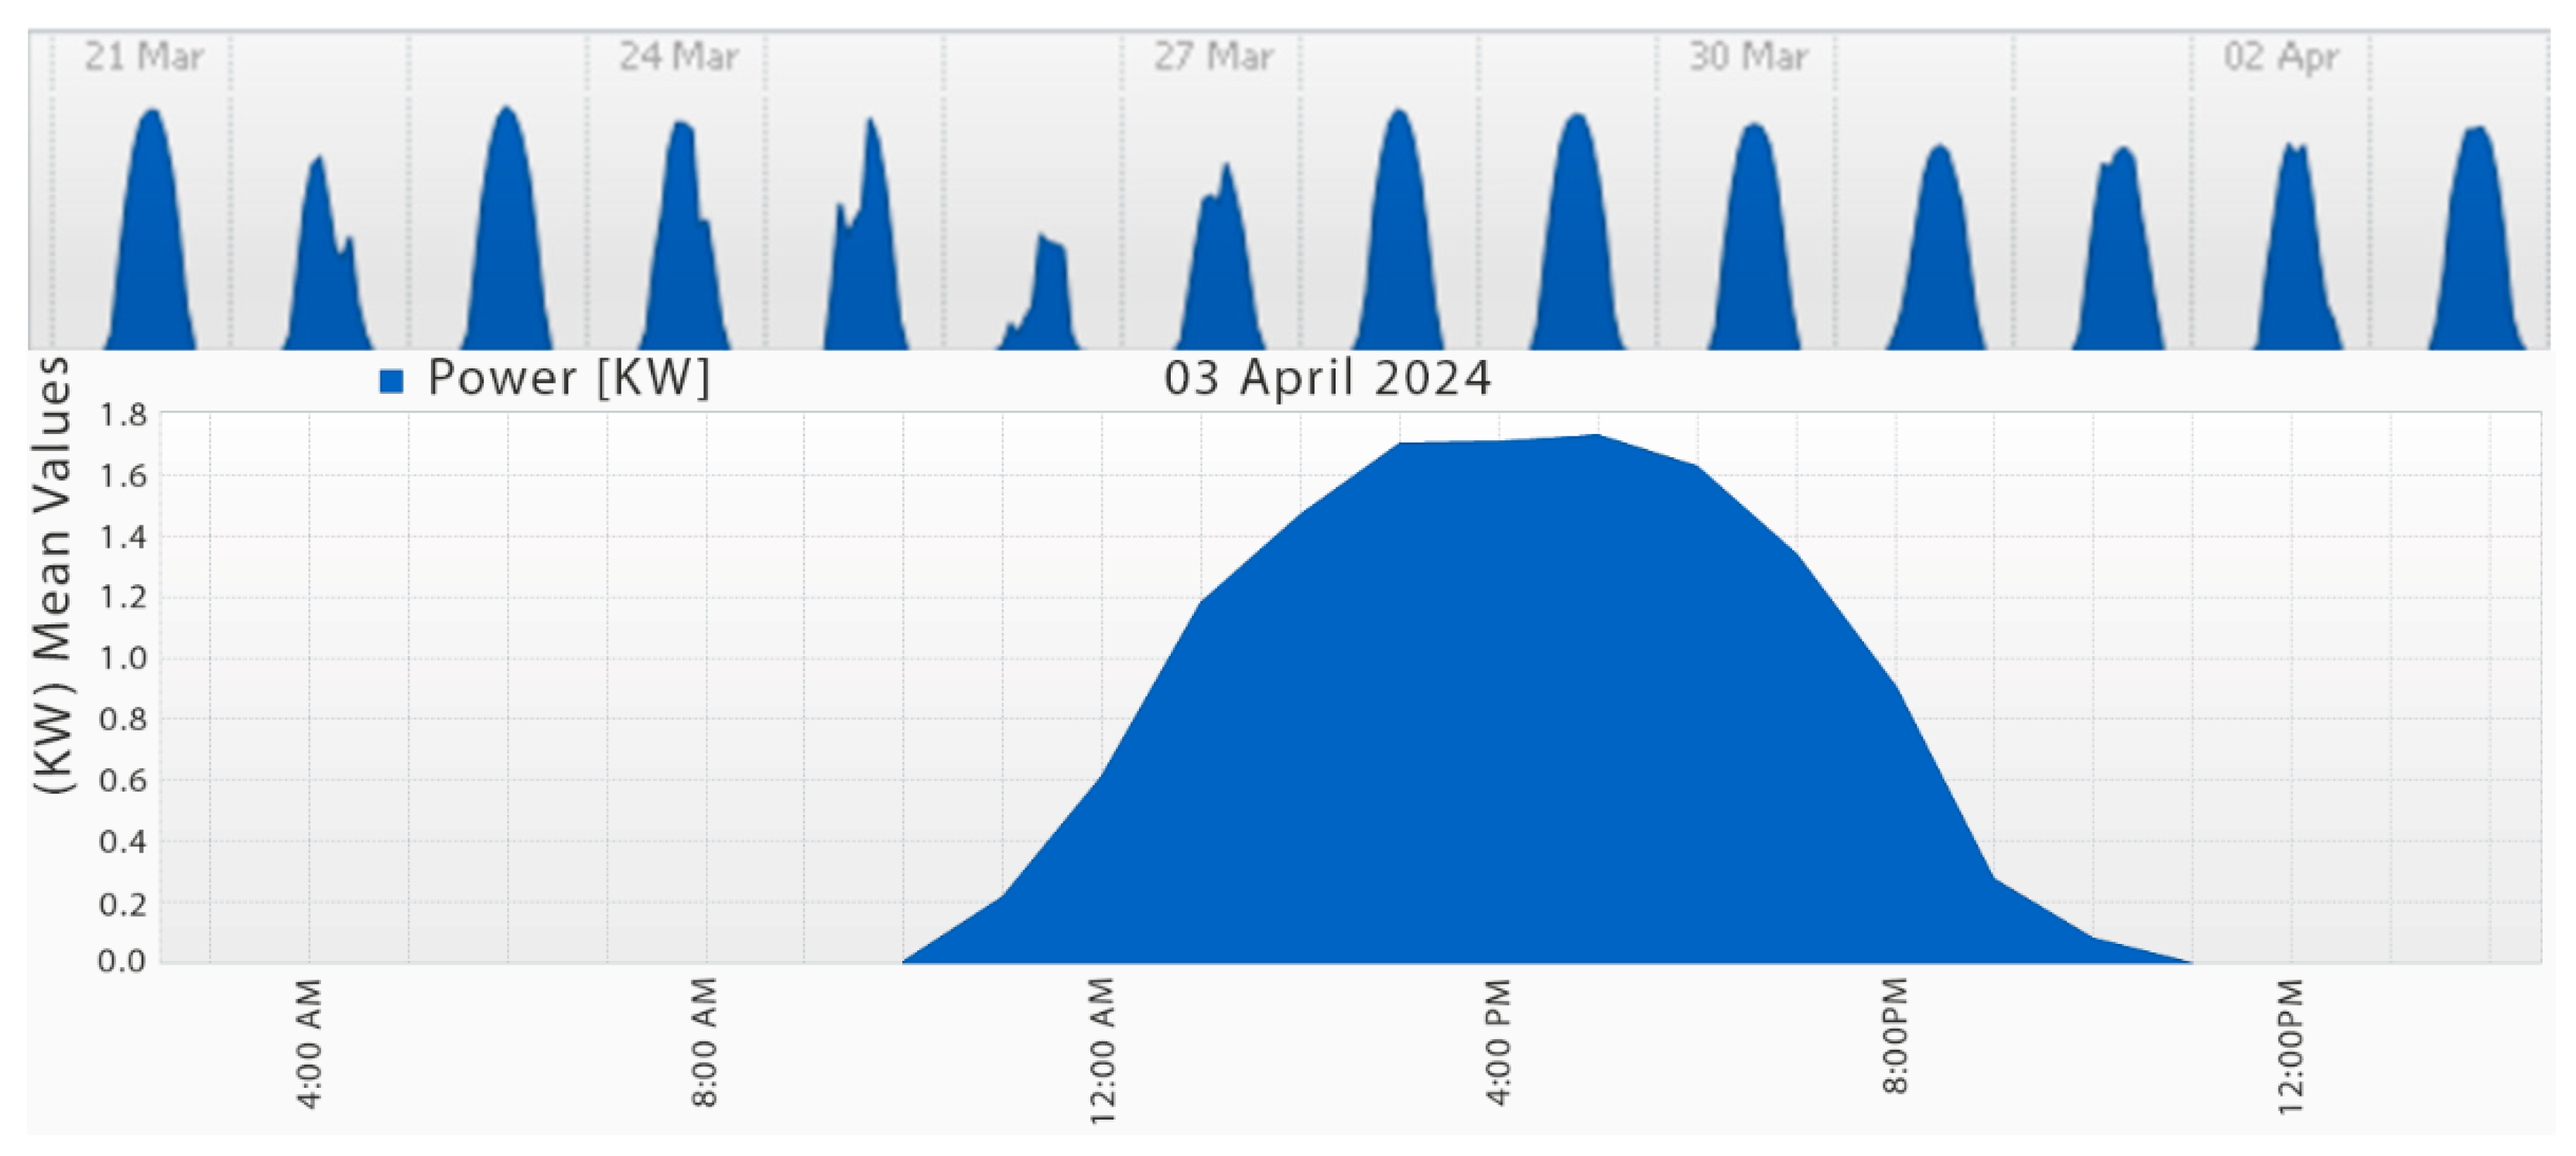
Hence, the research team developed the appropriate software interface in order to control the output power of the inverter that intervenes between the PV and the grid (SMA Sunny Boy 1200 W, one-phase output) from any point on the internet. Such an interface normally comes as a standard utility with the latest models of the same manufacturer, yet it cannot be found anywhere for the earliest models, such as that used in the testbed. With this utility, built in the same Matlab Simulink 2021a toolbox environment as the testbed configuration control, the user can remotely set a limit to the power generation, in real-time, below the maximum power point tracked by the PV inverter controller. The operation and statistics of the PV array can be monitored 24/7 through the SMA portal sunnyportal.com. Right below (Figure 14) is a snapshot from the environment of this online service, showing real time values and recent statistics regarding the power injected into the grid.

5.6. PV Monitoring System

The measuring devices monitor the active and reactive power flow supplied by the grid to the feeder and vice versa. Aggregated harmonic content is also measured at the feeder. A power analyzer between the feeder and the PCC measures the active/reactive power demand and the power quality levels, i.e., current harmonic content and RMS value of voltage. Power analyzers are also located between the PCC and the two local groups of loads. The same type of analyzers are also connected to the input of each SB. The two SBs also have their independent voltage and current sensors, from the readings of which the power can be derived but not the current harmonic content. These measurements are performed for two reasons in the testbed: to verify and fine-tune the converters’ operation and to have them published to the IoT platform that creates the SB cluster ecosystem. Moreover, a power analyzer monitors the combined demand of the step load and the constant load on load line 1. All data from the several different measuring setups are independently validated with the use of two high-sampling-rate digital oscilloscopes and the relevant voltage and current probes.

5.7. Step Loads

Two different sets of step loads are connected to the two load lines. Figure 15a presents the schematic diagram of the load used in line 1 and Figure 15b contains the schematic diagram of the load used in line 2. Together with each diagram comes a table with the attainable active or reactive power values, according to the selected configuration. The seven switches are on seven corresponding relays and the numbers assigned to these diverter switches (two-way contacts) correspond to the data acquisition system digital I/O ports that control them (see Section 5.8 below). In these two diagrams, the normal condition of each relay sets the connection to node A and energizing the relay sets connection to node B. Notice that the active power loads can never be zero, hence there can never be purely capacitive or purely inductive loading. As an example, in the step load of Figure 15a, with all the relays not energized, the load is purely resistive with 400 W active power consumed if the voltage is 230 V. This is considered as the base load of line 1. In a similar way, with all the relays not energized, the base load of load line 2 is 350 W.

5.8. Automation Box

In Section 5.7, the schematics of the two utilized step loads were presented. In order to implement this scheme, it is necessary to have seven programmable diverter switches. This is achieved with seven 12V DC, 10A–250V power relays (10 ms response time) energized by an integrated digital amplifier (ULN2002). The amplifier has seven Darlington transistor arrays (Darlington pairs) with a current driving capability of 500 mA each; yet, in the present application the current of each relay coil is limited to 50 mA. The seven input pins of the amplifier are connected to seven digital outputs of the data logger, presented further below, with a flat cable. Moreover, the digital ground of the data logger is tied to the ground of the amplifier. The instructions to the data logger that determine the condition of the corresponding digital I/O ports (high/low) come from a relevant Matlab–Simulink program.

5.9. Boiler

The boiler contained in the demonstration setup (Figure 16) is a Maltezos SA 150lt capacity stainless-steel tank, normally used in solar water heater applications. It is in thermal contact with a thin chamber surrounding the tank and containing a heat transfer fluid (in our case though this chamber is empty), externally covered by polyurethane foam for thermal insulation. The outer cover is stainless steel too. The boiler is placed horizontally (as illustrated in Figure 16). It has three slots on one of its circular side caps to insert temperature sensors at different levels of the tank. In the center of the other side cap, the heating resistor can be found. Next to it is the thermostat, that automatically turns the power supply off if the water temperature surpasses an adjustable threshold (80 °C in our case). The hot water outlet is adjusted to a safety relief valve that is expected to open in the case of excessive pressure in the tank, e.g., if all other protection units (converter control and/or thermostat) fail and the water reaches the boiling point. An anode rod made of magnesium, placed close to the resistor, prevents corrosion of the metal parts of the water piping circuit, including the steel tank itself.

5.10. Temperature Sensing

For temperature sensing, a voltage signal comes from a voltage divider consisting of a constant value resistor and a Positive Temperature Coefficient (PTC) thermistor temperature-sensing kit in approximate thermal equilibrium with the surrounding water in the boiler, fed with 5 V DC. The time constant of a thermistor is typically a few seconds and this may increase by a few more seconds if we consider the thermal constant of its metal protective case that does not allow it to come in immediate contact with the surrounding environment [31] and that of the metal tube immersed in the water to hold the temperature sensor. However, for the sake of the present experiments, where small temperature changes happen in a matter of several minutes, a temperature reading delay of, say, 15–20 s is not of crucial importance. The readings are currently saved in a record file on the computer connected to the data logger, yet they can be transmitted to the internet (e.g., to the DSO), if necessary.
In order to acquire an approximate water temperature profile in the boiler, three thermistors are used in total, placed at different levels in the boiler through the proper slots and the corresponding inserted metal tubes intentionally added for this specific purpose. This temperature profile, from which the stored energy and, eventually, the residual heat capacity of the boiler can be determined, is not a simple average of the three readings, since temperature is not a linear function of the vertical position in the tank and neither is the volume of the tank. Moreover, while feeding the boiler with power there is a keen, temperature stratification of its content, intensified by the fact that the tank lies horizontally with the heating resistance placed in the middle of its side plate. A vertical positioning of the boiler would be preferable in terms of a more effective heat transfer in the tank when the power is on, since in such a case both the heating resistor and the thermostat would lie at the bottom of the tank. Yet, this was not the most convenient option for the optimum arrangement of devices and cabling at the testbed. Moreover, at most of the solar heaters, which are the most appropriate candidates for the SB application, the boiler is placed horizontally too.
The research team is currently looking for the optimum algorithm to accurately calculate the stored energy and, eventually, the energy headroom of the boiler, according to the water temperature readings, which includes determination of the heat loss rate both during heating time, when intense stratification is taking place, and during the non-heating time that follows, when gradual homogenization occurs (Figure 17). It is necessary to note that this issue, i.e., the determination of the residual energy capacity of the boiler from the data of limited sensing resources (e.g., two or even just one temperature sensor in the tank, without any inlet/outlet flow-meters or thermometers) has no established method and the relevant literature is remarkably poor.

5.11. Data Acquisition System

The data acquisition system (DAS) used is a Data Translation DT9834 data logger. Its analogue and digital I/O ports are easily accessible through the Matlab–Simulink environment and several of its operations are fully programmable. For the purposes of the conducted tests, three of its sixteen analogue input ports and seven of its sixteen digital I/O ports are utilized.
Each of the analogue inputs received a continuous voltage signal in the range ±2.5 V (selected among other possible ranges). Those voltage signals are sampled at a rate of 100 sps, selected to be so, since higher sampling rates are a meaningless waste of computational and communication resources, when it comes to slow-paced water temperature variations. This signal is properly converted into temperature units with the Matlab code developed for this purpose. With the same code, six thousand consecutive samples are averaged to output one single value per minute. This averaging diminishes any error due to a possibly noisy signal, e.g., as a result of the EMI from the switching operation of the converter.

6. Experimental Results

With all the components of the testbed fully operational, the research team performed several tests to verify the operation of the system at both the power flow circuitry and the measurements and control part. Each test was repeatedly performed in order to reveal any possible malfunction that could remain hidden during a unique, seemingly faultless test. In this section, indicative results from the tests are presented in the form of graphs from recorded data and oscillograms.
In Figure 18, the RMS value of the voltage at the PCC during excessive loading is recorded. We attempted to reduce the voltage drop observed at the start of the test (t < 3 s) via the operation of SB1 at t = 35 s. It is evident that a voltage rise of approximately 1 V is achieved with the injection of 400 VAR into the grid, whilst the SB operates at 1 kW. Note that we use the convention whereby a positive value for the SB’s reactive power indicates consumption of reactive power or inductive operation, whereas a negative value corresponds to the generation of reactive power or capacitive operation.
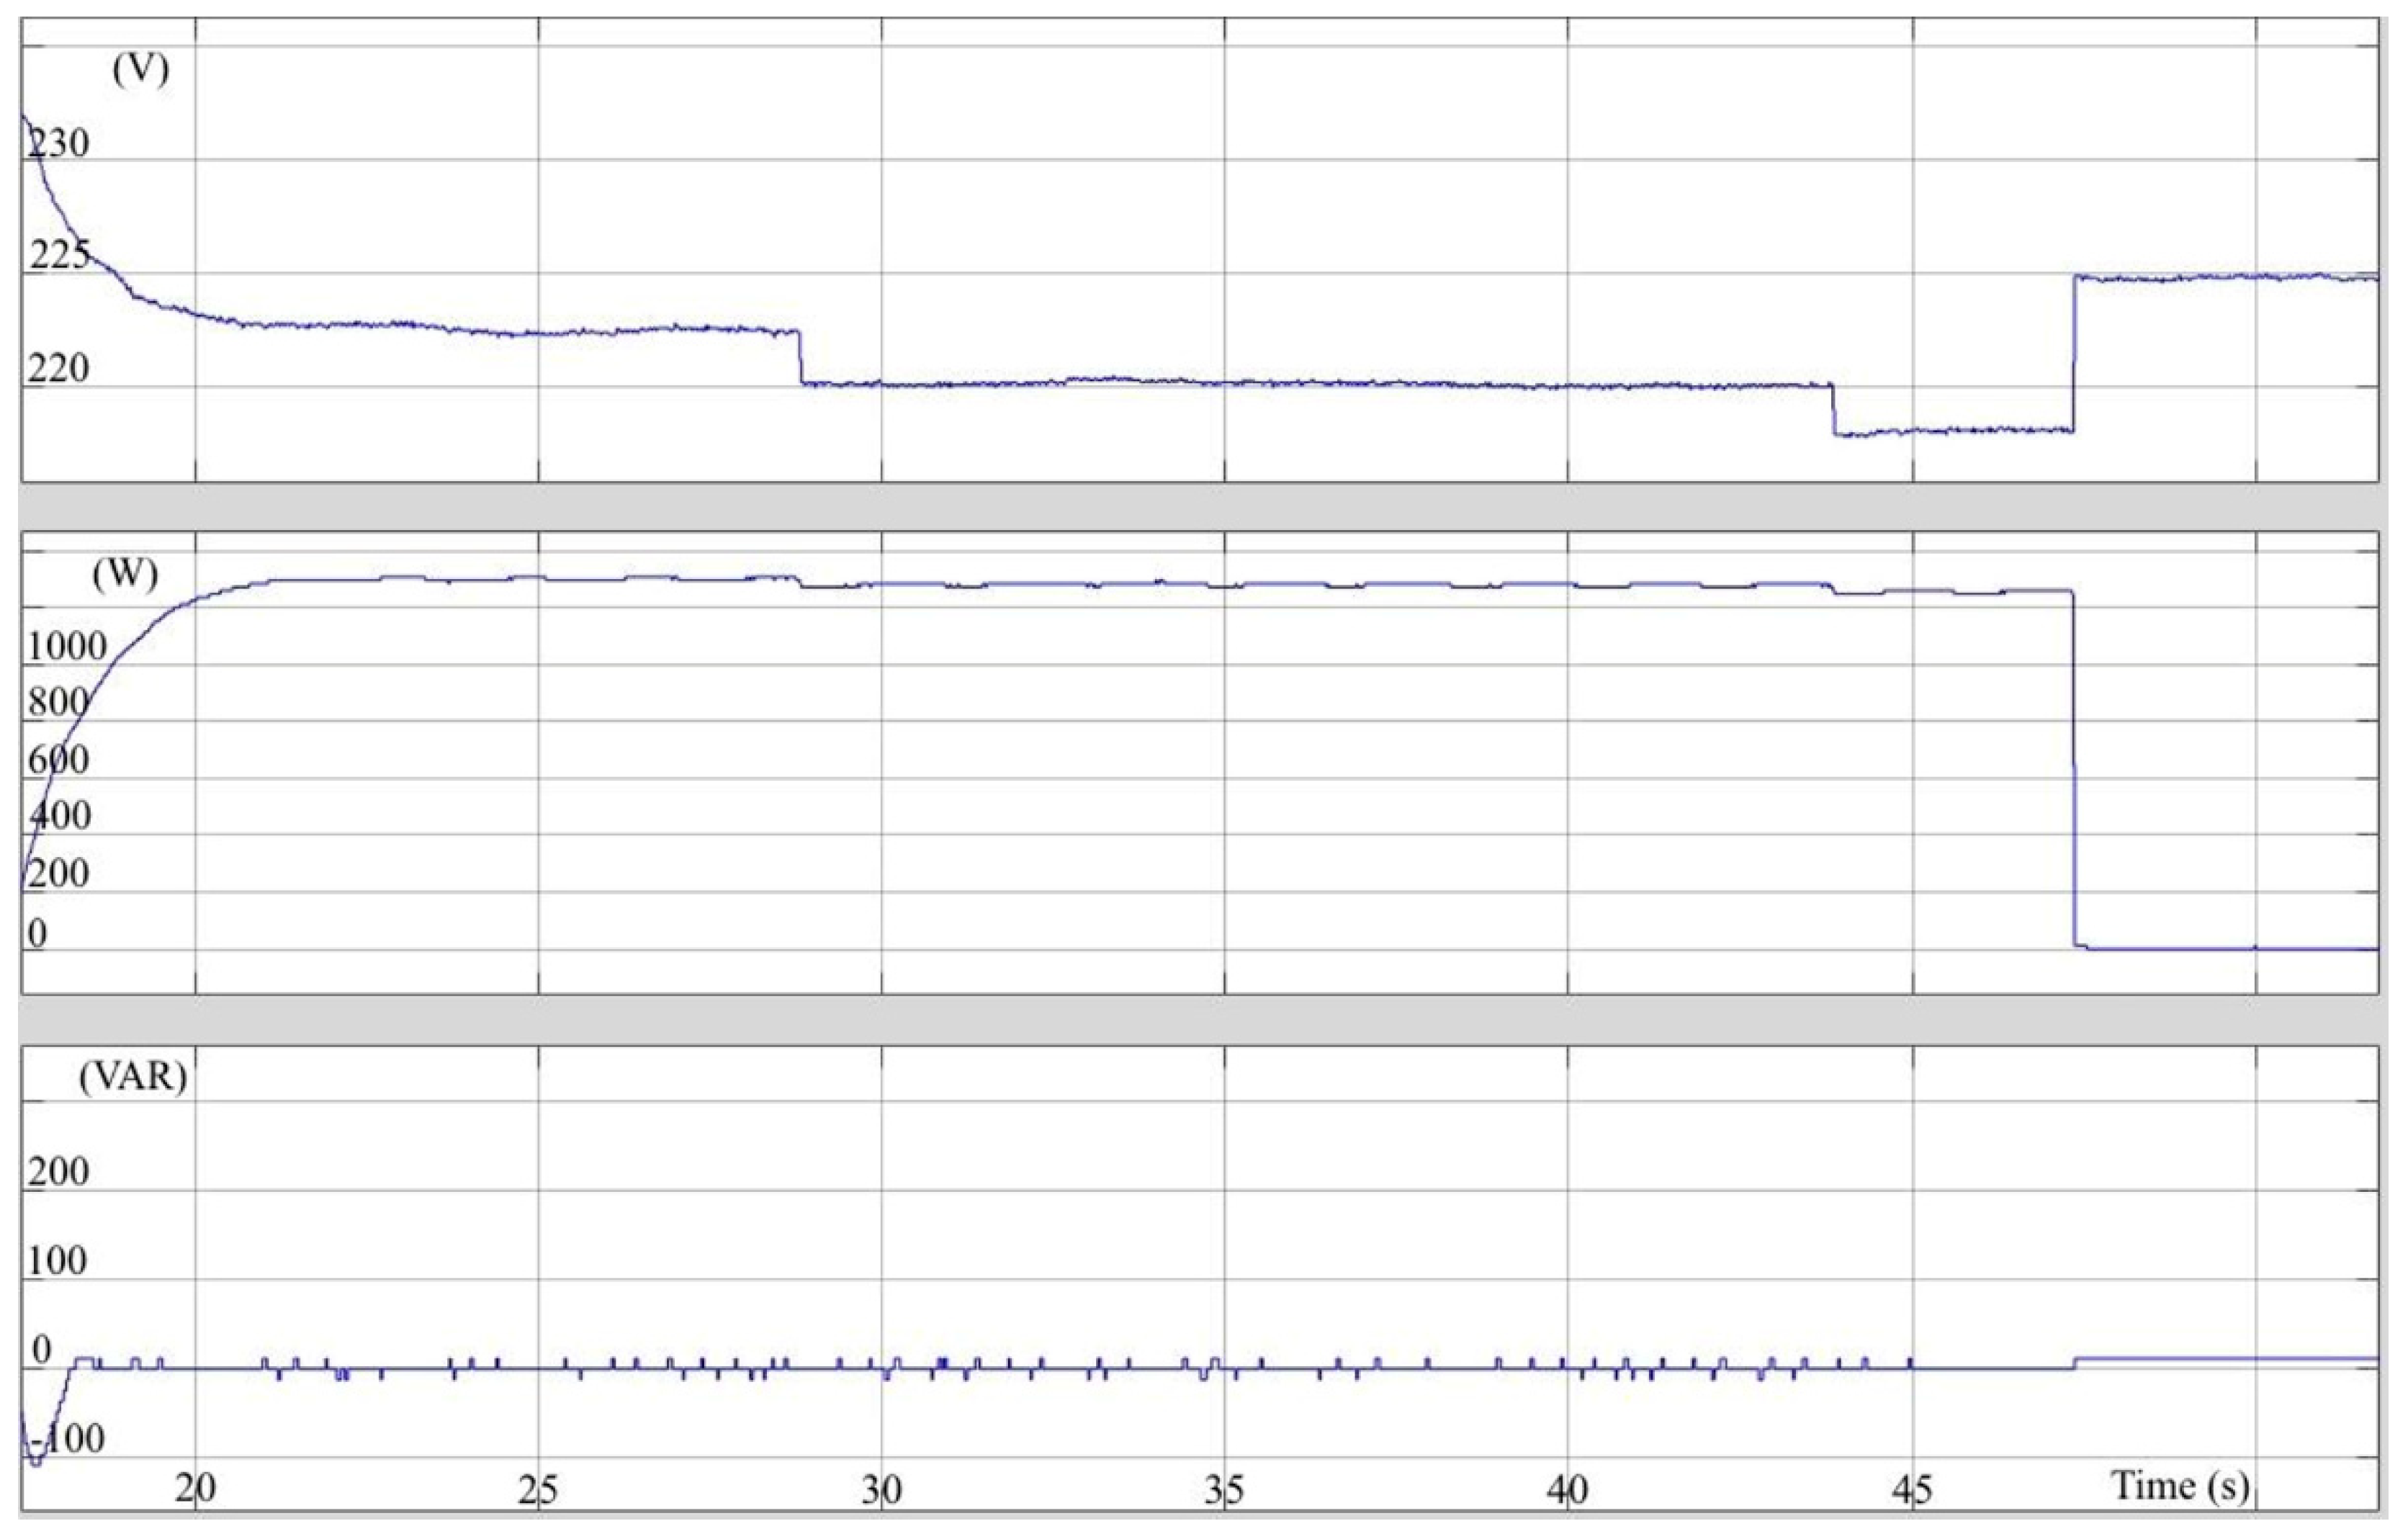
In Figure 19, again, the voltage at the PCC is recorded, this time during two sequential load increments resulting in a 5 V drop at t = 44 s. The Smart Boiler shut-down results to 7 V recovery at t = 47 s. Prior to these two events, there is a gradual voltage drop by 8 V due to the Smart Boiler active power increase from zero to 1 kW. It is evident that in a case where the grid voltage drops below a predefined critical value other Smart Boiler services (e.g., current harmonics mitigation) may be labeled as lower-priority activities, so that the Smart Boiler is forced to revert to idle mode and mitigate this effect. In another alternative option, Smart Boilers’ active power may be drastically reduced, at the expense of lower effectiveness in the harmonics mitigation task.
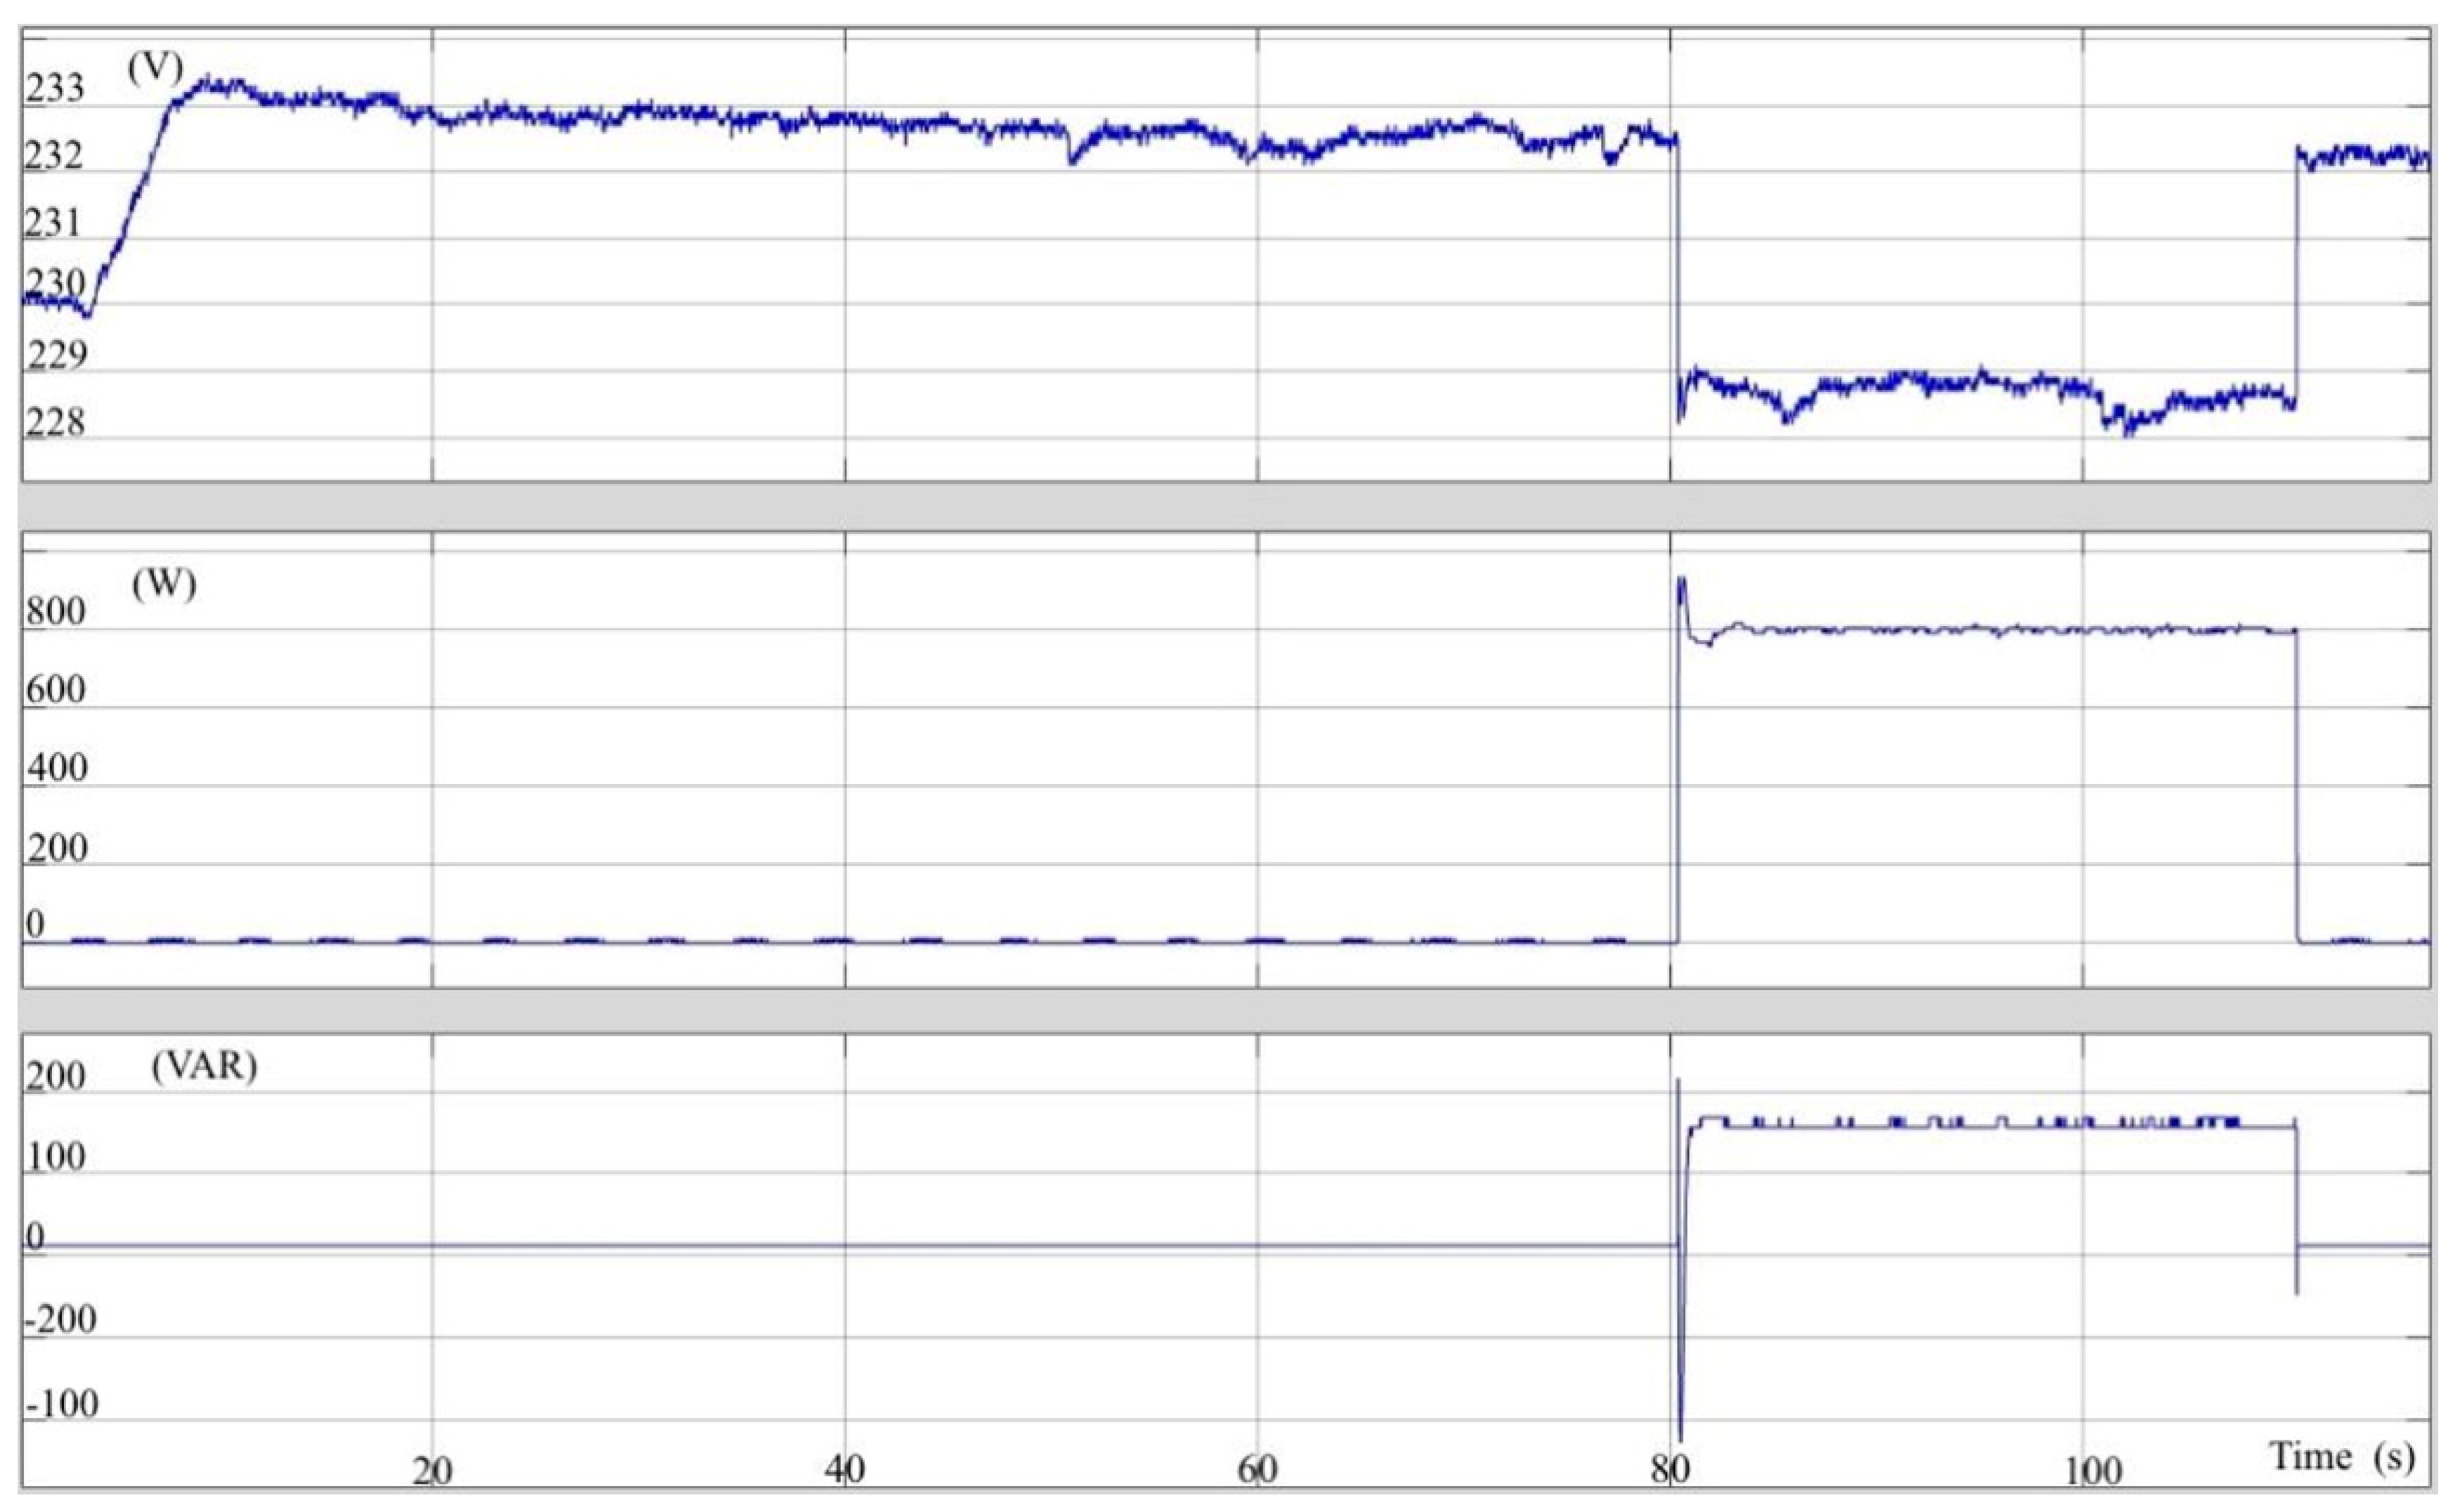
In the next test (Figure 20), the PV array injects 750 W of active power into load line 1, leading to a local voltage rise of approximately 2.5 V at the PCC. With the operation of SB1 at P = 800 W and Q = +150 VAR at t = 80 s, the voltage is regulated at 229 V and returns back to its previous value when the SB is deactivated at t = 110 s.
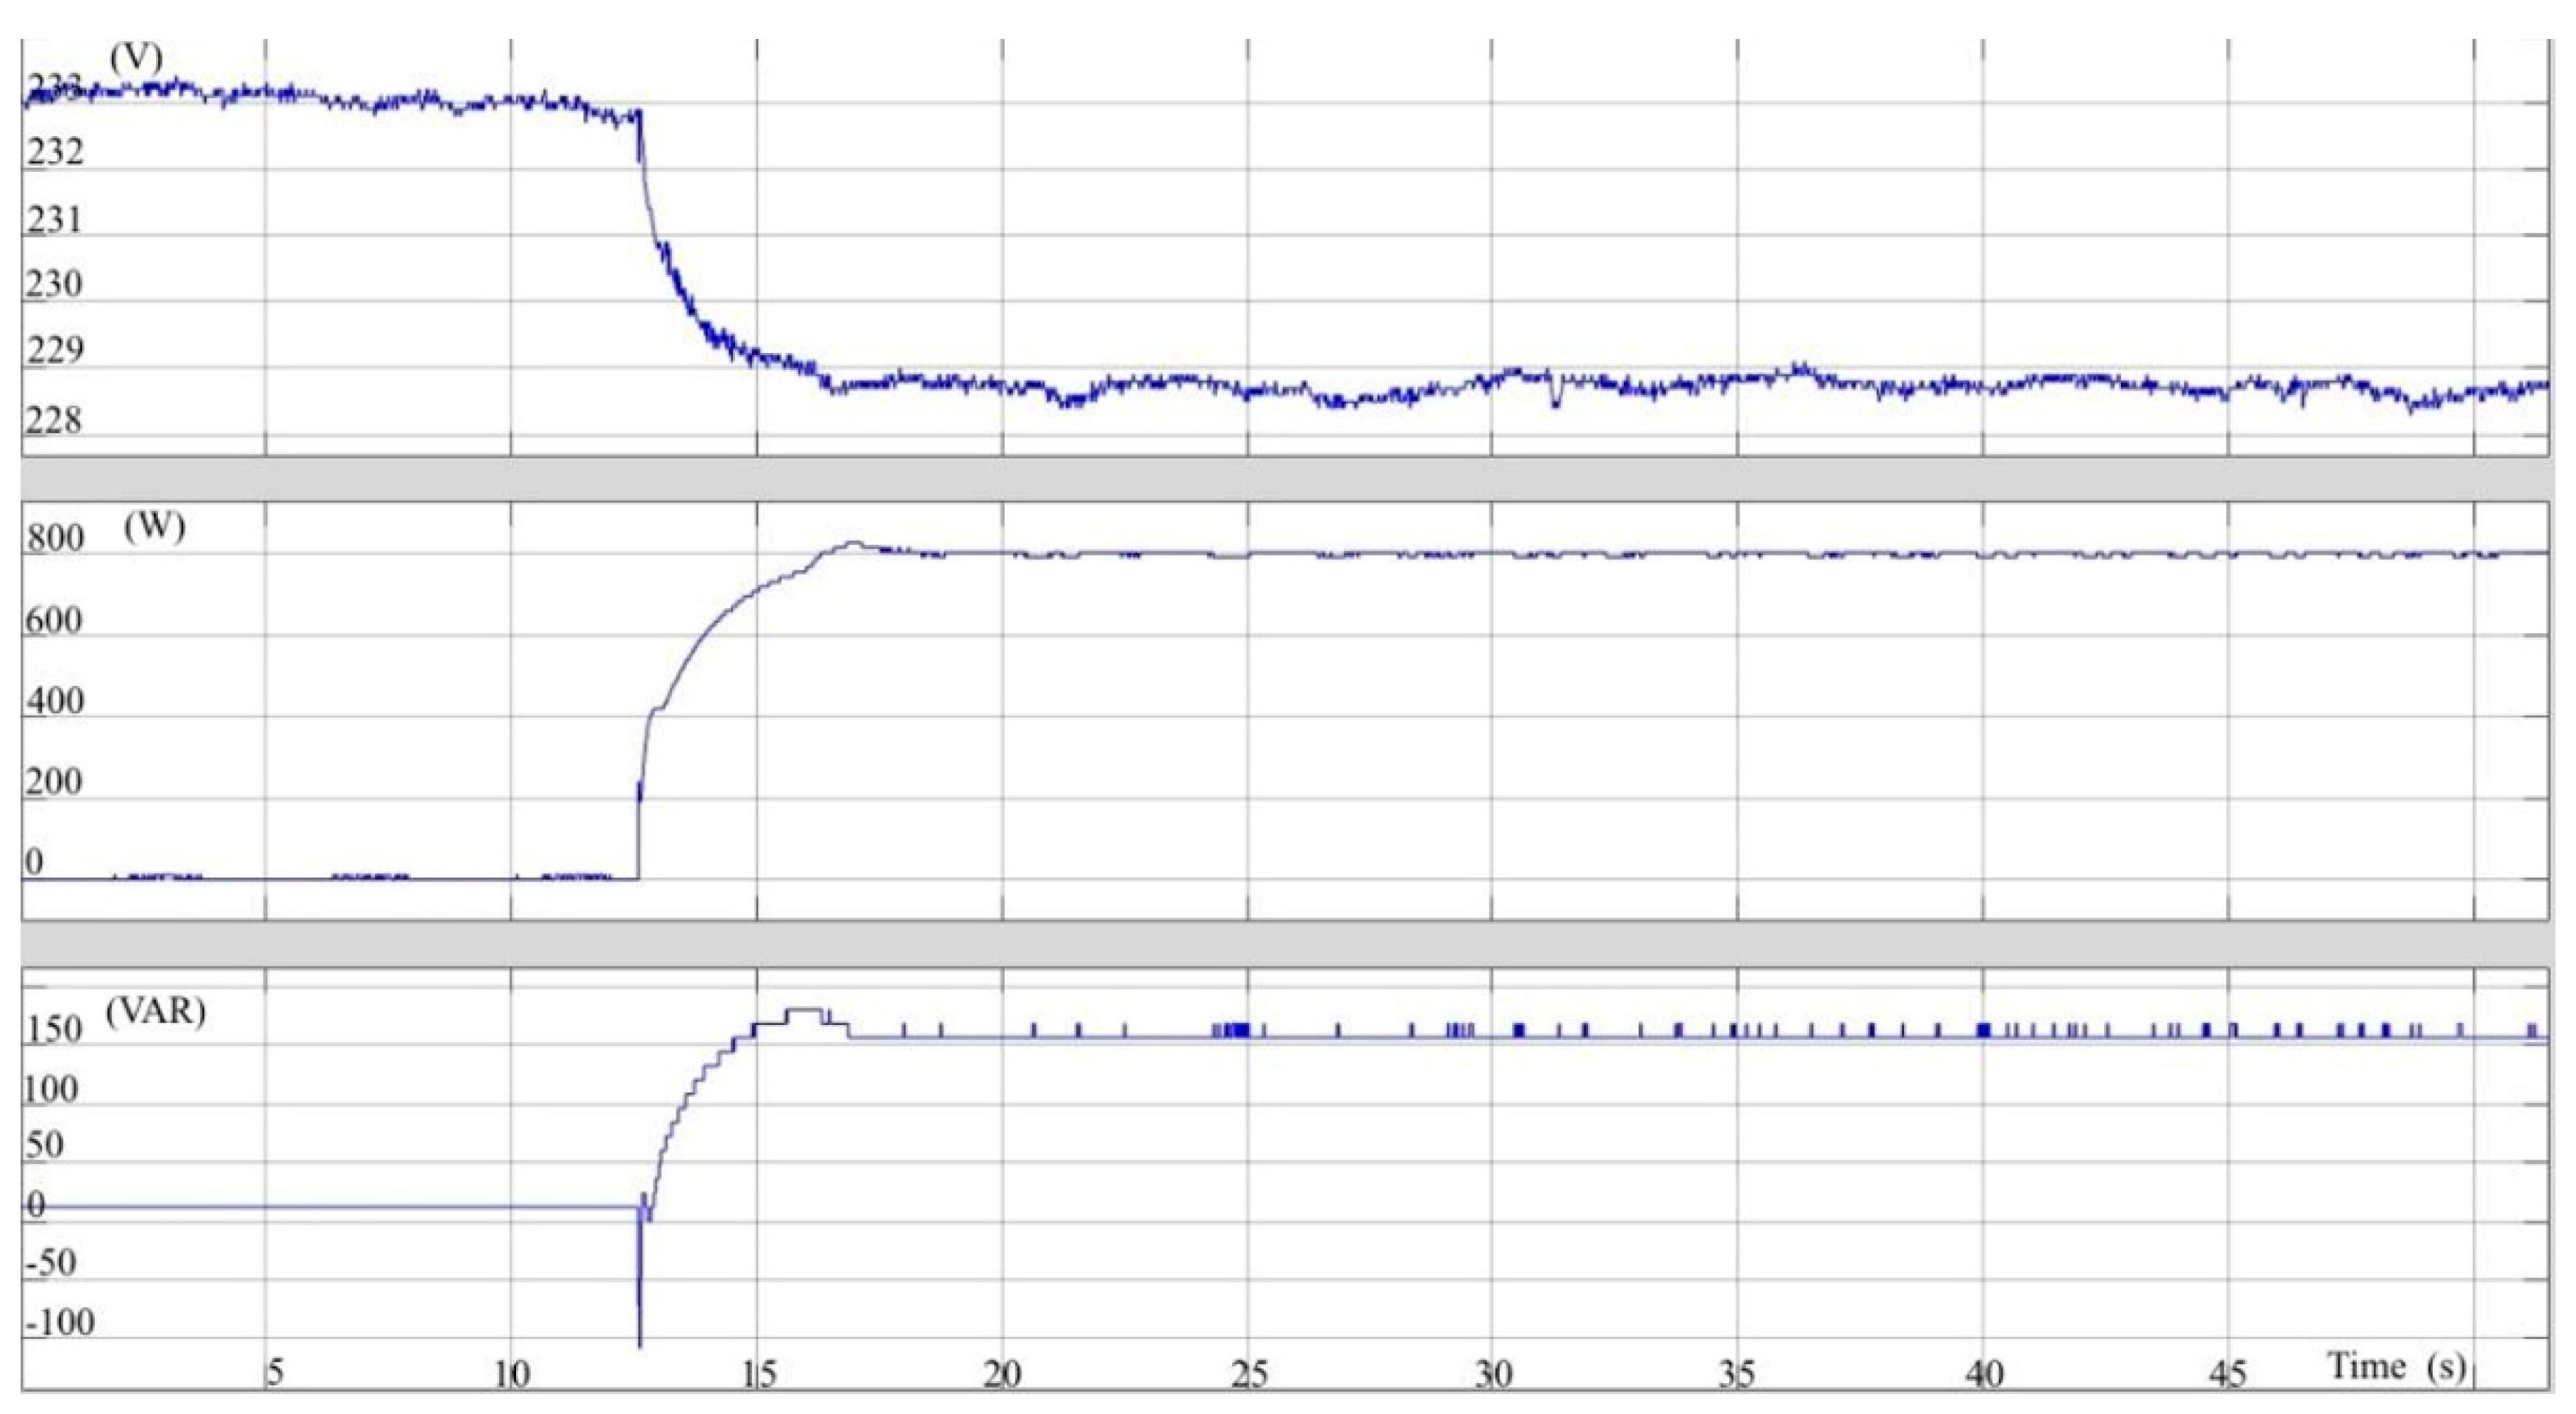
In a similar test, with the difference that the PV power reaches 800 W, a zoom-in at the moment when the SB turns on (Figure 21) reveals that the response time for the voltage regulation is about three seconds. One extra second is needed by the time the DSO sends the command for this action to the time the SB starts its control action. However, as explained in Section 4, this time depends on several factors related to the network speed and the computation infrastructure handling communications and control centrally.
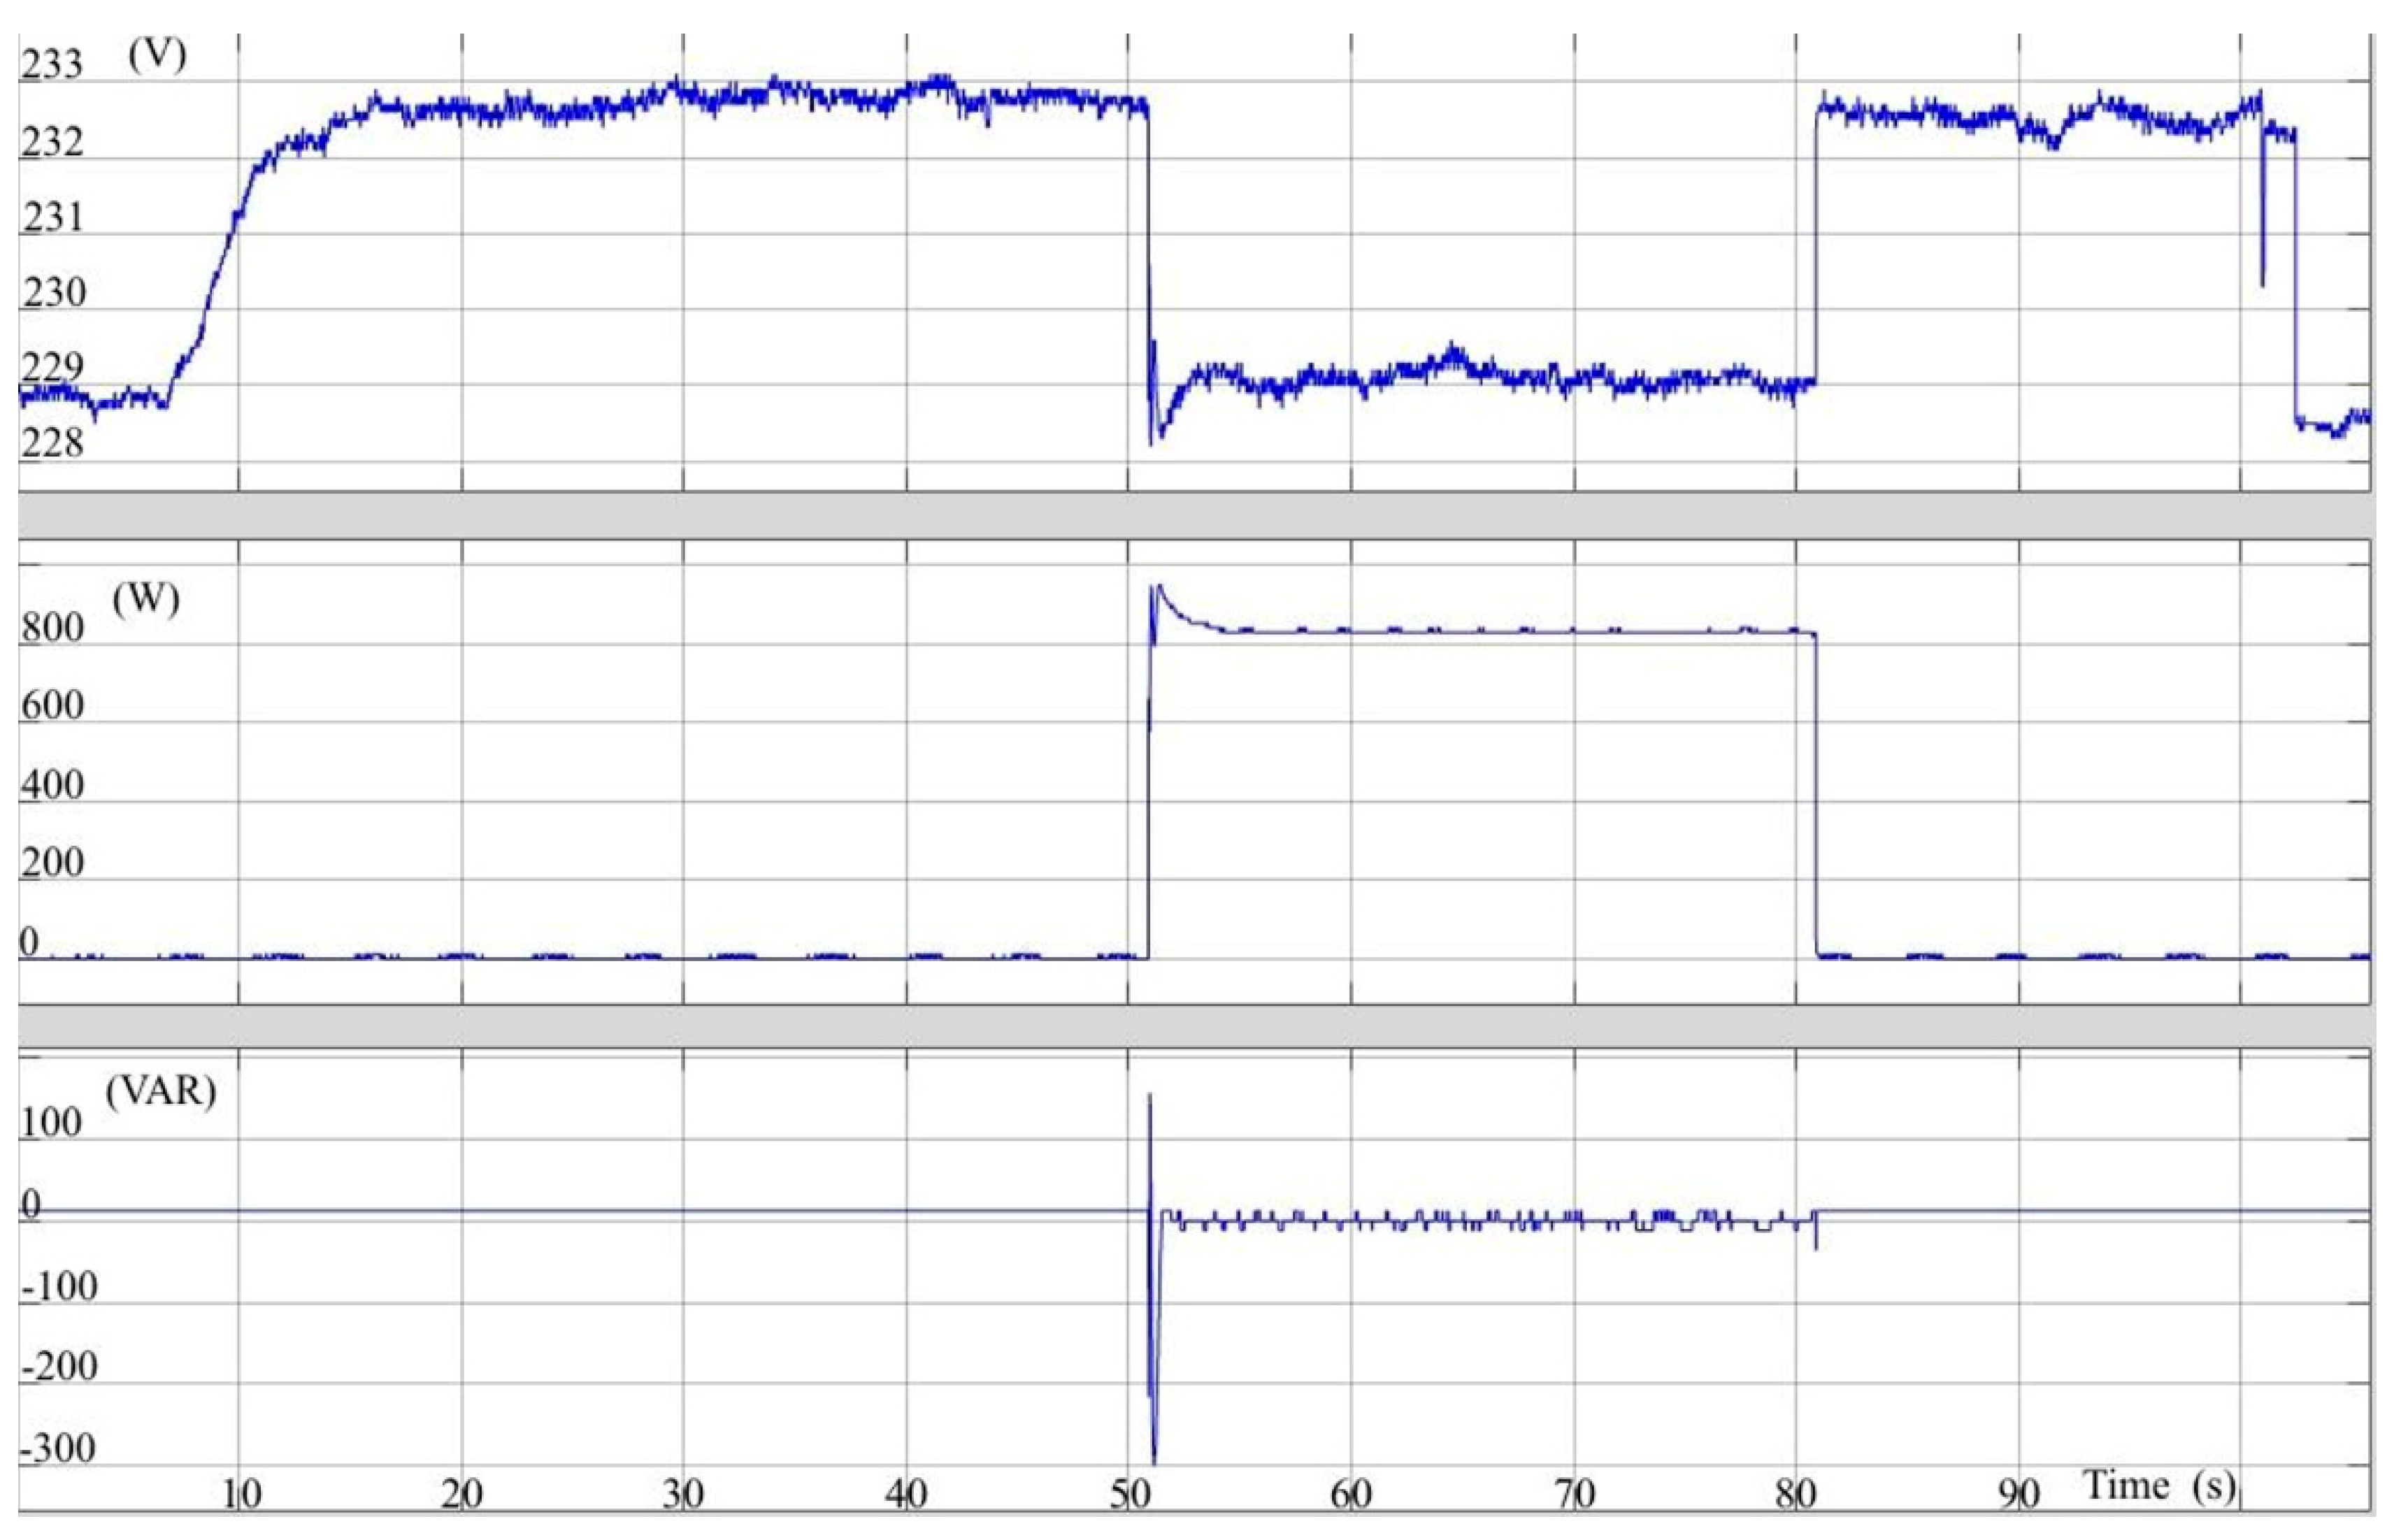
The test has been equally successful when the SB absorbs only active power (Figure 22). This fact verifies that the active power flow has the main role in voltage regulation due to the resistive nature of distribution grids; reactive power consumption further increases the voltage drop via the impact it has on total current. More specifically, it takes 1000 W and −400 VAR (reactive power generation) to achieve a 1 V rise, whilst 800 W are enough to cause a 3.5 V drop. However, it is not just the voltage difference to be achieved the only decisive factor that determines the proper P and Q values for the SB when a specific value voltage difference regulation must be addressed; the location of the disturbance cause and its distance from the SB is another. As an example, the voltage rise at the PCC due to active power injection from the PV connected in load line 1 is expected to be mitigated more effectively from a SB connected to load line 1 rather than a SB connected to load line 2 (adjacent building), due to the impedance of the two lines. However, these two impedances are negligible in the implemented testbed wiring.
Μore complicated scenarios could be investigated, for example, with numerous SBs emulating a widespread application case, non-negligible impedance connection of the several virtual buildings to the PCC, and P-Q demand well out of the capability range of the available SBs. Indeed, this would help develop algorithms of optimum SB coordination, with the interrelations, prioritization, and scheduling of the several offered services well defined. However, such an increase in the number of the test case scenarios, capable of creating an input data set appropriate for the development of a reliable optimal-operation algorithm, would also require a significant expansion in testbed capacity, with more SBs, non-ideal connections between several load lines, more load (variable and constant) measuring devices, intercommunication units, etc. This would expand beyond the purpose of this work, which is to verify the proof of concept of the SB application, and would drastically increase the complexity of the presented results. It is necessary to note at this point that with the increasing number of available SBs, the SB cluster is expected to be more effective. Multiple SBs, at different states (water tank sizes, water temperature, etc.) have been simulated and their ability to cooperate in order to complete such common tasks, seamlessly for the DSO and the end-user, has been verified [9].
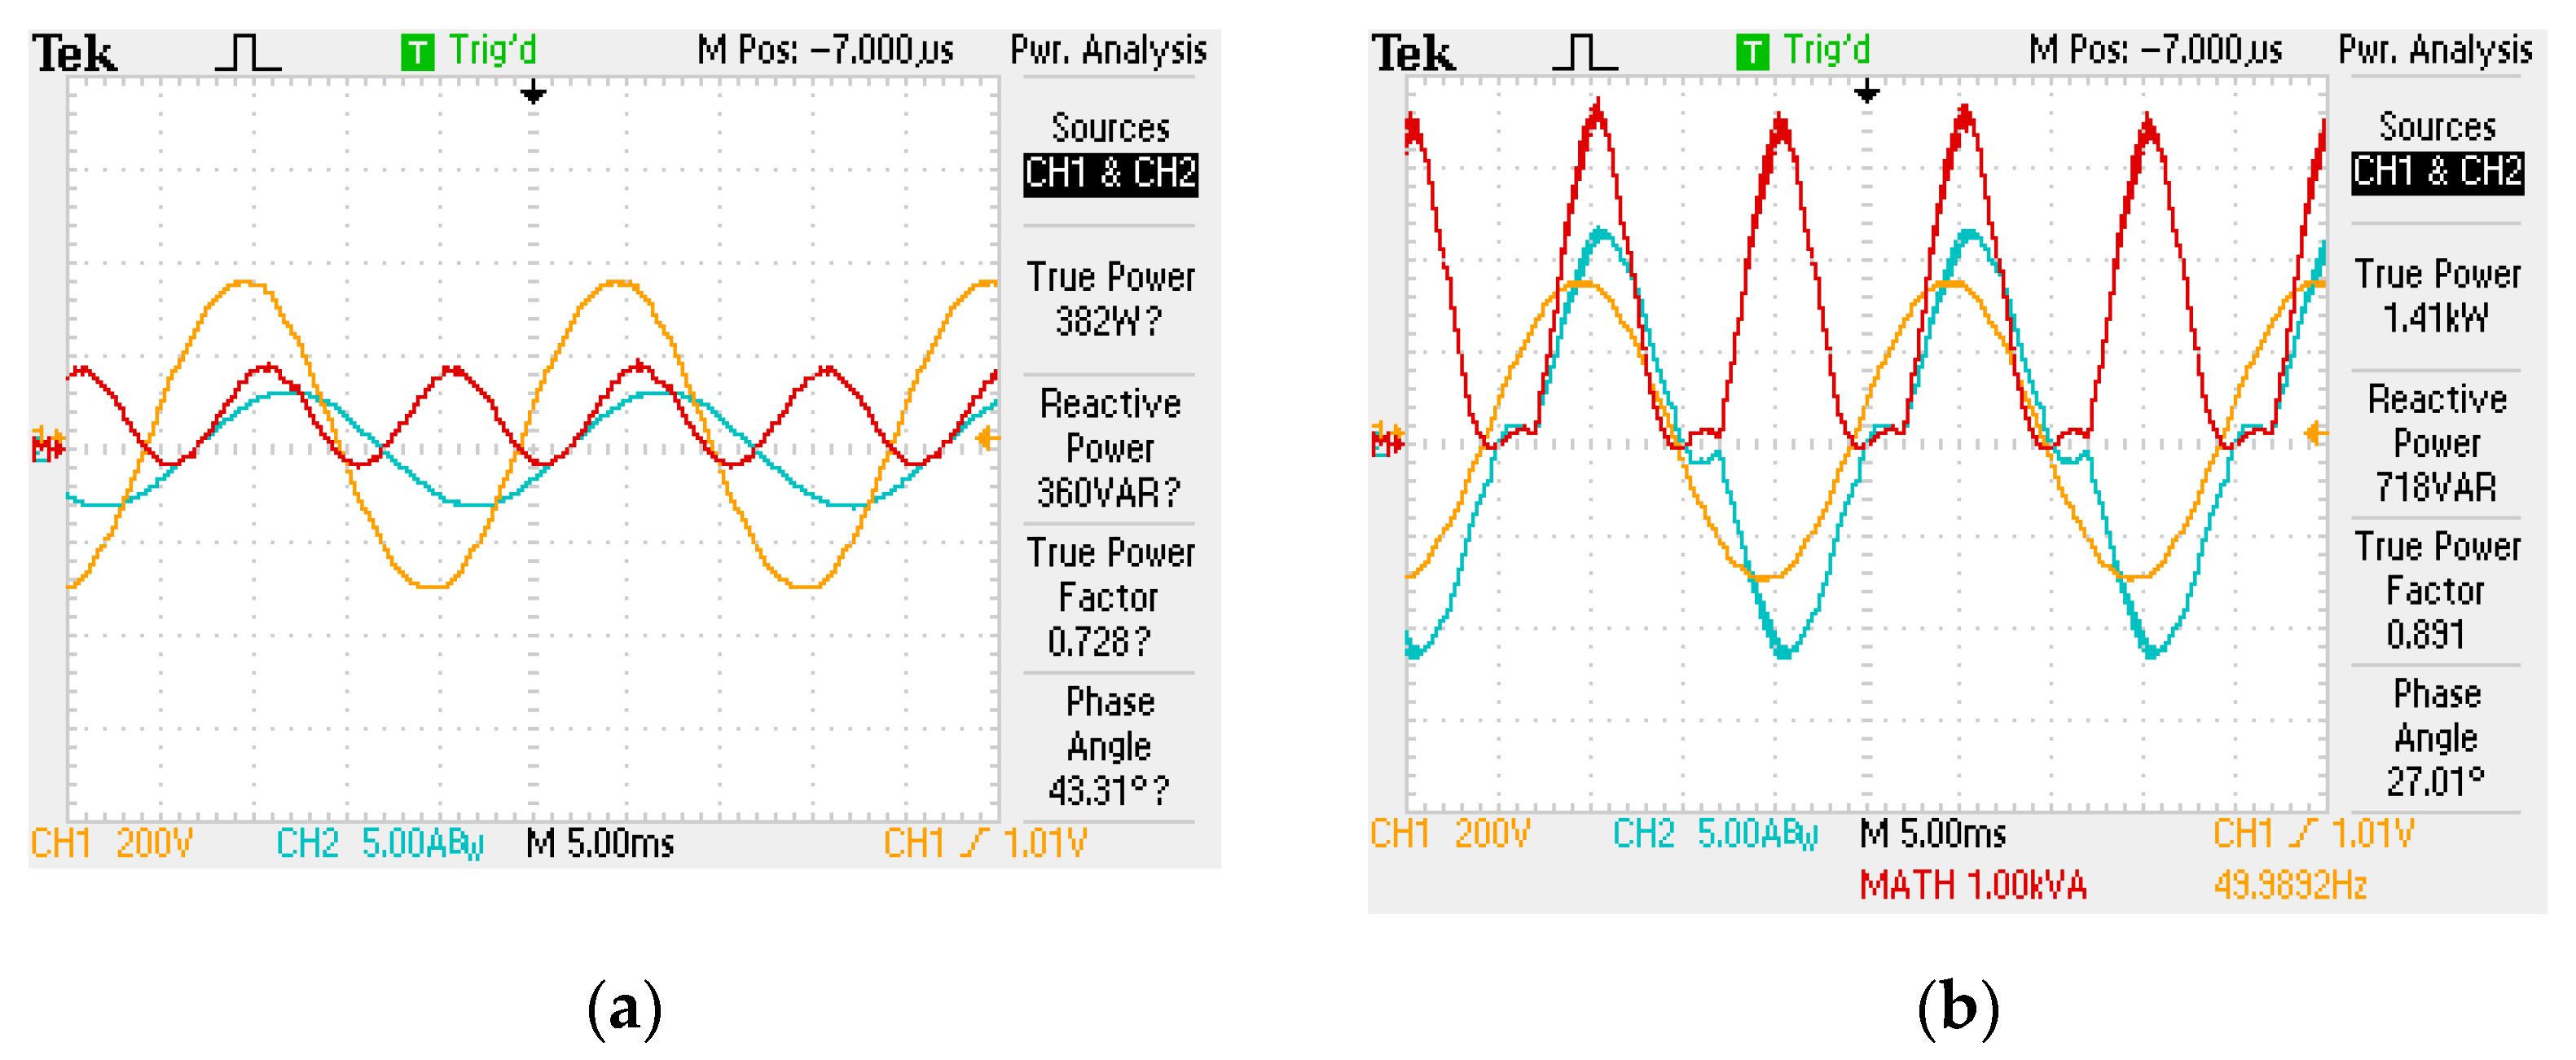
The oscillograms that illustrate the effect of the SB operation on voltage, current and power waveforms are also interesting. In Figure 23a, these three waveforms are recorded at the input connection of the PCC (end of the LV distribution line) in a case of inductive loading (380 W, 360 VAR, and PF = 0.73). In Figure 23b, the SB1 is activated, consuming 1030 W of active power and 360 VAR of reactive power in order to regulate the local overvoltage. As a result, the PF improves to 0.89, yet, with the harmonics mitigation mode off, some current distortion is clearly visible.
In Figure 24a, the SB is requested to compensate for the reactive power and consequent overvoltage caused by the capacitive loading of the local micro-grid. The SB achieves an improvement in the PF from 0.90 to 0.98 by providing 1150 W and 500 VAR (Figure 24b). Then, the distorted current waveform is effectively corrected nearly into its normal sinusoidal shape with the harmonics mitigation mode activated (Figure 24c).
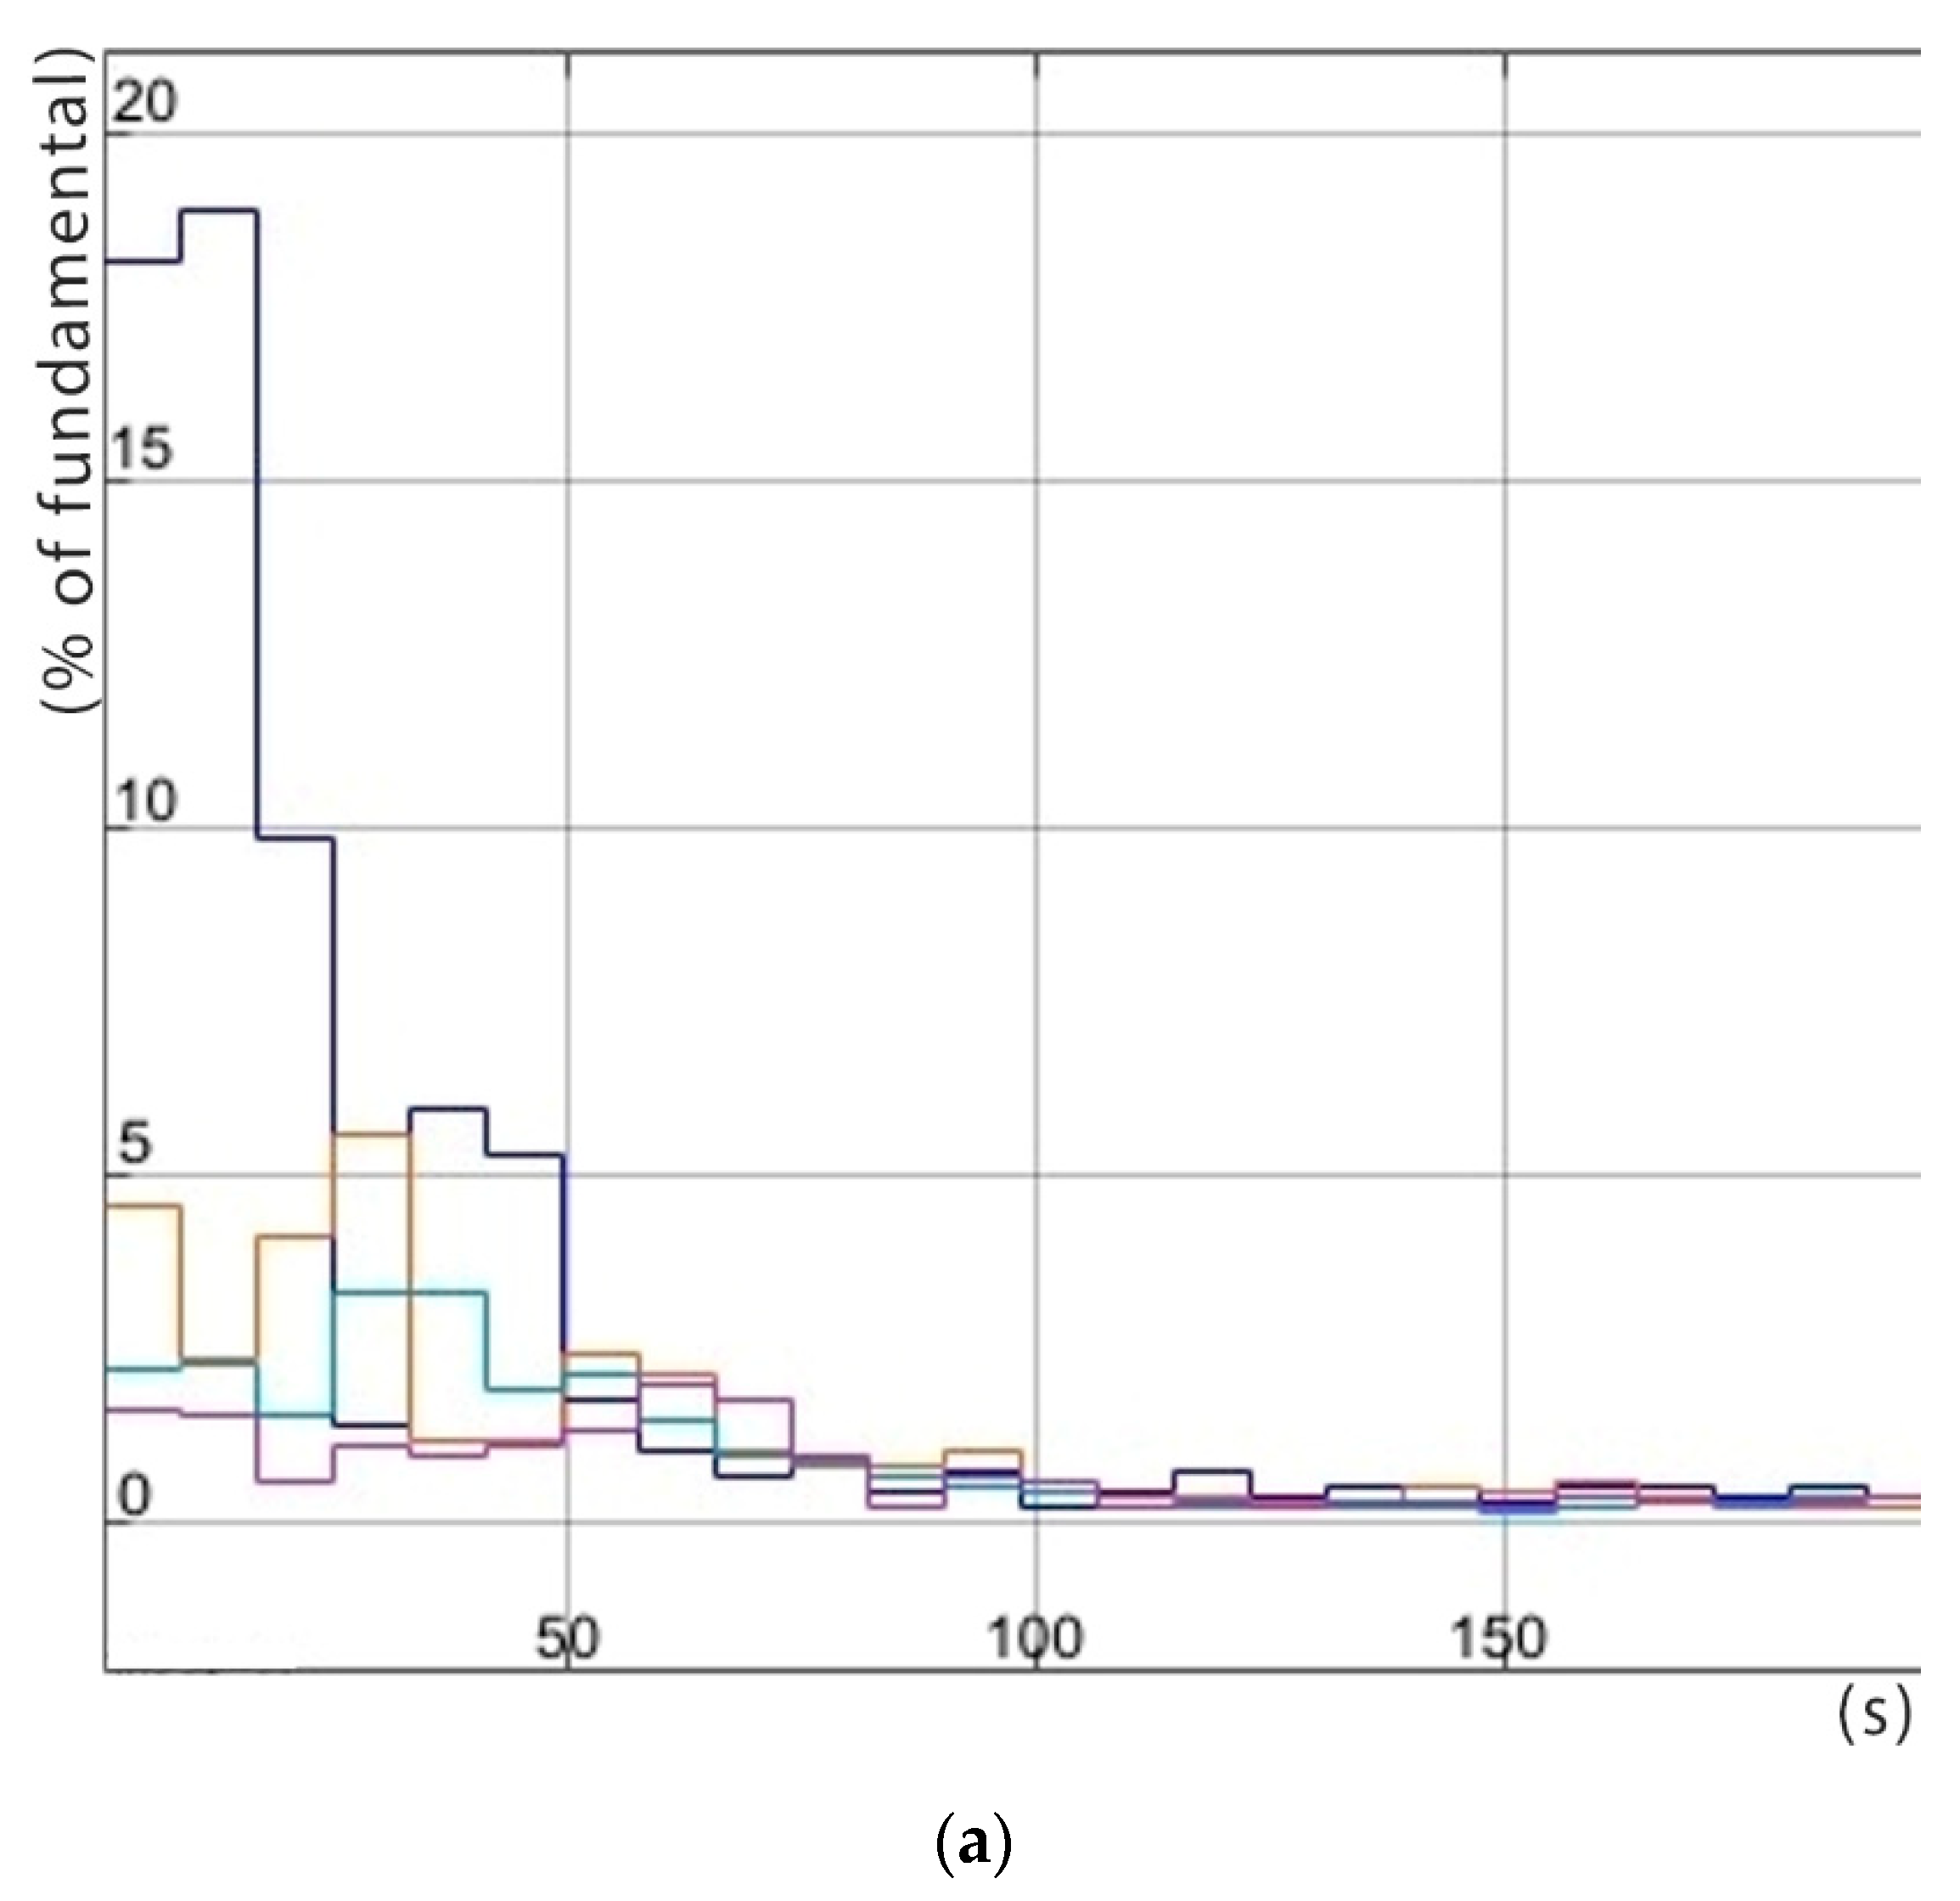
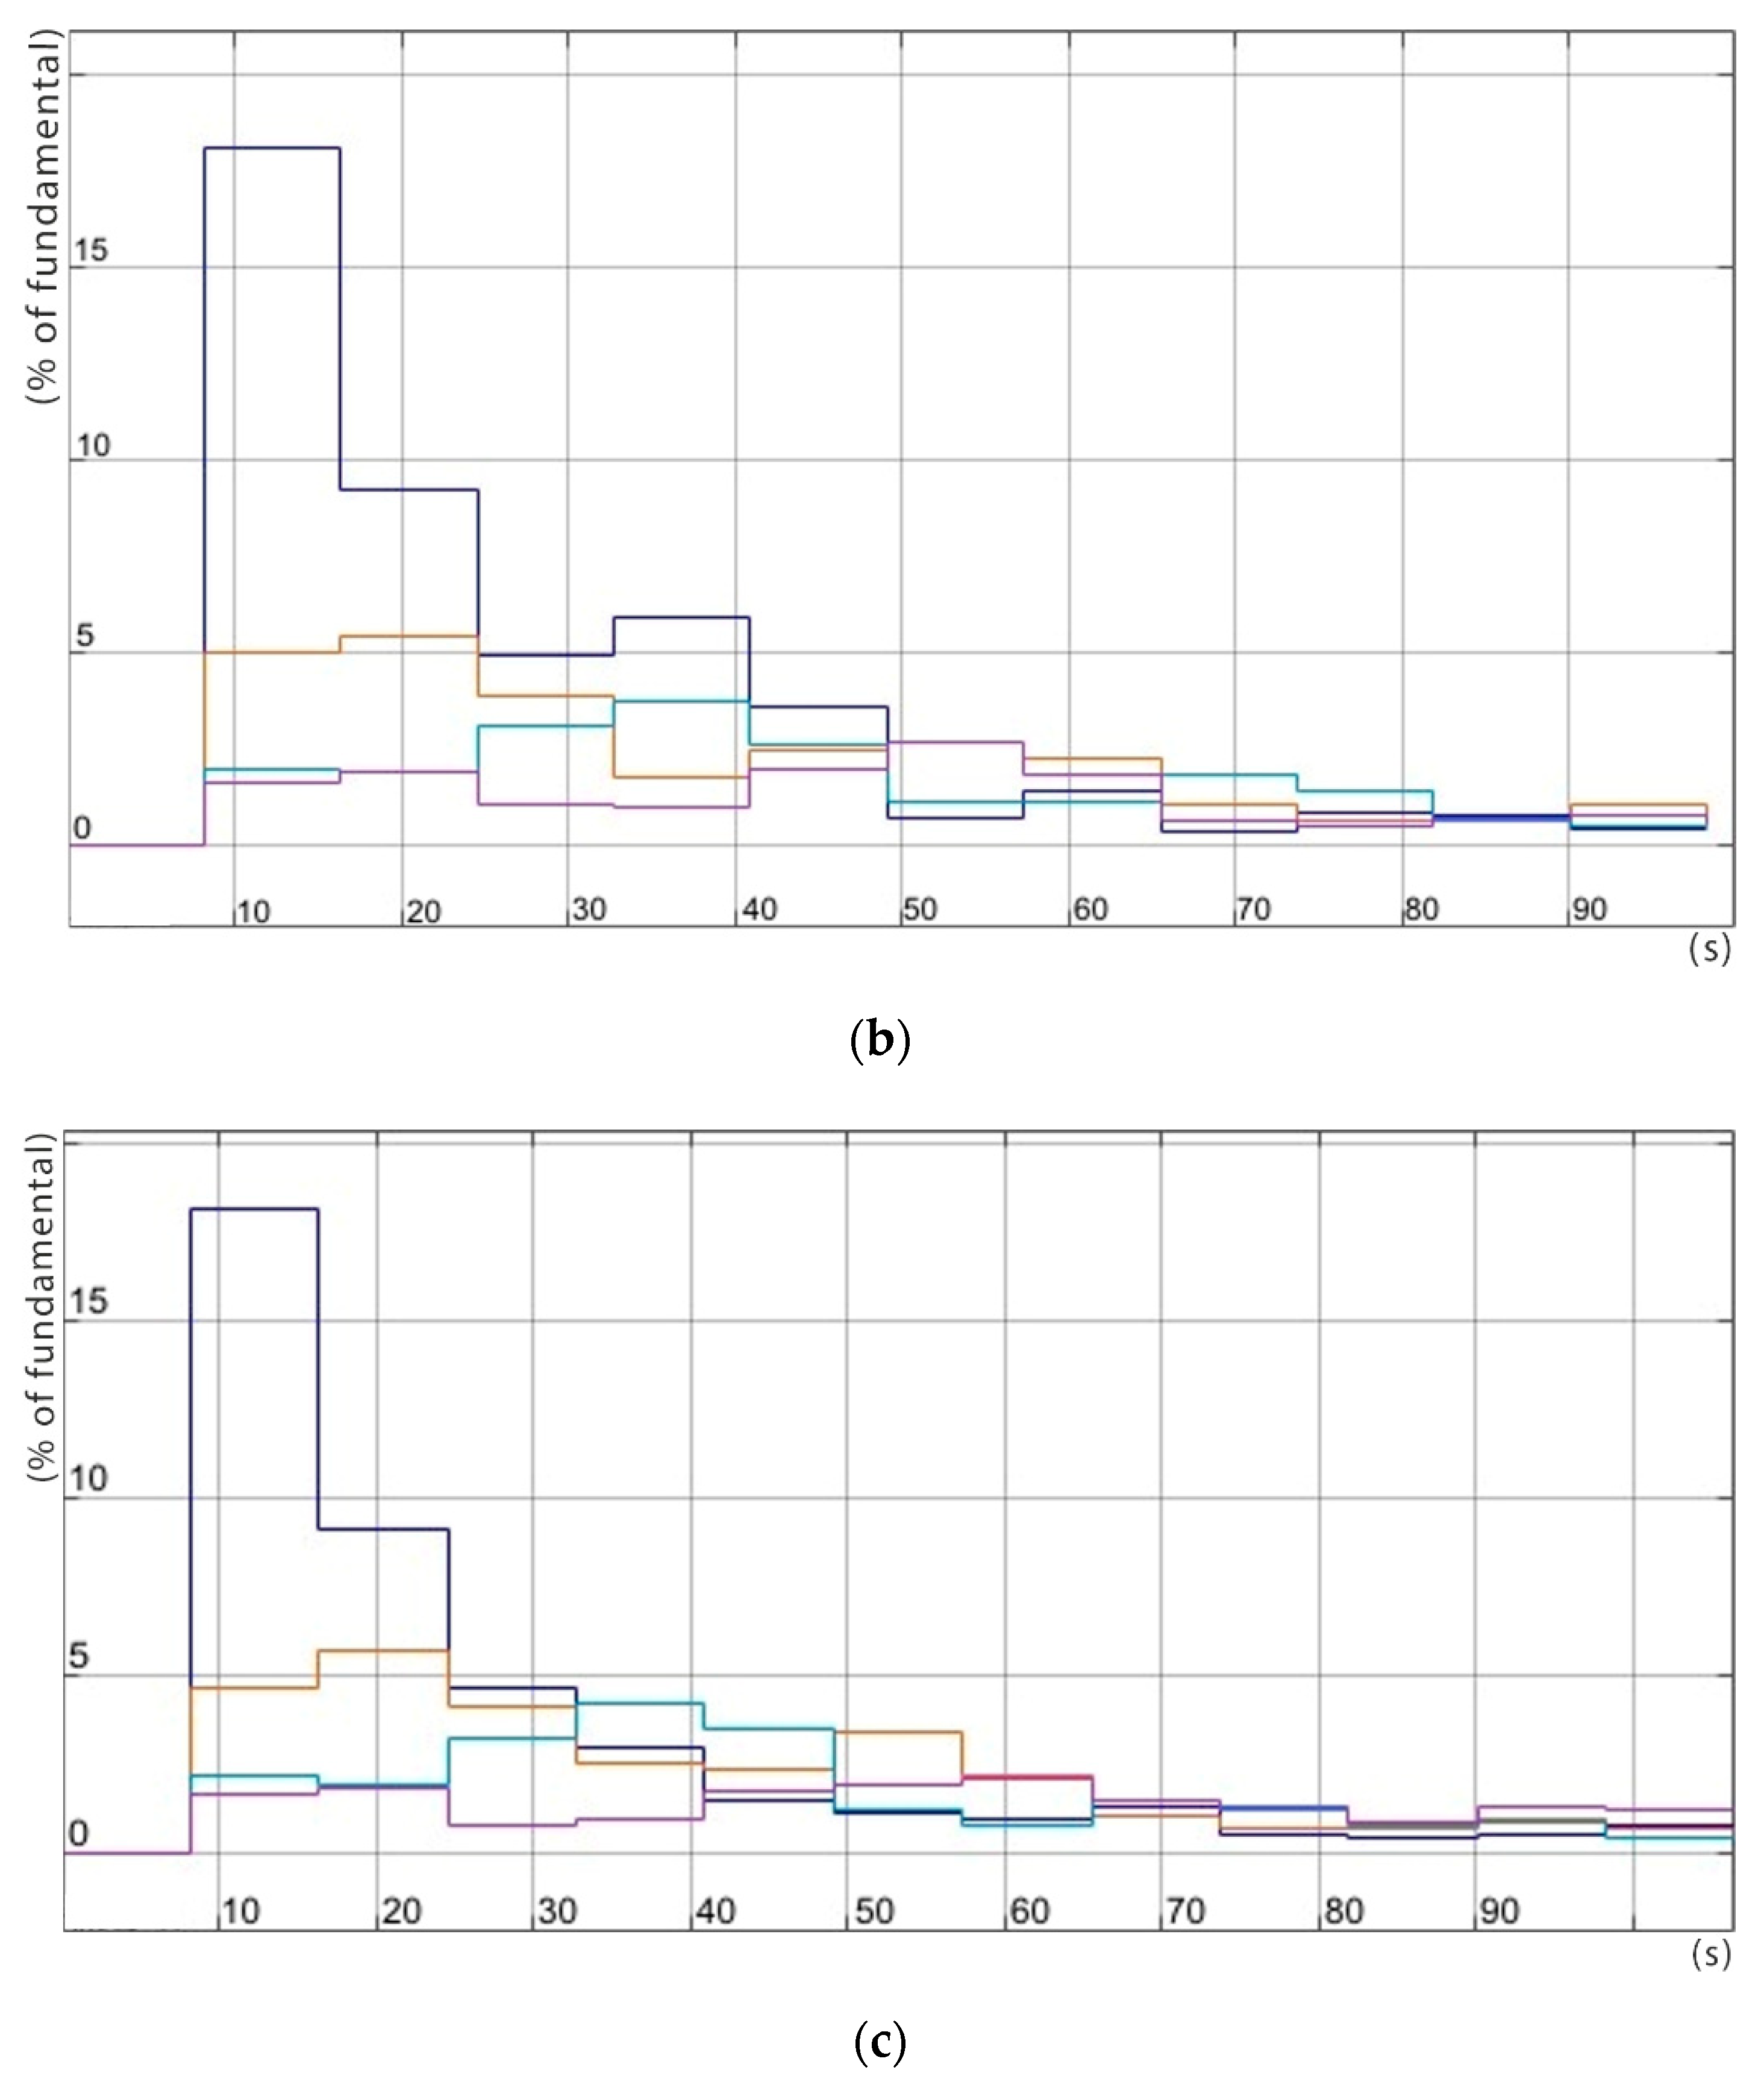
The series of recordings in Figure 25 illustrate the progressive mitigation of the input current harmonics under several random initial conditions. Although sampling and re-calculation of the harmonics amplitude occurs every 0.8192 s, one minute is approximately required for the suppression of all harmonics below 5%, as well as with the Total Harmonic Distortion (THD). An interesting observation is that the act of injecting a mirror harmonic results in a temporary back-lash of the cancelling process for the neighboring order harmonics. This effect is more prominent when acting from higher order harmonics to lower order harmonics, rather than the opposite.
It is evident from the previous graphs that the response time of P and Q control is of the order of a few seconds. However, simultaneous control of all three quantities causes some significant delays in the control process, which is currently under the spotlight of the research team. For example, there is a conflict between the Q and harmonics control modes, due to the fact that the injection of a mirror harmonic inevitably leads to injection of its adjacent odd harmonics, too. Hence, when low-order harmonics cancellation is attempted (e.g., third and fifth order) the effect on the fundamental component is non-negligible and leads to a temporary deregulation of the Q control. This latter fact means that more iterations are necessary for the Q control to respond to the new data. Moreover, the fundamental current component phase shift during Q control requires the phase of the injected current harmonics to be constantly re-calculated. For reasons like these, the PI control for the reactive power is set to respond at a slower pace when harmonics control is also active; this may be translated into some tens of seconds in overall response time, as in Figure 25. This time span may be acceptable if we consider only the excess energy storage concept. However, grid quality services may require a faster response of the order of a few seconds. More sophisticated algorithms are currently under investigation, which are expected to make control fast enough for such applications.

7. Conclusions

In this paper, the concept of upgrading some non-critical resistive loads, e.g., water boilers, so as to provide power quality services to the grid and economic operation to the end-user, is presented and experimentally validated. The provided services to the grid include the following: (a) reactive power compensation; (b) voltage level stabilization; and (c) harmonic compensation. The end-user, in addition to expected compensation for the services provided by his load to the grid, may also expect the following: (d) short-term storage of locally produced excess renewable energy and (e) better quality of supply at his feeder. The hardware components, installed software, and communications scheme of the SB all form a fairly simple and consequently low-cost kit. The proposed upgrade is implemented with the single technical requirement of internet access. Therefore, widespread adoption of the system across the electricity consumers community is possible, but some appropriate incentives should be offered (e.g., compensation for provided services and simple legislature for responsibilities and rights for its usage).
The testbed used for the presented experimental investigation of the SB application has been designed to be flexible and, therefore, easily convertible or expandable, in order to emulate realistic grid operation scenarios with progressively higher complexity.
The experimental results clearly prove that the proposed approach is successful and highly efficient in electricity networks sensitive to generation/consumption variations, e.g., a micro-grid or a Nearly Zero Energy Building. The system’s assigned targets for voltage regulation and current harmonic distortion mitigation are achieved in a matter of seconds, even though further improvements towards both time response and permanent error minimization may be expected.
The communication protocol selected for the integration of the kit in an IoT entity proves to be exceptionally efficient in poor connectivity conditions, even with a huge number of such smart units. This last fact makes the proposed kit an ideal solution to the problem of low-quality voltage in distant or poor-quality grids, as those widely encountered in emerging economies and developing countries.

Author Contributions

Conceptualization, P.N.V. and K.G.G.; methodology, P.N.V. and K.G.G.; software, P.N.V. and E.S.T.; validation, G.S.D., P.N.V., K.G.G. and E.S.T.; formal analysis, G.S.D.; investigation, G.S.D., P.N.V., K.G.G. and E.S.T.; resources, G.S.D., P.N.V., K.G.G. and E.S.T.; data curation, G.S.D., P.N.V., K.G.G. and E.S.T.; writing—original draft preparation, G.S.D.; writing—review and editing, P.N.V., K.G.G. and E.S.T.; visualization, E.S.T.; supervision, P.N.V.; project administration, P.N.V.; funding acquisition, P.N.V. and K.G.G. All authors have read and agreed to the published version of the manuscript.

Funding

This research is part of project SUNSETS, supported under the umbrella of the SOLAR-ERA.NET Cofund by the General Secretariat for Research and Technology (GSRT) and the Swedish Energy Agency (SWEA). SOLAR-ERA.NET is supported by the European Commission within the EU Framework Programme for Research and Innovation HORIZON 2020 (Cofund ERA-NET Action, grant N° 691664).

Data Availability Statement

The original contributions presented in the study are included in the article, further inquiries can be directed to the corresponding author.

Acknowledgments

The authors would like to thank Maltezos SA and Konstantinos Vrellis, especially, for providing significant parts of the thermal system and the technical advice concerning the experiments performed in this work.

Conflicts of Interest

The authors declare no conflict of interest.

References

  1. Directive (EU) 2023/2413 of the European Parliament and of the Council. Official Journal of the European Union, L Series, Found in European Legislation Identifier. 2023. Available online: http://data.europa.eu/eli/dir/2023/2413/oj (accessed on 18 April 2024).
  2. Mountain, B.; Szuster, P. Solar, Solar Everywhere: Opportunities and Challenges for Australia’s Rooftop PV Systems. IEEE Power Energy Mag. 2015, 13, 53–60. [Google Scholar] [CrossRef]
  3. Giordano, F.; Ciocia, A.; Di Leo, P.; Mazza, A.; Spertino, F.; Tenconi, A.; Vaschetto, S. Vehicle-to-Home Usage Scenarios for Self-Consumption Improvement of a Residential Prosumer with Photovoltaic Roof. IEEE Trans. Ind. Appl. 2020, 56, 2945–2956. [Google Scholar] [CrossRef]
  4. Khouzam, K.Y. Technical and economic assessment of utility interactive PV systems for domestic applications in South East Queensland. IEEE Trans. Energy Convers. 1999, 14, 1544–1550. [Google Scholar] [CrossRef]
  5. Kroposki, B. Integrating high levels of variable renewable energy into electric power systems. J. Mod. Power Syst. Clean Energy 2017, 5, 831–837. [Google Scholar] [CrossRef]
  6. Chaudhari, K.; Kandasamy, N.K.; Krishnan, A.; Ukil, A.; Gooi, H.B. Agent-Based Aggregated Behavior Modeling for Electric Vehicle Charging Load. IEEE Trans. Ind. Inform. 2019, 15, 856–868. [Google Scholar] [CrossRef]
  7. Li, C.; Yu, X.; Yu, W.; Chen, G.; Wang, J. Efficient Computation for Sparse Load Shifting in Demand Side Management. IEEE Trans. Smart Grid 2017, 8, 250–261. [Google Scholar] [CrossRef]
  8. Tushar, M.H.K.; Zeineddine, A.W.; Assi, C. Demand-Side Management by Regulating Charging and Discharging of the EV, ESS, and Utilizing Renewable Energy. IEEE Trans. Ind. Inform. 2018, 14, 117–126. [Google Scholar] [CrossRef]
  9. Vovos, P.N.; Georgakas, K.G. Smart Boilers: Grid Support Services from Non-Critical Loads. J. Power Energy Eng. 2020, 8, 23–45. [Google Scholar] [CrossRef]
  10. Shen, J.; Jiang, C.; Li, B. Controllable Load Management Approaches in Smart Grids. Energies 2015, 8, 11187–11202. [Google Scholar] [CrossRef]
  11. Serban, I.; Ion, C.P. Supporting the Dynamic Frequency Response in Microgrids by Means of Active Loads. In Proceedings of the 42nd Annual Conference of the IEEE Industrial Electronics Society (IECON), Florence, Italy, 23–26 October 2016; pp. 3781–3786. [Google Scholar] [CrossRef]
  12. Klaassen, E.; Zhang, Y.; Lampropoulos, I.; Slootweg, H. Demand Side Management of Electric Boilers. In Proceedings of the 3rd IEEE PES Innovative Smart Grid Technologies Europe (ISGT Europe), Berlin, Germany, 14–17 October 2012; pp. 1–6. [Google Scholar] [CrossRef]
  13. IEC 62477-1; Safety requirements for power electronic converter systems and equipment—Part I: General. International Electrotechnical Comission: Geneva, Switzerland, 2022.
  14. IEC 61000-6; EMC—Part 6-2: Immunity Standard for Industrial Environments. International Electrotechnical Comission: Geneva, Switzerland, 2016.
  15. IEC 61000-6; EMC—Part 6-3: Emission Standard for Equipment in Residential Environments. International Electrotechnical Comission: Geneva, Switzerland, 2016.
  16. IEC 63000; Assessment of Electrical and Electronic Products with Respect to the Restriction of Hazardous Substances. International Electrotechnical Comission: Geneva, Switzerland, 2016.
  17. Mishra, B.; Kertesz, A. The Use of MQTT in M2M and IoT Systems: A Survey. IEEE Access 2020, 8, 201071–201086. [Google Scholar] [CrossRef]
  18. Minoli, D.; Sohraby, K.; Occhiogrosso, B. IoT Considerations, Requirements, and Architectures for Smart Buildings—Energy Optimization and Next-Generation Building Management Systems. IEEE Internet Things J. 2017, 4, 269–283. [Google Scholar] [CrossRef]
  19. Verma, A.; Prakash, S.; Srivastava, V.; Kumar, A.; Mukhopadhyay, S.C. Sensing, Controlling, and IoT Infrastructure in Smart Building: A Review. IEEE Sens. J. 2019, 19, 9036–9046. [Google Scholar] [CrossRef]
  20. Metallidou, C.K.; Psannis, K.E.; Egyptiadou, E.A. Energy Efficiency in Smart Buildings: IoT Approaches. IEEE Access 2020, 8, 63679–63699. [Google Scholar] [CrossRef]
  21. Koziolek, H.; Grüner, S.; Rückert, J. A Comparison of MQTT Brokers for Distributed IoT Edge Computing. In Software Architecture, Proceedings of the 14th European Conference, ECSA 2020, L’Aquila, Italy, 14–18 September 2020; Lecture Notes in Computer Science; Jansen, A., Malavolta, I., Muccini, H., Ozkaya, I., Zimmermann, O., Eds.; Springer: Cham, Switzerland, 2020; Volume 12292. [Google Scholar] [CrossRef]
  22. O’Mahony, D.; Doyle, D. Reaching 5 Million Messaging Connections: Our Journey with Kubernetes, December 2018. Available online: https://www.slideshare.net/ConnectedMarketing/reaching-5-million-messaging-connections-our-journey-with-kubernetes-126143229 (accessed on 5 February 2024).
  23. Sommer, P.; Schellroth, F.; Fischer, M.; Schlechtendahl, J. Message-oriented middleware for industrial production systems. In Proceedings of the International Conference on Automation Science and Engineering (CASE), Munich, Germany, 20–24 August 2018; pp. 1217–1223. [Google Scholar]
  24. Mishra, B.; Mishra, B.; Kertesz, A. Stress-Testing MQTT Brokers: A Comparative Analysis of Performance Measurements. Energies 2021, 14, 5817. [Google Scholar] [CrossRef]
  25. Setz, B.; Graef, S.; Ivanova, D.; Tiessen, A.; Aiello, M. A Comparison of Open-Source Home Automation Systems. IEEE Access 2021, 9, 167332–167352. [Google Scholar] [CrossRef]
  26. Mpouloumpasis, I.; Vovos, P.; Georgakas, K. Voltage harmonic injection angle optimization for grid current harmonics using a PV converter. IET Power Electron. 2019, 12, 2382–2388. [Google Scholar] [CrossRef]
  27. Katsaprakakis, D.A.; Papadakis, N.; Giannopoulou, E.; Yiannakoudakis, Y.; Zidianakis, G.; Katzagiannakis, G.; Dakanali, E.; Stavrakakis, G.M.; Kartalidis, A. Rational Use of Energy in Sport Centers to Achieving Net Zero—The SAVE Project (Part B: Indoor Sports Hall). Energies 2023, 16, 7308. [Google Scholar] [CrossRef]
  28. Kong, J.; Dong, Y.; Poshnath, A.; Rismanchi, B.; Yap, P.-S. Application of Building Integrated Photovoltaic (BIPV) in Net-Zero Energy Buildings (NZEBs). Energies 2023, 16, 6401. [Google Scholar] [CrossRef]
  29. Yang, J.; Cai, B.; Cao, J.; Wang, Y.; Yang, H.; Zhu, P. Comprehensive Characterization of Energy Saving and Environmental Benefits of Campus Photovoltaic Buildings. Energies 2023, 16, 7152. [Google Scholar] [CrossRef]
  30. Dickert, J.; Domagk, M.; Schegner, P. Benchmark low voltage distribution networks based on cluster analysis of actual grid properties. In Proceedings of the 2013 IEEE Grenoble Conference, Grenoble, France, 16–20 June 2013; pp. 1–6. [Google Scholar] [CrossRef]
  31. Dimitrakakis, G.; Tatakis, E.; Nanakos, A. A simple calorimetric setup for the accurate measurement of losses in power electronic converters. In Proceedings of the 14th European Conference on Power Electronics and Applications, (EPE 2011), Birmingham, UK, 30 August–1 September 2011. No. 744. [Google Scholar]
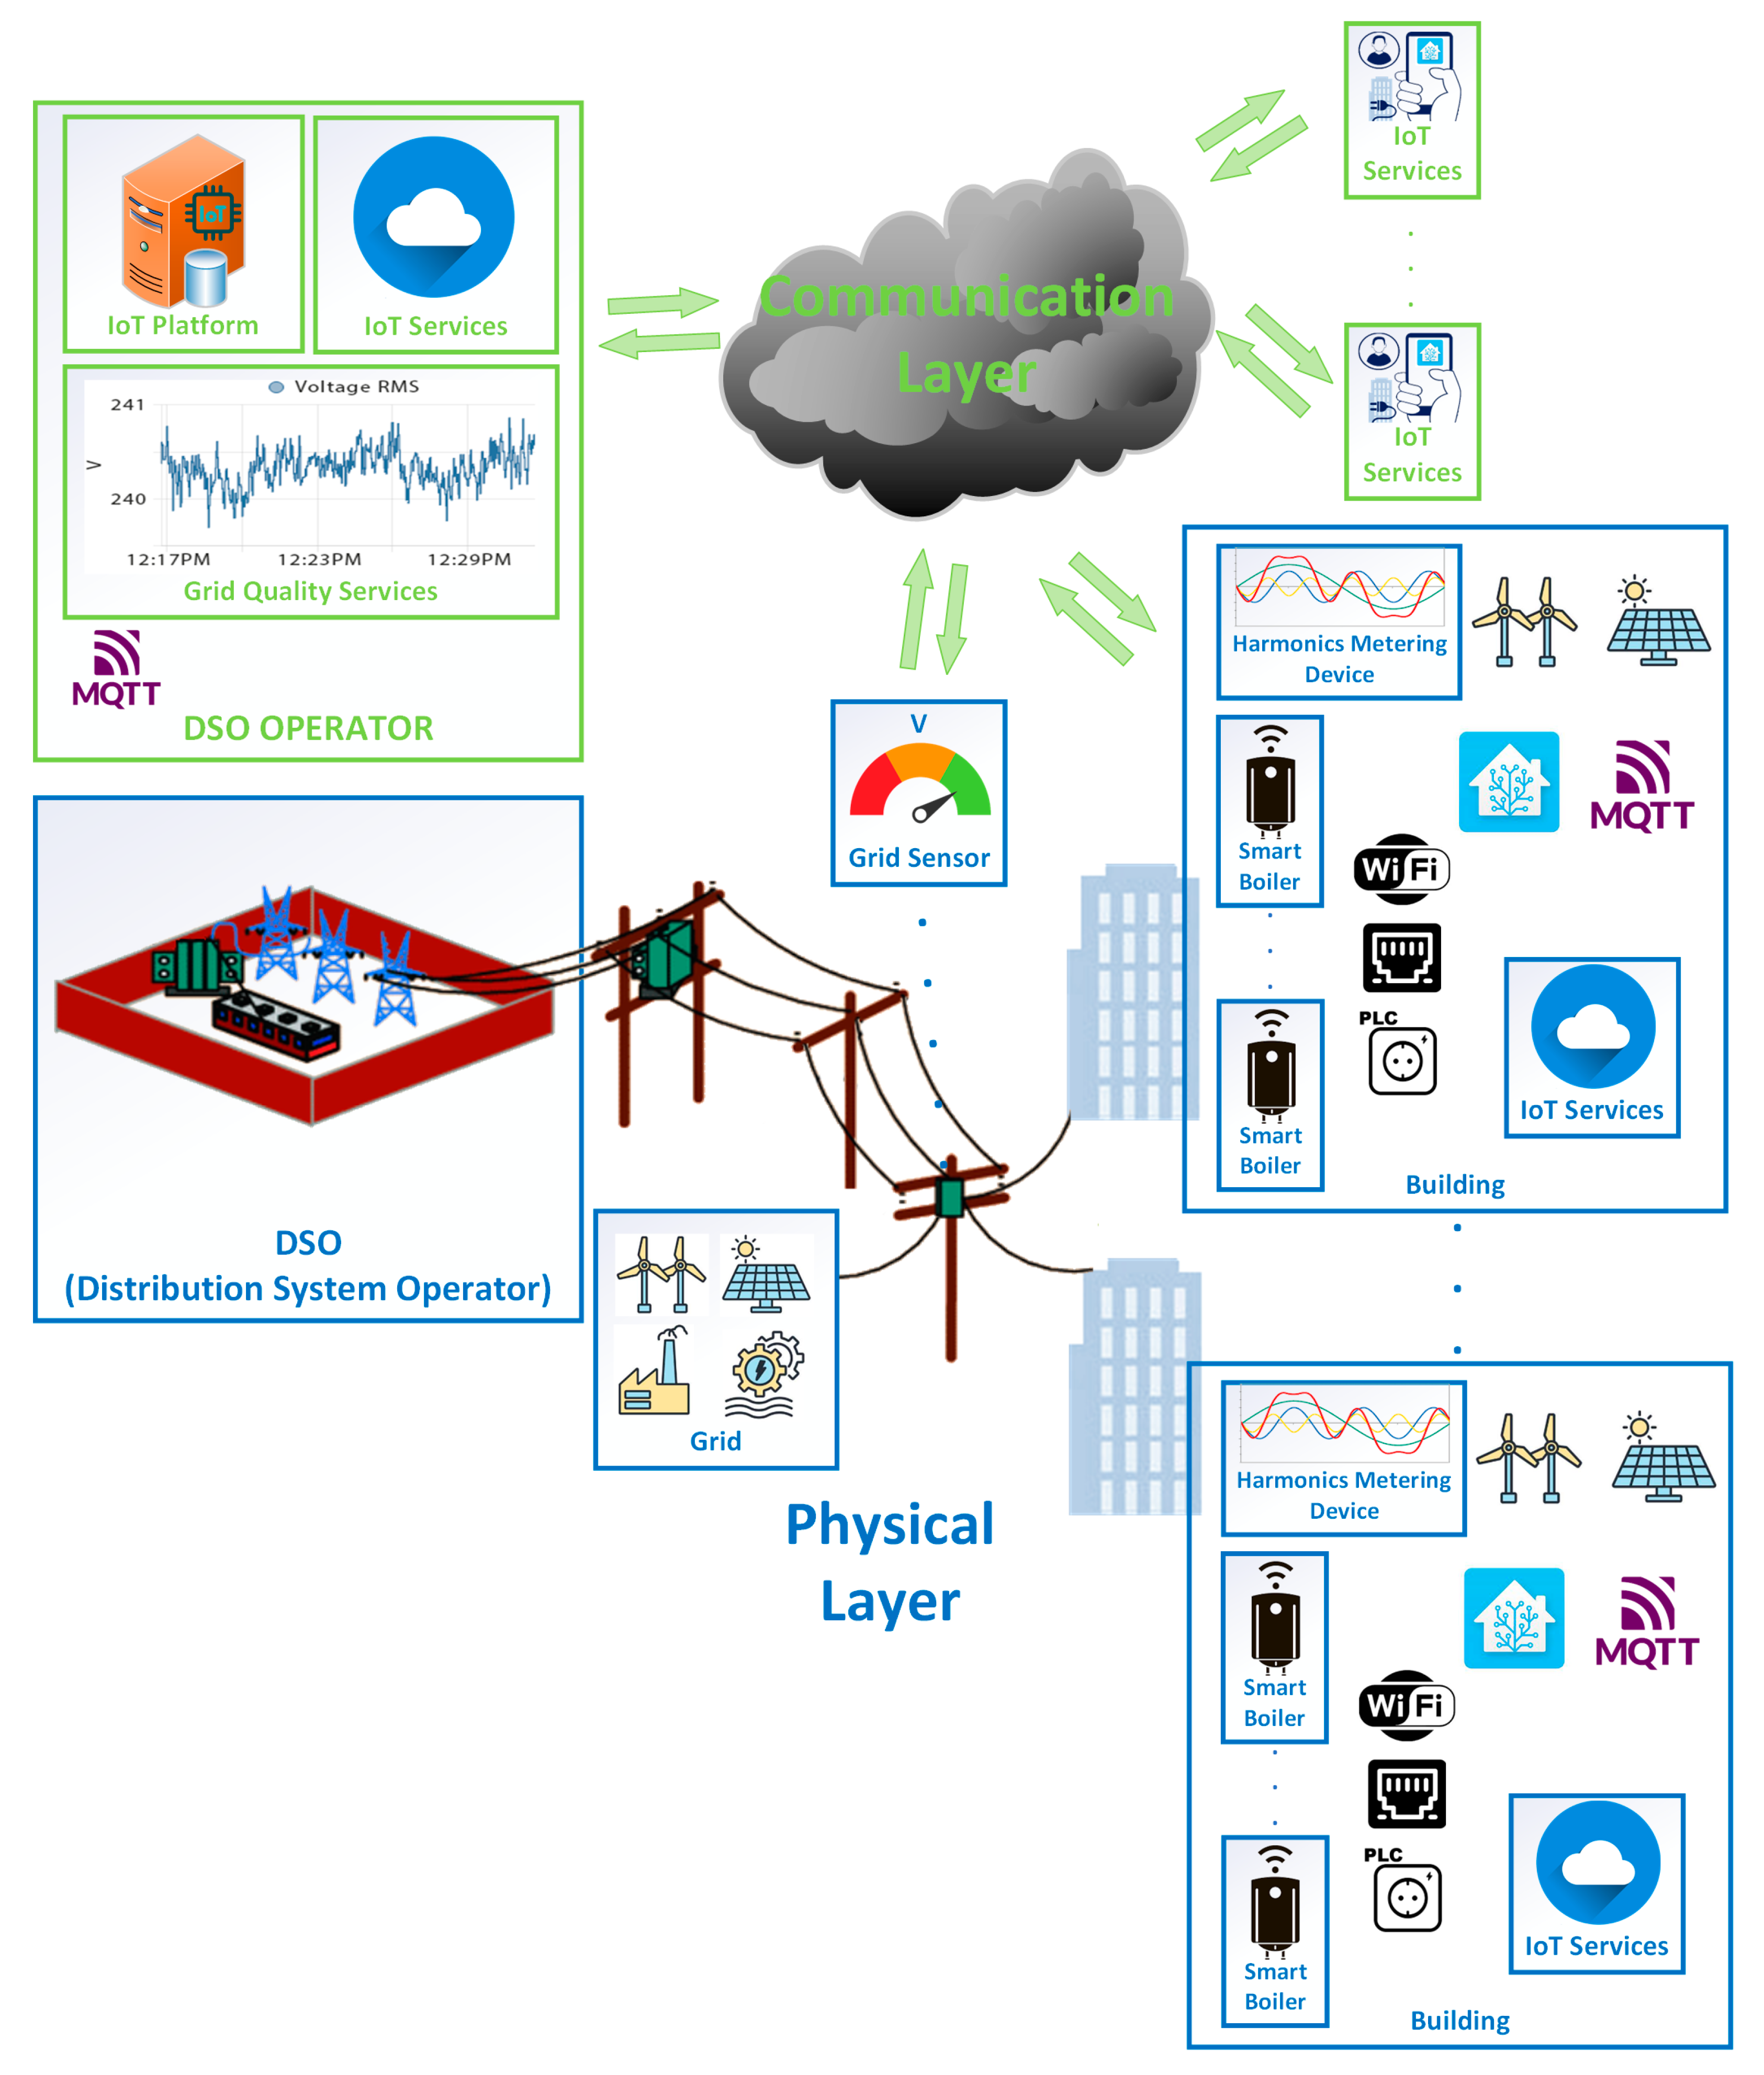
Figure 1. The Smart Boiler platform.
Energies 17 02096 g001
Figure 2. Simplified schematic of the converter in the Smart Boiler kit, with the photos of some of the components used in the construction of the test prototype: bridge rectifier with diodes of low-frequency specifications; in-lab, hand-made, high-frequency inductor; and 60 A/650 V IGBT in TO-247 package.
Energies 17 02096 g002
Figure 3. Top view of the latest test prototype of the Smart Boiler kit. The right section includes the power electronics converter with its snubber, filter, and heat sinks and a detachable IGBT driver circuit PCB at the bottom side (not visible). The middle section includes three DC power supplies: 18 V for the IGBT driver circuit, 5 V for the communication node and the voltage/current sensors, and 3.3 V for the control board. It also includes the sensors (voltage and current) for the monitoring of the local values at the point of the Smart Boiler. The left section has the microcontroller for the control of the device and another microcontroller unit acting as a communications node (see Section 4, Telecommunication Aspects of the Widespread Application of Smart Boilers). The control unit is optically isolated from the driving circuit. The aluminum sheets are to prevent EMI between the three sections.
Energies 17 02096 g003
Figure 4. Simulated current waveform in a diode of the bridge rectifier with the filter on the AC side (a) and on the DC side (b).
Energies 17 02096 g004
Figure 5. Illustration of the logic for the creation of the IGBT control pulses in order to achieve inductive or capacitive reactive power with the use of a Smart Boiler.
Energies 17 02096 g005
Figure 6. Capability curve of the Smart Boiler converter. Positive Q corresponds to inductive and negative Q corresponds to the capacitive operation of the Smart Boiler. For a specific amount of Q to be achieved, P should be equal or greater than the reading from the graph.
Energies 17 02096 g006
Figure 7. Generation of current harmonics from the Smart Boiler converter with the comparison of a properly distorted waveform with a high-frequency triangular wave. In the illustrated example, a 150 Hz component is added.
Energies 17 02096 g007
Figure 8. IoT communication scheme of the Smart Boiler application setup.
Energies 17 02096 g008
Figure 9. Smart Boiler as an IoT end node.
Energies 17 02096 g009
Figure 10. Harmonics Metering Device.
Energies 17 02096 g010
Figure 11. Home Assistant screenshots for a Smart Boiler. (a) GUI for setting active and reactive power set points; (b) GUI displaying active and reactive power, as well as, control switches for selected harmonics that will be suppressed.
Energies 17 02096 g011
Figure 12. Screenshots from the MQTT Explorer environment. (a) Meter measurements; (b) Smart Boiler parameters and achieved status.
Energies 17 02096 g012
Figure 13. Schematic diagram of the selected testbed configuration for the experimental investigation of Smart Boilers operation and their impact on grid operating properties.
Energies 17 02096 g013
Figure 14. Power curve of the PV array used in the testbed on 4 March 2024, acquired at 18:00 local time, at the University of Patras campus. On the horizontal axis is the local time. On top of the graph are the corresponding graphs for the preceding days.
Energies 17 02096 g014
Figure 15. Schematics and power values of the two step loads at the respective feeders connected to the PCC. (a) upper feeder; (b) lower feeder.
Energies 17 02096 g015
Figure 16. Photo and section drawing of the 150lt boiler provided by Maltezos SA.
Energies 17 02096 g016
Figure 17. Plot of the temperature readings from the three sensors during a heating process and a succeeding natural cooling experiment (i.e., without cold water inlet flow or hot water outlet flow). Curve T1 is for the bottom sensor, T2 for the mid-positioned one, and T3 for the top sensor. In this experiment, the heating process lasted for about 2.5 h.
Energies 17 02096 g017
Figure 18. Voltage at the PCC (top), Smart Boiler active power (middle), and reactive power (bottom). Effect of reactive power injection on the voltage level.
Energies 17 02096 g018
Figure 19. Voltage at the PCC (top), Smart Boiler active power (middle), and Smart Boiler reactive power (bottom). Effect of Smart Boiler shut-down on the voltage level.
Energies 17 02096 g019
Figure 20. Voltage at the PCC (top), Smart Boiler active power (middle), and reactive power (bottom). Effect of the PV connection on the voltage level (t = 4 s) and voltage regulation from the Smart Boiler (t = 80 s).
Energies 17 02096 g020
Figure 21. Voltage at the PCC (top), Smart Boiler active power (middle), and reactive power (bottom). Regulation from the Smart Boiler against the voltage rise due to the connection of a PV array.
Energies 17 02096 g021
Figure 22. Voltage at the PCC (top), Smart Boiler active power (middle), and reactive power (bottom). Zero reactive power regulation from the Smart Boiler against the voltage rise due to the connection of a PV array. The power injected by the PV is 950 W.
Energies 17 02096 g022
Figure 23. Voltage (orange), current (cyan), and instant power (red) waveforms before the Smart Boiler starts (a) and after the Smart Boiler has started (b).
Energies 17 02096 g023
Figure 24. Voltage (orange), current (cyan), and instant power (red) waveforms: (a) with capacitive loading; (b) with the reactive power compensation of the Smart Boiler on; and (c) with the harmonics mitigation mode on too.
Energies 17 02096 g024
Figure 25. Harmonics mitigation. Harmonics of the order 3, 5, 7, and 9 have blue, yellow, cyan, and purple lines, respectively, of a 200 W mixer. The test has been repeated three times (ac), with the P and Q control modes also active, so that the reliability of the control is verified.
Energies 17 02096 g025aEnergies 17 02096 g025b
Table 1. Comparison of the performance of typical MQTT brokers with the expected Smart Boiler MQTT broker requirements.
MQTT Broker Comparison Review [21]MQTT Broker Requirements for Widespread Use of Smart Boilers
Messages1000 to 50,000up to 11,000
(10,000 SBs and 1000 Meter Devices)
Transmission frequency in seconds10.8192
Message payload size in Bytes15016
Messages without packet lossup to 28,000
Disclaimer/Publisher’s Note: The statements, opinions and data contained in all publications are solely those of the individual author(s) and contributor(s) and not of MDPI and/or the editor(s). MDPI and/or the editor(s) disclaim responsibility for any injury to people or property resulting from any ideas, methods, instructions or products referred to in the content.