Abstract
This study describes both experimental and numerical investigations into the heat and mass transfer processes governing the vacuum freeze drying of camel milk, with a specific focus on improving the energy efficiency. A three-dimensional model was developed and solved using the finite element method to simulate temperature evolution and sublimation interface progression during drying. The numerical model was validated against experimental data, achieving strong agreement, with an value of 0.94. A detailed parametric analysis examined the effects of the shelf temperature, sample thickness, and chamber pressure on the drying kinetics and energy input. The results indicate that optimising these parameters can significantly reduce the energy consumption and processing time while maintaining product quality. Notably, reducing the sample thickness to 4 mm shortened the drying time by up to 40% and reduced the specific energy consumption (SEC) from 358 to 149 kWh/kg. These findings offer valuable insights for the design of more energy-efficient freeze drying systems, with implications for sustainable milk powder production and industrial-scale process optimisation.
1. Introduction
Camel milk is a high-quality milk with high nutritional value and health benefits. Camel milk contains a variety of nutrients, such as fat, protein, vitamins, lactose, etc. [1,2,3]. Research has demonstrated that camel milk possesses several bioactive properties, including anti-cancer effects [4], hypoallergenic characteristics [5], and anti-diabetic potential [6]. Camel milk has recently emerged on the international dairy market, largely due to advances in powdered milk production, which offers an effective means of preserving this highly perishable product for future use. Since camel milk is often produced in remote areas, far from consumer markets, dehydration presents the most efficient option for large-scale transportation. In the dairy industry, spray drying remains the dominant technique in producing milk powders due to its scalability, its low energy consumption per unit mass, and the favorable solubility of the resulting product. However, this method involves high-temperature exposure, which can degrade sensitive components such as bioactive proteins, enzymes, and vitamins. In contrast, vacuum sublimation drying is a low-temperature, vacuum-based method that better preserves the nutritional and biochemical integrity of the product. Despite its advantages, vacuum sublimation drying is energy-intensive and time-consuming, making it less common in large-scale production. For niche markets—such as camel milk processing, where quality preservation is critical—vacuum sublimation drying remains a promising alternative. Therefore, optimising the vacuum sublimation drying parameters to reduce the energy consumption while maintaining product quality is essential in enhancing the feasibility of this method in specialised dairy applications. Camel milk powder commands a premium market price of approximately EUR 60–100 per kilogram, significantly higher than other dairy powders, including cow, goat, and mare’s milk products. This presents substantial economic opportunities for camel-rearing regions, particularly for countries like Kazakhstan, where camel breeding has deep cultural and historical roots. The country’s vast territorial expanses provide ideal conditions for herd expansion, while existing pastoral traditions offer a strong foundation for commercial development. The combination of high market value and favourable production conditions makes camel milk powder an attractive commodity for pastoral economies with established camel farming infrastructure. The process of transforming fresh camel milk into a powder form comes with a significant financial burden, requiring specialised tools and substantial technological investment. Vacuum sublimation drying has emerged as a leading technique for the production of camel milk powder, demonstrating its ability to maintain both the nutritional content and desirable taste characteristics of the milk [7]. However, vacuum sublimation drying remains more energy- and time-intensive than alternative drying methods, with current industrial systems requiring 20–35 h to produce high-quality outputs. This economic and operational challenge drives ongoing research to improve the process efficiency—particularly in reducing the energy use and production costs. The numerical simulation of heat and mass transfer during vacuum sublimation drying offers a promising pathway for optimisation, which is the focus of this study.
Substantial improvements in vacuum sublimation drying process modelling have been achieved through three decades of development in numerical simulation techniques for simultaneous heat and mass transfer [8,9,10,11,12,13,14,15]. In [8], the authors introduced an optimal control framework for vacuum sublimation drying, formulating the process as a time minimisation problem with constraints on the final moisture content. Their model considered the radiator energy output and chamber pressure as control variables, laying the groundwork for subsequent dynamic modelling efforts. Building upon this, ref. [9] expanded the modelling approach to encompass both the primary and secondary drying stages. Their comprehensive analysis incorporated heat and mass transfer mechanisms, providing a more detailed understanding of the vacuum sublimation drying process dynamics. In [10], the authors further advanced the field by developing a multi-dimensional model describing vacuum sublimation drying in vials. This model accounted for spatial variations and provided insights into the effects of the vial geometry and product configuration on drying behaviour. Ref. [11] introduced a finite element analysis approach to simulate the vacuum sublimation drying process. Their computational model enabled the prediction of the temperature and moisture profiles within the product, facilitating the optimisation of process parameters. Ref. [12] focused on the mathematical modelling of the primary and secondary vacuum sublimation drying stages under microwave heating. Their work highlighted the potential of microwave-assisted vacuum sublimation drying to reduce the processing time while maintaining product quality. Ref. [13] addressed the computational challenges associated with large-scale simulations by implementing adaptive time-stepping methods. Their approach improved the efficiency and accuracy of simulations, particularly for complex parabolic problems encountered in vacuum sublimation drying modelling. Ref. [14] investigated the impact of a sample’s porous structure on vacuum sublimation drying. Their study emphasised the significance of microstructural characteristics in influencing the drying kinetics and final product quality. Ref. [15] developed a 3D mathematical model to understand the atypical heat transfer observed in vial vacuum sublimation drying. Their model incorporated various heat transfer mechanisms, including conduction, convection, and radiation, providing a comprehensive tool for the analysis and optimisation of the vacuum sublimation drying process.
Collectively, these studies have significantly contributed to the advancement of vacuum sublimation drying process modelling, offering valuable insights and tools to improve efficiency, product quality, and scalability in the pharmaceutical and food industries. Key developments in recent research [16,17,18,19,20,21] have substantially improved our fundamental understanding of the transient heat and mass transfer mechanisms governing vacuum sublimation drying processes. The numerical modelling of heat and mass transfer during milk vacuum sublimation drying in vials was investigated in [16], with a focus on phase transitions and mass transport. The study highlighted the critical role of heat transfer and moisture removal in determining process efficiency, offering insights for the optimisation of dairy industry applications. A multiphase porous media model for the prediction of the temperature and moisture distribution during vacuum sublimation drying was developed in [17], contributing to enhanced process control. Further advancing this field, ref. [18] combined computational simulations with experimental validation to analyse the vacuum sublimation drying of delicate materials, providing practical guidance for industries processing heat-sensitive products.
We extend the scope of our earlier work [21] through three-dimensional modelling, systematic vapour pressure assessment, and detailed parametric investigations. This study investigates the heat and mass transfer dynamics during the vacuum sublimation drying of camel milk, employing numerical simulations and experimental validation. Gaining a comprehensive understanding of these underlying principles is crucial in refining the drying procedure, maximising its effectiveness, and guaranteeing the superior quality of the final product. Using computational models, our research seeks to uncover the intricate relationships between heat transfer, mass movement, and material characteristics as they occur during the drying phase. Despite its advantages in preserving nutritional quality, vacuum sublimation drying is widely recognised as one of the most energy-intensive food processing methods, with the specific energy consumption often exceeding that of conventional drying techniques. This poses challenges in terms of environmental impacts and economic feasibility, especially in large-scale production. Therefore, optimising the vacuum sublimation drying conditions to minimise the energy input while maintaining product quality is essential. This study aims to contribute toward energy-efficient process design by systematically analysing the influence of drying parameters on both the drying performance and energy consumption.
2. Materials and Methods
In this section, we experimentally investigate the freeze drying process of camel milk and present a numerical method supported by a modelling tool and governing equations. To validate the proposed model, numerical results are compared with experimental data.
2.1. Experimental Study
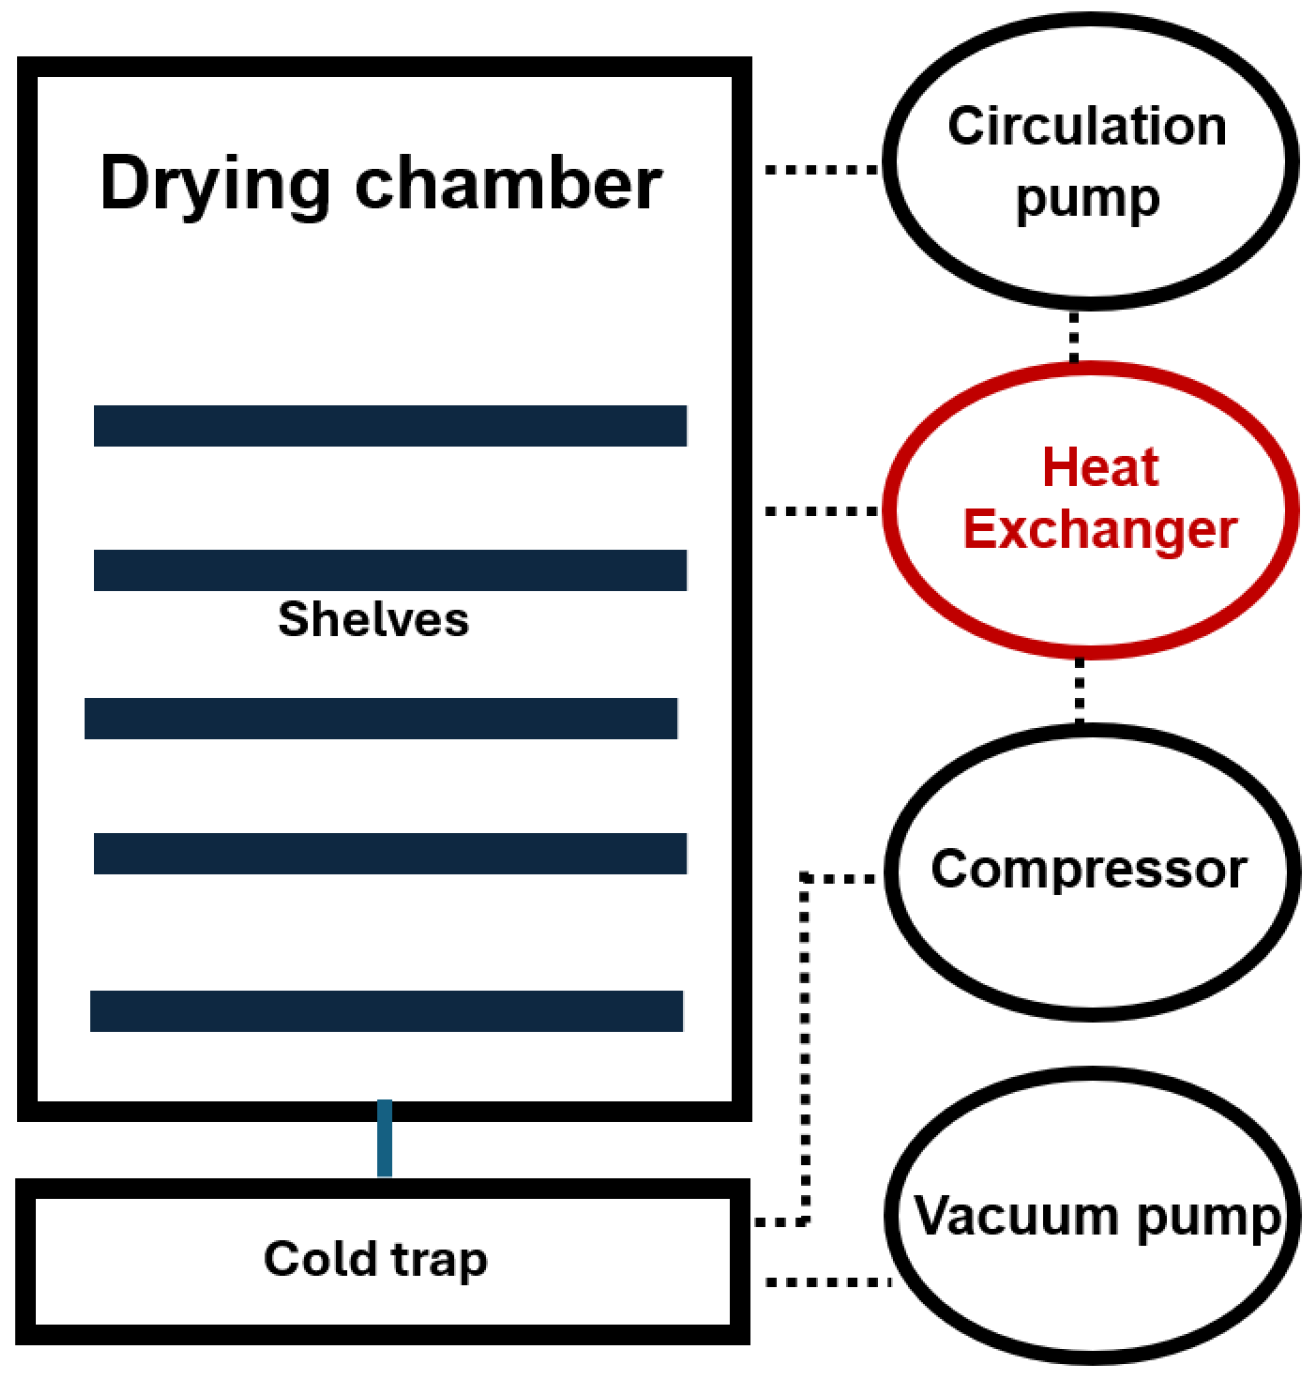
Experiments were performed using a shelf-type vacuum freeze dryer (model ZLGJ-300) as the primary apparatus, shown in Figure 1. In detail, the equipment information is provided in ref. [22]. The sample is introduced into a drying chamber, where, at a reduced temperature and pressure, the ice present within the sample transforms directly into water vapour. This vapour is subsequently channeled through a vacuum network to a designated condensation chamber for collection.

Figure 1.
Schematic diagram of experimental equipment.
The camel milk used in the experiment was sourced from a commercial camel farm located in the Almaty region, Kazakhstan. All milk was collected from a single herd of Bactrian camels, and the samples were pooled from the same morning milking session. To ensure compositional consistency, all samples used in the study were collected on the same day from the same group of animals. No mixing of samples across different days or production cycles occurred. No pretreatment, such as filtration, sterilisation, or homogenisation, was performed on the fresh camel milk, seeking to retain its natural composition. Camel milk was poured into stainless-steel trays of cm at depths of 4–8 mm and placed in the freeze drying chamber. A temperature probe was inserted into the sample to monitor the core temperature. Samples were prefrozen at −50 °C for 3 h, after which the chamber pressure was reduced to 95 Pa to initiate sublimation, with heat supplied through the shelves. Moisture loss was assessed by weighing the samples every 3 h, and the moisture content was calculated from the mass reduction.
Experiments were conducted using sample thicknesses of 4, 6, and 8 mm, each tested under chamber pressures of 95, 105, and 115 Pa. Preliminary tests with thicknesses exceeding 8 mm resulted in final moisture content above 7%, which does not meet industrial quality standards. Moreover, the associated drying times were excessively long. Therefore, thicknesses greater than 8 mm were excluded from the scope of this study.
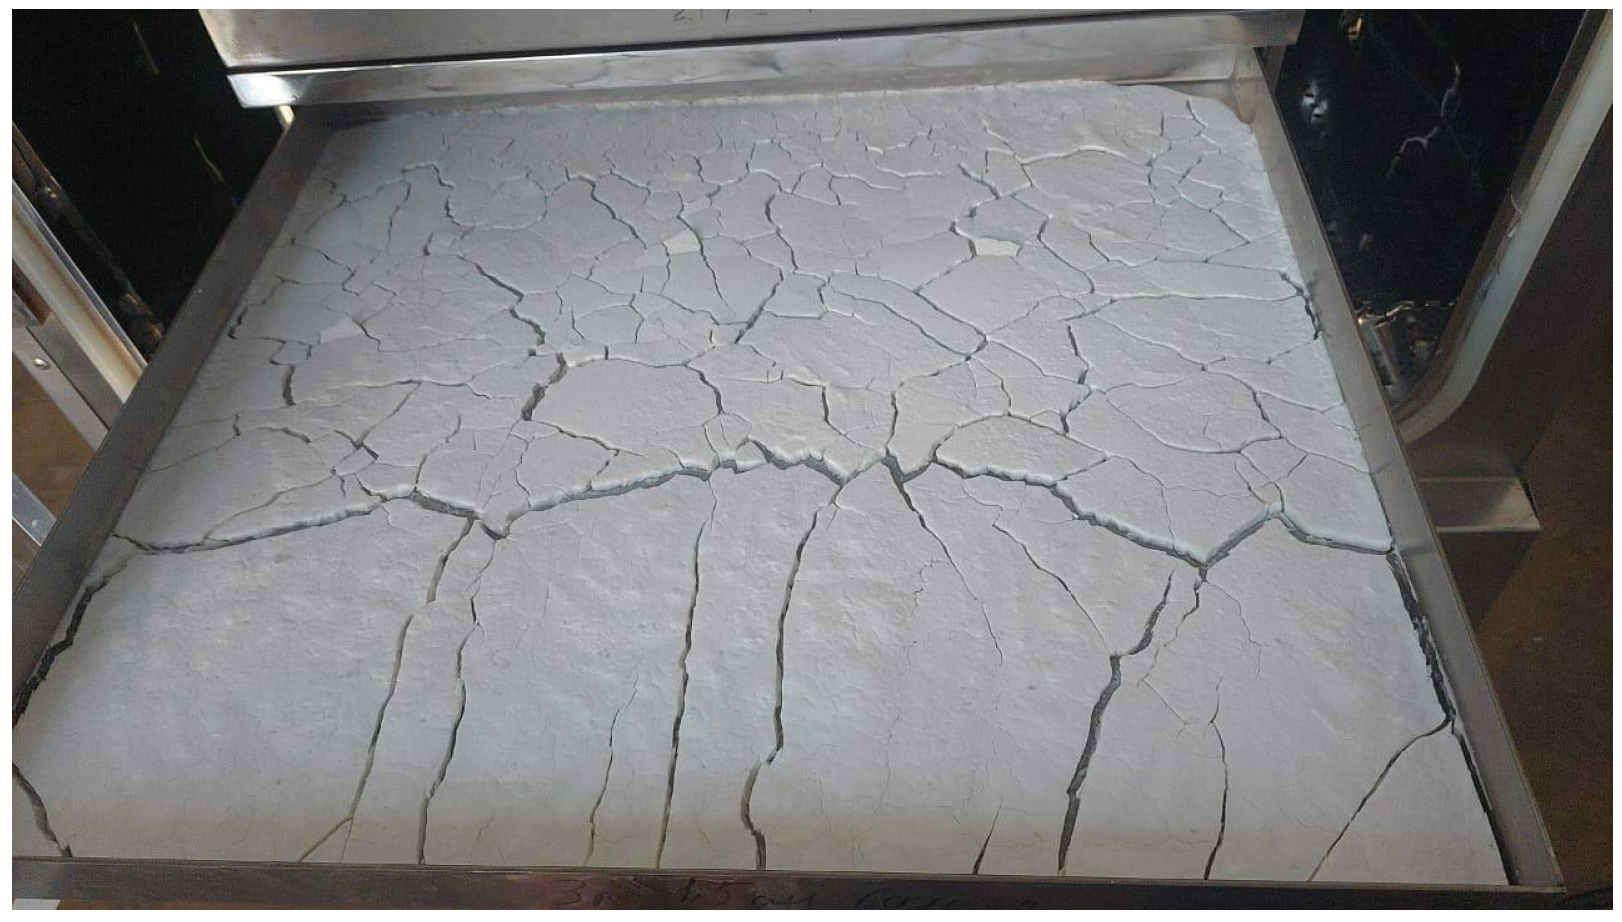
The temperature and pressure were logged every 3 min during drying. The complete sublimation process lasted 22–25 h, depending on the sample thickness. Drying was considered complete when the sample’s weight stabilised, indicating the removal of free moisture. A visual depiction of the dried product is shown in Figure 2.
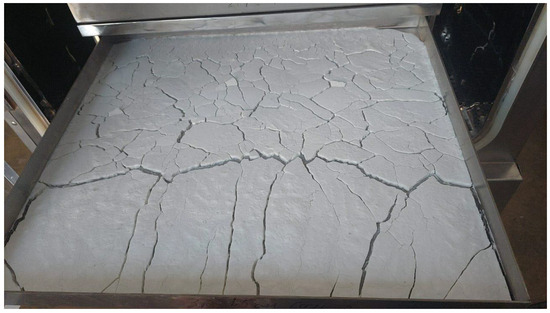
Figure 2.
Dried product.
Structural changes such as cracks, observed in Figure 2, arise from mechanical stresses due to uneven drying and shrinkage between frozen and dried layers. Although the current model assumes a rigid porous matrix, these deformations can affect heat and mass transfer by altering vapour pathways and surface exposure. Cracks may enhance mass transfer but increase heat loss, while flakes can act as thermal barriers. Future models could address these effects using a poromechanical framework.
Measurement of Moisture Content. To monitor the moisture content during the vacuum sublimation drying of mare’s milk, we used the Evlas-2M moisture analyser, Manufacturer: Sibagropribor, Krasnoobsk, Novosibirsk region, 630501, Russia a precise instrument for the analysis of moisture in food and biological samples. Dried samples were collected every 3 h, cooled to room temperature, and weighed before and after drying using a high-precision balance. The moisture content was calculated as
where is the mass of the sample before drying (wet mass); is the mass of the sample after complete drying (dry mass). Measurements were averaged over three trials, confirming the final moisture content below 4%, in line with industry standards. The analyser was regularly calibrated, and the results were used to validate the numerical model.
Experiment and Simulation Verification. During the sublimation stage, the temperature was increased stepwise until reaching the target value. These stepwise changes were incorporated into the numerical simulation.
Figure 3 shows the comparison between the simulated and experimental temperature profiles during both the primary and secondary drying stages for the 6-mm-thick sample. The temperature was measured at the central part of the tray with the camel milk.
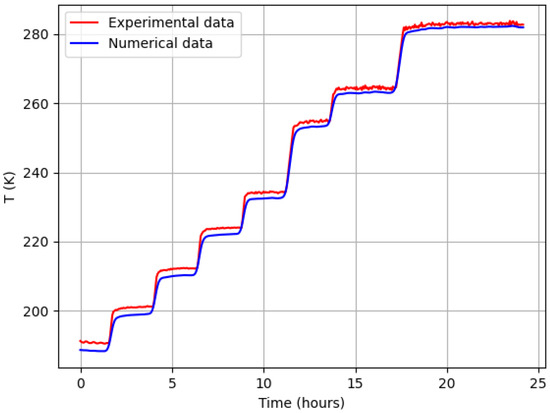
Figure 3.
Comparison between the measured and simulated temperatures.
Figure 3 demonstrates a strong correlation between the numerical simulation results and the experimental temperature data. In the simulation, both cooling and heating from beneath the tray were implemented using a stepwise function.
To quantify the accuracy of the model, the coefficient of determination () was calculated using the following formula:
where denotes the experimental temperature measurements, denotes the simulated values, and is the average of the experimental data. An value of 0.94 was achieved during the sublimation and drying stages, indicating excellent agreement. As illustrated in Figure 3, the model accurately reproduces the temperature evolution, confirming its reliability in capturing the heat and mass transfer dynamics of the sublimation drying process.
2.2. Numerical Method
Owing to the symmetry of the trays and to reduce the computational time, a computational domain of 5 × 4 × 0.8 cm is considered, as shown in Figure 4. The drying process divides the computational space into two regions: the uppermost, desiccated layer and a lower, frozen layer. As sublimation occurs, the boundary between these zones gradually moves downward, causing the dry area to expand. The initial drying phase ends when this sublimation front reaches the bottom of the tray.
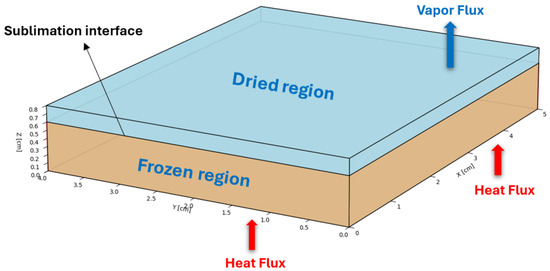
Figure 4.
Computational domain.
To simplify the modelling process, several assumptions are adopted based on prior studies [23]. It is assumed that the solid matrix remains structurally stable throughout the process. A thin, idealised interface separates the frozen and dried regions. Vapour transport in the dried layer is described by Darcy’s law. Additionally, the porous structure is considered to remain intact as long as the temperature stays below the glass transition point.
2.2.1. Governing Equations
The computational model simulating the vacuum freeze drying process for camel milk focuses on the interconnected nature of heat and mass movement within a porous material transforming its state. This model divides the system into two key areas: a frozen region composed of ice and the solid base material and a dry region containing vapour and the solid base material. The transition of ice directly into vapour at their boundary causes the dry layer to expand while the frozen layer shrinks.
Heat Transfer. The temperature field in the porous medium is governed by the energy conservation equation
where is the effective volumetric heat capacity, is the effective thermal conductivity, is the Darcy velocity of vapour, and accounts for the latent heat absorption due to sublimation.
Vapour Transport Vapour mass transfer u (m/s) is derived from Darcy’s law, expressed as
where is the permeability of the dried porous medium, is the dynamic viscosity of water vapour, and is the vapour pressure. The relationship between the vapour pressure and vapour density is maintained via the ideal gas approximation.
The corresponding water vapour pressure is calculated from the vapour density using the ideal gas law:
Here, R is the universal gas constant and is the molecular weight of water vapour.
Sublimation Interface and Phase Change. The sublimation interface is tracked using a moving boundary approach based on the Clausius–Clapeyron relation:
where is the sublimation temperature, is the latent heat of sublimation, is a reference pressure, and is the vapour pressure at the interface.
The progression of the sublimation front is dictated by the principle of mass balance:
where is the interface position and is the normal vector pointing outward from the frozen domain. This equation ensures that the vapour flux at the interface corresponds to the rate of ice removal due to sublimation.
2.2.2. Initial and Boundary Conditions
Initially, we assume that the pressure in the dehydrated area mirrors the drying chamber’s pressure. Furthermore, we treat the sample as having a consistent temperature and composition throughout both the dried and frozen sections at the beginning of the sublimation drying procedure. Consequently, the starting parameters are
where represents the chamber pressure (in Pascals), and denotes the initial temperature (in Kelvin) of the sample material at the start of the sublimation drying process.
The mass transfer (in terms of pressure and vapour flux) boundary conditions are as follows. At the top surface,
At the lateral surface,
Since water vapour is produced at the sublimation interface, the vapour flux boundary condition is established at this interface:
where represents the position of the sublimation interface. In this study, sublimation occurs in both the x- and y-directions. The heat transfer boundary conditions are as follows.
Bottom boundary—convective heat flux from the shelf:
where h is the heat transfer coefficient, and is the shelf temperature.
Top and lateral boundaries—convective and radiative heat losses:
where is the ambient heat transfer coefficient, is the Stefan–Boltzmann constant, and is the emissivity of the surface.
The heat transfer boundary conditions in the sublimation interface:
where is the sublimation interface temperature (in Kelvin).
2.3. Parameters and Thermal Physical Properties
The absence of trustworthy experimental results for camel milk’s thermal conductivity, density, and specific heat capacity necessitates estimations of these properties derived from the milk’s established composition.
There are studies in the literature that have reported the composition of camel milk. However, slight variations in constituent content have been observed among these studies, attributed to differences in region, feeding practices, and sampling times. In this work, we adopt the results of Konuspaeva [24], as our samples originate from the same geographical area. The typical composition of camel milk is as follows in [24]: water ∼87.47%, fat ∼3.50%, protein ∼3.21%, lactose ∼4.65%, and ash ∼0.840%. Based on the given composition of camel milk, the following solid matrix properties have been estimated:
W/m·K (thermal conductivity), kg/m3 (density), J/kg·K (specific heat capacity).
To account for changes in the thermophysical properties across a space during sublimation, we use average properties calculated for each volume. These average properties are linked to the local ice saturation level, symbolised as S, which ranges from a state of complete freezing (S = 1) to a state of complete dryness (S = 0), with values between these signifying the area where sublimation is actively occurring.
The concepts of the effective volume-averaged density and heat capacity can be expressed effectively through the following definitions:
Similarly, the effective thermal conductivity, calculated using the parallel model of heat conduction in porous media, is given by
By setting , one obtains the thermophysical properties corresponding to the fully dried state of the product, as referenced in [17].
Table 1 presents a summary of the parameters employed in the numerical simulation. These include the thermal conductivity k, density , and specific heat capacity of the dry matrix (subscript m), ice (I), and water vapour (v). Porosity defines the fraction of pore volume in the matrix. The vapour density is derived from the ideal gas law using the molecular weight and universal gas constant R. The permeability of the dry layer is modelled using an empirical pressure-dependent relation. The dynamic viscosity of vapour is expressed as a temperature-dependent function.

Table 1.
Simulation parameters for the freeze drying procedure.
Numerical Simulation. A three-dimensional computational model, built within the COMSOL Multiphysics 6.3 platform, was employed to simulate the freeze drying process. This model utilised the finite element method to tackle the intricate interplay of heat and mass transfer within a porous structure, specifically focusing on frozen milk undergoing vacuum freeze drying. The simulation accurately represented heat conduction and vapour movement through the frozen milk matrix by integrating the “Heat Transfer in Porous Media” and “Darcy’s Law” modules.
Initially, the model presumed a completely frozen state, monitoring phase transitions through a phase change interface. This feature relied on temperature-based criteria to pinpoint the boundary of sublimation. To accommodate the mesh distortion caused by volume shrinkage during ice sublimation, a deformed geometry component was integrated into the system. The underside experienced a defined heat input, mimicking the heat transfer from a shelf, with the sides and top edges insulated thermally. Simulations were conducted over a 24 h period, employing a backward differentiation formula (BDF) for time progression. For improved solver reliability, a distinct method was implemented, involving two separate stages: a pressure stage and a temperature stage. Each stage utilised PARDISO, a direct linear solver, to find solutions. Nonlinear acceleration was facilitated through Anderson acceleration, employing a damping factor of 0.9, with Jacobian revisions executed at each time interval. Termination criteria for the simulation were established through bespoke formulas, designed to halt the process when the sublimation boundary reached the base of the simulated region. Thermal and material characteristics were implemented using a homogenised porous media model, incorporating newly determined values for both dry camel milk and ice.
Mesh Independence Study. For precision and dependability, a structured mesh was created using triangular elements, spanning the base of the 3D model and extending vertically. To precisely capture thermal variations, a boundary layer mesh with four enhanced layers was incorporated near regions of significant thermal influence. A globally refined mesh setting, designated as “Finer”, was employed, with an even finer setting, ”Extra Fine”, applied to critical edges. A hyperelastic smoothing technique was utilised during deformation to prevent the need for remeshing.
3. Results and Discussion
3.1. Analysis of the Movement of the Sublimation Front
A defined group of factors was chosen to model heat and mass transfer processes within camel milk during the freeze drying procedure. This baseline encompassed a 8 mm sample depth, a shelf temperature of −20 degrees Celsius, and a reduced chamber pressure of 105 pascals.
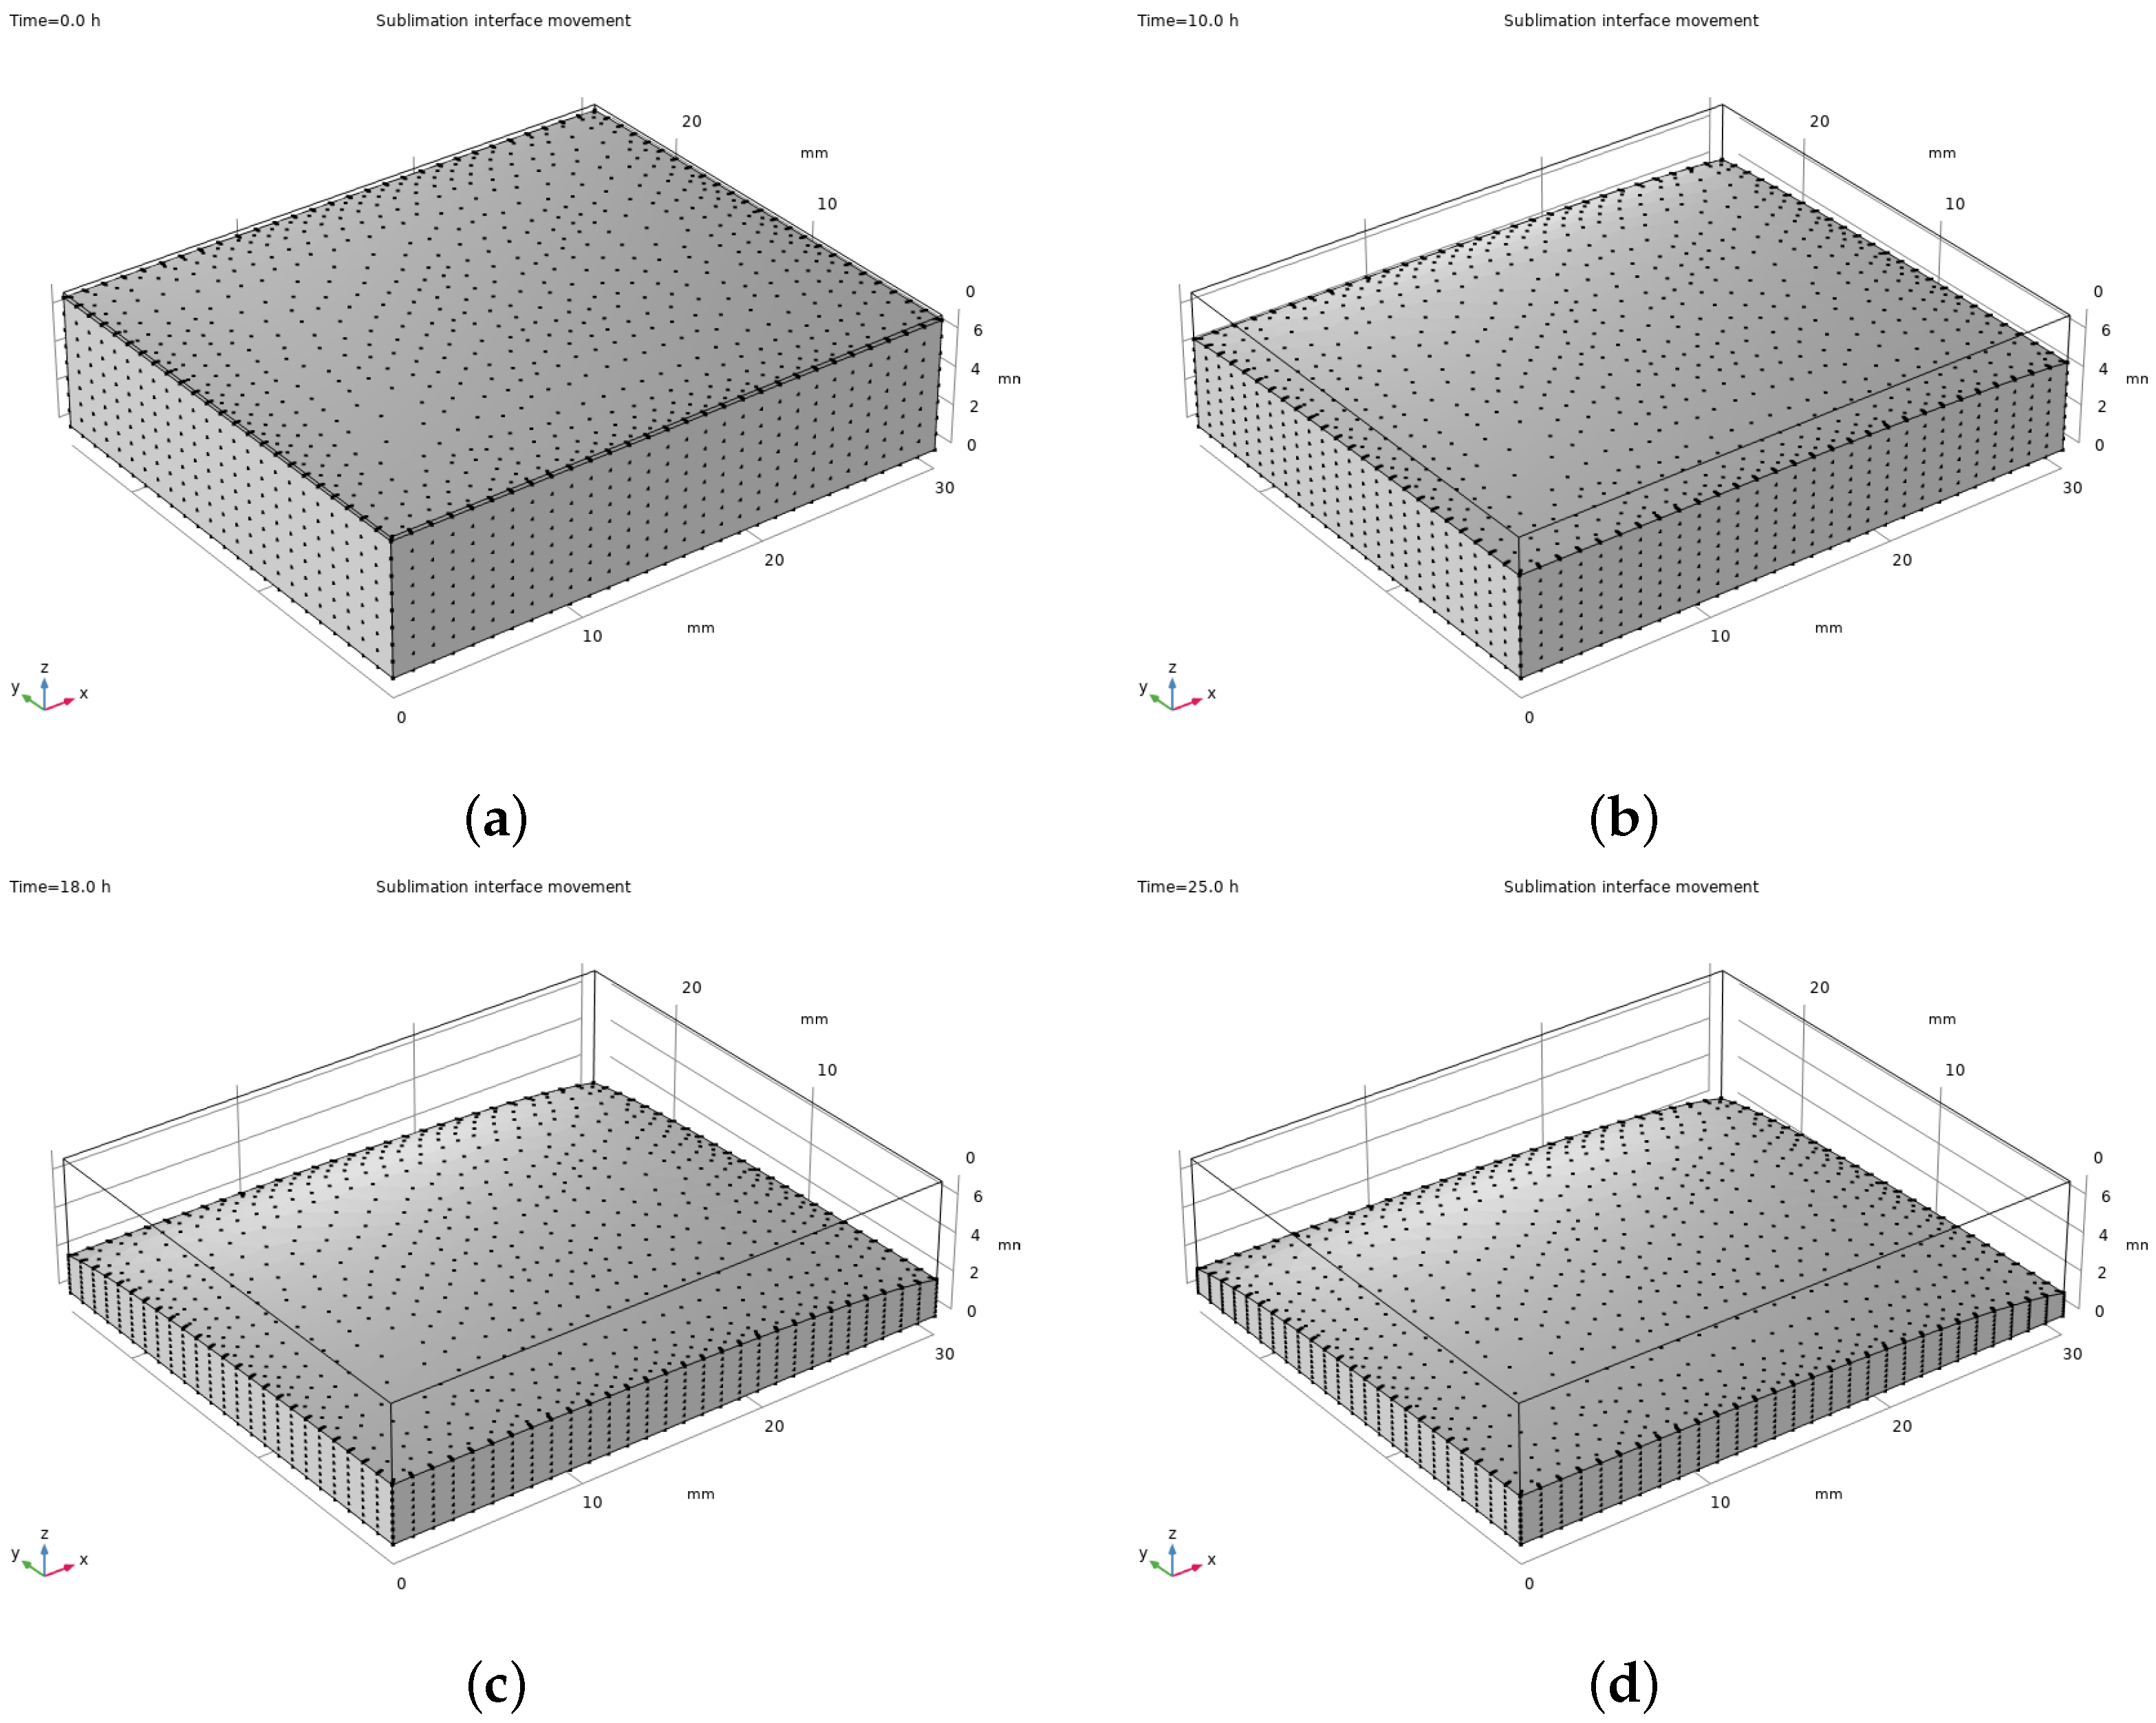
Standard conditions reveal a clear pattern in the sublimation front’s movement, as depicted in Figure 5. The grey-shaded area, symbolising the frozen portion, steadily diminishes, retreating towards the sample’s base, while the dried layer grows.

Figure 5.
Progression of the sublimation interface during the drying process at the following time points: (a) 0.5 h, (b) 5 h, (c) 18 h, and (d) 25 h.
In the early stages of drying, vapour readily escapes from the top, causing the dried area to expand quickly. However, as drying progresses, the growing gap between the sublimation point and the surface slows down vapour movement, thus decelerating the movement of the dried interface. Eventually, the ice crystals left at the sample’s base become extremely difficult to sublimate, requiring substantial energy to eliminate completely.
3.2. Heat and Mass Transfer Analysis
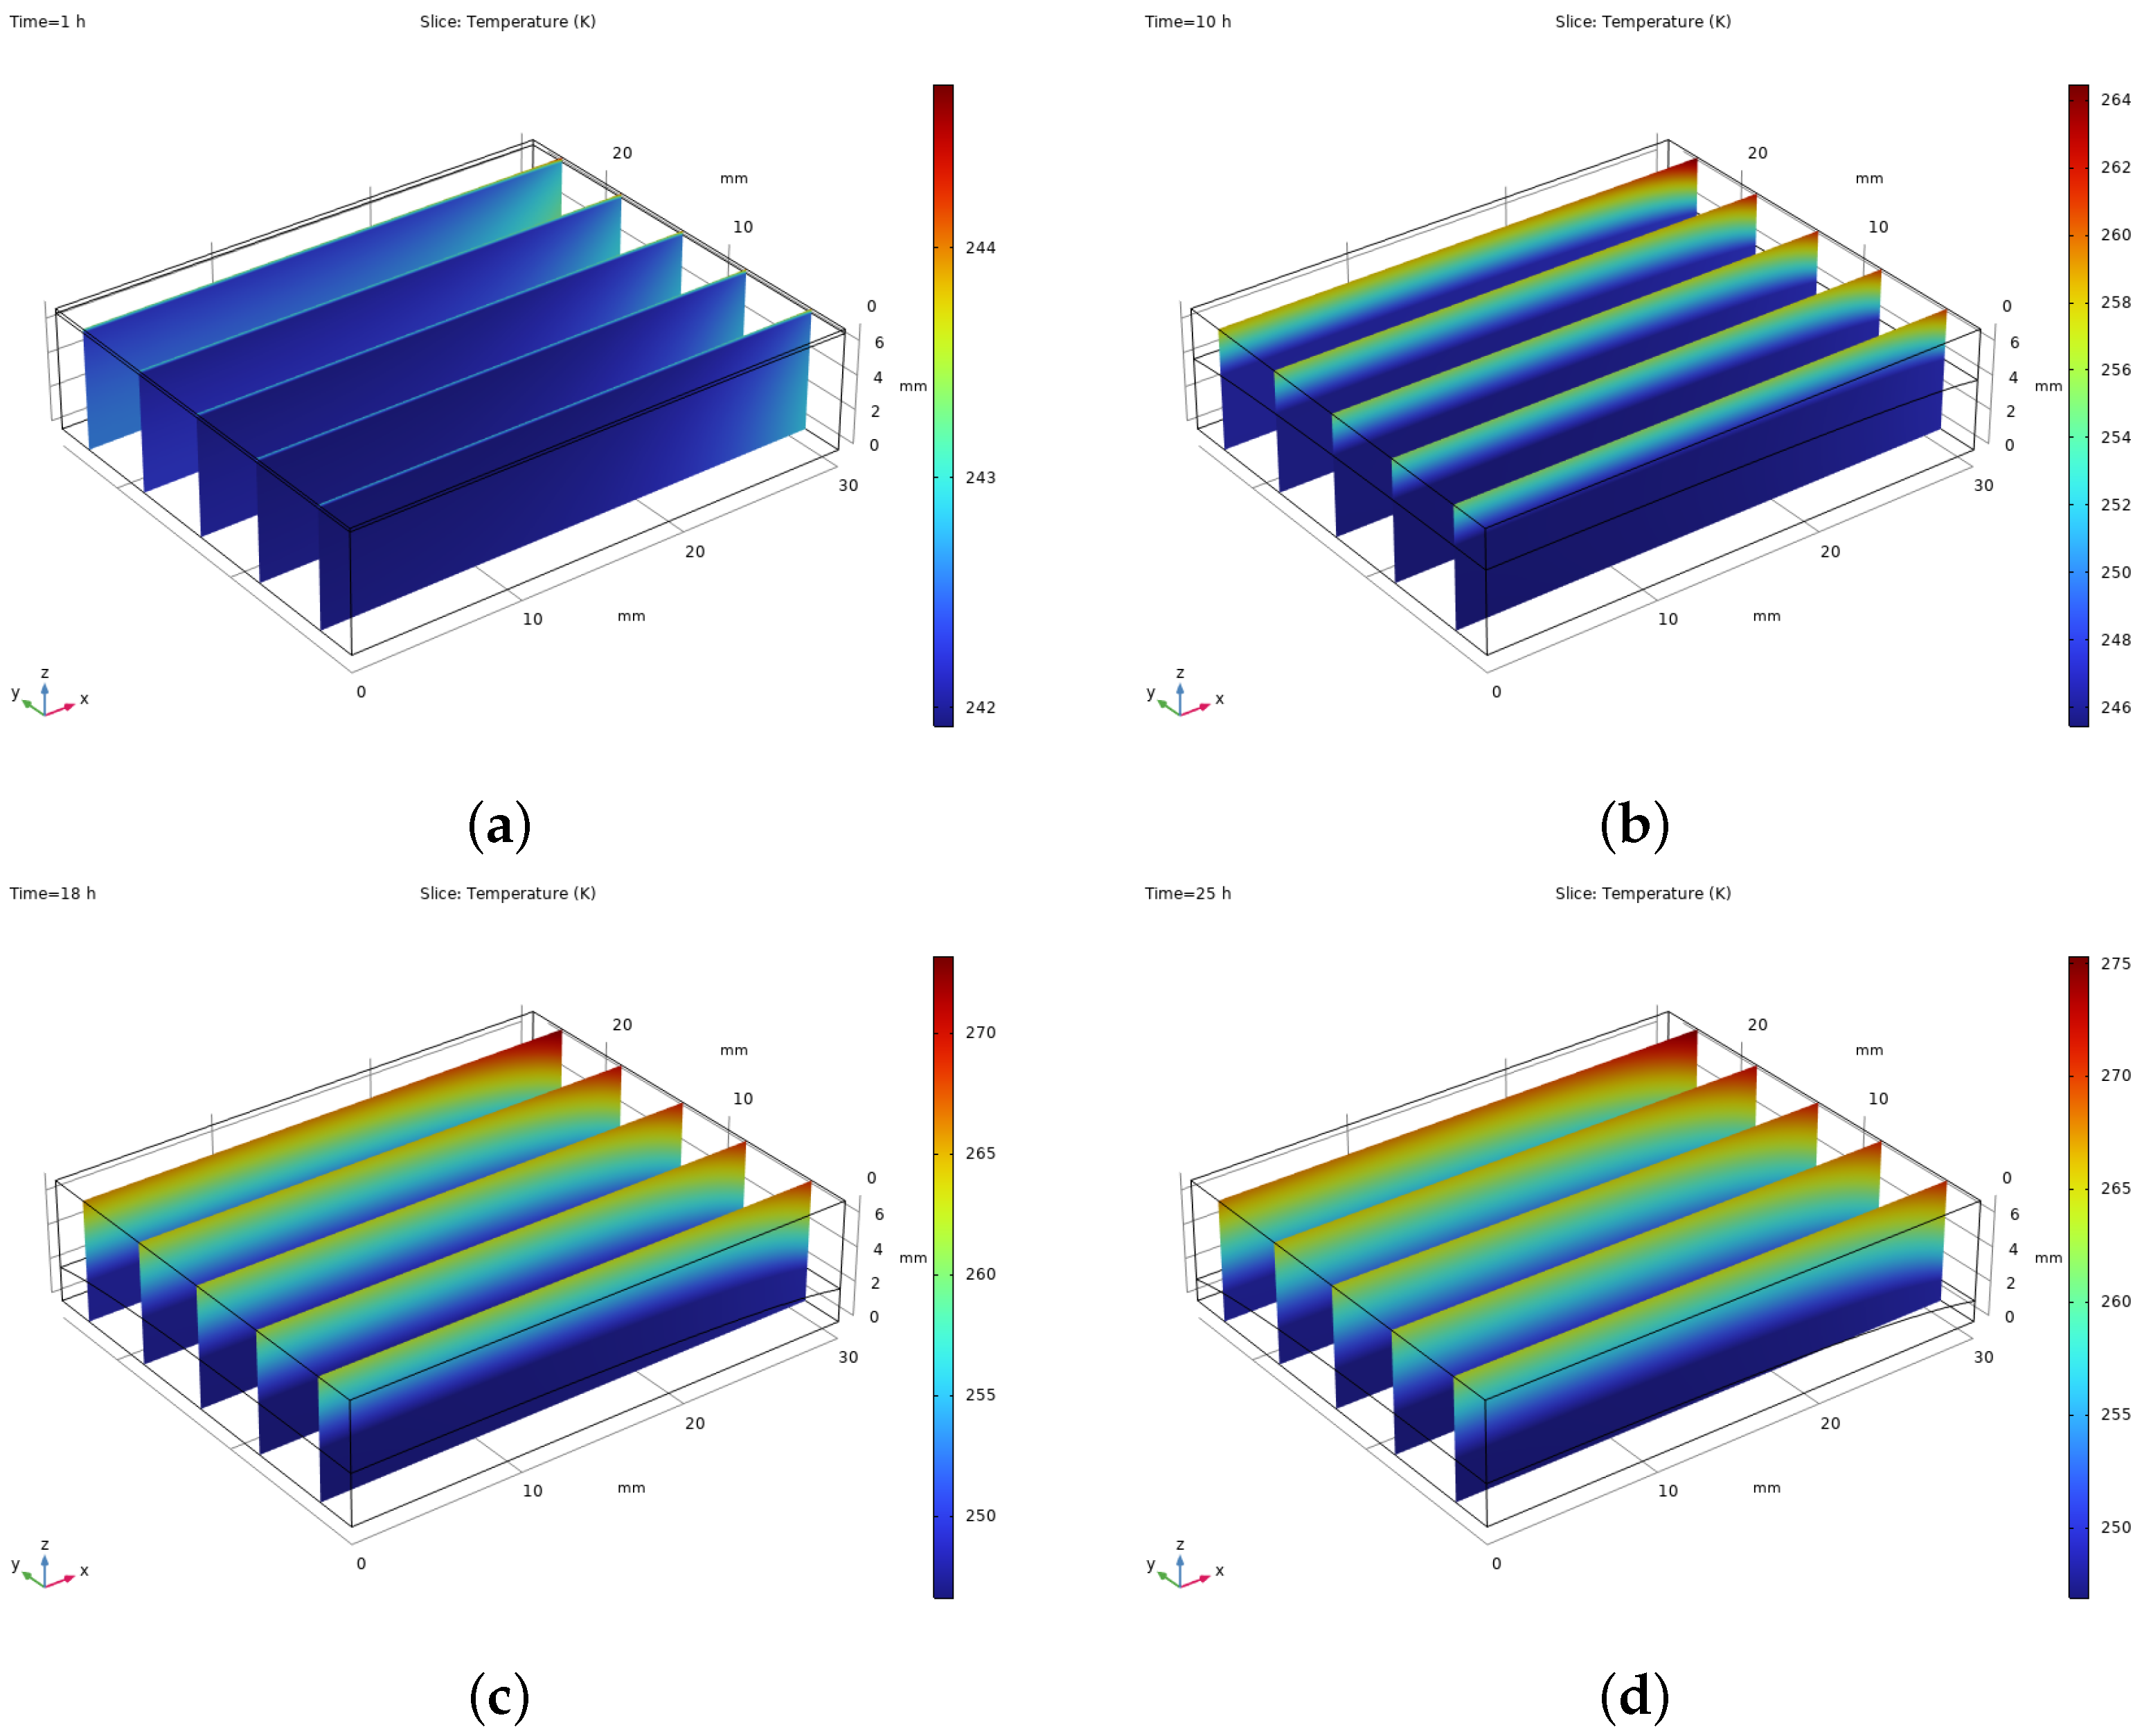
This research investigated the temperature fluctuations and heat transfer patterns inside the drying chamber, revealing significant temperature differences during the initial drying stage through simulations. These disparities are a direct result of the high energy required for the transformation of ice into vapour.
Figure 6 illustrates how the temperature changes within camel milk samples during the freeze drying process under typical circumstances. The heat emanating from the drying shelf penetrates the frozen portion of the sample, ultimately reaching the point where ice transitions directly into vapour, thus facilitating drying.

Figure 6.
Heat flux distribution at different stages of the drying process.
The frozen and dried areas differ significantly in how they respond to heat. The frozen section, due to its higher thermal conductivity and ability to store heat, experiences more stable temperatures and heats up slowly. Conversely, the dry, porous layer readily absorbs radiant heat, leading to quicker, concentrated heating.
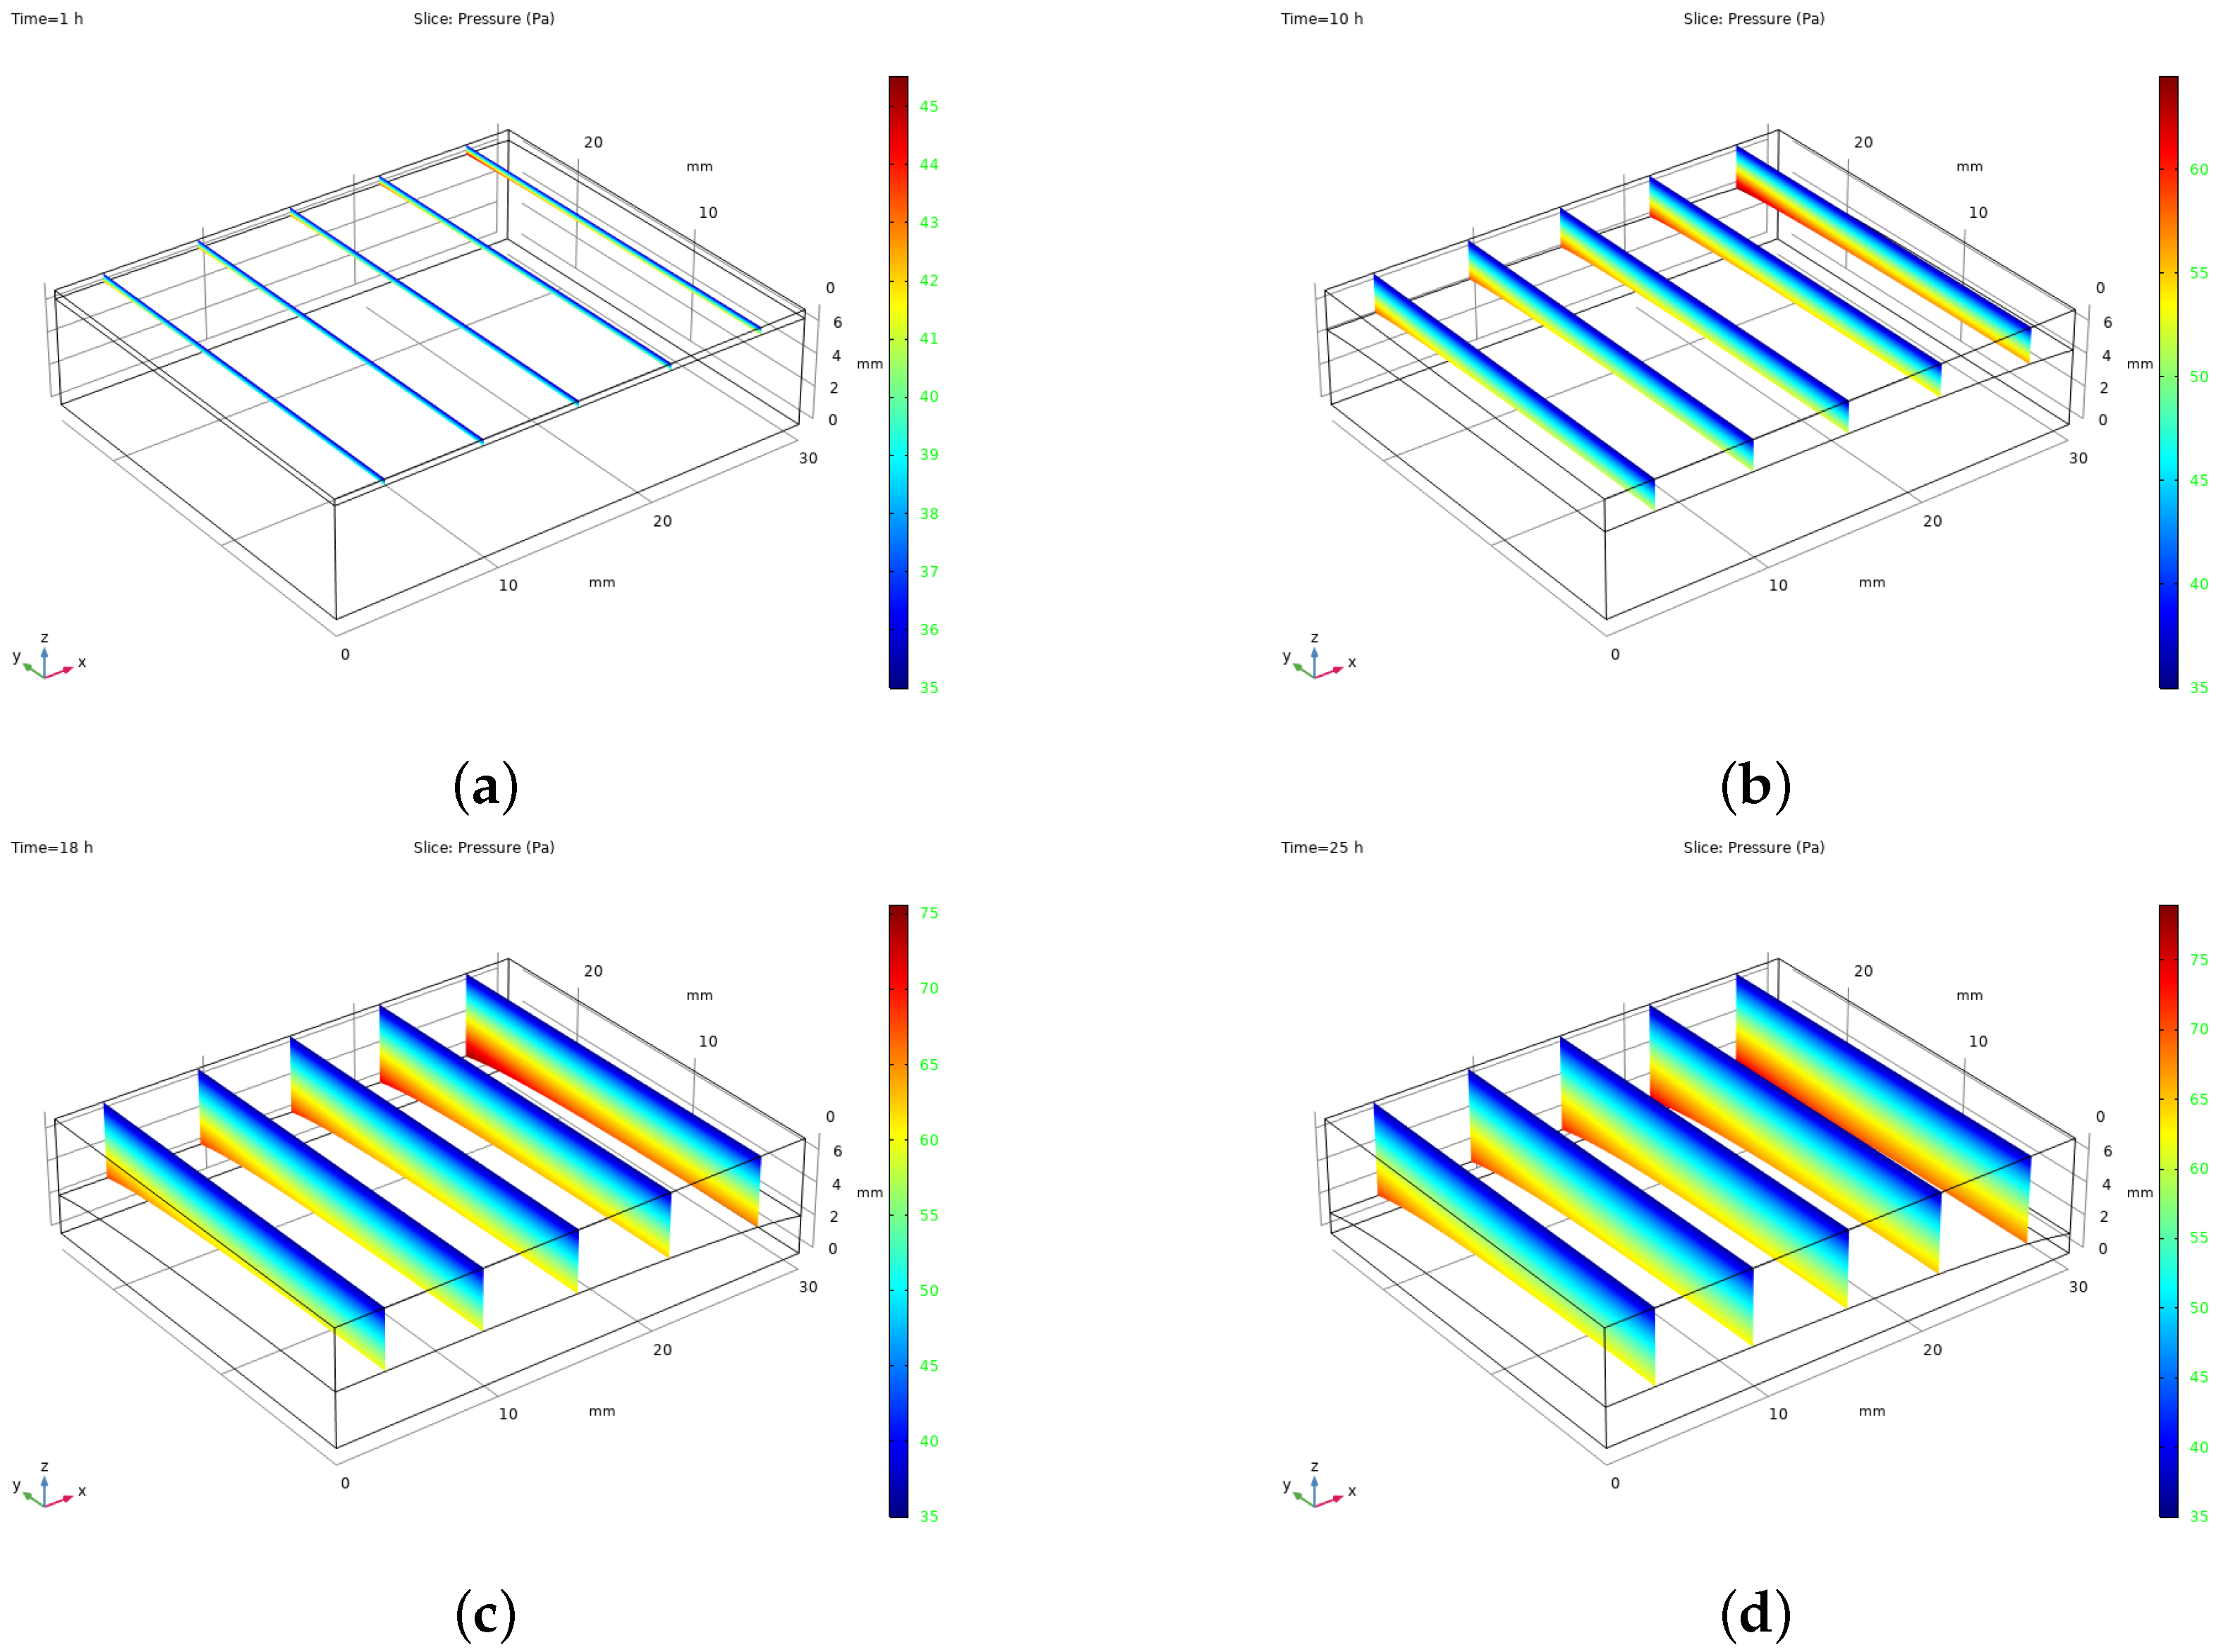
The vapour pressure patterns found in camel milk during standard freeze drying are illustrated in Figure 7. This computational analysis, which simplifies the process by disregarding mass movement within the frozen portion, focuses solely on how the pressure changes within the dried area.

Figure 7.
Vapour pressure distribution throughout the sublimation drying process at different time intervals: (a) 1 h, (b) 10 h, (c) 18 h, and (d) 25 h.
3.3. Parametric Study
This subsection presents a comprehensive parametric analysis aimed at understanding how the sample thickness and chamber pressure influence heat and mass transfer during the vacuum sublimation drying of camel milk.
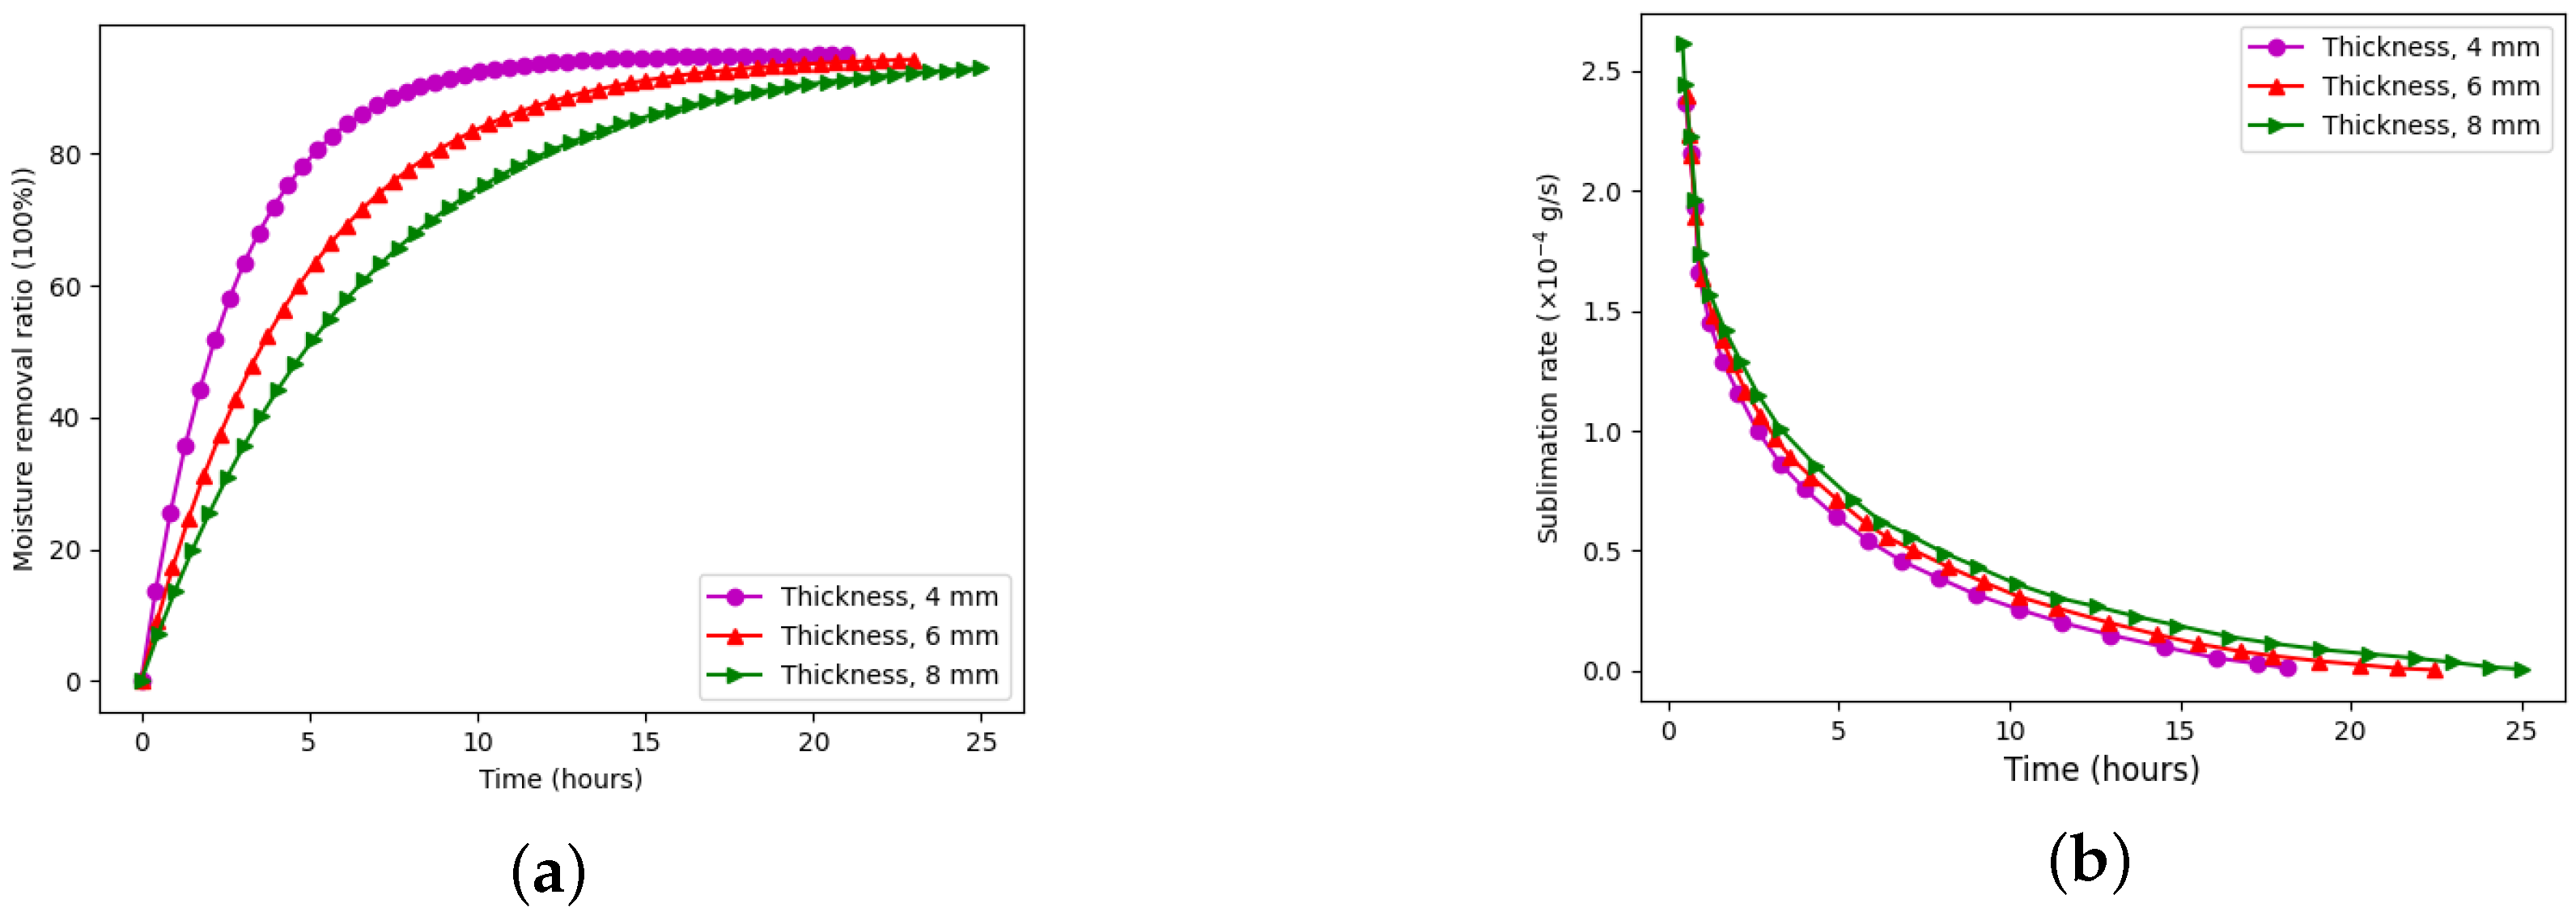
We first investigated the effect of the sample thickness on the moisture removal efficiency. Samples with thicknesses of 4 mm, 6 mm, and 8 mm were tested under constant conditions: a shelf temperature of −20 °C and a chamber pressure of 105 Pa.
Figure 8a illustrates the drying duration versus the moisture removal ratio for the three sample thicknesses. A clear inverse relationship is observed: thinner samples dry significantly faster. Specifically, the 4 mm sample (pink line) reaches approximately 95% moisture removal in about 10 h, while the 6 mm sample (red line) takes roughly 15 h, and the 8 mm sample (green line) requires nearly 20 h to achieve 90% removal. This is attributed to the shorter vapour diffusion paths in thinner samples, facilitating faster moisture escape.
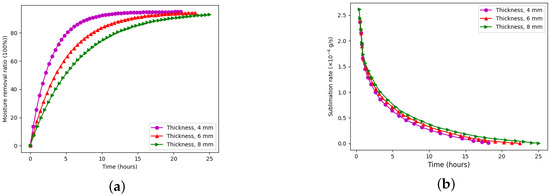
Figure 8.
Effects of sample thickness on (a) moisture removal ratio and (b) sublimation rate during the vacuum sublimation drying process.
Figure 8b shows the corresponding sublimation rate. Interestingly, thicker samples exhibit higher peak sublimation rates, due to the greater initial water content and stronger vapour pressure gradients. However, this advantage is offset by prolonged drying times and higher energy demands, making thinner samples more desirable from an energy efficiency perspective.
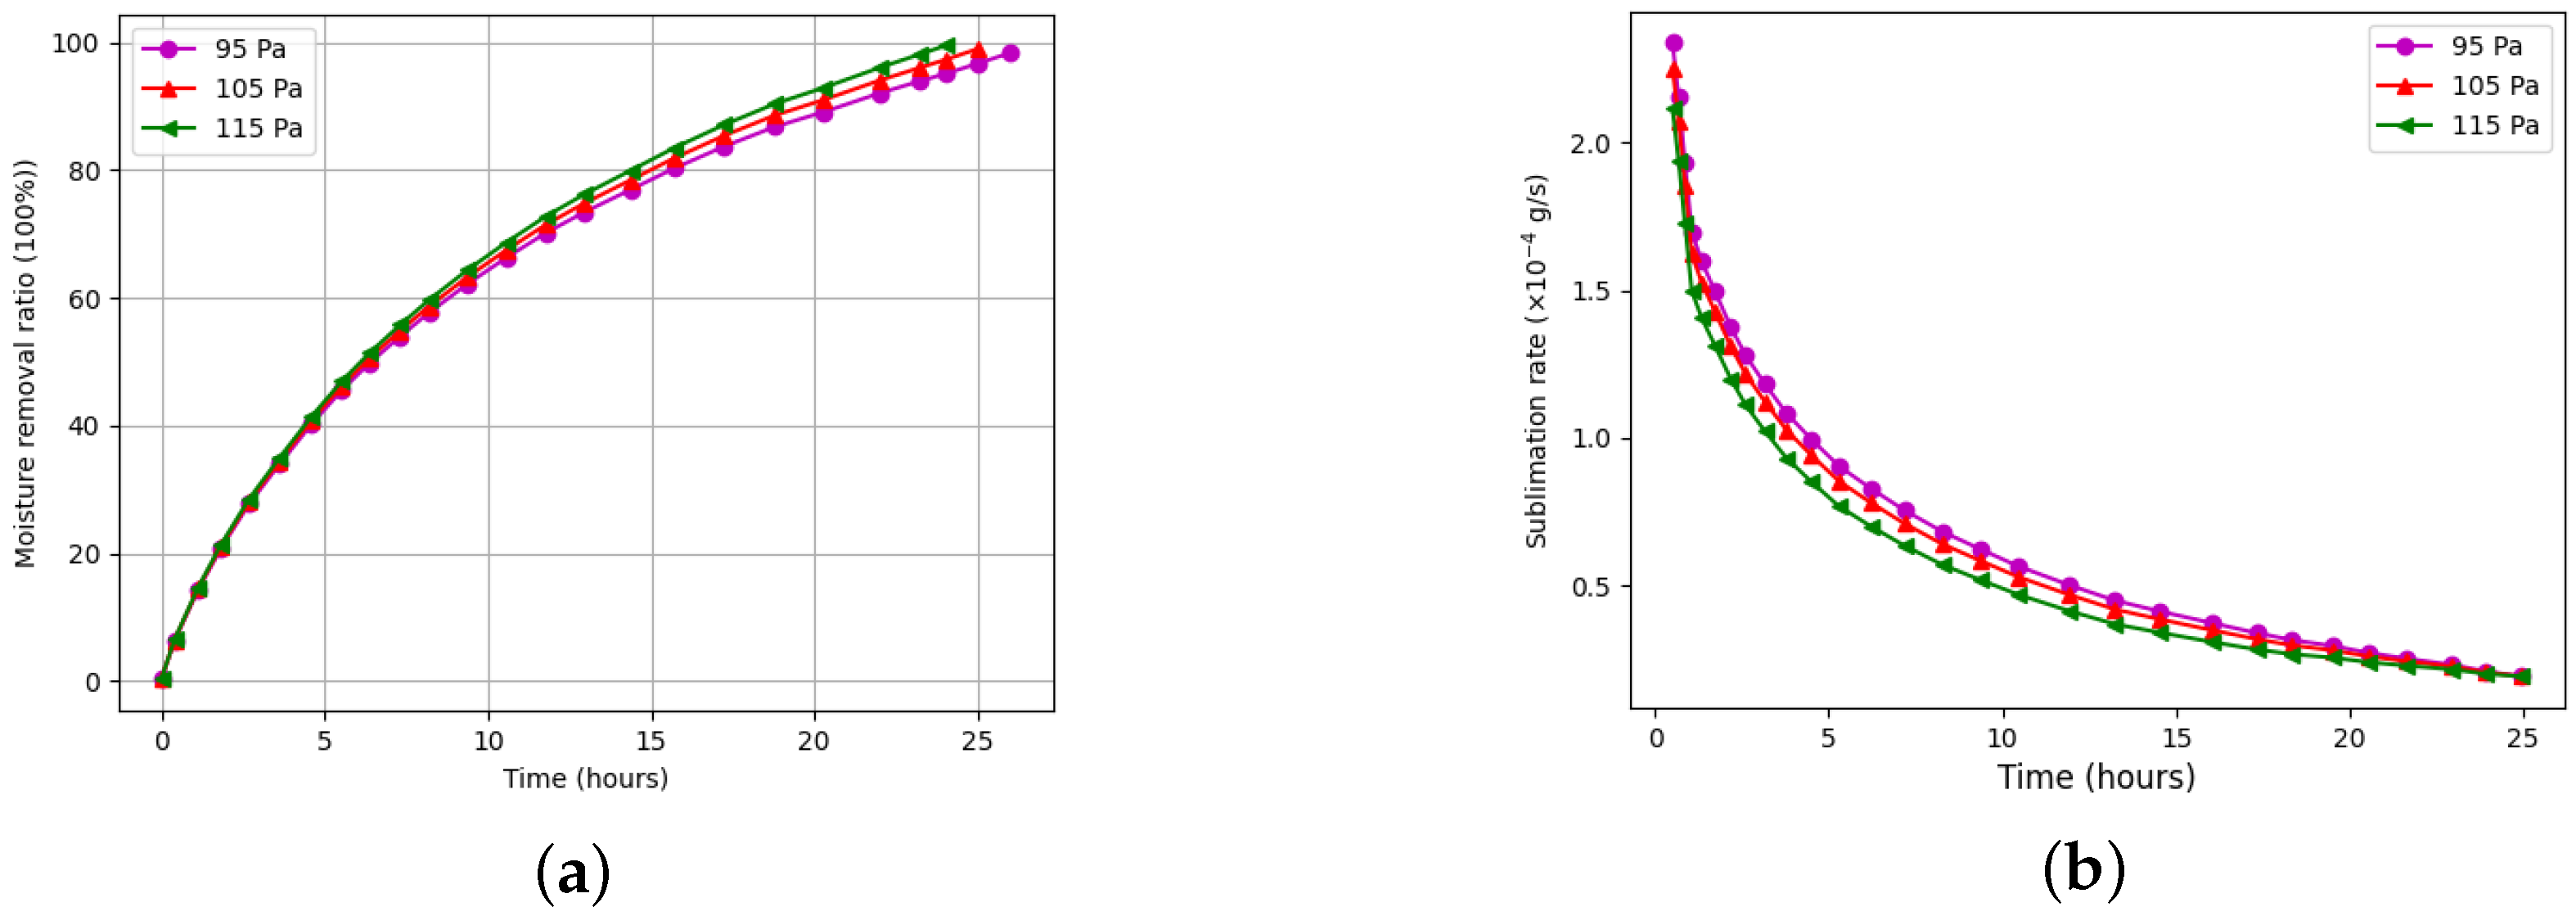
We also studied the impact of the chamber pressure on the drying process. Figure 9a shows that lowering the chamber pressure from 115 Pa to 95 Pa reduces the total drying time by approximately 30 min. This improvement is primarily due to enhanced vapour diffusion and a lower sublimation temperature at a reduced pressure. However, it must be noted that operating the vacuum system at lower pressures incurs higher energy costs.
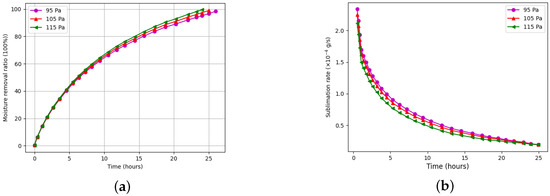
Figure 9.
Effects of chamber pressure on (a) moisture removal ratio and (b) sublimation rate.
Figure 9b reveals that the sublimation rate initially increases with decreasing pressure, especially in the early stages. However, after approximately five hours, this advantage diminishes as the vapour pressure gradient stabilises, and the sublimation rate levels off across all cases. This confirms that the benefit of pressure reduction is most significant during the early drying phase.
These findings indicate that both the chamber pressure and sample thickness are critical control variables in improving the drying efficiency. To meet international standards requiring final moisture content below 4%, it is advisable to maintain sample thicknesses below 8 mm. Furthermore, while reduced chamber pressures accelerate drying, their contribution to energy savings must be balanced against the increased operational cost of deeper vacuum levels.
Since no pretreatment was applied, variations in the fat globule distribution, protein aggregates, and indigenous microorganisms may have influenced the local heat and mass transfer rates. This factor could contribute to heterogeneity in the drying kinetics and the formation of structural features such as cracks.
From an industrial perspective, drying performance can be scaled by using larger trays or parallel tray systems within the chamber. However, the use of very thin layers in small trays may become energetically inefficient due to the higher relative overhead. Future work will focus on integrating predictive process control, energy monitoring, and optimisation algorithms to enhance the sustainability and reduce the carbon footprint of freeze drying operations in dairy processing.
While thinner samples significantly enhance the drying speed and energy efficiency, they also reduce the batch volume per tray. In industrial-scale settings, this may necessitate more frequent batch cycles to meet production targets, increasing the operational and labor costs. Hence, a trade-off exists between maximising energy efficiency and maintaining high throughput, which must be considered in process optimisation. Our results are consistent with those in [21], which also reported improved drying efficiency at lower pressures and thinner sample layers. However, unlike the previous 2D model, our 3D simulation provides a more detailed parametric and energy analysis. Notably, we observed a 58% SEC reduction when reducing the thickness from 8 mm to 4 mm and further discussed the trade-off between energy efficiency and production capacity, which was not addressed in earlier studies.
Future work should include detailed microstructural characterisation—such as SEM or micro-CT imaging—to quantify the pore morphology and connect these features directly to the heat and mass transfer behavior in porous matrices during sublimation drying.
3.4. Energy Performance Analysis
Evaluating energy efficiency is essential in assessing the sustainability and scalability of vacuum sublimation drying processes. In this study, we estimated the specific energy consumption (SEC) of camel milk drying based on the equipment’s electrical power and the amount of water removed.
The vacuum freeze dryer used in our experiments operates at a rated power of 14.5 kW. For typical drying durations of up to 24 h per batch, the total energy consumed is
The volume of camel milk processed in each tray was 1080 cm3 (45 cm × 40 cm × 0.6 cm), which corresponds to a mass of approximately 1.112 kg, assuming a density of 1.03 g/cm3. Given water content of 87.47%, the mass of water removed during sublimation is
Hence, the specific energy consumption is calculated as
To investigate how the drying conditions affect the energy consumption, we estimated the SEC for different sample thicknesses while keeping other parameters constant. Thinner samples dried significantly faster, reducing the total energy consumption required per unit of water removed.
Figure 10 illustrates the relationship between the sample thickness and SEC. When the thickness was reduced from 8 mm to 4 mm, the drying time decreased from 24 h to 10 h, leading to a substantial drop in SEC from 358 kWh/kg to 149 kWh/kg—a reduction of nearly 58%. This trend demonstrates that optimising the geometric and process parameters can lead to major improvements in energy performance.
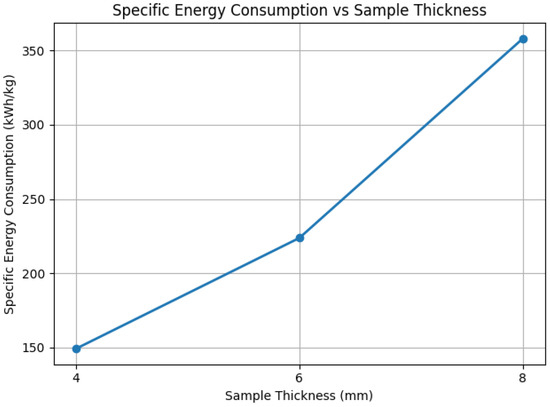
Figure 10.
Specific energy consumption (SEC) versus sample thickness. Thinner samples dry faster and require less energy per unit of water removed, highlighting the importance of geometric optimisation for energy-efficient drying.
A summary of the drying energy metrics across thicknesses is provided in Table 2.
Table 2.
Sample thickness effect on drying time and energy consumption.
These results emphasise that the sample thickness is a key factor not only in the drying kinetics but also in the overall energy performance. Although a 4 mm thickness yields the lowest specific energy consumption (SEC), it also reduces the amount of product processed per tray, potentially requiring more batches to achieve the same output. This trade-off between energy savings and production capacity presents a significant challenge for industrial scalability. Therefore, in practical applications, optimisation must balance SEC reduction with throughput targets. Industrial-scale solutions may involve the use of stacked tray configurations or expanded tray areas to maintain productivity while leveraging the energy efficiency of thinner layers.
Future work will involve scaling this analysis to multi-tray configurations, integrating real-time energy monitoring, and comparing the SEC across various drying methods, such as spray drying or microwave-assisted freeze drying. Additionally, life cycle energy assessment (LCEA) can be employed to quantify the environmental impact of freeze drying and guide sustainable processing design.
4. Conclusions
This study integrated experimental measurements and three-dimensional numerical simulations to analyse the vacuum sublimation drying process of camel milk. By quantifying the temperature distribution and sublimation front progression, the model demonstrated strong predictive accuracy, with an value of 0.94. Importantly, the study highlights the significant impact of process parameters such as the chamber pressure and sample thickness on both the drying efficiency and energy consumption.
A key contribution of this work lies in its energy-oriented analysis: reducing the sample thickness and optimising the chamber pressure significantly lowered the drying time and improved the thermal performance, thereby reducing the specific energy input per unit of removed moisture. These findings have direct implications for sustainable dairy processing and industrial freeze drying design, particularly in regions where camel milk production is expanding.
Although our current model assumes a rigid porous structure, experimental observations reveal that cracks and deformations can arise during drying, affecting local heat and mass transfer. Future work should extend this model by coupling heat and mass transfer with poromechanical deformation to account for these dynamic effects.
Future work will also involve incorporating real-time process monitoring and control algorithms aimed at further improving the energy performance, as well as conducting a comparative life cycle energy analysis with alternative drying methods. The ultimate goal is to enhance the viability of freeze drying technology in energy-constrained or sustainability-focused applications.
Author Contributions
Conceptualisation, A.A. and A.R.; methodology, A.A. and A.R.; software, D.D.; writing—review and editing, A.A. and A.R.; visualisation, A.A. and S.S.; supervision, A.R. and S.S.; project administration, A.R.; funding acquisition, A.R. All authors have read and agreed to the published version of the manuscript.
Funding
This research was funded by the Committee of Science of the Ministry of Science and Higher Education of the Republic of Kazakhstan (Grant No. BR21881957).
Data Availability Statement
The original contributions presented in this study are included in the article. Further inquiries can be directed to the corresponding authors.
Conflicts of Interest
The authors declare that they have no conflicts of interest.
References
- Konuspayeva, G.; Faye, B. Recent Advances in Camel Milk Processing. Animals 2021, 11, 1045. [Google Scholar] [CrossRef]
- Ibrahim, A.H.; Khalifa, S.A. Effect of Freeze-Drying on Camel’s Milk Nutritional Properties. Int. Food Res. J. 2015, 22, 1438–1445. Available online: https://www.proquest.com/scholarly-journals/effect-freeze-drying-on-camels-milk-nutritional/docview/1698633458/se-2 (accessed on 12 June 2025).
- Zhang, B.Y.; Xu, S.; Villalobos-Santeli, J.A.; Huang, J.-Y. Fouling Characterization of Camel Milk with Comparison to Bovine Milk. J. Food Eng. 2020, 285, 110085. [Google Scholar] [CrossRef]
- Magjeed, N.A. Corrective Effect of Camel Milk on Some Cancer Biomarkers in Blood of Rats Intoxicated with Aflatoxin B1. J. Saudi Chem. Soc. 2005, 9, 253–263. [Google Scholar]
- Shabo, Y.; Barzel, R.; Margoulis, M.; Yagil, R. Camel Milk for Food Allergies in Children. Immunol. Allergy 2005, 7, 796–798. Available online: https://www.scopus.com/record/display.uri?eid=2-s2.0-29444443127&origin=inward&txGid=7821cbc3977fad9e47f6be0b138afb62 (accessed on 12 June 2025).
- Agrawal, R.P.; Swami, S.C.; Beniwal, R.; Kochar, D.K.; Sahani, M.S.; Tuteja, F.C.; Ghouri, S.K. Effect of Camel Milk on Glycemic Control, Risk Factors and Diabetes Quality of Life in Type-1 Diabetes: A Randomised Prospective Controlled Study. J. Camel Pract. Res. 2003, 10, 45–50. Available online: https://www.scopus.com/inward/record.uri?eid=2-s2.0-0345770643&partnerID=40&md5=92133790c8538142a2ad8a4699fd65a7 (accessed on 12 June 2025).
- Pikal, M.J. Freeze Drying. In Encyclopedia of Pharmaceutical Technology, 3rd ed.; Taylor and Francis: London, UK, 2006. [Google Scholar]
- Liapis, A.I.; Litchfield, R.J. Optimal Control of a Freeze Dryer-I: Theoretical Development and Quasi Steady State Analysis. Chem. Eng. Sci. 1979, 34, 975–981. [Google Scholar] [CrossRef]
- Liapsis, A.I.; Marchello, J.M. Advances in the Modelling and Control of Freeze Drying. In Advances in Drying; Mujumdar, A.S., Ed.; Hemisphere Publishing Corporation: Washington, DC, USA, 1984; Volume 3, pp. 217–244. [Google Scholar]
- Tang, M.M.; Liapis, A.I.; Marchello, J.M. A Multi-Dimensional Model Describing the Lyophilization of a Pharmaceutical Product in a Vial. In Proceedings of the 5th International Drying Symposium, Cambridge, MA, USA, 13–16 August 1986; Mujumdar, A.S., Ed.; Hemisphere Publishing Corporation: New York, NY, USA, 1986; pp. 57–64. [Google Scholar]
- Mascarenhas, W.J.; Akay, H.U.; Pikal, M.J. A Computational Model for Finite Element Analysis of the Freeze-Drying Process. Comput. Methods Appl. Mech. Eng. 1997, 148, 105–124. [Google Scholar] [CrossRef]
- Nastaj, J.F.; Witkiewicz, K. Mathematical Modeling of the Primary and Secondary Vacuum Freeze Drying of Random Solids at Microwave Heating. Int. J. Heat Mass Transf. 2009, 52, 4796–4806. [Google Scholar] [CrossRef]
- Georgiev, K.; Kosturski, N.; Margenov, S.; Starý, J. On Adaptive Time Stepping for Large-Scale Parabolic Problems: Computer Simulation of Heat and Mass Transfer in Vacuum Freeze-Drying. J. Comput. Appl. Math. 2009, 226, 268–274. [Google Scholar] [CrossRef]
- Zhang, H.; Zhang, J.; He, L. Effects of the Sample’s Porous Structure on the Process of Vacuum Freeze Drying. In Proceedings of the IEEE International Conference Bioinformatics and Biomedical Engineering, Chengdu, China, 18–20 June 2010; pp. 4244–4713. [Google Scholar] [CrossRef]
- Scutella, B.; Plana-Fattori, A.; Passot, S.; Bourles, E.; Fonseca, F.; Flick, D.; Trelea, I.C. 3D Mathematical Modelling to Understand a Typical Heat Transfer Observed in Vial Freeze Drying. Appl. Therm. Eng. 2017, 126, 226–236. [Google Scholar] [CrossRef]
- Srinivasan, G.; Muneeshwaran, M.; Raja, B. Numerical Investigation of Heat and Mass Transfer Behavior of Freeze Drying of Milk in Vial. Heat Mass Transf. 2019, 55, 2073–2081. [Google Scholar] [CrossRef]
- El-Maghlany, W.M.; Bedir, A.E.; Elhelw, M.; Attia, A. Freeze-Drying Modeling via Multi-Phase Porous Media Transport Model. Int. J. Therm. Sci. 2019, 135, 509–522. [Google Scholar] [CrossRef]
- Chen, B.-L.; Jang, J.-H.; Amani, M.; Yan, W.-M. Numerical and Experimental Study on the Heat and Mass Transfer of Kiwifruit during Vacuum Freeze-Drying Process. Alex. Eng. J. 2023, 73, 427–442. [Google Scholar] [CrossRef]
- Woo, S.-H.; Noh, J.-H.; Raza, H.; Kim, H. Numerical Modeling of Sublimation of Ammonium Carbamate Applied to Supply System of NOx Reductant. Energies 2021, 14, 3795. [Google Scholar] [CrossRef]
- Shao, J.; Jiao, F.; Nie, L.; Wang, Y.; Du, Y.; Liu, Z. Study on Sublimation Drying of Carrot and Simulation by Using Cellular Automata. Processes 2023, 11, 2507. [Google Scholar] [CrossRef]
- Rakhmatulina, A.; Altybay, A.; Imanbayeva, N.; Bagitova, S.; Baikonys, A. Numerical Simulation and Experimental Analysis of Mare’s Milk Sublimation Drying. Processes 2025, 13, 206. [Google Scholar] [CrossRef]
- Experimental Setup. Available online: http://www.yuxiang17.com/productshow_161.html (accessed on 17 May 2025).
- Lopez-Quiroga, E.; Antelo, L.T.; Alonso, A.A. Time-Scale Modeling and Optimal Control of Freeze–Drying. J. Food Eng. 2012, 111, 655–666. [Google Scholar] [CrossRef]
- Konuspayeva, G.; Faye, B.; Loiseau, G. The Composition of Camel Milk: A Meta-Analysis of the Literature Data. J. Food Compos. Anal. 2009, 22, 95–101. [Google Scholar] [CrossRef]
- Song, C.S.; Nam, J.H.; Kim, C.-J.; Ro, S.T. Temperature Distribution in a Vial during Freeze-Drying of Skim Milk. J. Food Eng. 2005, 67, 467–475. [Google Scholar] [CrossRef]
- Nam, J.H.; Song, C.S. Numerical Simulation of Conjugate Heat and Mass Transfer during Multi-Dimensional Freeze Drying of Slab-Shaped Food Products. Int. J. Heat Mass Transf. 2007, 50, 4891–4900. [Google Scholar] [CrossRef]
- Warning, A.D.; Arquiza, J.M.R.; Datta, A.K. A Multiphase Porous Medium Transport Model with Distributed Sublimation Front to Simulate Vacuum Freeze Drying. Food Bioprod. Process. 2015, 94, 637–648. [Google Scholar] [CrossRef]


Disclaimer/Publisher’s Note: The statements, opinions and data contained in all publications are solely those of the individual author(s) and contributor(s) and not of MDPI and/or the editor(s). MDPI and/or the editor(s) disclaim responsibility for any injury to people or property resulting from any ideas, methods, instructions or products referred to in the content. |
© 2025 by the authors. Licensee MDPI, Basel, Switzerland. This article is an open access article distributed under the terms and conditions of the Creative Commons Attribution (CC BY) license (https://creativecommons.org/licenses/by/4.0/).