Article

Strategies for Workplace EV Charging Management

by
Natascia Andrenacci
1,*,
Antonino Genovese
2 and
Giancarlo Giuli
1
1
Sustainable Mobility and Transport Laboratory, C.R. Casaccia, ENEA, Via Anguillarese, 00193 Rome, Italy
2
AGENS Viale Pasteur, 10, 00144 Rome, Italy
*
Author to whom correspondence should be addressed.
Energies 2025, 18(2), 421; https://doi.org/10.3390/en18020421
Submission received: 19 December 2024 / Revised: 13 January 2025 / Accepted: 14 January 2025 / Published: 19 January 2025
(This article belongs to the Special Issue Future Smart Energy for Electric Vehicle Charging)

Abstract

:
Electric vehicles (EVs) help reduce transportation emissions. A user-friendly charging infrastructure and efficient charging processes can promote their wider adoption. Low-power charging is effective for short-distance travel, especially when vehicles are parked for extended periods, like during daily commutes. These idle times present opportunities to improve coordination between EVs and service providers to meet charging needs. The present study examines strategies for coordinated charging in workplace parking lots to minimize the impact on the power grid while maximizing the satisfaction of charging demand. Our method utilizes a heuristic approach for EV charging, focusing on event logic that considers arrival and departure times and energy requirements. We compare various charging management methods in a workplace parking lot against a first-in-first-out (FIFO) strategy. Using real data on workplace parking lot usage, the study found that efficient electric vehicle charging in a parking lot can be achieved either through optimized scheduling with a single high-power charger, requiring user cooperation, or by installing multiple chargers with alternating sockets. Compared to FIFO charging, the implemented strategies allow for a reduction in the maximum charging power between 30 and 40%, a charging demand satisfaction rate of 99%, and a minimum SOC amount of 83%.

1. Introduction

Electric mobility is transforming our daily travel experiences, driven by advancements in electric storage systems. Over the past twenty years, lithium-ion batteries (LIBs) have made remarkable progress, improving not only energy efficiency but also durability, reliability, and safety. Their price is expected to halve in the next two years, [1] boosting the electric vehicle market. Emerging technologies, such as solid-state lithium batteries, promise extended vehicle ranges, shorter charging times, and reduced costs [2]. It is widely believed that an affordable and appropriately sized battery is crucial for the success of electric mobility, and EV manufacturers are actively working toward this goal [3]. However, potential buyers of electric vehicles (EVs) often overestimate the battery capacity needed to satisfy their mobility requirements. This tendency is influenced by “range anxiety,” which serves as a barrier to the adoption of EVs [4], although more mature markets show that expert EV users experience relatively little range anxiety [5]. A user-focused charging infrastructure and the implementation of efficient charging processes, particularly smart charging, can significantly facilitate the broader adoption of electric vehicles [6,7].
In daily travel situations involving short distances, low-power charging proves to be highly effective, especially when vehicles need to remain stationary for extended periods. A typical example of this is the daily commute from home to work, which usually entails limited mileage and considerable periods of vehicle inactivity. These long idle times create opportunities to implement various management strategies for addressing charging needs. By establishing a smart charging network, electric vehicles can communicate with service providers to better coordinate their charging activities.

1.1. Literature Overview

This section provides a concise overview of recent studies on smart charging and charge management. Table 1 provides a summary of the review works, while Table 2 outlines some characteristics of the research articles analyzed in this section.
Implementing smart charging is a complex process that requires a clearly defined regulatory framework, minimum technical requirements, and standardization. Additionally, it can involve dynamic pricing and the creation of a new market structure and rules, all while enhancing cooperation among various stakeholders [6]. From users’ perspectives, a study in [5] shows that EV drivers are open to smart charging, although they prefer maintaining control over their charging sessions. A qualitative review of best practices in the EU and US markets shows that the most effective smart charging policy strategies include cost-reflective pricing, the use of smart technology, and careful, integrated planning of charging infrastructure [7]. Many researchers have focused on managing smart charging stations to enhance energy management and improve the quality of charging services while adhering to the station’s service constraints [8]. These studies cover various aspects of charging services and architecture, including bidirectional charging, integration with the electric grid and renewable energy sources, and various charge control strategies. They also address technological, communication, and security issues [9]. Charging management is a multi-objective control problem where station profitability, user preferences, network requirements, and stability should be simultaneously optimized. National laws and regulations may influence the possibility of implementing smart and bidirectional charging models, as investigated in [10].
Coordinated charging of electric vehicles can be organized in either a centralized or decentralized manner, typically under the oversight of an agent known as an aggregator [11]. In centralized charging control, the aggregator has exclusive responsibility for coordinating the charging process for electric vehicles. Conversely, in decentralized charging management, individual electric vehicle owners make their own charging decisions, while aggregators can only influence these decisions indirectly, often through incentives. Another possible class of approaches involved a hierarchical control framework, which has features of both centralized and decentralized control [12]. Decentralized and hierarchical approaches are often used in charging management, while centralized approaches are favored in microgrid control optimization.

1.1.1. Charge Management

Centralized control is best suited to situations with a limited number of users such as a residential complex, a work parking lot, or a charging infrastructure. The management of domestic charging is addressed in [16] regarding condominium parking, while [17] examines domestic charging managed on a digital platform run by a single energy aggregator. The work in [18] proposes an approach for charging control in residential area based on smart meters, which rely on the local sensing and computing capability of the meter for communication with the single EV, and global coordination of advanced metering infrastructures for charging regulation. A centralized charging strategy for a charging infrastructure is proposed in [19]; the aim is to optimize the charging time, selecting the best charging protocol that maximizes the charging capacity while minimizing the queuing delay. The study in [20] designs a charging architecture that features a centralized control system that acts as a common server for public charging infrastructure and coordinates the overall vehicle charging cycle with a reservation-based strategy. The realization of a centralized management system software for electric vehicle charging is presented in [21]. The realization includes a web application, a database, and a mobile application. In [22], they describe a scalable centralized charging approach to manage EV fleets considering power grid impact and user comfort.
A mixed approach is proposed in [23] where the charging management is implemented using electricity price signals and centralized charging control strategy. In [24], a two-stage hierarchical optimization method is designed to facilitate dynamic control of many EVs.
In [25], they propose a demand management system for charging at public stations that uses a predictive control model. The system adapts in real time to grid conditions, acting on electricity prices to influence user preferences. In [26], they describe a distributed, multi-agent reinforcement learning approach that optimizes the decisions of each charging point with a view to minimizing costs while maximizing user satisfaction. The work in [27] proposes a dynamic optimization algorithm that aims to schedule EV charging based on a priority index attributed to each charge request, so as not to exceed the assigned maximum power capacity in each electrical substation. A similar approach based on the classification of charging requests is illustrated in [28]. The priority level assignment aims to maximize the satisfied energy requests, while respecting the charging station power limit.
Recent studies [13,29,30] have examined the role of AI in managing charging and the overall EV ecosystem, which is expected to become increasingly important in the coming years.

1.1.2. Integration with Renewable Energy Sources

Integrating renewable energy sources into smart grids is a crucial step toward decarbonization; however, it poses significant challenges in managing power flows effectively. These flows should be optimized to accommodate the variability of renewable sources and the unpredictability of energy demand. The work in [31] develops an intelligent controller that coordinates the charging and discharging of EV batteries connected to a charging station. The fuzzy logic controller manages the integration of EVs and charging station with the electricity grid, local renewable sources and a storage system. Similarly, in [32], a multi-objective optimization algorithm is proposed to reduce the operating cost of the charging station and optimize the utilization of energy from the distribution grid and a photovoltaic system. A new power control method is proposed and implemented in [33,34] to manage distributed photovoltaic impacts, using dynamic management of EV fleet charging power demand. Charge management in residential applications is also relevant. A review of systems for intelligent home energy management with grid-connected photovoltaic (PV) solar panels and integrated with electric vehicles is provided in [14]. Integrated energy management of EVs and renewable energy sources are particularly relevant for microgrids (MG). Many approaches have been proposed for the optimal management of MG; an improved version of the Runge Kutta optimizer has been developed in [35] to manage a system composed of two diesel generators, two wind turbines, three fuel cells, an electrical vehicle charging station, and interconnected loads. A bald-eagle search optimizer is applied to a similar problem considering wind turbine, photovoltaic, micro turbine, fuel cell, storage battery, PHEVs, and grid in [36]. In [37], a metaheuristic algorithm is used to simultaneously minimize the daily operating costs and net environmental pollution of a small MG with a distributed power generation system, considering the charging demand of plug-in hybrid electric vehicles (PHEVs) and consumer load demands.

1.1.3. Bidirectional Energy Exchange

Bidirectional energy exchange allows EVs to act not only as loads but also as energy sources, representing an active actor in the smart grid ecosystem [15]. The authors in [38] propose a solution for bidirectional charging, where electric vehicles can act as mobile power sources for homes, buildings, and the electricity grid, based on the use of smart meters. The preferences of an electric vehicle user are the input of an algorithm for bidirectional intelligent charging, which integrated with the needs of providing auxiliary services to the grid and local energy exchange, allowing the model to adapt to various conditions [39].

1.2. Contribution of This Work

This study focuses on managing the charging of electric vehicles in a workplace parking lot. An analysis of actual data regarding car movements shows that, on average, these vehicles travel relatively short distances and stay parked for several hours. The study explores various management strategies that leverage these long idle periods to meet the charging needs of the cars. Solutions for planning the operations of charging stations in urban areas that include coordinated planning of charging points have been examined in [40,41]. Our work differs from previous ones in the use of real travel data associated to the case study, which allows a more precise analysis of the advantages associated with different approaches to coordinated management of charging points. Moreover, the case study of a private parking lot allows for a centralized control management that is more difficult to implement in a public charge infrastructure. The study referenced in [42] introduces a charging management system for a residential parking lot that enhances fairness in the charging process, considering various user profiles. The parking lot is equipped with charging stations that have multiple sockets. This work shares several similarities with the approach outlined in the current paper. However, instead of addressing an optimization problem, our method uses a heuristic approach to charging management that does not require a priori knowledge of the arrivals. While heuristic approaches are often used to solve optimization problems, our method takes a more adaptive strategy. Instead of finding a single optimal solution that may be rigid and inflexible, we propose a heuristic method that can dynamically adjust to varying charging demands without needing prior knowledge of vehicle arrivals. Although this solution may not be the absolute best in every scenario, it is highly effective in a wide range of real-world conditions. This approach enables more robust and responsive charging management. This method is based on event logic, which considers the timing of EV arrivals and departures, as well as their energy requirements. A similar approach is proposed in [28], using a different method of prioritizing and fulfilling recharge requests compared to what is suggested here. Another difference from the work [28] is that we consider a scenario in which the number of charging points in the parking lot is lower than the charging requests, necessitating queue management.
The present study investigates effective strategies for managing EV charging demands within a designated parking lot. Specifically, this research addresses the following questions:
  • What is the minimum number of charging points required to accommodate the charging needs of the vehicle fleet?
  • How can charging infrastructure be designed to ensure equitable access for all vehicles?
  • What are the operational and logistical implications of different charging strategies?
By analyzing vehicle parking patterns and evaluating various charging scenarios, this study aims to provide valuable insights for optimizing EV charging infrastructure and enhancing the overall efficiency and sustainability of electric vehicle fleets.
The investigated infrastructure scenarios can be classified as follows according to the number of charging points (CPs):
  • Scenario 1 (CPs >= EVs):
    • Focus on managing power availability limits from the grid.
    • Strategies:
      Monitor key parameters (vehicle idle times, energy required).
      Modulate charging power.
      Manage start/end times of charging sessions.
  • Scenario 2 (CPs < EVs):
    • Focus on organizing access to CPs.
    • Strategies:
      Monitor key parameters (vehicle idle times, energy required).
      Manage start/end times of charging sessions (CPs rotation).
    • NOTE: logistics of the CPs’ accesses are not within the scope of the study.
We provide a comparison of various methods for managing the charging of EVs in a workplace parking lot, evaluating the performance of these methods against a first-in-first-out (FIFO) charging management strategy.
The key characteristics of the proposed methodology are as follows:
-
Charging management relies on basic information from the vehicles. Specifically, the system gathers only the state of charge (SOC) and the battery size to assess charging needs.
-
While knowledge of the stop duration can enhance optimization, the methodology still performs well even without this information. No a priori knowledge of the arrival time is necessary.
-
Various configurations of CPs are analyzed regarding their quantity, layout, and the power they can deliver.
-
The proposed methodology is applicable in scenarios where the available power in the parking lot is limited. This is particularly important since installed capacity is constrained by the limitations of the power distribution system, especially in urban areas.
The case study utilizes real data on the usage of a workplace parking lot. Each vehicle in the sample relates to the actual distances traveled between stops at the parking lot, which allows for a punctual evaluation of the energy requests.

2. Materials and Methods
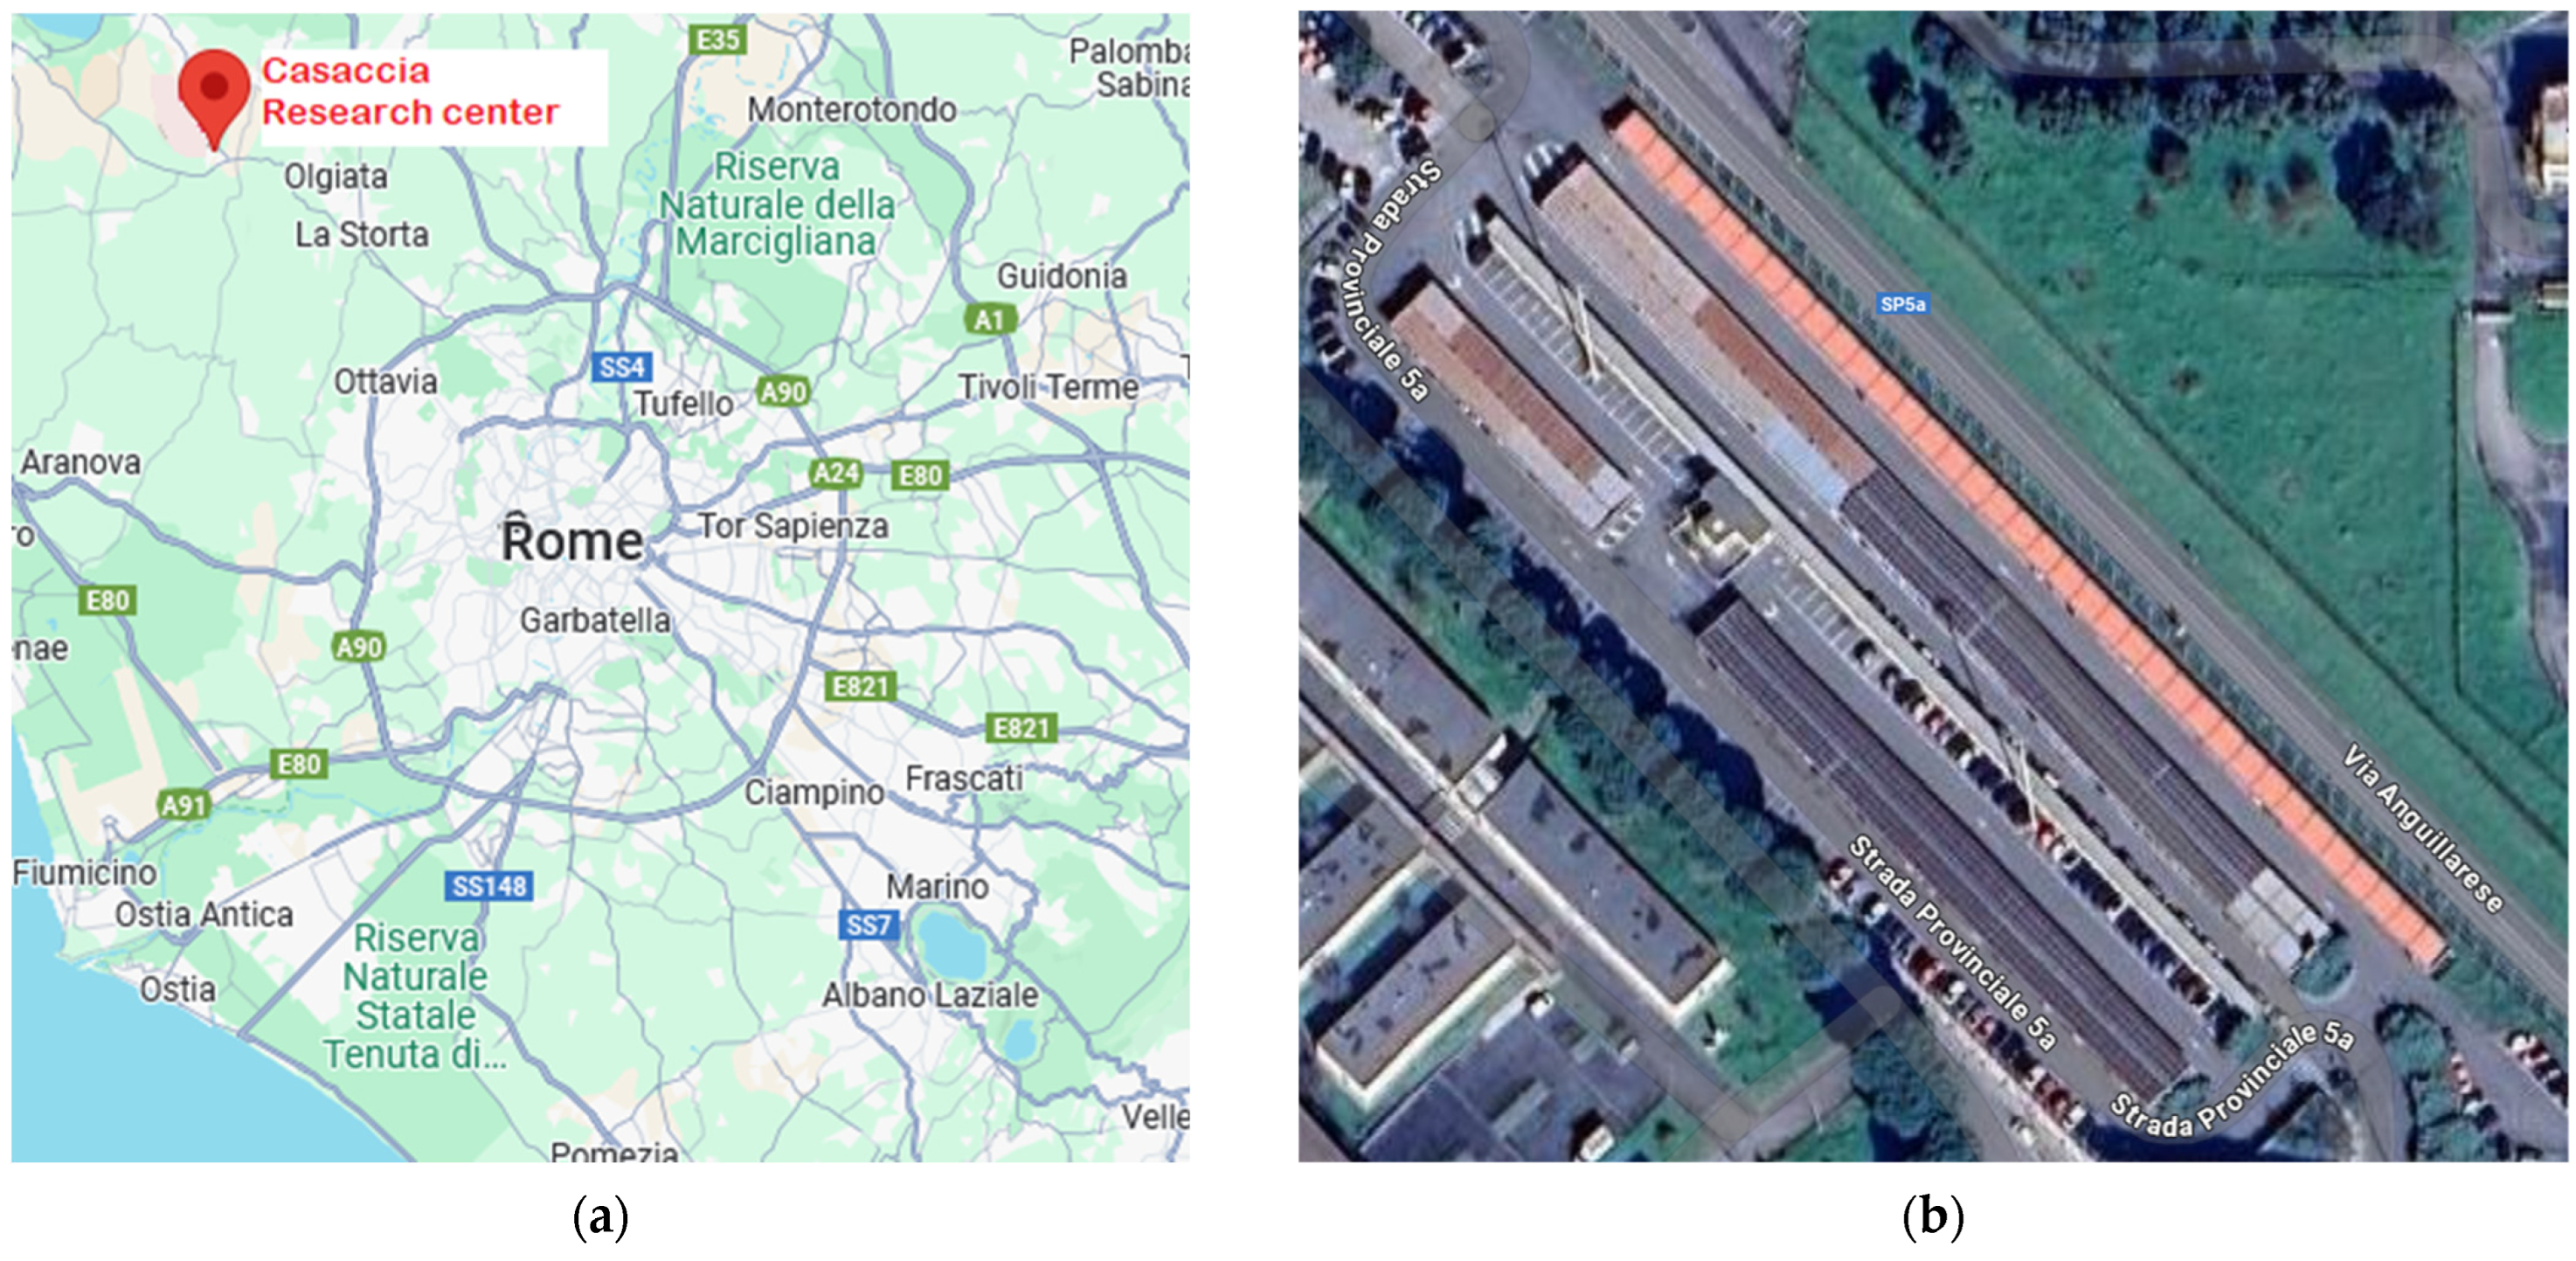
This study investigates different EV charging management methodologies in the context of home–work trips, considering the impact of charging operations on the company site’s power network and the effectiveness of the charging service. The analysis compares three different charging management strategies against the uncontrolled one to evaluate their effects and potential. The study aims to assess the benefits that can be obtained for the electricity network by developing specific charging management algorithms and optimizing the number of CPs while meeting the charging demand.
The study utilizes mobility data collected by vehicular devices to estimate distances and consumption for the charging management approaches. These data help identify recurring travel profiles, such as daily home-to-work trips, enabling better management of charging services, and supporting the design and implementation of an appropriate charging structure.

2.1. Data

Using in-vehicle location tracking systems has improved the coverage and accuracy of roadside investigations. In Italy, OctoTelematics operates a vehicle probe system for insurance profiling, which relies on the wireless exchange of information between a fleet of private vehicles and a data processing center [43]. The present study’s analysis relies on a set of OctoTelematis data concerning vehicles operating in the metropolitan area of Rome, covering over 150,000 cars and more than 157 million travel records throughout a complete solar year. Each vehicle’s device is equipped with a GPS, accelerometer, and GSM/GPRS communication device for information exchange with the data collection center. The recorded information includes the start and end time of the trip and the position, with sampling occurring every 2 km on urban or extra-urban roads and every 30 s on the highway. The vehicle data are organized into the following fields:
  • Terminal ID;
  • Date Time: UTC timestamp of the recording (dd-mm-yyyy hh:mm:ss);
  • Latitude: geographic coordinate in the WGS84 system in millionths of a degree;
  • Longitude: geographic coordinate in the WGS84 system in millionths of a degree;
  • Speed: instantaneous speed in km/h;
  • Direction: direction of travel (in degrees 0 = North, 90 = East, 180 = South, 270 = West);
  • Quality: GPS signal quality (1 = does not navigate, 2 = 2d, 3 = 3d);
  • Status: status (0 = departure, 1 = motion, 2 = arrival);
  • DeltaPos: distance in meters from the position of the previous point;
  • Road: road type attributed by OctoTelematics (U = urban, E = extra-urban, A = highway).
Our objective was to identify recurring trips and analyze the energy profiles related to commuter transfers at the Casaccia Research Center parking lot. We excluded any data that contained inconsistencies or errors, such as GPS inaccuracies. Specifically, we eliminated trips that did not follow the correct sequence of statuses (0-1-2), those with zero or negative distances, and trips that had missing recorded data. The data were then analyzed to identify movements belonging to the same travel chain, with each journey characterized by specific information as follows:
  • Trip ID.
  • Terminal ID.
  • Departure date and time.
  • Starting position.
  • Date and time of arrival.
  • Arrival position.
  • Distance travelled.
  • Trip duration.
  • Stop duration until next trip.
The data analysis aims to evaluate the demand for electricity to recharge EVs during stops at the workplace, originating from home–work commutes. We selected as a case study the “Casaccia” ENEA Research Center, located north of Rome and equipped with a large parking lot to accommodate employees’ and visitors’ vehicles (Figure 1). To evaluate the potential demand for charging, we must assume that the travel habits of the identified ICE vehicles are similar to those of EVs. In this way, based on the distances traveled and energy consumption of a typical BEV, we can estimate the charging demand for each stop.
Clustering techniques were applied to the initial set of trips, enabling us to identify the recurring stops made by each vehicle. Each vehicle is assigned an anonymous ID to ensure privacy. Notably, the recurring night stops helped us determine the residences of each user. Our focus is on vehicles that reside in the metropolitan area of Rome and make more than five stops at the specific location of Casaccia throughout the year. The total number of selected vehicles in this study is 38. A questionnaire conducted by the Casaccia Mobility Manager revealed that approximately 68% of the 578 respondents (who represent 70% of the total ENEA employees) use a car for their commute to work. The respondents work an average of 3.9 days in the office. The sample of 38 vehicles accounts for about 7% of the total fleet of ENEA workers. Given that in 2023, the share of plug-in electric cars in Italy is around 1.1% [44], we can consider this sample to be representative for the case study.
The analysis of trips and parking events enables us to estimate energy demand and its variability on both a weekly and annual scale. By examining the hourly distribution of daily energy demand, we can determine if there are peak periods of charging requests that require effective management.

2.2. Methods

The approach presented in this study aims to minimize the number of charging points in the parking lot while maximizing the satisfaction of charging demand. However, due to the dynamic nature of charging demand, defining a single universally optimal solution is challenging. Therefore, we employ a heuristic method to efficiently explore a vast solution space and identify feasible options that effectively balance these competing objectives. While this approach cannot guarantee an absolutely optimal solution, it offers a practical and adaptable solution suitable for various scenarios.
The analysis of stops at the workplace parking lot shows that, on average, they last for several hours. This characteristic enables various solutions for managing charging, particularly by adjusting the power levels and the number of CPs installed.
The proposed heuristic method can be summarized in the following steps:
  • Define the charging infrastructure scenario.
  • Explore solutions that prioritize reducing the number of CPs in charging infrastructure.
  • Identify feasible options that balance competing objectives.
  • Note: it cannot guarantee absolute optimality but offers a practical and adaptable solution.
To analyze the impacts of the different charging management strategies, we can identify two infrastructure scenarios; in the first, the number of CPs is equal or larger than the number of vehicles (CPs ≥ EVs); in the second, each CP is used by multiple EVs (CPs < EVs).
In the first scenario, the charge management strategy addresses the potential issue of power availability limits imposed by the grid connection. To enhance the efficiency of charge implementation, the system needs to monitor key parameters, such as vehicle idle times and the amount of energy required. Leveraging this information can significantly enhance the efficiency of request fulfillment. Effective strategies can include modulating the charging power, managing the start and end times of charging sessions, or implementing hybrid approaches.
If the number of CPs is lower than the number of EVs, a system based on organizing access to the CPs through a booking service and managing parking and charging spaces is necessary. These ancillary services for managing access to parking and charging bays will not be investigated in the present work. Instead, our focus will be on the energy management of resources needed to meet the charging demand.
To find the optimal solution for charging power in relation to the number of CPs and the management of the request queue, we will consider charging stalls equipped with sockets, organized hierarchically in a master–slave structure, as illustrated in Figure 2.
The master connects to the power grid, monitors the charging points, and controls the activation of charging. The CPs are cabled with a digital bus, which facilitates communication between the master and the CPs, and a power bus for energy exchange. This system exchanges information about the presence of vehicles and the safety measures in place for users. Based on this architecture, we will explore how to implement an intelligent management system that can effectively address demand.

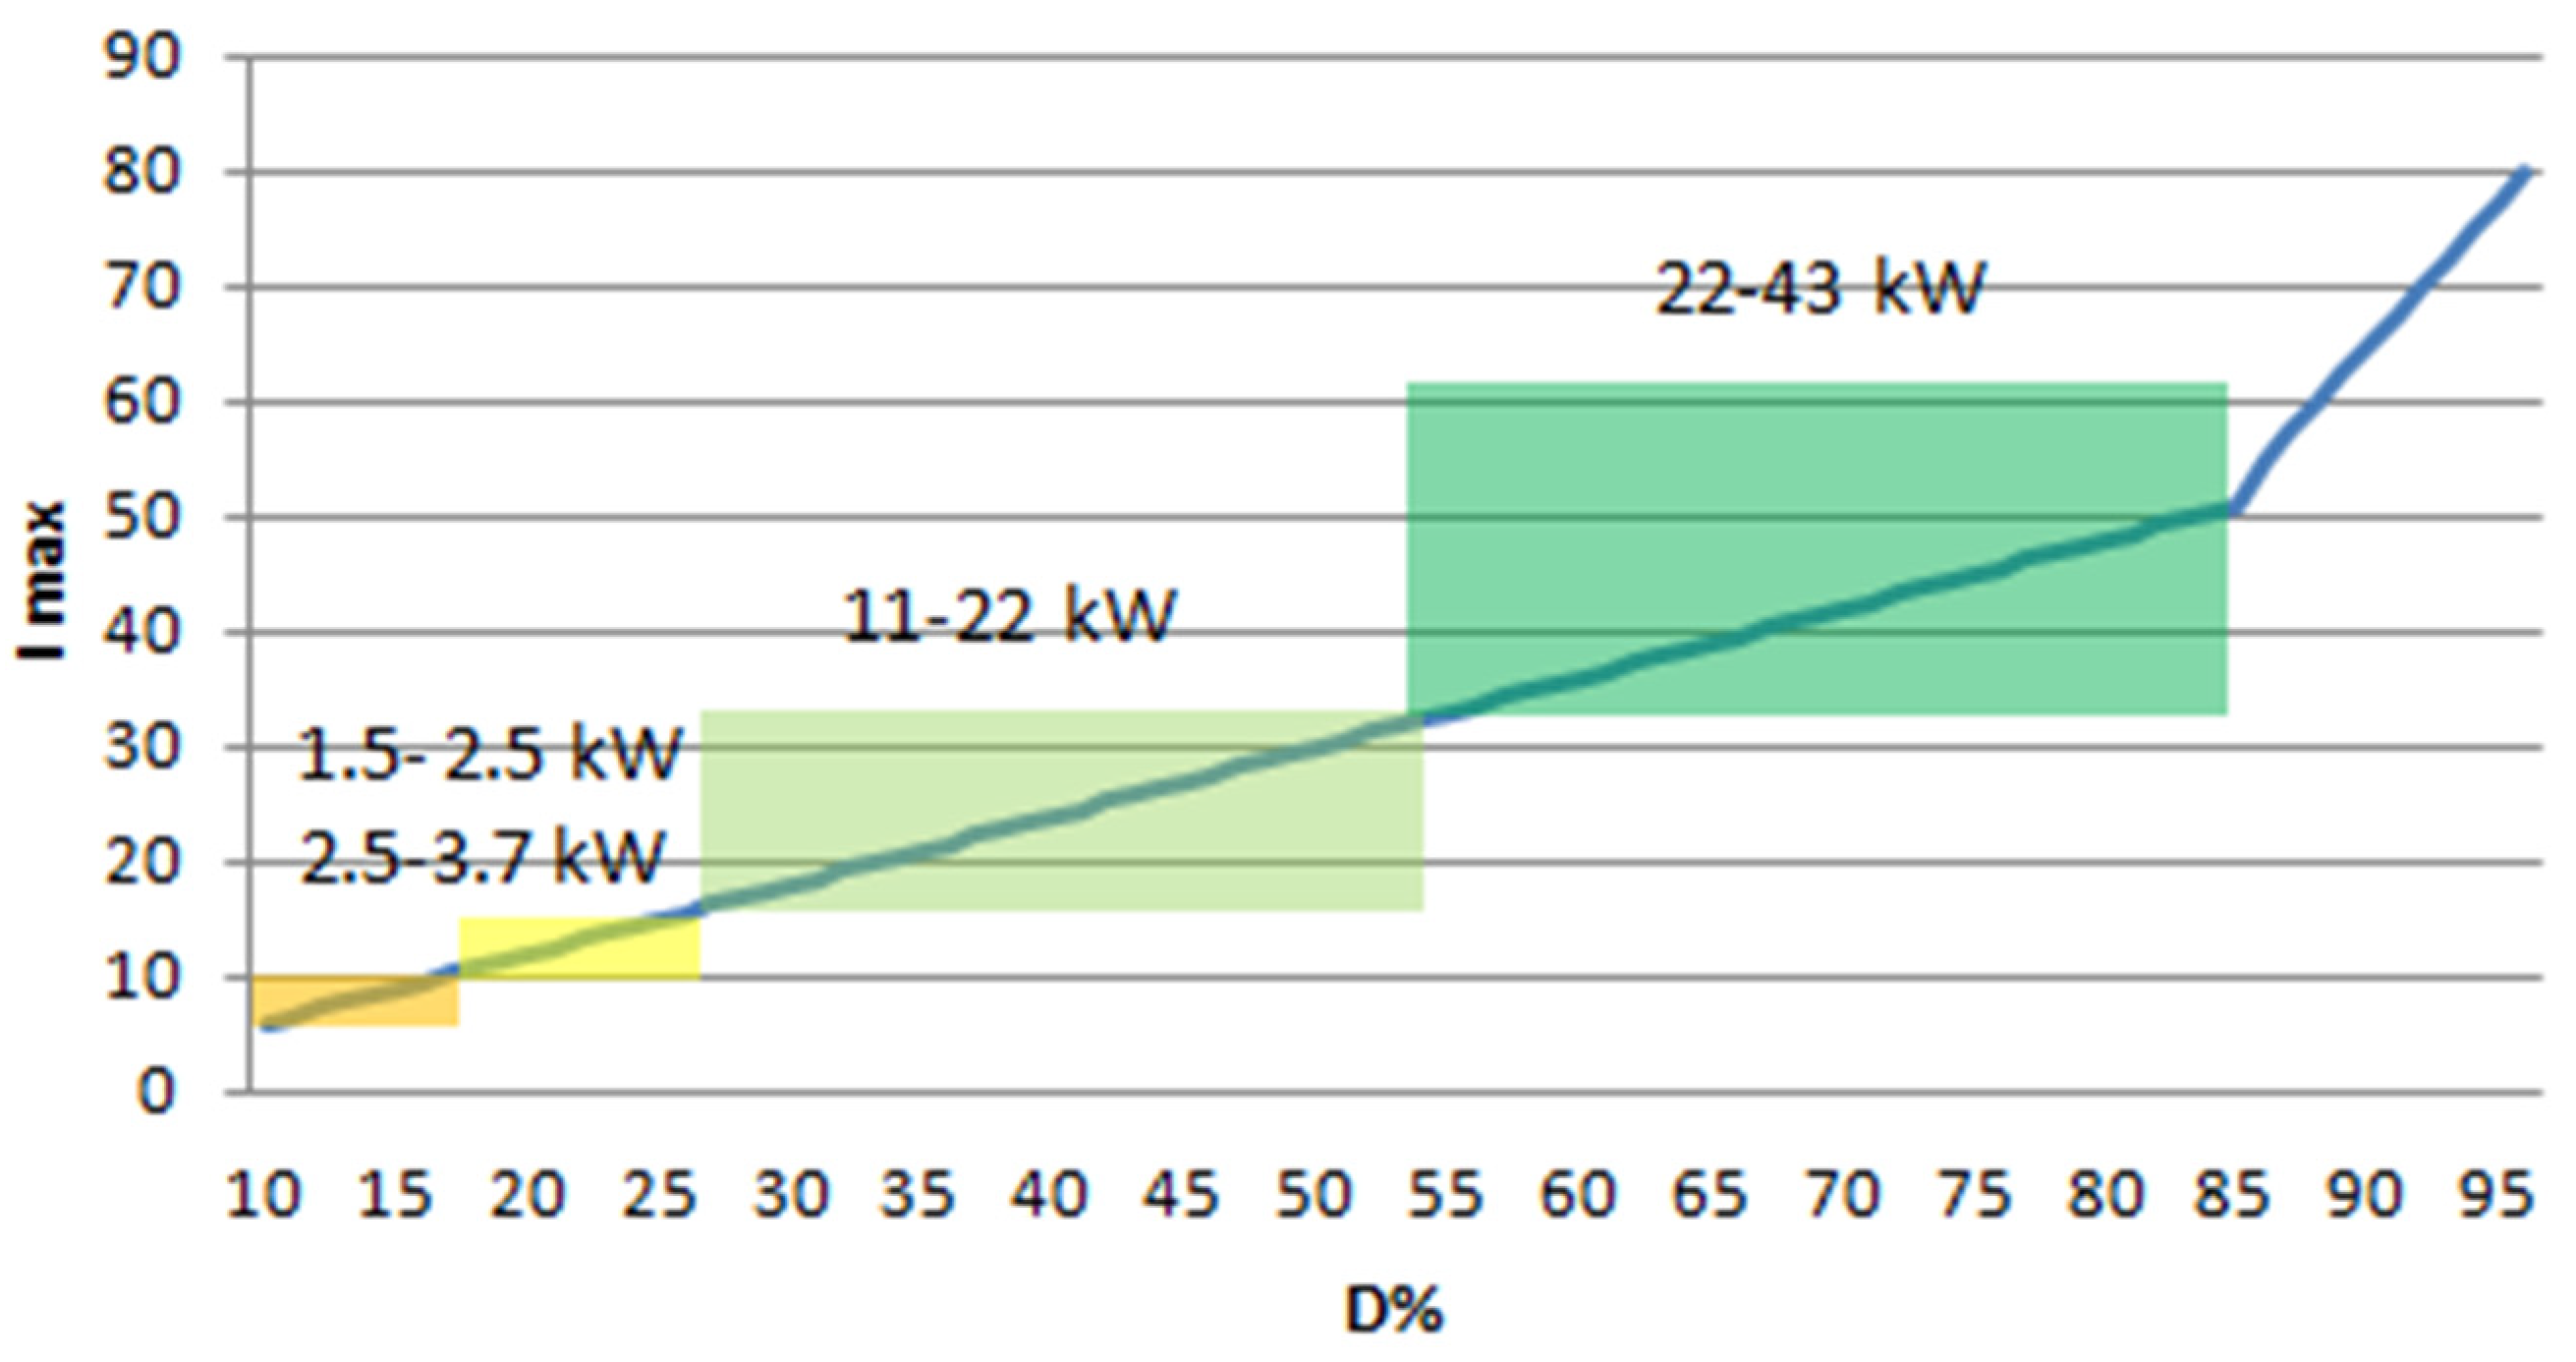
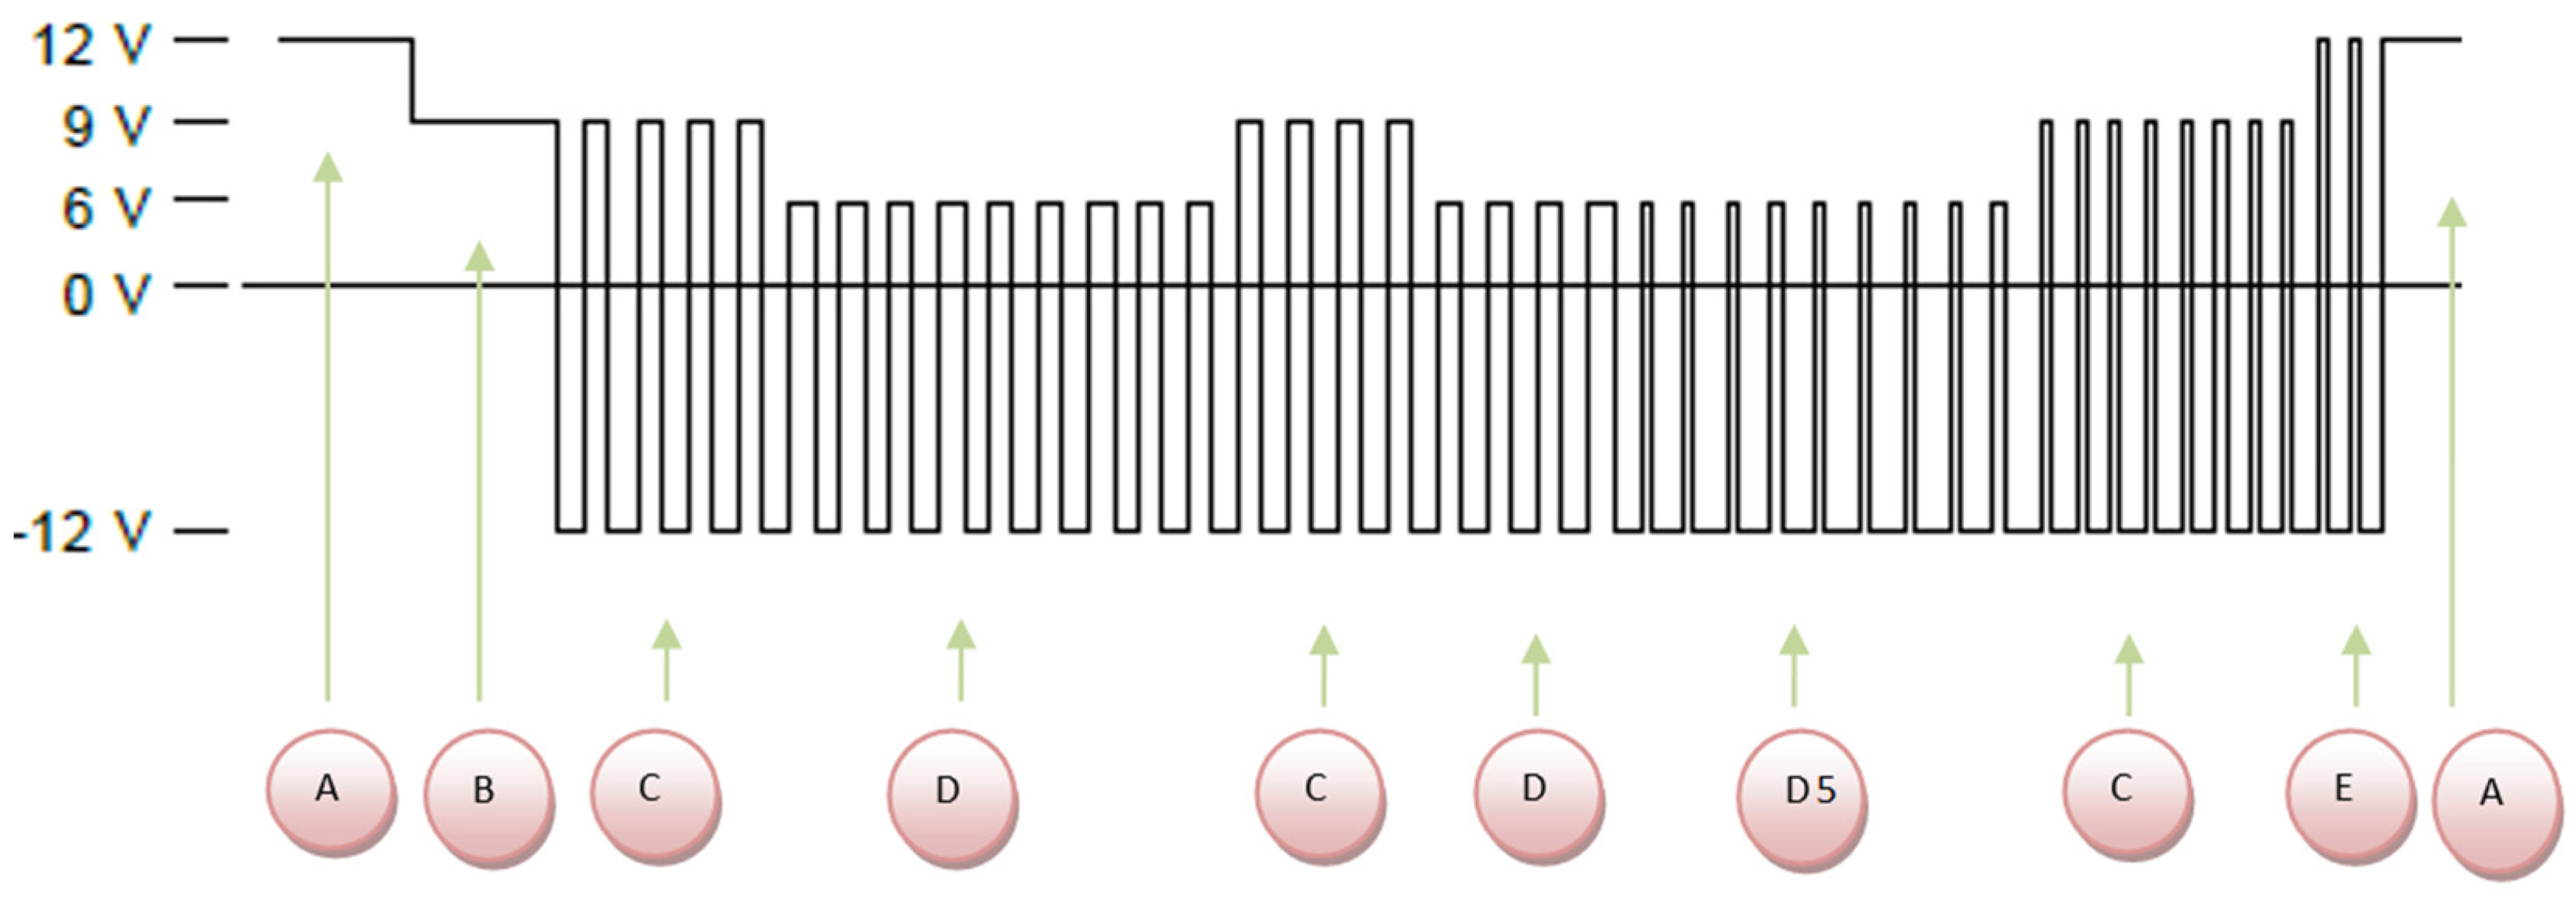
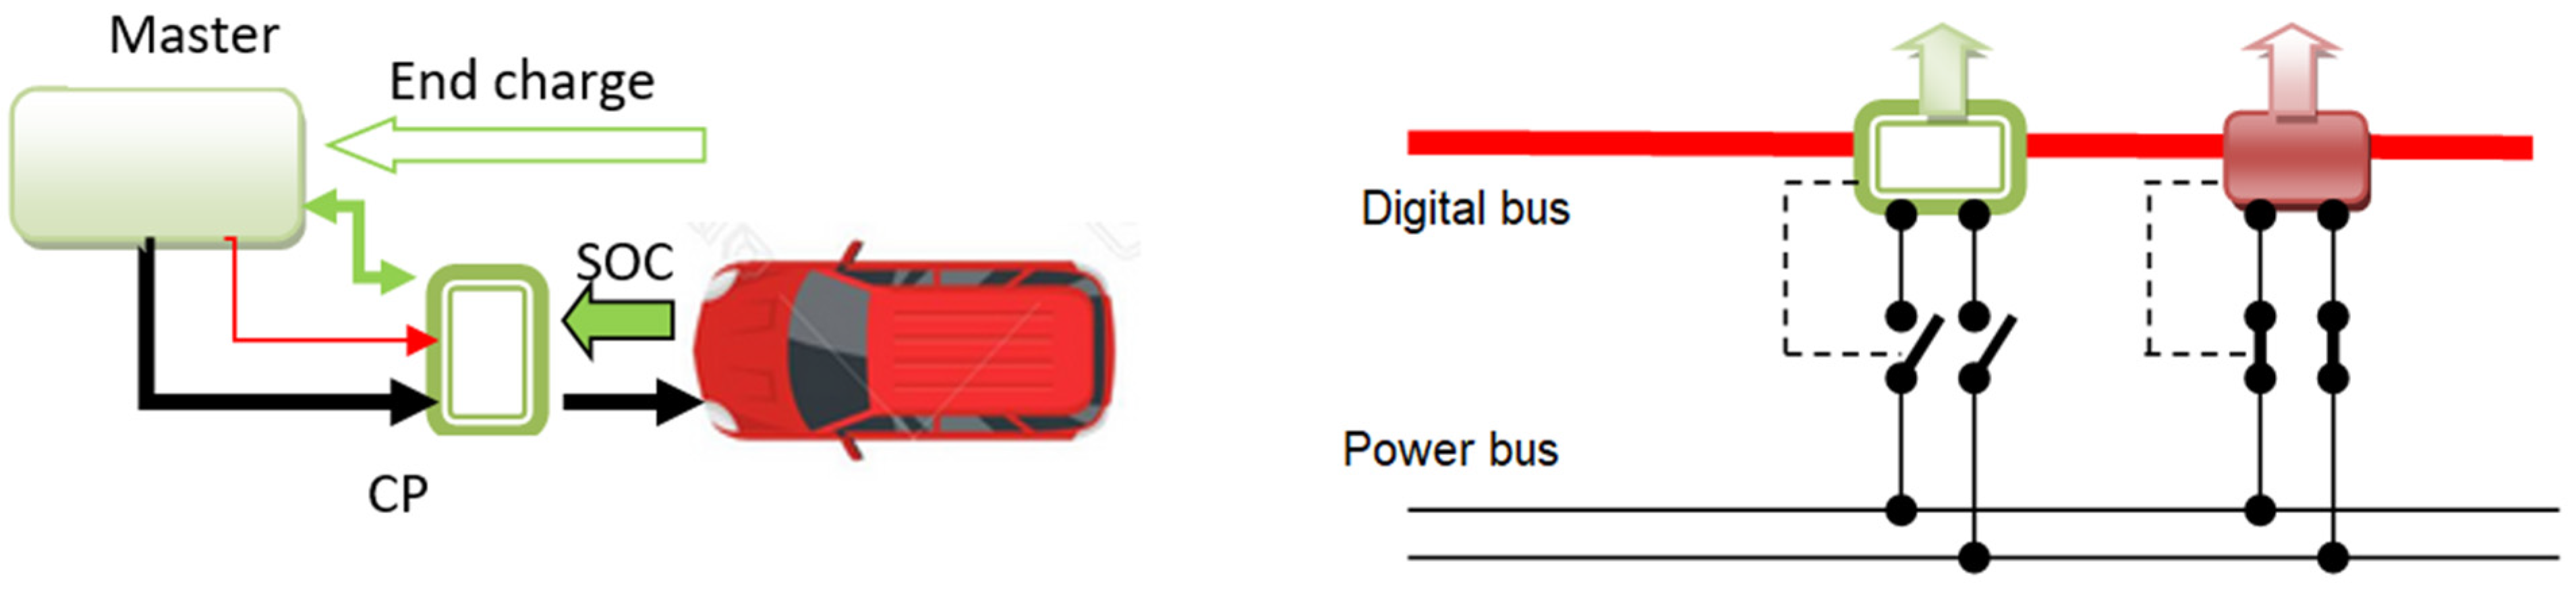
Charging Power Modulation

Power modulation at the EV charging station, also known as Electric Vehicle Supply Equipment (EVSE), takes place in charging mode 3 through a signal present in the pinout of the vehicle–station wiring. IEC 61851-1 provides information on the protocol between the EV and the EVSE, which enables operations for control, safety, and charging regulation. In mode 3 (as well as in modes 2 and 4, although with certain limitations based on the different contexts), the following functions are mandatory:
  • Verification of the continuity of the ground conductor.
  • Verification of the connected vehicle.
  • Enabling and disabling energy transfer.
  • Verification of the maximum supply current that can be drawn.
If the EVSE is supplying power to multiple vehicles simultaneously, these functions must be guaranteed independently for each EV. Therefore, in a master–slave configuration, all conditions must be respected for each CP, regardless of the identified topology. Charging mode 3 implements a signal to regulate the maximum current that the CP can draw. This regulation is achieved by modulating the duration of the high level in a square wave signal, known as Pulse Width Modulation (PWM), which is present in the connection between the EVSE and the vehicle. The management protocol ensures that the charging station sends a control signal of a specified amplitude at a frequency of 1 kHz. The duty cycle (D), which represents the percentage of time the square wave signal is at a high level relative to its total period, may vary under different operating conditions. Specifically, when D is between 10% and 85%, there is a direct proportionality with the current that the CP can supply, according to the following relationship:
I s = D i n 0.6 ,
If D is between 85 and 94%, the maximum current will be supplied according to the following relation:
I s = D i n 64 2.5
Figure 3 illustrates regulation curves as a function of D, while also considering the useful power range for both single-phase supplies up to 16 A and three-phase configurations with higher currents. By utilizing the maximum commercial values for single-phase (1P) and three-phase (3P) setups, the maximum power values that can be drawn from the network are summarized in Table 3.
The PWM and control circuits ensure interoperability with systems that comply with the SAE J1772 standard. Figure 4 illustrates an example of a pilot signal, identifying different operational states. When the vehicle is disconnected, the CP signal is at +12 V; this voltage drops to +9 V when the connector is inserted (B). Subsequently, the PWM signal informs the vehicle of the maximum current it can draw (C). The EV then begins to draw current, which can be adjusted if the CP modifies the maximum withdrawable current (transition D5). The session ended through states C-E-A.

3. Results

In this section, we present the results of our analysis on the journeys and stops, which allow us to estimate the energy requirements for charging. The analysis reveals that the average duration of stops is quite long, providing a range of options for selecting the power levels of CPs and implementing charging management strategies, such as adjusting charging power and scheduling time shifts. Below, we analyze and report the impact of some of these strategies for the case study.

3.1. Data Analysis

From the analysis of vehicle monitoring data, 38 vehicles were identified as using the Casaccia parking lot multiple times, likely for work purposes. A detailed analysis was conducted on their parking behaviors, including the distances traveled before arriving at and after leaving the parking lot.
The frequency distribution of parking events for these vehicles over a year is reported in Table 4 along with the cumulative frequency. The annual presence of individual vehicles ranges from a minimum of 31 days to a maximum of 215 days. Notably, half of the vehicles had a presence exceeding 130 days within the year.
The temporal profile of the stops is illustrated in the graph in Figure 5, which shows the duration of stops (on the vertical axis) as a function of the start time (on the horizontal axis). There is a noticeable concentration of arrivals in the parking lot around 8 AM. Typically, the stop duration exceeds 4 h, with a maximum of 12 h, and the distribution falls mainly in the range of 7–10 h. The red arrow indicates the end time of the working day, which is determined by extrapolating the arrival–duration combination that shows the highest density in the scatter plot.
The relationship between the start time and the parking duration is consistent with the parking habits related to working hours. This scheme allows different approaches to charge management, even at low power.
To determine the vehicle’s consumption and charging needs, it is essential to assess the distance traveled during the home-to-work journey, in addition to establishing the timing of stops. Figure 6 shows a map of home–work distances, in which the red dots represent the residences of EV owners, and the blue dot is the Casaccia site. The maximum distance is 60 km, with a modal value around 30 km. The green line represents the Grande Raccordo Anulare, which circumscribes the urban area of Rome. From the street map, it is possible to deduce that half of the vehicles follow a mixed route (extra-urban–urban) and the remainder a predominantly extra-urban route.
Figure 7 presents the histogram of home–work distances with the indication of the average distance, equal to 24.57 km.

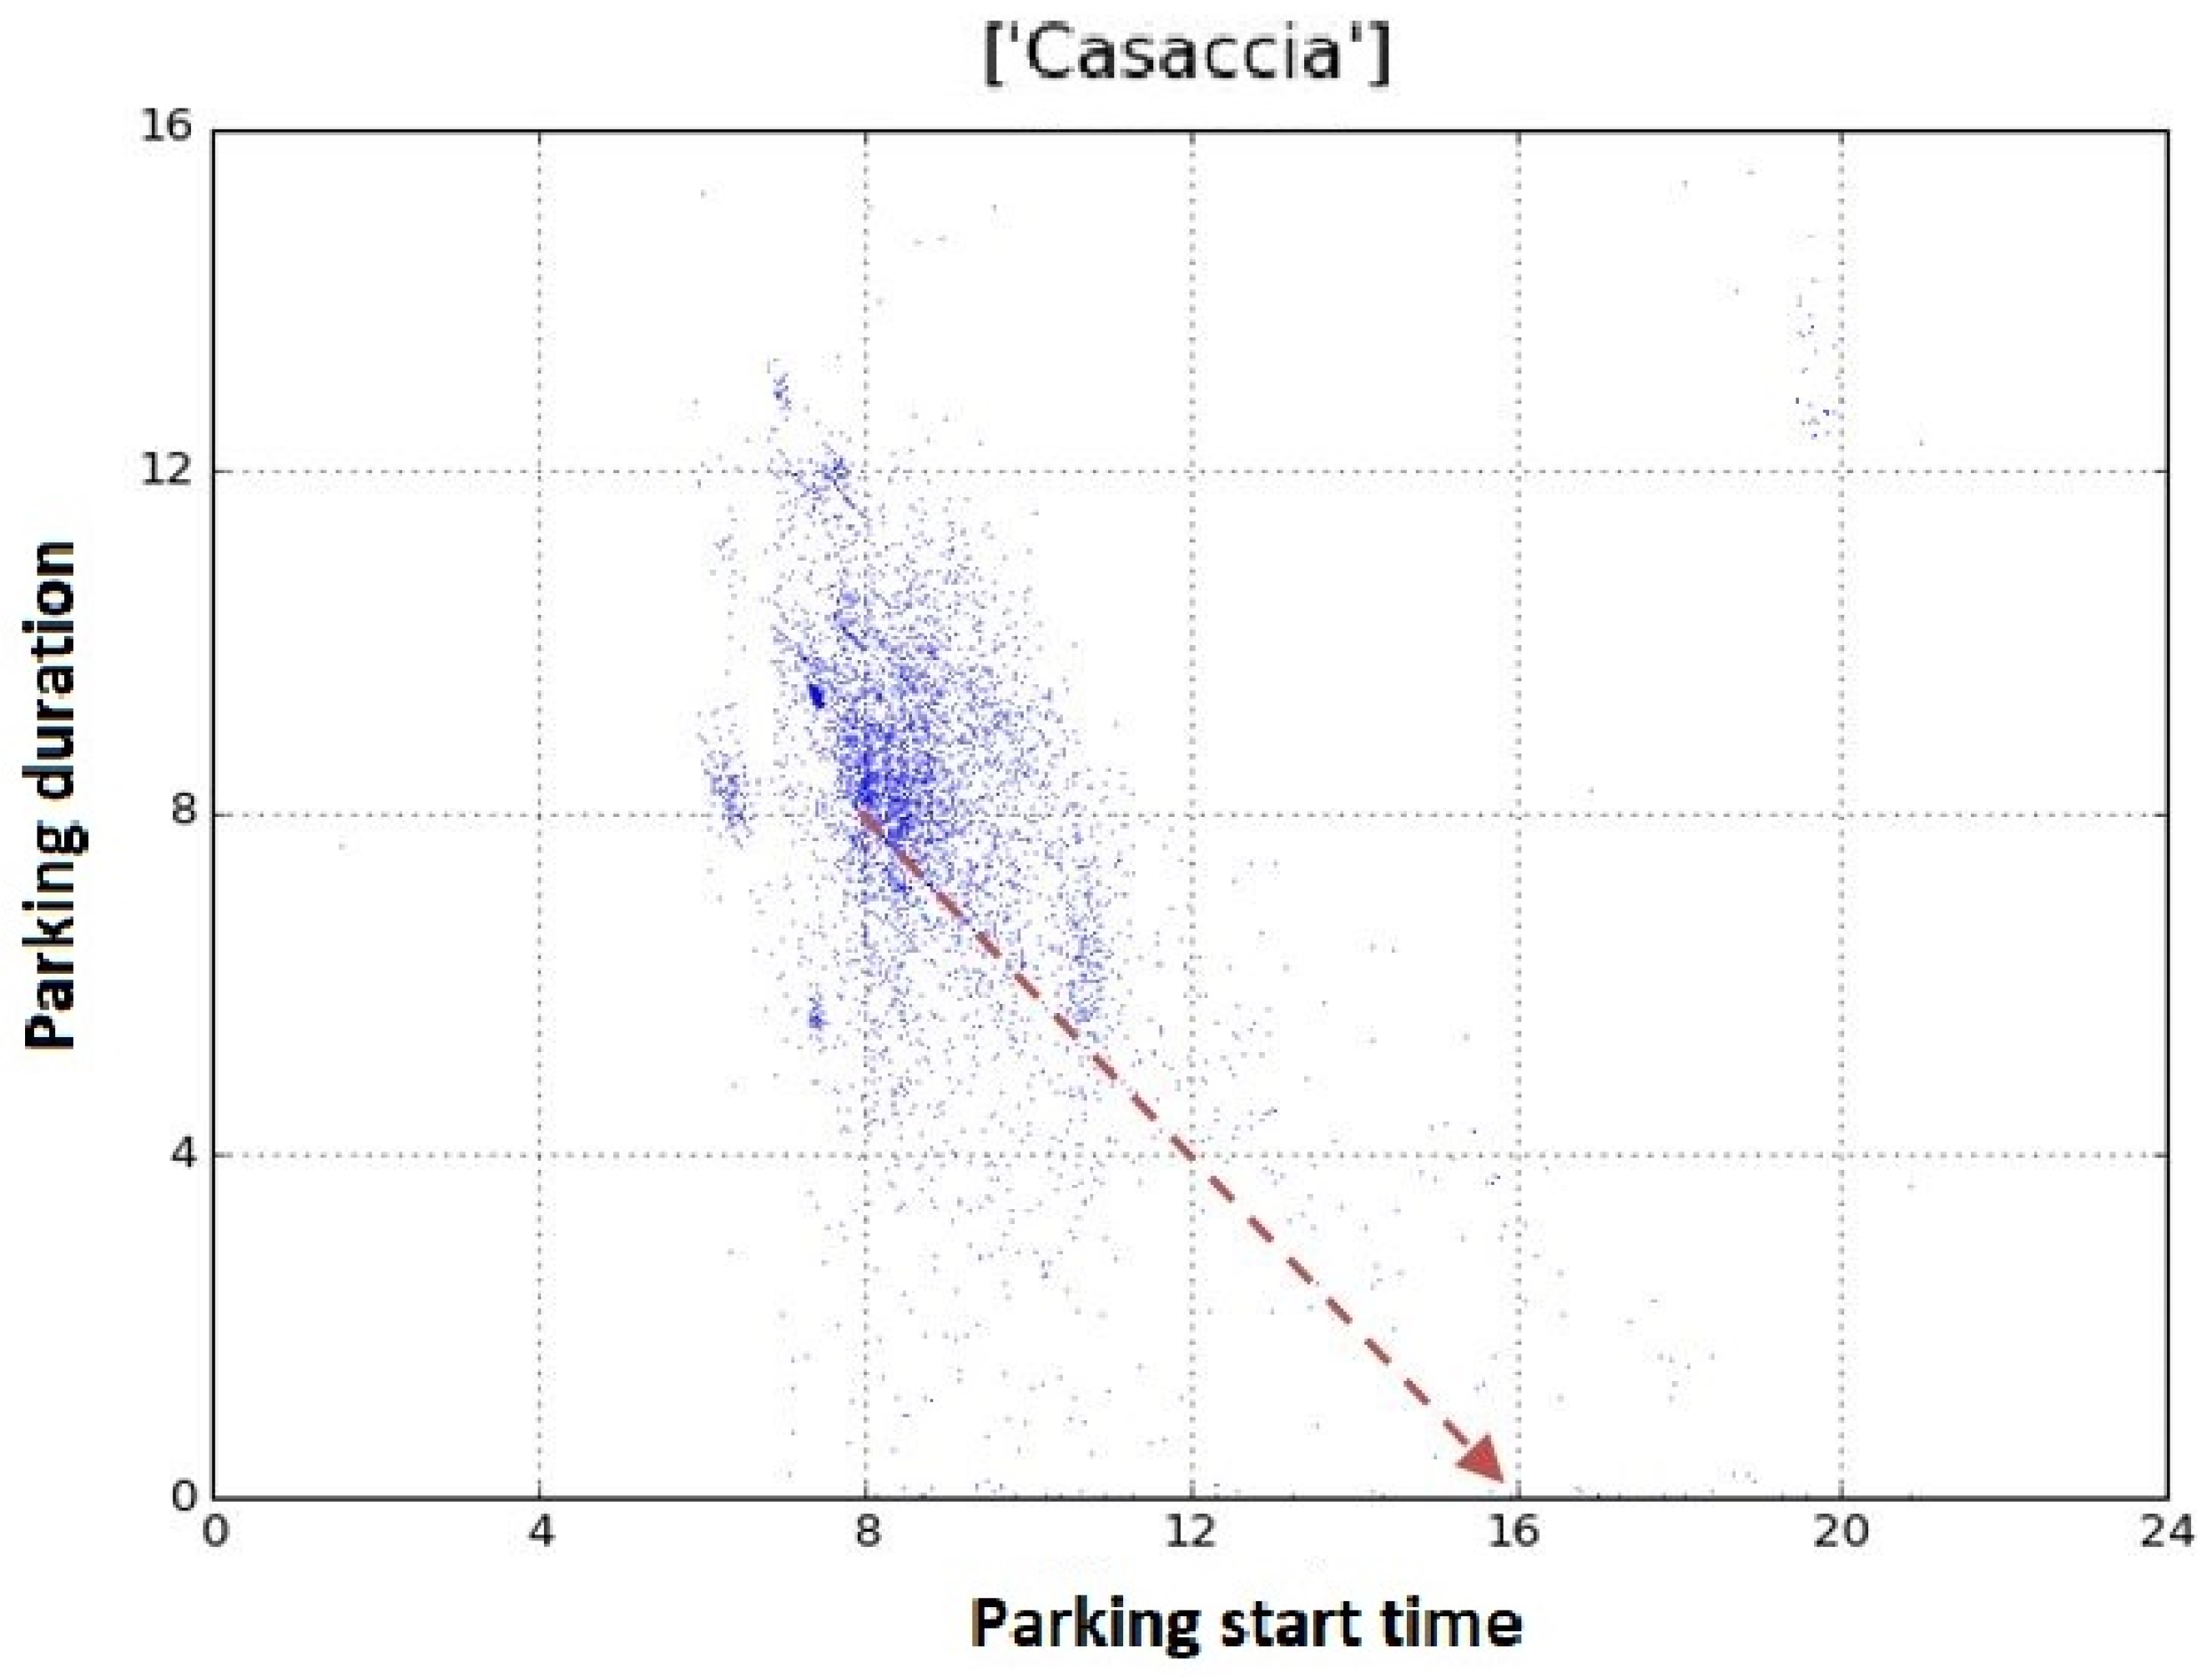
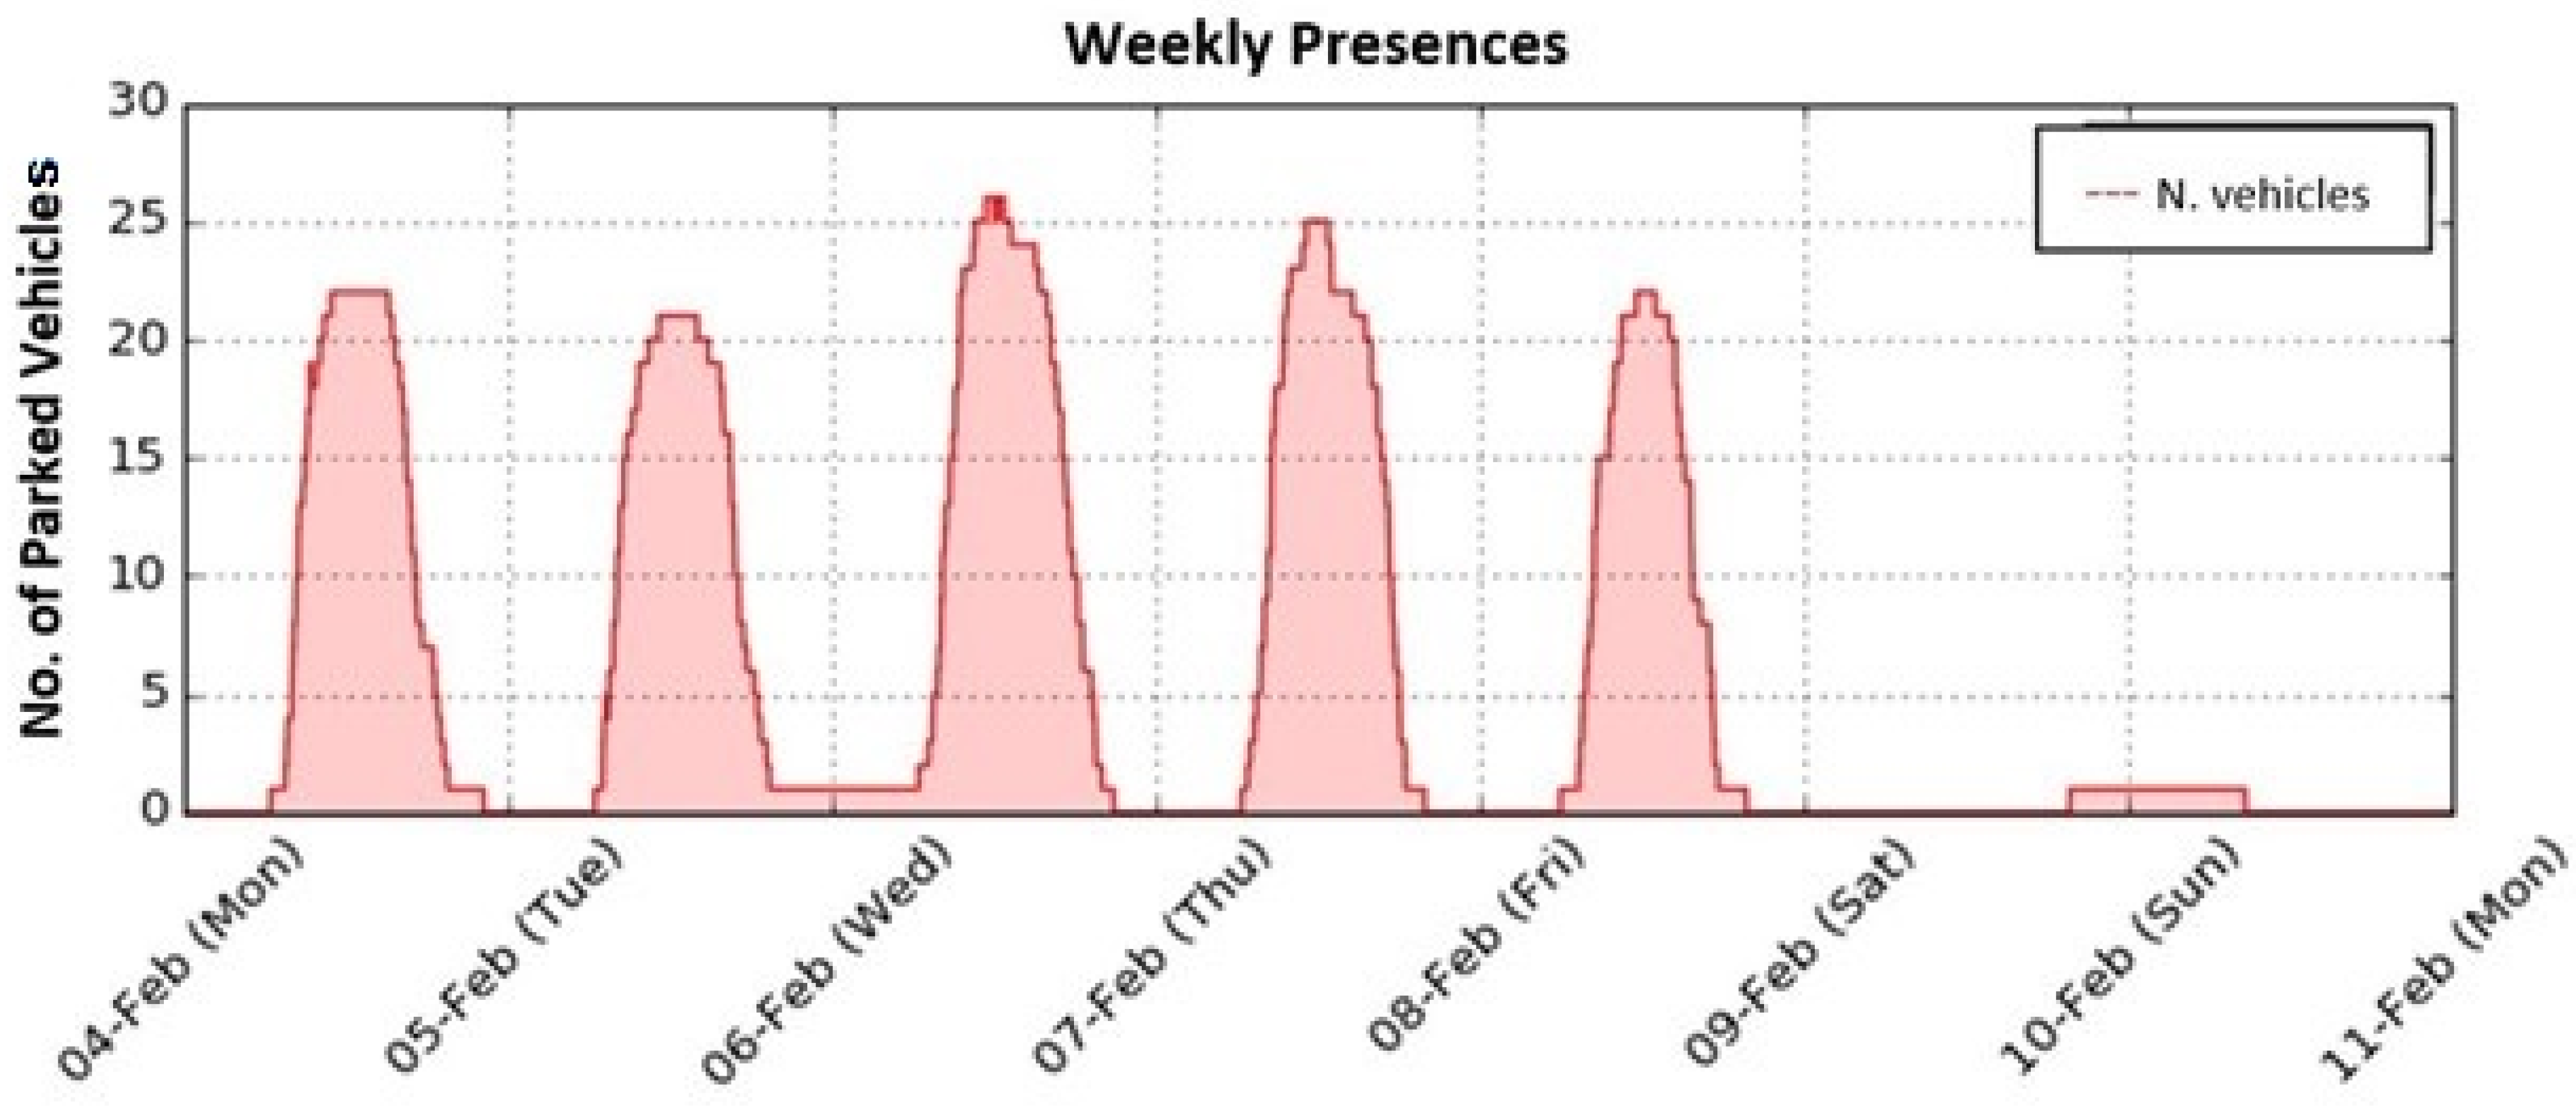
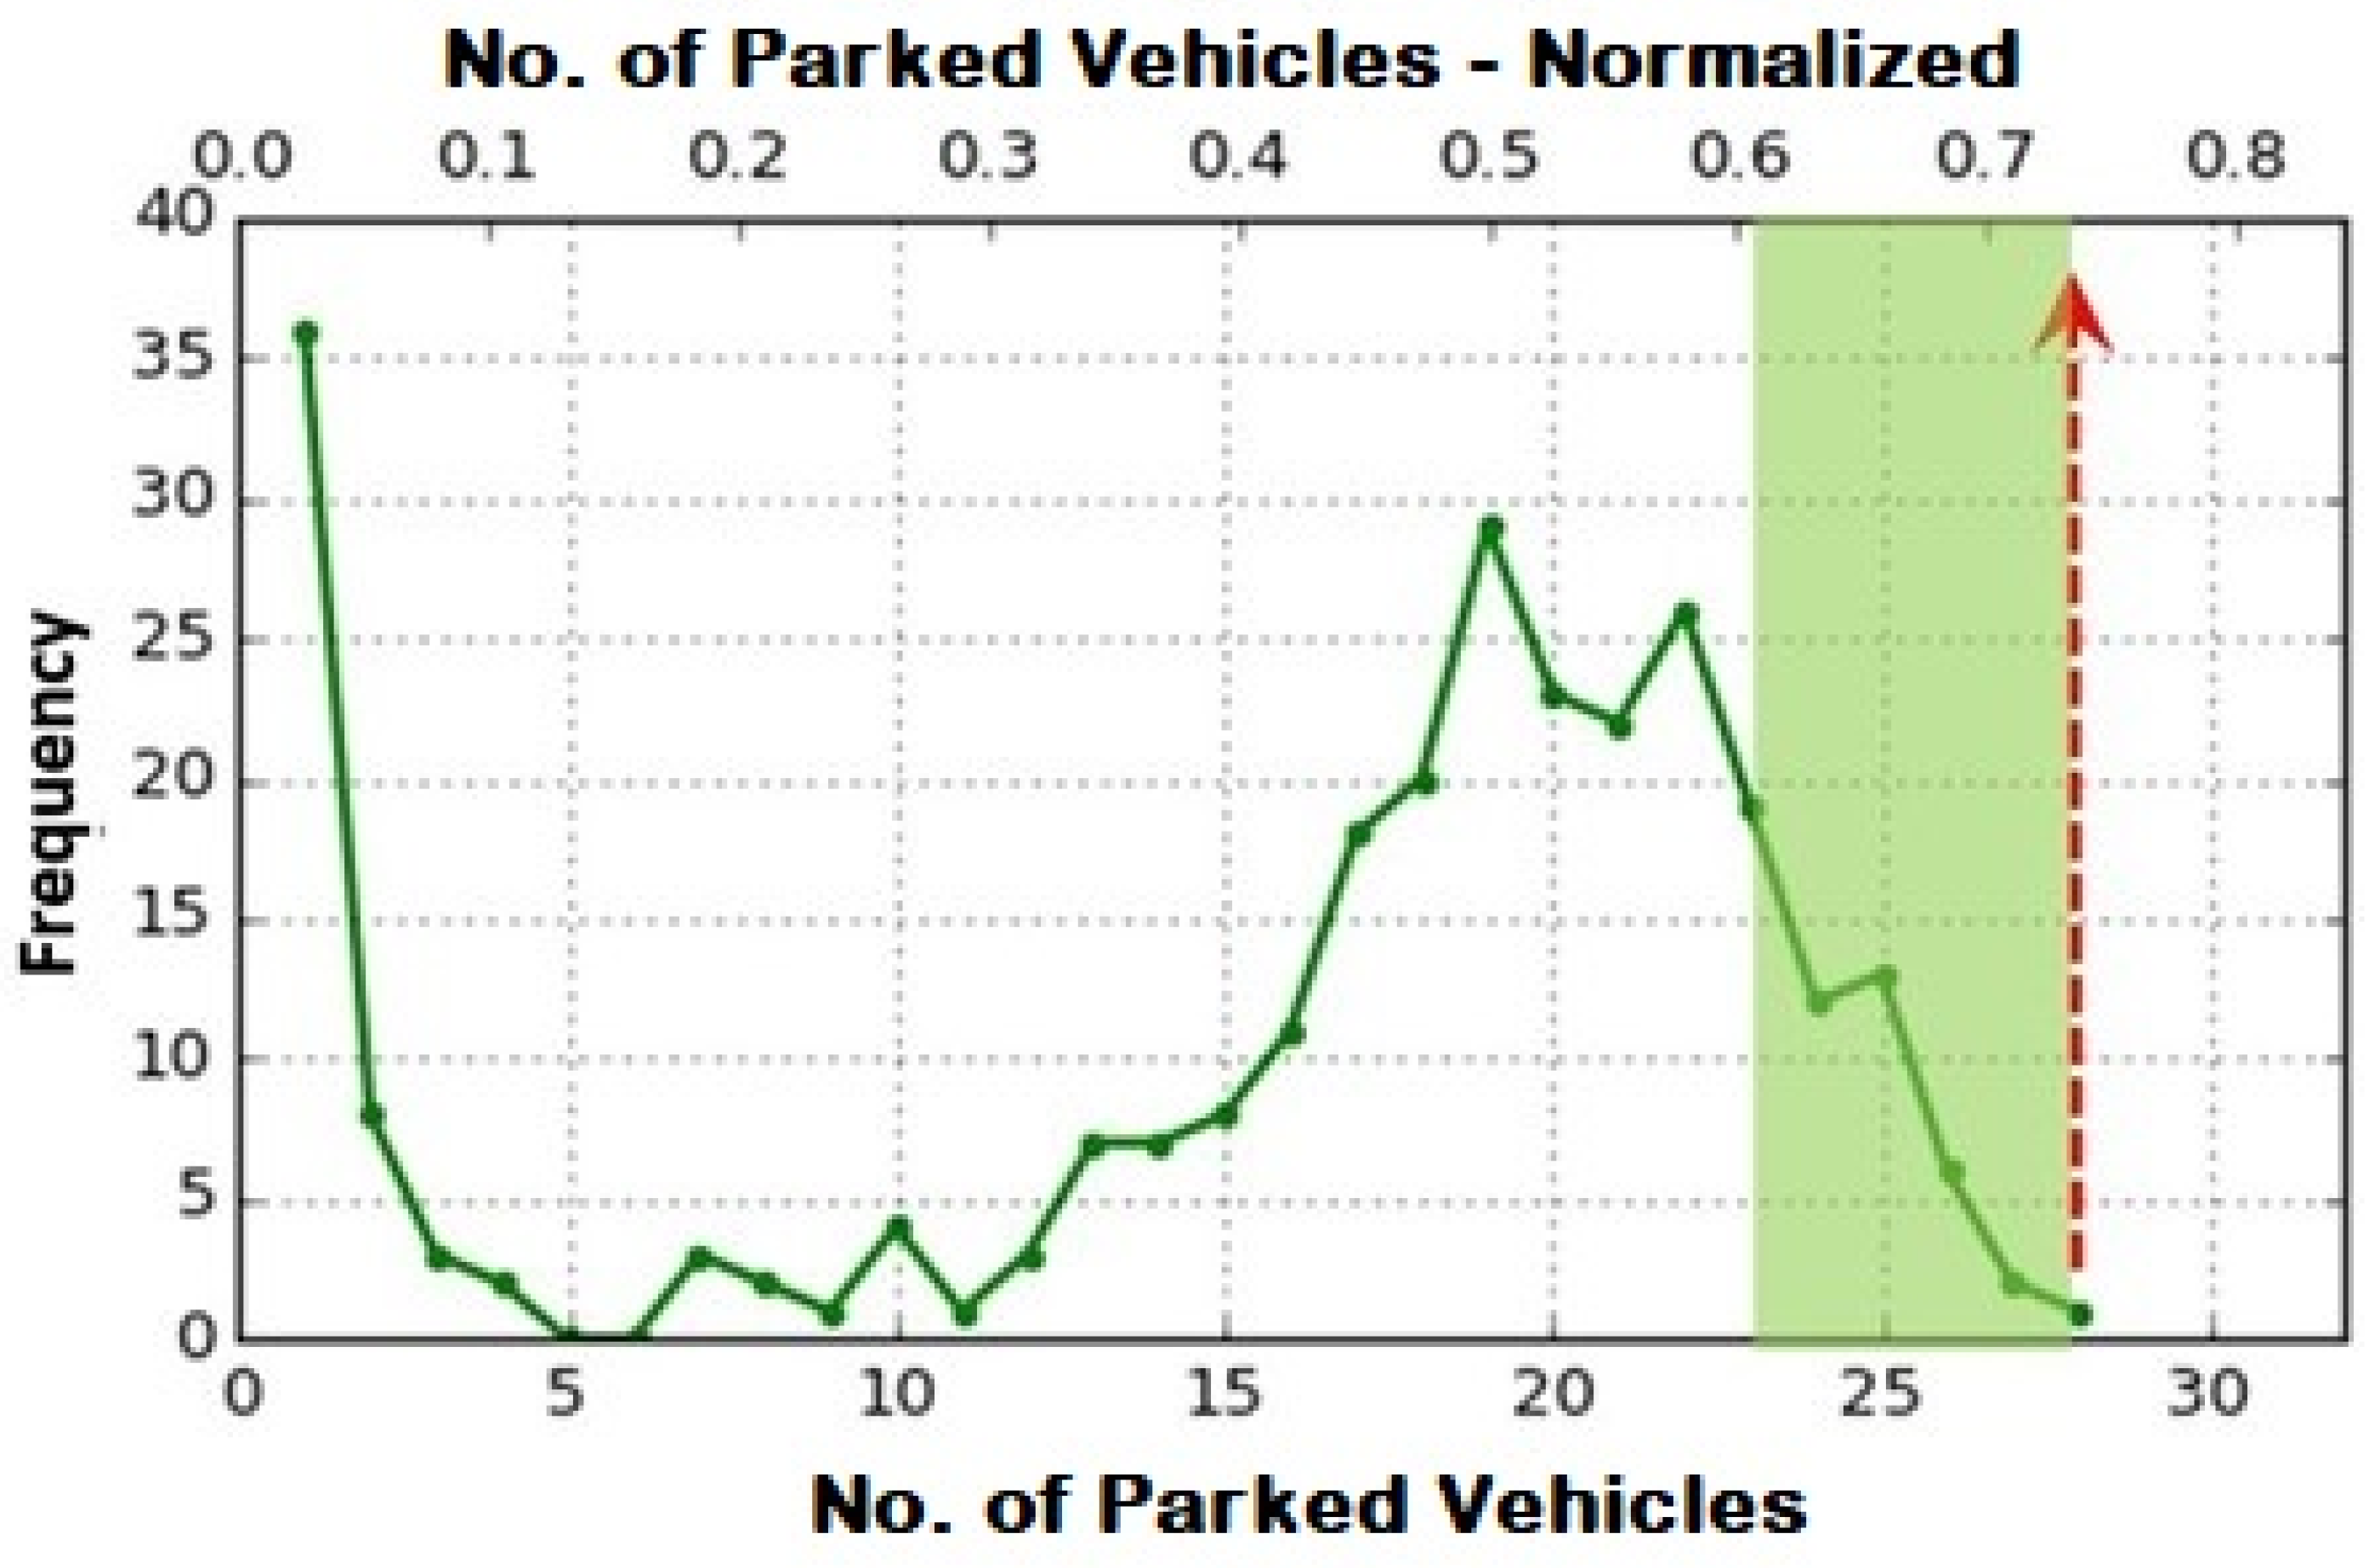
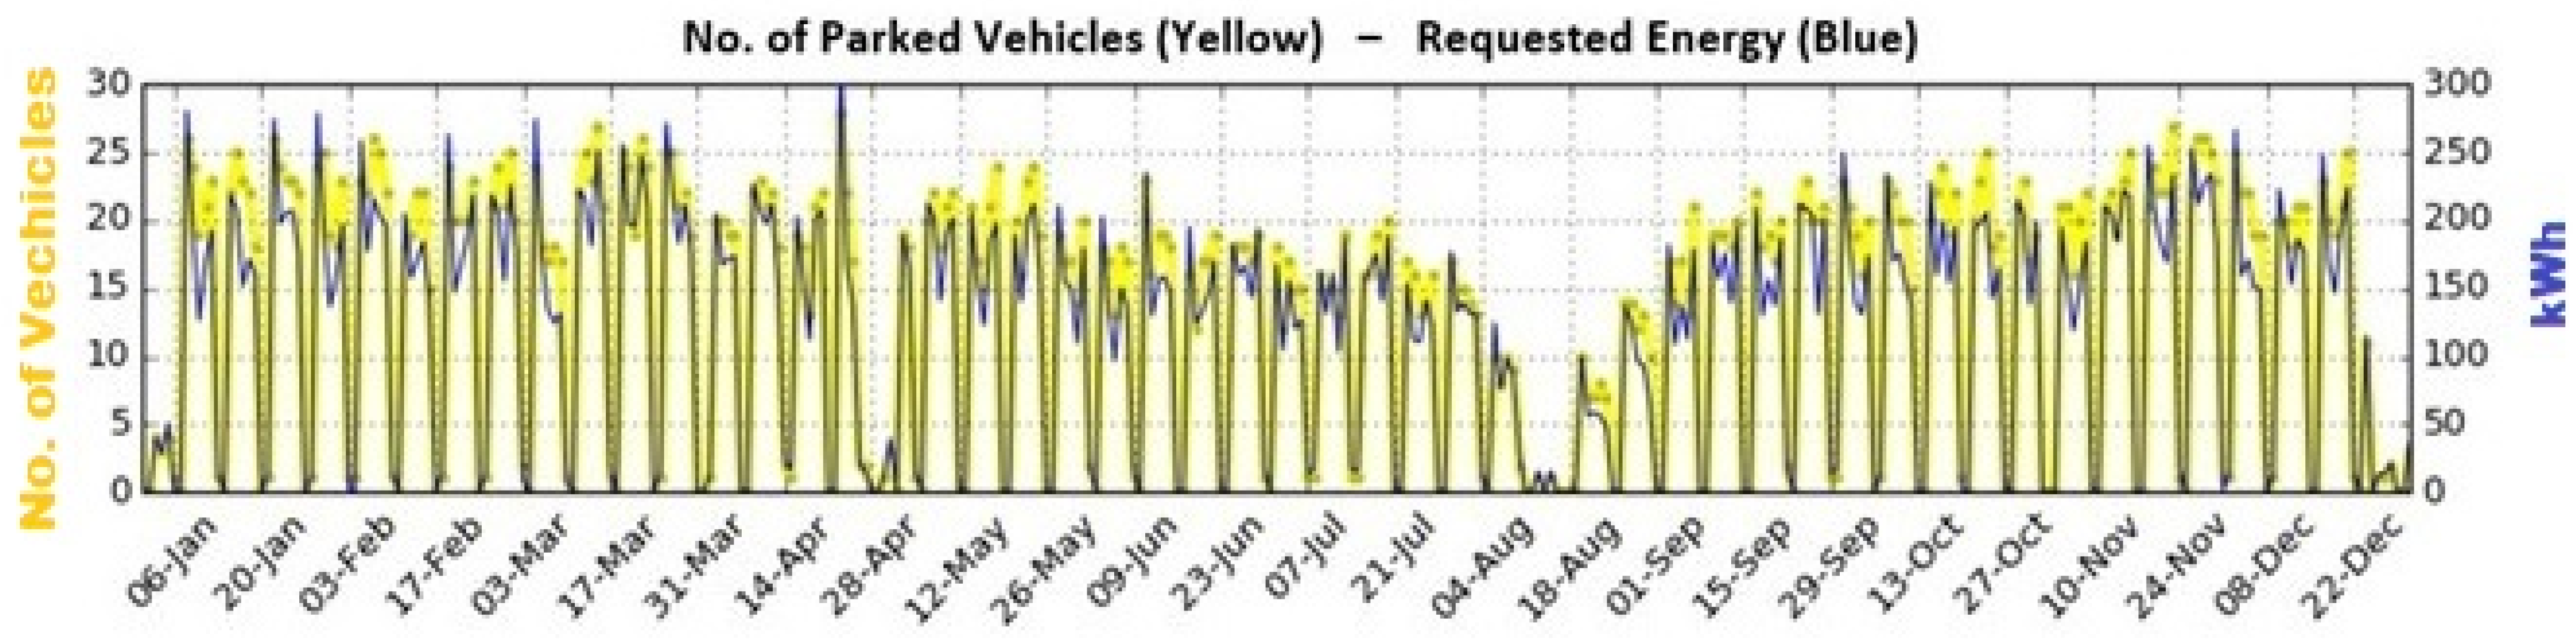
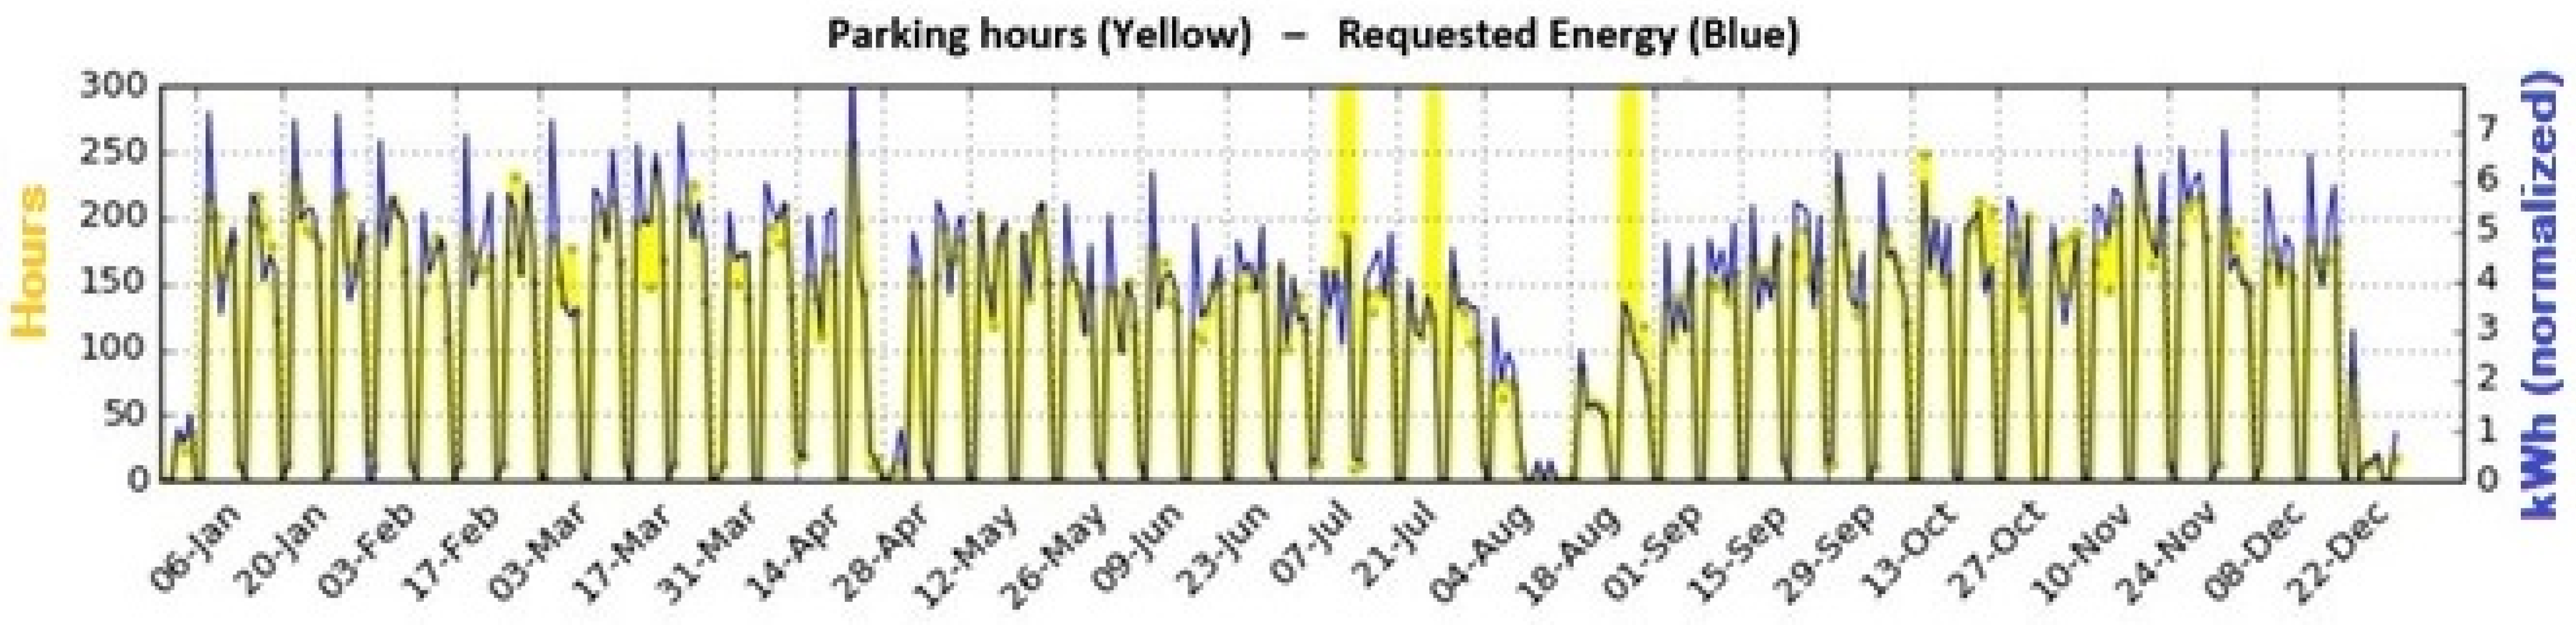
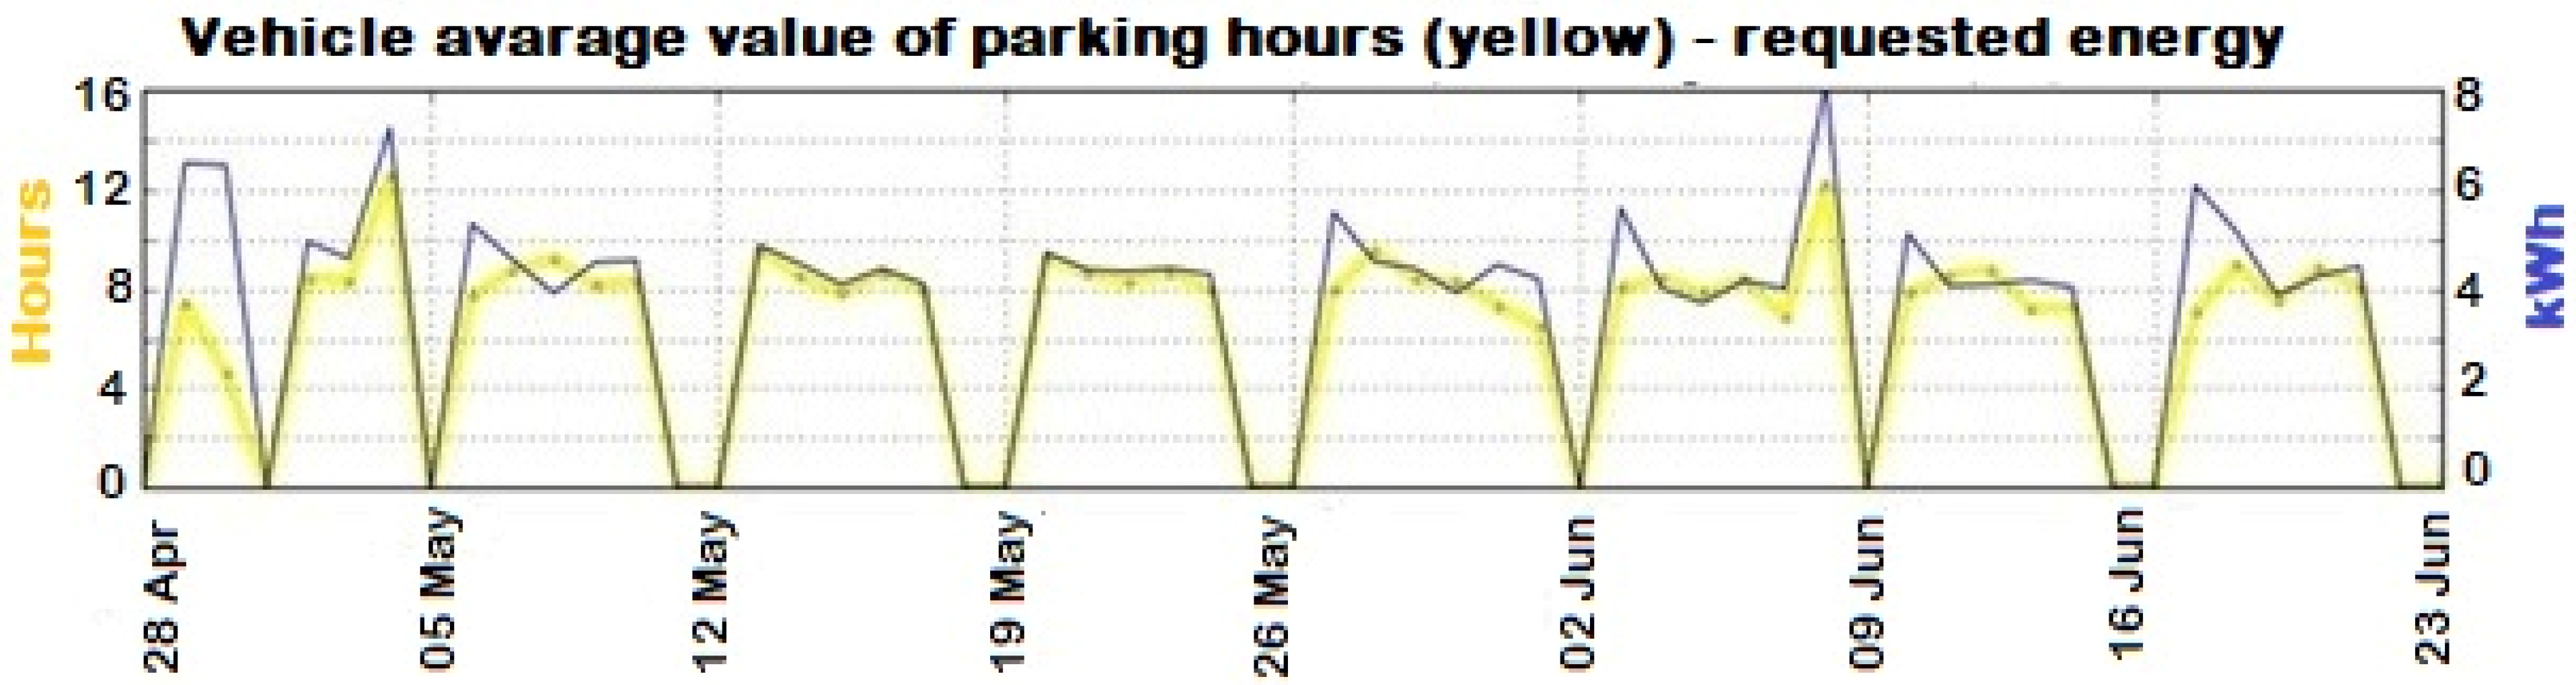
3.1.1. Temporal Distribution of the Stop Events

In this section, we will illustrate the results regarding the daily distribution of vehicle arrivals and parking durations. This information is essential for potential regulations on charging, specifically concerning access policies to the CPs and the regulation of charging power levels. To provide a clearer understanding of the users’ behavior, we will examine the temporal profile of arrivals and parking for a typical day. Figure 8 displays the arrival times and parking durations of the 23 vehicles that accessed the parking lot on February 4th.
The average duration of these stops is 8 h 25 m with a minimum of 5 h 35 m and a maximum of 13 h 58 m. The analysis excludes vehicle number 15, whose stop is only 17 min, a time not compatible with its classification as a home–work stop.
Figure 9 illustrates the temporal distribution of vehicles in the parking lot during the week of February 4th to February 11th. The maximum number of vehicles accessing the parking lot during this period ranges from 21 to 26. The curves demonstrate a daily pattern in the distribution of arrivals from Monday to Friday. The profile consists of three main segments: an ascending segment in the morning, indicating arrivals; a horizontal segment during the midday hours; and a descending segment in the afternoon, reflecting the conclusion of the workday. Vehicle presence over the weekend is notably low and is likely due to night shifts.
Analyzing this week’s access data, we find that only 55% to 68% of the monitored fleet accesses the parking lot each day. To gain further insights, we examined the distribution of accesses over the year. Figure 10 shows this distribution with the number of vehicles in the car park on a given day (event) on the abscissa and the frequency (number of events) with which the configuration occurs on the ordinate. The upper part of the graph normalizes the values to the total number of vehicles in the fleet. From the graph, we can see that the maximum percentage of vehicles present in the parking lot is 73% (indicated by the red arrow). Additionally, events with attendance exceeding 60% (highlighted in the green zone) occur only 34 times in a year, representing 9.3% of the total.
This result highlights that the number of CPs needed to satisfy the demand is less than the number of vehicles in the fleet. In fact, for the case study, 23 CPs can satisfy the charging demand of all the vehicles in more than 90% of the cases, while 28 CPs satisfy 100% of the requests, regardless of the arrival time.

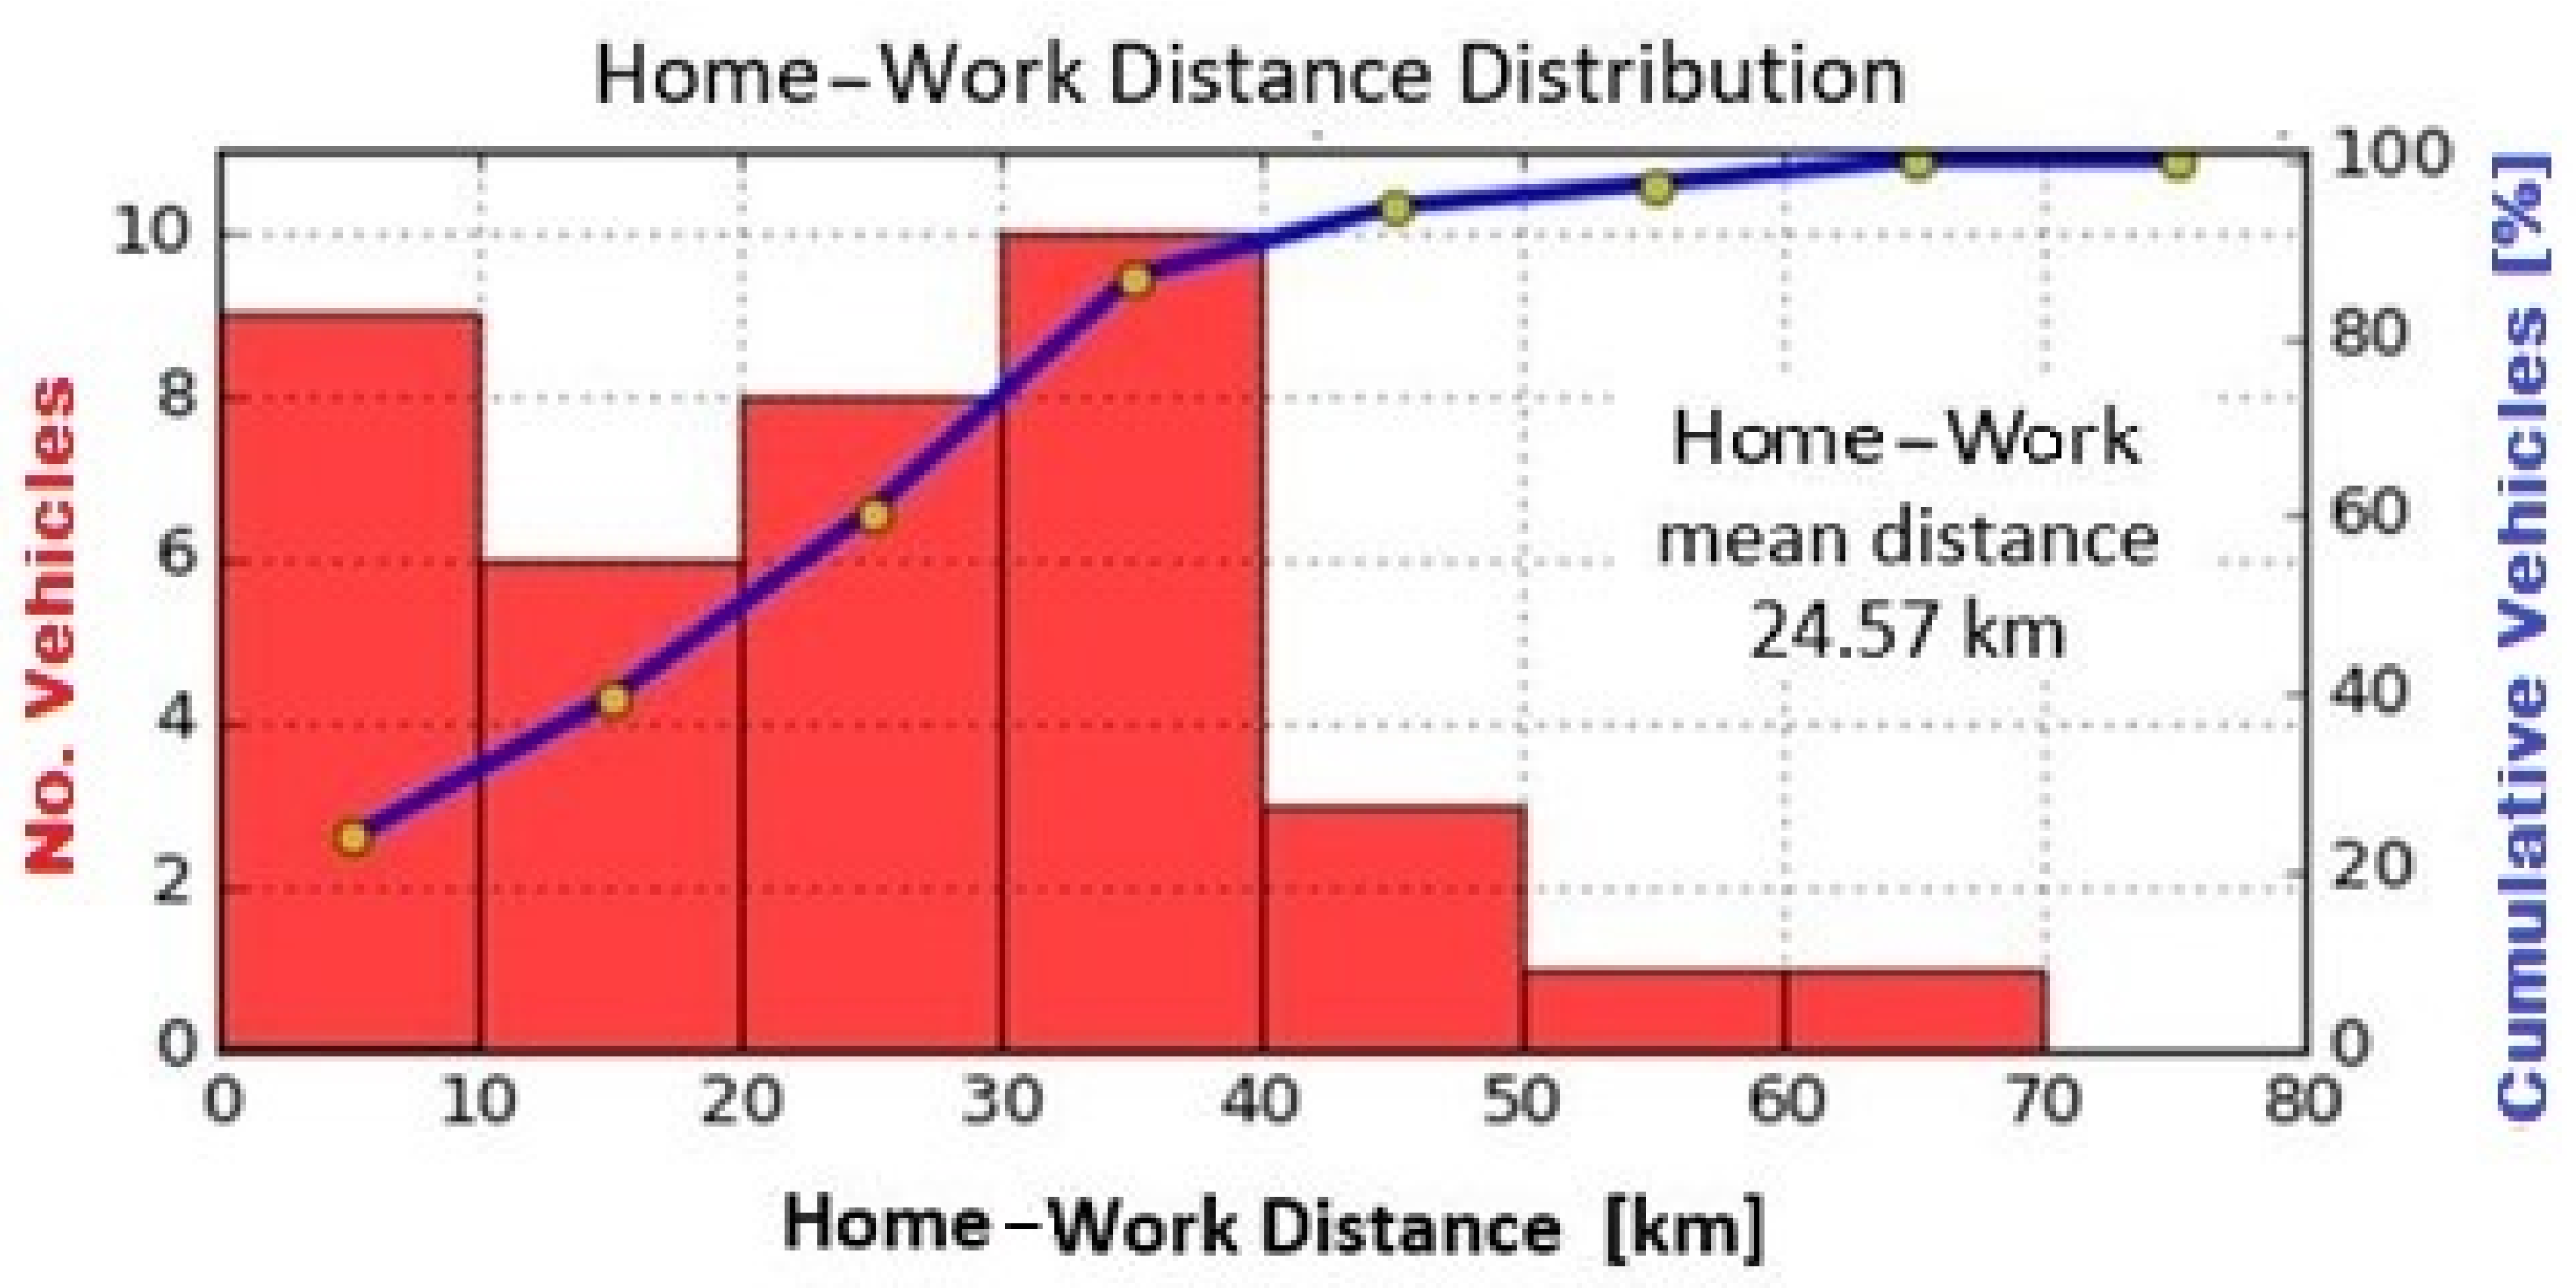
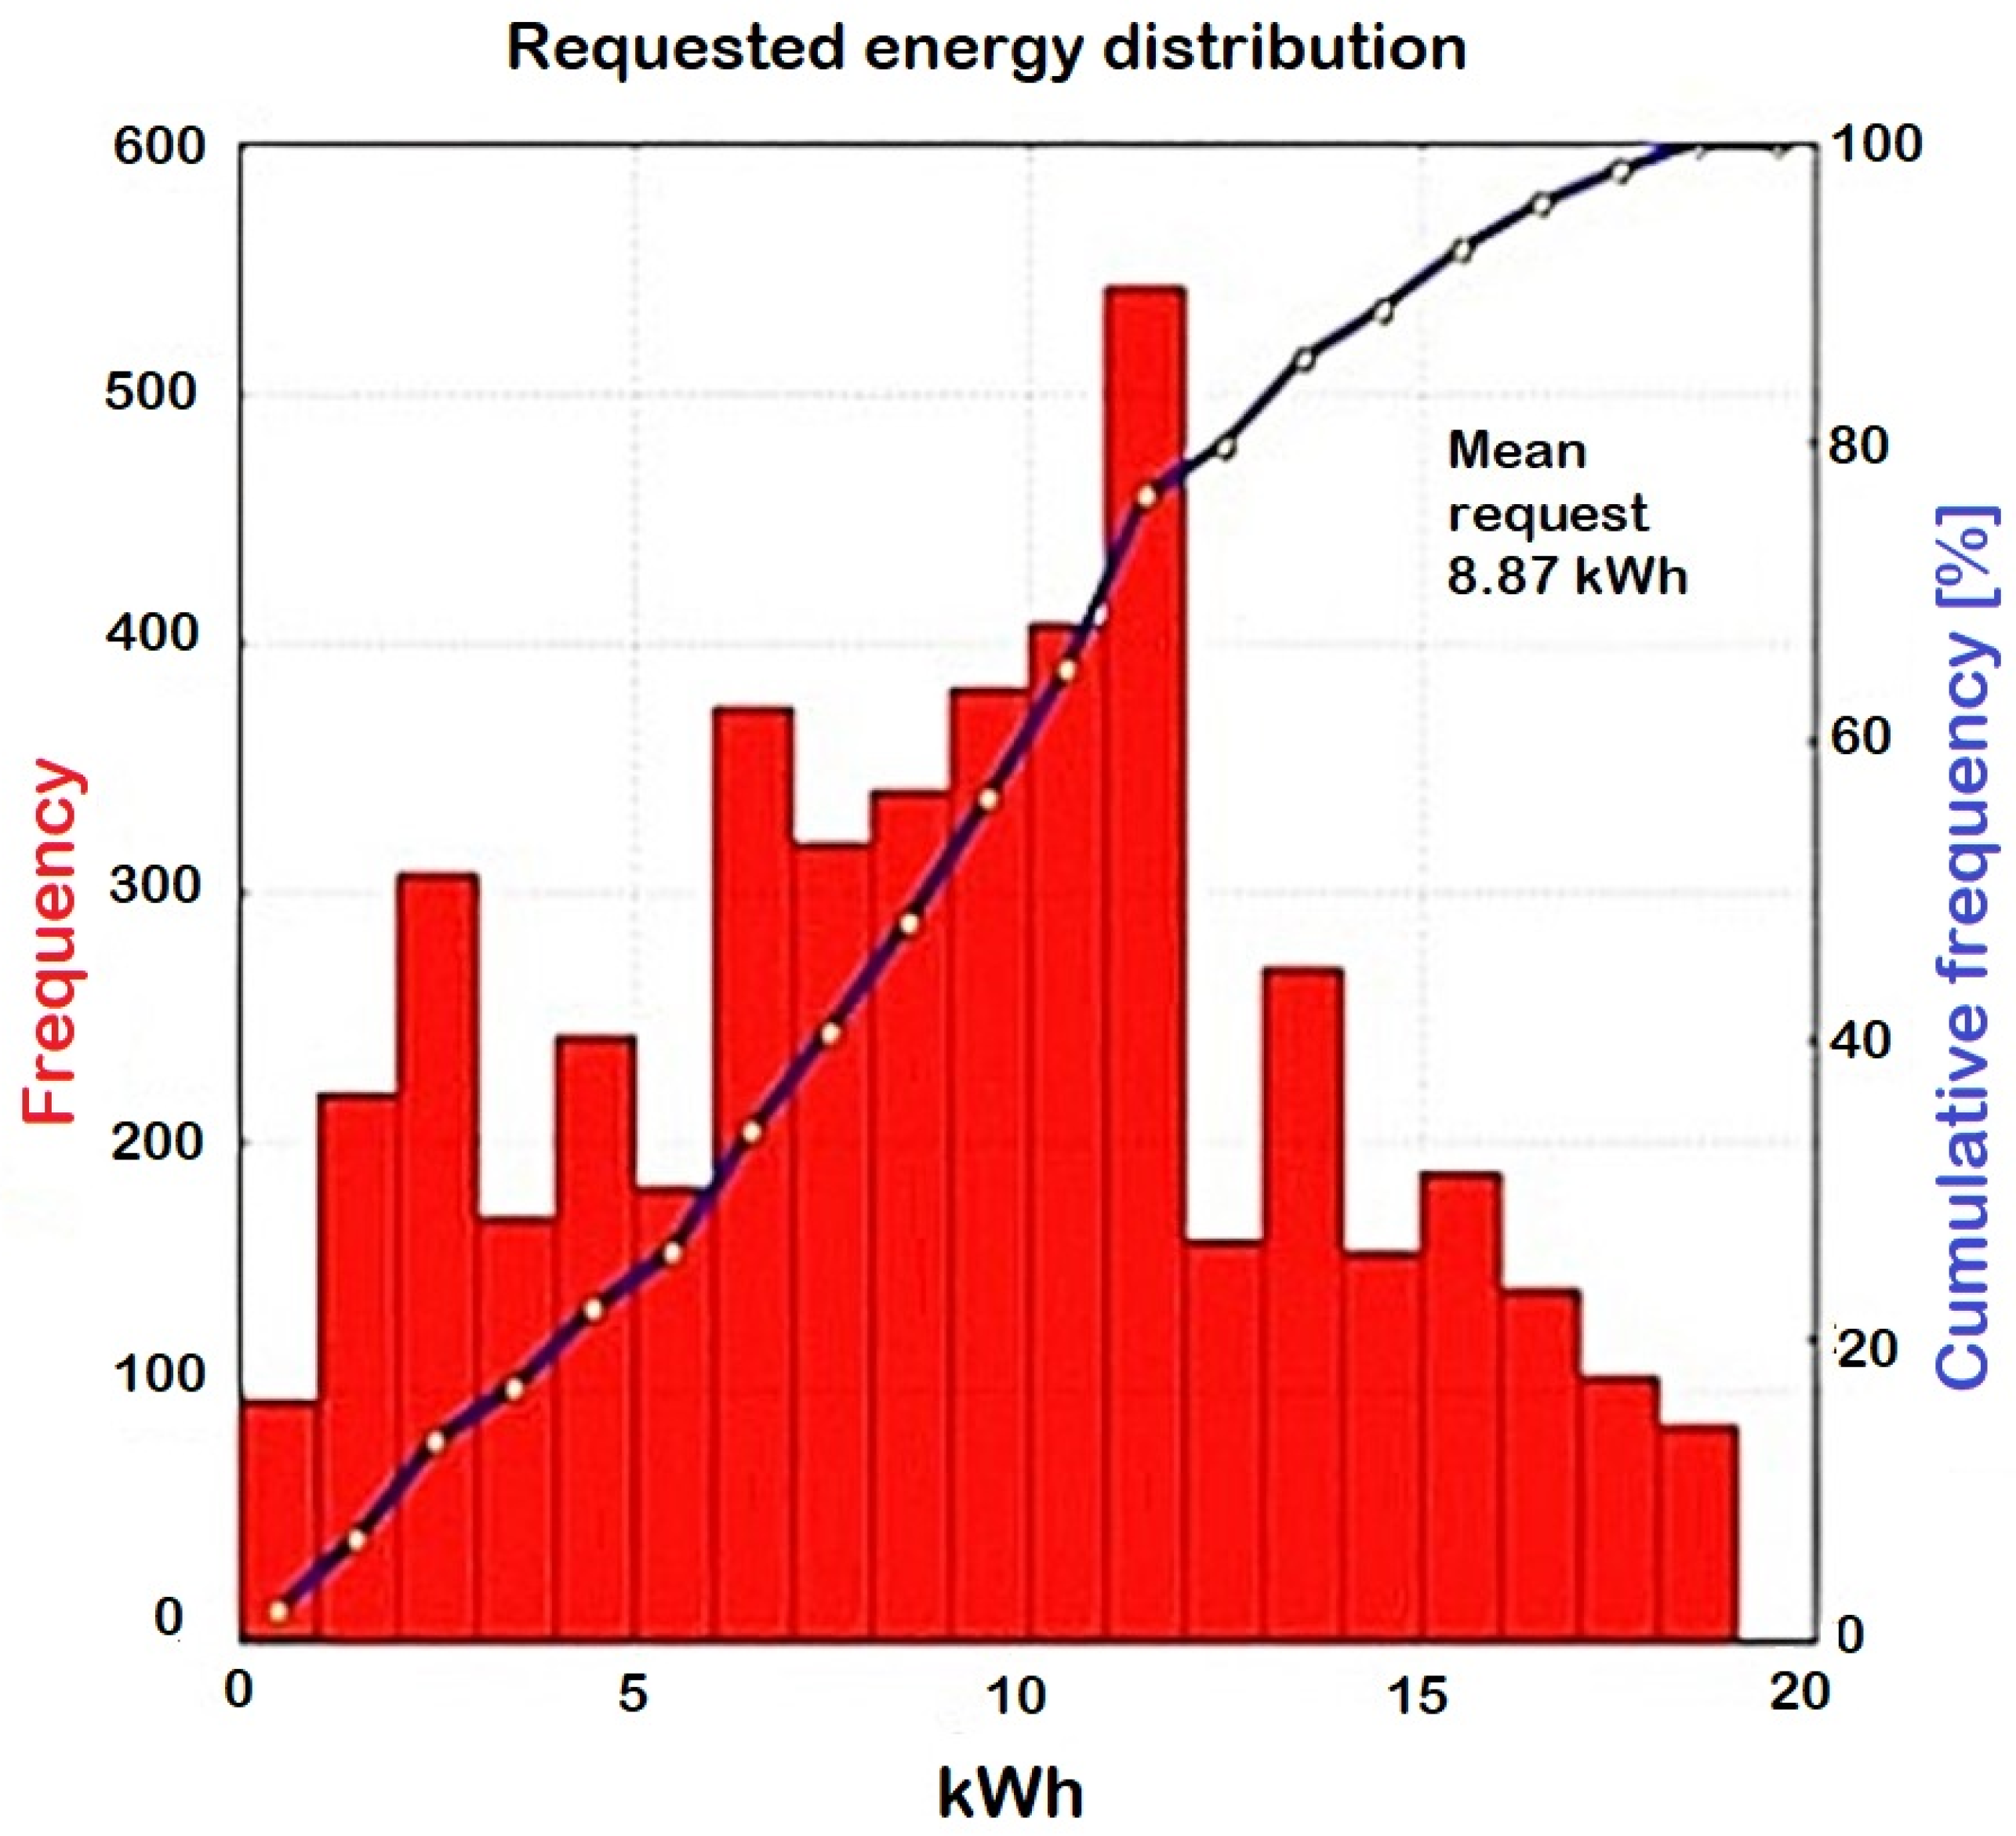
3.1.2. Charge Demand

To evaluate the energy required for EV charging, it is essential to calculate the distance traveled since the last charge. Analysis of parking frequencies in the workplace parking lot shows an annual average of 100 days per year. Typically, several days may pass between two consecutive visits to the parking lot.
For this study, we adopted several working hypotheses:
  • Charging is preferably done at the workplace.
  • Charging at home or any other location occurs only when strictly necessary.
Based on these assumptions, we determined the distance traveled between the last charging site and the parking lot. The EV consumption was estimated using experimental evidence from a Nissan Leaf 24 kWh, gathered through on-road measurements by ENEA. By applying this procedure to all vehicles over a year, we compiled the frequency distribution of daily energy requirements, as shown in Figure 11.
The maximum daily energy needed per vehicle is 19 kWh, while the most frequent charging requirement is 12 kWh. The average energy requirement for charging is 8.87 kWh. This average corresponds to a distance of 59 km, which is approximately 10 km greater than the average home-to-work-to-home distance. This suggests that the vehicle is being used for purposes beyond just commuting to and from work.
The time distribution of the energy required to recharge the vehicles for the entire parking lot for the entire year is shown in Figure 12. In particular, the blue curve represents the daily energy overall required by the vehicles being recharged (right axis), and in yellow, the number of vehicles (left axis). The maximum requested energy during the day is 300 kWh and a peak occurs almost every Monday due to the greater mileage on Saturday/Sunday. On other weekdays, the energy demand varies between 150 and 200 kWh.
A key factor in determining the most appropriate charging management strategy is the total duration of vehicle stops. The graph in Figure 13 illustrates the total number of hours that vehicles in the parking lot are stationary (shown on the left axis). Superimposed on this graph is a blue curve representing the required energy. The right axis displays values for both metrics, normalized to the 38 vehicles in the fleet using the parking lot.
There is an appreciable correlation between the total hours of stoppage and the energy required. Notably, three data points in the graph show parking duration exceeding 300 h. These instances occur during the summer months of July and August and pertain to a vehicle that remained parked for over ten days.
In Figure 14, we present a zoom-in on the two previous variables, focusing on the period from April 28 to June 23 (8 weeks). This allows for a better evaluation of their temporal behavior. Specifically, the quantities have been normalized based on the number of vehicles present in the parking lot each day. With this normalization, the two variables represent the average values per vehicle.
The overlapping of the average values of parking hours with those of energy demand can be observed, generally differing on Monday. The first week analyzed includes two holidays, hence the difference between the average values of presence and energy demand. Based only on weekdays throughout the year, the average parking is 8.31 h/vehicle while the energy demand is 8.87 kWh/vehicle.

3.2. Charge Management Strategies

This study identifies the design conditions for the charging infrastructure at the parking lot in two ways:
  • N° CP ≥ N° EV
  • N° CP < N° EV
The first scenario assumes that there is always a CP available for each vehicle arriving at the parking lot, resulting in a surplus of CPs. In this case, a smart charging system only needs to manage the power distribution among CPs to meet the network’s needs.
In contrast, the second scenario involves a limited number of CPs, which is fewer than the number of vehicles in the parking lot. Here, it is necessary to manage a queue for charging requests. When multiple vehicles arrive in a short period, it becomes important to handle the movement of vehicles between charging stalls and parking spaces. To meet the charging demand effectively, the queue management must be “smart.” This means it should consider the expected parking durations and the amount of energy each vehicle requires. The goal is to ensure that no vehicle leaves without charging while fully charged vehicles remain connected to the CPs in the parking lot.

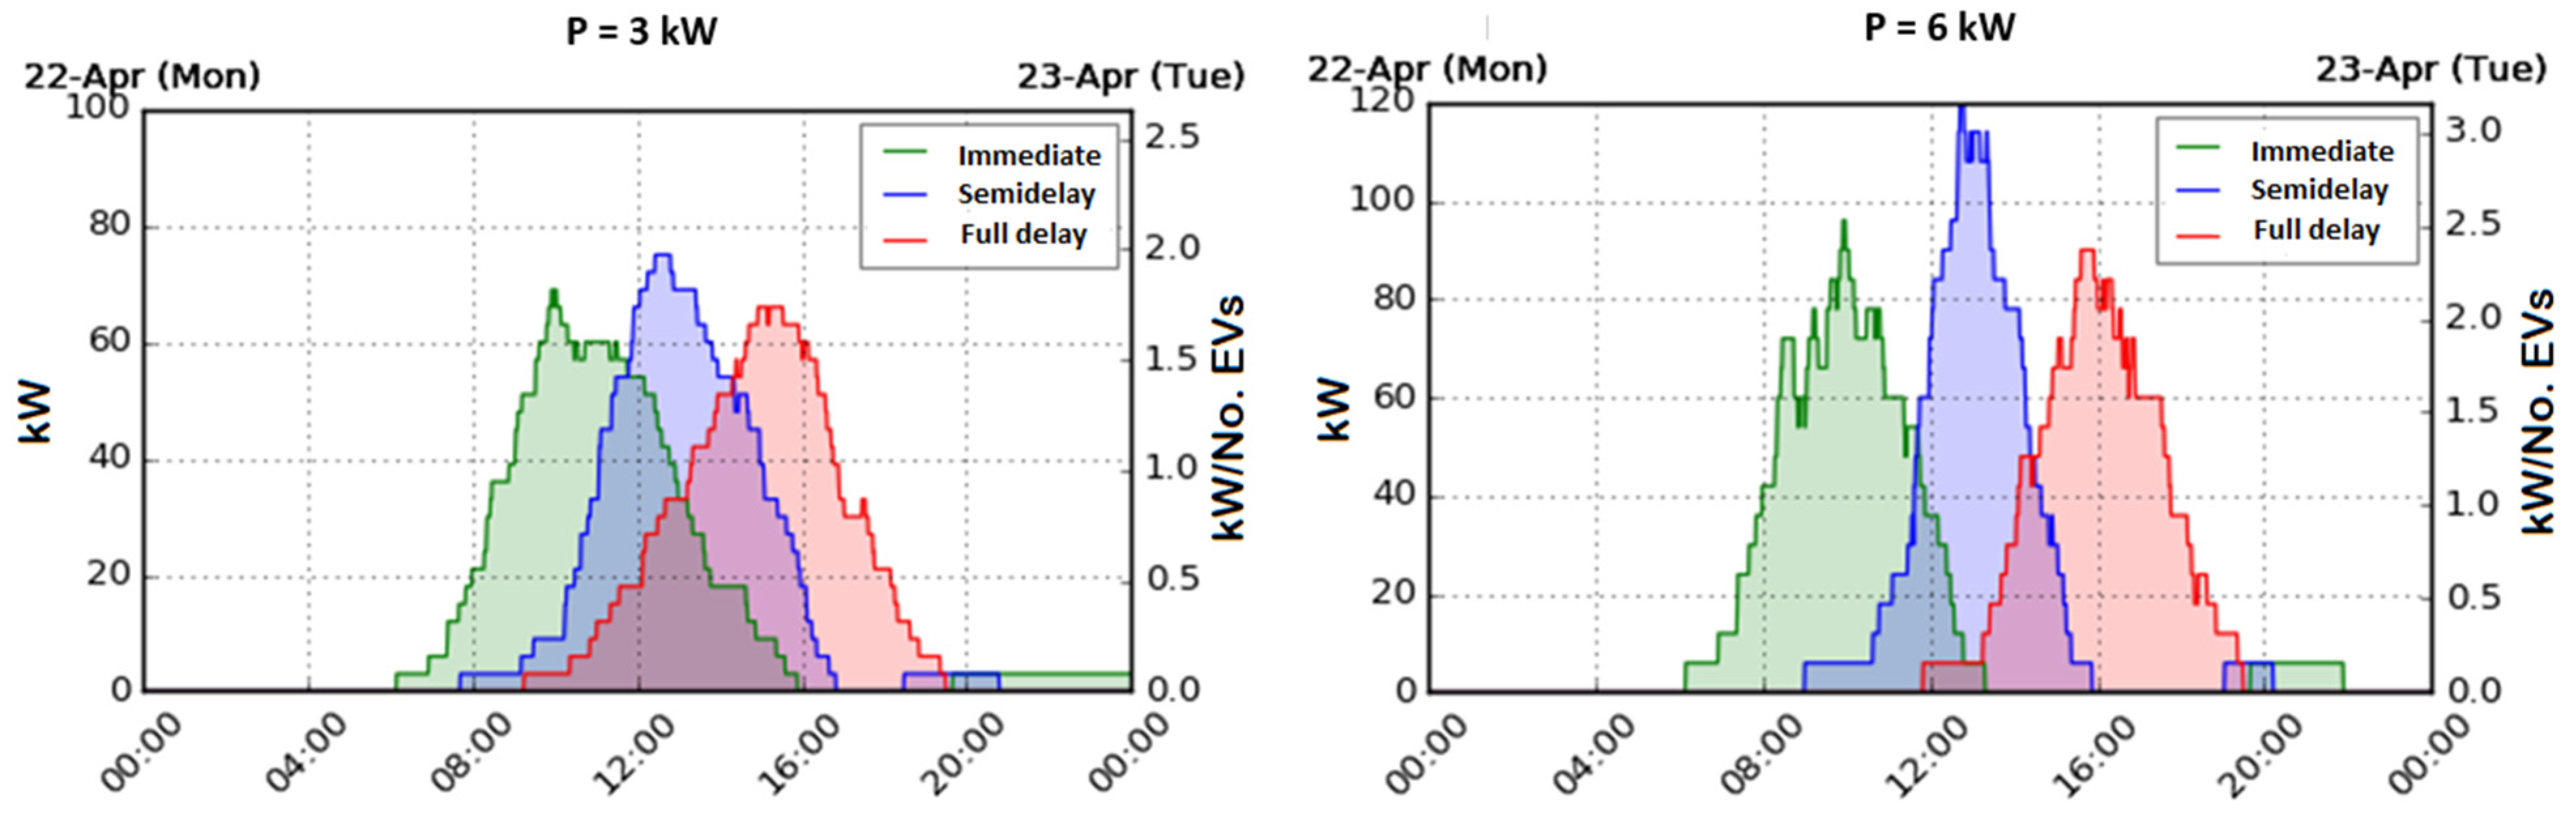
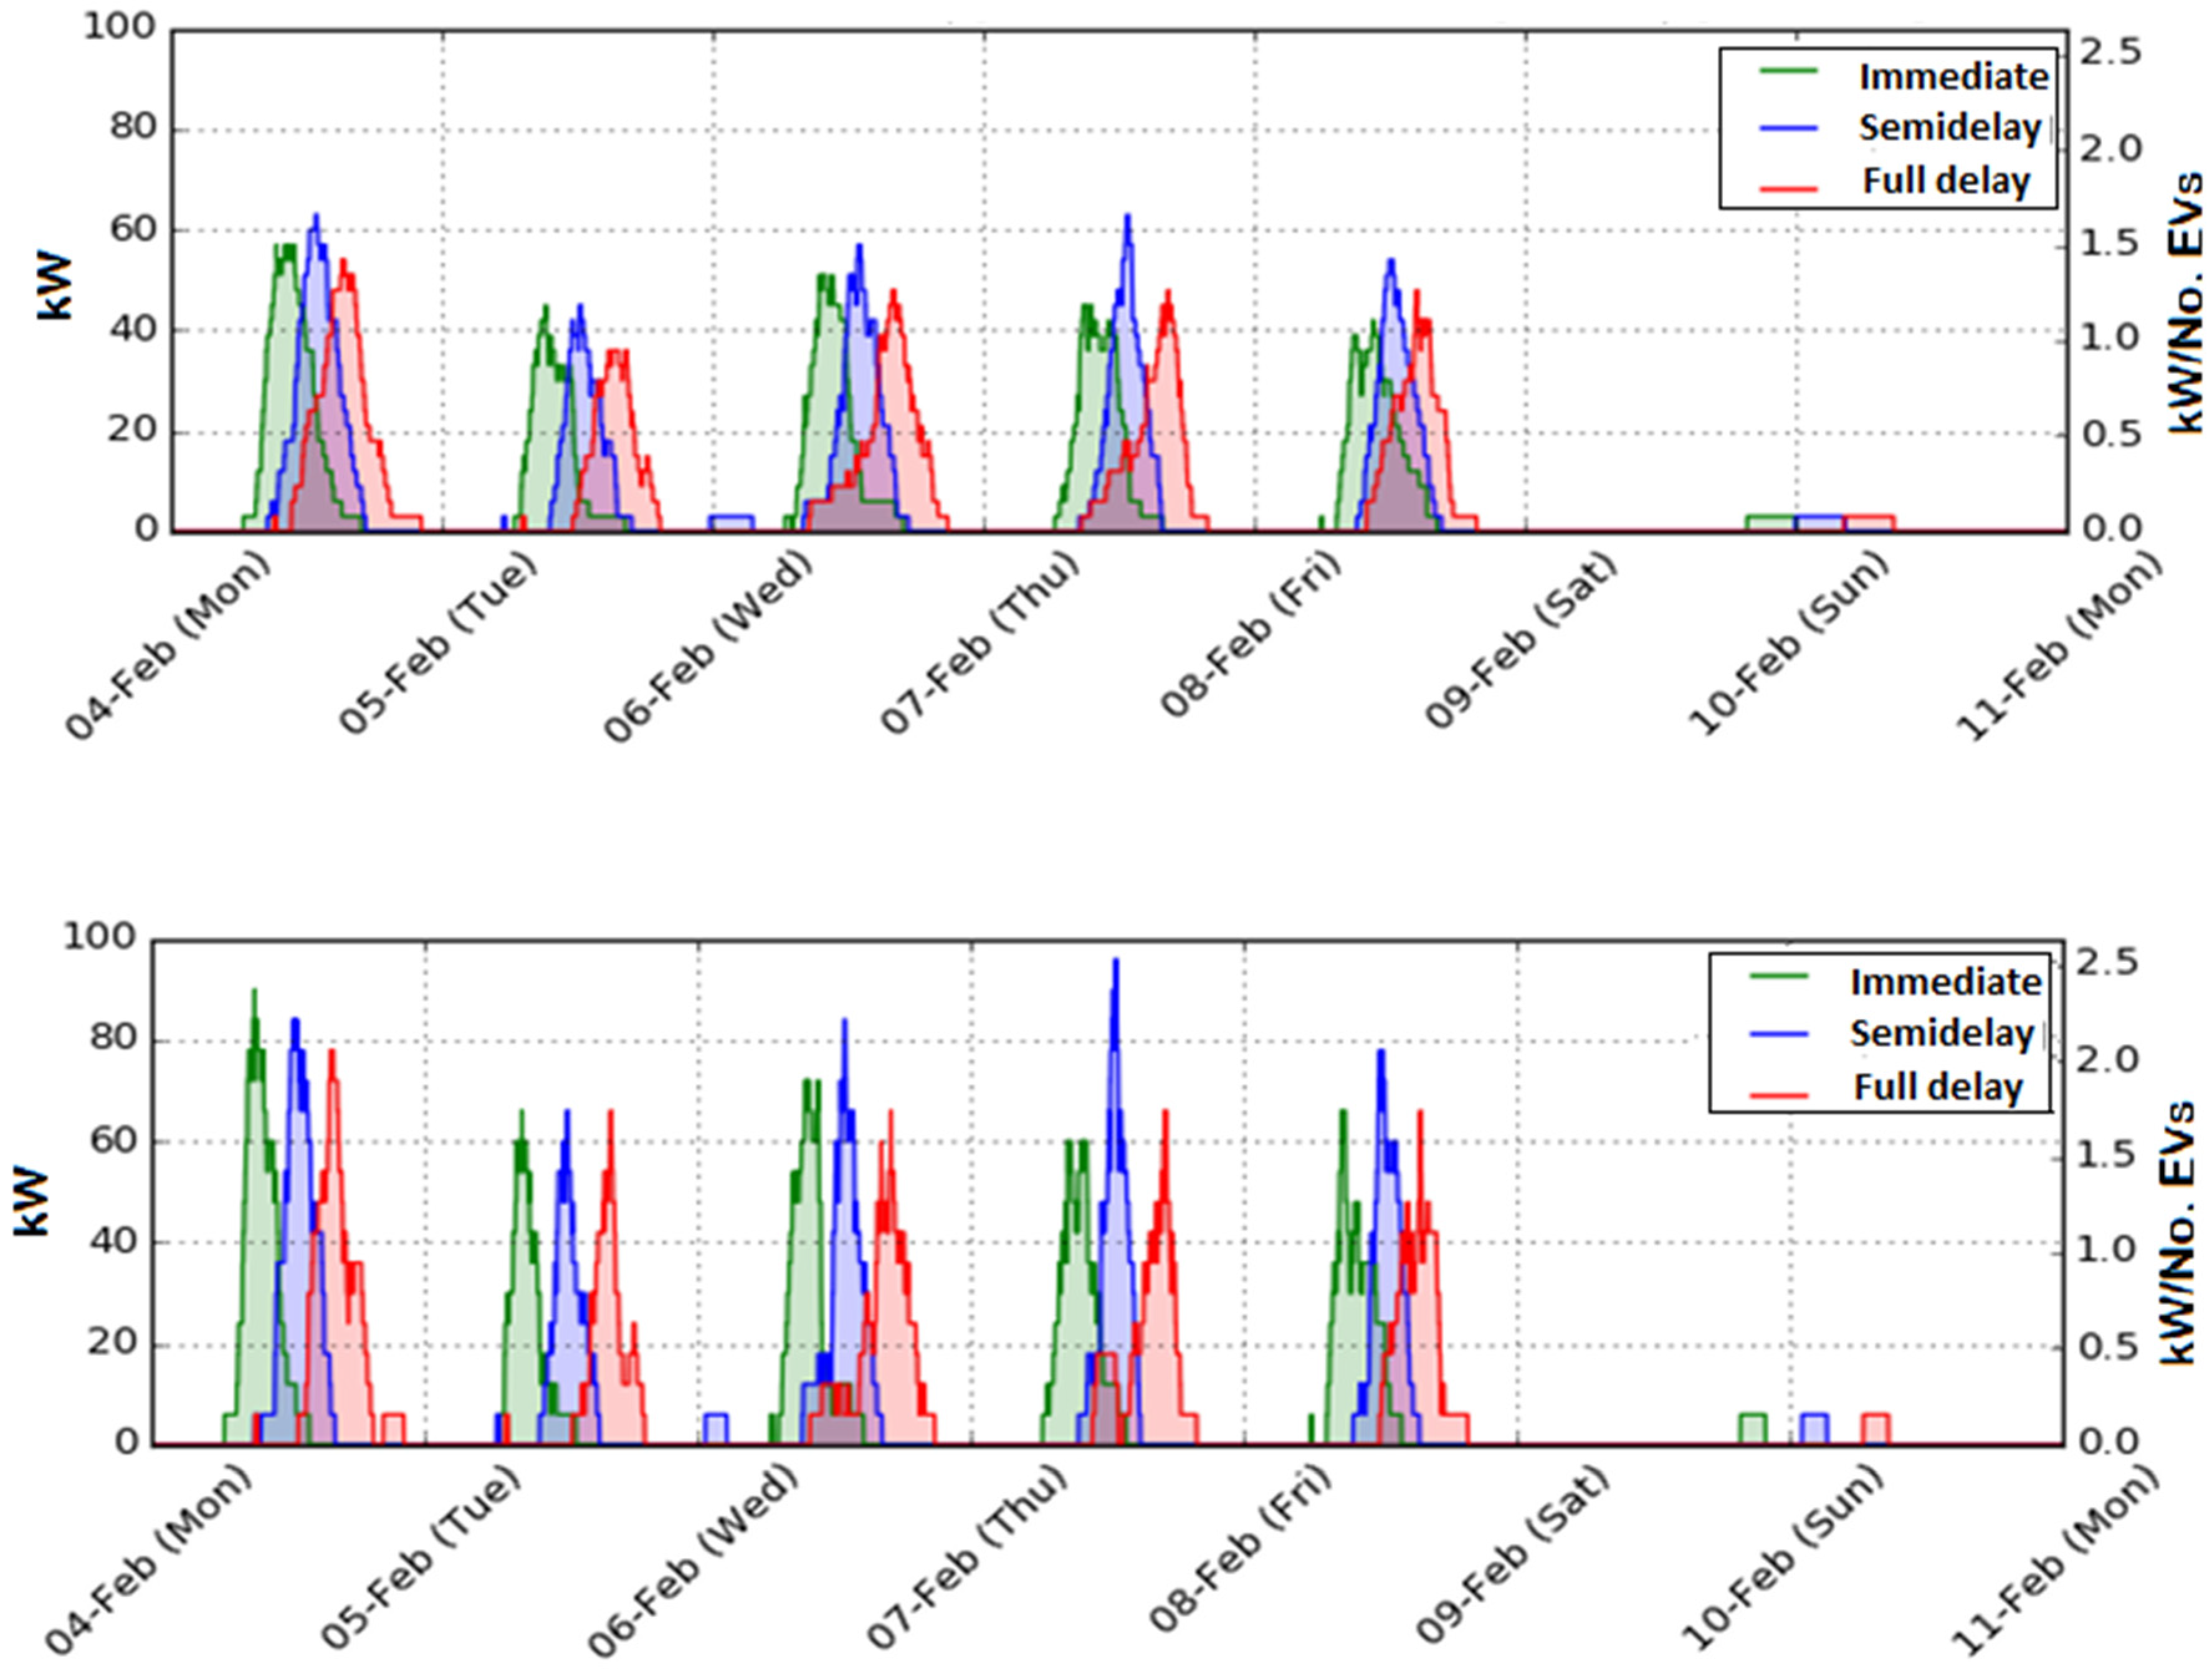
3.2.1. Surplus of CPs

In this scenario, the availability of CP exceeds the demand, meaning it does not restrict the formulation of the charging problem. However, a constraint in the provision of the service arises from the overall power limit that the charging system can provide.
To verify the maximum charge requirements, we evaluate the power supplied to the load on the most critical day. On this day, the 28 vehicles in the parking lot collectively need a total of 325 kWh for charging. We consider two different charging power levels for the CPs: 3 kW and 6 kW.
Figure 15 displays the distribution of power required for EV charging, indicated by the green line. We assume that each charging session begins as soon as the EV parks, with the connection time to the charging point considered negligible. Under these conditions, the maximum peak power is just under 70 kW, occurring around 9:30 AM, and drops to zero by 4:00 PM. Charging usually ends around 8:00 PM, which is before the last vehicle departure. The time interval between the end of charging sessions and the departures becomes longer when the charging power level increases. For example, when CP charging power is 6 kW, charging usually ends around 1:00 PM, reaching a maximum request of 100 kW. For each BV, we define “residual time” as the interval between the end of the charging session and the vehicle’s departure, see Figure 16. On average, this residual time is approximately two-thirds of the total stop time when charging at 3 kW, and it increases with higher charging rates.
Since the average residual time is not zero, we can evaluate a charging strategy that establishes a time interval between the vehicle’s arrival at the parking lot and the start of charging. To assess the impact of this procedure on the power profile, we introduced the following delays:
(a)
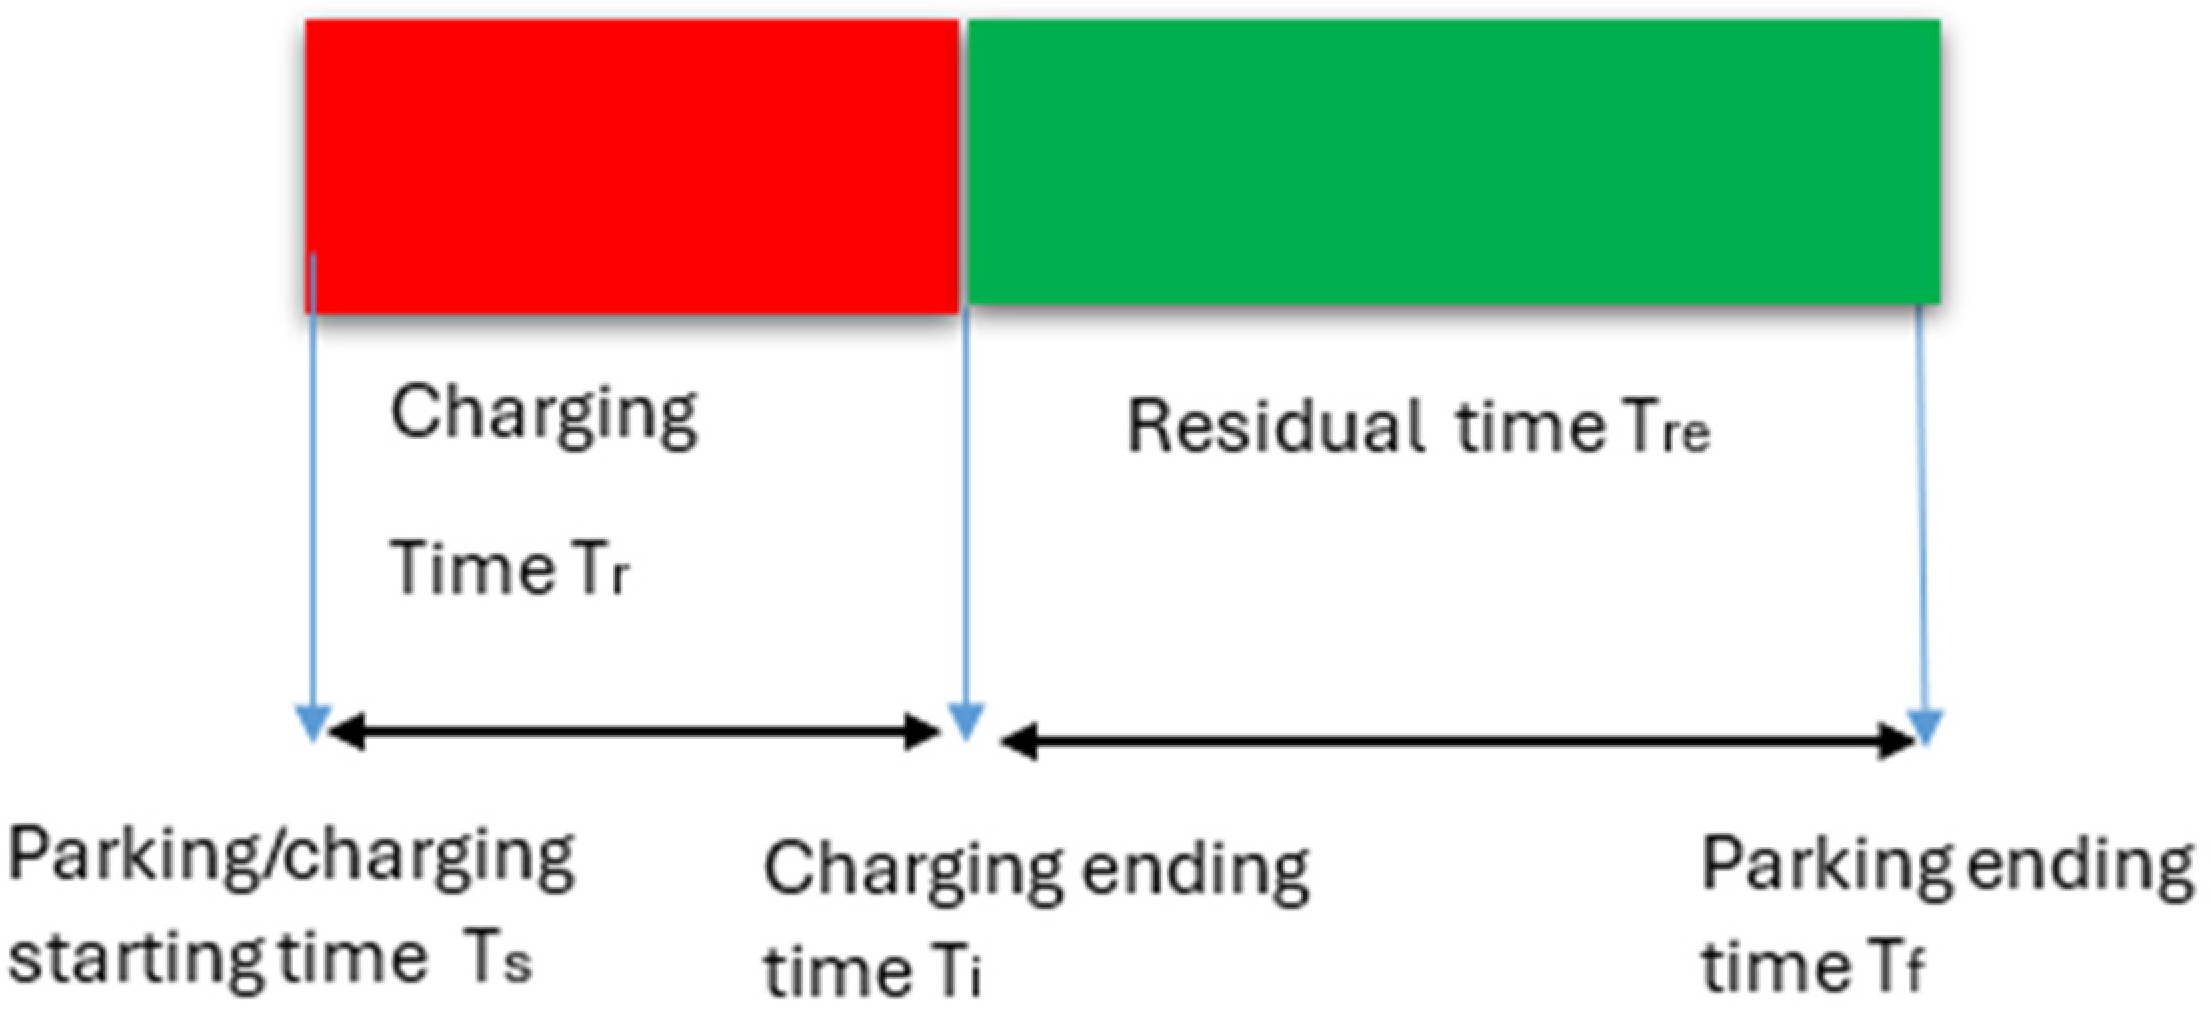
The vehicle waits for a time equal to half of its residual time.
(b)
The vehicle waits for a time equal to its full residual time.
Under the first condition, the residual time is halved compared to the scenario without waiting. In the second case, the residual time becomes zero. This temporal shift results in slight changes to the maximum power demand. The highest power request occurs in case (a), due to an increased number of overlapping charging events.
For high-power CPs, while the charging load trends remain similar, we observe a higher peak in committed power with a shorter withdrawal time, due to reduced charging duration for each vehicle.
Figure 17 shows the power trends for a typical week (February 4–10) for the two different charging power options (blue curve: half residual time delay; red curve: full residual time delay; green curve: no delay). Comparing the two graphs in Figure 17, it is evident that doubling the charging power results in a 50% increase in the maximum power delivered, for instance, rising from 63 kW to 96 kW.
The temporal analysis of charging requests indicates that the maximum number of active CPs at any given time is lower than the number of vehicles present. For example, in a no-delay scenario, out of 27 vehicles parked simultaneously, only 22 CPs are active when using 3 kW CPs, and only 16 are active with 6 kW CPs.
While both CP configurations are sufficient to meet the charging needs of the EV fleet in all three delayed charging approaches, ensuring that no vehicle leaves the parking lot without being charged, the 6 kW option increases the maximum peak power demand by up to 40% compared to the 3 kW case.
We now introduce some charging strategies to contain the power peak. The charge control system is represented by the scheme identified in Figure 18. The master receives the end-of-parking information from the user and the initial SOC from the vehicle. Based on these inputs, the master programs the charging start time by closing the power circuit and opening it at the end of charging.
Figure 19 illustrates a workflow for managing vehicle charging based on parking time, with a delay equal to the “residual time”. P r is the maximum power level at the CP.
The duration of the charging session is influenced by the vehicle’s technical specifications and the power level of the charger. If the dwell time is equal to or shorter than the necessary charging time, charging will commence immediately. However, if the parking duration exceeds the required charging time, charging will begin at a later moment T i . The goal for the final SOC is 100%, although it could not be fulfilled in some situations.
T r = charging time.
T f = end-of-parking time.
T i = start charging time.
T r = residual time.
Another goal of charging management is to improve the performance of the parking charging system by reducing power peaks.
One way to contain power peaks is to reduce the charging power of the vehicles to maximize the number of active CPs with the same total power delivered. Let us consider the following two different configurations for the CPs that aim to halve the total power, illustrated in Figure 20:
(a)
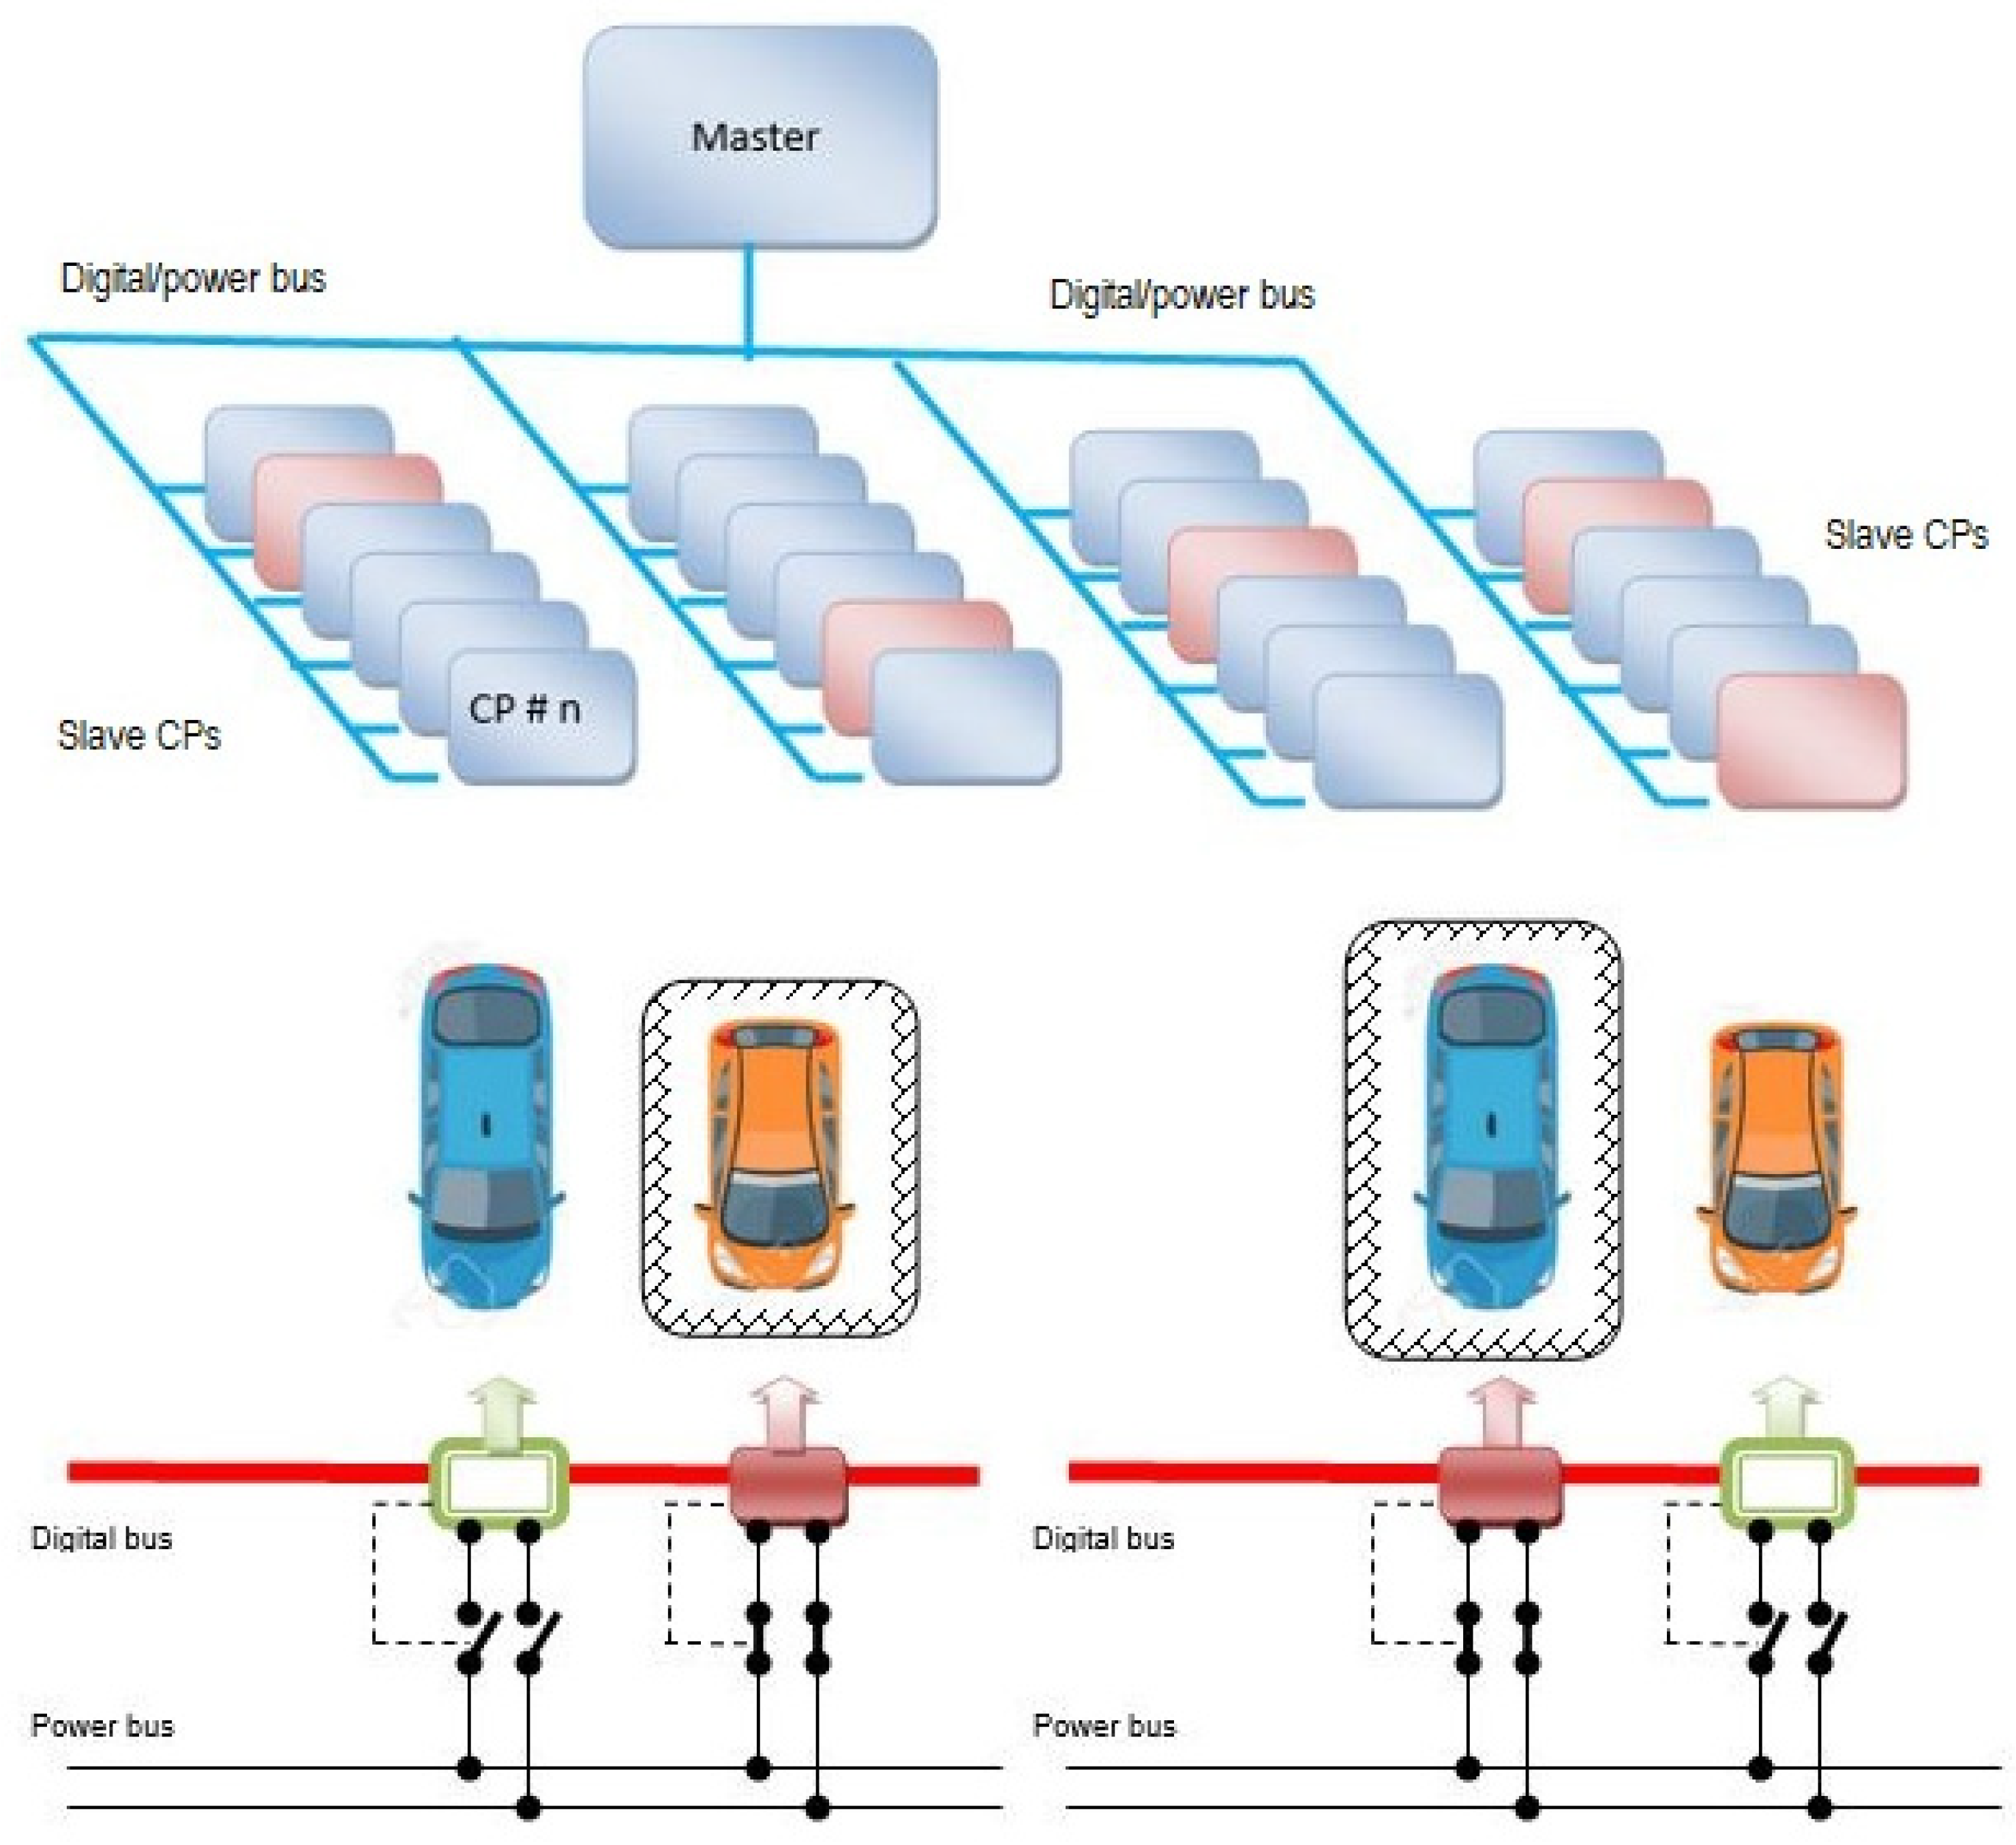
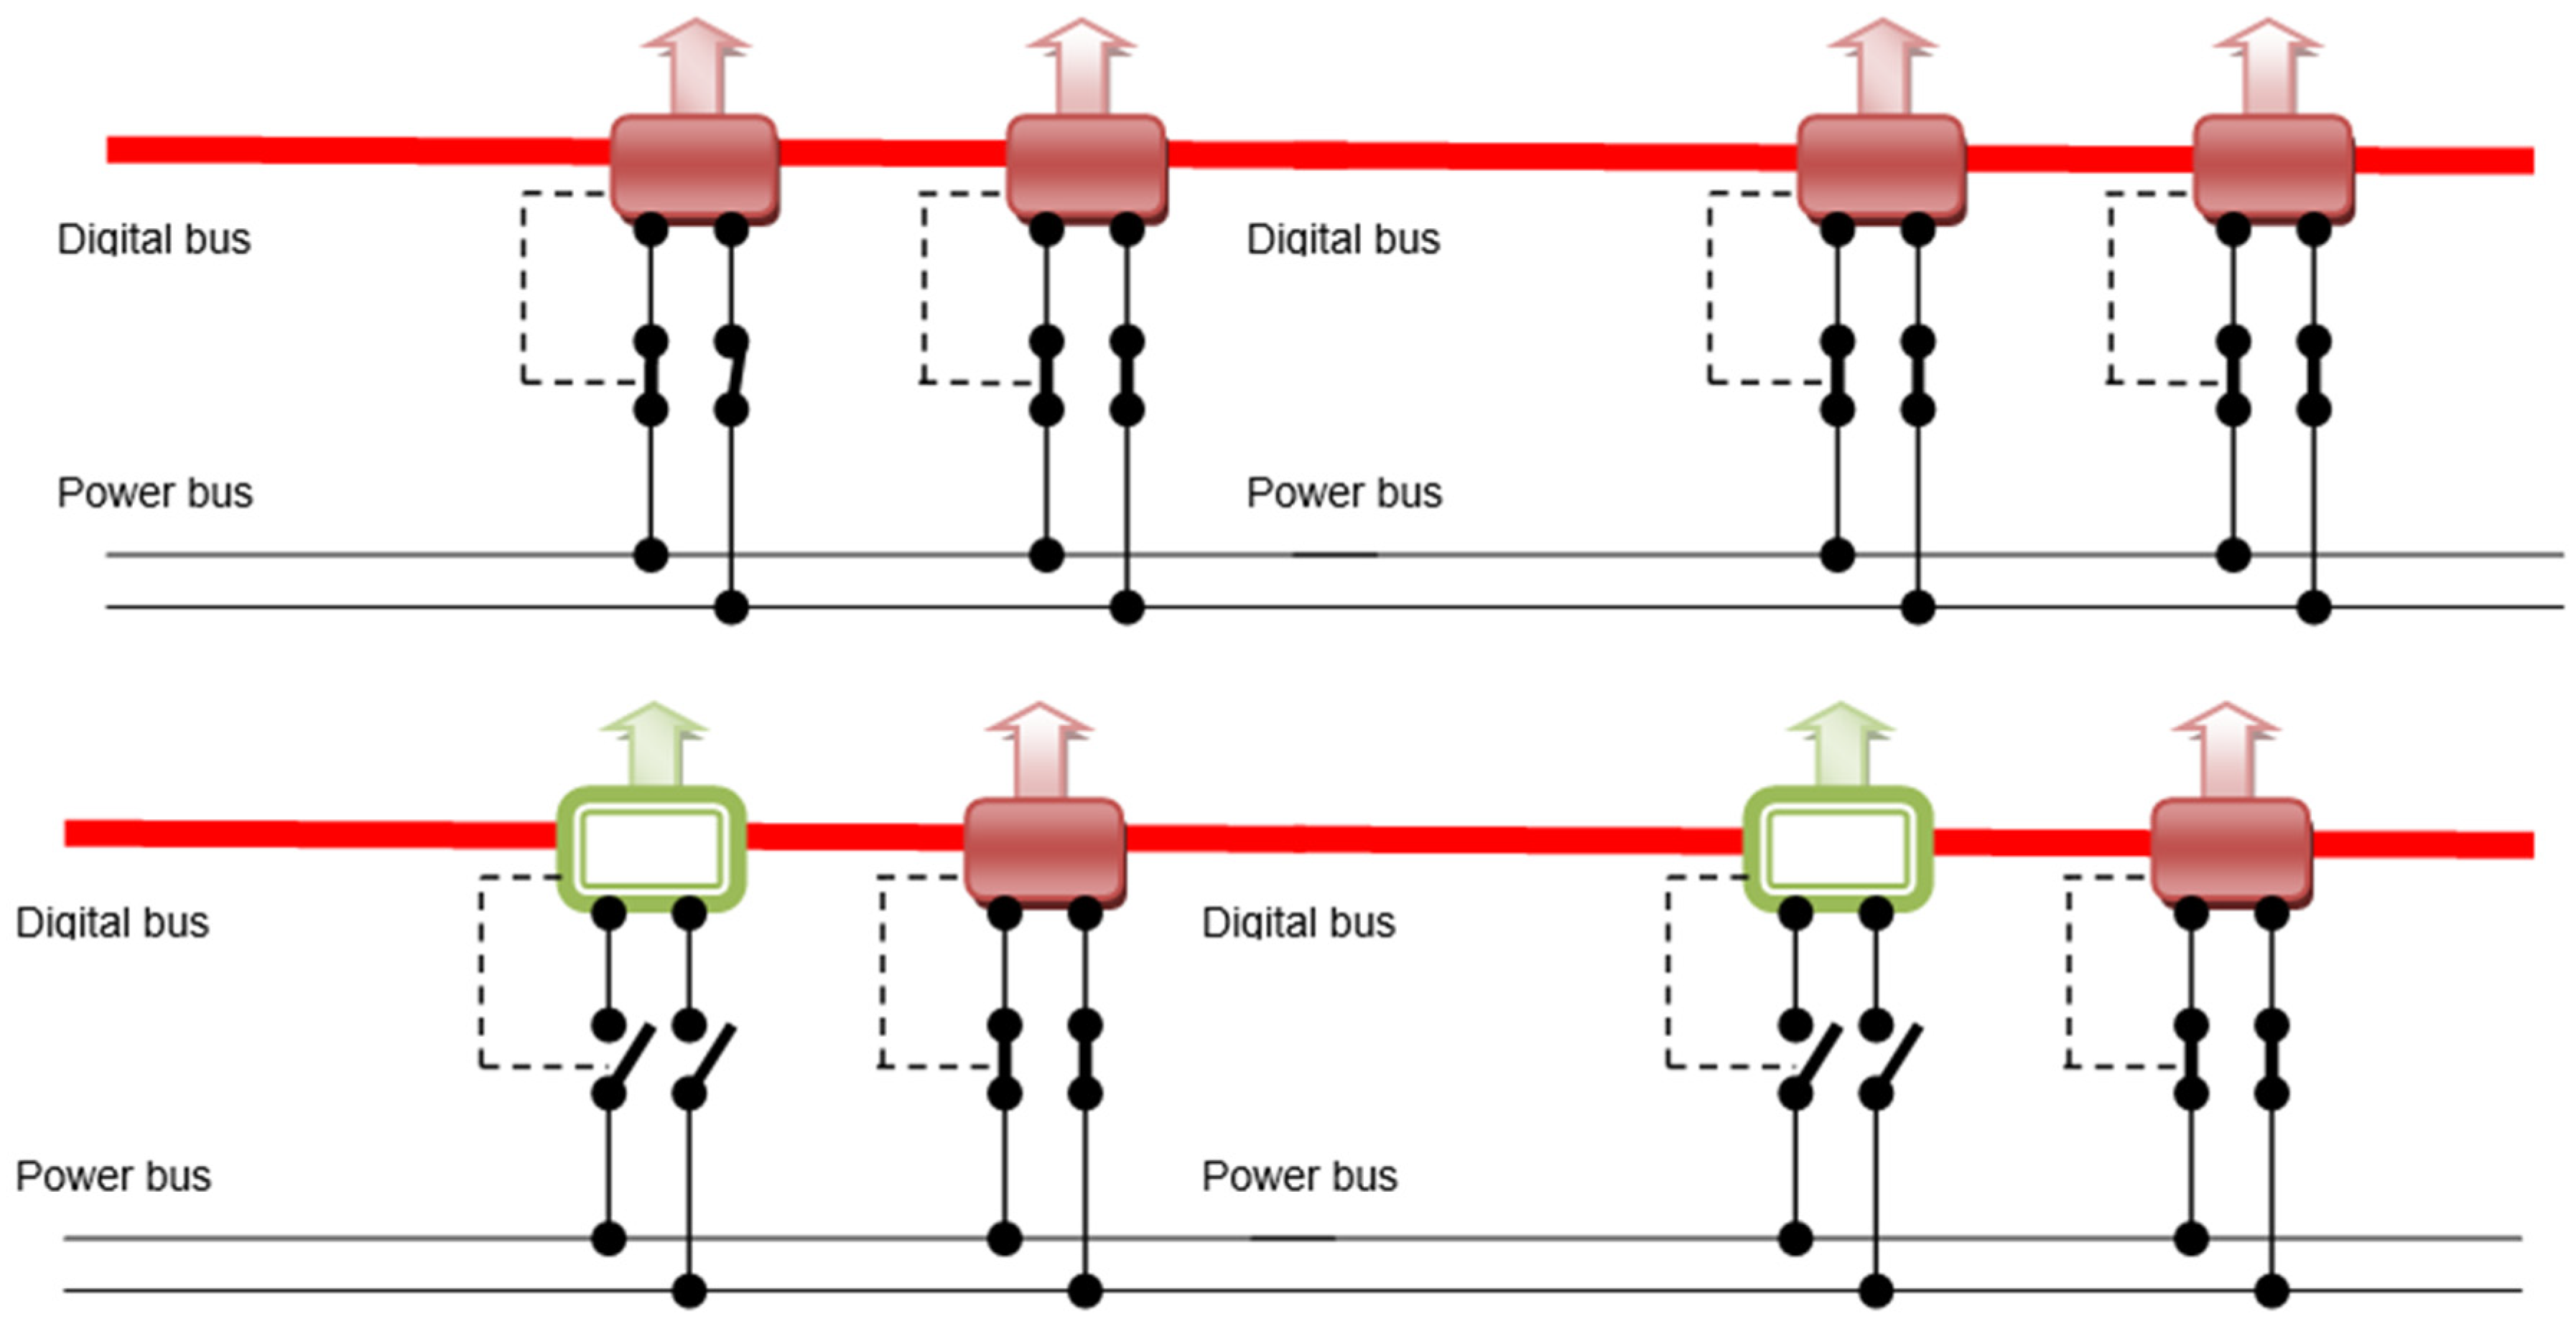
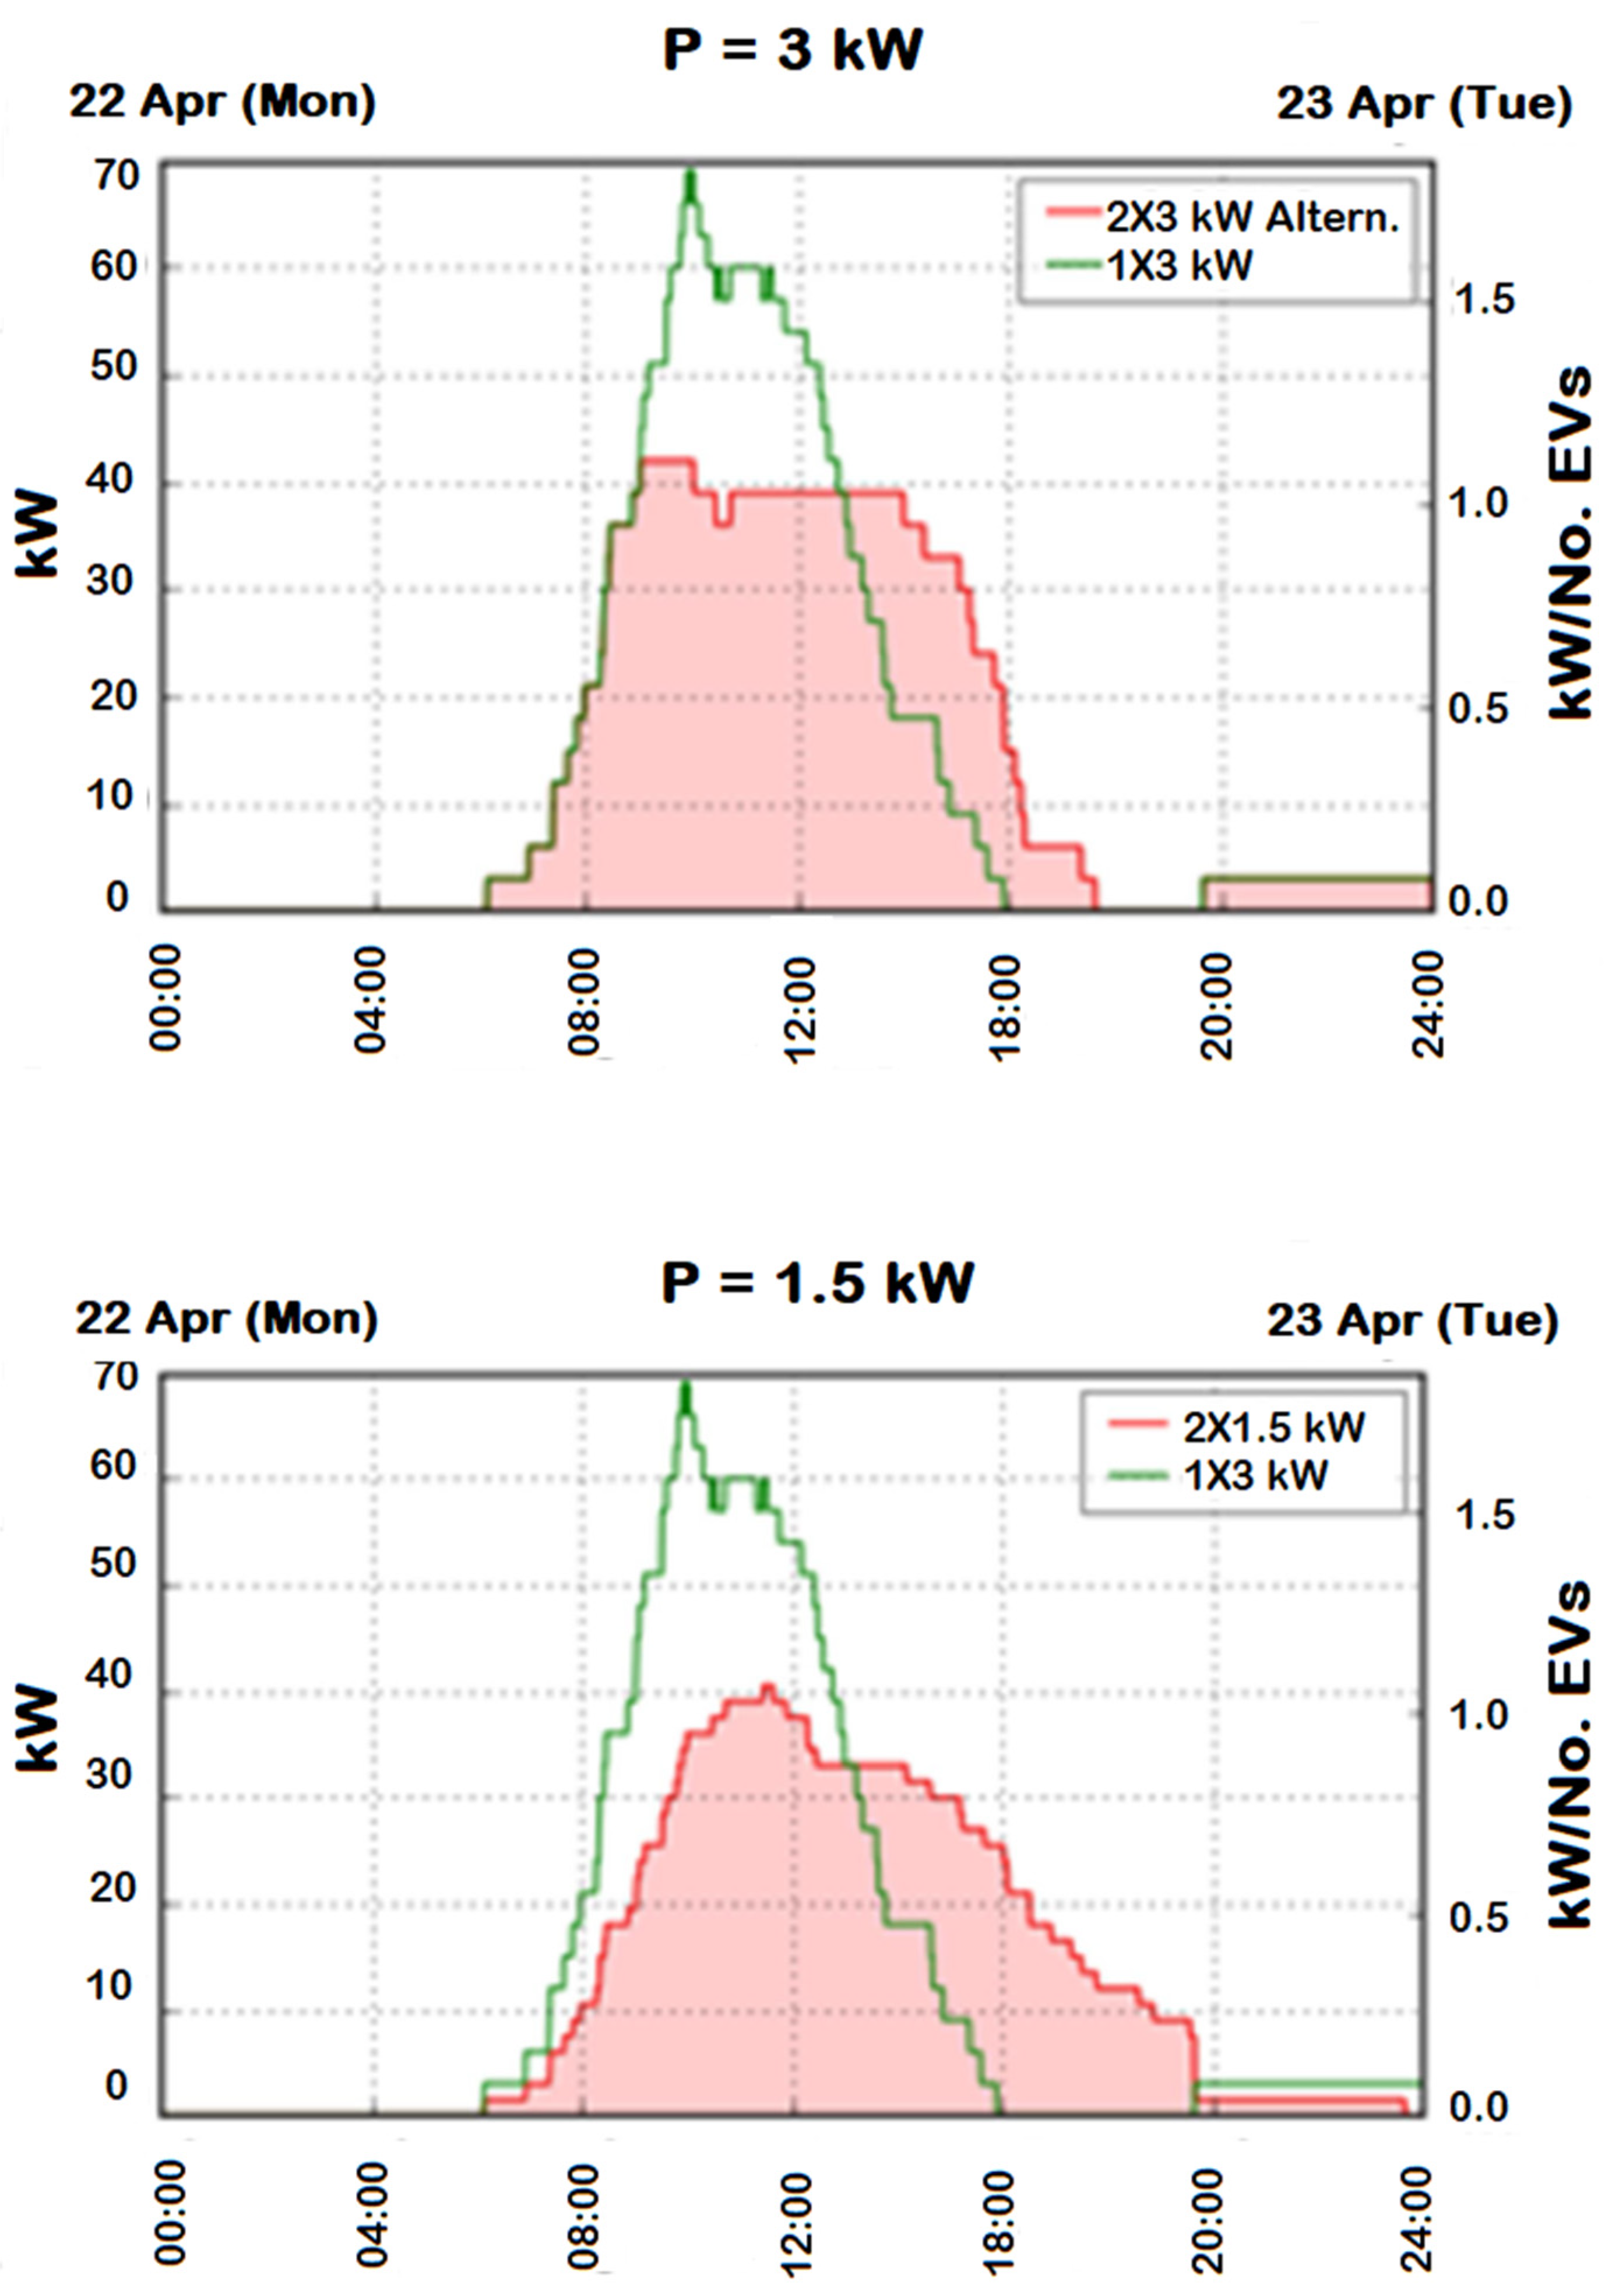
All the engaged CPs are powered, but with a power equal to half the nominal power of the CP.
(b)
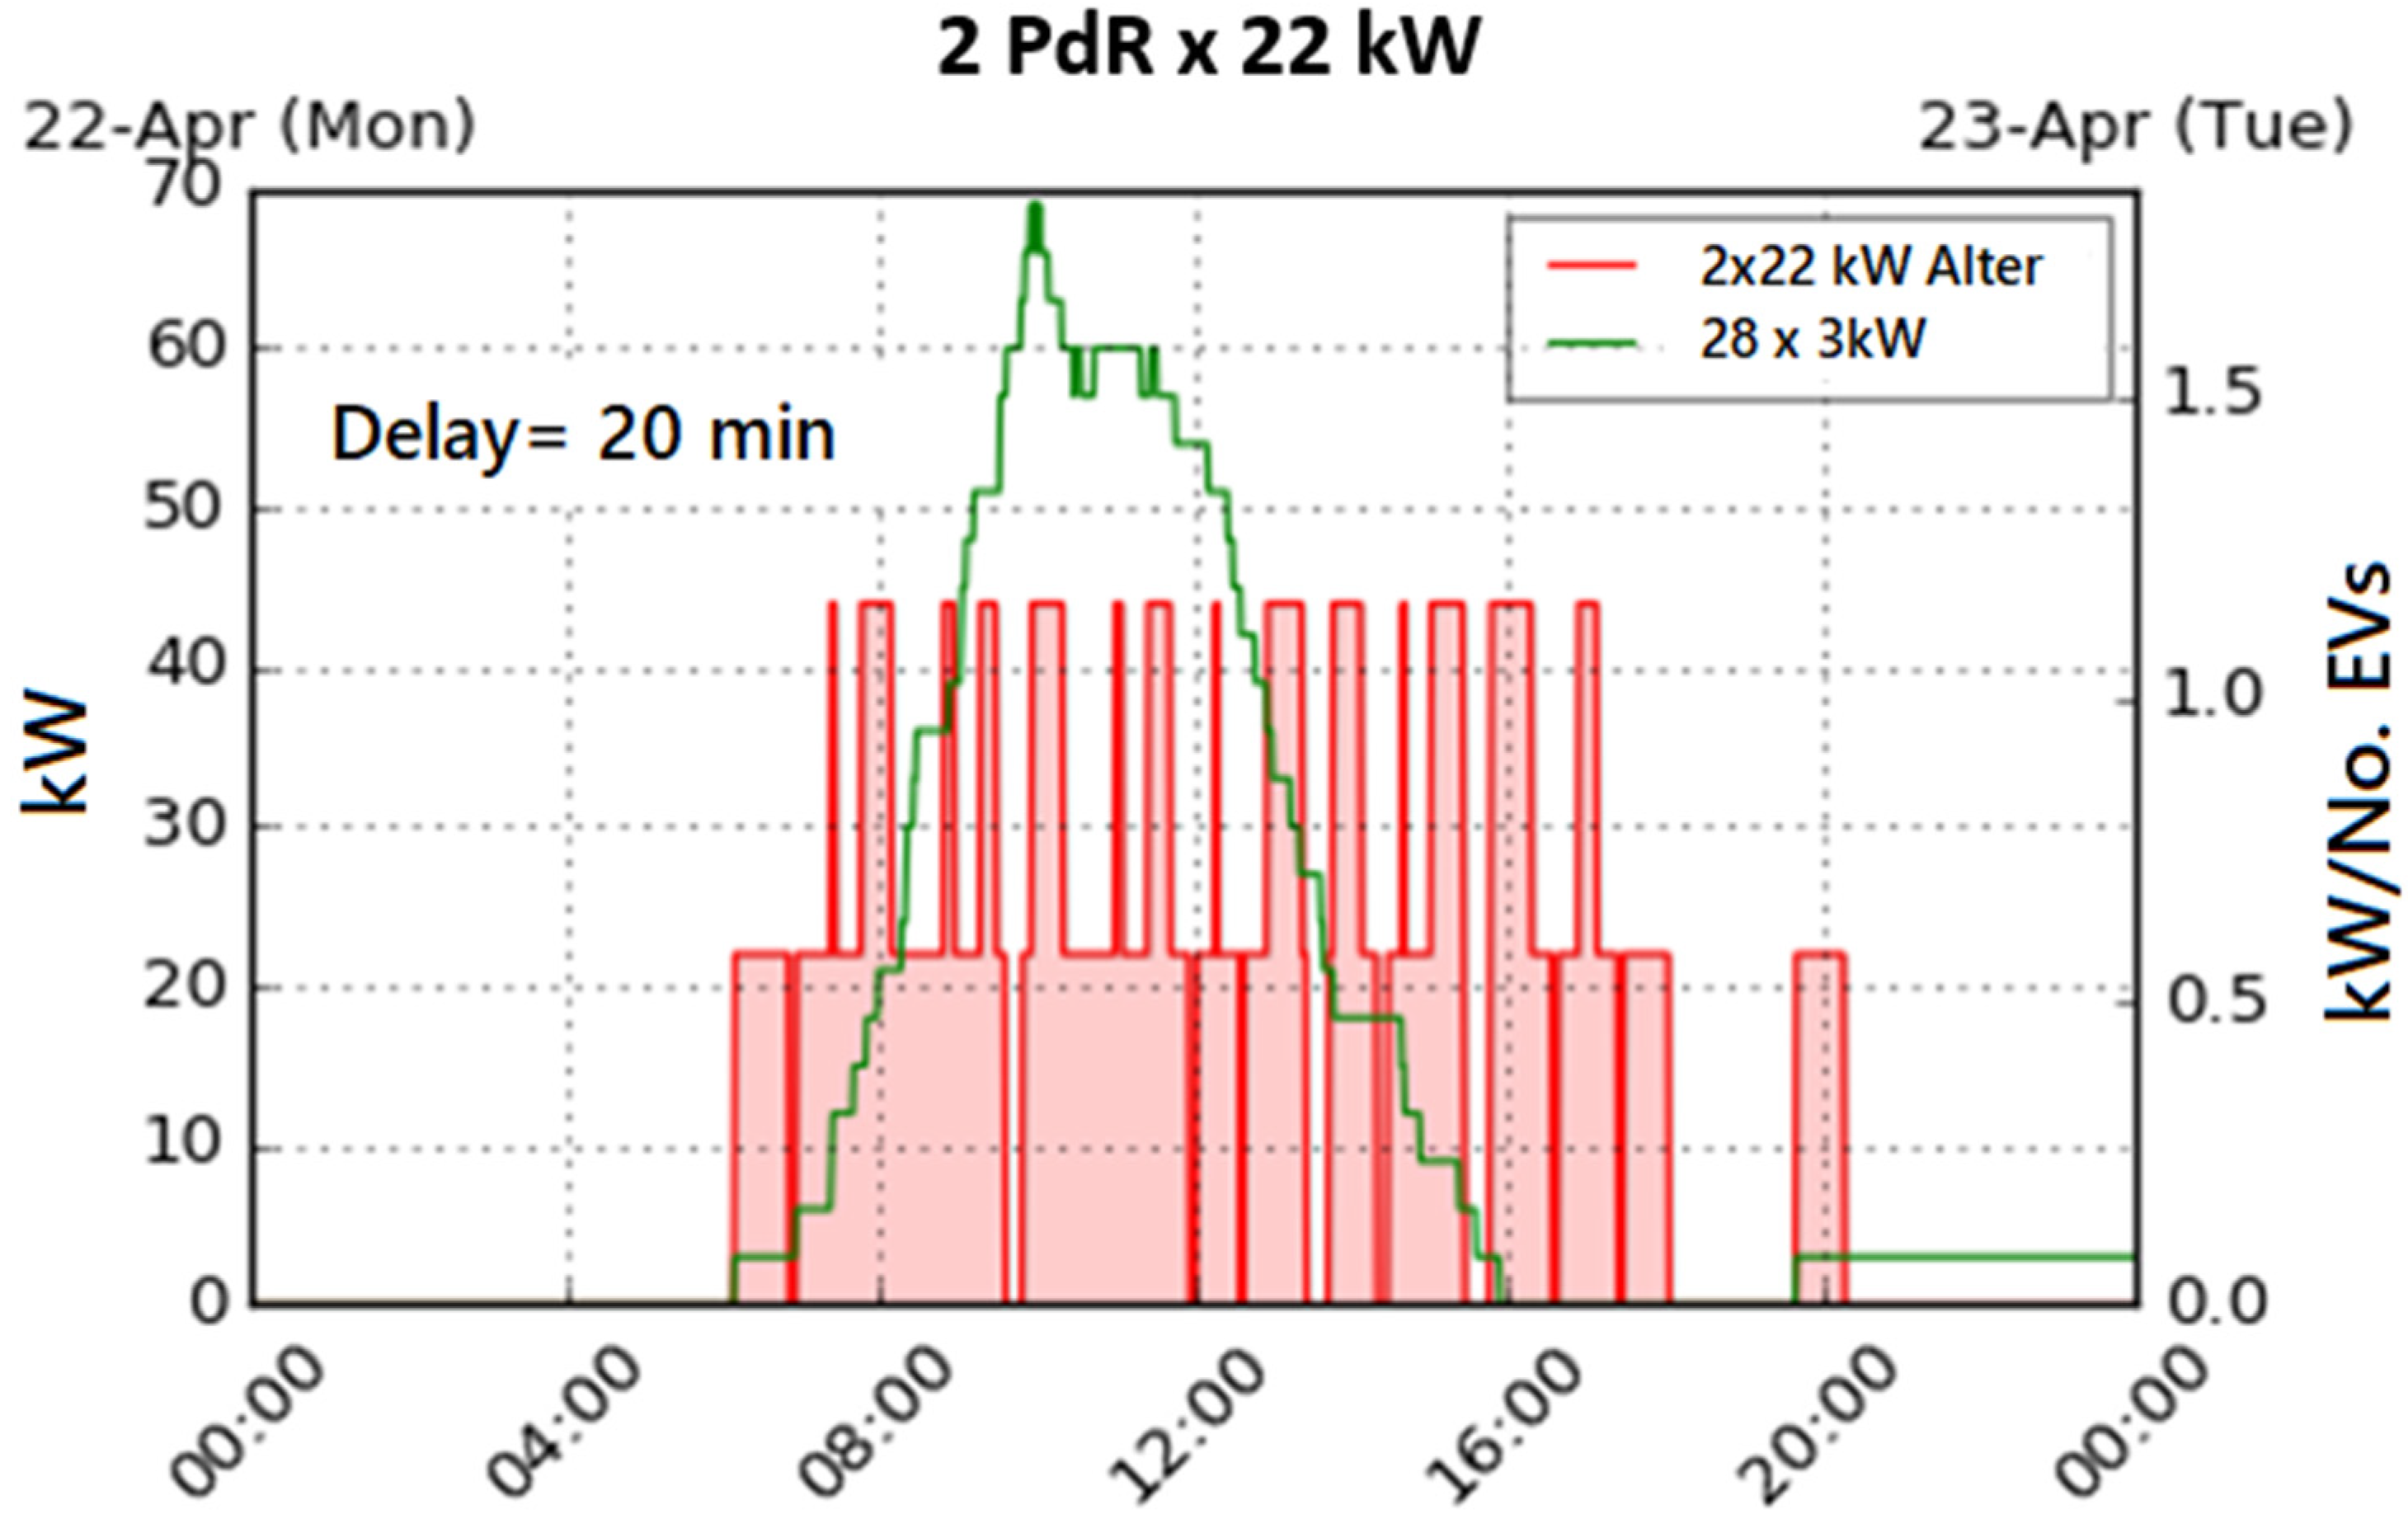
The CPs are grouped in groups of two and are powered alternately at the nominal power of the CP.
Approach (b), which involves grouping the CPs, allows the same charging power to be applied to two vehicles but at different times. The result is a halved overall power due to the limitation of access to charging.
The CPs are virtually connected by the master, allowing for greater flexibility in managing activations and deactivations, even if they are located in distant stalls (as illustrated in Figure 4).
Simulations were conducted to the power distribution over time under two different charging management approaches. Figure 21 summarizes the results for a typical day (22 April). We assume there are 28 CPs, corresponding to the number of parked vehicles.
The graph on the right illustrates mode (a), where power is distributed across all 28 CPs. In contrast, the graph on the left represents mode (b), where a maximum of 14 CPs can be activated simultaneously. Additionally, the figure shows the power trend when vehicles are charged at 3 kW (green line), with charging beginning upon arrival, following the FIFO (first-in-first-out) logic.
In Approach (a), which limits the charging power at the CPs, the maximum peak demand is reduced to 40 kW (as shown in the top panel of Figure 21). The load power curve increases at a slower rate compared to the case of uncontrolled charging (green line). Reducing the maximum requested power results in extended charging times, postponing the end of operations to 8:00 PM. Reducing the maximum power available for charging to 1.5 kW prevents the full charging needs of electric vehicles. For the day under investigation, for example, five cars leave the parking lot before their batteries are fully charged, resulting in a total of 8.2 kWh (about 2.5% of the total energy demand) not being supplied. To address this issue, full-power charging could be provided when only one vehicle is connected to every two charging points.
Charge management according to Approach (b), as illustrated in the graph on the bottom of Figure 21, requires the knowledge of each stop duration. This allows prioritizing the vehicle with the shortest residual time among those connected to the CPs. Having more information enables us to manage power usage effectively and plan charging schedules. Initially, the power curve aligns with that of uncontrolled charging (green curve). Around 9:00 AM, the power reaches the limit of 42 kW. From this point onward, charging is managed to ensure that this power limit is not exceeded; some vehicles complete their charging while others begin, maintaining a constant total power usage. As a result, some vehicles are connected to the CPs but are not actively charging. The power supplied remains constant until 2:00 PM, after which it begins to decrease and reaches zero by 6:00 PM.
The maximum power drops from 70 kW of the uncontrolled charging to 42 kW. The overall charging time is extended by two hours due to the staggered charging start times for some vehicles in the management method. However, the service capacity—meaning the ability to meet the energy demand for charging—remains unchanged; the total energy supplied, represented by the area under the red curve, is equal to that under the green curve and totals 325 kWh.
The previous evaluations were conducted under the assumption that the exit time of the vehicles was known. When there is uncertainty about the parking duration, we can implement a round-robin charging approach, where the charging alternates between the two vehicles at regular intervals.
The results of simulations carried out with charging powers of 3 kW, 2.5 kW, and 2 kW, with time intervals of 30 min for the charging alternation, are presented below. We will compare the findings from this round-robin charging method with those from Approach (b).
Table 5 summarizes the results, with the first column identifying the virtual CP pairs, the second column listing the identifiers of the vehicles being charged, and the remaining six columns showing the energy not supplied relative to the total charging needs for both charging methods at various maximum power levels.
Tests conducted using Approach (b) charging consistently yield the best results due to the prior knowledge of the end-of-stay time. For 3 kW CP, the results are also excellent for round-robin charging; in fact, there is only one instance in which not all requested energy is supplied, with the shortfall being less than 1% of the total request and 17% for the specific vehicle involved.
As the maximum charging power decreases, the percentage of unsupplied energy for Approach (b) rises to 4.5% for 2.5 kW and 17.1% for 2 kW. The round-robin charging method results in an additional decrease of about 2% in both cases, with 6.2% and 19.4% of unsupplied energy, respectively.
Round-robin charging exhibits slightly lower performance levels compared to Approach (b). However, when examining the share of energy not delivered to each vehicle, it becomes evident that round-robin charging distributes the shortfall more evenly between the two vehicles in the same charging pair. In contrast, Approach (b) tends to penalize only one of the two vehicles. The details of the charging time sequence for the case with 14 3-kW CPs are illustrated in Figure 22, with Approach (b) shown in the left panel and round-robin charging in the right panel.
In Figure 22, the vehicle’s idle periods are highlighted in yellow. Each of the other 14 colors represents the specific CP when it is active on a vehicle. Despite the different charge strategies, the delivered energy profiles are nearly identical, as illustrated by the red curve in Figure 23, which shows consecutive recharge on the left and round-robin recharge on the right.

3.2.2. Limited Number of CPs

Previous analyses considered a number of CPs equal to or greater than the number of charging requests. If the number of CPs is limited, the operating framework changes, since a waiting queue can be generated at the CPs. As a case study, let us consider the case of five available 3-kW CPs. Figure 24 shows the number of daily vehicles parked (blue area) and those charging (hatched area) in the case of five CPs; between 8.00 and 18.00, all the CPs are occupied while before and after they are partially free.
The energy required to charge the 28 parked vehicles is 325.3 kWh. However, only 64% of this demand can be met with five CPs of 3 kW each.
A sensitivity analysis was conducted regarding the number of CPs and the maximum charging power. The results of this analysis, presented in Table 6, indicate that when using a power level of 3 kW, at least nine CPs are needed to meet the total energy requirements. However, if the available power is increased to 7 kW, only three CPs are necessary. At a power level of 22 kW, a single CP is sufficient to supply the energy required for the parked fleet.
The results presented in Table 6 relate to the hypothesis that there is no delay in accessing charging points (CPs) for two consecutive charging requests. Queue management is organized by accounting for the expected parking end time, and prioritizing access to CPs for vehicles scheduled to leave the parking lot first.
A more realistic scenario considers a non-zero delay between two consecutive charges. In this case, a single 22-kW charging point (CP) would not adequately meet the demand. Therefore, we considered a scenario with two 22-kW CPs. A time interval of 20 min was assumed between two successive recharges. The maximum power available is 44 kW, which occurs when both CPs are active (see Figure 25). All requests were satisfied, as shown in the graph in Figure 26, and all vehicles completed their charging before leaving.
Not all vehicles currently on the market can accept 22 kW AC charging power; many EVs only support single-phase 7 kW charging. To meet the needs of these vehicles, we implemented the same algorithm for 7 kW CPs. Five 7 kW CPs are needed to meet the overall charging demand when considering a 20-min delay for the disconnection and connection of operations between vehicles. The delivered power curve is illustrated in Figure 27. For comparison, the green line reproduces the power curve for 28 3 kW CPs, where charging starts according to the order of vehicle arrivals. The access time sequence for the parked vehicles to charge is shown in Figure 28 with each color representing one of the five CPs. The maximum power delivered at the station varied between 21 kW, 28 kW, and 35 kW, depending on the number of active CPs.

4. Discussion

The study analyzes a group of 38 workers who use private vehicles to commute to their workplace, aiming to identify travel behaviors and charging needs. The research addresses various aspects of electric vehicle (EV) charging management, including energy demand estimation, charging infrastructure design, and charging strategies.
The investigation revealed that the number of vehicles present in the parking lot rarely exceeded 70% of the entire fleet. Assuming these vehicles are electric, they require an average of 8.87 kWh per vehicle per day. Requests for more than 15 kWh are relatively modest, representing just over 10% of the total.
This study has analyzed two different scenarios; in the first scenario, an “unlimited” number of CPs are available for charging needs, while in the second one, the number of CPs at the parking lot is less than the average number of daily charge requests.
When the number of available CPs exceeds the recharge requests, an uncontrolled charging approach can lead to a peak power demand of nearly 70 kW with 3 kW chargers and 100 kW with 6 kW chargers. The peak charging demand typically occurs around 9:30 AM, and even during this peak time, the maximum number of active chargers is lower than the total number of parked vehicles. Introducing delays between a vehicle’s arrival and the start of charging can slightly shift the peak power demand but does not reduce its magnitude.
We assessed various straightforward charging management strategies to effectively address power peaks. The most basic approach is to reduce the power output of all active chargers by half. While this method lowers peak demand, it also lengthens charging times and might result in some vehicles not being fully charged. Another strategy involves pairing chargers and alternating their activation. This method is more effective at reducing peak demand than simple power reduction, but it necessitates knowledge of vehicle parking durations for optimal scheduling. Round-robin charging offers a simpler method for managing alternating charges, relying on less information about parking durations. However, it is generally less efficient than differentiated power supply in terms of energy delivered.
In scenarios with unlimited charging point capacity, both differentiated power supply and round-robin charging effectively manage charging loads when the arrival time is unknown and parking duration information is limited.
When the number of charging points is limited, a waiting queue can form, significantly impacting the charging process. The quantity of CPs and their charging power are both critical for meeting overall charging demands. It is important to consider the delays between charging sessions when calculating the necessary number of CPs. To optimize charging efficiency, implementing queue management strategies, such as prioritizing vehicles with shorter parking durations, is essential.
Regarding charging needs, it was found that a single 22 kW charging point (CP) can adequately meet the daily demands of 22 vehicles, provided that the charging order is optimized based on parking patterns. However, optimal management of the charging sequence requires users to take turns moving their vehicles throughout the day with no delay between two consecutive charges.
An alternative, simpler solution would be to equip the parking lot with a number of CPs equal to half the maximum number of vehicles expected. Each CP should have two sockets, with only one active at a time. This setup allows all vehicles to be connected, either charging or on standby. Two vehicles can be connected simultaneously to the same CP, with their charging alternating every 30 min, thus eliminating the need to know the precise duration of each vehicle’s parking.
For this solution, 14 CPs with double connections would be necessary to effectively manage the fleet of vehicles. The redundancy of sockets ensures that vehicles can remain parked for the entire duration of their stay without needing to be moved.
The study emphasizes the importance of implementing strategies to manage peak charging demand, as it can significantly affect grid stability and infrastructure costs. It is essential to accurately size the charging capacity based on actual vehicle usage patterns and parking durations. This approach helps avoid unnecessary infrastructure expenses while reducing the risk of failing to meet user demand.
The study effectively incorporates real-world data derived from insurance applications, which lends a practical and authentic context to the analysis of electric vehicle (EV) charging scenarios. This grounding in real data enhances the relevance and applicability of its findings. The analysis includes an examination of vehicle parking behaviors, energy consumption patterns, and specific charging requirements, providing valuable insight for policymakers, and offering data-driven guidance for future developments in EV charging infrastructure.
On the other hand, the study is rooted in a specific case study, which inherently limits the generalizability of its findings. As a result, the conclusions drawn may not necessarily apply to other regions or different sizes of EV fleets, potentially restricting its broader applicability. Moreover, some of the assumptions made within the study, such as the universal availability of charging infrastructure and the presence of flawless vehicle-to-grid communication, may not reflect the realities encountered in various situations. These idealized scenarios could skew the practical applicability of the recommendations. For any realistic application, a comprehensive economic analysis of the different charging strategies, including the costs and benefits of each approach, should be included.
Further research is needed to address existing limitations and explore more advanced charging strategies that can optimize both energy consumption and user experience. An interesting area of research not covered in the present work concerns user behavior and their willingness to manage centralized or decentralized charging [45,46], as well as the management of user-perceived needs as a function of socio-economic characteristics [47,48]. These factors are crucial for the successful implementation of a charge management system.
Since the parking lot is equipped with a system of shelters that structurally support a photovoltaic field with a power of 300 kWp, a natural development is the integration of renewable energy sources into EV-charging infrastructure. The research should concentrate on the technological and logistical challenges associated with optimizing the use of clean energy for EV charging. This focus aims to contribute to a more sustainable transportation ecosystem.
By addressing the identified limitations and pursuing the proposed research directions, we can contribute to accelerating the transition to a more efficient, sustainable, and user-centric electric transportation system.

Author Contributions

Conceptualization, G.G. and A.G.; methodology, N.A., G.G., and A.G.; software, G.G.; validation, N.A., G.G., and A.G.; formal analysis, N.A. and A.G.; investigation, G.G.; resources, G.G.; data curation, G.G.; writing—original draft preparation, N.A., G.G., and A.G.; writing—review and editing, N.A. and A.G.; visualization, N.A.; supervision, A.G.; project administration, A.G.; funding acquisition, A.G. All authors have read and agreed to the published version of the manuscript.

Funding

This research was financed by the Lombardy Region with POR FESR 2014/2020 funds, Call HUB Open Innovation, grant no. 1180965.

Data Availability Statement

The datasets presented in this article are not readily available due to NDA commitments.

Conflicts of Interest

The authors declare no conflicts of interest.

References

  1. Electric Vehicle Battery Prices Are Expected to Fall Almost 50% by 2026, Goldman Sachs, October 7, 2024. Available online: https://www.goldmansachs.com/insights/articles/electric-vehicle-battery-prices-are-expected-to-fall-almost-50-percent-by-2025 (accessed on 11 November 2024).
  2. Shah, R.; Mittal, V.; Precilla, A.M. Challenges and Advancements in All-Solid-State Battery Technology for Electric Vehicles. J 2024, 7, 204–217. [Google Scholar] [CrossRef]
  3. IEA; Sanguesa, J.A.; Torres-Sanz, V.; Garrido, P.; Martinez, F.J.; Marquez-Barja, J.M. A Review on Electric Vehicles: Technologies and Challenges. Smart Cities 2021, 4, 372–404. [Google Scholar] [CrossRef]
  4. Rainieri, G.; Buizza, C.; Ghilardi, A. The psychological, human factors and socio-technical contribution: A systematic review towards range anxiety of battery electric vehicles’ drivers. Transp. Res. Part F: Traffic Psychol. Behav. 2023, 99, 52–70. [Google Scholar] [CrossRef]
  5. Brey, B.d.; Gardien, L.; Hiep, E. Smart Charging Needs, Wants and Demands, Charging Experiences and Opinions of EV Drivers. World Electr. Veh. J. 2021, 12, 168. [Google Scholar] [CrossRef]
  6. Amann, G.; Escobedo Bermúdez, V.R.; Boskov-Kovacs, E.; Gallego Amores, S.; Giannelos, S.; Iliceto, A.; Ilo, A.; Chavarro, J.R.; Samovich, N.; Schmitt, L.; et al. E-Mobility Deployment and Impact on Grids: Impact of EV and Charging Infrastructure on European T&D Grids: Innovation Needs; Gallego Amores, S., Ed.; Publications Office of the European Union: Luxembourg, 2022; MJ-09-22-246-EN-N. [Google Scholar] [CrossRef]
  7. Hildermeier, J.; Kolokathis, C.; Rosenow, J.; Hogan, M.; Wiese, C.; Jahn, A. Smart EV Charging: A Global Review of Promising Practices. World Electr. Veh. J. 2019, 10, 80. [Google Scholar] [CrossRef]
  8. Rahman, I.; Vasant, P.M.; Singh, B.S.M.; Abdullah-Al-Wadud, M.; Adnan, N. Review of recent trends in optimization techniques for plug-in hybrid, and electric vehicle charging infrastructures. Renew. Sustain. Energy Rev. 2016, 58, 039–1047. [Google Scholar] [CrossRef]
  9. Ayoade, I.A.; Longe, O.M. A Comprehensive Review on Smart Electromobility Charging Infrastructure. World Electr. Veh. J. 2024, 15, 286. [Google Scholar] [CrossRef]
  10. Zahler, J.; Vollmuth, P.; Ostermann, A. Unlocking the Potential: An In-Depth Analysis of Factors Shaping the Success of Smart and Bidirectional Charging in a Cross-Country Comparison. Energies 2024, 17, 3637. [Google Scholar] [CrossRef]
  11. Amin, A.; Tareen, W.U.K.; Usman, M.; Ali, H.; Bari, I.; Horan, B.; Mekhilef, S.; Asif, M.; Ahmed, S.; Mahmood, A. A Review of Optimal Charging Strategy for Electric Vehicles under Dynamic Pricing Schemes in the Distribution Charging Network. Sustainability 2020, 12, 10160. [Google Scholar] [CrossRef]
  12. Aghajan-Eshkevari, S.; Azad, S.; Nazari-Heris, M.; Ameli, M.T.; Asadi, S. Charging and Discharging of Electric Vehicles in Power Systems: An Updated and Detailed Review of Methods, Control Structures, Objectives, and Optimization Methodologies. Sustainability 2022, 14, 2137. [Google Scholar] [CrossRef]
  13. Rauf, M.; Kumar, L.; Zulkifli, S.A.; Jamil, A. Aspects of artificial intelligence in future electric vehicle technology for sustainable environmental impact. Environ. Chall. 2024, 14, 100854. [Google Scholar] [CrossRef]
  14. Irfan, M.; Deilami, S.; Huang, S.; Veettil, B.P. Rooftop Solar and Electric Vehicle Integration for Smart, Sustainable Homes: A Comprehensive Review. Energies 2023, 16, 7248. [Google Scholar] [CrossRef]
  15. Muqeet, H.A.; Liaqat, R.; Jamil, M.; Khan, A.A. A State-of-the-Art Review of Smart Energy Systems and Their Management in a Smart Grid Environment. Energies 2023, 16, 472. [Google Scholar] [CrossRef]
  16. Ramsebner, J.; Hiesl, A.; Haas, R.; Auer, H.; Ajanovic, A.; Mayrhofer, G.; Reinhardt, A.; Wimmer, A.; Ferchhumer, E.; Mitterndorfer, B.; et al. Smart charging infrastructure for battery electric vehicles in multi apartment buildings. Smart Energy 2023, 9, 100093. [Google Scholar] [CrossRef]
  17. Bjørndal, E.; Bjørndal, M.; Bøe, E.K.; Dalton, J.; Guajardo, M. Smart home charging of electric vehicles using a digital platform. Smart Energy 2023, 12, 100118. [Google Scholar] [CrossRef]
  18. Li, A.; Chen, Y.; Xiang, X.; Xu, C.; Wan, M.; Huo, Y.; Geng, G. Orderly Charging Control of Electric Vehicles: A Smart Meter-Based Approach. World Electr. Veh. J. 2024, 15, 449. [Google Scholar] [CrossRef]
  19. Makeen, P.; Memon, S.; Elkasrawy, M.A.; Abdullatif, S.O.; Ghali, H.A. Smart green charging scheme of centralized electric vehicle stations. Int. J. Green Energy 2021, 19, 490–498. [Google Scholar] [CrossRef]
  20. Vaidya, B.; Mouftah, H.T. Smart electric vehicle charging management for smart cities. IET Smart Cities 2020, 2, 4–13. [Google Scholar] [CrossRef]
  21. Gowri, V.; Sivraj, P. A Centralized Management System Software Framework to aid in EV Charging. In Proceedings of the 2021 International Conference on Recent Trends on Electronics, Information, Communication & Technology (RTEICT), Bangalore, India, 27–28 August 2021; pp. 703–707. [Google Scholar] [CrossRef]
  22. Aygun, I.; Kamalasadan, S. Centralized Charging Approach to Manage Electric Vehicle Fleets For Balanced Grid. In Proceedings of the 2022 IEEE International Conference on Power Electronics, Smart Grid, and Renewable Energy (PESGRE), Trivandrum, India, 2–5 January 2022; pp. 1–6. [Google Scholar] [CrossRef]
  23. Dahiwale, P.V.; Rather, Z.H. Centralized Multi-objective Framework for Smart EV Charging in Distribution System. In Proceedings of the 2023 IEEE PES Conference on Innovative Smart Grid Technologies—Middle East (ISGT Middle East), Abu Dhabi, United Arab Emirates, 12–15 March 2023; pp. 1–5. [Google Scholar] [CrossRef]
  24. Yi, Z.; Scoffield, D.; Smart, J.; Meintz, A.; Jun, M.; Mohanpurkar, M.; Medam, A. A highly efficient control framework for centralized residential charging coordination of large electric vehicle populations. Int. J. Electr. Power Energy Syst. 2020, 117, 105661. [Google Scholar] [CrossRef]
  25. Fernandez, V.; Pérez, V. Optimization of Electric Vehicle Charging Control in a Demand-Side Management Context: A Model Predictive Control Approach. Appl. Sci. 2024, 14, 8736. [Google Scholar] [CrossRef]
  26. Korkas, C.D.; Tsaknakis, C.D.; Kapoutsis, A.C.; Kosmatopoulos, E. Distributed and Multi-Agent Reinforcement Learning Framework for Optimal Electric Vehicle Charging Scheduling. Energies 2024, 17, 3694. [Google Scholar] [CrossRef]
  27. Aoun, A.; Adda, M.; Ilinca, A.; Ghandour, M.; Ibrahim, H. Dynamic Charging Optimization Algorithm for Electric Vehicles to Mitigate Grid Power Peaks. World Electr. Veh. J. 2024, 15, 324. [Google Scholar] [CrossRef]
  28. Alyami, S. Ensuring Sustainable Grid Stability through Effective EV Charging Management: A Time and Energy-Based Approach. Sustainability 2024, 16, 6149. [Google Scholar] [CrossRef]
  29. Shern, S.J.; Sarker, M.T.; Ramasamy, G.; Thiagarajah, S.P.; Al Farid, F.; Suganthi, S.T. Artificial Intelligence-Based Electric Vehicle Smart Charging System in Malaysia. World Electr. Veh. J. 2024, 15, 440. [Google Scholar] [CrossRef]
  30. Singh, P.; Kumar, Y.; Sawle, Y.; Alotaibi, M.A.; Malik, H.; Márquez, F.P.G. Development of artificial Intelligence-Based adaptive vehicle to grid and grid to vehicle controller for electric vehicle charging station. Ain Shams Eng. J. 2024, 15, 102937. [Google Scholar] [CrossRef]
  31. Bose, P.; Sivraj, P. Smart Charging Infrastructure for Electric Vehicles in a Charging Station. In Proceedings of the 2020 4th International Conference on Intelligent Computing and Control Systems (ICICCS), Madurai, India, 13–15 May 2020; pp. 186–192. [Google Scholar] [CrossRef]
  32. Stojkovic, J. Multi-Objective Optimal Charging Control of Electric Vehicles in PV charging station. In Proceedings of the 2019 16th International Conference on the European Energy Market (EEM), Ljubljana, Slovenia, 18–20 September 2019; pp. 1–5. [Google Scholar] [CrossRef]
  33. Santos, J.B.; Francisco, A.M.B.; Cabrita, C.; Monteiro, J.; Pacheco, A.; Cardoso, P.J.S. Development and Implementation of a Smart Charging System for Electric Vehicles Based on the ISO 15118 Standard. Energies 2024, 17, 3045. [Google Scholar] [CrossRef]
  34. Maia, G.L., Jr.; Santos, C.C.L.; Nunes, P.R.M.; Castro, J.F.C.; Marques, D.C.; Medeiros, L.H.A.D.; Limongi, L.R.; Brito, M.E.C.; Dantas, N.K.L.; Filho, A.V.M.L.; et al. EV Smart-Charging Strategy for Power Management in Distribution Grid with High Penetration of Distributed Generation. Energies 2024, 17, 5394. [Google Scholar] [CrossRef]
  35. Meteab, W.K.; Alsultani, S.A.H.; Jurado, F. Energy Management of Microgrids with a Smart Charging Strategy for Electric Vehicles Using an Improved RUN Optimizer. Energies 2023, 16, 6038. [Google Scholar] [CrossRef]
  36. Fathy, A. Bald eagle search optimizer-based energy management strategy for microgrid with renewable sources and electric vehicles. Appl. Energy 2023, 334, 120688. [Google Scholar] [CrossRef]
  37. Chakraborty, A.; Ray, S. Multi-objective energy management using a smart charging technique of a microgrid with the charging impact of plug-in hybrid electric vehicles. Sustain. Cities Soc. 2024, 117, 105923. [Google Scholar] [CrossRef]
  38. Muniandi, B.; Wan, S.; El-Yabroudi, M. Bi-Directional Charging with V2L Integration for Optimal Energy Management in Electric Vehicles. Electronics 2024, 13, 4221. [Google Scholar] [CrossRef]
  39. Al-Obaidi, H. Khani, H.E.Z. Farag, M. Mohamed, Bidirectional smart charging of electric vehicles considering user preferences, peer to peer energy trade, and provision of grid ancillary services. Int. J. Electr. Power Energy Syst. 2021, 124, 106353. [Google Scholar] [CrossRef]
  40. Chen, H.; Hu, Z.; Luo, H.; Qin, J.; Rajagopal, R.; Zhang, H. Design and Planning of a Multiple-Charger Multiple-Port Charging System for PEV Charging Station. IEEE Trans. Smart Grid 2019, 10, 173–183. [Google Scholar] [CrossRef]
  41. Zhang, H.; Hu, Z.; Xu, Z.; Song, Y. Optimal Planning of PEV Charging Station With Single Output Multiple Cables Charging Spots. IEEE Trans. Smart Grid 2017, 8, 2119–2128. [Google Scholar] [CrossRef]
  42. Morais, H. New approach for electric vehicles charging management in parking lots considering fairness rules. Electr. Power Syst. Res. 2023, 217, 109107. [Google Scholar] [CrossRef]
  43. Andrenacci, N.; Ragona, R.; Valenti, G. A demand-side approach to the optimal deployment of electric vehicle charging stations in metropolitan areas. Appl. Energy 2016, 182, 39–46. [Google Scholar] [CrossRef]
  44. “L’Unrae Presenta il Quadro del Settore Automotive nel 2023”, (Online), 2023. (In Italian). Available online: https://www.sistan.it/index.php?id=88&no_cache=1&tx_ttnews%5Btt_news%5D=11356 (accessed on 30 November 2024).
  45. Will, A. Schuller, Understanding user acceptance factors of electric vehicle smart charging. Transp. Res. Part C: Emerg. Technol. 2016, 71, 198–214. [Google Scholar] [CrossRef]
  46. Gupta, V.; Kumar, R.; Panigrahi, B.K. User-Willingness-Based Decentralized EV Charging Management in Multiaggregator Scheduling. IEEE Trans. Ind. Appl. 2020, 56, 5704–5715. [Google Scholar] [CrossRef]
  47. Alsabbagh, A.; Wu, B.; Ma, C. Distributed Electric Vehicles Charging Management Considering Time Anxiety and Customer Behaviors. IEEE Trans. Ind. Inform. 2021, 17, 2422–2431. [Google Scholar] [CrossRef]
  48. Lee, J.H.; Chakraborty, D.; Hardman, S.J.; Tal, G. Exploring electric vehicle charging patterns: Mixed usage of charging infrastructure. Transp. Res. Part D Transp. Environ. 2020, 79, 102249. [Google Scholar] [CrossRef]
Figure 1. Casaccia Research Center: (a) location map and (b) aerial view of the parking lot. Solar panels on the rooftops of the parking lot are visible in the lower right corner.
Energies 18 00421 g001
Figure 2. Master–slave type multi-point charging system. The digital bus transmits information while the power bus supplies power to the charging points (CPs).
Energies 18 00421 g002
Figure 3. Current deliverable as a function of the PWM signal D (blue line) and maximum power deliverable in single-phase and three-phase.
Energies 18 00421 g003
Figure 4. Example of pilot signal with working states.
Energies 18 00421 g004
Figure 5. Scattered plot of the stop events. Each point represents a stop identified by the arrival time (on the x-axis) and its duration (on the y-axis).
Energies 18 00421 g005
Figure 6. Spatial distribution of the residences of the selected vehicles. Blue dot: Casaccia site. Green line: GRA.
Energies 18 00421 g006
Figure 7. Histogram of home–work distances.
Energies 18 00421 g007
Figure 8. Arrival and parking durations of the 23 vehicles accessing the parking lot on February 4th.
Energies 18 00421 g008
Figure 9. Temporal distribution of the vehicles in the parking lot on 4–11 February.
Energies 18 00421 g009
Figure 10. Annual frequency distribution of the number of vehicles present in the parking lot daily.
Energies 18 00421 g010
Figure 11. Distribution of energy required daily by vehicles during stops for one year.
Energies 18 00421 g011
Figure 12. Number of parked vehicles (yellow) and total energy required (blue).
Energies 18 00421 g012
Figure 13. Total hours of parking (yellow line) and total energy required (blue line).
Energies 18 00421 g013
Figure 14. Average daily values of parking hours (yellow line) and energy required (blue line) per vehicle.
Energies 18 00421 g014
Figure 15. Total power output with 3 kW (left) and 6 kW (right) CPs. The three curves refer to immediate charges (green), with a medium delay (blue), and with a maximum delay (red).
Energies 18 00421 g015
Figure 16. Definition of residual parking time.
Energies 18 00421 g016
Figure 17. Total charge power request using 3 kW (top panel) and 6 kW (bottom panel) CPs.
Energies 18 00421 g017
Figure 18. Power supply control scheme at the CP.
Energies 18 00421 g018
Figure 19. Flowchart of the delayed recharge strategy.
Energies 18 00421 g019
Figure 20. Flexibility strategies comparison: power reduction (upper panel); differentiated power supply (lower panel).
Energies 18 00421 g020
Figure 21. Power load with differentiated power supply; mode a (top panel, red line); mode b (bottom panel, red line). The green curve represents charging all vehicles at 3 kW, with FIFO logic and no delay.
Energies 18 00421 g021
Figure 22. Timeline of the charge events for Approach (b) (left) and round-robin charging (right). Yellow bars represent the parking duration; colored bars indicate that the vehicle is charging (each bar color refers to a CP).
Energies 18 00421 g022
Figure 23. Delivered energy profile for Approach (b) (left) and round-robin charging (right). The red curve is the delivered energy profile for the controlled charge strategy, while the green line represents the uncontrolled case, for 3-kW CPs.
Energies 18 00421 g023
Figure 24. Number of vehicles simultaneously present at the parking lot (green line) and CPs occupation (hatched area) for a scenario of 5 3-kW CPs available.
Energies 18 00421 g024
Figure 25. Comparison of power required for charging with two CPs of 22 kW with queue management logic based on the duration of stops (red line), and twenty-eight CPs of 3 kW with sequential access (green line).
Energies 18 00421 g025
Figure 26. Timeline of stop and charging events with two CPs at 22 kW, on April 22nd. Each color refers to a single CP.
Energies 18 00421 g026
Figure 27. Comparison of power delivered for charging with five CPs of 7 kW with queue management logic based on stops and with a 20-min delay for connection–disconnection (red line) and 28 CPs of 3 kW with sequential access (green line).
Energies 18 00421 g027
Figure 28. Timeline of stop and charging events with five CPs at 7 kW, and a 20 min delay between two consecutive charges on April 22nd. Each color represents a single CP.
Energies 18 00421 g028
Table 1. Review articles’ focus.
ReferenceReview Focus
[5]Analysis of a survey on the experiences and opinions of EV drivers about smart charging.
[6]Position paper on technical and connectivity solutions for electric vehicle (EV) charging and regulations.
[7]Qualitative review of policies for smart EV grid integration.
[8]Review on optimization problems and computational strategies for EV charging.
[9]Review on smart charging protocols and their impact on power distribution systems.
[10]Comparison of smart charging use cases in different countries to provide guidance for transnational product development.
[11]Review on optimal charging and scheduling strategies under dynamic pricing strategies.
[12]Review of control structures at charging stations and optimization methods for charge and discharge management.
[13]Review on charging technologies and applications of AI in the development of EVs.
[14]Review on grid-connected rooftop solar PV smart homes integrated with EVs and energy management systems in Australia.
[15]Review on smart grid enabling technologies, prominent features, and challenges.
Table 2. Areas of interest of the research articles. A check mark indicates if renewable energy sources and vehicle to grid integration are considered in the study.
ReferenceRESV2GCharging LocationCentralized/ DecentralizedMain Outcome
[16] ResidentialCentralizedSmart charge management lessens the impact of EVs on the distribution grid, especially during long parking times in residential areas.
[17] ResidentialCentralizedComparison of economic and energy performance between users of smart charging and conventional charging.
[18] ResidentialHybridA significant reduction in peak charging demand is validated through a numerical case study.
[19] Charging stationsCentralizedComparison of different optimization approaches for queueing and user demand management
[20] Charging stationsCentralizedSmart EV charging management system with centralized CS reservation.
[21] Charging stationsCentralizedSoftware implementation of a centralized management system to achieve flexible charging.
[22] FleetCentrilizedCentralized and scalable charging management algorithm, considering both the network side and the user comfort.
[23] Charging stationsCentralizedCharging control strategy through electricity price pricing to minimize the impact on the electricity distribution network.
[24] ResidentialCentralizedA receding horizon charging coordination framework to manage a large number of charge requests.
[25] Charging stationsCentralizedDemand-side management system to to meet both grid requirements and user needs.
[26] Charging stationsDecentralizedSingle-charger optimization approach to cost minimization and user satisfaction.
[27] ResidentialCentralizedAlgorithm managing the charging of connected EV by assigning each a priority index.
[28] ResidentialCentralizedCharge requests are prioritized based on available charging time and energy required.
[29] Charging stations CentralizedIntegration of artificial intelligence (AI) into Malaysian smart electric vehicle charging systems.
[30]MicrogridCentralizedArtificial-Neural-Network-based power management control system.
[31]Charging stationDecentralizedFuzzy logic controller at the EV charging station based on power requirements, energy price, and solar energy.
[32] Charging stationDecentralizedMulti-objective optimization to minimize charging station operational and power losses.
[33] Charging stationDecentralizedDevelopment of a charge emulation system using the ISO 15118 communication protocol.
[34] Charging stationCentralizedImplementation of the dynamic current-limiting algorithm using the IEC 61850 protocol.
[35] MicrogridCentralizedRunge Kutta optimizer for the energy management of MGs, with reduction of the operating cost.
[36] MicrogridCentralizedBald-eagle optimization method to minimize total operating cost and mitigate environmental pollutant emission.
[37] MicrogridCentralizedSlime Mould Algorithm to operating cost and emissions; weighted sum, fuzzy decision maker, and Slime Mould for multi-objective optimization of MG and PEV.
[38]MicrogridDecentralizedCoordination system between EVs, charging stations, and grid, using smart meters and communication networks.
[39] Charging stationDecentralizedAlgorithm for bidirectional smart charging considering user preferences, Peer-to-Peer energy trade, and grid ancillary services.
[40] Parking lotCentralizedTwo-stage stochastic programming model to coordinate the charging of multi-port chargers with minimization of investment and operating costs.
[41] Charging stationCentralizedTwo-stage stochastic programming model is developed for planning a public parking lot charging station equipped with single output multiple cables charging spots.
[42] Residential parking lotCentralizedMixed-integer linear programming optimization to improve fairness in the charging process considering different types of charging contracts.
Table 3. Maximum power that can be drawn from the grid based on the distribution voltages/currents.
I (A)1P (V)3P (V)1P (kW)3P (kW)
6220–240 1.3–1.4
10220–240 2.2–2.4
16220–240 3.5–3.810.5–11
32220–240380–4007–7.621–22
64220–240380–40014–15.342–44
Table 4. Annual frequency distribution and cumulative distribution of parking events for the set of vehicles.
Days/YearNo. of VehiclesCumulative Frequency [%]
0–2000.0
20–4037.9
40–60418.4
60–80428.9
80–100542.1
100–120350.0
120–140152.6
140–160565.8
160–180578.9
180–200489.5
200–2204100.0
Table 5. Comparison of energy delivered using Approach (b) charging and round-robin charging.
Max Charging Power3 kW2.5 kW2 kW
CP IDEV IDEnergy Required.
[kWh]
Approach (b)Round-RobinApproach (b)Round-RobinApproach (b)Round-Robin
0015.62.14.8
1411.22.30.27.22.4
1110.92.7
1516.62.61.17.6
2216.82.31.6
169.70.7
3315.61.54.3
1711.12.91.47.73.3
447.0
1816.01.22.35.6
557.0
1917.33.43.4
6617.43.05.41.07.8
2011.63.67.60.9
7711.72.1
219.23.51.4
886.0
2211.1
9910.21.9
2316.83.63.68.36.4
10109.3
2412.63.73.7
11114.8
2515.52.32.34.95.2
121210.8
265.7
13134.3
2713.44.7
TOTAL325.20314.720.355.763.1
Table 6. Overall delivered energy and percentage of energy demand satisfied as a function of the available CPs number and power level.
3 kW7 kW11 kW22 kW
N° CBkWh Deliv.% Req.kWh Deliv.% Req.kWh Deliv.% Req.kWh Deliv.% Req.
154161253819760393121
21043224375383118
314043327101
417554
520864
623973
727083
830092
9328101
Disclaimer/Publisher’s Note: The statements, opinions and data contained in all publications are solely those of the individual author(s) and contributor(s) and not of MDPI and/or the editor(s). MDPI and/or the editor(s) disclaim responsibility for any injury to people or property resulting from any ideas, methods, instructions or products referred to in the content.

