Article

Mapping Solar–Wind Complementarity with BARRA

by
Abhnil Prasad
* and
Merlinde Kay
*
School of Photovoltaic and Renewable Energy Engineering, University of New South Wales, Sydney, NSW 2052, Australia
*
Authors to whom correspondence should be addressed.
Energies 2025, 18(20), 5452; https://doi.org/10.3390/en18205452
Submission received: 31 August 2025 / Revised: 3 October 2025 / Accepted: 11 October 2025 / Published: 16 October 2025

Abstract

Australia’s renewable energy transition will be dominated by solar and wind power, yet their contrasting variability necessitates hybrid integration with storage to ensure reliability. This study uses Australian reanalysis data, BARRA (Bureau of Meteorology Atmospheric High-Resolution Regional Reanalysis for Australia), to quantify solar (global horizontal irradiance, GHI) and wind (wind power density, WPD) resources by examining their availability, variability, synergy, episode length, and lulls. The novelty of this work is the use of rarely examined metrics such as variability, availability, episode length, and extended lull events (Dunkelflaute) with a high-resolution and 29-year duration reanalysis dataset. The results show that solar is the more reliable resource, with high daytime availability and relatively short lulls. Wind, despite being abundant in coastal regions, is highly intermittent, characterized by a skewed distribution, low availability, and extended periods of lulls. Synergy metrics demonstrate significant complementarity, with combined solar–wind synergy reducing deficits in single resources, while joint non-synergy events define critical system vulnerabilities. Importantly, hybrid systems limit maximum joint lulls, which are far shorter than wind-only extremes, thereby reducing the scale of long-duration storage required. These findings underscore that, while solar provides a stable baseline supply and wind contributes spatial diversity, hybrid systems supported by batteries offer a resilient pathway. Synergy and non-synergy statistics provide essential parameters for optimally sizing storage to withstand rare but severe shortfalls, ensuring a reliable, utility-scale renewable future for Australia.

1. Introduction

The growing awareness of the benefits of complementary renewable resources is increasing globally [1,2,3,4,5,6]. The leading contenders for hybrid renewable systems are solar and wind. These two resources naturally complement each other, as solar energy often dominates during periods of clear, calm conditions, whereas wind is the dominant source during cloudy and more unstable weather conditions. Renewable generation increased by 15% globally last year, with solar and wind accounting for approximately 66% of that added capacity [7]. These two renewable resources are not limited to onshore areas; with the development of floating PV and the increasing uptake of offshore wind, the number of areas for the development of hybrid systems is expanding.
As greater amounts of wind and solar energy enter the market, challenges arise in ensuring the continuity of supply within the grid. This is primarily due to the inherent variability of the weather, which can lead to market volatility. Extreme weather events, such as heatwaves, bushfires, droughts, and intense cold snaps, can put tremendous pressure on the electricity grid. A recent example of such volatility within the grid was the winter blackouts in Texas [8], where demand greatly surpassed supply, and supply was cut to millions of customers. This type of situation requires a reconsideration of how infrastructure and resources can be utilized to prevent similar outcomes in the future. One way to increase energy resilience is to invest in hybrid renewable energy systems. The complementary nature of PV and wind can be used to offset any variability from a single resource and enhance system reliability [2,3,4,5,6,9].
Numerous methods have been employed to assess the complementary or synergistic nature of renewable resources [6,10]. More recently, Chen [11] presented a comprehensive global assessment of land-based solar–wind complementarity using high-resolution ERA5-Land reanalysis data from 1950 to 2021. Several other studies have also explored the topic at regional levels [5,12,13,14,15,16]. The overall definition of both appears quite consistent in the literature. For a complementary resource, one resource complements the other when the other is not available. The complementary aspect also falls into two categories: spatial and temporal [3]. The statistical metrics used to assess complementarity, however, differ in the literature. The most widely used are the Pearson correlation coefficient [5,14,17,18,19,20], Kendell [21,22], and Spearman [23,24].
Synergy is when both are performing at the same time [5,14,17,18,19,20,21,22,23,24]. Assessing the complementary nature or synergy of these resources spatially requires using reanalysis data such as MERRA-2 (Modern Era Retrospective Reanalysis for Research Applications or ERA5 (ECMWF Reanalysis version 5), and additionally for solar, satellite-derived irradiance. Many researchers have conducted single-resource [25,26,27,28,29,30] and hybrid-resource assessments in various parts of the globe [1,2,3,4,5,6,9,31,32,33]. These data sources, although helpful in assessing resources across continents, are at a coarser spatial resolution. When assessing hybrid resources, topographic effects, such as hills and valleys, as well as surface terrain characteristics are particularly important. Errors in reanalysis products lead to an overprediction of irradiance under cloudy conditions and an underprediction in clear skies [29]. Often these differences are attributed to cloud properties and aerosols not being well represented in the models [34]. With wind, errors frequently occur due to mismatches in model elevation or topography [35].
There are limited high-resolution re-analysis datasets on a global scale; however, many regional high-resolution datasets have become available [34,36,37,38]. The Irish Meteorological Service has developed a 2.5 km horizontal grid reanalysis product over Ireland called MÉRA [39]. A study investigating which reanalysis dataset is better for renewable energy applications over Ireland compared ERA5, MERRA2, and MÉRA, and it found that none of the reanalyses consistently outperformed the others across all weather parameters investigated. The shortcoming in MÉRA for shortwave radiation was attributed to the lack of assimilating satellite data [34]. The driving reanalysis dataset also contributed to the accuracy of the higher-resolution models. The Copernicus Climate Change Service has developed a high-resolution deterministic product, the Copernicus European Regional Reanalysis (CERRA), which covers all of Europe at a 5.5-km resolution [37]. They found that CERRA outperformed ERA5 for regions with complex terrain and most surface weather parameters in smaller regional areas. Over North America, a 40-year high-resolution hydroclimate reanalysis called CONUS404 was developed by NCAR, dynamically downscaling ERA5 with the Weather Research and Forecasting Model (WRF) to a spatial resolution of 4 km [40]. At this stage, it has not been used for renewable resource assessment. Australia’s Bureau of Meteorology (BoM) has developed a new reanalysis product, BARRA (Bureau of Meteorology Atmospheric High-Resolution Regional Reanalysis for Australia) [1,38], which holds great promise for renewable resource assessment.
With the increasing global adoption of renewables, the need for a spatial and temporal dataset tailored specifically for renewable energy siting purposes becomes more apparent. Many of the higher-resolution reanalysis products have not been fully utilised for renewable assessment in Australia. It is therefore essential to assess their viability in this role, alongside understanding the potential for them to serve as a tool for understanding the resilience of hybrid generation systems. This study is one of the first to assess the performance of BARRA over Australia for solar and wind systems (both onshore and offshore) to understand which regions have a complementary or synergistic relationship. A novel contribution of this work lies in its 29-year evaluation of solar–wind complementarity, incorporating rarely examined metrics such as variability, availability, episode length, and extended lull events (Dunkelflaute). These metrics help planners understand which locations are optimal for co-locating solar and wind energy as well as identify opportunities for integrating battery storage into such systems, particularly during periods of lulls.
The layout of this paper is as follows: Section 2 describes the reanalysis product and various metrics used to assess aspects of the co-location of solar and wind. Section 3 presents the results for all metrics across Australia, including offshore. Section 4 discusses the results in the context of previous work, and Section 5 concludes the key results of the paper.

2. Materials and Methods

2.1. Reanalysis Data

This study utilized the Bureau of Meteorology Atmospheric High-Resolution Regional Reanalysis for Australia (BARRA) product, available at the National Computational Infrastructure (NCI). Its core product, BARRA-R, provides data at a 12 km horizontal resolution and is built using version 10.2 of the UK Met Office’s Unified Model (UM). This atmospheric model employs a non-hydrostatic, fully compressible deep-atmosphere framework, characterized by a semi-implicit, semi-Lagrangian dynamical core that conserves mass and accurately solves the equations of motion. Vertically, BARRA-R is configured with 70 levels extending up to 80 km above sea level, with 50 levels concentrated below 18 km to capture tropospheric processes in detail [38].
The reanalysis is initialized using ERA-Interim data, which also provides the lateral boundary conditions interpolated hourly from ERA-Interim’s 6-hourly global fields at 0.75° resolution. BARRA-R assimilates a wide range of observational data, including measurements from surface stations, ships, drifting buoys, aircraft, radiosondes, wind profilers, and satellites. Satellite observations include retrieved wind vectors, radiances, and GPS radio occultation bending angles. Before assimilation, all observations undergo rigorous quality control to eliminate duplicates, remove low-quality data, and minimize redundancy, following established procedures.
In evaluations spanning 2003–2016, BARRA-R has demonstrated improved accuracy compared to global reanalysis, such as ERA-Interim and MERRA-2, particularly in representing near-surface variables, including 2 m temperature, 10 m wind speed, and surface pressure. It also provides more accurate estimates of temperature extremes and captures the frequency of heavy rainfall events with greater fidelity, especially at finer spatial scales (5–25 km) [38,41,42]. Likewise, evaluations with moist surface variables at sites in Northern Australia also demonstrated BARRA-R to be reliable and in good agreement with observations [43]. Recently, BARRA-R was found to be one of the best-performing reanalysis products for wind power generation [44,45]. Although not explicitly evaluated for solar irradiation, its consistency in reproducing surface variables under extreme conditions renders additional validation unnecessary [43,46].
Therefore, hourly BARRA-R data from January 1990 to February 2019 were assessed for their weather resources with the potential for renewable energy generation in Australia. This study avoided the conversion of weather resources to power, allowing regions to be easily compared without limiting the study to a single PV technology and a restrictive wind power curve. The spatial extent of BARRA-R and the region of interest for the weather resource assessment are shown in Figure 1.

2.1.1. Solar Resource

The solar resource was derived using the total downward shortwave radiative flux at the ground or ocean surface (av_swsfcdown) computed as the mean of all the radiative timestamp computations within the hour. Note: this variable directly aligns with the Global Horizontal Irradiance (GHI) used in solar resource assessments.

2.1.2. Wind Resource

The wind data was available at hourly averages for 10 m above ground level in zonal (av_uwnd10m) and meridional (av_vwnd10m) components. The components were converted into average hourly wind speeds using the Pythagoras approach. The wind speed data at 10 m (V10) were converted to wind resource data at 80 m (WPD80m), compatible with hub height for typical turbines available in Australia, using the classical wind power relationship with a shear component of α = 1/7 [47]. Thus, the Wind Power Density (WPD) was calculated using air density at sea-level (ρ = 1.225 kg/m3):
W P D 80 m = 1 2 ρ V 10 m 3 8 3 α
The shear component and air density exhibited spatial and temporal variability, which affects the computation of WPD [48]. Nonetheless, this simplification was necessary for consistency with other studies [49,50].

2.2. Analysis Approach

Key statistics from BARRA solar and wind resources were first calculated and later analyzed to determine the variability, reliability, and intermittency of the resources, followed by determining their synergy characteristics using metrics proposed by Prasad, Taylor, and Kay [5].

2.2.1. Central Tendency Measures

The central tendency measures were computed for the solar and wind resources ( R ) using the mean ( R ¯ ) and median ( R ~ ) values of the calculated resources. For a sequence of ordered resource power density R 1   ,   R 2   ,   R T } in time T (hourly resolution from January 1990 to February 2019), the calculations are as follows:
R ¯ = 1 T t = 1 T R t
R ~ = R T + 1 2     , i f   T   i s   o d d 1 2 R T 2 + R T 2 + 1 , i f   T   i s   e v e n                    

2.2.2. Variability

The variability in calculated resources was expressed using the relative coefficient of variation (RCoV) and the inter-quartile range (IQR):
R C o V = R t R ~ R ~ ~
I Q R = R 0.75 T + 1 R 0.25 T + 1

2.2.3. Reliability

The reliability of solar and wind resources was calculated as the availability ( A v ) of usable power defined as the frequency of occurrence of resource power density based on thresholds ( R T H ):
A v = 1 T t = 1 T 1 R t R T H × 100 %
For comparison to solar resources, the daytime availability ( D A v ) was also computed by filtering out nighttime data for GHI < 0 W/m2. Here, the thresholds for solar and wind resources were adopted as 170 W/m2 ( R T H S o l a r ) and 240 W/m2 ( R T H W i n d ), respectively, using earlier formulations by Prasad, Taylor, and Kay [5].

2.2.4. Intermittency

The intermittency in computed resource density was calculated using episode lengths and lulls based on the thresholds used for reliability calculations. The episode length depicts the persistence of reliability, whereas the lulls measure the persistence of unreliability. The binary resource availability indicator can be computed as the following:
A t = 1 , i f   R t R T H 0 ,   o t h e r w i s e      
Thus, an episode length ( E L ) is the maximum continuous interval t s , t e T :
t t s , t e , A t = 1   a n d   A t s 1 = 0 ,   A t e + 1 = 0
Then, the set of all episodes ( E L ) was defined as the following:
E L = t s i , t e i T t t s i , t e i ,   A t = 1 A t s i 1 = 0 ,   A t e i + 1 = 0
Hence, the length of an episode ( i ) will be given as this equation:
E L i = t e i t s i + 1
Likewise, the lulls ( L u l l s ) are the maximum continuous interval t s , t e T for the following:
t t s , t e , A t = 0   a n d   A t s 1 = 1 ,   A t e + 1 = 1
Then, the set of all lull periods ( L u l l s ) was defined with this equation:
L u l l s = t s i , t e i T t t s i , t e i ,   A t = 0 A t s i 1 = 0 ,   A t e i + 1 = 1
Hence, the length of lulls ( i ) will be given as
L u l l s i = t e i t s i + 1
The maximum episode lengths or lulls ( m a x ) were also derived using
m a x = max i { 1 , , } i  
Likewise, the mean, median, and IQR for episode lengths and lulls for the resources were also computed using similar formulations from Equations (2), (3) and (5), respectively.

2.2.5. Synergy Metrics

The synergy between solar and wind resources is determined by calculating the total number of reliable hours of power production at each grid point across Australia compared to the overall hours examined in the data [5]. The key metrics for the synergy of solar and wind resources were computed as follows [9]:
C W = 1 T t = 1 T 1 R t W i n d R T H W i n d R t S o l a r > R T H S o l a r × 100 %
The SCW scenario illustrates how solar resources can enhance the performance of wind resources. Specifically, it demonstrates how a solar farm can effectively support a non-generating wind farm connected to the same grid.
W C S = 1 T t = 1 T 1 R t W i n d > R T H W i n d R t S o l a r R T H S o l a r × 100 %
The WCS scenario illustrates how wind resources can enhance the performance of solar resources. Specifically, it demonstrates how a wind farm can effectively support a non-generating solar farm connected to the same grid.
W S S = 1 T t = 1 T 1 R t W i n d > R T H W i n d R t S o l a r > R T H S o l a r × 100 %
The WSS scenario illustrates the synergy between wind and solar energy. It demonstrates how a wind farm and a solar farm can complement each other when connected to the same power grid.
N W S S = 1 T t = 1 T 1 R t W i n d R T H W i n d R t S o l a r R T H S o l a r × 100 %
The NWSS scenario illustrates the negative synergy between wind and solar energy. It demonstrates how a wind farm and a solar farm fail to complement each other when connected to the same power grid, resulting in neither source producing usable power. Note that there may be a scenario where both the solar farm and wind farm simultaneously produce usable power, but they may not be in synergy and have been excluded from this study. All scenarios’ intermittency metrics were also computed using the formulations shown in Section 2.2.4 to understand the bankability of hybrid solar–wind farms across Australia.

3. Results

3.1. Central Tendency Measures

The mean and median of solar (GHI) and wind (WPD) resources are shown in Figure 2.
The mean and median values of GHI exhibited comparable regional characteristics. Higher GHI values, exceeding 480 W m−2, were observed in central and northwestern Australia, whereas lower values, below 240 W m−2, were prevalent in the southern regions, particularly in Tasmania. Over ocean areas, GHI values were generally lower than over adjacent land regions, reflecting higher cloud cover and atmospheric attenuation over marine environments. Similarly, the mean and median values of Wind Power Density (WPD) demonstrated analogous spatial patterns, albeit with significant differences in magnitude. The mean WPD was recorded at its highest in southwestern Australia, exceeding 480 W m−2, and at its lowest in the eastern interior, where it dropped below 180 W m−2. Conversely, the median WPD was markedly diminished in both regions, with values exceeding 250 W m−2 in the southwest and less than 50 W m−2 in the eastern region. Over oceans, WPD tended to remain elevated in both the mean and median, suggesting more persistent wind regimes compared to land areas due to the lack of orography. The underlying probability distributions influenced these discrepancies between the mean and median values. GHI typically adhered to a Gaussian distribution, resulting in a closer alignment between the mean and median, while WPD followed a positively skewed Weibull distribution, leading to greater deviations between these two metrics.

3.2. Variability

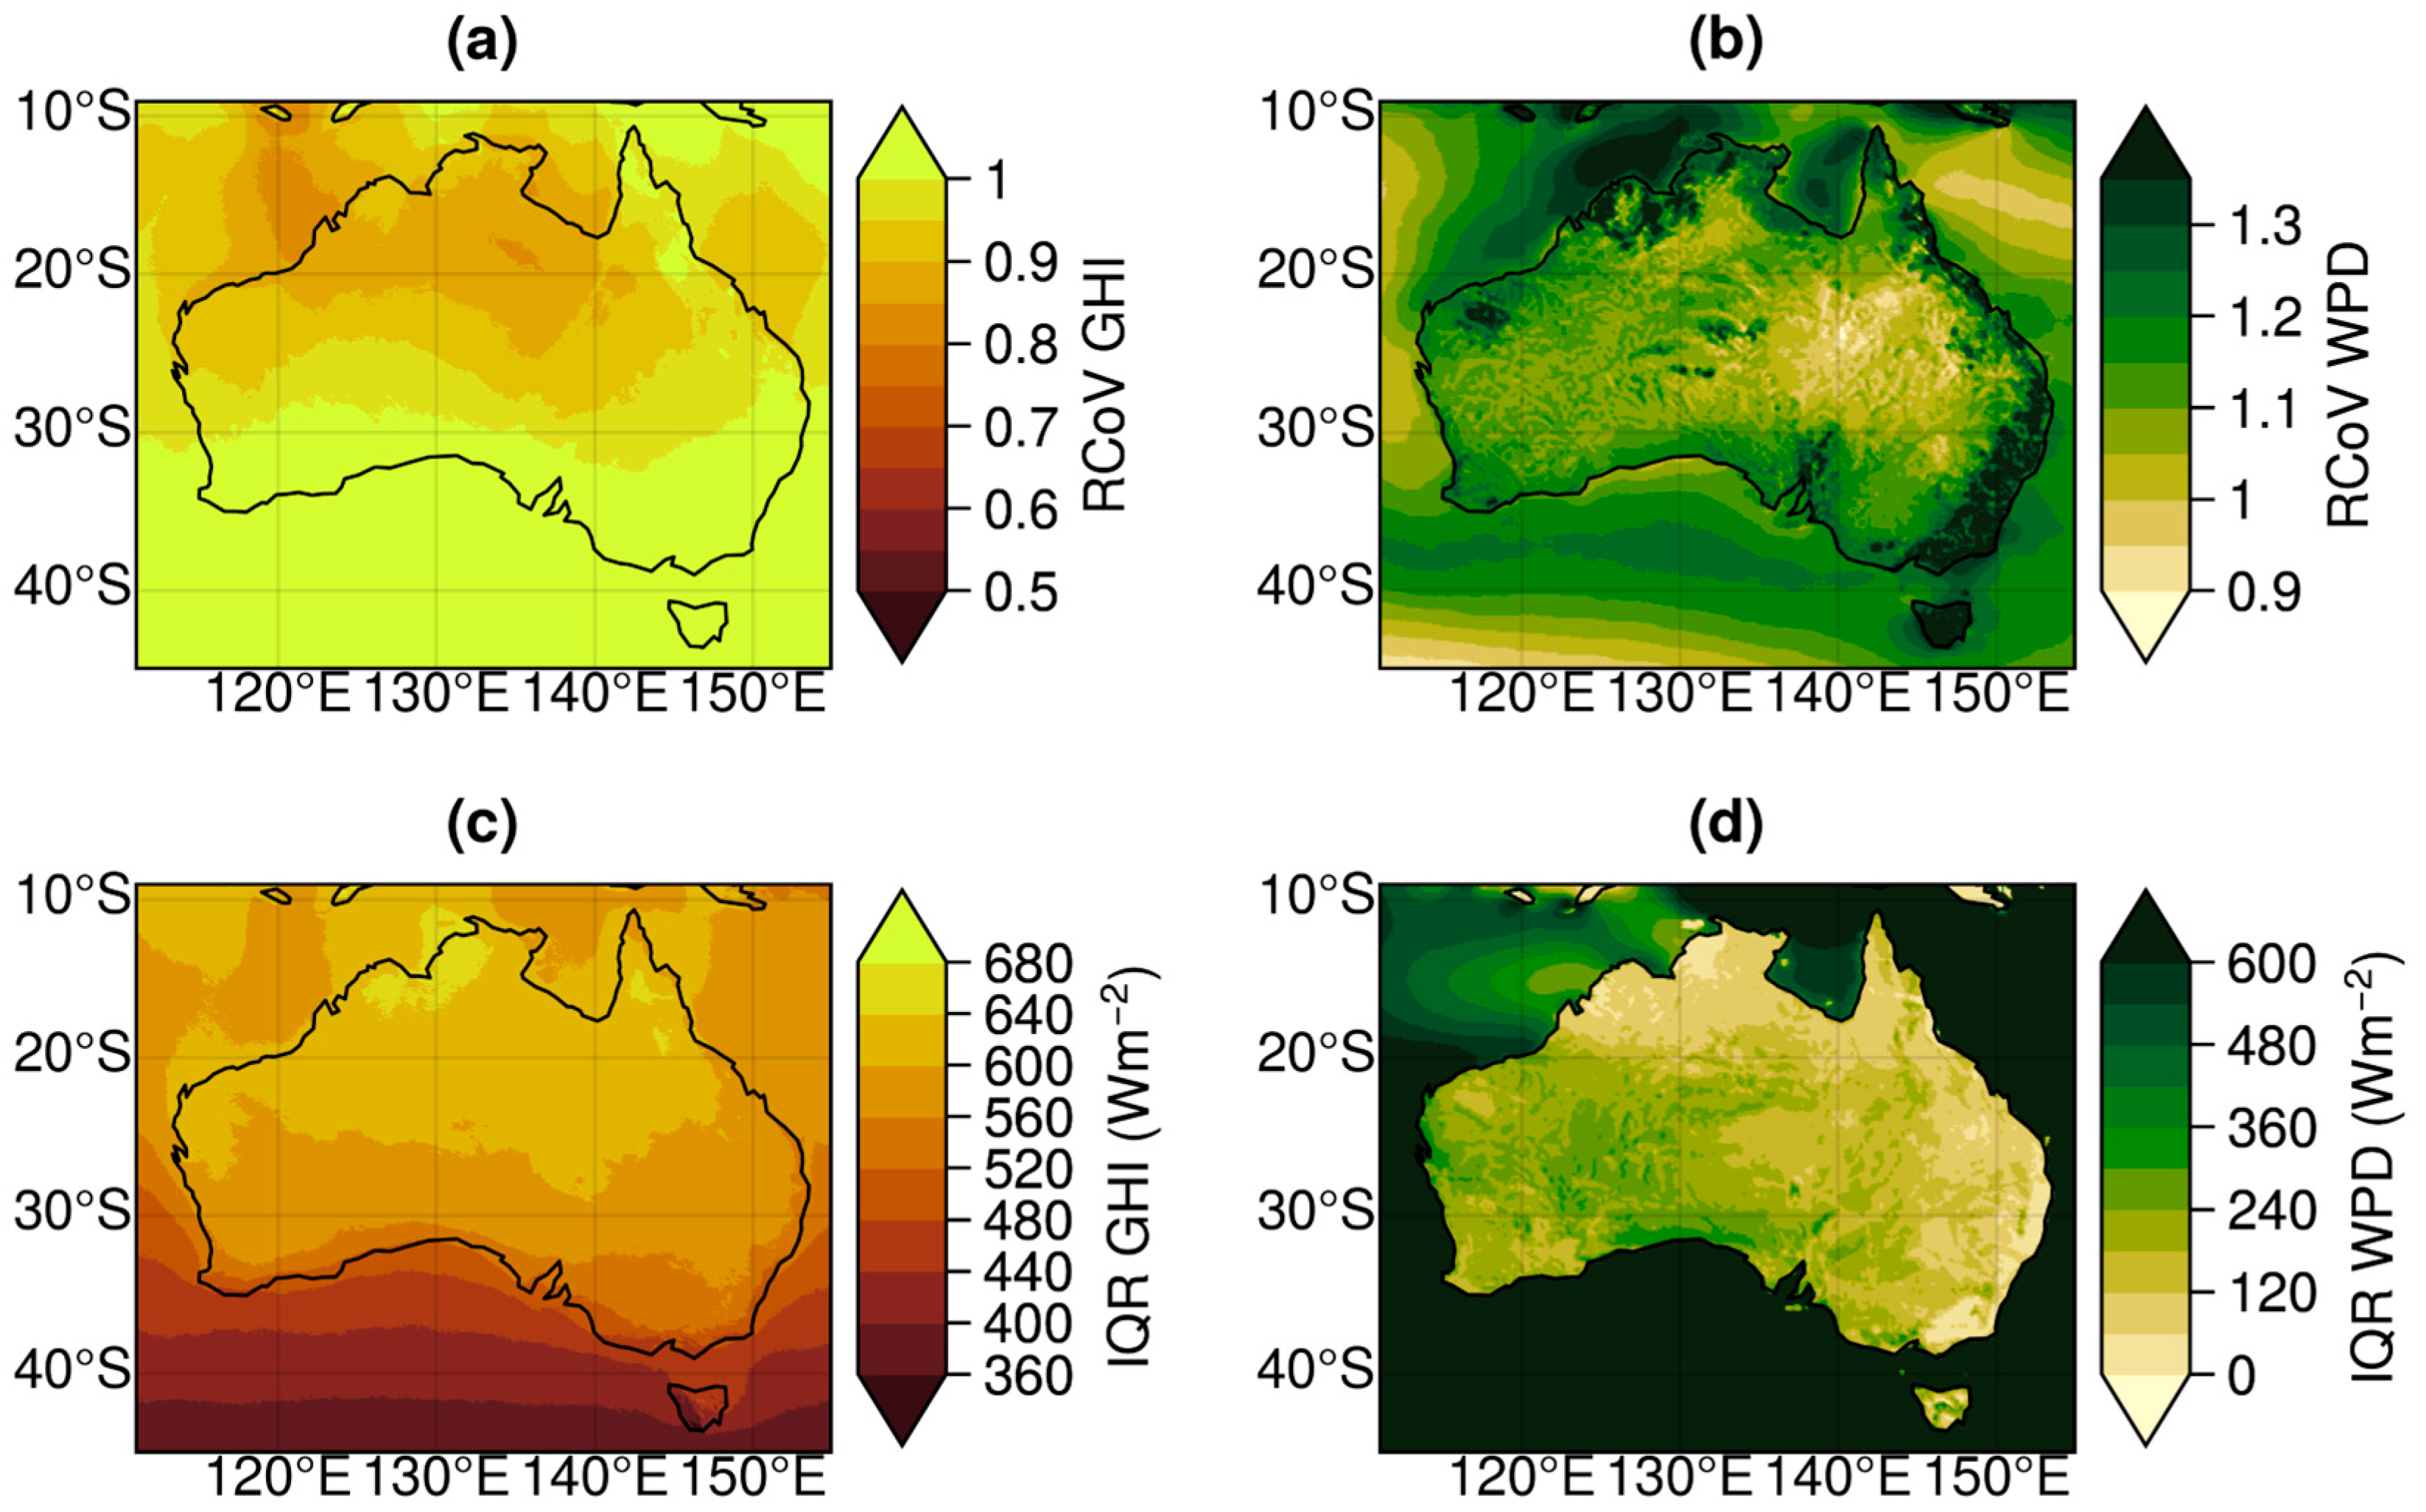
The variability of solar (GHI) and wind (WPD) resources, as computed by RCoV and IQR, is shown in Figure 3.
Both the RCoV and IQR distributions illustrate the spatial variability characteristics of solar (GHI) and wind (WPD) resources across Australia. The RCoV of GHI was relatively uniform, with values predominantly exceeding 0.6 across most of the continent, indicating modest variability in solar irradiance throughout the year. However, slightly elevated RCoV values (≥0.9) were observed in the southern regions, particularly Tasmania, suggesting an increase in seasonal variability in solar resources due to heightened cloud variability in this area. In contrast, the RCoV of WPD displayed significantly higher values (>1.3) in coastal and elevated regions, especially in southeastern Australia, reflecting substantial temporal fluctuations in wind energy availability. Conversely, inland and northern areas exhibited lower RCoV values (<1.0), indicating reduced variability. Notably, oceanic regions exhibited more uniform and lower RCoV values compared to land areas, suggesting steadier marine wind circulation patterns. The IQR distributions shown in Figure 3c,d further reinforce these patterns. The IQR of GHI showed higher absolute variability (>600 W m−2) in northern Australia, where total irradiance was also high, and lower values (<400 W m−2) in the southern regions. Over the ocean, the IQR of GHI was moderately low, consistent with the earlier observed mean values. For WPD, the IQR highlighted elevated variability (>480 W m−2) along southern and coastal regions, including offshore areas, confirming that wind resources exhibit both high magnitude and strong temporal fluctuations in these zones.

3.3. Reliability

The reliability of solar (GHI) and wind (WPD) resources, as computed by availability metrics, is shown in Figure 4.
Both total and daytime availability metrics provide insights into the reliability of solar and wind resources for energy generation across Australia. For GHI, both total and daytime availability revealed similar spatial patterns, with reliability improving toward the north and interior. Total AV GHI ranged from >39% in northern and central Australia to <27% in the southern regions, especially Tasmania, indicating lower year-round reliability due to seasonal cloud cover. Daytime AV GHI presented substantially higher percentages, with values exceeding 75% in northern areas and remaining above 51% even in the south. Unsurprisingly, during daylight hours, solar irradiance consistently exceeded the operational threshold across much of the continent, making it a highly reliable resource, especially in inland areas. For WPD, reliability exhibited greater spatial variability, as shown in Figure 4c,d. Total AV WPD was highest (>60–80%) along the southern and western coastal fringes and over adjacent oceans, but dropped below 20% across the eastern and interior regions. Daytime AV WPD revealed a similar spatial structure, with peak values remaining over marine areas and southern coastal zones, but lower reliability persisting inland. The strong contrast between land and ocean reliability reflects the influence of coastal wind systems and synoptic patterns that dominate Australia’s wind climate. GHI demonstrated broadly high and consistent reliability, especially during daylight hours, with only modest reductions in southern latitudes. In contrast, WPD reliability was highly region-specific, favoring southern coastal and marine zones while remaining limited inland. These patterns illustrate the complementary nature of solar and wind resources in Australia, underscoring the importance of geographic diversification in designing hybrid solar–wind energy systems.

3.4. Intermittency

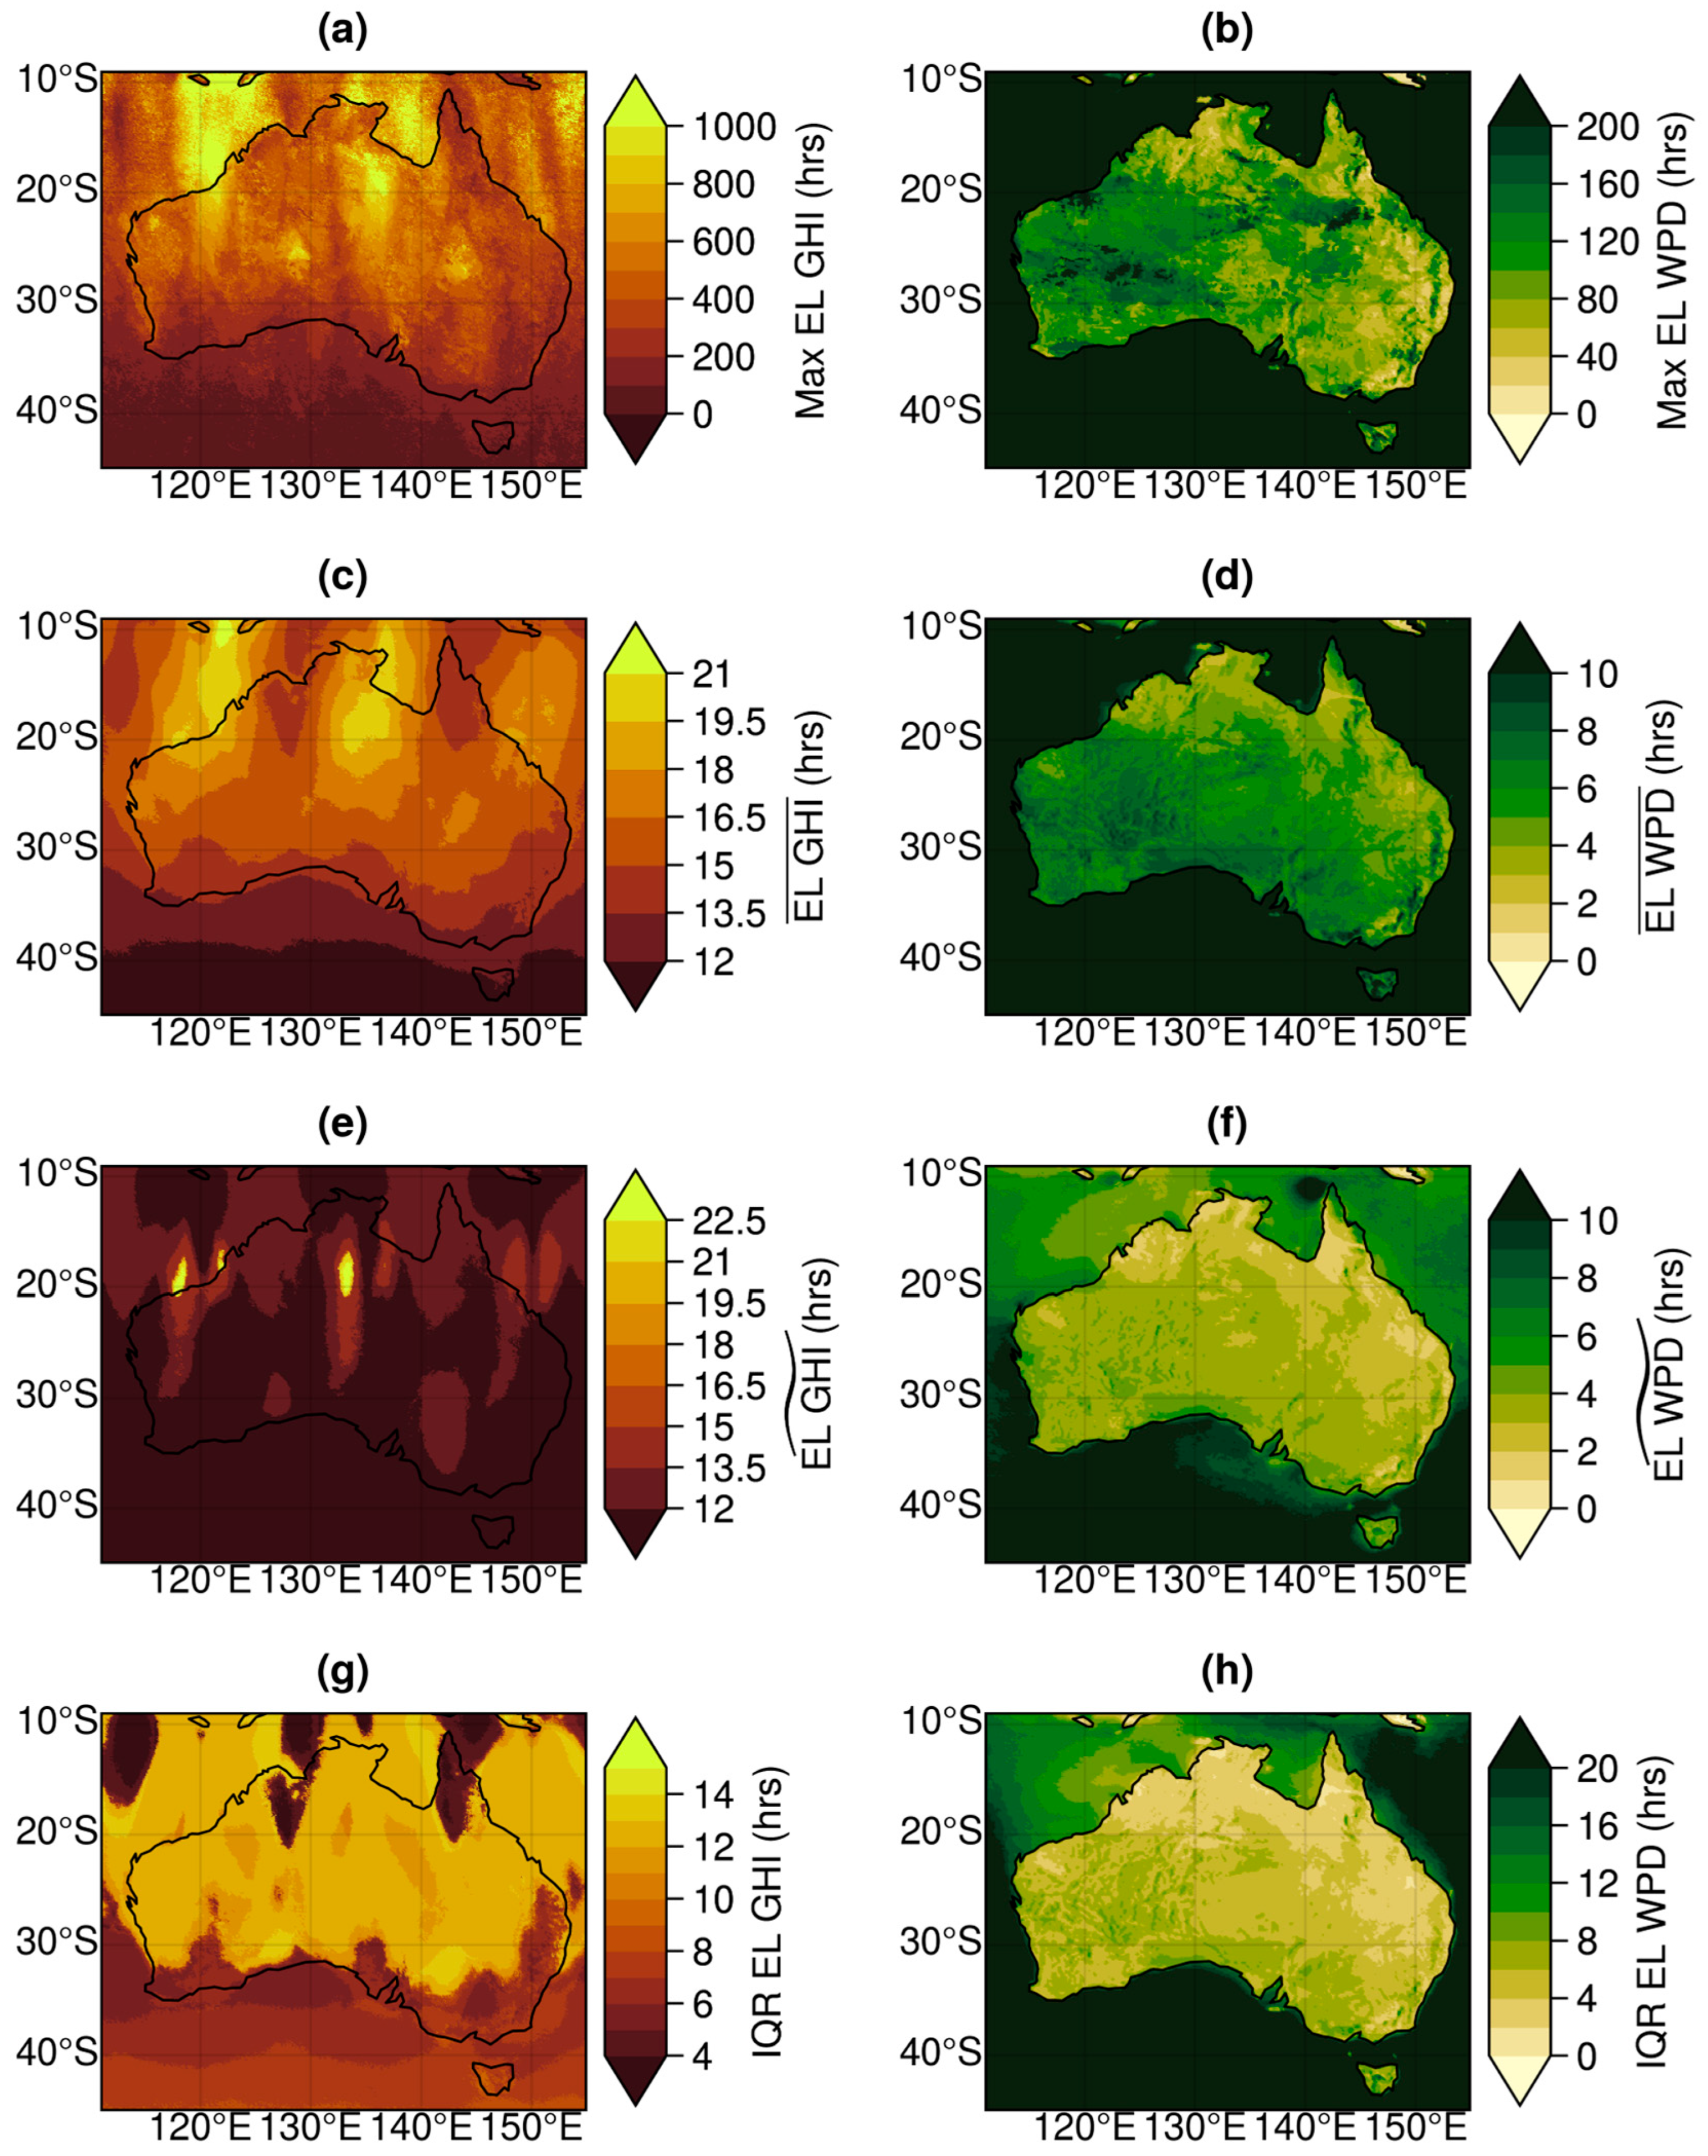
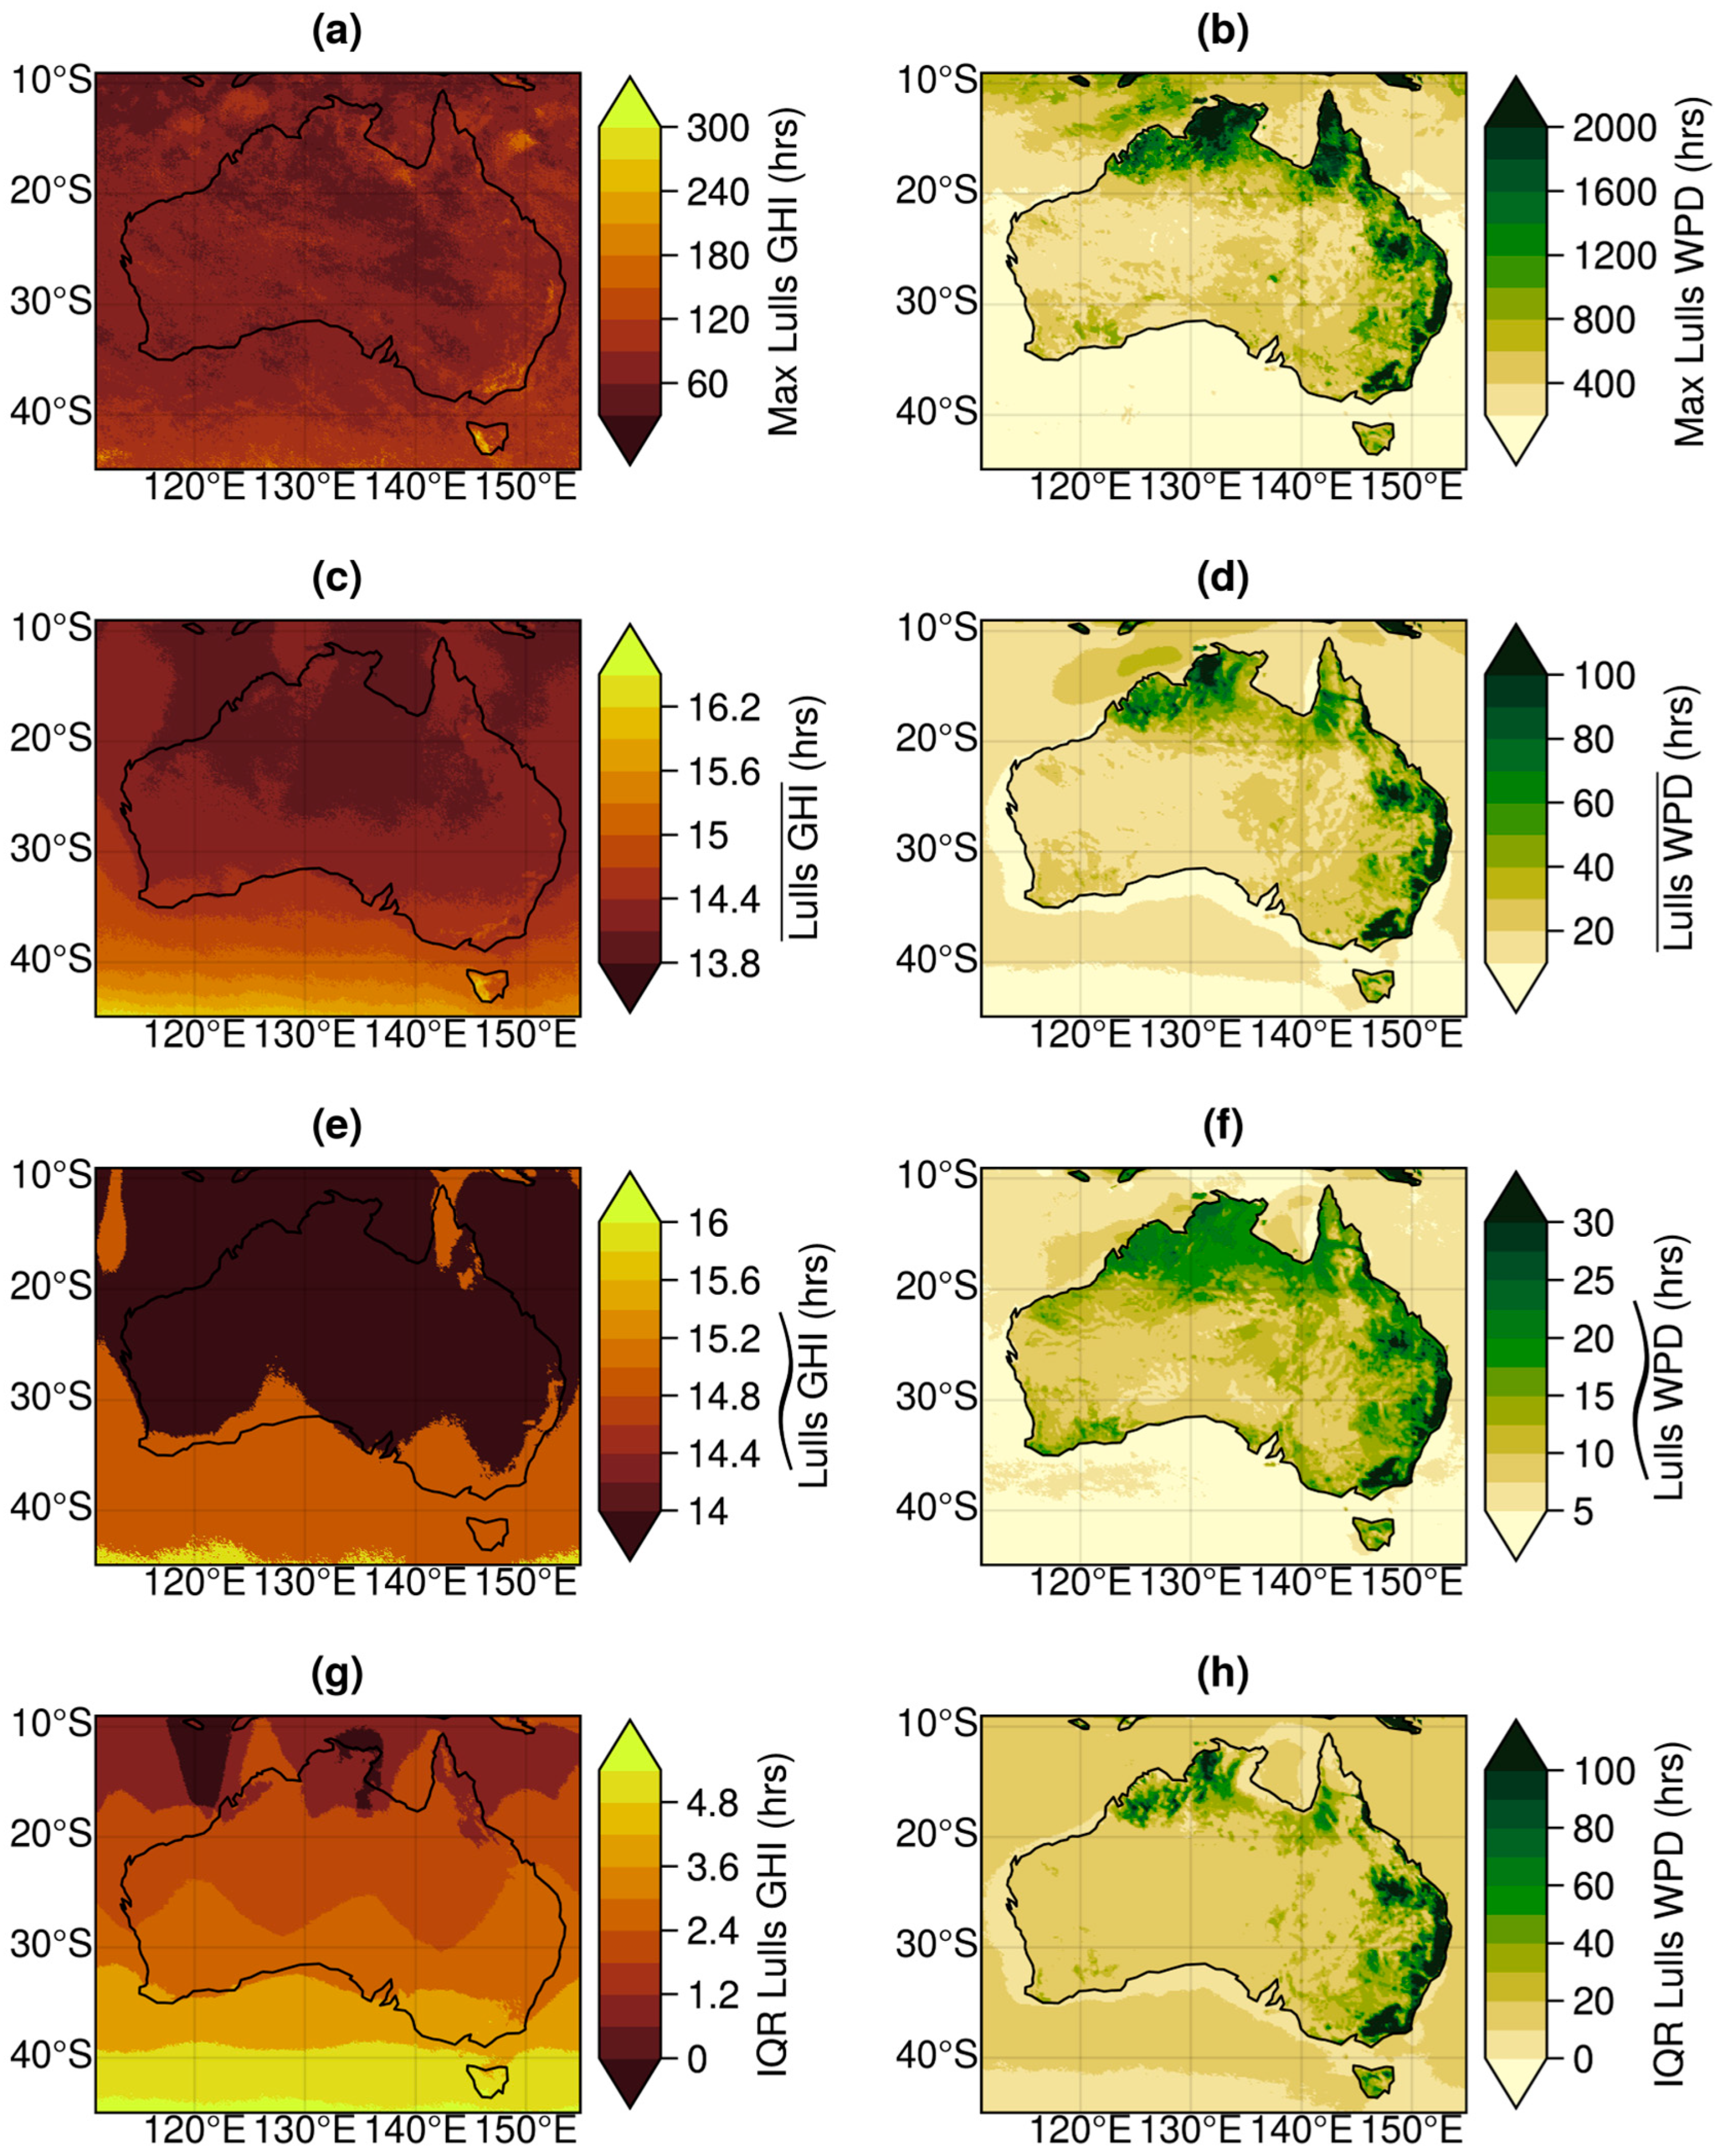
The intermittency of solar (GHI) and wind (WPD) resources can be characterized by episode lengths and lulls, as illustrated with the key statistics in Figure 5 and Figure 6. The maximum, mean, median, and IQR episode lengths for GHI and WPD are shown in Figure 5a,b, Figure 5c,d, Figure 5e,f, and Figure 5g,h, respectively.
The episode lengths offer valuable insights into the persistence and intermittency of solar and wind resources across Australia. For GHI, the maximum EL exceeded 800 h in many parts of central and northern Australia, indicating long and persistent high-irradiance periods, particularly in arid inland regions. Mean EL values exhibited a similar spatial gradient, ranging from ~12 h in southern areas to more than 21 h in the north, reflecting longer durations of sustained solar irradiance. The median EL also highlights the frequency of extreme-length solar episodes, with durations exceeding 21 h observed in localized high-sunshine regions in the northwest and central interior. The IQR of EL values was highest in the northern and central regions (>12 h), indicating greater variation in episode durations, but still suggesting a strong base of persistent solar availability. In contrast, WPD episode lengths were generally shorter and more variable. Maximum EL exhibited a fragmented pattern, with values of up to 200 h primarily observed in southern coastal and inland regions. Mean EL WPD was lower overall, generally ranging between 4 and 8 h, indicating shorter periods of continuous usable wind. The median EL confirms this variability, with few regions exceeding 10 h, and much of inland Australia below that threshold. The IQR of EL reinforces this result, showing a higher spread (>16 h) in coastal and oceanic zones and lower variability inland. These episode length metrics emphasize that solar energy offers longer and more predictable episode durations, especially in central and northern Australia, whereas wind energy episodes are more intermittent and shorter, particularly in inland areas.
Similarly, the maximum, mean, median, and IQR of lulls for GHI and WPD are shown in Figure 6a,b, Figure 6c,d, Figure 6e,f, and Figure 6g,h, respectively. Lulls provide critical insight into the intermittency and risk of prolonged low-resource conditions for solar and wind energy across Australia. For GHI, lull periods were generally short and consistent. The maximum lull duration was under 300 h across most of the continent, with the shortest lulls in northern Australia and longer durations in the south, particularly Tasmania. Mean lull duration ranged from ~13.8 to 16.2 h, with longer lulls in southern regions due to greater cloud cover and shorter daylight periods. The median lull duration showed similar spatial structure, indicating that extreme low-solar episodes were relatively constrained across most of Australia. The IQR was low throughout the continent (<5 h), suggesting high temporal consistency and low variability in solar resource interruptions. In contrast, WPD showed substantially greater intermittency. The maximum lull duration exceeded 2000 h in parts of inland Queensland, New South Wales, and northern Australia, indicating prolonged periods of unusable wind energy. Mean lull durations were generally higher than for GHI, exceeding 60 h in wind-poor inland regions, with lower values (20–40 h) near coastal zones. The median lull durations and IQR values further emphasize this variability, particularly in the eastern half of the continent, where IQR values exceeded 100 h. These metrics highlight the inherent unreliability of wind energy in inland and tropical regions, contrasted by more stable wind regimes near the coasts and over oceans.

3.5. Synergy

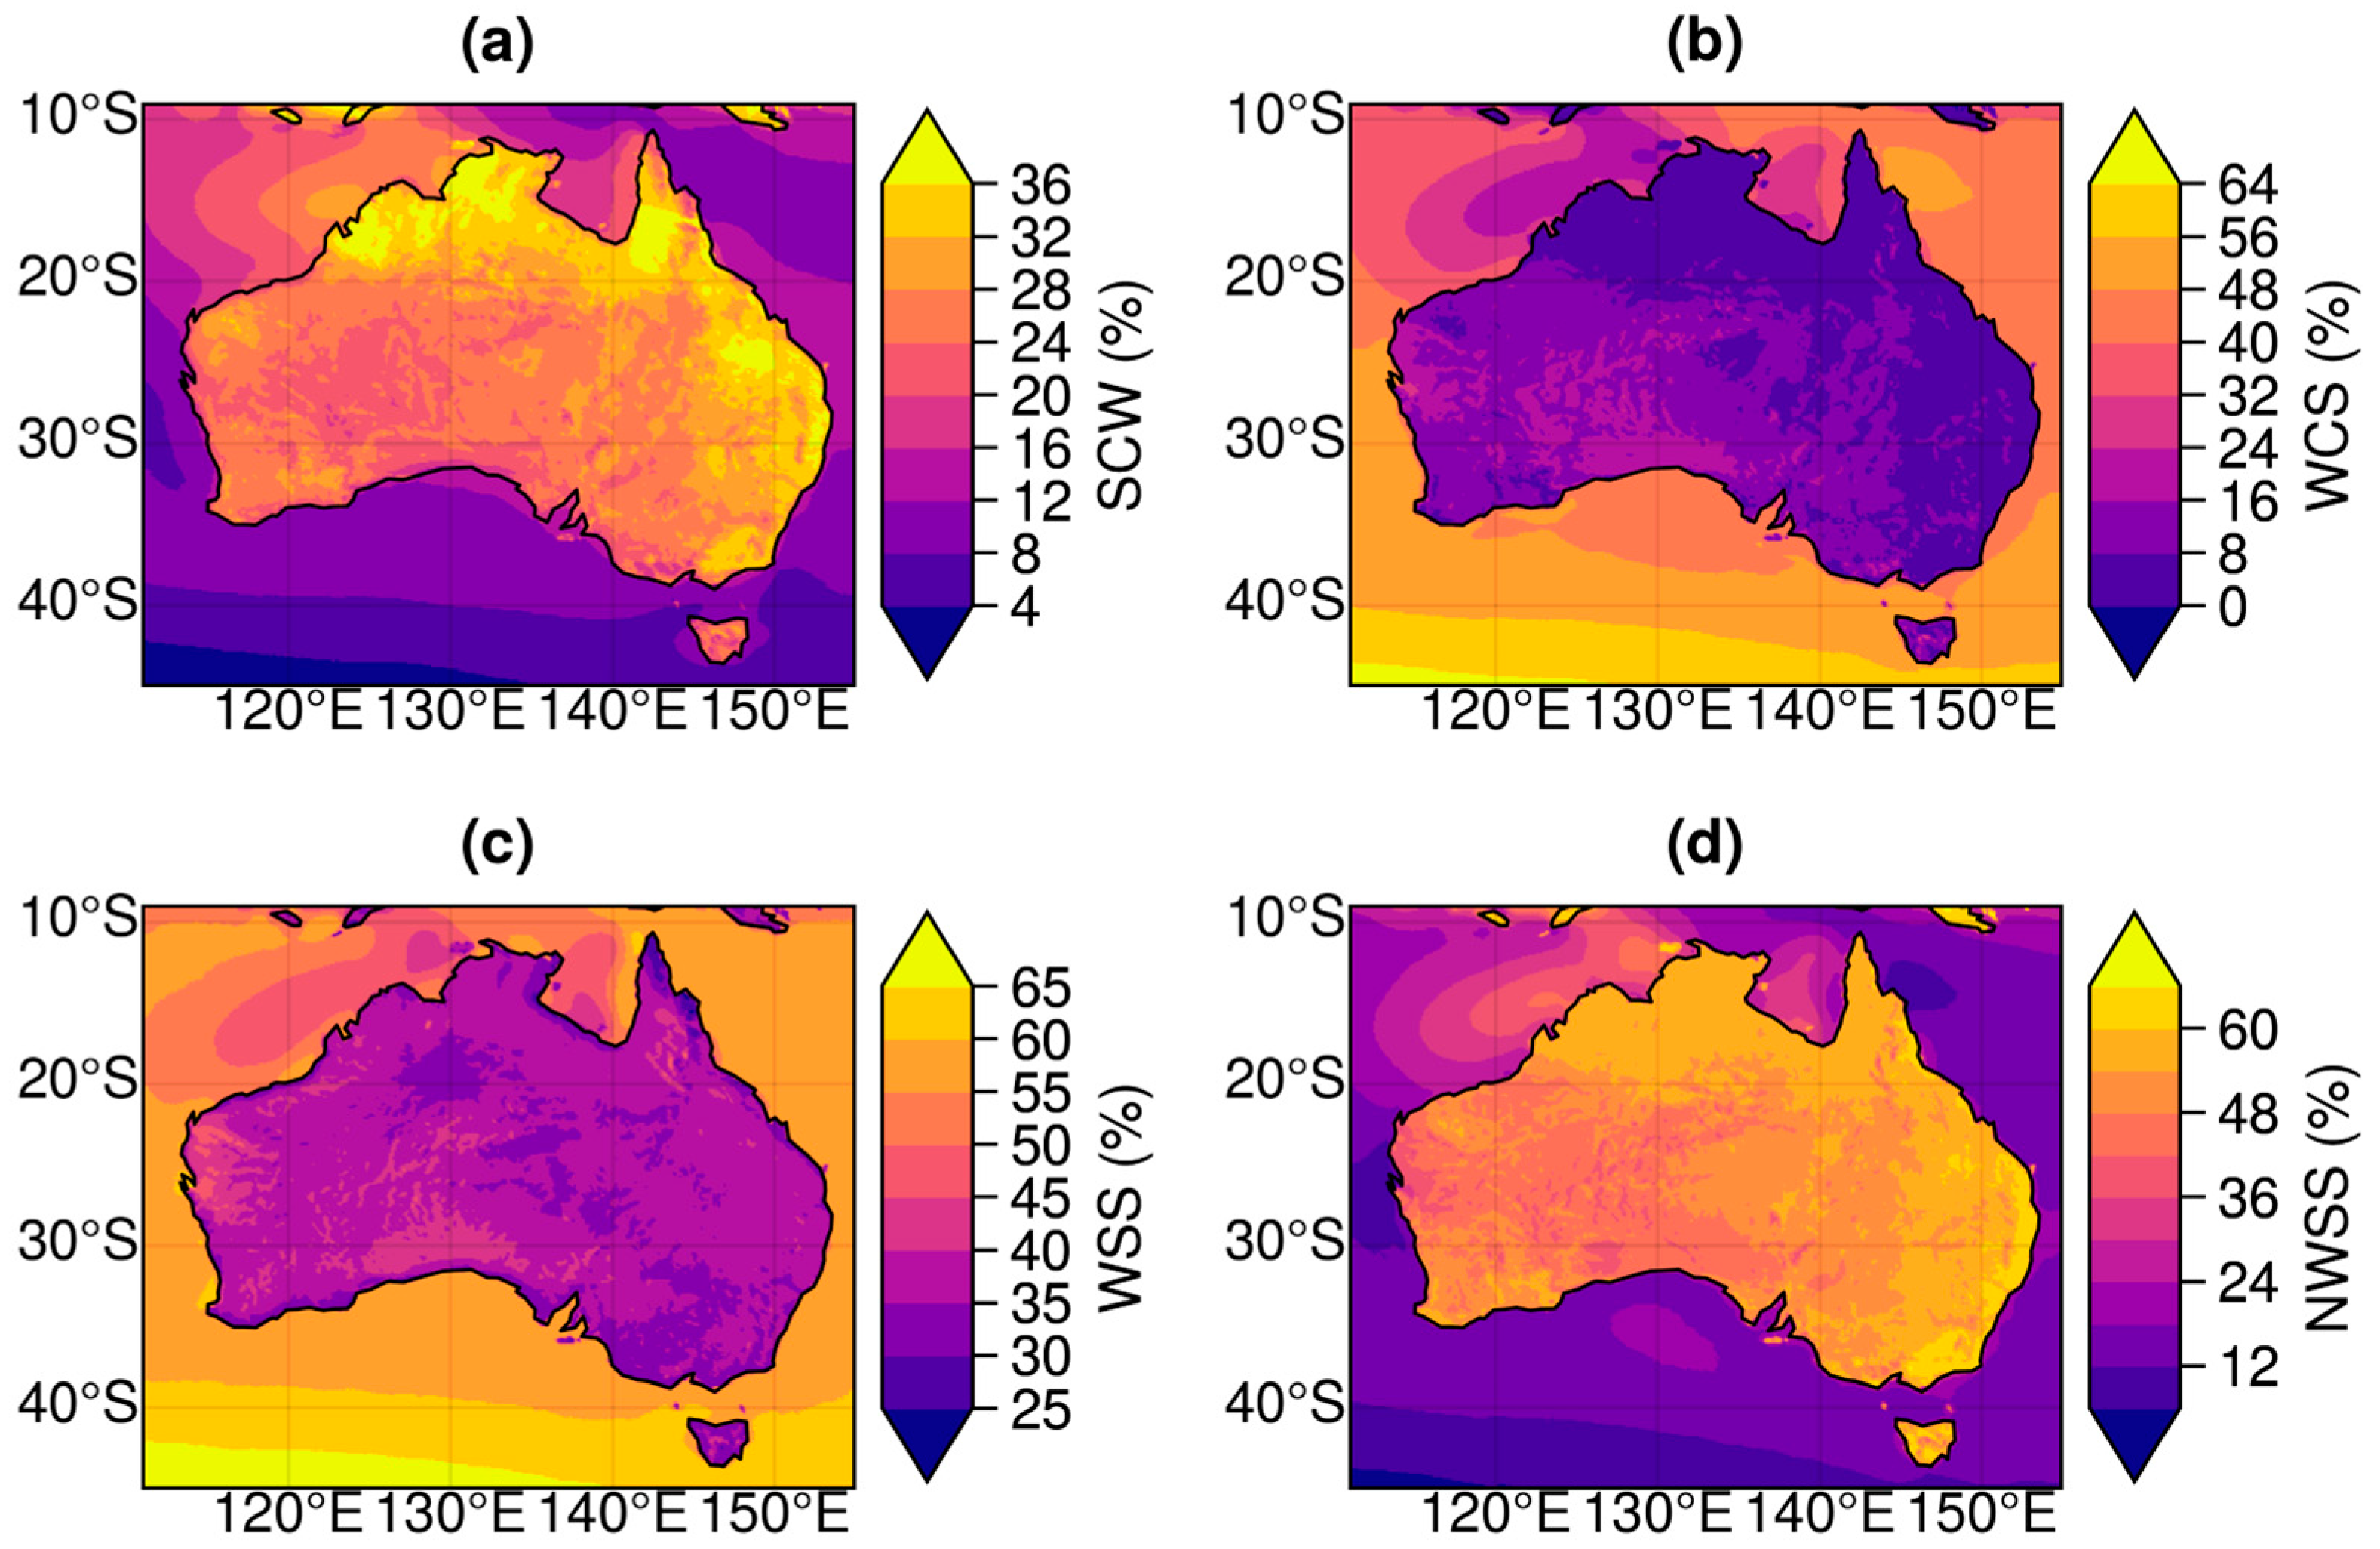
The synergy characteristics of solar (GHI) and wind (WPD) resources are shown in Figure 7.
SCW was highest (>32%) across much of central and northern Australia, as shown in Figure 7a. These regions exhibited strong complementarity, where wind and solar resources tend to be temporally offset, allowing solar resources to support energy generation when wind energy is unavailable. Lower SCW values (<8%) were observed in southern and southeastern coastal regions, indicating less temporal compensation between wind and solar energy. Figure 7b displays the fraction of time when solar availability drops and is complemented by the solar resource (WCS). This metric was elevated (>48%) in southern coastal regions, which are characterized by high wind availability. Lower values (<24%) were found in northern and inland regions, where wind is available in modest amounts during solar shortfalls.
Interestingly, WSS, shown in Figure 7c, included times when both resources adequately complemented each other. Overall, a strong land–ocean contrast is seen in WSS, with higher complementarity over oceans than land. The spatial pattern highlighted high values (>55%) in the southern and western regions of the country, and low values (<35%) in the northern and central regions, reinforcing that inland Australia provided more than 25% synergy in solar and wind resources. On the other hand, Figure 7d shows NWSS, which captures the combined periods with no solar and wind availability and is critical for understanding energy storage or grid backup needs. The highest values (>54%) occurred in southeastern and coastal regions, particularly where both wind and solar intermittency coincide. In contrast, northern and arid inland areas exhibited lower NWSS (<36%), suggesting lower overall mismatch and less reliance on batteries.
To assess the bankability of a hybrid solar–wind system in Australia, it is essential to consider not only synergy metrics but also other key factors. It is also necessary to investigate the intermittency associated with the synergy metrics, as shown with key statistics of episode lengths and lulls in Figure 8 and Figure 9, respectively.
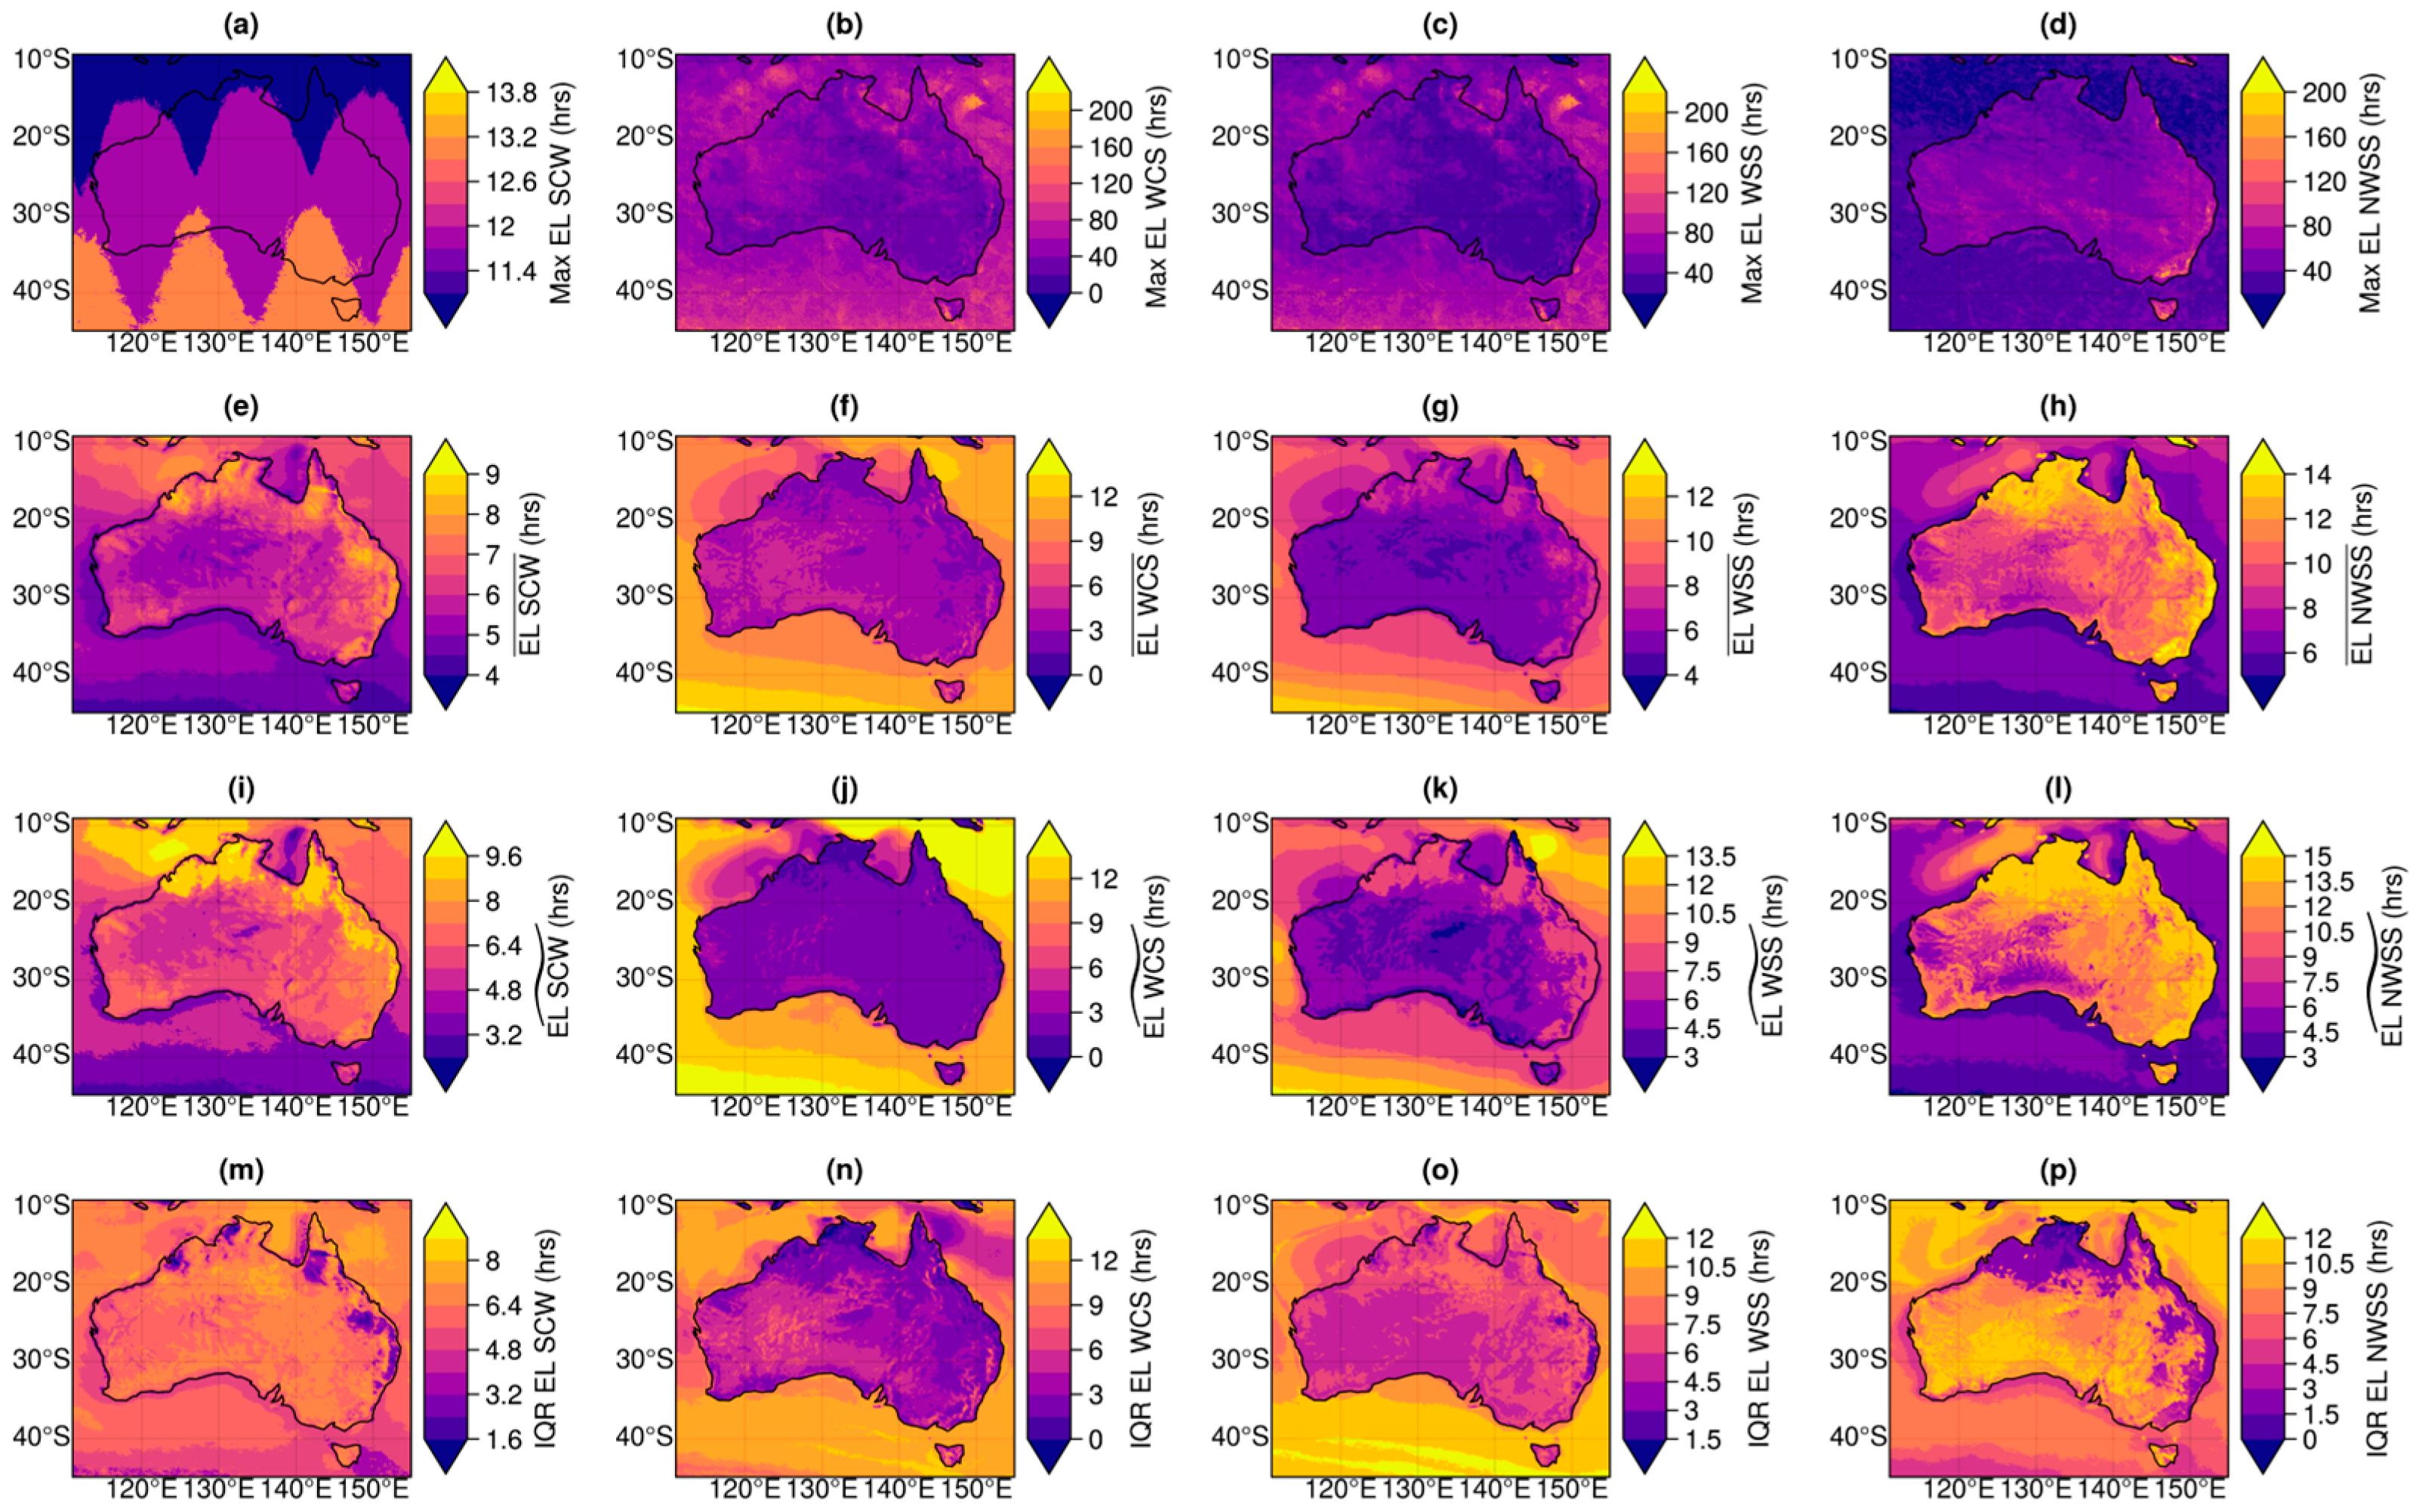
Figure 8a,e,i,m show the maximum, mean, median, and IQR episode length (EL) of solar complementing wind (SCW). The maximum EL for SCW ranged from 10 to 13 h, aligning with the regions with the longest daylight in southern Australia, with lower values over northern coastal and marine areas. The mean and median EL for SCW exhibited consistent patterns, peaking from around 6 to 9 h across central and eastern inland Australia, whereas coastal and oceanic zones showed reduced values. The IQR EL for SCW ranged from 2 to 8 h, with the largest swings concentrated in the northern interior, whereas marine regions showed lower variability, reflecting more uniform but shorter SCW episodes offshore. Figure 8b,f,j,n illustrate the maximum, mean, median, and IQR EL of wind complementing solar (WCS). The maximum EL for WCS reached up to 200 h across oceanic regions in Australia, over Tasmania, and in parts of northern Australia, but was significantly lower over eastern Australia. The mean and median EL for WCS peaked around 6 h in southern and southwestern land areas, with surrounding marine areas generally showing larger durations of 12 h. The IQR EL of WCS peaked at 9 h over land, with variability concentrated in southern and northeastern Australia, while ocean regions exhibited more stable, but higher swings.
Similarly, Figure 8c,g,k,o present the maximum, mean, median, and IQR EL of wind–solar synergy (WSS). The maximum EL for WSS extended to 200 h, scattered across much of Australia, with ocean areas exhibiting broader and more sustained synergy events compared to land areas. The mean and median EL for WSS values clustered between 9 and 12 h, especially over inland southeastern regions, while IQR for WSS was highest over continental zones, suggesting modest variations in synergy episode durations over land. Ocean regions again showed much higher swings in WSS distributions. Figure 8d,h,l,p display the maximum, mean, median, and IQR EL of no wind–solar synergy (NWSS), reflecting periods of simultaneous shortfall in both resources. The maximum EL of NWSS exceeded 180 h in southeastern and eastern inland regions, with oceanic zones typically showing shorter durations. The mean and median EL for NWSS peaked above 12 h in northern and eastern inland Australia, while remaining lower across southern coastlines and offshore. The IQR EL of NWSS was greatest (up to 12 h) in eastern interior regions, reflecting greater non-generation on land compared to the surrounding Southern Ocean.
Figure 9a,e,i,m show the maximum, mean, median, and IQR lull duration of solar complementing wind (SCW). The maximum lull durations reached up to 360 h in southern and coastal Australia, particularly over marine regions, indicating longer periods without effective solar complement to wind. Mean and median lull durations were highest in southern and southeastern Australia, ranging from 20 to 48 h, and were substantially shorter across northern inland areas (<16 h), suggesting better solar complementarity in the tropics. The IQR spanned from 4 to 40 h, with the most significant variability concentrated in southern and eastern coastal regions, while southern oceanic zones exhibited much higher IQR, implying more lull durations offshore. Figure 9 b,f,j,n present the maximum, mean, median, and IQR lull durations of wind complementing solar (WCS). The maximum lulls were most severe in eastern and northern Australia, exceeding 2000 h, indicating prolonged periods when wind cannot compensate for solar loss. Coastal and oceanic zones experienced shorter maximum lulls (<1000 h). The mean and median lulls exceeded 40 h in inland northern and northeastern Australia, while values in southern and coastal zones remained <20 h. The IQR varied from 10 to 80 h, with inland land areas exhibiting higher variability and marine zones again showing lower and more consistent lull durations.
Figure 9c,g,k,o illustrate the maximum, mean, median, and IQR lull durations of wind–solar synergy (WSS). The maximum lulls ranged between 24 and 80 h across southern and central Australia, while being shorter (<20 h) in the north and along the coastal oceans. The mean and median lulls in southern inland regions typically ranged from 3 to 8 h, with higher values (>10 h) observed in northern and eastern regions. The IQR of WSS was highest in eastern inland Australia, reaching up to 9 h, whereas oceans showed reduced and more stable lull variability. Figure 9d,h,l,p display the maximum, mean, median, and IQR lull durations of wind–solar energy (NWSS), representing the most critical periods of simultaneous resource unavailability. The maximum lull durations of NWSS exceeded 160 h in western and southwestern Australia and were generally much greater (>200 h) over coastal oceans. Mean and median lulls were <10 h in inland and southeastern regions, with values increasing toward the coasts. The IQR for NWSS was highest in southern Australia (12 h), reflecting lesser uncertainty in dual-resource shortfalls over land compared to the marine environment of the Southern Ocean.

3.6. Case Study

Further assessment of the metrics was tested for one of the biggest operational hybrid solar–wind farms in Port Augusta, South Australia, with a capacity of 317 MW. The key metrics computed for the site are shown in Table 1.
For the site, solar showed a high mean and median with relatively moderate variability, reflecting its consistency and predictable daily cycle. In contrast, wind had a much lower median compared to the mean and a higher variability, indicating a strongly skewed distribution dominated by frequent calms interspersed with strong events. Reliability metrics further confirmed this divergence. The total and daytime availability of solar energy was significantly higher than that of wind. Synergy statistics revealed that solar complementing wind (SCW) accounted for 23% of events, while wind complementing solar (WCS) accounted for only 9%, but combined synergy (WSS) accounted for 32%. Nonetheless, joint deficits (NWSS) remained dominant at 53%, underscoring the need for storage. Episode length (EL) analysis revealed that solar persistence was significantly stronger (mean 15 h, max 442 h) than wind (mean 6 h, max 70 h). In comparison, synergy episodes typically lasted 5 h but could extend up to 36 h. Importantly, synergy (WSS) lulls lasted an average of 10 h and could persist for up to 47 h, far shorter than wind-only extremes (>500 h), suggesting hybrid systems already reduce intermittency risks. In terms of solar lulls, it remained bounded (max ~91 h, mean 14 h), whereas wind could experience prolonged calm periods exceeding 500 h. Collectively, these results confirm that solar was the more reliable backbone resource at the site, wind provided valuable but variable diversity, and hybridization cut extreme shortfalls down to manageable durations on the order of a few days.

4. Discussion

Synergy metrics (such as SCW, WCS, and WSS) capture the periods when one resource effectively compensates for the other, thereby reducing the net variability of the system. When synergy is high, batteries primarily serve to smooth short-term fluctuations and perform intra-day shifting, such as storing solar surplus for evening peaks. In these conditions, storage requirements remain modest because the natural complementarity between solar and wind already eliminates many prolonged deficits. By contrast, the non-synergy metric (NWSS) represents the most critical stress points for system reliability. The duration and frequency of NWSS events directly inform the sizing of long-duration battery storage, since these are the periods when neither solar nor wind can support demand. For example, while synergy episodes may only require a few hours of coverage, NWSS lulls can extend up to several days, demanding substantially larger storage reserves to bridge the gap. Thus, synergy reduces overall storage burden, but NWSS defines the upper bound of backup capacity needed to guarantee system resilience. In practice, integrating synergy and non-synergy metrics ensures that storage planning is neither overbuilt, leading to unnecessary costs, nor underbuilt, leaving the grid exposed during rare but severe joint deficits. Several studies have already demonstrated the benefits of simple storage optimization using the complementary characteristics of a hybrid solar–wind system [9,51].
Most of the results presented in the study are comparable to those presented in similar metrics by earlier studies [5,9] using MERRA2 reanalysis data. The added resolution from BARRA-R reanalysis paints a clearer picture of the variability, reliability, and intermittency of solar and wind resources. It further provides more localized insights related to synergy characteristics. Most of the results presented in the paper differ slightly from a recent study examining the synergy characteristics of solar and wind energy using BARRA-R by Wu and West [1] mainly due to differences in wind energy conversions. We used a typical wind turbine hub-height of 80 m instead of surface winds at 10 m. Additionally, this study focused primarily on intermittency metrics for solar and wind energy, extending to synergy measures.
It is highly plausible that both localized and large-scale weather patterns drove the key results presented; however, this has not been extensively investigated in this study. A recent study has presented strong evidence of widespread clouds and anticyclonic circulations affecting solar and wind lulls in Australia [52]. Likewise, the evidence of climate variability has also been discussed in relation to fluctuations in supply for wind and solar energy [53]. Notably, errors in simulating clouds and circulation from the reanalysis model will propagate solar and wind resources upon post-processing. Some of the issues identified with the BARRA-R data include errors in the computation of direct and diffuse radiation, which lead to a 10% uncertainty in irradiance [54], and the underestimation of strong winds (gusts) at 10 m [38]. The recent release of BARRA2 may offer improved modelling of solar and wind resources, especially in terms of their synergy characteristics. It has been shown to outperform MERRA2 and ERA5 for wind power generation in Australia [45].

5. Conclusions

This paper assessed the suitability of the high-resolution BARRA reanalysis product in capturing the spatio-temporal characteristics, such as synergy and complementarity, between solar and wind energy sources across Australia.
The key metrics of variability and reliability assess a resource’s suitability for the continuity of supply. The greater the variability in a particular region, the more likely it is that it would require a form of Battery Energy Storage (BES) to cover the variable periods. Overall, for GHI spatially over Australia, only modest variability was observed. This did, however, increase in the southern states, particularly Tasmania, where cloud variability became the driving factor. WPD exhibited significantly larger variability in coastal and elevated regions, particularly in the southeast, which is likely due to terrain features and the land–sea boundary in coastal areas. The variability decreased across the ocean coastline and in the inland and northern parts of the continent.
Reliability was assessed by the availability metric, with higher availability in the central regions of the continent, which are more dominated by arid climate features. This region would therefore provide greater reliability. As observed with variability, availability decreased in the southern regions, most likely due to increased cloud cover. Unsurprisingly, WPD availability had greater spatial variability and was highly region-dependent, with the greatest availability in the south and in maritime zones. This alludes to the greater potential for off-shore wind. To further understand availability, two additional important metrics provided more details on the resource—lulls and episode length. Lulls provide important information on continuous periods of low to no generation. This metric can guide developers in understanding the longest period of time when BES may be needed, and they can also use this information to schedule maintenance effectively. For GHI lulls, the lulls were relatively consistent across the country and similar to what was observed in the previous metrics. We see that the duration of lulls was greater in the southern part of the continent and lower in the north. The longest period of no generation was approximately 12 days. The WPD, however, showed greater intermittency across the inland eastern part of the continent, stretching into the north. More stable wind regimes were found in the coastal areas and over the oceans. Episode length provides greater insight into availability by identifying regions where we can expect continuous, prolonged generation, which in turn gives more confidence in the continuity of supply. Solar energy had longer and more predictable periods of episode duration, in particular over central and northern Australia. WPD was again more variable, with greater intermittency and shorter episode lengths, which was more notable in inland areas.
While an understanding of these individual resources is useful, the metrics also suggest how synergy and complementary metrics will perform. Overall, we observed a strong aspect of SCW in the central and northern parts of Australia, with WCS prevailing in the southern and coastal areas. These regions demonstrated that the alternative resource will effectively offset any shortfalls from the other. In terms of the synergy metrics, an understanding of when both resources are not available or are highly intermittent could lead to the development of battery storage or other forms of grid backup to cover those shortfall periods. We observed the highest percentage of unavailability in the southeastern and coastal regions, with the arid inland areas being less reliant on forms of backup generation. In terms of lulls, with SCW, we observed better regions of complementarity in the tropical regions, specifically northern Australia, and greater variability in the southern and eastern coastal regions. For WCS, we observed longer durations in east and north Australia, suggesting that wind is unable to compensate for the loss of solar energy. Shorter-duration lulls were experienced in coastal and oceanic regions.
The metrics in this paper can be further explored in the future to optimize BES systems. Lulls and availability can be used to potentially size a system, whereby correlating with demand and the maximum lulls, one can determine the size and duration of storage required. This is key for transitioning to a renewable grid to maintain the continuity of supply. Alongside the metrics used in this study, correlations between temperature are also important when choosing a battery type for the BES system, as regions with higher temperatures can accelerate degradation. The locations identified in this study could also be used to model generation on a system level, providing guidance to investors and developers on future hybrid locations. Investigating how hybrid generation correlates with demand to reduce ramping from one system can also be extended in future studies. The threshold metrics used in this study could also be tailored to focus on extremes that impact solar and wind output. Overall, the BARRA dataset contains a range of variables useful for renewable assessment, such as Concentrated Solar Power (CSP), rainfall, and cloud cover, to name a few.
This study has illustrated the importance of understanding the characteristics of a resource both individually and collectively. The combination of solar and wind can reduce the intermittency that occurs from a single generation source, and understanding their synergistic behaviour allows for a better response to potential shortfalls and knowledge of when a backup power supply is needed, hence allowing the continuity of supply. These metrics and analyses were performed using a high-resolution spatial and temporal reanalysis product, with the methodology employed here easily adaptable to other products for any country in the world. BARRA-R’s coverage also gives the Pacific Islands the ability to understand how renewable resources could be implemented.

Author Contributions

Conceptualization, A.P. and M.K.; methodology, A.P.; software, A.P.; validation, A.P. and M.K.; formal analysis, A.P.; investigation, A.P.; resources, M.K.; data curation, A.P.; writing—original draft preparation, M.K.; writing—review and editing, A.P.; visualization, A.P.; supervision, M.K.; project administration, A.P.; funding acquisition, M.K. All authors have read and agreed to the published version of the manuscript.

Funding

This research received no external funding.

Data Availability Statement

The original data presented in the study are openly available in Thredds National Computational Infrastructure (NCI) at https://thredds.nci.org.au/thredds/catalog/catalog.html (accessed on 10 October 2025).

Acknowledgments

This research was undertaken with the assistance of resources from the National Computational Infrastructure (NCI Australia), an NCRIS-enabled capability supported by the Australian Government.

Conflicts of Interest

The authors declare no conflicts of interest.

References

  1. Wu, H.; West, S.R. Co-optimisation of wind and solar energy and intermittency for renewable generator site selection. Heliyon 2024, 10, 5. [Google Scholar] [CrossRef]
  2. Henao, F.; Viteri, J.P.; Rodríguez, Y.; Gómez, J.; Dyner, I. Annual and interannual complementarities of renewable energy sources in Colombia. Renew. Sustain. Energy Rev. 2020, 134, 110318. [Google Scholar] [CrossRef]
  3. Jurasz, J.; Canales, F.A.; Kies, A.; Guezgouz, M.; Beluco, A. A review on the complementarity of renewable energy sources: Concept, metrics, application and future research directions. Sol. Energy 2020, 195, 703–724. [Google Scholar] [CrossRef]
  4. de Andrade Melo, G.; Cyrino Oliveira, F.L.; Maçaira, P.M.; Meira, E. Exploring complementary effects of solar and wind power generation. Renew. Sustain. Energy Rev. 2025, 209, 115139. [Google Scholar] [CrossRef]
  5. Prasad, A.A.; Taylor, R.A.; Kay, M. Assessment of solar and wind resource synergy in Australia. Appl. Energy 2017, 190, 354–367. [Google Scholar] [CrossRef]
  6. Weschenfelder, F.; de Novaes Pires Leite, G.; Araújo da Costa, A.C.; de Castro Vilela, O.; Ribeiro, C.M.; Villa Ochoa, A.A.; Araújo, A.M. A review on the complementarity between grid-connected solar and wind power systems. J. Clean. Prod. 2020, 257, 120617. [Google Scholar] [CrossRef]
  7. IRENA. Renewable Capacity Statistics 2025; International Renewable Energy Agency: Abu Dhabi, United Arab Emirates, 2025. [Google Scholar]
  8. Busby, J.; Baker, K.; Bazilian, M.; Gilbert, A.; Grubert, E.; Rai, V.; Rhodes, J.; Shidore, S.; Smith, C.; Webber, M. Cascading risks: Understanding the 2021 winter blackout in Texas. Energy Res. Soc. Sci. 2021, 77, 102106. [Google Scholar] [CrossRef]
  9. Prasad, A.A.; Yang, Y.; Kay, M.; Menictas, C.; Bremner, S. Synergy of solar photovoltaics-wind-battery systems in Australia. Renew. Sustain. Energy Rev. 2021, 152, 111693. [Google Scholar] [CrossRef]
  10. Pedruzzi, R.; Silva, A.R.; Soares dos Santos, T.; Araujo, A.C.; Cotta Weyll, A.L.; Lago Kitagawa, Y.K.; Nunes da Silva Ramos, D.; Milani de Souza, F.; Almeida Narciso, M.V.; Saraiva Araujo, M.L.; et al. Review of mapping analysis and complementarity between solar and wind energy sources. Energy 2023, 283, 129045. [Google Scholar] [CrossRef]
  11. Chen, W.-B. Assessing global land-based solar–wind complementarity using high-resolution climate reanalysis for hybrid renewable energy design. Energy Convers. Manag. 2025, 343, 120267. [Google Scholar] [CrossRef]
  12. Bett, P.E.; Thornton, H.E. The climatological relationships between wind and solar energy supply in Britain. Renew. Energy 2016, 87, 96–110. [Google Scholar] [CrossRef]
  13. Heide, D.; von Bremen, L.; Greiner, M.; Hoffmann, C.; Speckmann, M.; Bofinger, S. Seasonal optimal mix of wind and solar power in a future, highly renewable Europe. Renew. Energy 2010, 35, 2483–2489. [Google Scholar] [CrossRef]
  14. Miglietta, M.M.; Huld, T.; Monforti-Ferrario, F. Local Complementarity of Wind and Solar Energy Resources over Europe: An Assessment Study from a Meteorological Perspective. J. Appl. Meteorol. Climatol. 2017, 56, 217–234. [Google Scholar] [CrossRef]
  15. Monforti, F.; Huld, T.; Bódis, K.; Vitali, L.; D’Isidoro, M.; Lacal-Arántegui, R. Assessing complementarity of wind and solar resources for energy production in Italy. A Monte Carlo approach. Renew. Energy 2014, 63, 576–586. [Google Scholar] [CrossRef]
  16. Xu, L.; Wang, Z.; Liu, Y. The spatial and temporal variation features of wind-sun complementarity in China. Energy Convers. Manag. 2017, 154, 138–148. [Google Scholar] [CrossRef]
  17. Jurasz, J.; Beluco, A.; Canales, F.A. The impact of complementarity on power supply reliability of small scale hybrid energy systems. Energy 2018, 161, 737–743. [Google Scholar] [CrossRef]
  18. Widen, J. Correlations Between Large-Scale Solar and Wind Power in a Future Scenario for Sweden. IEEE Trans. Sustain. Energy 2011, 2, 177–184. [Google Scholar] [CrossRef]
  19. Santos-Alamillos, F.J.; Pozo-Vázquez, D.; Ruiz-Arias, J.A.; Lara-Fanego, V.; Tovar-Pescador, J. Analysis of spatiotemporal balancing between wind and solar energy resources in the southern Iberian Peninsula. J. Appl. Meteorol. Climatol. 2012, 51, 2005–2024. [Google Scholar] [CrossRef]
  20. López Prol, J.; de Llano Paz, F.; Calvo-Silvosa, A.; Pfenninger, S.; Staffell, I. Wind-solar technological, spatial and temporal complementarities in Europe: A portfolio approach. Energy 2024, 292, 130348. [Google Scholar] [CrossRef]
  21. Kapica, J.; Canales, F.A.; Jurasz, J. Global atlas of solar and wind resources temporal complementarity. Energy Convers. Manag. 2021, 246, 114692. [Google Scholar] [CrossRef]
  22. Ren, G.; Wan, J.; Liu, J.; Yu, D. Spatial and temporal assessments of complementarity for renewable energy resources in China. Energy 2019, 177, 262–275. [Google Scholar] [CrossRef]
  23. Gallardo, R.P. Chapter 12—A comparative study of correlation coefficients used to assess the solar and wind complementarity in Mexico. In Complementarity of Variable Renewable Energy Sources; Jurasz, J., Beluco, A., Eds.; Academic Press: Cambridge, MA, USA, 2022; pp. 269–290. [Google Scholar]
  24. Yan, J.; Qu, T.; Han, S.; Liu, Y.; Lei, X.; Wang, H. Reviews on characteristic of renewables: Evaluating the variability and complementarity. Int. Trans. Electr. Energy Syst. 2020, 30, e12281. [Google Scholar] [CrossRef]
  25. Zhang, X.; Lu, N.; Jiang, H.; Yao, L. Evaluation of Reanalysis Surface Incident Solar Radiation Data in China. Sci. Rep. 2020, 10, 3494. [Google Scholar] [CrossRef]
  26. Samal, R.K. Assessment of wind energy potential using reanalysis data: A comparison with mast measurements. J. Clean. Prod. 2021, 313, 127933. [Google Scholar] [CrossRef]
  27. Yang, D.; Wang, W.; Xia, X. A Concise Overview on Solar Resource Assessment and Forecasting. Adv. Atmos. Sci. 2022, 39, 1239–1251. [Google Scholar] [CrossRef]
  28. Quansah, A.D.; Dogbey, F.; Asilevi, P.J.; Boakye, P.; Darkwah, L.; Oduro-Kwarteng, S.; Sokama-Neuyam, Y.A.; Mensah, P. Assessment of solar radiation resource from the NASA-POWER reanalysis products for tropical climates in Ghana towards clean energy application. Sci. Rep. 2022, 12, 10684. [Google Scholar] [CrossRef]
  29. Du, Y.; Shi, H.; Zhang, J.; Xia, X.; Yao, Z.; Fu, D.; Hu, B.; Huang, C. Evaluation of MERRA-2 hourly surface solar radiation across China. Sol. Energy 2022, 234, 103–110. [Google Scholar] [CrossRef]
  30. Rabbani, R.; Zeeshan, M. Exploring the suitability of MERRA-2 reanalysis data for wind energy estimation, analysis of wind characteristics and energy potential assessment for selected sites in Pakistan. Renew. Energy 2020, 154, 1240–1251. [Google Scholar] [CrossRef]
  31. Berger, M.; Radu, D.; Fonteneau, R.; Henry, R.; Glavic, M.; Fettweis, X.; Le Du, M.; Panciatici, P.; Balea, L.; Ernst, D. Critical time windows for renewable resource complementarity assessment. Energy 2020, 198, 117308. [Google Scholar] [CrossRef]
  32. Nyenah, E.; Sterl, S.; Thiery, W. Pieces of a puzzle: Solar-wind power synergies on seasonal and diurnal timescales tend to be excellent worldwide. Environ. Res. Commun. 2022, 4, 055011. [Google Scholar] [CrossRef]
  33. Sterl, S.; Liersch, S.; Koch, H.; van Lipzig, N.P.M.; Thiery, W. A new approach for assessing synergies of solar and wind power: Implications for West Africa. Environ. Res. Lett. 2018, 13, 094009. [Google Scholar] [CrossRef]
  34. Doddy Clarke, E.; Griffin, S.; McDermott, F.; Monteiro Correia, J.; Sweeney, C. Which Reanalysis Dataset Should We Use for Renewable Energy Analysis in Ireland? Atmosphere 2021, 12, 624. [Google Scholar] [CrossRef]
  35. Gualtieri, G. Analysing the uncertainties of reanalysis data used for wind resource assessment: A critical review. Renew. Sustain. Energy Rev. 2022, 167, 112741. [Google Scholar] [CrossRef]
  36. Kaiser-Weiss, A.K.; Borsche, M.; Niermann, D.; Kaspar, F.; Lussana, C.; Isotta, F.A.; van den Besselaar, E.; van der Schrier, G.; Undén, P. Added value of regional reanalyses for climatological applications. Environ. Res. Commun. 2019, 1, 071004. [Google Scholar] [CrossRef]
  37. Ridal, M.; Bazile, E.; Le Moigne, P.; Randriamampianina, R.; Schimanke, S.; Andrae, U.; Berggren, L.; Brousseau, P.; Dahlgren, P.; Edvinsson, L.; et al. CERRA, the Copernicus European Regional Reanalysis system. Q. J. R. Meteorol. Soc. 2024, 150, 3385–3411. [Google Scholar] [CrossRef]
  38. Su, C.-H.; Eizenberg, N.; Steinle, P.; Jakob, D.; Fox-Hughes, P.; White, C.J.; Rennie, S.; Franklin, C.; Dharssi, I.; Zhu, H. BARRA v1.0: The Bureau of Meteorology Atmospheric high-resolution Regional Reanalysis for Australia. Geosci. Model Dev. 2019, 12, 2049–2068. [Google Scholar] [CrossRef]
  39. Gleeson, E.; Whelan, E.; Hanley, J. Met Éireann high resolution reanalysis for Ireland. Adv. Sci. Res. 2017, 14, 49–61. [Google Scholar] [CrossRef]
  40. Rasmussen, R.M.; Chen, F.; Liu, C.H.; Ikeda, K.; Prein, A.; Kim, J.; Schneider, T.; Dai, A.; Gochis, D.; Dugger, A.; et al. CONUS404: The NCAR–USGS 4-km Long-Term Regional Hydroclimate Reanalysis over the CONUS. Bull. Am. Meteorol. Soc. 2023, 104, E1382–E1408. [Google Scholar] [CrossRef]
  41. Acharya, S.C.; Nathan, R.; Wang, Q.J.; Su, C.H.; Eizenberg, N. An evaluation of daily precipitation from a regional atmospheric reanalysis over Australia. Hydrol. Earth Syst. Sci. 2019, 23, 3387–3403. [Google Scholar] [CrossRef]
  42. Chandra Acharya, S.; Nathan, R.; Wang, Q.J.; Su, C.H.; Eizenberg, N. Ability of an Australian reanalysis dataset to characterise sub-daily precipitation. Hydrol. Earth Syst. Sci. 2020, 24, 2951–2962. [Google Scholar] [CrossRef]
  43. May, P.T.; Trewin, B.; Su, C.H.; Ostendorf, B. Verification of moist surface variables over northern Australia in a high-resolution reanalysis (BARRA). J. South. Hemisph. Earth Syst. Sci. 2021, 71, 194–202. [Google Scholar] [CrossRef]
  44. Cowin, E.; Wang, C.; Walsh, S.D.C. Assessing Predictions of Australian Offshore Wind Energy Resources from Reanalysis Datasets. Energies 2023, 16, 3404. [Google Scholar] [CrossRef]
  45. Palmer, G.; Dargaville, R.; Su, C.H.; Wang, C.; Hoadley, A.; Honnery, D. Validation of BARRA2 and comparison with MERRA-2 and ERA5 using historical wind power generation. J. South. Hemisph. Earth Syst. Sci. 2025, 75, ES24028. [Google Scholar] [CrossRef]
  46. Fox-Hughes, P.; Su, C.H.; Eizenberg, N.; White, C.; Steinle, P.; Jakob, D.; Black, M.; Dowdy, A.; Brown, A.; Nathan, R.; et al. A review of early severe weather applications of high-resolution regional reanalysis in Australia. Meteorol. Appl. 2022, 29, e2087. [Google Scholar] [CrossRef]
  47. Gualtieri, G.; Secci, S. Methods to extrapolate wind resource to the turbine hub height based on power law: A 1-h wind speed vs. Weibull distribution extrapolation comparison. Renew. Energy 2012, 43, 183–200. [Google Scholar] [CrossRef]
  48. Lopez-Villalobos, C.A.; Martínez-Alvarado, O.; Rodriguez-Hernandez, O.; Romero-Centeno, R. Analysis of the influence of the wind speed profile on wind power production. Energy Rep. 2022, 8, 8079–8092. [Google Scholar] [CrossRef]
  49. Sherman, P.; Song, S.; Chen, X.; McElroy, M. Projected changes in wind power potential over China and India in high resolution climate models. Environ. Res. Lett. 2021, 16, 034057. [Google Scholar] [CrossRef]
  50. Zhang, Z.; Liang, Y.; Xue, X.; Li, Y.; Zhang, M.; Li, Y.; Ji, X. China’s future wind energy considering air density during climate change. Renew. Sustain. Energy Rev. 2024, 199, 114452. [Google Scholar] [CrossRef]
  51. Dehghani, F.; Shafiyi, M.A. Integration of hybrid renewable energy sources with the power system considering their economic complementarity. IET Renew. Power Gener. 2023, 17, 3638–3650. [Google Scholar] [CrossRef]
  52. Richardson, D.; Pitman, A.J.; Ridder, N.N. Climate influence on compound solar and wind droughts in Australia. Npj Clim. Atmos. Sci. 2023, 6, 184. [Google Scholar] [CrossRef]
  53. Gunn, A.; Dargaville, R.; Jakob, C.; McGregor, S. Spatial optimality and temporal variability in Australia’s wind resource. Environ. Res. Lett. 2023, 18, 114048. [Google Scholar] [CrossRef]
  54. Sun, Z.; Li, J.; He, Y.; Li, J.; Liu, A.; Zhang, F. Determination of direct normal irradiance including circumsolar radiation in climate/NWP models. Q. J. R. Meteorol. Soc. 2016, 142, 2591–2598. [Google Scholar] [CrossRef]
Figure 1. The spatial extent of BARRA-R with shaded terrain height. The regional boundary used in this study for Australia is shown in dashed red lines. Also marked (x) is one of the biggest operational hybrid solar–wind farms in Port Augusta, South Australia, with a capacity of 317 MW.
Energies 18 05452 g001
Figure 2. Key statistics of solar and wind resources derived using BARRA-R over Australia. (a) Mean GHI, (b) Mean WPD, (c) Median GHI, and (d) Median WPD.
Energies 18 05452 g002
Figure 3. Variability of solar and wind resources derived using BARRA-R over Australia. (a) RCoV GHI, (b) RCoV WPD, (c) IQR GHI, and (d) IQR WPD.
Energies 18 05452 g003
Figure 4. Reliability of solar and wind resources derived using BARRA-R over Australia. (a) Total availability in GHI, (b) Total availability in WPD, (c) Daytime availability in GHI, and (d) Daytime availability in WPD.
Energies 18 05452 g004
Figure 5. Episode Lengths (EL) of solar and wind resources derived using BARRA-R over Australia. (a) Maximum EL for GHI, (b) Maximum EL for WPD, (c) Mean EL for GHI, (d) Mean EL for WPD, (e) Median EL for GHI, (f) Median EL for WPD, (g) IQR EL for GHI, and (h) IQR EL for WPD.
Energies 18 05452 g005
Figure 6. Lulls of solar and wind resources derived using BARRA-R over Australia. (a) Maximum Lulls for GHI, (b) Maximum Lulls for WPD, (c) Mean Lulls for GHI, (d) Mean Lulls for WPD, (e) Median Lulls for GHI, (f) Median Lulls for WPD, (g) IQR Lulls for GHI, and (h) IQR Lulls for WPD.
Energies 18 05452 g006
Figure 7. Synergy of solar and wind resources derived using BARRA-R over Australia. (a) SCW, (b) WCS, (c) WSS, and (d) NWSS.
Energies 18 05452 g007
Figure 8. Episode Lengths (EL) of synergy metrics derived using BARRA-R over Australia. (a) Maximum EL for SCW, (b) Maximum EL for WCS, (c) Maximum EL for WSS, (d) Maximum EL for NWSS, (e) Mean EL for SCW, (f) Mean EL for WCS, (g) Mean EL for WSS, (h) Mean EL for NWSS, (i) Median EL for SCW, (j) Median EL for WCS, (k) Median EL for WSS, (l) Median EL for NWSS, (m) IQR EL for SCW, (n) IQR EL for WCS, (o) IQR EL for WSS, and (p) IQR EL for NWSS.
Energies 18 05452 g008
Figure 9. Lulls of synergy metrics derived using BARRA-R over Australia. (a) Maximum Lulls for SCW, (b) Maximum Lulls for WCS, (c) Maximum Lulls for WSS, (d) Maximum Lulls for NWSS, (e) Mean Lulls for SCW, (f) Mean Lulls for WCS, (g) Mean Lulls for WSS, (h) Mean Lulls for NWSS, (i) Median Lulls for SCW, (j) Median Lulls for WCS, (k) Median Lulls for WSS, (l) Median Lulls for NWSS, (m) IQR Lulls for SCW, (n) IQR Lulls for WCS, (o) IQR Lulls for WSS, and (p) IQR Lulls for NWSS.
Energies 18 05452 g009
Table 1. Key metrics computed for the site in Port Augusta with an operational hybrid solar–wind farm.
MetricsGHIWPDSCWWCSWSSNWSS
Key Statistics x ¯ 431146----
x ~ 39253----
Variability R C o V   ( % ) 105142----
I Q R 560177----
Reliability T o t a l   A V   ( % ) 3820----
D a y   A V   ( % ) 7134----
Synergy S c e n a r i o   ( % ) --23 9 32 53
Intermittency M a x   E L   ( h ) 4427012363646
E L ¯   ( h ) 15653511
E L ~   ( h ) 12452412
I Q R   E L   ( h ) 876458
M a x   L u l l s   ( h ) 915371446234790
L u l l s ¯   ( h ) 142618341010
L u l l s ~   ( h ) 141516191010
I Q R   L u l l s   ( h ) 320635115
Disclaimer/Publisher’s Note: The statements, opinions and data contained in all publications are solely those of the individual author(s) and contributor(s) and not of MDPI and/or the editor(s). MDPI and/or the editor(s) disclaim responsibility for any injury to people or property resulting from any ideas, methods, instructions or products referred to in the content.