Article

Multi-Area Wind Power Planning with Storage Systems for Capacity Credit Maximization Using Fuzzy-Based Optimization Strategy

Electrical Engineering Department, King Fahd University of Petroleum & Minerals, Dhahran 31261, Saudi Arabia
*
Author to whom correspondence should be addressed.
Energies 2025, 18(21), 5628; https://doi.org/10.3390/en18215628
Submission received: 13 July 2025 / Revised: 6 September 2025 / Accepted: 22 October 2025 / Published: 26 October 2025
(This article belongs to the Special Issue Recent Developments of Wind Energy: 2nd Edition)

Abstract

Generation expansion planning is critical for the sustainable development of power systems, particularly with the increasing integration of renewable energy sources like wind power. This paper presents an innovative generation expansion model identifying the optimal strategy for constructing new wind power plants. The model determines the ideal size of wind power generation and strategically allocates wind resources across multi-area power systems to maximize their capacity credit. A novel fuzzy set approach addresses wind power’s inherent uncertainty and variability, which models wind data uncertainty through membership functions for each stochastic parameter. This method enhances the accuracy of capacity credit calculations by effectively capturing the unpredictable nature of wind power. The model uses the Effective Load Carrying Capability (ELCC) as the objective function to measure the additional load that can be reliably supported by wind generation. Additionally, integrating a compressed-air energy storage system (CAESS) is introduced as a novel solution to mitigate the intermittency of wind power, further boosting the wind power plants’ capacity credit. By incorporating an energy storage system (ESS), the model ensures greater resource availability and flexibility. The study evaluates a multi-area power network, where each area has distinct conventional generation capacity, reliability metrics, load profiles, and wind data. A three-interconnected power system case study demonstrates the model’s effectiveness in increasing the load carrying capability of intermittent renewable resources, improving system reliability, and enhancing resilience. This study provides new insights into optimizing renewable energy integration by leveraging advanced uncertainty modeling and energy storage, contributing to the long-term sustainability of power systems.

1. Introduction

1.1. Motivation

In 2023, the global wind power sector achieved a monumental milestone, surpassing 1 terawatt (TW) of cumulative installed capacity. This remarkable feat, marked by a 13% year-on-year (YoY) increase and the addition of 117 gigawatts (GW) of new capacity, is a testament to the industry’s rapid growth. Surpassing the 1 TW milestone is a symbol of wind power’s immense potential and progress. Onshore wind capacity saw a robust 54% YoY increase, with 106 GW installed, the first time over 100 GW was added in a single year globally. China and the US led in onshore installations, followed by Brazil, Germany, and India, which collectively accounted for 82% of new capacity. China notably set a record with 69 GW of new onshore capacity. The offshore wind sector also made significant strides, adding 10.8 GW and reaching a total capacity of 75.2 GW globally. This represented a 24% increase from 2022, making 2023 the second-highest year for offshore installations. China continued to dominate offshore additions with 6.3 GW, comprising 58% of the global total, while Europe also had a record year with 3.8 GW of new offshore capacity commissioned [1,2]. While renewable energy sources are crucial for establishing sustainable power systems, they present significant challenges in electric power networks, primarily because of their intermittent nature.

1.2. Literature Review

Integrating wind power into the energy grid presents unique challenges and opportunities. However, with the role of integrated planning becoming increasingly significant, the feasibility of this transition is becoming more apparent. Effective GEP is not just a tool but a crucial strategy for increasing wind power penetration, enhancing system reliability, and optimizing economic benefits. It plays a paramount role in transitioning to a more sustainable energy system. Several studies have addressed different aspects of this integration, highlighting various methodologies and frameworks.
The research presented in [3] discussed the application of a joint deterministic–probabilistic criterion for bulk power system planning with wind integration. This innovative approach, which combined deterministic methods with probabilistic assessments to evaluate system risk and reliability, was a significant step in adapting traditional planning methods to maintain reliability with higher wind penetration levels. The deterministic approach for generation and transmission expansion planning proposed by [4] used a mixed-integer linear programming (MILP) model to minimize costs associated with generation, load shedding, and investments. The study, which was applied to a network in southeast Romania, highlighted the significance of coordinated planning for new wind power plants and transmission lines. This approach demonstrated how integrated planning could address the challenges of aging infrastructure and the spatial distribution of renewable resources. Ref. [5] presents a framework for expanding data centers in electricity and data networks under uncertainty. That study underscores the importance of accounting for uncertainties in planning, such as fluctuating renewable energy sources like wind. The framework integrates various scenarios to ensure robust and resilient planning. The optimization of GEP involves uncertainties in input data for the renewable power generation system and balancing conflicting objectives, such as minimizing the system’s total cost while maximizing reliability [6,7,8,9].
Capacity credit, a crucial aspect of GEP, refers to the contribution of wind power to the reliability of the power system [10]. It quantifies how wind generation can replace conventional capacity while maintaining system reliability. A proper evaluation of capacity credit is crucial in GEP to ensure that adding wind power does not compromise system reliability. This involves using advanced probabilistic methods to account for wind generation’s variable and uncertain nature, underscoring the complexity of the task [11,12,13,14]. The approach based on the ELCC is considered the most appropriate for evaluating capacity credit [15,16]. Additionally, an ESS significantly mitigates wind power variability and uncertainty [17,18]. An ESS enhances grid stability and reliability by storing excess energy during high wind generation and releasing it during low generation periods. Therefore, this study considers a compressed-air energy storage system (CAESS) that facilitates high capacity [19,20].
Incorporating ESSs into GEP models helps optimize the integration of wind power, thereby reducing the need for backup conventional generation and improving overall system efficiency. Therefore, integrating wind power into GEP requires careful consideration of capacity credit and the deployment of an ESS [21]. These elements ensure the power system can accommodate wind power’s variability while maintaining reliability and efficiency. This approach supports the transition to a more sustainable and resilient energy system. While advanced ESS and GEP models improve wind power integration, wind variability still poses challenges. Addressing this uncertainty is crucial for developing a resilient and reliable power and energy system.
Addressing uncertainty is a longstanding concern within the power system sector [22,23,24,25]. During the 1970s, probabilistic models were employed to analyze demand behavior, and the resulting models and algorithms were utilized to comprehend and interpret these uncertainties in power system studies [26,27]. Fuzzy set theory is extensively utilized in decision making within uncertain contexts [28,29,30,31,32]. Numerous mathematical frameworks employing fuzzy techniques have been crafted to address issues of uncertainty. In 1965, Zadeh [33] pioneered the concept of fuzzy set theory, introducing membership functions to characterize and handle ambiguous data. Fuzzy optimization is widely recognized as a valuable tool in decision-making processes. Consequently, identifying broadly applicable and practical fuzzy optimization techniques remains a critical pursuit for both theoretical advancement and real-world implementation [34,35,36,37,38].
Various applications of fuzzy optimization in power systems have been documented. One area where these techniques have proven particularly useful is power system scheduling. Fuzzy optimization techniques have been developed for optimal power flow under uncertain system loads, as discussed in [39], for multi-area scheduling with fuzzy demand and tie capacity limits, as presented in [40], and for power system scheduling with fuzzy reserve requirements as detailed in [41]. Recently, fuzzy optimization has demonstrated efficacy in multiple contexts of power system planning and operation. It has been utilized to model the uncertainties related to optimizing virtual power plant (VPP) operations prior to bidding in external markets [42]. The uncertainties associated with bidding Virtual Power Plants into markets are modeled through fuzzy optimization [43]. In a recent paper, fuzzy set theory was employed to diagnose faults in power systems by modeling the uncertain operational states of protective relays and circuit breakers [44]. A fuzzy optimization model was also used for distribution system asset planning, incorporating battery energy storage systems (BESSs) to manage the increasing penetration of renewable energy sources [45]. The urgency and importance of addressing uncertainties in the power system cannot be overstated, as it is crucial for developing a resilient and reliable power and energy system.
A thorough comparison between previous research in this field and the proposed strategy is presented in Table 1 to clarify the paper’s contributions. As shown in Table 1, previous GEP studies vary widely in approach, with minimal incorporation of uncertainty and storage for CC maximization. The joint deterministic–probabilistic approach in [4] evaluated wind integration but lacked uncertainty modeling and a CAESS. Deterministic planning in [5] optimized expansion cost, neglecting wind variability’s stochastic nature. Stochastic storage deployment [46] and robust multi-energy planning [47] both addressed uncertainty but focused on microgrids and not on system-wide CC. In contrast, this paper employs fuzzy optimization to model wind uncertainty and includes a CAESS in a multi-area GEP model with a sole focus on CC and not cost.
As shown in Table 1, most prior studies focus on cost minimization or single-area planning, often using deterministic or stochastic approaches. Our work differs by addressing a multi-area system, integrating a compressed-air energy storage system (CAESS), and applying fuzzy optimization to maximize capacity credit directly under uncertainty.

1.3. Contributions

This study aims to develop a GEP model that maximizes CC in multi-area power systems by optimally distributing wind power and incorporating a CAESS within wind uncertainty, a challenge inadequately addressed in conventional cost-centric GEP [5]. In contrast to probabilistic CC evaluations [11,12,13,14] or ESS studies [17,18,19,20], we present an innovative methodology that integrates fuzzy optimization with a CAESS to improve system reliability and facilitate renewable integration.
The main contributions of this paper are as follows:
  • We develop a fuzzy optimization GEP framework that represents wind uncertainty using membership functions, enhancing CC estimation beyond deterministic approaches.
  • We present the first integration of a CAESS into multi-area GEP, demonstrating its critical role in mitigating wind intermittency and boosting CC.
  • A case study demonstrates the model’s effectiveness for a multi-area power system. It provides valuable lessons on strategic wind resource allocation and energy storage, which can increase system resilience and capacity credit.
  • A detailed sensitivity analysis reveals the importance of tie-line capacity and wind-profile correlation in improving power-system efficiency.
The remainder of this paper is outlined as follows: Section 2 presents the methodology describing the system modeling. Section 3 describes the objective function and the system constraints under consideration. Section 4 investigates the case study and presents the results and discussion, followed by the conclusion in Section 5.

2. Methodology

This study seeks to create a chronological expansion planning model to maximize the capacity credit of a new wind power plant necessary to fulfill demand and reliability standards. It also aims to find the optimal decisions to allocate wind power among multiple areas to maximize capacity credit. The findings of this study will have practical implications for the wind power industry. A fuzzy optimization technique will be utilized to address the uncertainty of wind data, and the impact of the compressed-air energy storage system (CAESS) on renewable power plants’ capacity credit will be investigated.

2.1. Operating Principle

In contrast to the conventional objective function of GEP, which is cost minimization, capacity credit is considered an objective function. Among several methods, the ELCC has been employed to determine wind power plant capacity credit. The ELCC denotes an extra load that may be sustained while maintaining equivalent reliability standards. The required data must include hourly load and wind information to compute the ELCC. The LOLE and capacity outage probability table (COPT) are calculated using the installed capacity of conventional generators and FORs.
In this study, fuzzy optimization enhanced the decision-making framework incorporated into the generation expansion planning model. It is beneficial when addressing uncertainties of renewable energy systems, such as wind power variability, by constructing membership functions (MFs) of the wind parameters and capacity credit. One of the main advantages of fuzzy set theory is that it can be used in a broad universe of discourse for reliable control in different conditions. Unlike linear control methods, which rely on fixed thresholds, this technique dynamically adjusts to input uncertainties, making it particularly effective for renewable energy systems. Additionally, CAESS integration enhances system reliability by storing excessive wind energy at high-generation times for later redistribution when generation is low. This ensures a more stable and efficient utilization of renewable energy resources, further strengthening the effectiveness of the fuzzy optimization approach in generation expansion planning.

2.2. Decision and Dependent Variables

This study’s decision variables included the distribution of allocated wind power in different regions, the capacities of tie lines, and the CAESS operational bounds, which included charging and discharging limit features. These components enable the optimization of generation expansion planning for renewables. The dependent variable due to these decisions included the CC and other reliability indicators like the LOLE and the energy balance stability in the network. All these elements must be integrated to develop a reliable and economical power system with many renewable energy sources.

2.3. Assumptions

This research rested on two foundational assumptions to simplify and prioritize it. The first was the assumed constant rate of 6% annual growth in load over all regions and a steady though moderate growth in electricity demand over a time horizon. This assumption allowed the model to test the system’s capacity value under realistic though manageable demand growth conditions. Secondly, CAESS efficiency was taken as 100% (ideal) both while charging and discharging.

2.4. System Configuration

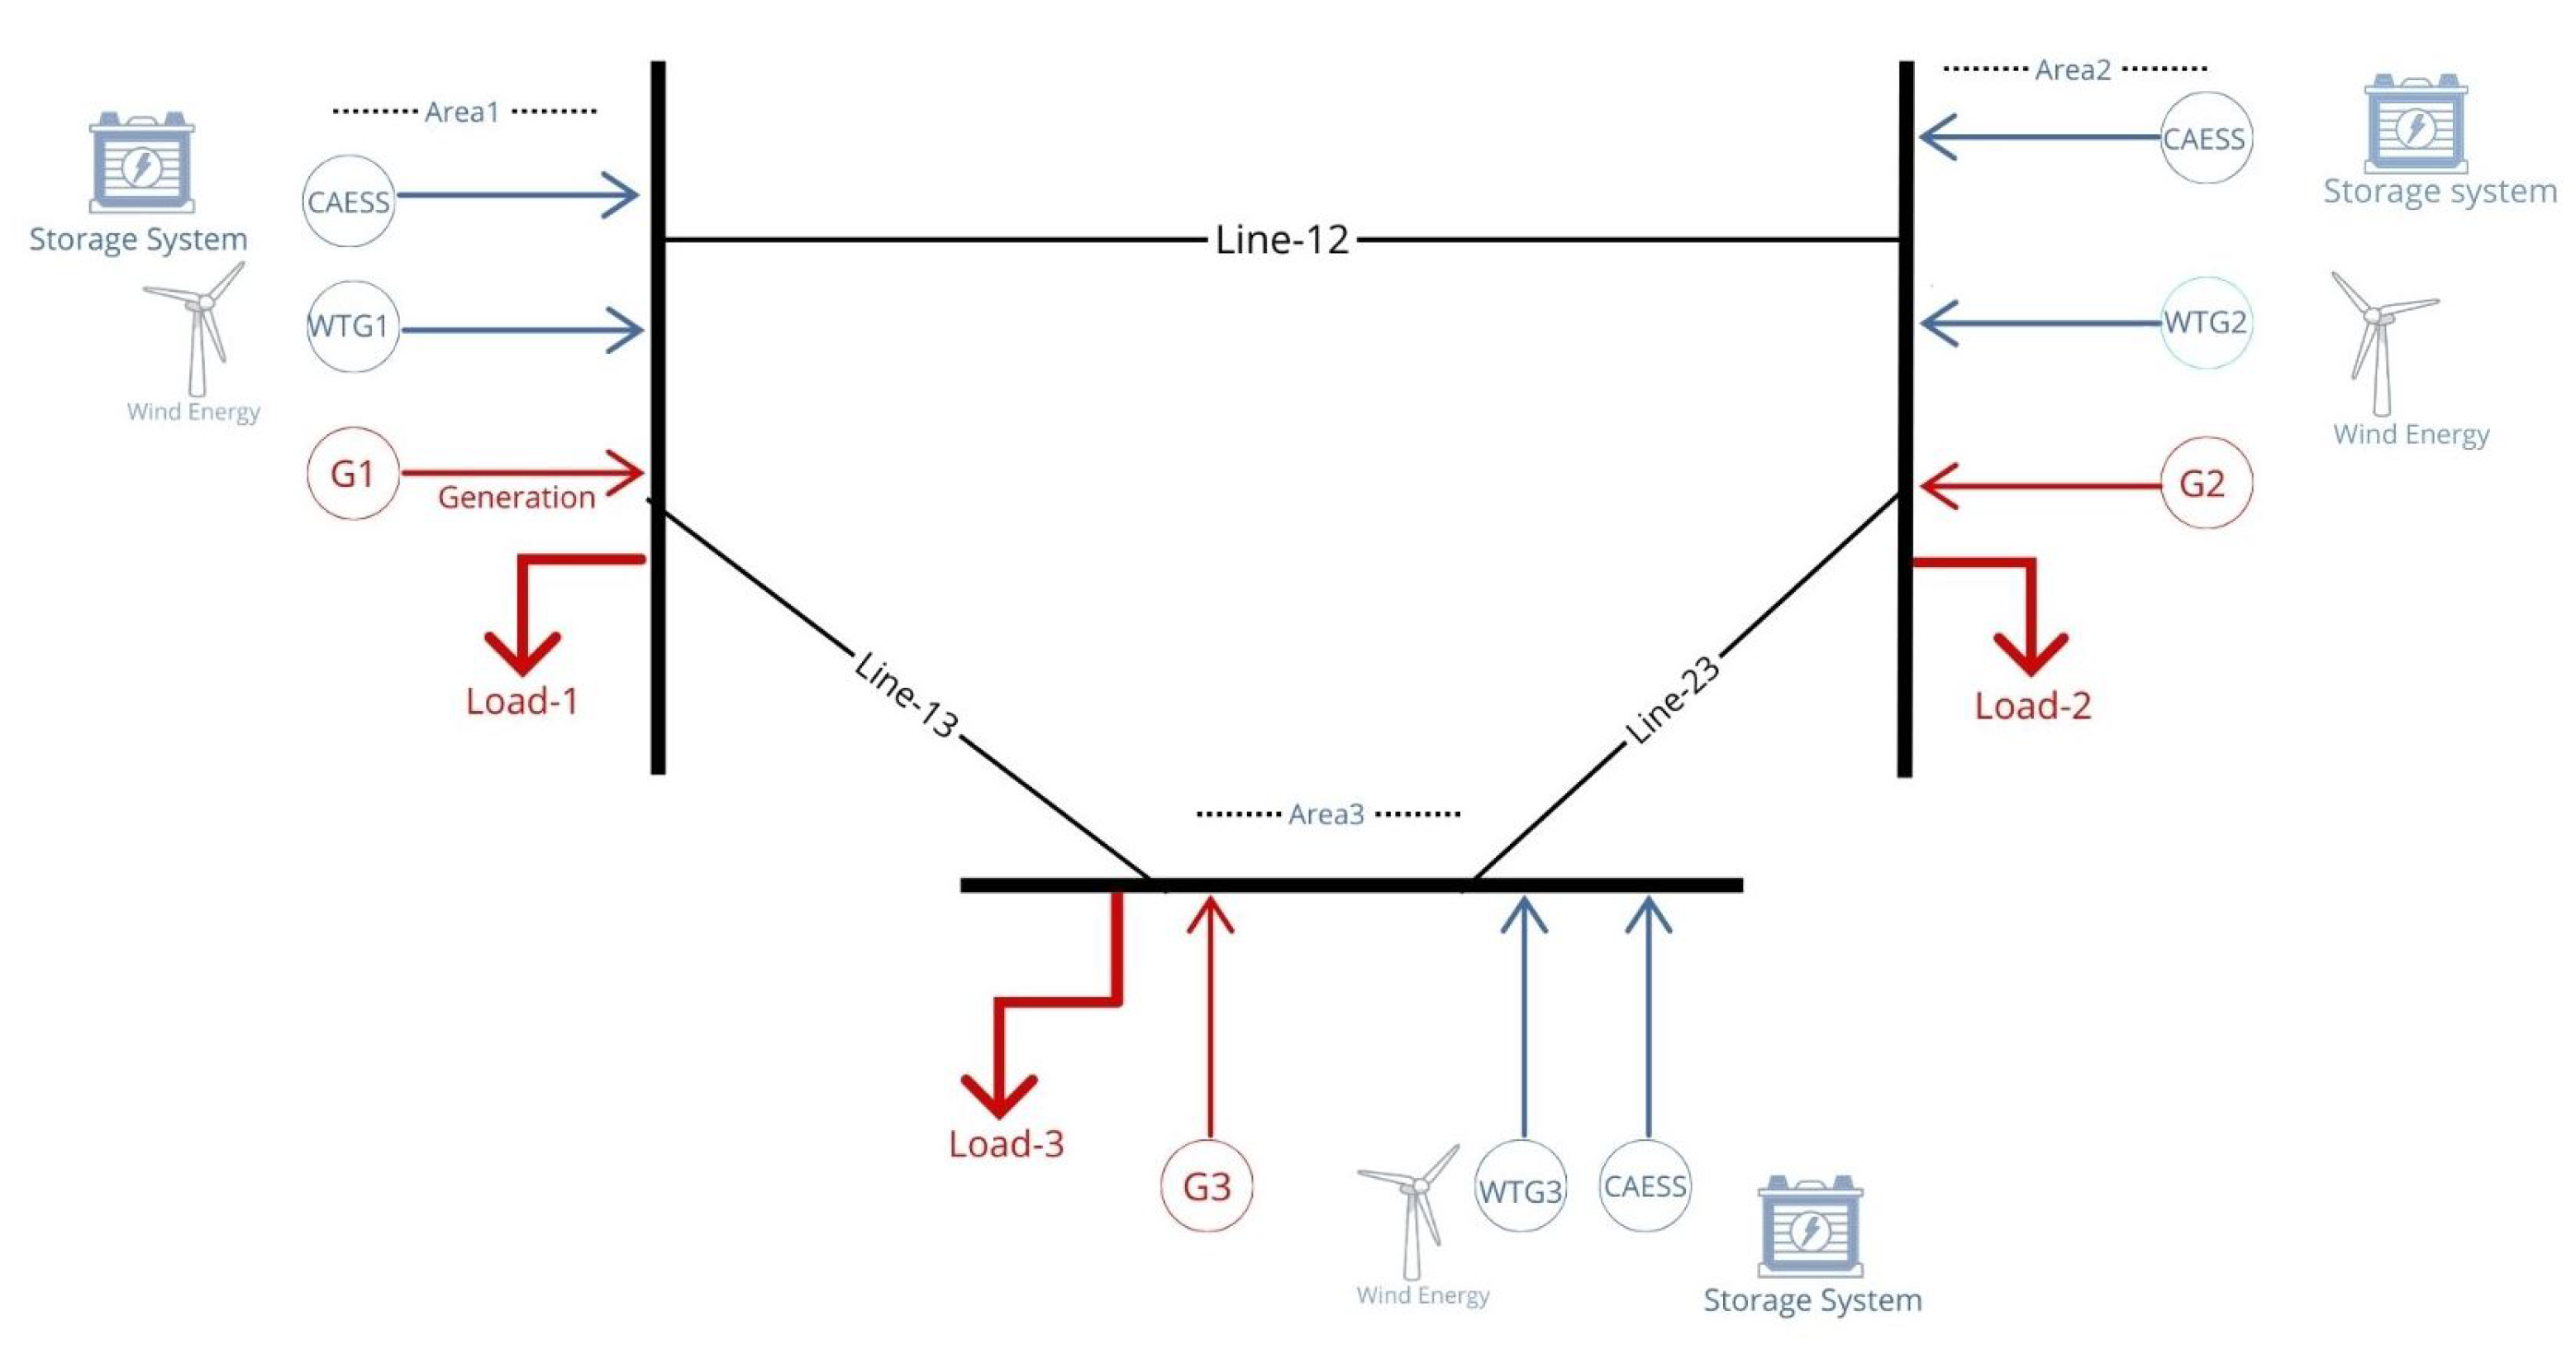
The system under study was a multi-area power system, with each area having a conventional power plant and a unique load profile, as shown in Figure 1. Tie lines connected all the regions, allowing for power exchange between them. Additionally, each area was assigned a specific wind profile. This system underwent generation expansion planning to assess the effects of allocating wind power across multiple regions on capacity credit.

2.5. Load Model

The load, a primary component of a power system, is a stochastic process that is difficult to describe with a simple mathematical formula [50]. This study focused on a multi-area power system, a critical area of research planning optimization [51]. Given the importance of the multi-area power system under study, different hourly chronological load profiles were assigned for each area. One area’s hourly chronological load profile was derived from the Reliability Test System (RTS) load data [52]. The load data for the other areas were taken from the Belgium Electricity Operator, available on their website (ELIA) [53].

2.6. Wind Model

The chronological model necessitated hourly chronological load data in conjunction with wind data. Consequently, the wind samples utilized in this investigation were obtained from the NREL/3TIER website for various regions. These datasets have hourly wind power measurements for several stations across the USA. The wind data from the NREL/3TIER website [48], part of the WWSIS dataset [49], cover 2004–2006 at a 10 min resolution, modeled with the WRF mesoscale model over 4 million km2 at 2 km resolution. Wind speed at 100 m, among other parameters, was processed into hourly power outputs for synthetic 30 MW projects, averaged to 8760 h per area.

2.7. Compressed-Air Energy Storage System (CAESS)

This study followed the generation expansion planning framework, incorporating CAESS operation. Thus, a model was developed for the CAESS to improve the reliability and capacity credit of renewable energy sources, especially wind power. The system operated in two modes: charging (compressing air) when there was excess wind energy availability and discharging (expanding air) to produce electricity at times of high energy demand. The incorporation of a CAESS into a multi-area power system enabled the storage of surplus wind energy during low-wind periods, thereby flattening the power supply curve.
The model evaluated the effectiveness of the CAESS in reducing the loss of load expectation (LOLE) and heightening the capacity credit ratio in the total system. In order to achieve a minimum loss of load expectation index, different decision factors such as charging and discharging rates of the CAESS and allocation of stored energy in varying regions were modified. This adaptation ensured the system optimally contributed to the LOLE while minimizing energy losses, hence enhancing the efficiency and reliability of integrated wind power systems. The capacity and power limits of the CAESS affect the CC via modifying storage and dispatch flexibility. Increased CAESS capacities above 50 MWh and raised power limits beyond 25 MW could optimize energy management and increase the CC; nevertheless, they are constrained by system load and interconnections. These effects were not studied here but are proposed for future research.

3. Problem Formulation

To optimize the placement and size of Wind Turbine Generators (WTGs) with proper CAESS assistance, a chronological planning framework was developed [54]. The objective was to maximize the capacity credit for the expansion project and guarantee the power network’s appropriate reliability standards.

3.1. Deterministic Model Formulation

Traditional expansion strategies primarily focus on minimizing costs, as resources and power generation are fully managed and regulated. On the other hand, WTGs’ renewable power generation is reliant on the environment, necessitating extra thought while setting up wind power systems. Therefore, we suggest creating an objective function for the system’s capacity credit that takes into consideration the need for a steady, reliable power supply as well as reliability standards related to wind power installation. A deterministic method was used to generate the network dynamics. The representation of the objective function is as follows:
Maximize C C
The model’s objective is to maximize the total system capacity credit (CC), which represents the effective additional load the system can support due to the integration of wind power. The total capacity credit is the sum of the individual area credits, as defined in Equation (2). This process involves determining the additional load ( Δ D i ) required to be met in area i after n year, along with the potential wind capacity (WC) that area i can contribute toward new generation installations, as described in (3).
C C = i = 1 I C C i
C C i = Δ D i W C × 100
x i is the decision variable representing the installed capacity of wind power in area i. Constraint (4) shows that the wind capacity x i in each area is limited to an upper limit α i due to several conditions, such as environmental conditions or social concerns. Equation (5) defines the magnitude of wind generation required to add to the current power plant in order to satisfy the growing demand, with WC representing the decision variable for the potential wind capacity installation size.
0 x i α i
i = 1 I x i = W C
The CAESS could operate in either charge mode ( α c h ) or discharge mode ( α d s ) using a binary variable (6). The maximum charging and discharging power of the CAESS was limited by the power constraints in Equations (7) and (8), respectively. Similarly, the energy capacity of the CAESS was determined by taking into account the charging efficiency ( η c h ) and discharging efficiency ( η d s ) of the CAESS as given in (9). The energy constraint in (10) was also implemented in the CAESS.
α c h i t + α d s i t 1
0 P c h i t P c h m a x × α c h i t
0 P d s i t P d s m a x × α d s i t
E i t = E t 1 i + P c h i t × η c h 1 η d s × P d s i t
E i t m i n = E i t E i t m a x
Equation (11) represents the hourly loss of the system’s load probability after adding the wind power plant in area i. Equation (12) indicates the loss of load expectation of the system that encompasses both types of generation: conventional and wind. The constraint given in (13) underscores the importance of the reliability level requirement in meeting the additional load through new wind generation. The constraint in (14) enforces each area’s power flow with tie-line capacity. In Equation (15), the conventional hourly power is confined to the conventional capacity of each area. However, the constraint shown in (16), a crucial aspect, is vital to maintaining the wind power capacity’s penetration at an acceptable level of the existing conventional power capacity.
L O L P t W D t = P r ( C k ( ω i t × x i + q i t P c h i t + P d s i t f i j t + f j i t ) ( D t i + Δ D i ) i I , t T , j J
L O L E W D ( i ) = t = 1 T L O L P t W D t i I , t T
L O L E W D ( i ) = L O L E G E N ( i ) i I , t T
F i j f i j t F i j i I , t T , j J
0 q i t I C i I , t T , j J
0 W C P N
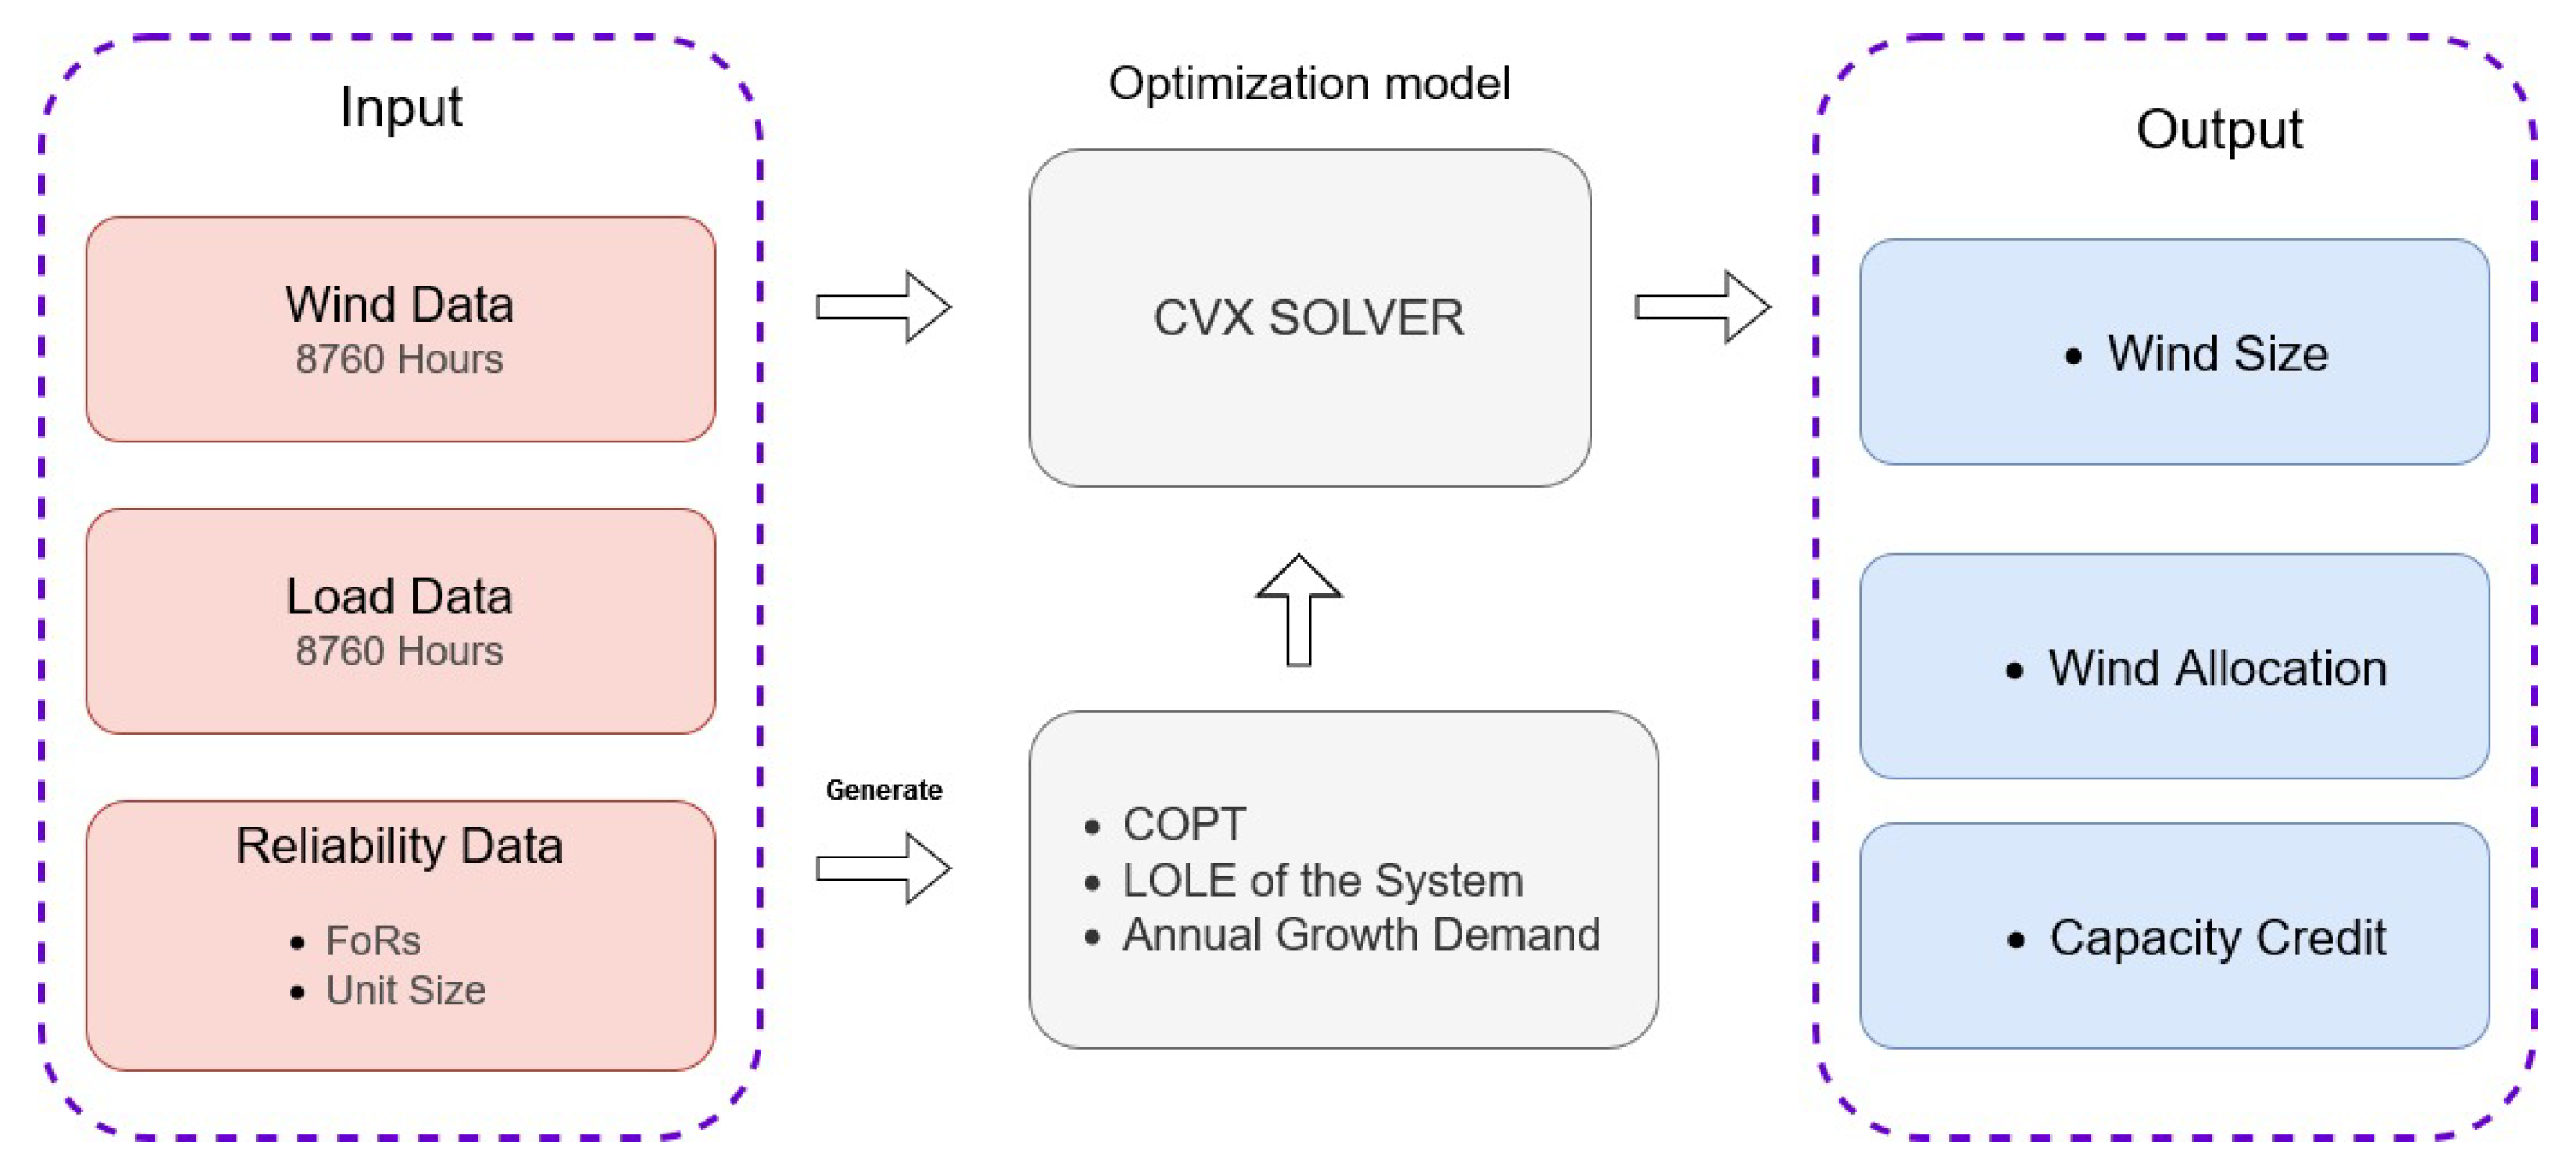
The deterministic optimization problem of maximizing CC under the constraints (1)–(16) was solved through mixed-integer linear programming (MILP) using the CVX toolbox in the MATLAB software environment (R2019b) with the Gurobi solver. CVX is a high-level modeling framework for convex optimization, and Gurobi is a state-of-the-art commercial solver for linear and mixed-integer programs. The algorithm was composed of three processes: (1) formulating the linear objective function and constraints (1)–(16) with binary variables ( α c h i t , α d s i t ) to enforce exclusive CAESS modes, (2) inputting the system data and reliability metric, and (3) solving the MILP using CVX to find optimal wind allocations and total wind capacity.

3.2. Fuzzy Optimization

Fuzzy set theory is a primary technique for addressing uncertainty in optimization problems. Fuzzy optimization converts objectives and constraints into satisfaction functions based on fuzzy sets. In this framework, the fuzzy inputs are the wind power data and the capacity credit limits, while the output is the satisfaction level ( λ ), representing the optimized capacity credit.
To further clarify the fuzzy optimization framework, the following summarizes the model’s inputs, outputs, and implicit rule structure. In the fuzzy optimization model, the uncertain wind power generation and the capacity credit (CC) objective are represented as fuzzy variables with corresponding membership functions. The inputs to this fuzzy model are the wind power data (for each area) and the planner’s specified capacity credit bounds, while the output is the overall satisfaction level λ (the membership grade of the solution). The fuzzy logic rules in this context are defined implicitly by the membership function bounds and their if–then structure.
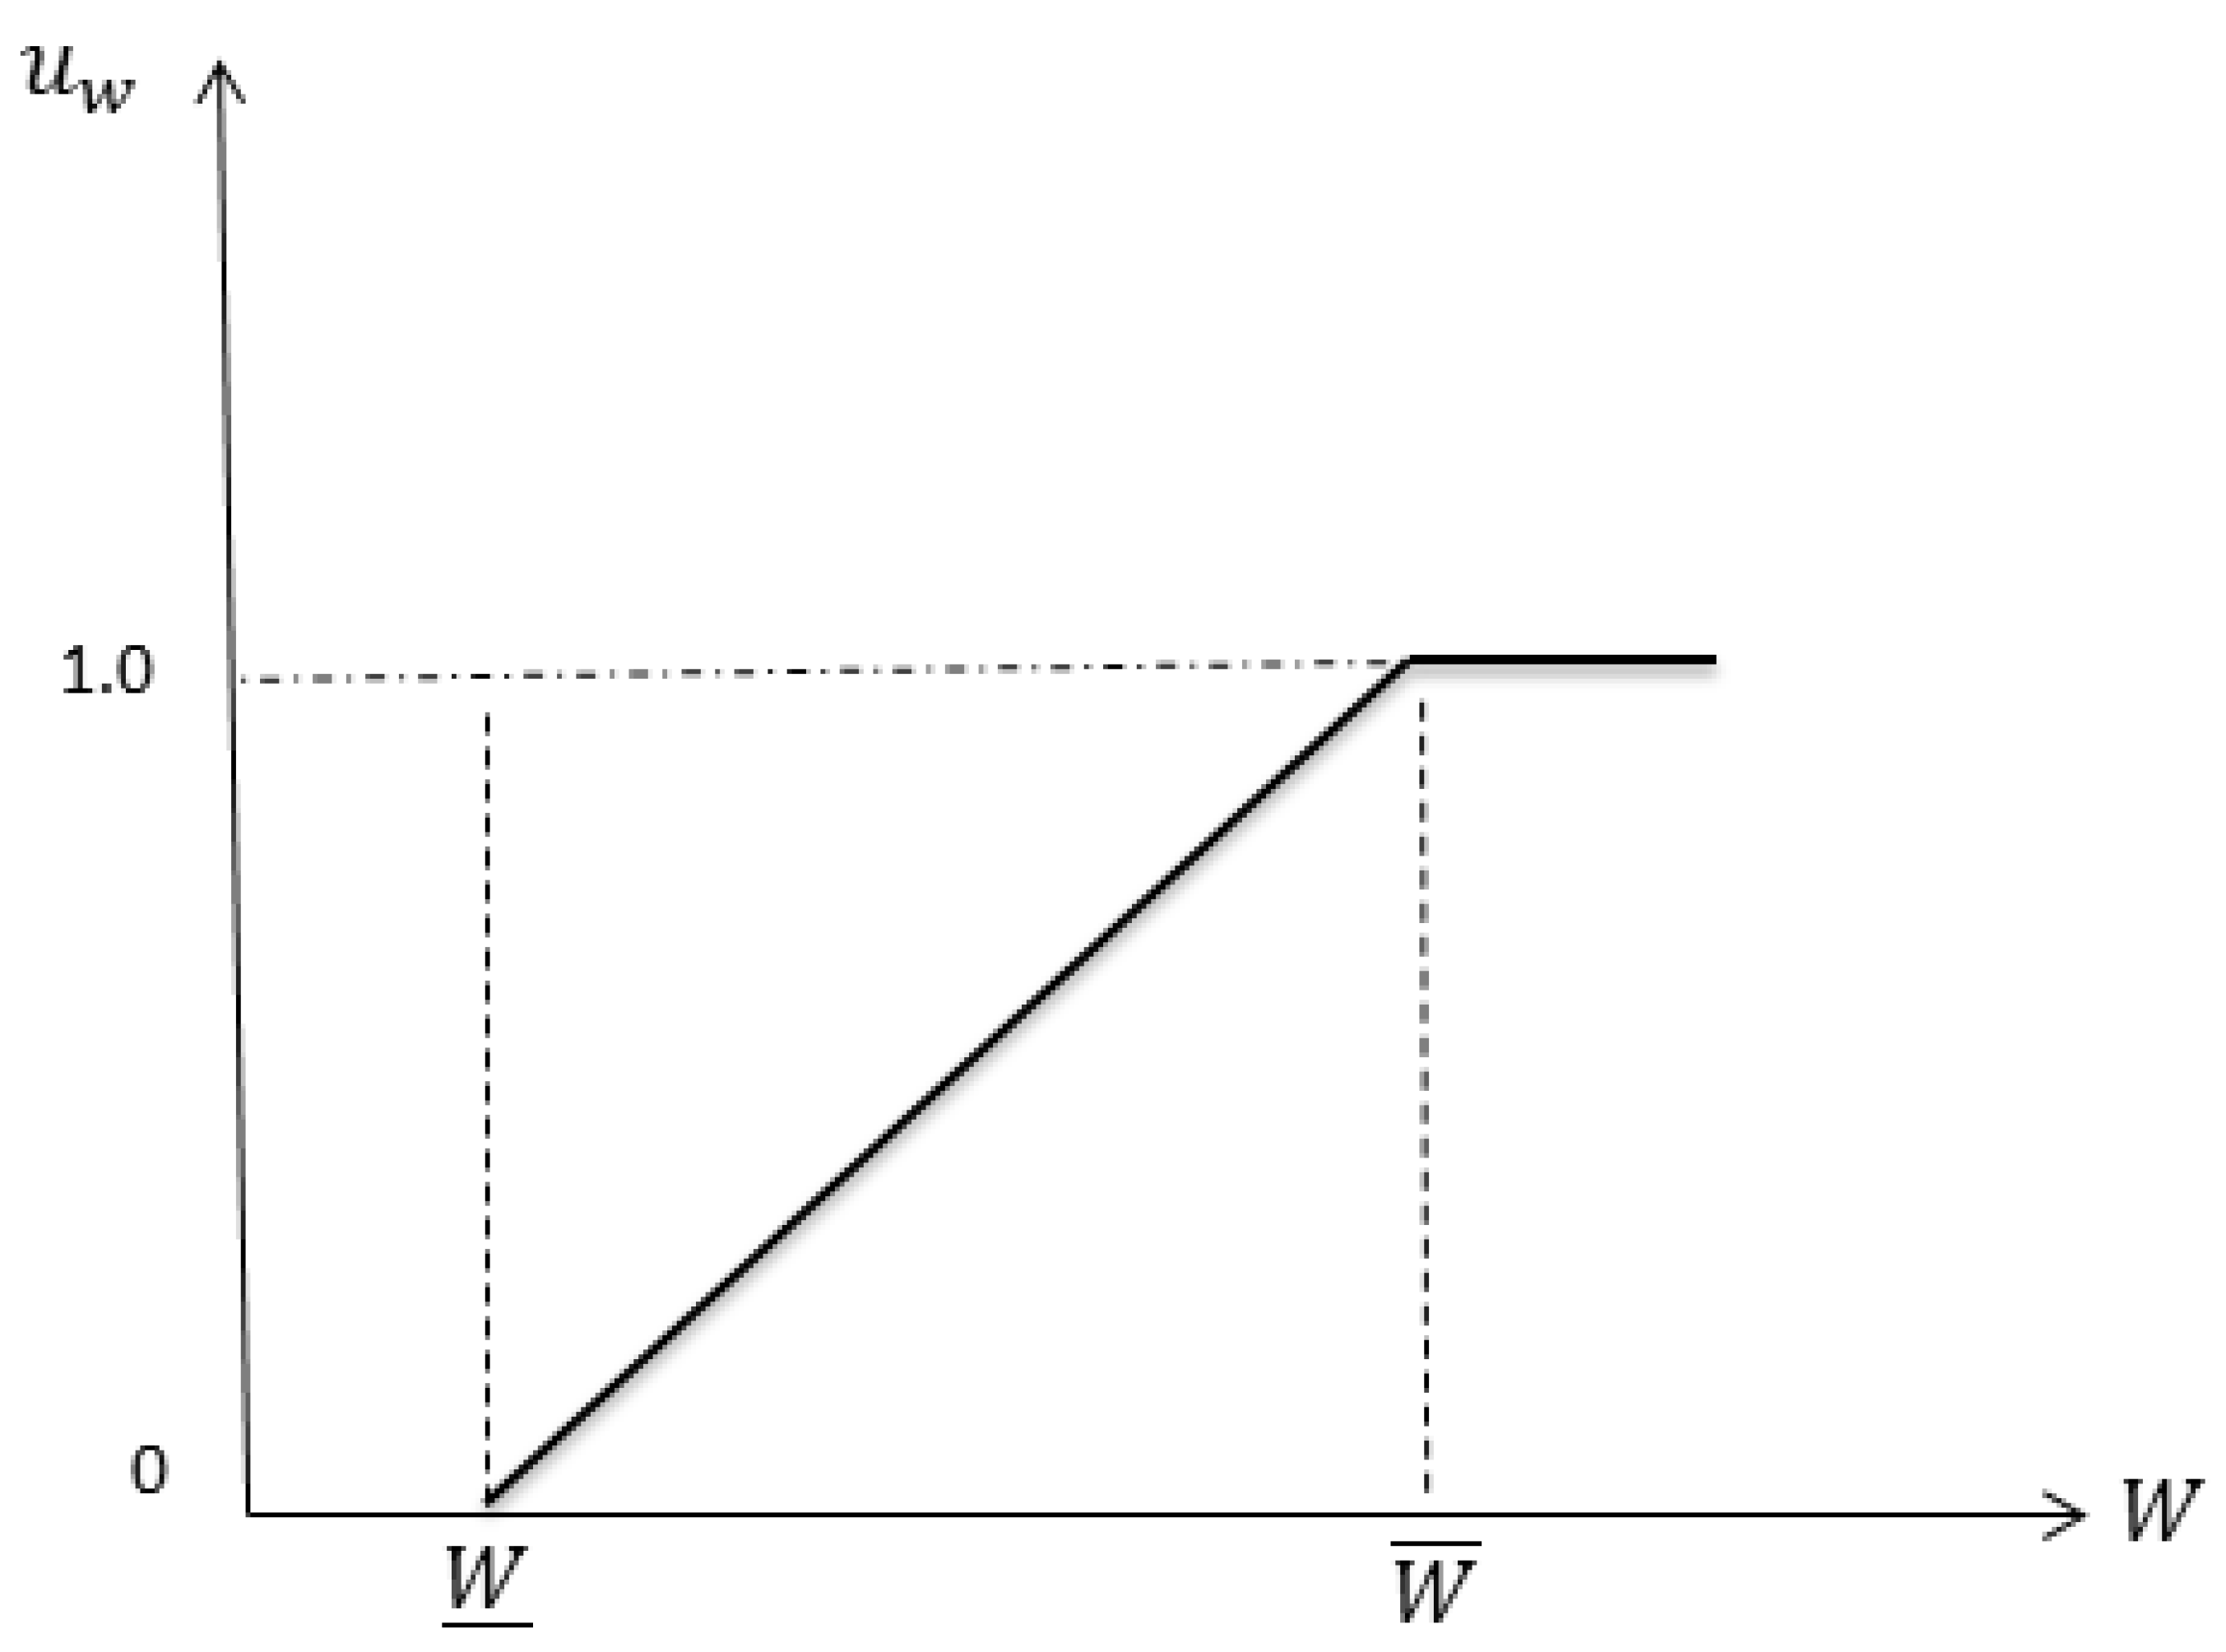
For example, wind power availability in each area is described by a triangular membership function based on a worst-case minimum and a best-case maximum output. This corresponds to rules such as: if the wind generation in an area is at or below the minimum expected level (worst case), its membership u ω is 0, whereas if it is at or above the maximum expected level, u ω is 1, with partial membership for intermediate values.
These fuzzy rule structures, combined with the use of the minimum operator to aggregate all fuzzy conditions (i.e., requiring all fuzzy objectives and constraints to be satisfied at least to degree λ ), ensure that the optimization robustly accounts for wind uncertainty.
The standard form of an optimization problem is presented as follows:
M a x i m i z e f ( x , ϵ , α )
subjected to
g i ( x , ϵ , α ) i = 1 , , m
h j ( x , ϵ ) j = 1 , , p
where f ( x , ε , α ) denotes the objective function, and g i ( x , ε , α ) represents the i-th constraint function incorporating both uncertain parameters, collected in the vector α , and deterministic parameters ε . Additionally, h j ( x , ε ) denotes the j-th constraint function that depends exclusively on deterministic parameters. Uncertainty is neglected in a deterministic optimization problem, and the data are considered certain. The problem mentioned can be reformulated in fuzzy optimization as follows:
M a x i m i z e λ
λ = m i n ( u f , u g 1 , , u m )
The newly introduced variable λ represents the membership grade associated with the solution. The min operator is employed to evaluate the minimum among the satisfaction levels, where u f and u g i denote the membership functions of the objective function f and the i-th fuzzy constraint, respectively.

3.2.1. Fuzzy Objective Model

The objective function of the proposed GEP optimization problem was to maximize the total capacity credit. This means that we sought to optimize the fuzzy set of the CC, and it was represented as follows:
C C ˜ = [ C C , u c c ] , CC ̲ C C CC ¯
Equation (23) expresses the membership function of the objective function “CC” as an inequality constraint.
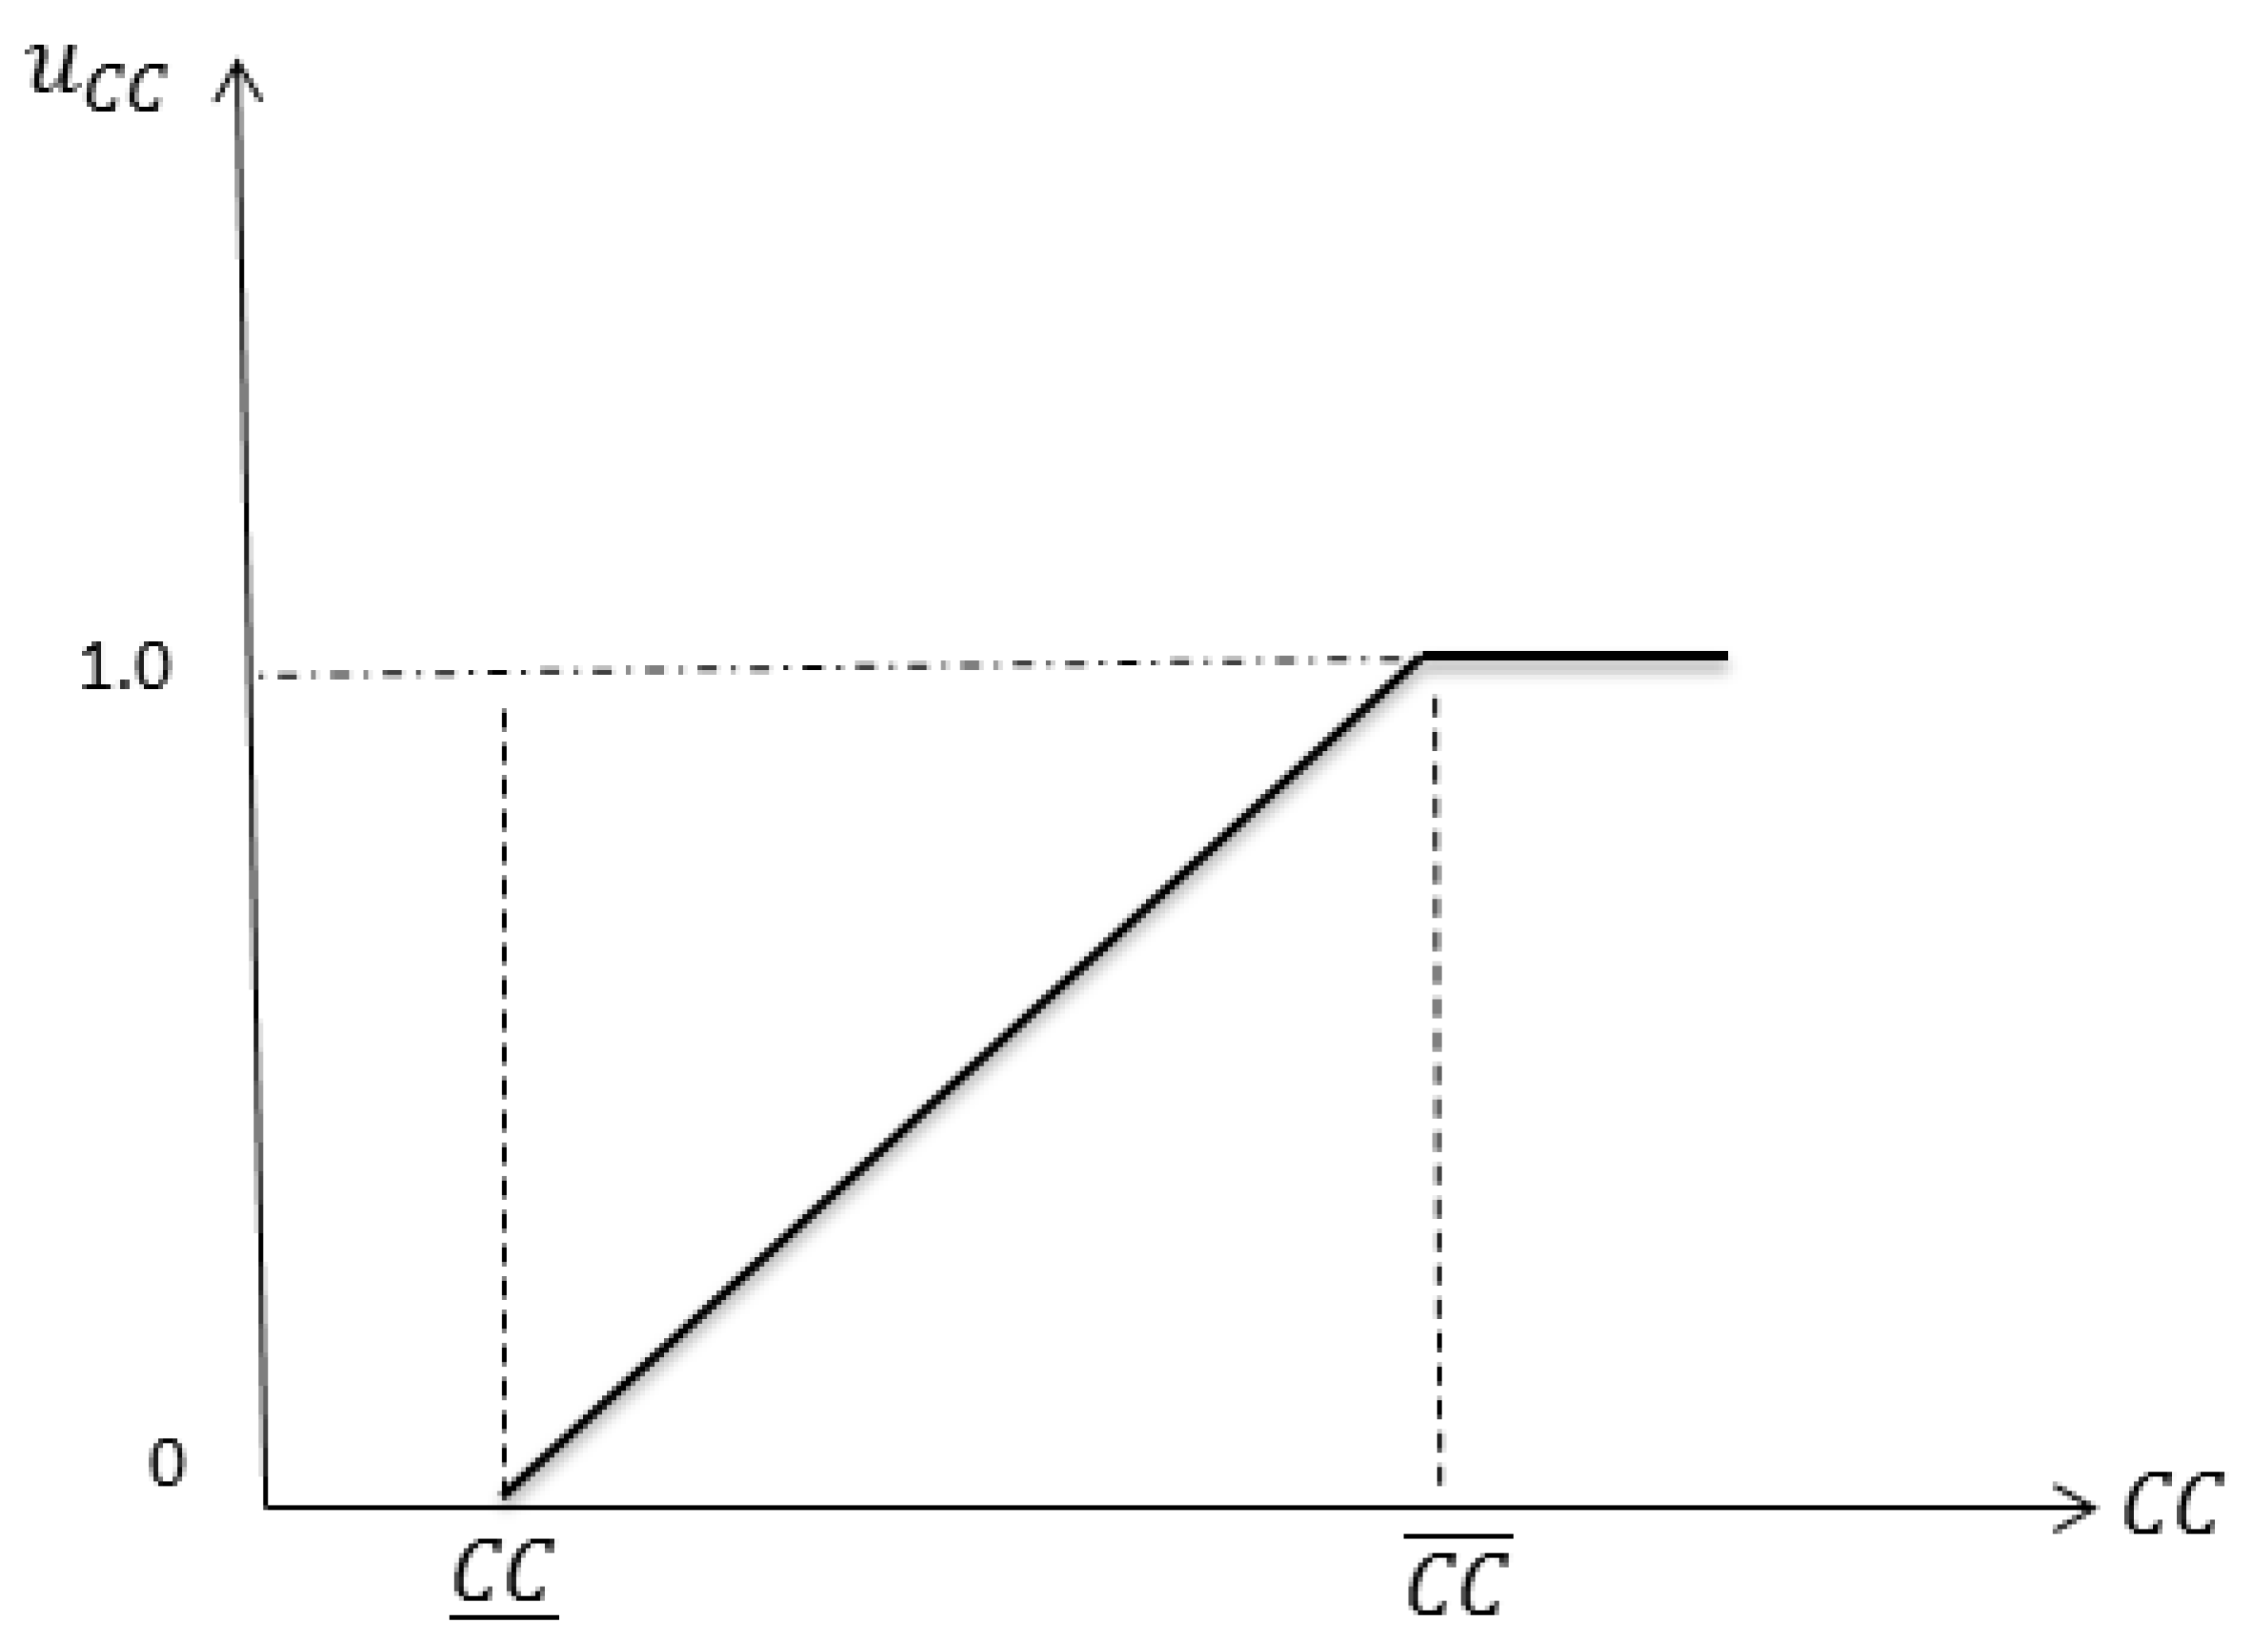
u c c = 0 C C CC ̲ C C CC ̲ CC ¯ CC ̲ CC ̲ C C CC ¯ 1 C C CC ¯
The value of the CC was determined using a deterministic model. The power system planner set the upper limit CC ¯ and the lower limit CC ̲ . In the fuzzy model, the deterministic objective function was treated as a constraint. This means that the membership function of the CC became a fuzzy constraint in Equation (24). The membership function of the CC is illustrated in Figure 2.
λ u C C = C C CC ̲ CC ¯ CC ̲
λ × ( CC ¯ CC ̲ ) ( C C CC ̲ )

3.2.2. Fuzzy Model of Wind Power

The fuzzy optimization model included consideration for the variability in wind power. This was achieved through the construction of a fuzzy model for wind power, denoted as ( ω ) , which was represented as follows:
ω ˜ = [ ω , u ω ] , ω ̲ ω ω ¯
The membership function for the wind power data is shown in (26):
u w = 0 ω ω ̲ ω ω ̲ ω ¯ ω ̲ ω ̲ ω ω ¯ 1 ω ω ¯
The power system planner has the flexibility to determine the values of ω ¯ and ω ̲ . These values are crucial in converting the membership function into a fuzzy constraint, as demonstrated in Equation (27). The membership function of the wind power data is illustrated in Figure 3.
λ × ( ω ¯ ω ̲ ) ( ω ω ̲ )
This work used a triangular membership function (MF) for wind power, defined in (26), since it is appropriate for capturing wind energy uncertainty. Wind speed variability was reflected in the 13.2% average MAPE across areas as listed in Table 2. The triangular MF’s linear interpolation accurately represented this gradual transition, striking a balance between computational simplicity and precision, in contrast to trapezoidal membership functions, which presumed flat uncertainty plateaus, or Gaussian membership functions, which suggested unbounded tails and required complex exponential computations. This decision was necessary for a practical, planner-specified range, improving CC estimation under realistic wind variations.

3.2.3. Complete Fuzzy Model of Proposed GEP

M a x i m i z e λ
Subjected to: (1)–(15), (24), (27).
In contrast to the deterministic formulation, the fuzzy model incorporated a revised objective function and merely two further constraints.

4. Case Study

A case study was developed that focused on a chronological model designed to enhance the generation capacity of an existing power system. This study also examined the effects of the allocation of wind energy across multiple regions on the reliability of existing power systems, evaluating both the deterministic model and the fuzzy model to evaluate their effectiveness in addressing uncertainties and optimizing system performance.

4.1. Deterministic Model

The chronological model created to increase the power system’s generating capacity was comprehensively investigated using a case study. The effect of distributing wind power across various regions on wind power’s capacity credit was examined. The impact of CAES on the capacity credit was also investigated. The deterministic model was assessed in this examination without taking uncertainty into account.

4.1.1. System Configuration

Three regions of the electric power system were examined comprehensively, all interconnected by tie lines, as illustrated in Figure 4. Each area had its conventional power capacity, specific wind profile, and load, as listed in Table 3. Tie lines connected each area with capacities shown in Table 4.
The three-area power system was selected for this study since it could significantly represent multi-area power systems with varying generation capacity, load characteristics, and wind resource characteristics in each area. The structure of the system allowed for the investigation of the impact of wind power allocation across multiple interconnected areas and the assessment of the contribution of tie-line capacity to system reliability. Further, it reflected the practical concerns of power systems, such as the geographic diversity of wind resources and the need for coordinated generation expansion planning.

4.1.2. System Parameters and Data

Since the demand for power systems increases annually, an annual load increase of 6% was assumed for all areas to simulate system demand growth over one year. Wind data were obtained from the NREL website. The available data measured wind power generation every hour for one year across three different locations. The CAESS model took the most significant parameters from Table 5 such as a maximum charging and discharging compressor power of 25 MW and a tank volume implicitly set by a 50 MWh capacity, and energy conversion efficiencies at 100%. The 25 MW power of the compressor was consistent with traditional CAESS configurations and balanced responsiveness with the system’s 560–751 MW conventional capacities. The 50 MWh tank capacity, based on realistic storage needs, supported hourly wind variability reduction. The reliability data for the generating units were sourced from the IEEE-RTS system. These data included unit size, number of units, and forced outage rate. Based on these data, the capacity outage probability table (COPT) was calculated. Table 6 meticulously arranges and lists all areas’ generating units’ reliability data.

4.1.3. Case Study Scenarios

Three scenarios were generated and tested to compare with optimal wind power allocation. This allowed us to see each scenario’s impact on the capacity credit and the superiority of allocating wind power among multiple areas using the proposed GEP model.
  • Base case: estimated the original system’s reliability to find the original system’s LOLE.
  • Scenario 1: Even distribution in Areas 1 and 2; wind capacity is evenly divided (163 MW each), with no wind in Area 3. We examined the effect on capacity credit (CC).
  • Scenario 2: even distribution in Areas 2 and 3; 163 MW of wind capacity in each area with no wind in Area 1.
  • Scenario 3: even distribution across all areas; each area received an equal share of 109 MW of wind capacity.
  • Optimal case: In the optimal case, wind capacity allocation was optimized to maximize the capacity credit (CC). After successfully solving the optimization problem using the CVX toolbox, the results indicated the following allocations: 44 MW for Area 1, 147 MW for Area 2, and 135 MW for Area 3.

4.1.4. Findings and Discussion

  • Base case reliability assessment
Since the demand for power systems increases annually, the percentage of annual demand increases, and the number of years in the study for expansion power generation needs to be defined. First, the reliability data of the original system, followed by pre-expansion with a 6% load increase (after one year), were calculated. The new peak load is listed in Table 7. The reliability assessment of the original system for pre-expansion with and without the 6% load increase is shown in Table 8.
The results show that the loss of load expectation (LOLE) increased due to the 6% annual growth rate applied to each region’s peak load over the one-year study period, as shown in Table 7. Figure 5 shows the system’s original reliability and reliability curves after one year with a new peak load.
2.
Impact of wind power allocation
Three scenarios were arranged and studied for comparison with optimal wind power distribution. This methodology permitted an assessment of the influence exerted by each scenario on the capacity credit and the realization of the advantages that arose from geographically distributed wind power. The results of the scenarios were as follows: Scenario 1 attained a CC of 16%, Scenario 2 attained a CC of 19%, and Scenario 3 attained a CC of 24%.
For the optimal case, CVX, a popular MATLAB R2019b modeling framework used for convex optimization problems, solved the optimization problem and determined the size of the new wind generation needed to satisfy demand. The optimal distribution of wind power among three regions was determined according to the maximum capacity credit. The flowchart in Figure 6 illustrates the entire process. A capacity credit of 29.3% was achieved, demonstrating the benefit of strategic wind power distribution with 326 MW total installed wind capacity as shown in Table 9 and Table 10. Figure 7 illustrates the enhancement of the optimal wind distribution’s reliability curve compared to the other scenarios with the same wind power installation.
The CC variations between scenarios pointed out the impact of wind allocation. Scenario 1 (16%) did not include Area 3, thus restricting load support. Scenario 2 (19%) did not include Area 1, thus not tapping its potential. Scenario 3 (24%) distributed 109 MW across all areas, enhancing diversity without optimality. The optimal case (29.3%) distributed greater amounts to Areas 2 and 3 (147 MW, 135 MW), with Area 1’s 44 MW allocation reflecting its reduced load (471.7 MW). Efficiency was a result of the overlap of wind with capacity and load, augmented by wind profile variability and tie-line flexibility.
3.
Impact of CAESS integration
Implementing the CAESS in the optimal scenario increased the CC to 35%, significantly enhancing the system’s ability to handle variable wind power. Thus, it directly contributed to the study’s aim of maximizing capacity credit while maintaining reliability. The result is demonstrated in Table 11. Increasing the volume and power could enhance the CC by improving storage and dispatch flexibility. Optimizing these factors may necessitate balancing capacity with wind variability and cost, which is left for future study.
Regarding the optimal wind allocation, we can conclude that distributing wind among multiple areas maximized the capacity credit, which was around 29.3%. Furthermore, the capacity credit became 35% after using the CAESS as listed in Table 11 and Table 12. Consequently, the power system planner will have a clear vision of the best use of renewable resources and can obtain the maximum benefit. The findings underscore the significance of our contributions:
  • Capacity credit optimization: we proposed a capacity-credit-centric approach that explicitly tackled the issues arising from renewable integration.
  • CAESS’s advantage: we showed that storage systems could overcome issues related to integrating renewable energy sources.
  • Optimal wind allocation and policy implications: distributing wind power optimally across interconnected areas maximized capacity credit, minimized the system’s loss of load expectation (LOLE), and enhanced the system’s resilience and reliability.
The proposed model practically allows system operators to measure how much wind and storage contribute to overall capacity using ELCC, aiding capacity procurement and reliability planning. Policymakers can leverage these findings to develop incentives or planning strategies that acknowledge the reliability benefits of renewable integration.

4.1.5. Sensitivity Analysis

This section is dedicated to a thorough investigation of the impact of tie-line capacity on CC and the correlation of wind resources between the areas. This investigation is paramount for understanding the dynamics of power systems and their planning and operation. The system’s line capacity, serving as a base case, is pivotal in testing the effectiveness of changing the transmission line capacity on the wind power plant’s capacity credit. This test is of significant importance, as it demonstrates the sensitivity of line capacity, as shown in Figure 8, thereby enhancing our understanding of the system’s dynamics. The x-axis represents tie-line capacity as a percentage of the base case scenario, where each increment or decrement reflects the variation in power transfer capabilities between areas. The y-axis (left) illustrates the total wind power capacity (WC) that can be integrated into the system and measured in MW. As the tie-line capacity increases, the system hosts more wind power due to increased power transfer abilities. The y-axis on the right shows the capacity credit, CC, as a percentage of WC and demonstrates that increasing tie-line capacity generally increases the CC due to the added flexibility in the flow of power, allowing excess wind power from one area to support demand in another. Curves (x1), (x2), and (x3) are the wind allocations for Areas 1, 2, and 3, respectively, and are observed to change dynamically with a change in the tie-line capacity.
As a result, expanding the capacity of transmission lines maximizes the capacity credit, due to the adaptability of power flow, as it enables the transfer of greater power from regions with surplus wind energy or diminished power demand. L23 (45 MW) likely has a larger impact due to Area 3’s high wind allocation, but optimization requires further study.
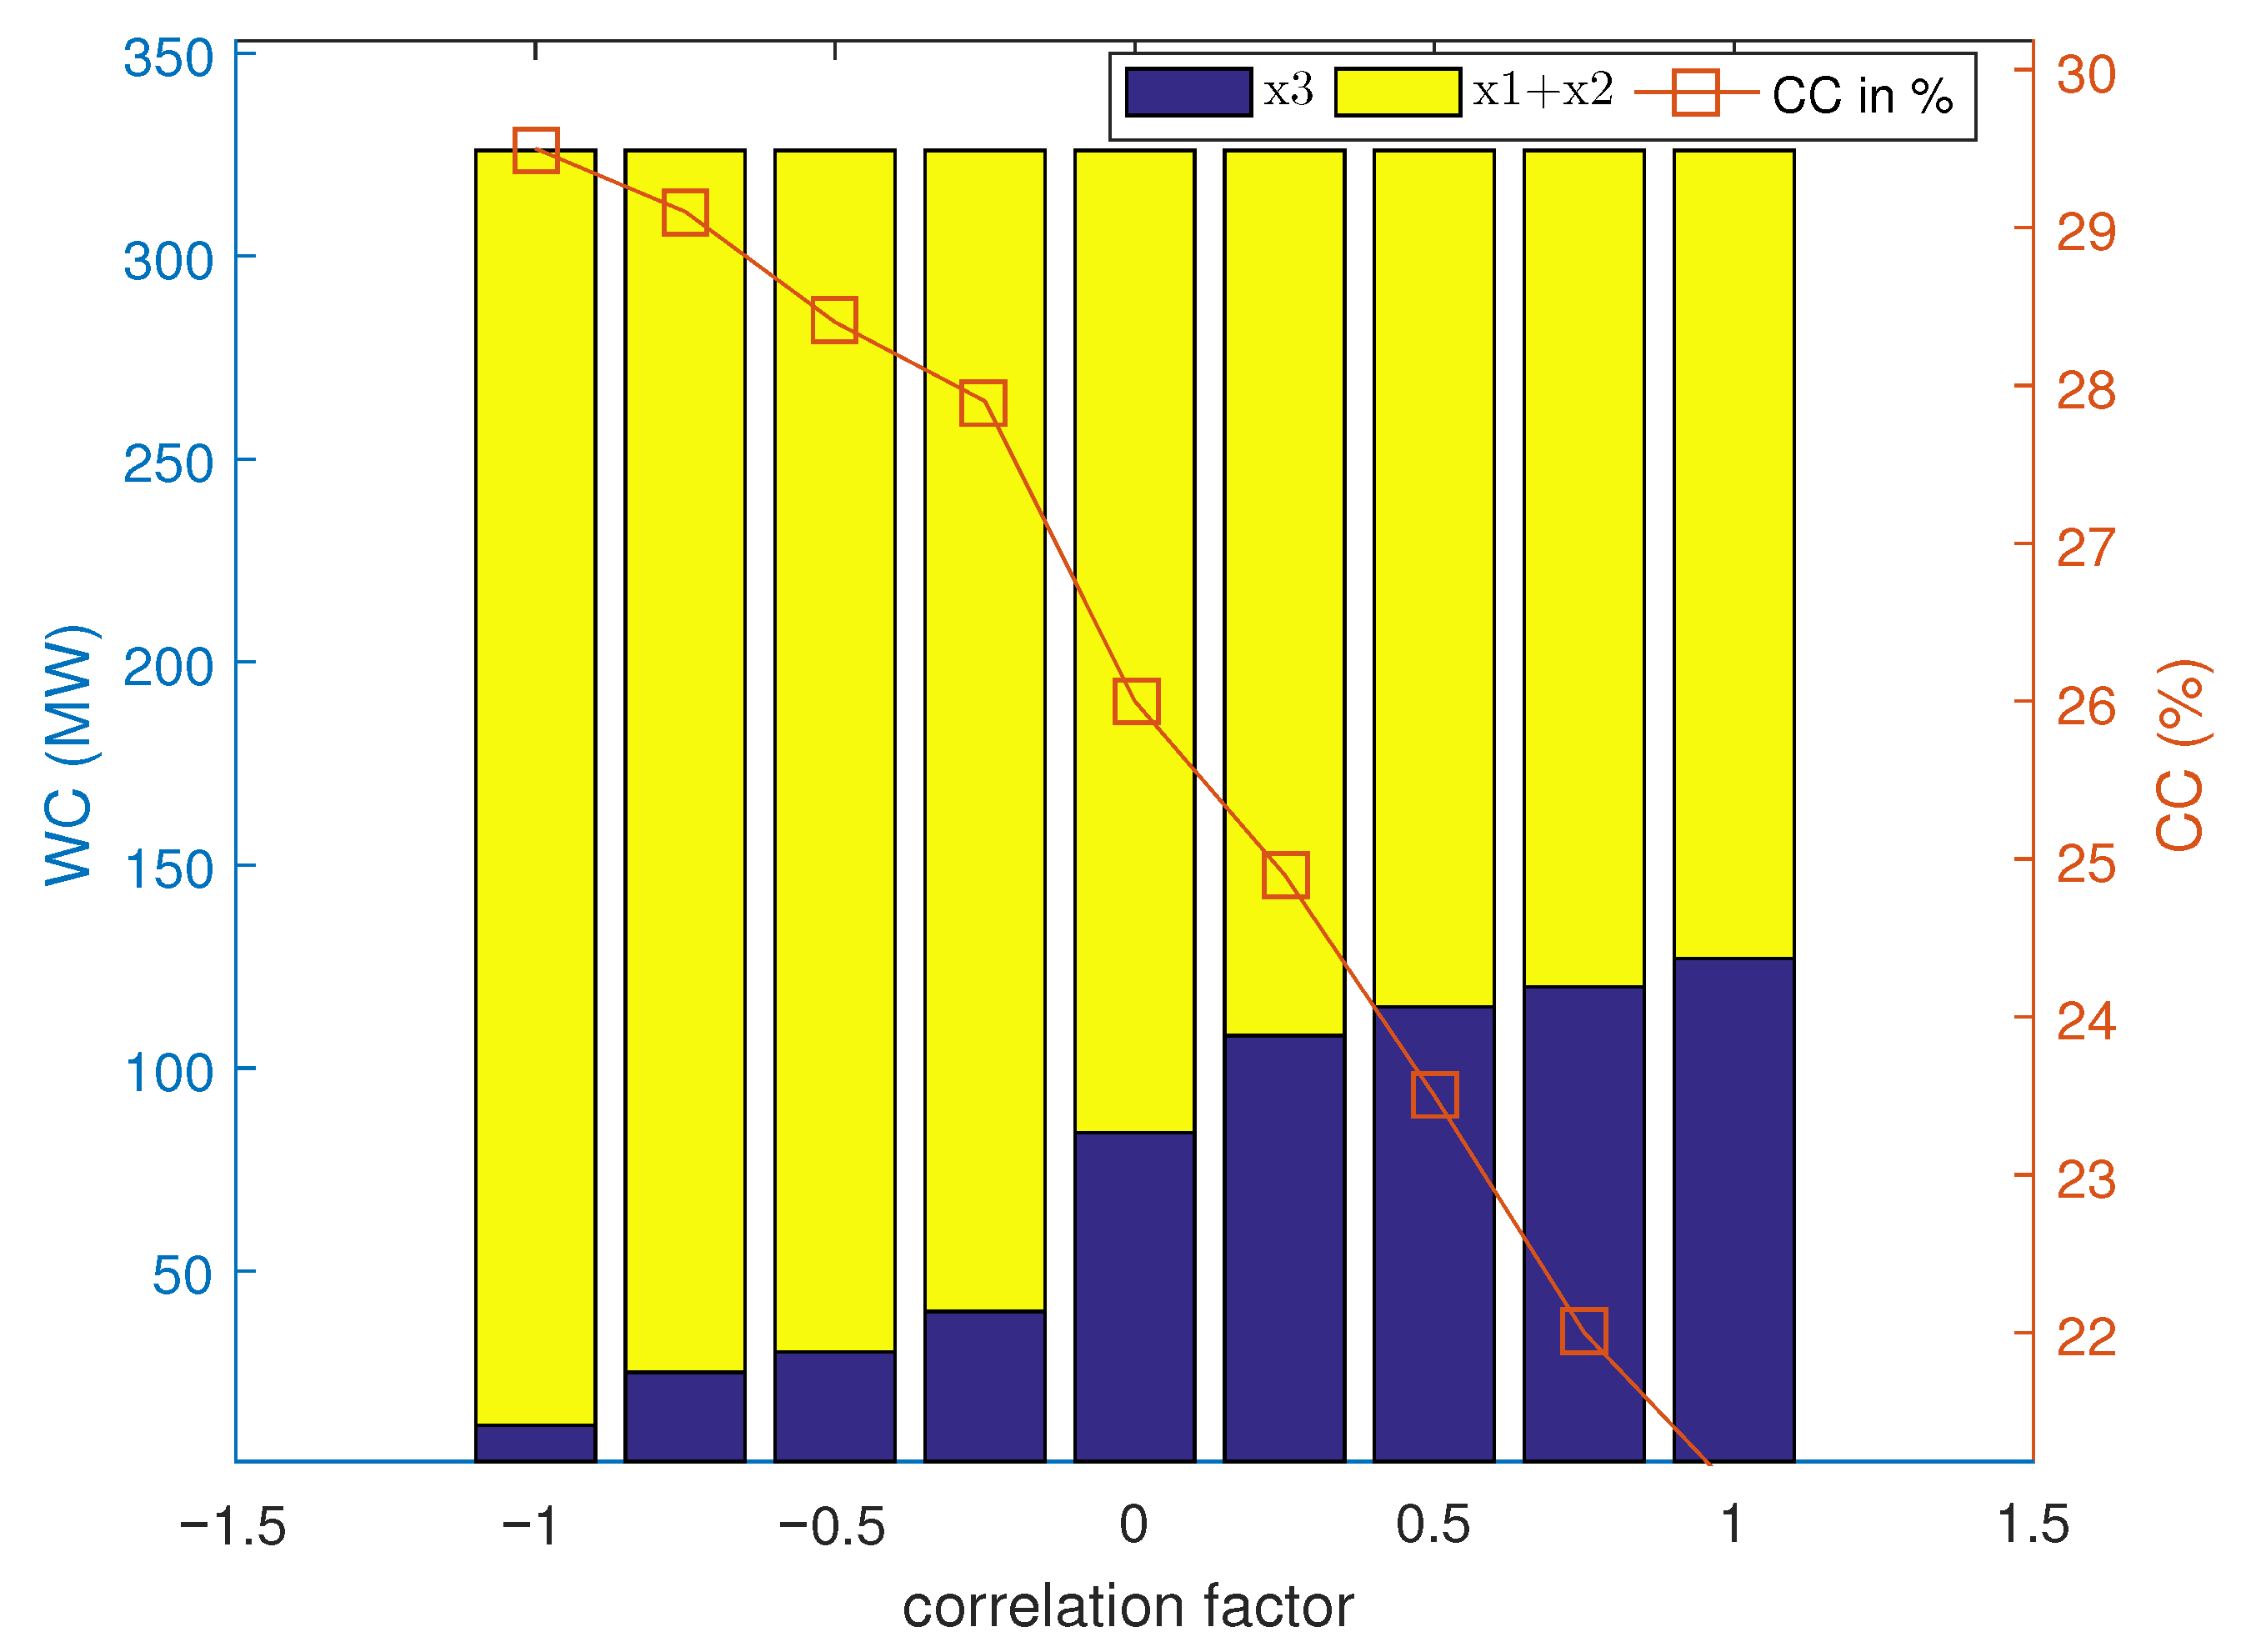
The sensitivity analysis was conducted by varying the correlation coefficient between Areas 1 and 2 while maintaining Area 3 at a constant level. Figure 9 illustrates the results for various correlation values. It is encouraging to note that selecting wind resources that are negatively correlated between the areas positively impacts the CC, offering a potential solution to enhance power system efficiency.

4.2. Fuzzy Optimization

In this case study, we carefully computed the mean absolute percentage error (MAPE) between two years of wind data for each site within the three-area power system, guaranteeing the precision of our results. These results are listed in Table 2, providing a solid foundation for our analysis of the fuzzy model.
In simpler terms, the average MAPE across the three regions was determined and applied to the upper ω ¯ and lower ω ̲ expected values of the wind power data for all regions. Furthermore, the upper CC ¯ and the lower CC ̲ of capacity credit boundaries for the proposed fuzzy optimization model were defined as specific, unchanging capacity credit percentages.
These percentages denoted the anticipated contribution of wind energy to the overall power system capacity. The limits were established as a ( ± ) percent of the deterministic CC. The optimization problem was resolved utilizing the CVX solver, and the anticipated values of CC together with all decision factors are displayed in Table 13.
The precise value of the CC for both deterministic and fuzzy methodologies was ascertained utilizing 52,422 historical wind samples for each region. The decision variables were subsequently defined for each approach, as seen in Table 11 and Table 13.
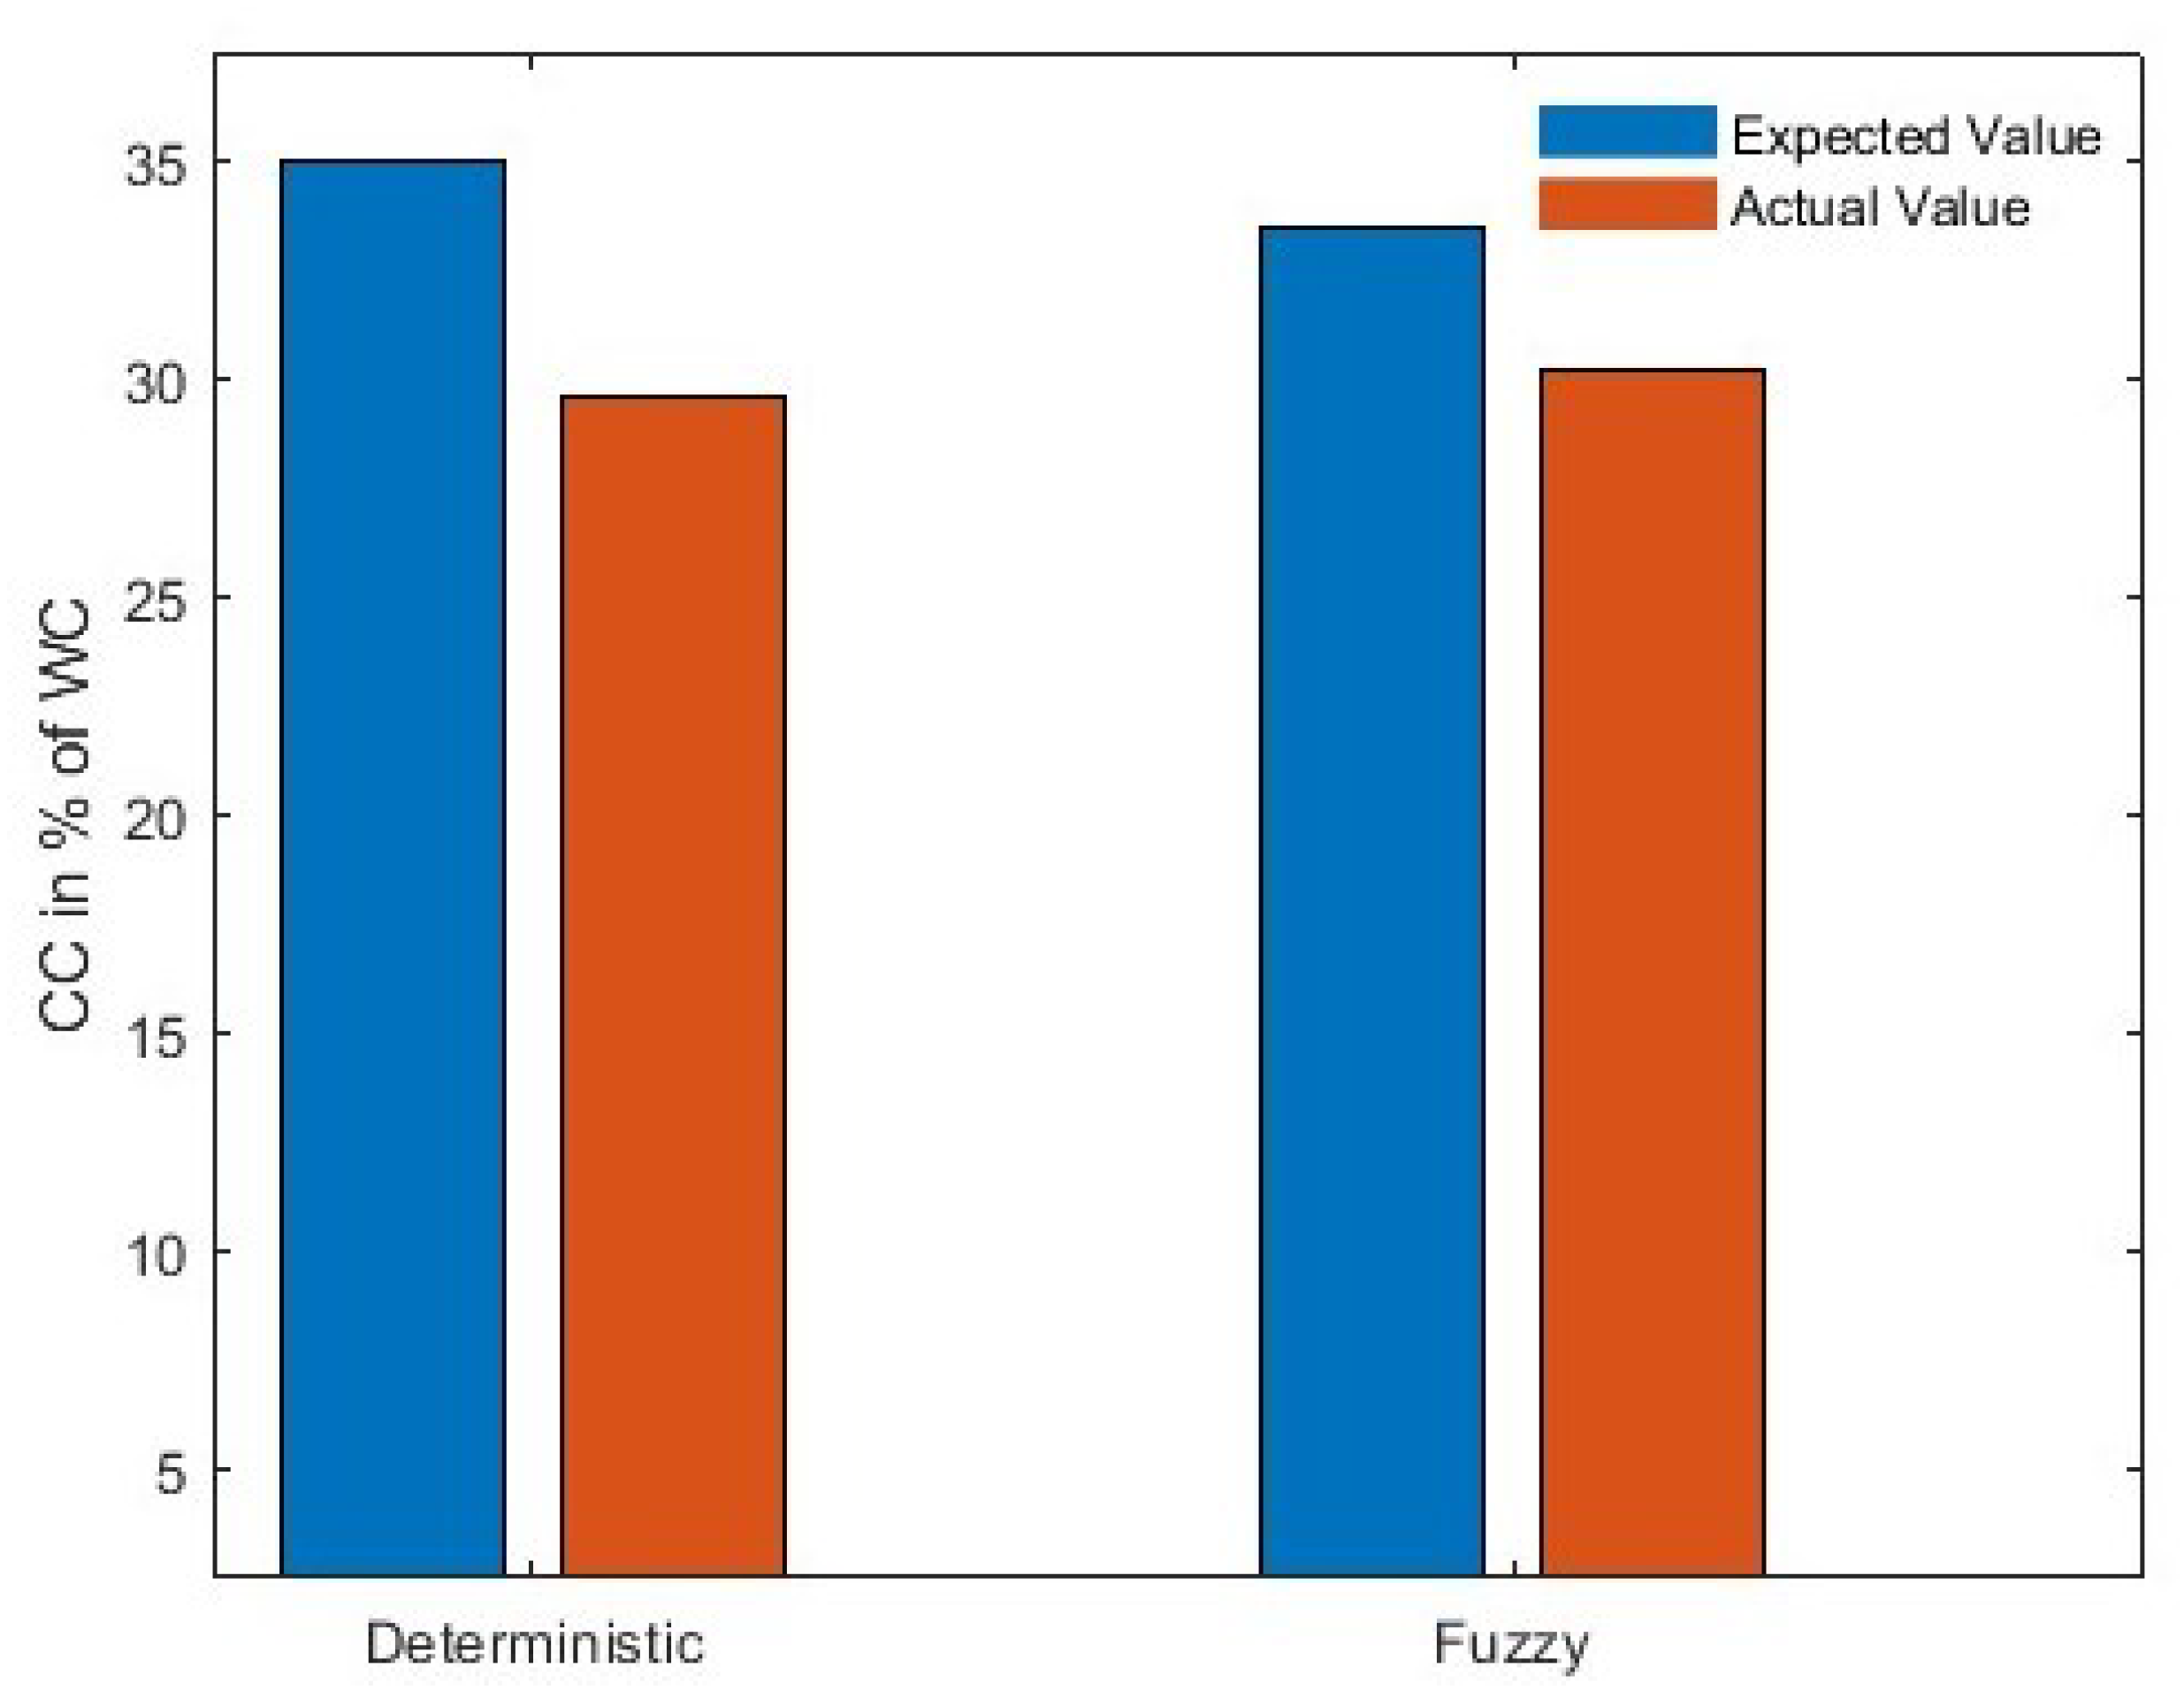
Table 14 displays the actual capacity credit (CC) value, comparing the capacity credit of wind generation across various methods. In the fuzzy optimization method, the anticipated CC value was computed as 33.4%, which was lower than the CC established by the deterministic approach. Yet, the actual CC value derived from the fuzzy method exceeded the deterministic value. This highlights the significance of the fuzzy approach in accounting for wind uncertainty within the optimization model. This result implies that neglecting the uncertainty in the optimization problem could lead to a misinterpretation of the expected capacity credit, highlighting the significance of this research. The key advantage of the fuzzy optimization technique over all others is its efficiency. The size of the problem does not substantially expand as the number of uncertain parameters increases. This is because it is not necessary to create a large number of scenarios for every stochastic parameter. Figure 10 provides a clear comparison between the deterministic and fuzzy approaches, highlighting the latter’s practicality and efficiency.
Additionally, adjusting the fuzzy capacity credit limits, CC ¯ and CC ̲ , to various levels led to different CC values. Table 15 illustrates that two levels of fuzzy CC limits were evaluated against the base case. Based on this comparison, establishing CC limits at ±9% would optimize the CC value.
The case study demonstrated that intelligently distributing wind power over different interconnected areas, combined with a compressed-air energy storage system (CAESS), could significantly improve a power system’s reliability and capacity credit. This study discovered that capacity credit could increase from 29.3% to 35% with appropriate allocation. Simultaneously, the sensitivity analysis demonstrated that a distributed wind power design across regions reduced the system’s loss of load expectation (LOLE). Furthermore, the fuzzy optimization methodology outperformed deterministic methods by offering a more accurate evaluation of capacity credit under wind power variability, emphasizing the necessity of factoring in uncertainty in renewable integration planning. These findings highlight how multi-area wind distribution can play an essential role in increasing the resilience and efficiency of renewable energy systems when backed by sophisticated energy storage options.

5. Conclusions

This study presented a chronological generation expansion planning model focused on capacity credit (CC) maximization through the optimal allocation of wind power generation in a multi-area power system network, incorporating compressed-air energy storage (CAES) to mitigate wind power fluctuations. This study demonstrated that the proposed fuzzy-based generation expansion planning model significantly improves the reliability of multi-area power systems by maximizing capacity credit (CC) The test system analysis showed that CAES significantly impacted CC, with the potential to increase CC to 29.3% under a 6% annual load demand growth and further to 35% with additional CAES support. Moreover, the study employed a fuzzy optimization approach to address the inherent uncertainty in wind power generation. Key uncertainty metrics were calculated, including the mean absolute percentage error (MAPE) of 13.2% for wind data, providing a quantified measure of variability. This method emphasizes the importance of considering wind uncertainty in the optimization model. Ignoring this uncertainty could lead to misleading projections of capacity credit, resulting in sub-optimal decisions. Additionally, our research highlighted the difference between deterministic and fuzzy approaches for calculating the capacity credit. While the expected value of the CC using fuzzy optimization was 33.4% lower than the deterministic value, the actual CC found by the fuzzy approach surpassed that of the deterministic method. This underscores the significance of incorporating uncertainty into the optimization process, as neglecting it could lead to a misinterpretation of the expected capacity credit, further reinforcing the value of the fuzzy approach in future studies. These findings can inspire further research on optimizing wind power allocation, especially in expanding power networks with diverse renewable energy and storage technologies.
In summary, the scientific originality of this work lies in three main aspects as follows:
(i)
Developing a fuzzy-based optimization strategy that directly maximizes capacity credit while considering wind uncertainty;
(ii)
Integrating a compressed-air energy storage system (CAESS) into a multi-area generation expansion planning framework;
(iii)
Emphasizing capacity credit enhancement rather than cost minimization, which sets our study apart from most previous research.
By combining multi-area wind allocation, storage deployment, and fuzzy-based uncertainty modeling, this study provides a novel methodological contribution and new insights for improving the reliability and resilience of renewable-integrated power systems. The fuzzy-based capacity credit approach is also adaptable; for example, it can be applied to solar photovoltaic (PV) expansion or other renewable/storage hybrids by redefining the uncertainty membership functions for those technologies. Therefore, the methodology can support planning for diverse future energy systems.
Future research will focus on optimally distributing wind energy over different areas and including advanced storage technologies to raise the reliability of wind-integrated power systems. Several key improvements can be explored as follows:
  • Improve compressed-air energy storage system (CAESS) capacity and power limitations:
This will enable the quantification of scalability effects on the capacity credit (CC). Increasing the CAESS’s volume and power beyond 50 MWh and 25 MW may enhance the CC by minimizing significant wind fluctuations, although this would imply trade-offs in cost and spatial requirements.
2.
Refining transmission network models:
Advancing from aggregate tie-line capacities to detailed transmission network models can enhance wind power distribution by considering actual grid configurations and congestion. For instance, L23, with a base capacity of 45 MW, accommodates substantial wind allocations, indicating a potential bottleneck. Increasing its capacity could improve power flow, suggesting that capacity expansion may serve as an optimization strategy, though further study is required.
3.
Assessing the economic implications of the CAESS and wind allocation for cost–benefit optimization.
These advancements will enhance the efficiency and reliability of renewable energy integration while tackling economic and technical challenges.

Author Contributions

Conceptualization, H.M.G.; methodology, H.M.G. and F.A.; software, H.M.G.; validation, H.M.G. and U.A.K.; formal analysis, U.A.K.; investigation, U.A.K.; resources, F.A.; data curation, F.A.; writing—original draft, H.M.G.; writing—review and editing, U.A.K.; supervision, U.A.K. and F.A. All authors have read and agreed to the published version of the manuscript.

Funding

This research received no external funding.

Data Availability Statement

The original contributions presented in this study are included in the article. Further inquiries can be directed to the corresponding author.

Conflicts of Interest

The authors declare no conflicts of interest.

Nomenclature

i , j Indices of areas
α i Upper limitation of wind allocation in area i
tHour index
JSet of all area receiving power
ISet of all area of wind farm
TSet of all hours in the study
x i Decision variable of wind allocation
W C Total installation of wind capacity
C K i Capacity outage probability table
q i t Hourly conventional capacity of area i
ω i t Hourly wind data of area i
C C i Capacity credit of area i
F i , j t Tie-line capacity between areas i and j (MW)
f i , j t Hourly power flow from area i to area j
D i t Hourly load data for area i
P N Penetration level of wind power plant
C C ˜ Fuzzy sets for the capacity credit
ω ˜ Fuzzy sets for the wind power parameter
c c ¯ / c c ̲ Upper/lower limit for the capacity credit
ω ¯ / ω ̲ Upper/lower limit for the wind parameter
u c Membership function of the capacity credit
u w Membership function of the wind parameter
η c h Efficiency of charging
η d s Efficiency of discharging
α c h , α d s Binary variable to allow only one mode charge or discharge
E i t CAES capacity MWh
P c h i t CAES charge power at time t and area i
P d s i t CAES discharge power at time t and area i

References

  1. Global Wind Energy Council. Global Wind Report 2024; Global Wind Energy Council (GWEC): Brussels, Belgium, 2024. [Google Scholar]
  2. WindEurope, Wind Energy in Europe 2023—Statistics and the Outlook for 2024–2030, Feb. 2024. Available online: https://windeurope.org/intelligence-platform/product/wind-energy-in-europe-2023-statistics-and-the-outlook-for-2024-2030/ (accessed on 1 February 2024).
  3. Zhao, Y.; Lin, W. Overview of Power System Planning under Uncertainty. In Proceedings of the 2022 2nd International Conference on Electrical Engineering and Control Science (IC2ECS), Nanjing, China, 16–18 December 2022; pp. 352–360. [Google Scholar]
  4. Billinton, R.; Gao, Y.; Karki, R. Application of a Joint Deterministic-Probabilistic Criterion to Wind Integrated Bulk Power System Planning. IEEE Trans. Power Syst. 2010, 25, 1384–1392. [Google Scholar] [CrossRef]
  5. Sima, C.A.; Lazaroiu, G.C.; Dumbrava, V.; Roscia, M. Deterministic Approach for Generation and Transmission Expansion Planning. In Proceedings of the 2018 International Conference on ENERGY and ENVIRONMENT (CIEM), Prague, Czech Republic, 23–27 July 2018; pp. 485–489. [Google Scholar]
  6. Vafamehr, A.; Khodayar, M.E.; Manshadi, S.D.; Ahmad, I.; Lin, J. A Framework for Expansion Planning of Data Centers in Electricity and Data Networks Under Uncertainty. IEEE Trans. Smart Grid 2019, 10, 305–316. [Google Scholar] [CrossRef]
  7. Fan, M.; Sun, K.; Lane, D.; Gu, W.; Li, Z.; Zhang, F. A Novel Generation Rescheduling Algorithm to Improve Power System Reliability with High Renewable Energy Penetration. IEEE Trans. Power Syst. 2018, 33, 3349–3358. [Google Scholar] [CrossRef]
  8. Abou El Ela, A.A.; El-Sehiemy, R.A.; Shaheen, A.M.; Shalaby, A.S.; Mouafi, M.T. Reliability constrained dynamic generation expansion planning using honey badger algorithm. Sci. Rep. 2023, 13, 16765. [Google Scholar] [CrossRef]
  9. Abou El-Ela, A.A.; El-Sehiemy, R.A.; Shaheen, A.M.; Shalaby, A.S.; Mouwafi, M.T. Robust generation expansion planning in power grids under renewable energy penetration via honey badger algorithm. Neural Comput. Appl. 2024, 36, 7923–7952. [Google Scholar] [CrossRef]
  10. Xu, Q.; Cao, M.; Yang, Y. Capacity Credit Evaluation of Correlated Wind Resources Using Vine Copula and Improved Importance Sampling. Appl. Sci. 2019, 9, 199. [Google Scholar] [CrossRef]
  11. Liu, G.; Vrakopoulou, M.; Mancarella, P. Assessment of the Capacity Credit of Renewables and Storage in Multi-Area Power Systems. IEEE Trans. Power Syst. 2021, 36, 2334–2344. [Google Scholar] [CrossRef]
  12. Zhang, N.; Yu, Y.; Fang, C.; Su, Y.; Kang, C. Power System Adequacy with Variable Resources: A Capacity Credit Perspective. IEEE Trans. Reliab. 2024, 73, 53–58. [Google Scholar] [CrossRef]
  13. Liu, K.; Hu, P.; Liu, G.; Mancarella, P. Capacity Credit Evaluation Framework of Wind, Solar and Pumped Hydro Storage Considering Generation Adequacy and Flexibility. In Proceedings of the 2019 9th International Conference on Power and Energy Systems (ICPES), Perth, WA, Australia, 10–12 December 2019; pp. 1–6. [Google Scholar] [CrossRef]
  14. Wu, C.; Chen, L.; Zeng, P.; Xu, X. Capacity Credit Assessment of Wind Power Considering Energy Storage. In Proceedings of the 2014 China International Conference on Electricity Distribution (CICED), Shenzhen, China, 23–26 September 2014. [Google Scholar]
  15. Garver, L.L. Effective Load Carrying Capability of Generating Units. IEEE Trans. Power Appar. Syst. 1966, PAS-85, 910–919. [Google Scholar] [CrossRef]
  16. Paik, C.; Chung, Y.; Kim, Y.J. ELCC-based capacity credit estimation accounting foruncertainties incapacity factors and its application to solar power in Korea. Renew. Energy 2021, 164, 833–841. [Google Scholar] [CrossRef]
  17. Nguyen, T.V. Integration of compressed air energy storage with wind turbine to provide energy source for combustion turbine generator. In Proceedings of the IEEE PES Innovative Smart Grid Technologies, Europe, Istanbul, Turkey, 12–15 October 2014; IEEE: New York, NY, USA, 2014; pp. 1–5. [Google Scholar]
  18. Calero, F.; Cañizares, C.A.; Bhattacharya, K.; Anierobi, C.; Calero, I.; de Souza, M.F.Z.; Farrokhabadi, M.; Guzman, N.S.; Mendieta, W.; Peralta, D.; et al. A Review of Modeling and Applications of Energy Storage Systems in Power Grids. Proc. IEEE 2023, 111, 806–831. [Google Scholar] [CrossRef]
  19. Qi, N.; Li, P.; Cheng, L.; Zhang, Z.; Huang, W.; Yang, W. Methodology for Capacity Credit Evaluation of Physical and Virtual Energy Storage in Decarbonized Power System. arXiv 2023. [Google Scholar] [CrossRef]
  20. Zhao, J.-F.; Oh, U.-J.; Choi, J.-S. Power System Reliability Evaluation Including Capacity Credit Considering Wind Energy with Energy Storage Systems in China. IFAC-PapersOnLine 2019, 52, 348–353. [Google Scholar] [CrossRef]
  21. Oh, U.; Choi, J.; Kim, H.-H. Capacity credit and reasonable ESS evaluation of power system including WTG combined with BESS. In Proceedings of the International Conference on Probabilistic Methods Applied to Power Systems (PMAPS), Beijing, China, 16–20 October 2016; IEEE: New York, NY, USA, 2016; pp. 1–6. [Google Scholar]
  22. Saket, R.K.; Sanjeevikumar, P. (Eds.) Reliability Analysis of Modern Power Systems, 1st ed.; Wiley Press: Hoboken, NJ, USA; IEEE: New York, NY, USA, 2024. [Google Scholar]
  23. Makvand, S.B. Probabilistic evaluation and planning of power transmission system reliability. Iet Gener. Transm. Distrib. 2017, 11, 3239–3246. [Google Scholar] [CrossRef]
  24. Fan, H.; Wang, C.; Liu, L.; Li, X. Review of Uncertainty Modeling for Optimal Operation of Integrated Energy System. Front. Energy Res. 2022, 9, 641337. [Google Scholar] [CrossRef]
  25. Hemmati, M.; Mohammadi-Ivatloo, B.; Soroudi, A. Uncertainty Management in Power System Operation Decision Making. arXiv 2019, arXiv:1911.10358. [Google Scholar] [CrossRef]
  26. Allan, R.N.; Billinton, R. Probabilistic Assessment of Power Systems. IEEE Trans. Power Appar. Syst. 1978, PAS-97, 2235–2242. [Google Scholar] [CrossRef]
  27. Kumar, D.S.; Quan, H.; Wen, K.Y.; Srinivasan, D. Probabilistic risk and severity analysis of power systems with high penetration of photovoltaics. Sol. Energy 2021, 230, 1156–1164. [Google Scholar] [CrossRef]
  28. Atici, U.; Gürcan, Ö.F.; Güldeş, M.; Şahin, C. A Fuzzy Multi-Criteria Decision-Making Method for Selection of Biomass Power Plant Location. In Optimization and Decision-Making in the Renewable Energy Industry; Balo, F., Topal, A., Demir, E., Ulutaş, A., Eds.; IGI Global Scientific Publishing: London, UK, 2022; pp. 1–30. [Google Scholar] [CrossRef]
  29. Sarwar, A.; Xu, J.; Da, L.; Hashim, M. Ahp and Fuzzy Topsis Methods for Green Supplier Selection and Evaluation. Int. J. Adv. Res. 2017, 5, 625–635. [Google Scholar] [CrossRef] [PubMed]
  30. Vieira, R.S.; Souza, J.D.F.; Lima, E.L. An Industrial Maintenance Decision Support System based on Fuzzy Inference to Optimize Scope Definition. Procedia Manuf. 2020, 51, 1633–1640. [Google Scholar] [CrossRef]
  31. Lu, K.; Liao, H.; Zavadskas, E.K. An overview of fuzzy techniques in supply chain management: Bibliometrics, methodologies, applications and future directions. Technol. Econ. Dev. Econ. 2021, 27, 402–458. [Google Scholar] [CrossRef]
  32. Lin, S.-S.; Zheng, X.-J. Enhancing smart city assessment: An advanced MCDM approach for urban performance evaluation. Sustain. Cities Soc. 2025, 118, 105930. [Google Scholar] [CrossRef]
  33. Zadeh, L.A. Fuzzy sets. Inf. Control. 1965, 8, 338–353. [Google Scholar] [CrossRef]
  34. Vivas, F.J.; Segura, F.; Andújar, J.M. Fuzzy logic-based energy management system for grid-connected residential DC microgrids with multi-stack fuel cells: A multi-objective approach. Sustain. Energy, Grids Netw. 2022, 32, 100909. [Google Scholar] [CrossRef]
  35. Dang, T.-T.; Nguyen, N.-A.-T.; Nguyen, V.-T.-T.; Dang, L.-T.-H. A Two-Stage Multi-Criteria Supplier Selection Model for Sustainable Automotive Supply Chain under Uncertainty. Axioms 2022, 11, 228. [Google Scholar] [CrossRef]
  36. Tavana, M.; Shaabani, A.; Santos-Arteaga, F.J.; Valaei, N. An integrated fuzzy sustainable supplier evaluation and selection framework for green supply chains in reverse logistics. Environ. Sci. Pollut. Res. 2021, 28, 1–26. [Google Scholar] [CrossRef]
  37. Vivas, F.J.; Segura, F.; Andújar, J.M.; Palacio, A.; Saenz, J.L.; Isorna, F.; López, E. Multi-Objective Fuzzy Logic-Based Energy Management System for Microgrids with Battery and Hydrogen Energy Storage System. Electronics 2020, 9, 1074. [Google Scholar] [CrossRef]
  38. Ortíz-Barrios, M.; Jaramillo-Rueda, N.; Gul, M.; Yucesan, M.; Jiménez-Delgado, G.; Alfaro-Saíz, J.-J. A Fuzzy Hybrid MCDM Approach for Assessing the Emergency Department Performance during the COVID-19 Outbreak. Int. J. Environ. Res. Public Health 2023, 20, 4591. [Google Scholar] [CrossRef]
  39. Miranda, V.; Saraiva, J.T. Fuzzy Modeling of Power System Optimal Load Flow. IEEE Trans. Power Syst. 1992, 7, 843–849. [Google Scholar] [CrossRef]
  40. Wang, C.; Shahidehpour, S.M.; Adapa, R. A fuzzy Set Approach to Tie Flow Computation in Optimal Power Scheduling. In Proceedings of the 54th Annual Meeting of the American Power Conference, Chicago, IL, USA, 23–25 April 1992; pp. 1443–1450. [Google Scholar]
  41. Guan., X.; Luh, P.; Prasannn, B. Power System Scheduling with Fuzzy Reserve Requirements. In Proceedings of the IEEE/PES 1995 Summer Meeting, Portland, OR, USA, 23–28 July 1995. [Google Scholar]
  42. Al-Awami, A.T.; Amleh, N.A.; Muqbel, A.M. Optimal Demand Response Bidding and Pricing Mechanism with Fuzzy Optimization: Application for a Virtual Power Plant. IEEE Trans. Ind. Appl. 2017, 53, 5051–5061. [Google Scholar] [CrossRef]
  43. Ansari, M.; Al-Awami, A.T.; Sortomme, E.; Abido, M.A. Coordinated bidding of ancillary services for vehicle-to-grid using fuzzy optimization. IEEE Trans. Smart Grid 2015, 6, 261–270. [Google Scholar] [CrossRef]
  44. Shao, N.; Chen, Q.; Dong, Y.; Ding, W.; Wang, L. Power System Fault Diagnosis Method Based on Intuitionistic Fuzzy Sets and Incidence Matrices. IEEE Trans. Power Deliv. 2023, 38, 3924–3938. [Google Scholar] [CrossRef]
  45. Masteri, K.; Venkatesh, B.; Freitas, W. A Fuzzy Optimization Model for Distribution System Asset Planning With Energy Storage. IEEE Trans. Power Syst. 2018, 33, 5114–5123. [Google Scholar] [CrossRef]
  46. Li, Z.; Xu, Y.; Feng, X.; Wu, Q. Optimal Stochastic Deployment of Heterogeneous Energy Storage in a Residential Multienergy Microgrid with Demand-Side Management. IEEE Trans. Ind. Inform. 2021, 17, 991–1004. [Google Scholar] [CrossRef]
  47. Yang, N.; Xu, G.; Fei, Z.; Li, Z.; Du, L.; Guerrero, J.M.; Li, Z. Two-Stage Coordinated Robust Planning of Multi-Energy Ship Microgrids Considering Thermal Inertia and Ship Navigation. IEEE Trans. Smart Grid 2025, 16, 1100–1111. [Google Scholar] [CrossRef]
  48. National Renewable Energy Laboratory (NREL). Renewable Electricity Futures Study Data Explorer. Available online: https://www.nrel.gov/analysis/re-futures.html (accessed on 1 May 2022).
  49. Potter, C.W.; Lew, D.; McCaa, J.; Cheng, S.; Eichelberger, S.; Grimit, E. Creating the Dataset for the Western Wind and Solar Integration Study (U.S.A.). Wind. Eng. 2008, 32, 325–338. [Google Scholar] [CrossRef]
  50. Kirschen, D.S.; Strbac, G. Fundamentals of Power System Economics, 2nd ed.; Wiley: Hoboken, NJ, USA, 2018. [Google Scholar]
  51. Gupta, D.K.; Jha, A.V.; Appasani, B.; Srinivasulu, A.; Bizon, N.; Thounthong, P. Load Frequency Control Using Hybrid Intelligent Optimization Technique for Multi-Source Power Systems. Energies 2021, 14, 1581. [Google Scholar] [CrossRef]
  52. Grigg, C.; Wong, P.; Albrecht, P.; Allan, R.; Bhavaraju, M.; Billinton, R.; Singh, C. The IEEE Reliability Test System-1996. A report prepared by the Reliability Test System Task Force of the Application of Probability Methods Subcommittee. IEEE Trans. Power Syst. 1999, 14, 1010–1020. [Google Scholar] [CrossRef]
  53. Elia. Load Data for Belgium Electricity. Available online: https://www.elia.be/en/grid-data/load-and-load-forecasts (accessed on 1 October 2024).
  54. Ghazal, H.M. Wind Power Generation Expansion Planning Based on Capacity Credit Maximization. Master’s Thesis, Department of Electrical Engineering, King Fahd University of Petroleum and Minerals, Dhahran, Saudi Arabia, May 2018. [Google Scholar]
Figure 1. Multi-area power system example with conventional and wind power generation.
Energies 18 05628 g001
Figure 2. Membership function of objective function in fuzzy optimization model.
Energies 18 05628 g002
Figure 3. Membership function of wind data in fuzzy optimization model.
Energies 18 05628 g003
Figure 4. System under study: multi-area power system.
Energies 18 05628 g004
Figure 5. Reliability curve of the system.
Energies 18 05628 g005
Figure 6. Flow chart of the optimization model.
Energies 18 05628 g006
Figure 7. Reliability curve of the system: optimal case vs. all cases.
Energies 18 05628 g007
Figure 8. Sensitivity analysis: capacity credit results based on varying transmission line capacity.
Energies 18 05628 g008
Figure 9. Correlation sensitivity result: capacity credit results based on varying the correlation factor of wind among different areas.
Energies 18 05628 g009
Figure 10. Comparison of optimization techniques: deterministic model’s CC vs. fuzzy model’s CC.
Energies 18 05628 g010
Table 1. Comparison of methodologies with previous work.
Ref.ScopeUncertainty HandlingStorage TypeObjective
[5]GEPDeterministicNoneMinimize cost
[48]Residential
microgrid
StochasticHeterogeneousCost and demand-side management
[49]Ship microgridRobust optimizationThermalCost and navigation
This StudyMulti-area GEPFuzzy optimizationCAESSMaximize CC
Table 2. MAPE results.
MAPE Results
Area iMAPE
113.3% 
211.1% 
315.21%
 Average  13.2% 
Table 3. Three-area power system data.
LocationArea 1Area 2Area 3
Conventional capacity560 MW696 MW751 MW
Peak load445 MW550 MW600 MW
Wind profileNREL data for location ANREL data for location BNREL data for location C
Table 4. Line capacities.
Line Capacity
Line No.Capacity
L1240 MW
L1345 MW
L2345 MW
Table 5. CAESS’s specifications.
Line Capacity
ParameterValue
P c h i t m a x 25 MW
P s d i t m i n 25 MW
CAES capacity in each area50 MWh
C-rate0.5 C
η c h 1
η d s 1
Table 6. Reliability data.
Generating Unit Reliability Data
Unit SizeArea 1Unit SizeArea 2Unit SizeArea 3
No. UnitsFORNo. UnitsFORNo. UnitsFOR
1250.021230.022030.1
5040.012020.15020.02
10030.0415540.0419730.05
Table 7. Load data after one year.
New Peak Load 
Area iPeak Load
1471.7 MW
2583 MW
3636 MW
Table 8. LOLE of all cases.
Loss of Load Expectation (h/y)
Area
i
Base
Case
After 
One Year
LOLE (h/y) of Each Case
123Optimal
15.5810.5768.96.45.2
21832.926.352223.717.6
3415752.343.73941.28
Total64.58100.584.6574.669.164.1
Table 9. Deterministic results without using CAESS.
Results
Area iDeterministic Results
WindWCCC
AllocationMW
14432629.3%
2147
3135
Table 10. CC results for all cases.
Comparison Among Cases
Area iWind Installation Cases
CaseCaseCaseOptimal
123Case
1163010944
2163163109147
30163109135
CC16%19%24%29.3%
Table 11. Deterministic results using CAESS.
Results
Area iDeterministic Results Using CAES
WindWCCC
AllocationMW
15127335%
290
3132
Table 12. Comparison between the proposed model with and without a CAES.
Comparison Result
Without CAESWith CAES
Expected CC29.3% 35%   
Table 13. Result of capacity credit and wind allocation using the fuzzy model.
Results
Area iFuzzy Results
WindWCCC
AllocationMW
13628633.4%
2109
3141
Table 14. Comparison between fuzzy and deterministic CC.
Comparison Results
DeterministicFuzzy
Expected CC35% 33.4%   
 Actual CC29.5%30.2%   
Table 15. Sensitivity of capacity credit to fuzzy CC limits.
 Results
DeterministicFuzzy
±5±9±13
Expected CC35% 32.8%   33.4% 32.5%   
 Actual CC29.5%29.3%   30.2%   29%   
Disclaimer/Publisher’s Note: The statements, opinions and data contained in all publications are solely those of the individual author(s) and contributor(s) and not of MDPI and/or the editor(s). MDPI and/or the editor(s) disclaim responsibility for any injury to people or property resulting from any ideas, methods, instructions or products referred to in the content.