Article

Thermodynamic Analysis of Pumped Thermal Energy Storage System Combined Cold, Heat, and Power Generation

1
School of Energy and Environment, Southeast University, Nanjing 210096, China
2
School of Fashion and Textiles, The Hong Kong Polytechnic University, Hong Kong 999077, China
*
Author to whom correspondence should be addressed.
Energies 2025, 18(3), 525; https://doi.org/10.3390/en18030525
Submission received: 24 December 2024 / Revised: 17 January 2025 / Accepted: 21 January 2025 / Published: 23 January 2025
(This article belongs to the Topic Energy Storage and Conversion Systems, 2nd Edition)

Abstract

:
Aiming at problems such as the low efficiency of renewable energy conversion and the single energy flow mode, this paper proposes a heat pump energy storage system combining cold, heat and power generation to achieve the purpose of diversified utilization of renewable energy. The system is suitable for buildings requiring cooling, heating/domestic hot water production and electricity. This paper mainly uses MATLAB for numerical calculations, selects several key cycle parameters to calculate and analyze the thermodynamic performance of the system, and uses the genetic algorithm and TOPSIS decision method to carry out fine design of the system working conditions. Through the multi-objective optimization calculation and the optimal solution, the system can achieve a total energy efficiency of 2.39 and a high thermal economic performance, indicating that the system can achieve the goals of cooling, heating water and power supply and providing ideas for the application of the multiple energy storage system.

1. Introduction

With the strengthening of development and investment in renewable energy such as wind and solar energy, renewable energy, led by both, will become the fastest growing energy source in the world in the next 30 years [1]. However, due to the intermittent and fluctuating characteristics of renewable energy generation [2], with the increase in its penetration rate in the power grid, the grid connection of renewable energy will have some impact on the traditional power grid [3,4]. Energy storage technology is the key to the full utilization of renewable energy. Realizing the movement of energy in time and space is the key principle of energy storage [5], which is essentially to make energy more controllable. The basic principle of electricity storage technology is that the electric energy is converted into other forms of energy storage when there is excess electric energy production, and when electric demand is large, the other forms of energy stored are re-converted into electric energy and released through certain technical means to achieve the function of peak regulation of electric energy.
To fully utilize renewable energy sources, the global effort to shift away from fossil fuels calls for energy storage that is efficient, affordable, and sustainable. The Carnot battery [6,7] could revolutionize the energy storage sector [8]. Pumped thermal electricity storage (PTES) technology, also known as the “Carnot battery”, combines thermal cycle technology with energy storage technology [9] and is a new type of electricity storage technology developed in recent years. The realization of the PTES charge/discharge function is not limited by geographical conditions and will not bring environmental and safety problems. At the same time, PTES has the advantages of large capacity, sufficient power, high efficiency, low cost, and long heat storage period [10,11]. According to the different operating principles of the system, PTES can be further divided into supercritical Brayton cycle PTES, transcritical cycle PTES, and subcritical cycle PTES.
The storage temperature of the Brayton PTES system is high, usually above 500 °C. The material and process requirements and quality of the system are high, resulting in an increase in the initial investment of the system [12]. Compared with the Brayton PTES system, there are relatively few studies on PTES based on the Rankine cycle. The transcritical cycle PTES system, such as the transcritical CO2 PTES system, uses non-toxic, non-flammable, environmentally friendly CO2, which has excellent thermal performance, as the working fluid because its working temperature is lower than 200 °C. As a heat/cold storage medium, pressurized water has a broad development prospect in the field of energy storage. In the transcritical CO2 PTES system established by Mercangöz et al. [13], the heat storage system consisted of four heat storage tanks and four ice storage tanks. The results showed that the efficiency of the system reached 53%, and the maximum pressure reached 13.3 MPa when the maximum storage temperature was only 396 K. Morandin et al. [14,15] optimized different transcritical CO2 cycle configurations using hot water and brine ice for heat and cold storage, respectively, and the cycle efficiency reached 60%. The maximum temperature of the system was only 450 K, but the maximum pressure was 18.9 MPa. In the follow-up study, Morandin et al. [16] optimized the thermal economic performance of the different system configurations they proposed. The charging and discharging power of the system was 50 MW, the charging and discharging time was 2 h, and the cycle efficiency was increased to 64%. In view of the high storage pressure of CO2 as a working fluid, Carro et al. [17] proposed a PTES system in which high-pressure CO2 is stored in abra. This system is suitable for different scenarios of renewable energy storage and carbon capture systems, and the storage efficiency reaches 42–56%. Combined with renewable energy storage, the system can store more than 1 Mt of additional CO2 per year.
The application of the Rankine cycle-based PTES system in the integrated energy system is particularly important. Reference [18] designed a PTES system suitable for industrial parks. The system could integrate the low-temperature waste heat of industrial parks as the basis of electricity storage and meet the steam demand of the industrial parks at the same time. In the case of industrial parks, the steam heat PTES system has a round-trip efficiency of 55.6%, a COP of 3.3, and a heating efficiency of 68.2%, which shows to a certain extent that the heat pump energy storage system based on the Rankine cycle has considerable energy storage performance. At the same time, the high efficiency of thermoelectric conversion gives it the ability to integrate and redistribute the thermal and electrical resources [19]. Although in terms of performance, the PTES system based on the Rankine cycle has shown good competitiveness, the practical economy of the heat pump storage system is still open to question. Taking data centers as practical application scenarios, Antoine [20] explored the technical and economic potential of heat pump power storage system based on the Rankine cycle. His research idea was to improve system efficiency by recycling waste heat, thus enhancing the economy of the system.
In recent years, the development of Carnot battery technology has been rapid, and several representative research projects have been initiated, for example, the National Facility for Pumped Heat Energy Storage (Newcastle University, Cambridge, UK, 150 kW grid-scale demonstration), the CHESTER Project (EU Horizon 2020, 10 kWe lab-scale prototype system), and the Malta system (Malta, Inc., Cambridge, UK, 100 MW grid-scale solution). Initially, the Carnot battery concept was chiefly centered around electric energy storage. However, its application scope has now expanded to multi-vector energy domains, such as combined cooling, heating, and power (CCHP). These multi - energy management systems gain enhanced flexibility and efficiency by integrating different energy sources, including solar, wind, and waste heat, and being applicable to intricate application scenarios. Take the Rankine cycle-based Carnot battery systems as an example. They are capable of making use of waste heat. Provided that waste heat is considered costless, they can theoretically reach a roundtrip efficiency exceeding 100%. Due to this advantage, they have been suggested as an approach for renovating existing coal - fired power plants, as well as solar thermal and photovoltaic (PV) power plants.
Much of the literature has focused on grid power to storage intermediates (high-temperature thermal energy), which, after a period of time, are converted back into electrical energy. However, there is a lack of research on how to convert grid power into more intermediate products. Based on the current research situation, a new concept combining the Carnot battery and multiple energy storage is proposed in this paper: power supply from the grid to the multistage heat pump, generating cold, medium-temperature heat, and high-temperature heat; the cold capacity and medium-temperature heat can be used by users, and the high-temperature heat can meet the needs of power generation. In view of the current problems of low efficiency of distributed energy conversion and the time–space mismatch between supply and demand, this kind of pumped thermal energy storage system is a viable choice for sustainable energy development in the future [21]. In this paper, the key parameters such as heat pump parameters and heat engine parameters are studied, and the performance is analyzed. The genetic algorithm is used to optimize the system. The performance calculation and analysis were completed by MATLAB R2020a.

2. System Description

This section mainly introduces the basic operation principle of the system and the system operation process.

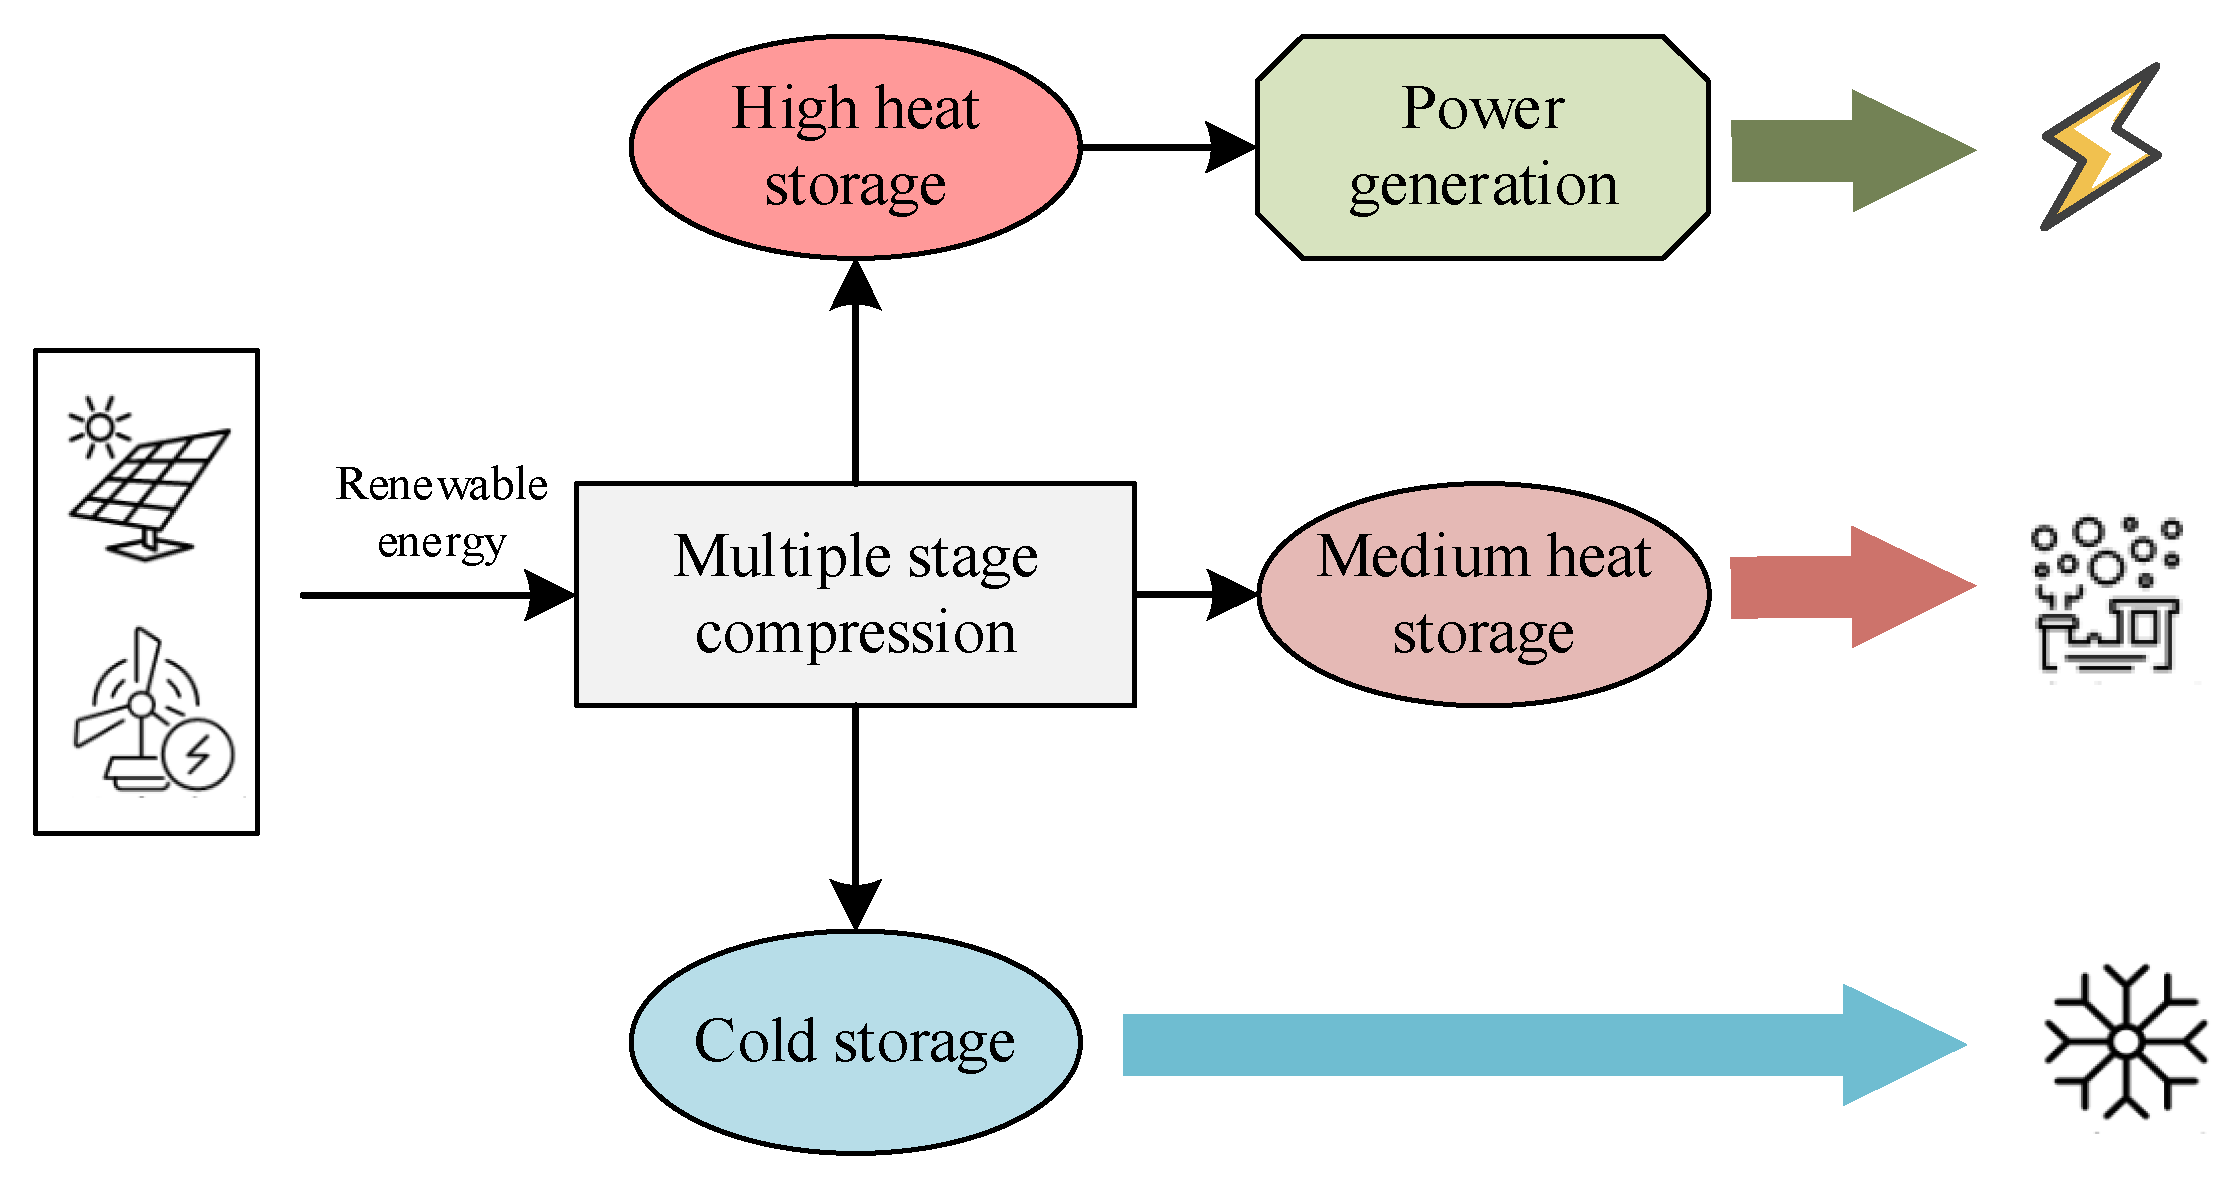
2.1. System Principle
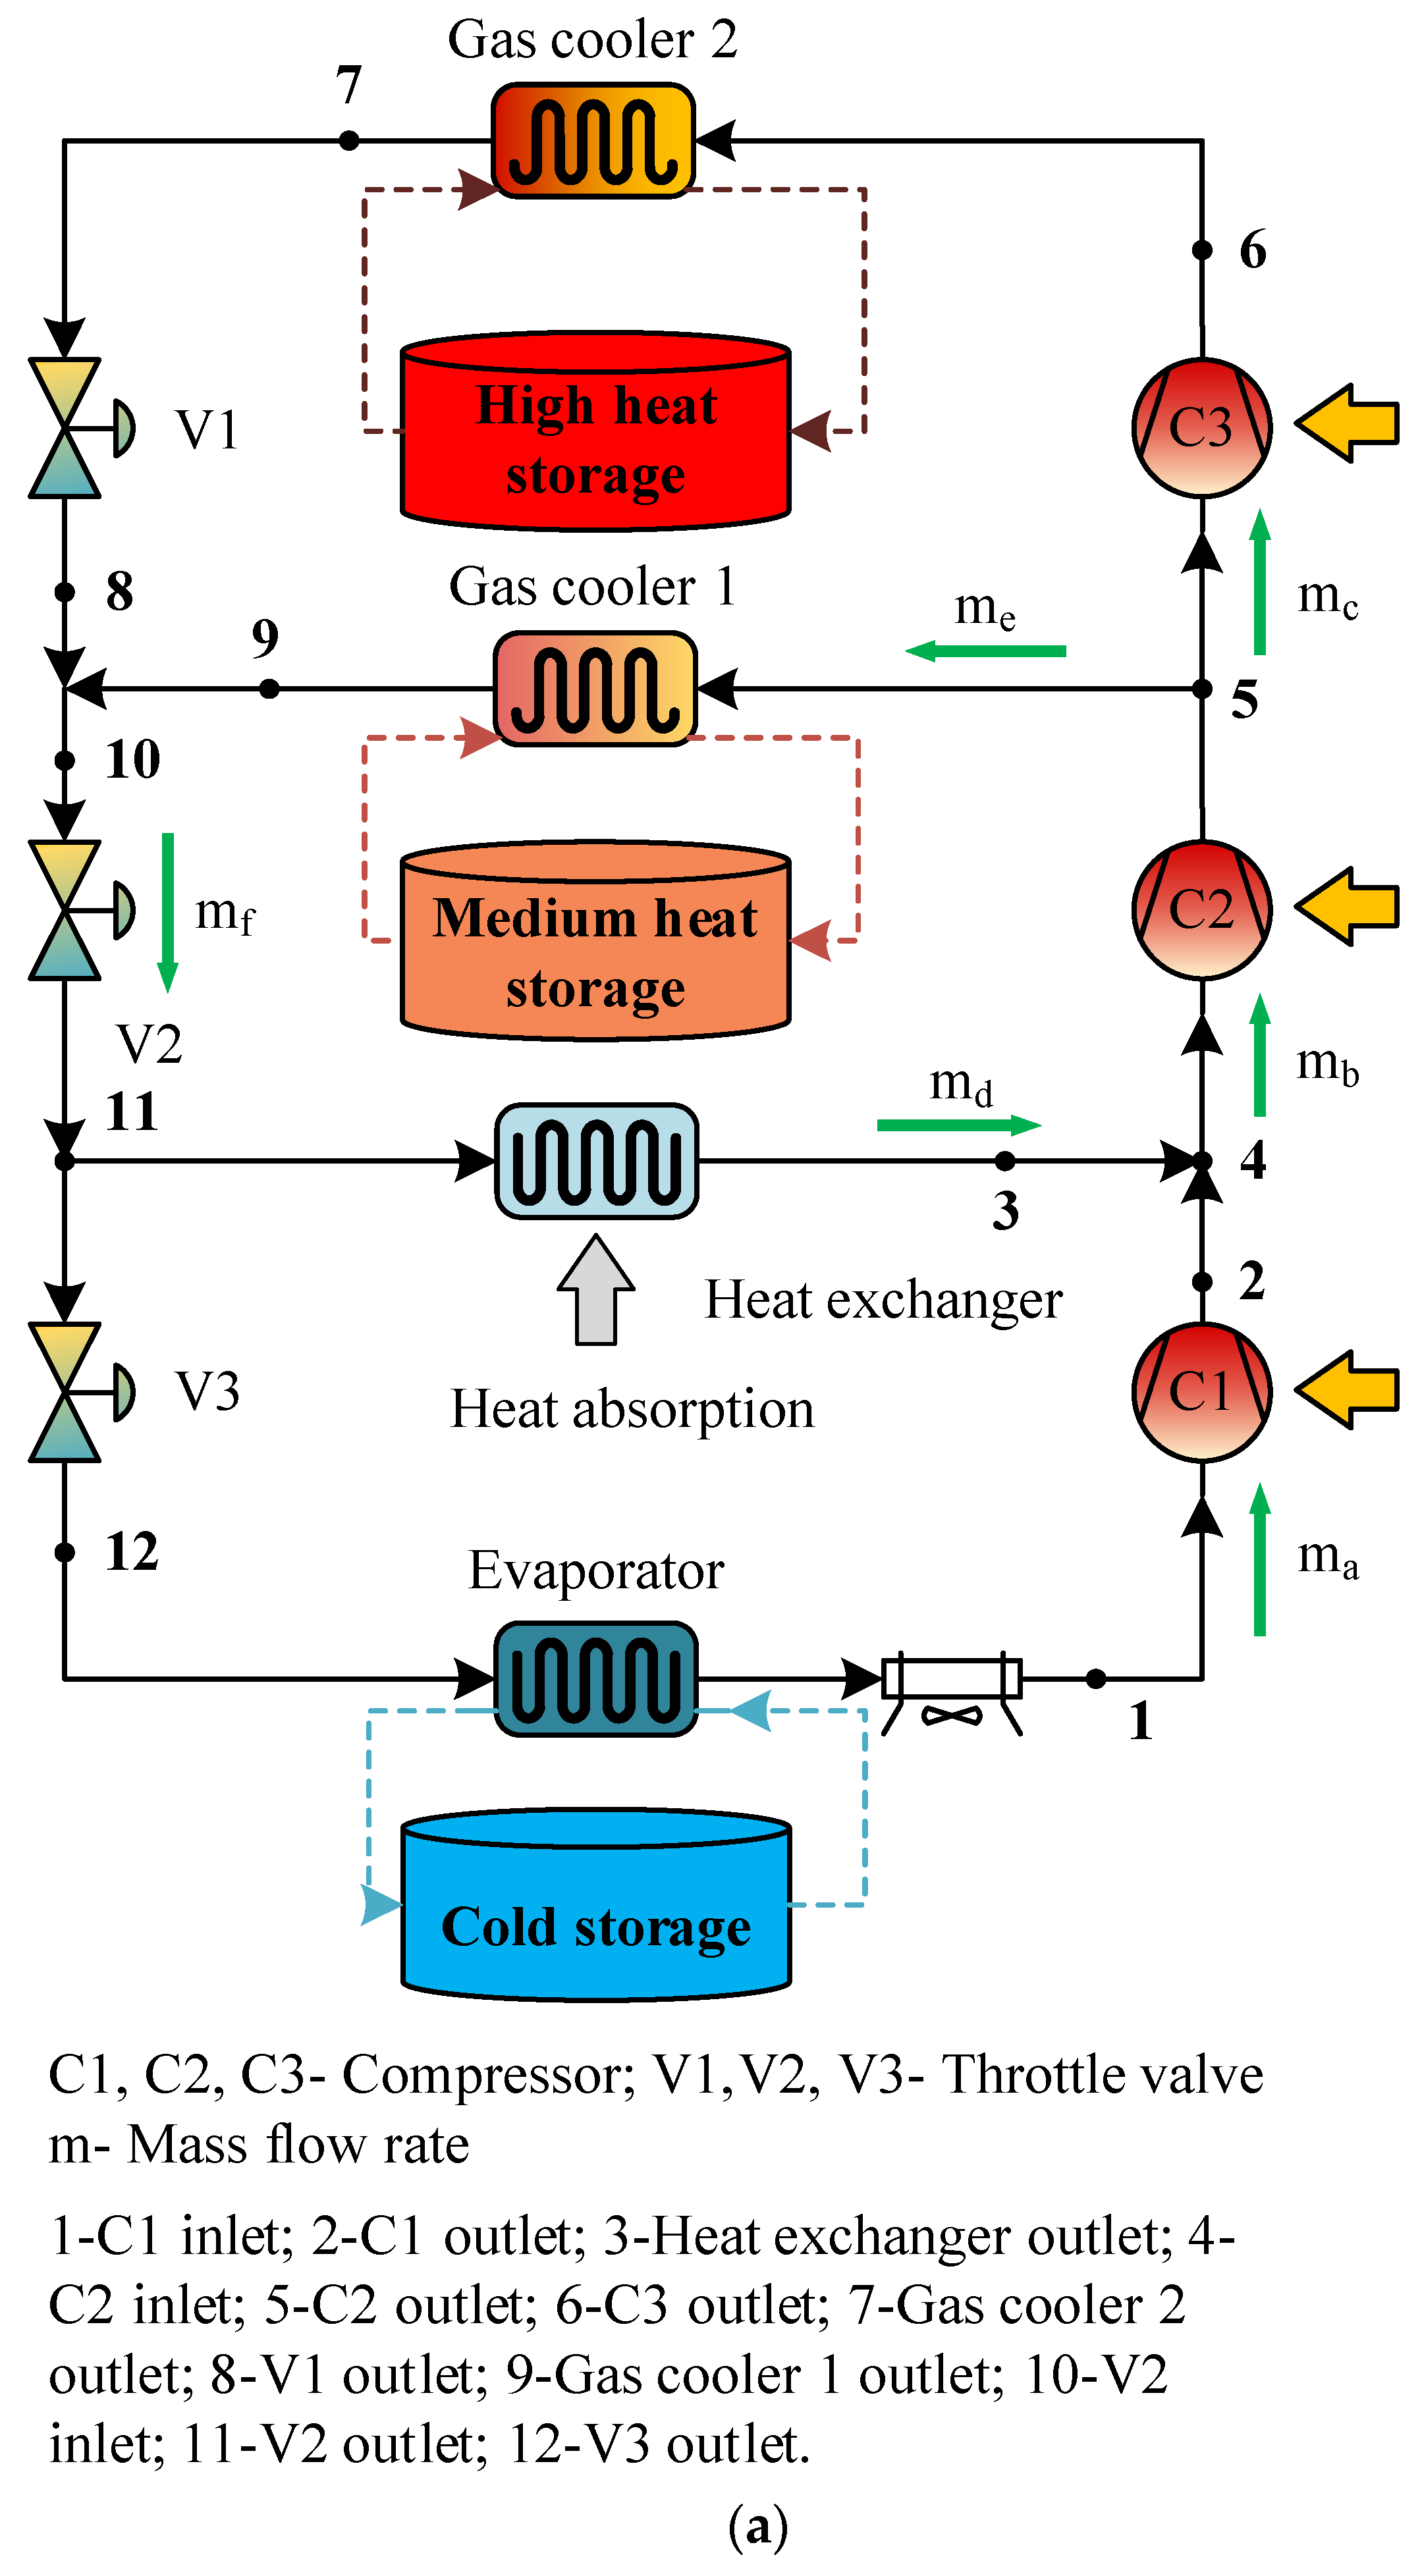
The principle of the multiple energy storage system based on CO2 heat pump energy storage is shown in Figure 1. By compressing the working fluid several times, the heat is stored and utilized in steps, so as to achieve the purpose of storing renewable electricity in the form of cold and hot energy storage fluid. Unlike the conventional pumped thermal energy storage system, which stores electric energy only in the form of cold heat with a large temperature difference in the energy storage unit, the system stores about 0 °C of cold energy on the energy storage side to meet the cooling load demand on the user side. At the same time, it stores 50 °C medium-temperature hot water, which is used to provide domestic hot water for the user side, and it stores the high-temperature heat of about 115 °C for driving the turbine to generate electricity. The system not only can store renewable power, but can also realize the flexible regulation of storage/release of power and meet the demand of multiple loads of heating and cooling in different periods.

2.2. System Process

The heat pump energy storage system is mainly composed of the energy storage cycle and energy release cycle, and the main components are the compressor, heat exchanger, throttle valve, pump, and turbine.
(1)
As shown in Figure 2a, when the system performs the energy storage process, the cycle operation mode is similar to that of a multistage compression heat pump. The initial state of the working fluid of the cycle is 1. From state 1 to 2 is the first stage of compression. The low-temperature and low-pressure CO2 (ma) is mixed with the working fluid (md) after the first stage of compression (C1), becoming stage 4. From state 4 to 5 is the second stage of compression; the mixed working fluid (mb) enters the second stage compressor (C2) to become the medium-temperature and -pressure working fluid. From state 11 to 3 is the heat equilibrium process. The heat exchanger on the md branch is designed to balance the heat of the system by absorbing heat from the air to achieve the thermal balance of the first stage compression circuit. From state 5 to 6 is the third stage of compression. From state 5 to 9 is the process of medium-temperature heat storage in gas cooler 1. After diverting the working fluid after the second-stage compressor, some working fluid (me) is heat exchanged with water in gas cooler 1 for medium-temperature heat storage (50 °C), and the other (mc) enters the third-stage compressor. From state 6 to 7 is the process of high-temperature heat storage in gas cooler 2. After three stages of compression, the working fluid reaches a high-temperature and high-pressure state, and this part of the high-temperature heat is stored in water through the gas cooler 2 for high-temperature heat storage (120 °C). From state 7 to 8 is the process of throttling in throttle valve 1. From state 10 to 11 is the process of throttling in throttle valve 2. The working fluid of the outflow gas cooler is medium-temperature and high-pressure supercritical CO2, which enters the first-stage throttle to become the medium-temperature and medium-pressure working fluid, and then, enters the second-stage throttle after mixing (mf) with the medium-temperature heat transfer working fluid (me). From state 11 to 12 is the process of throttling in throttle valve 3. From state 12 to 1 is the cooling process in the evaporator. After two throttling processes, the working fluid is divided into two ways: one way (md) absorbs environmental heat for heat balance, and the other way (ma) carries out the third-stage throttling to become low-temperature and low-pressure working fluid, absorbs the heat of the coolant in the evaporator, and restores the initial state of the working fluid.
(2)
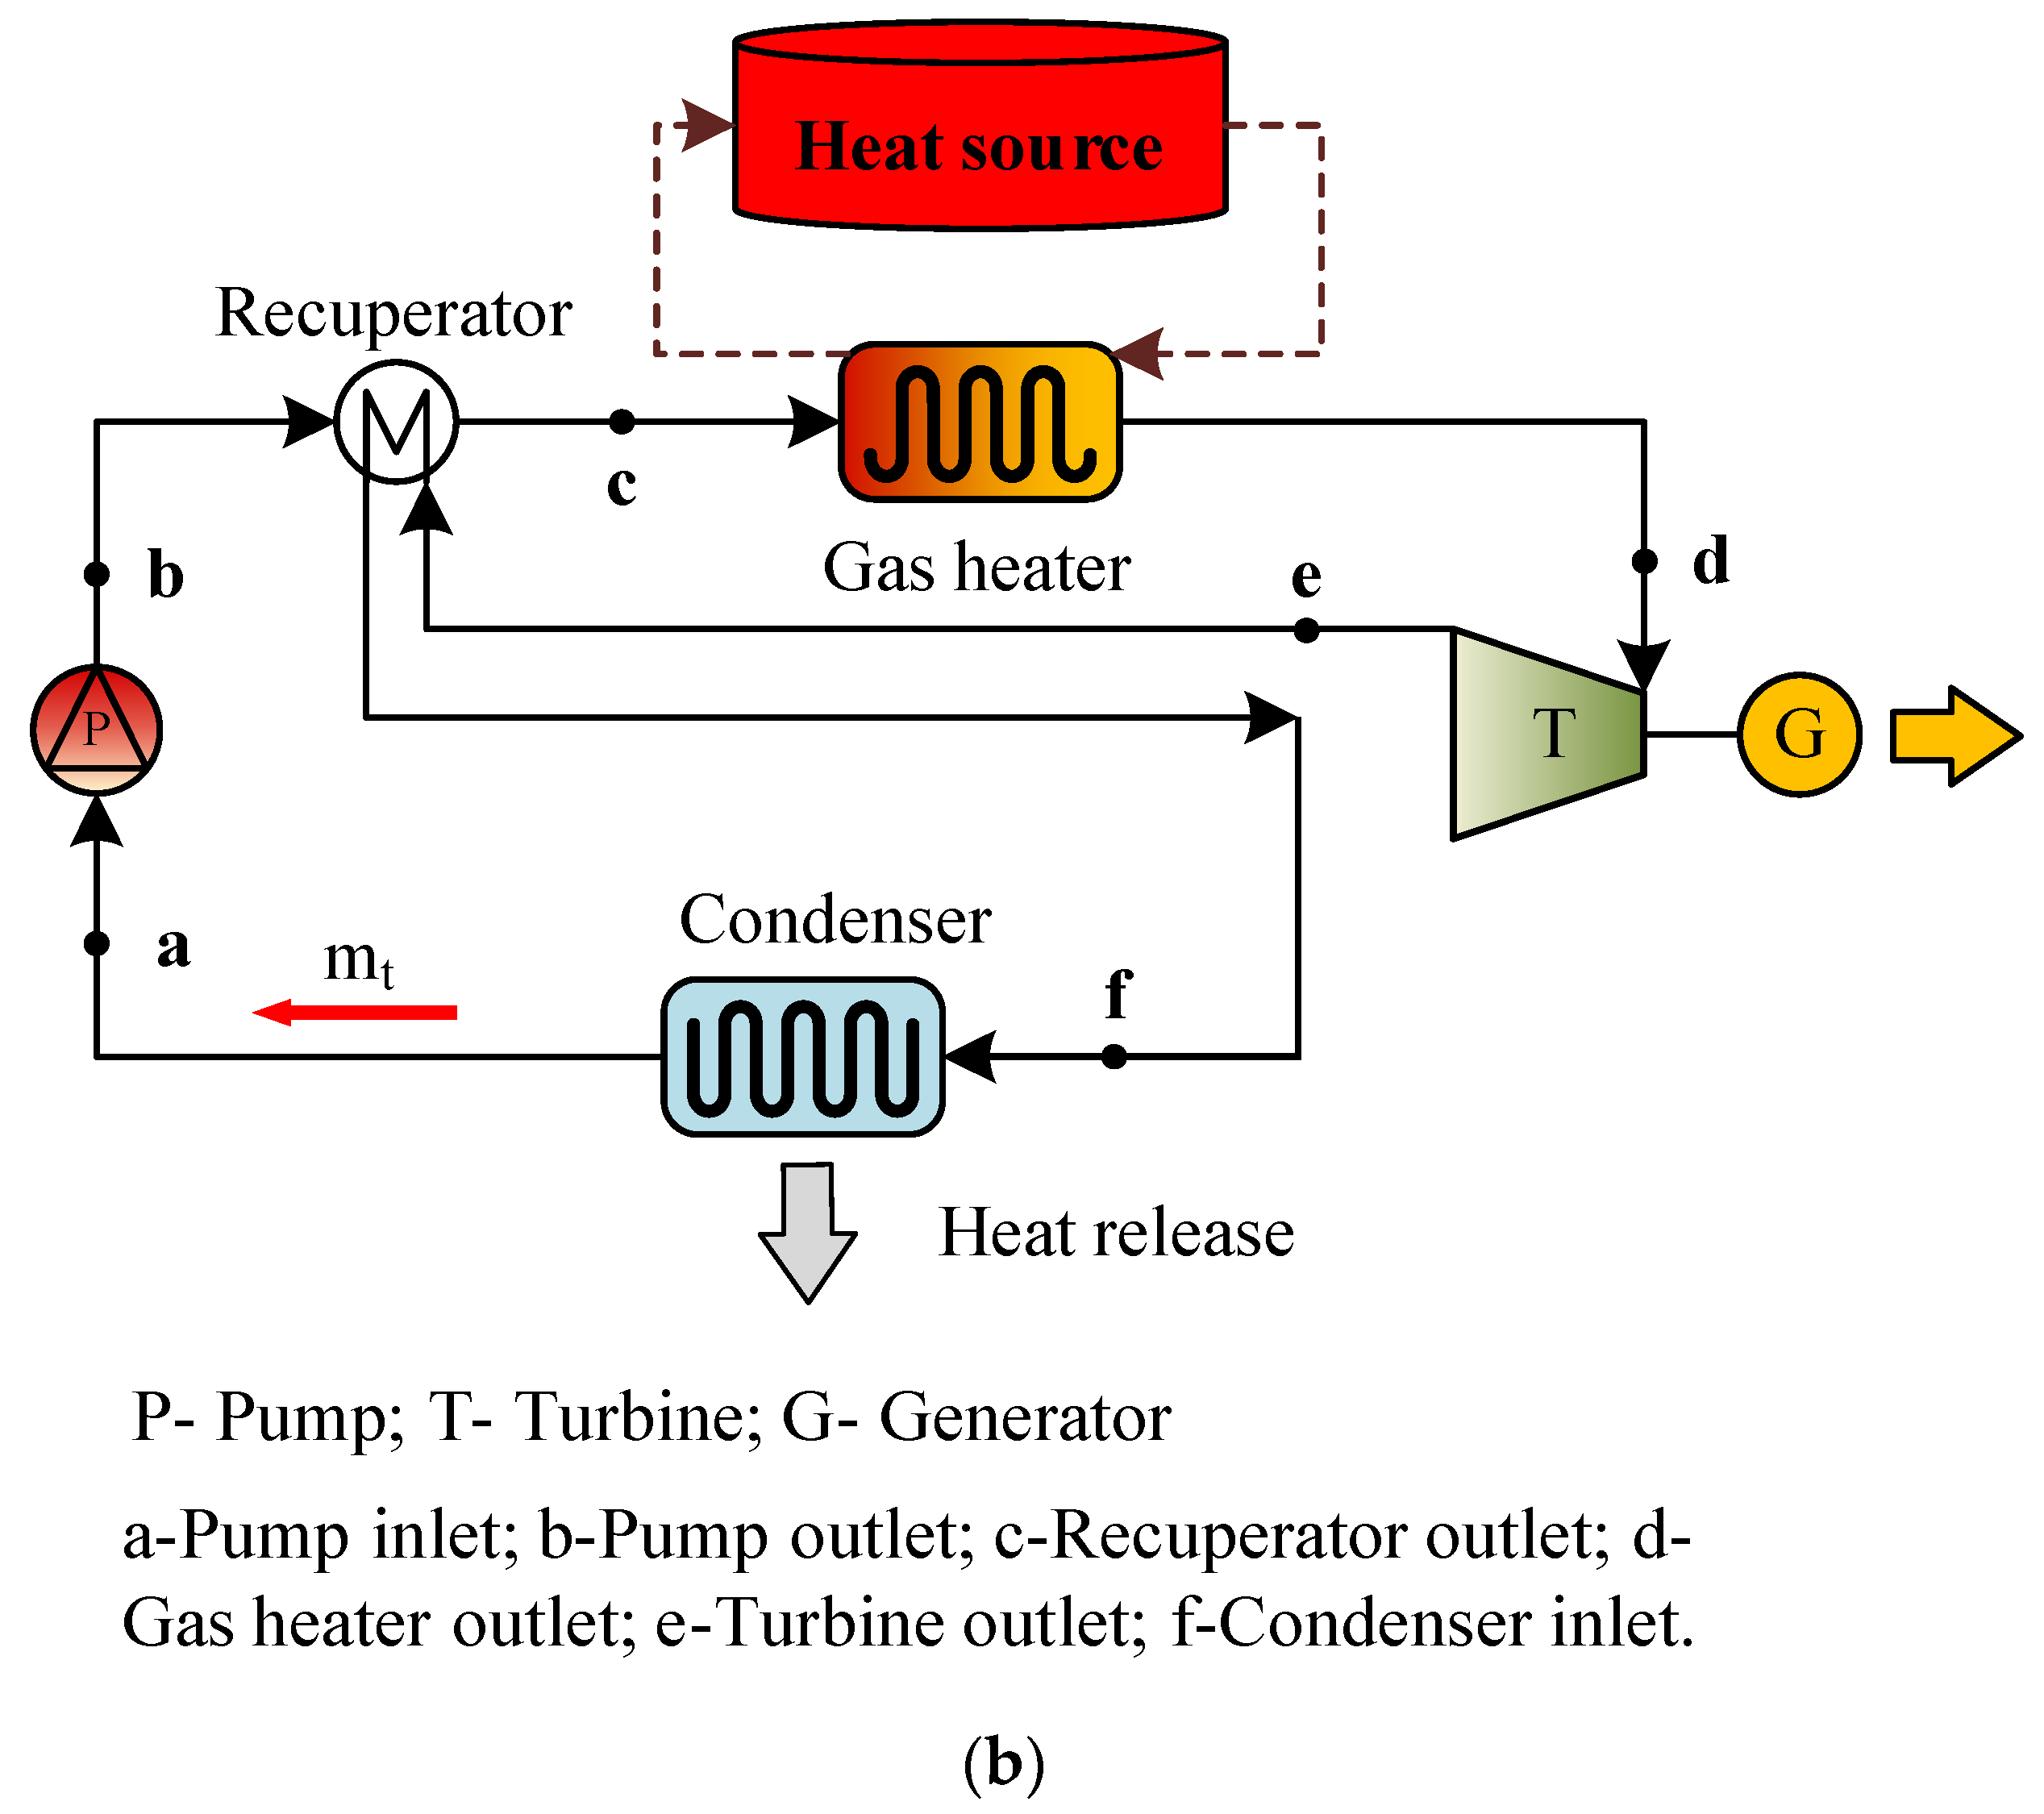
As shown in Figure 2b, the energy release process is the heat engine cycle. From state a to b is the pressurization process in the pump. The low-temperature, low-pressure working fluid (mt) is pressurized by the pump to become the low-temperature, high-pressure working fluid. From state b to c is the heating process in the recuperator. The low-temperature working fluid at state b of the recuperator is exchanged with the waste heat at the turbine outlet. From state c to d is the heating process in the gas heater. From state d to e is the expansion process of the turbine. The working fluid flows into the gas heater and uses the high-temperature heat stored in the energy storage cycle to heat the working fluid, thus becoming the high-temperature, high-pressure supercritical CO2 in the turbine expansion power generation. From state f to a is the cooling process in the condenser. The medium-temperature fluid at the turbine outlet can preheat the working fluid at the outlet of the pump, and the CO2 after heat exchange can further release excess heat to the environment and return to the initial state.

3. Materials and Methods

This section mainly introduces the modeling of the system, models the various components of the system, establishes the performance index of the system, and finally, verifies the validity of the model.

3.1. Mathematical Models

In order to study the thermodynamic performance of the PTES system, it is necessary to establish the thermodynamic model of the main components of the system in order to analyze the overall thermodynamic performance of the system. In the process of building the thermodynamic model of the system, in order to simplify the calculation and analysis process, the following basic assumptions are made:
(1)
The system is in a stable operation state and does not consider the specific heat transfer process;
(2)
The heat transfer loss between the internal and external pipes and compressors and the external environment is ignored;
(3)
The pressure drop of CO2 and energy storage medium in the flow process is ignored, and the flow rate and temperature are evenly distributed;
(4)
Mass conservation is satisfied at each part of the system; that is, the outlet flow of the connected component is equal to the inlet mass of the next component.

3.1.1. Heat Pump Modeling

The working fluid is pressurized in the compressor, and the calculation methods of the isentropic efficiency of the compressor are shown in Equation (1):
η i s , c o m 1 = h 2 s h 1 h 2 h 1 ; η i s , c o m 2 = h 5 s h 4 h 5 h 4 ; η i s , c o m 3 = h 6 s h 5 h 6 h 5
where the subscript “is” indicates isentropic, and the numbers in the subscripts represent different state points.
The input work of each stage compressor is shown in Equation (2):
W C 1 = m a × h 2 h 1 ; W C 2 = m b × h 5 h 4 ; W C 3 = m c × h 6 h 5
where m a , m b , and m c are, respectively, the mass flow rates of the first-, second-, and third-stage compressors.
In the throttle model, the specific enthalpy of the working fluid at the inlet and outlet is the same, and the calculation method is shown in Equation (3):
h 7 = h 8 ; h 10 = h 11 ; h 11 = h 12
In this paper, all the heat exchangers in the system are tube-in-tube heat exchangers. The energy conservation equation of each heat exchanger is shown in Equation (4):
m c × h c , o h c , i = m w × h w , i h w , o
where m c and m w are, respectively, the mass flow rate of working fluid and heat storage fluid; h c , o and h w , o are, respectively, the outlet specific enthalpy of working fluid and heat storage fluid; h c , i and h w , i are, respectively, the inlet specific enthalpy of working fluid and heat storage fluid.

3.1.2. Heat Engine Modeling

According to the theory of heat transfer and engineering thermodynamics, the process of working medium pump doing work to working medium is an adiabatic process, and the calculation method of adiabatic efficiency is shown in Equation (5):
η i s , p = h b s h a h b h a
The output work of pump is shown in Equation (6):
W P = m t × h b h a
where m t is the mass flow rate of heat engine cycle.
According to the theory of heat transfer and engineering thermodynamics, the expansion process in a turbine is an adiabatic process, and the calculation method of adiabatic efficiency is shown in Equation (7):
η i s , t = h d h e h d h e s
The output work of the turbine is shown in Equation (8):
W T = m t × h e h d

3.1.3. Energy Balance Equations and Other Correlations

The calculation method of cold storage capacity Q c o l d is shown in Equation (9):
Q c o l d = m a × h 1 h 12
The calculation method of heat storage at medium temperature Q h o t , m is shown in Equation (10):
Q h o t , m = m e × h 5 h 9
where m e is the mass flow rate of working fluid in gas cooler 1.
The calculation method of heat storage at high temperature Q h o t , h is shown in Equation (11):
Q h o t , h = m c × h 6 h 7
The input work and calculation method of the first-, second-, and third-stage compressors W C 1 , W C 2 , W C 3 is shown in Equation (12):
W C 1 = m a × h 2 h 1 ; W C 2 = m b × h 5 h 4 ; W C 3 = m c × h 6 h 5
The calculation method of total input energy W C is shown in Equation (13):
W C = W C 1 + W C 2 + W C 3
There is mixing of working fluid at point 4, which can be modeled by mass flow balance and energy balance, as shown in Equations (14) and (15):
m a + m d = m b
m a × h 2 + m d × h 3 = m b × h 4
There is mixing of working medium at point 10, which can also be modeled by mass flow balance and energy balance, as shown in Equations (16) and (17),
m c + m e = m f
m c × h 8 + m e × h 9 = m f × h 10
where m f is the mass flow rate of working fluid in throttle valve 2.
By combining the mass flow balance at point 11 and point 4, Equation (18) can be obtained:
m f = m b
The calculation method of heat transfer of gas heater is shown in Equation (19):
Q h = m t × h d h c
The power output of the heat engine cycle W o u t is obtained by subtracting the power consumption of the pump from the output work of the turbine, and the calculation equation is shown in Equation (20):
W o u t = m t × h d h e h b + h a
The heat balance equation of the regenerator is shown in Equation (21):
h c h b = h e + h f
The efficiency of the heat engine cycle can be calculated by Equation (22):
η h e = W o u t Q h

3.2. Thermodynamic Performance Evaluation Indexes

In this article, two performance indexes related to the thermodynamic performance and thermal economic performance of the system are established, and their specific meanings are shown as follows.

3.2.1. Energy Efficiency

The performance coefficient of the CO2 pumped thermal energy storage cycle in this paper can be compared with that of the conventional heat pump system. Since the energy efficiency in this article mainly focuses on the conversion and utilization efficiency of electric energy, and it focuses on the energy utilization capacity in the system process of electric energy storage and release, the power consumed by pumping the working medium and heat storage fluid is ignored. The ability to convert electrical energy into electricity and heat and cold energy is the ability of energy utilization to measure the comprehensive thermal performance of the system. It is defined as the ratio of the sum of the cold storage capacity of the heat pump, the medium-temperature heat storage capacity, and the net electric energy of the heat engine cycle output system to the total electric energy of the heat pump cycle input system through the compressor, as shown in Equation (23):
η a l l = Q c o l d + Q h o t , m + W o u t W C

3.2.2. Total UA Value

When calculating the thermal economic performance of the heat exchanger, the U A value is usually used to represent the product of the heat transfer area and the total heat transfer coefficient. Therefore, the U A value can also be interpreted as heat exchanger performance. For the same fluid, when the heat exchanger model is determined, the total heat transfer coefficient is basically determined. The greater the U A value of the heat exchanger, the greater the heat exchange area required, the higher the cost of heat storage, and the higher the cost of the heat exchanger [22]. This paper defines the total U A value of the heat pump/heat engine cycle, which is the sum of the U A values of the heat exchanger in the charge/discharge cycle. The specific calculation equation is shown in Equation (24):
U A a l l = U A h p + U A h e
Taking the heat pump cycle heat storage process as an example, the calculation equation of the logarithmic mean temperature difference in the heat transfer process is shown in Equation (25).
It should be noted that the logarithmic mean temperature difference here refers to the temperature difference between the working fluid and the heat-storage fluid in the gas cooler and gas heater, and the value of the logarithmic mean temperature difference depends on the inlet and outlet temperatures of the working fluid and heat-storage fluid. For the heat-transfer process in the evaporator, because it is an isothermal process, the initial value of the heat transfer temperature difference is set to 5 °C.
Δ T h o t = T c i T w o ( T c o T w i ) ln T c i T w o T c o T w i
The equation for calculating the U A value of each heat exchanger is shown in Equation (26):
U A = Q / Δ T h o t

3.3. Model Validation

Based on the thermodynamic model built in this section and combined with the design parameters of each component in reference [23], the operating parameters of the system components in the literature were validated. The specific design parameters and values of the system in [23] are shown in Table 1. Table 2 shows the model validation results of the system. The error analysis index in the process of model verification is relative error x, and its calculation method is shown in Equation (27) [24]:
x = C a l c u l a t i o n   v a l u e s R e f e r e n c e   v a l u e s R e f e r e n c e   v a l u e s
According to Table 2, based on the system model established in this section and the design parameters of the literature, the relative error of output work of the turbine in each parameter of the system is the maximum of −4.2%, and the relative error of all parameters is less than 5%. The above data show that the calculation error of the model established in this paper is relatively small, and the calculation results of the model are acceptable.

4. Results and Discussion

The thermodynamic performance of the PTES system depends on the design parameters of the heat pump and the heat engine, so the design parameters of the heat pump and the heat engine should be considered comprehensively when evaluating the thermodynamic performance of the system. In all key design parameters of the heat pump and heat engine, four sets of design parameters are considered according to the operation characteristics of bidirectional conversion, and the thermodynamic performance of different sets of design parameters is comprehensively analyzed and evaluated. This section uses the evaluation indicators proposed in Section 3.2 as the basis, and when one set of parameters is investigated, the other parameters retain the default values shown in Table 3 and the influence law of the system’s thermal performance with the changes of the following four groups of key parameters. The thermophysical properties of the working fluid were obtained by using REFPROP v9.1 software developed by NIST in MATLAB.

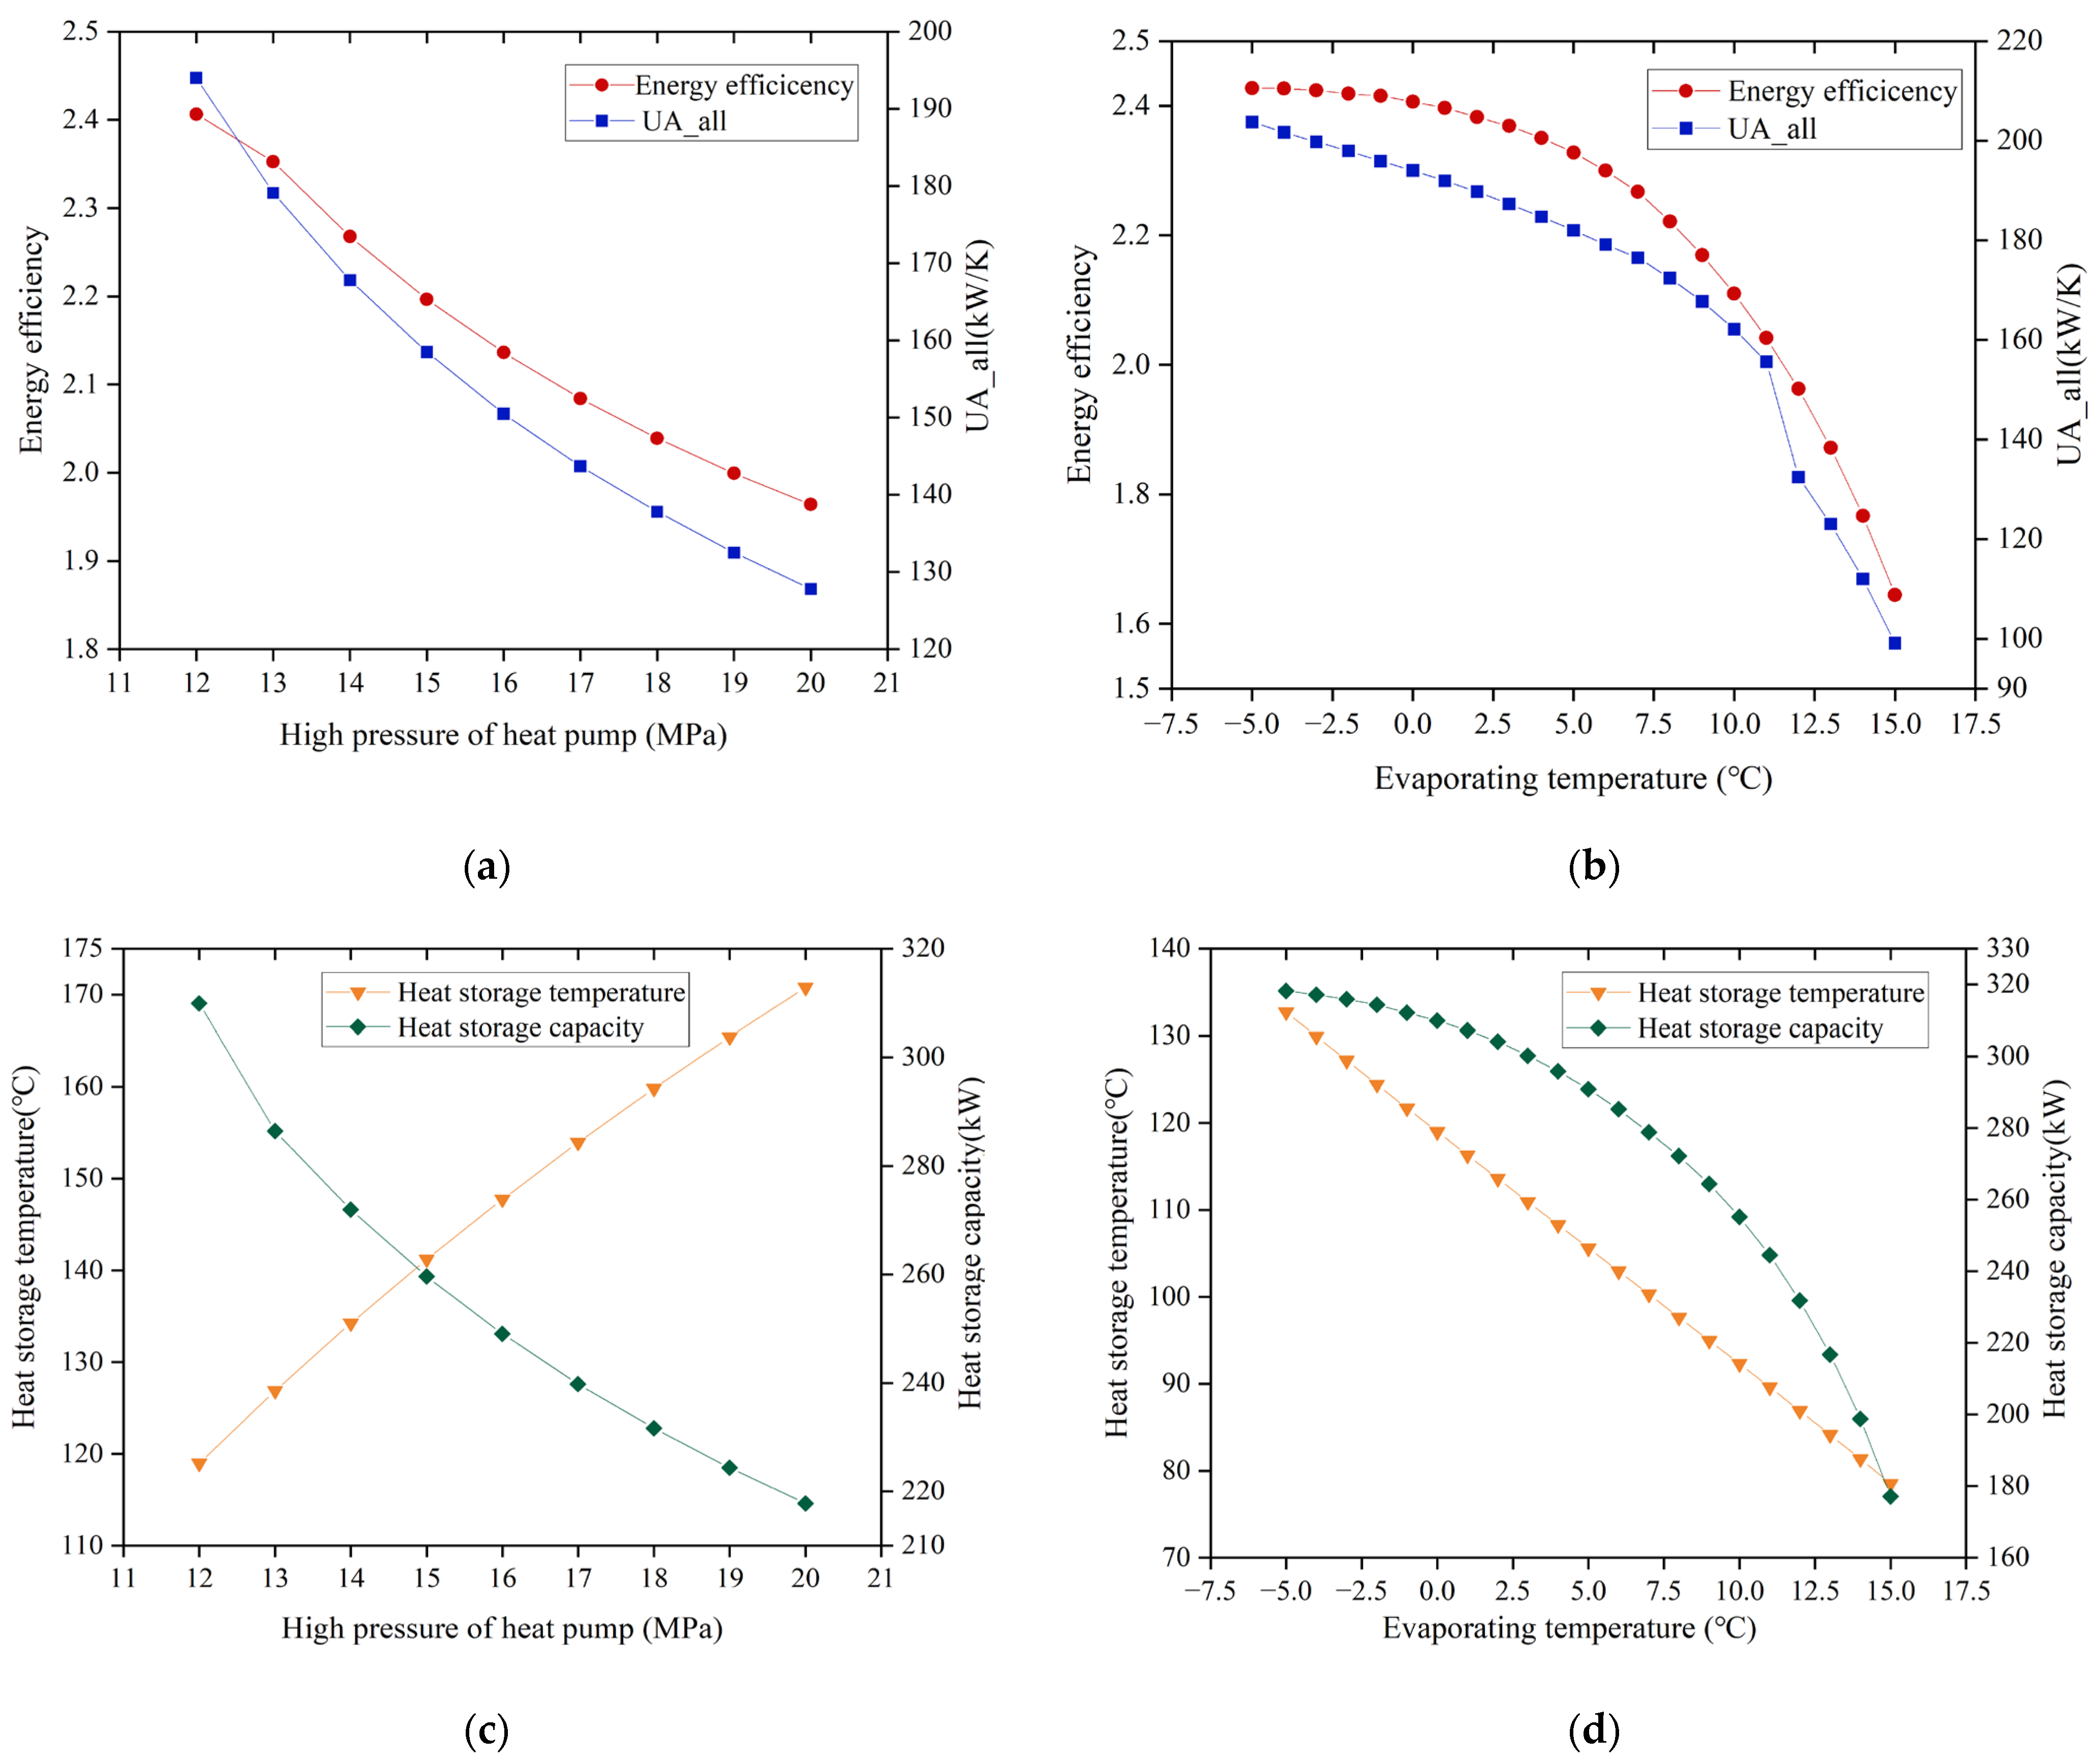
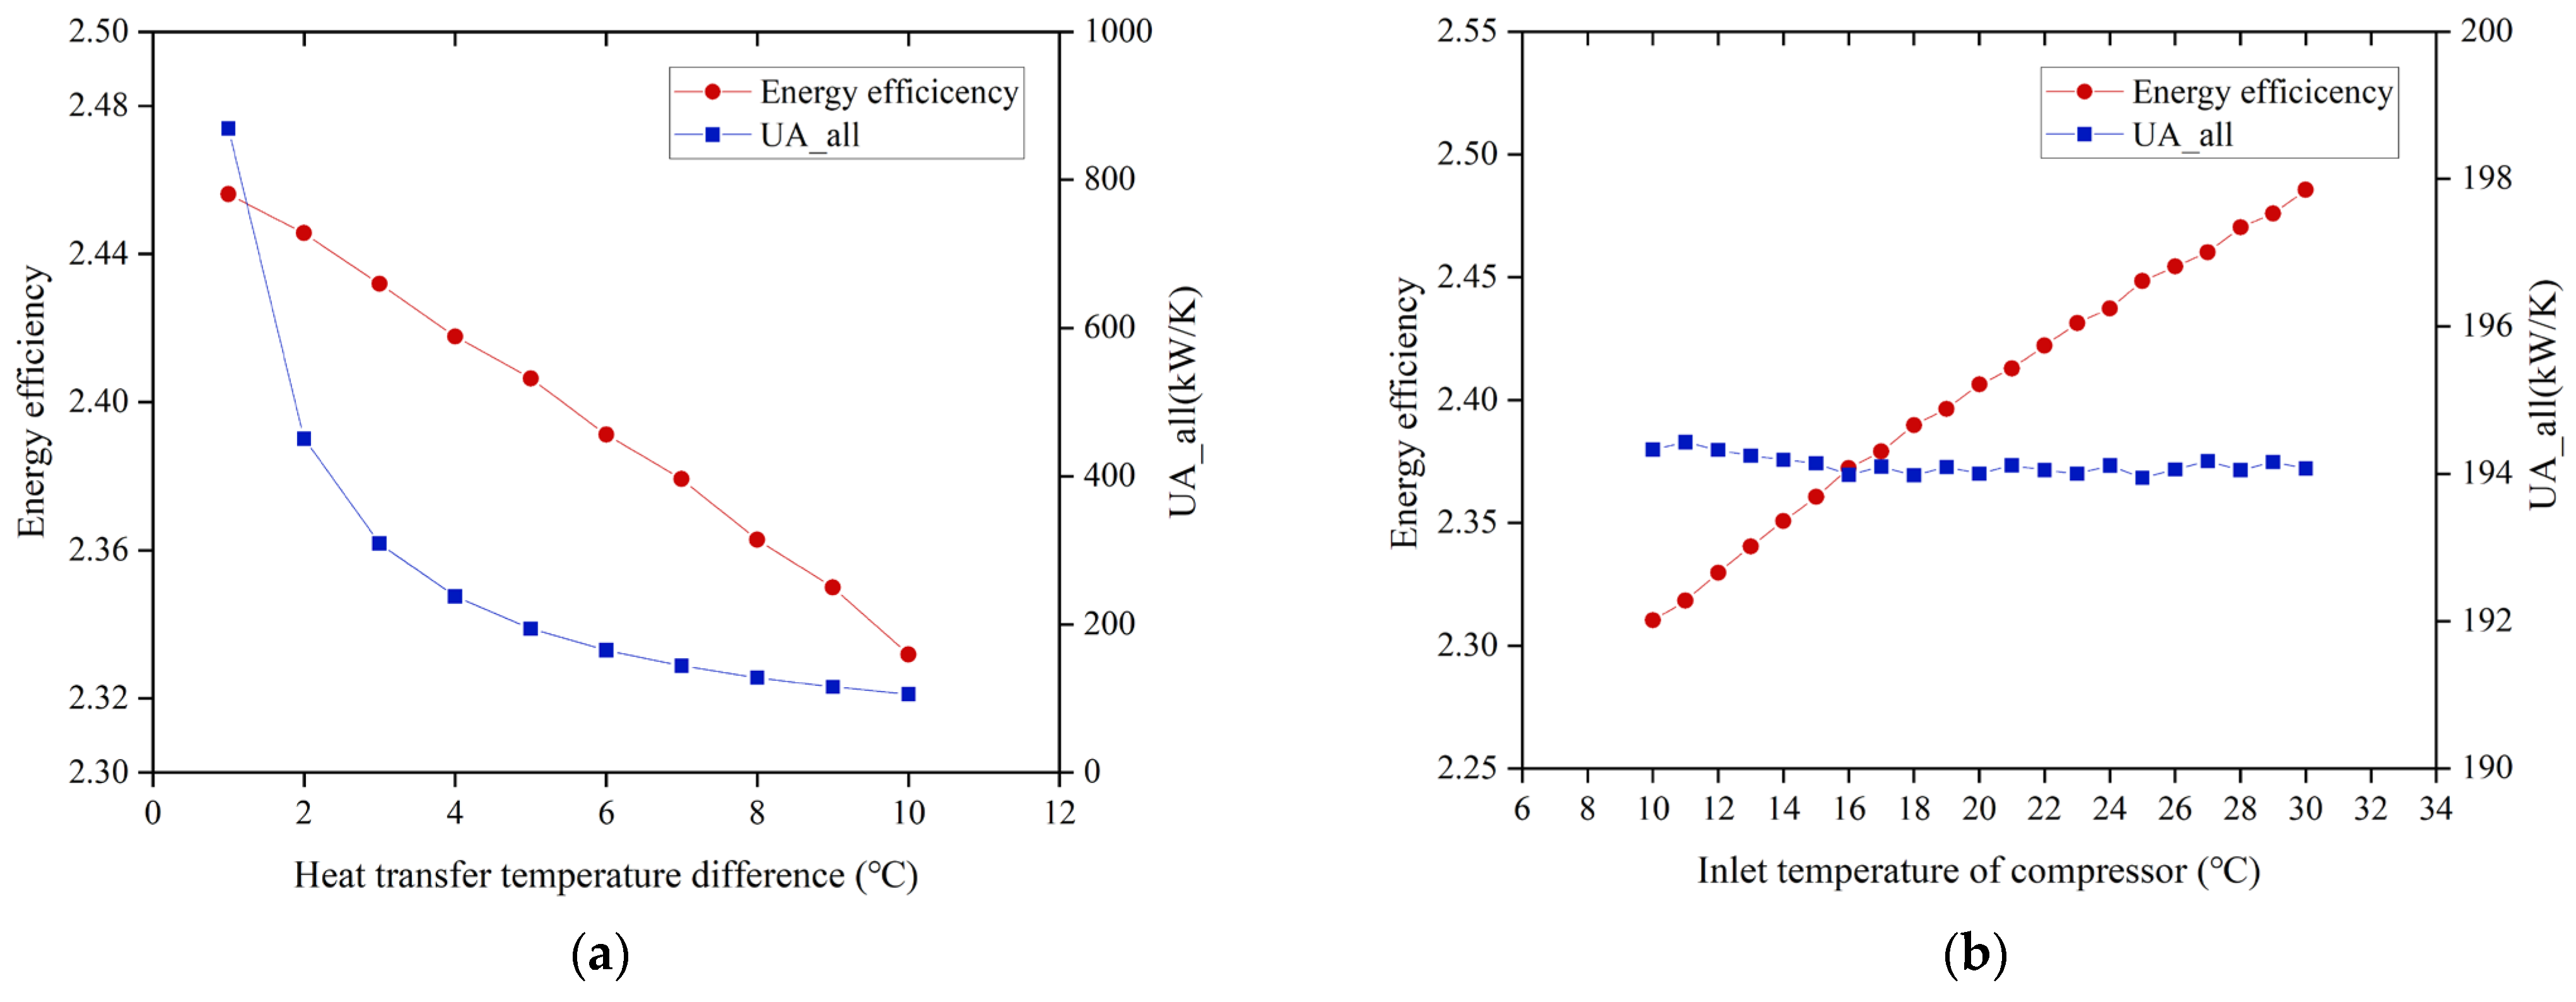
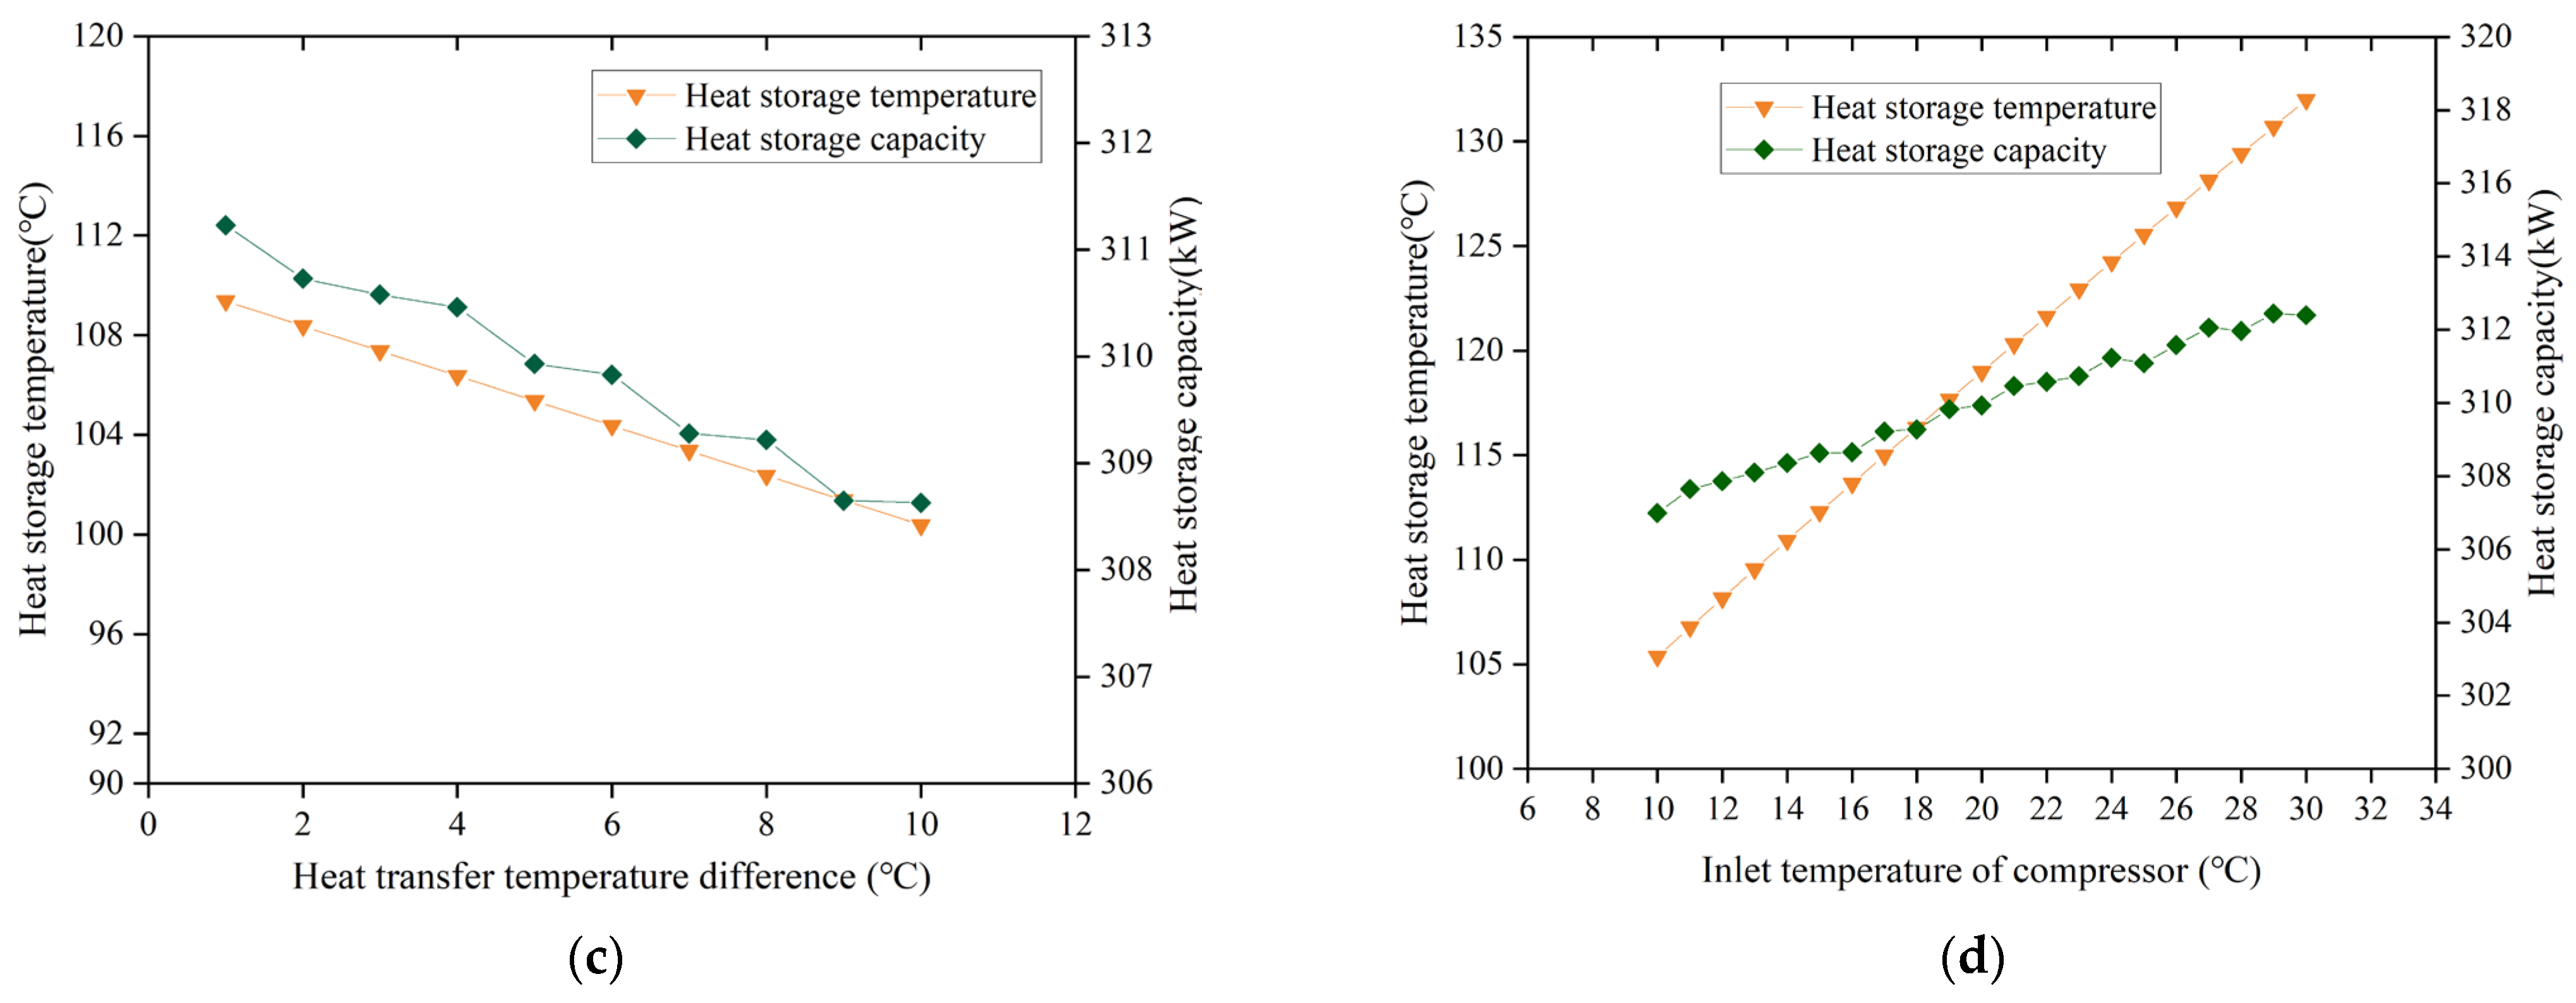
4.1. Critical Parameters of Heat Pump

The high pressure of the heat pump P h p and the evaporating temperature T e v a represent the key parameters of the heat pump cycle, which represents the pressure range of the heat pump cycle operation and has a significant impact on the energy storage process, so it is necessary to explore the influence of these parameters on the overall thermodynamic performance.
Figure 3 shows the results of η a l l and U A a l l with respect to P h p and T e v a : η a l l and U A a l l decrease as P h p and T e v a increase. This is because when P h p increases, the outlet enthalpy of the compressor increases while the inlet enthalpy stays the same, and the compressor’s work consumption and heat storage temperature increase. Since the heating temperature of the working medium of the heat engine cycle is affected by the heat storage temperature, the discharge energy increases, so U A a l l decreases. On the other hand, when T e v a increases, the inlet enthalpy of the compressor increases while the outlet enthalpy remains unchanged, resulting in a decrease in the enthalpy difference between the inlet and outlet of the compressor, further reducing the input electrical work, but the increment of cold storage capacity is greater than the decrease in the compressor power consumption. In addition, T e v a does not affect the energy release cycle, which means that the output energy is unchanged, and eventually η a l l is reduced.
As shown in Figure 4, the heat storage temperature increases with the increase in the high pressure of the heat pump, but it decreases with the increase in the evaporation temperature, because although the compressor inlet enthalpy increases, the flow rate of the circulating working fluid decreases. When P h p = 12   M P a and T e v a = 5   ° C , η a l l of the system reaches the highest value of 2.43. The change trend of U A a l l is the same as that of η a l l , and the minimum value of U A a l l is 61.32 kW/K when P h p = 20   M P a and T e v a = 15   ° C are used.
The results show that although the system performance decreases when the heat pump pressure and evaporation temperature are increased, the economic performance of the system can be increased. It is impossible to obtain the best economic performance and the highest energy efficiency at the same time under the same working parameters, so those working parameters need to be optimized to achieve a better compromise performance.

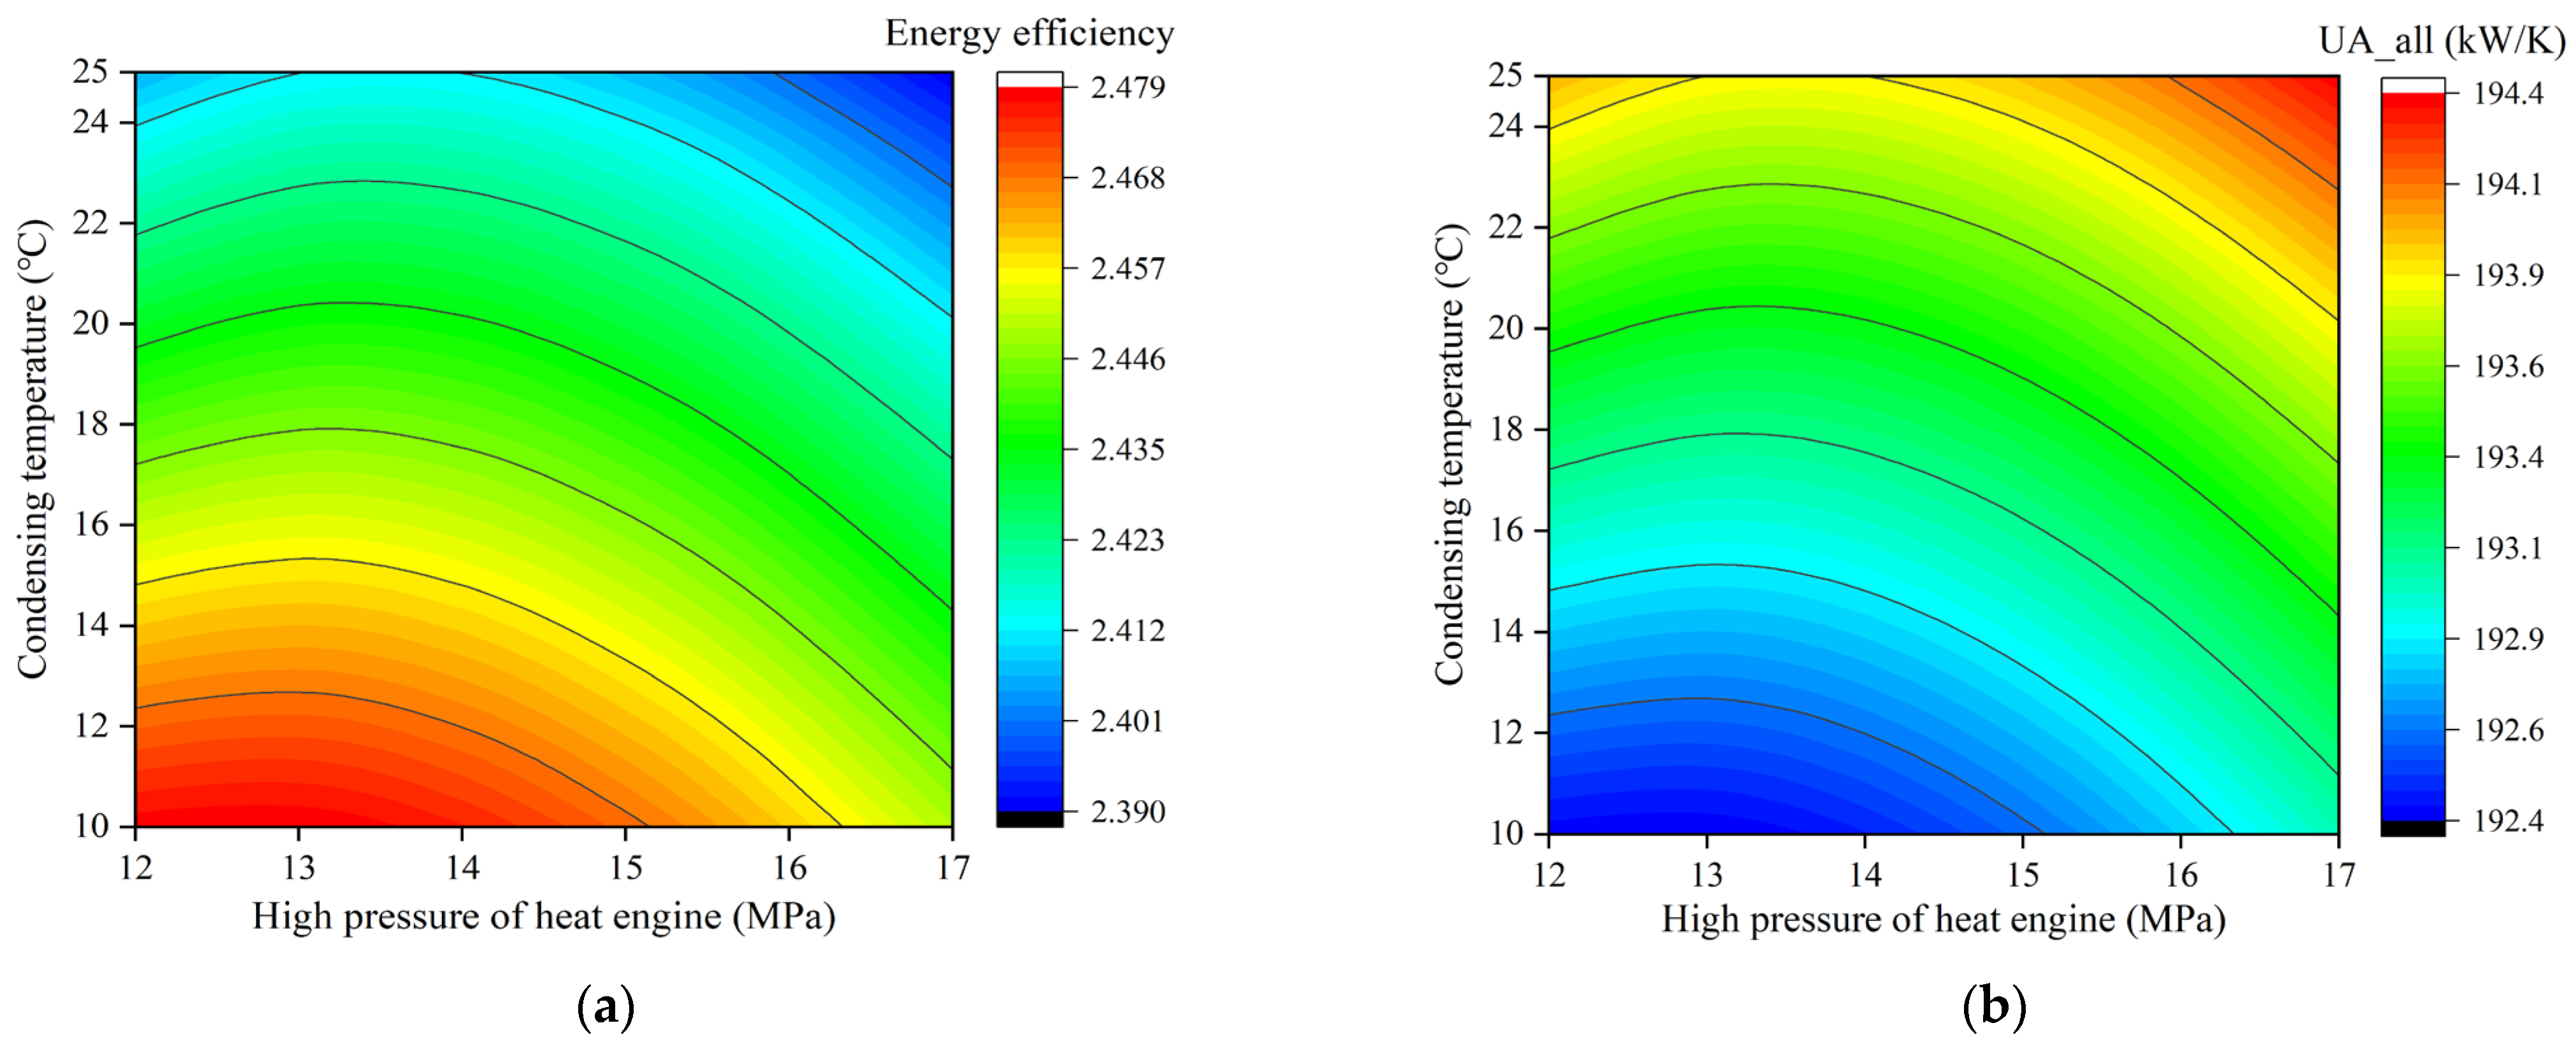
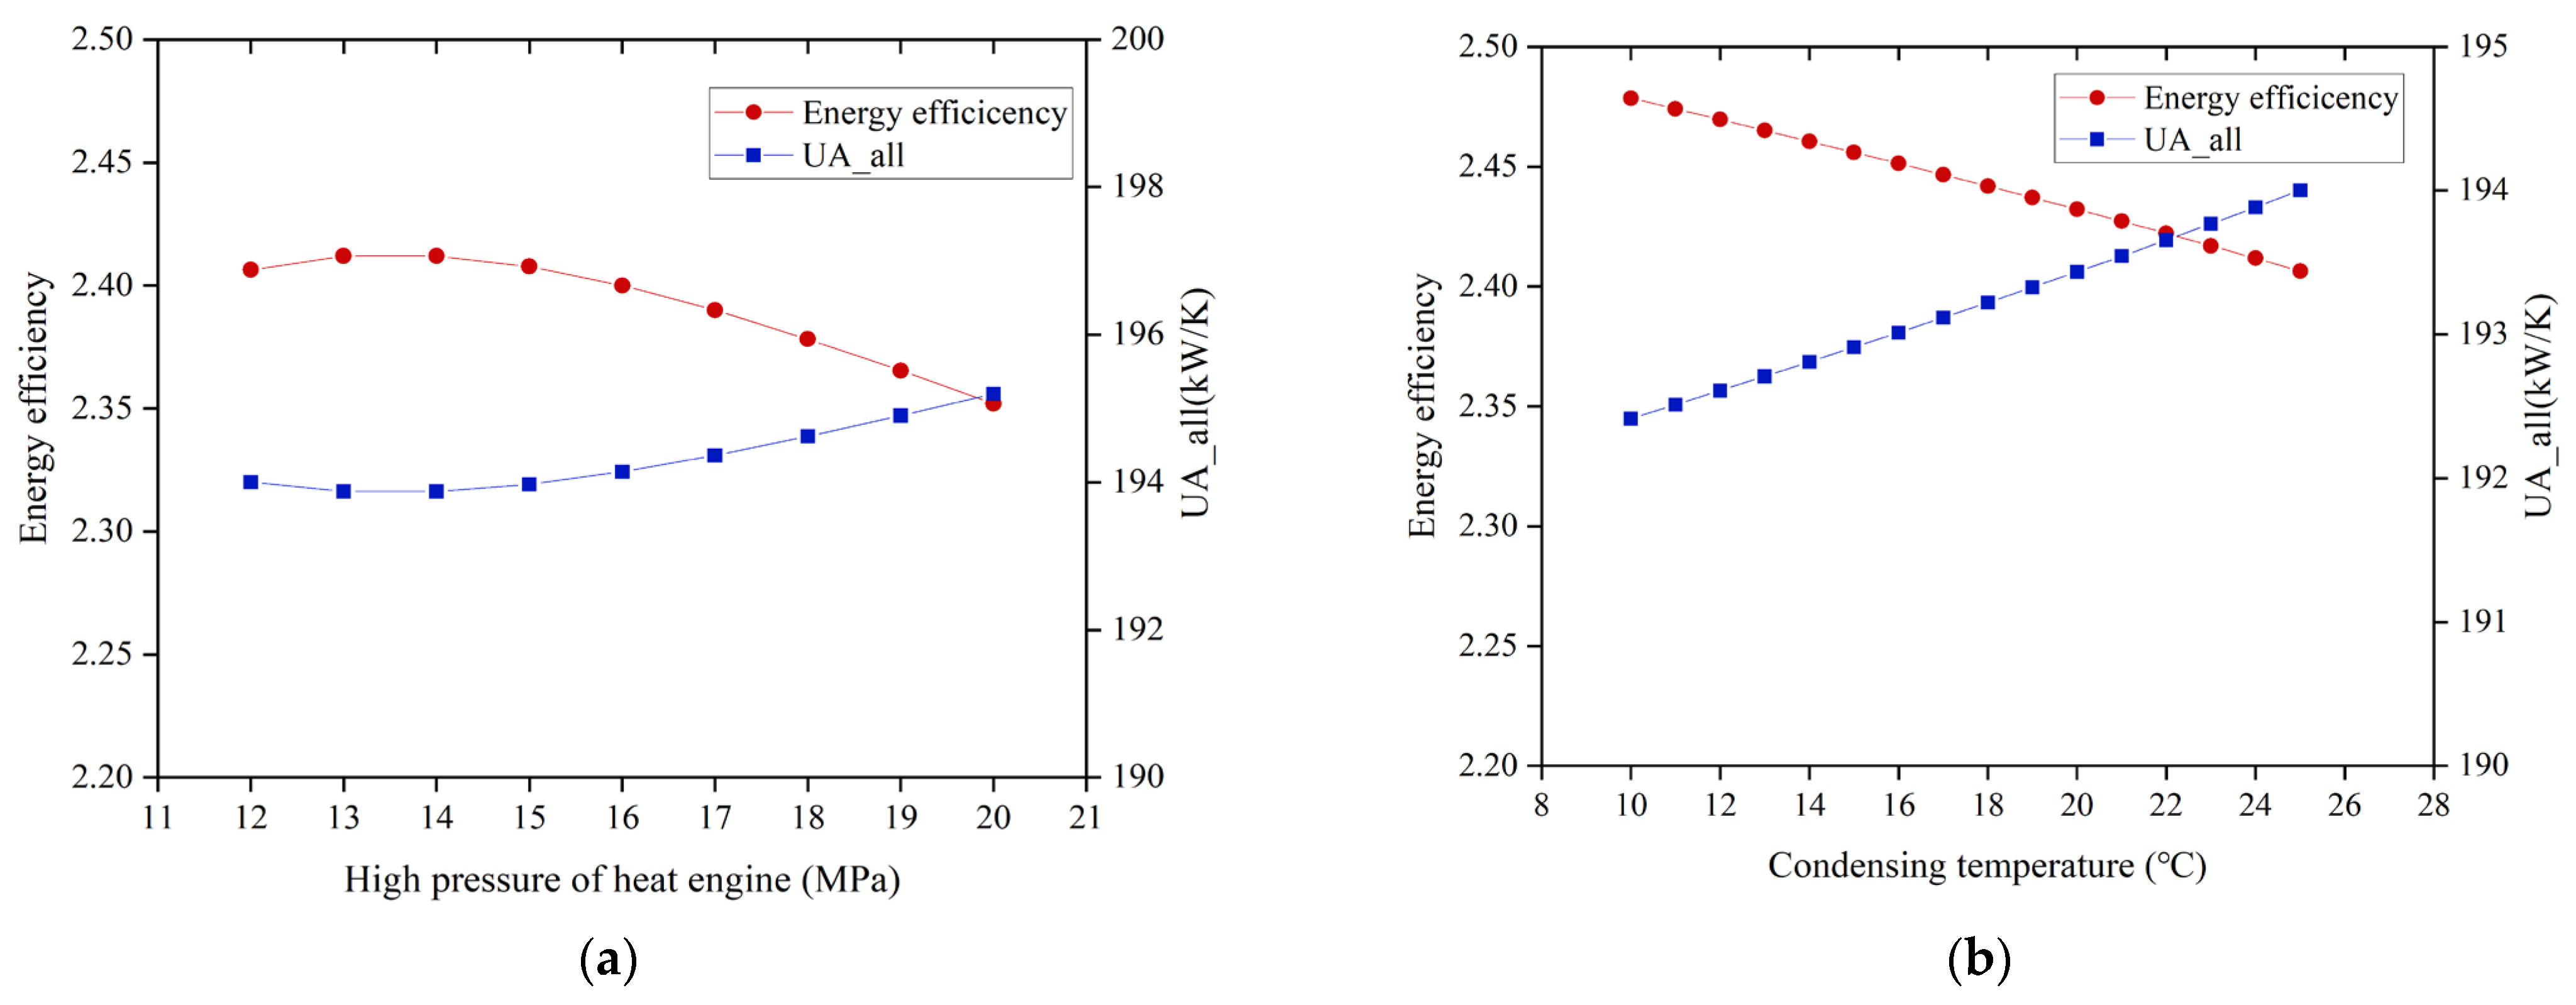
4.2. Critical Parameters of Heat Engine

The high-pressure P h e and condensing temperature T c o n d of the heat engine represent the key parameters of the heat engine cycle and reflect the pressure range of the heat engine cycle, which has a significant impact on the energy release process, so it is necessary to analyze the influence of these parameters on the overall thermodynamic performance.
Figure 5 shows the results of η a l l and U A a l l as a function of P h e and T c o n d . It can be seen that the change in η a l l and U A a l l with the heat engine parameters is not simply a linear relationship. However, the rate of change in U A a l l is less than 5%, and it can be approximated that U A a l l changes little with P h e and T c o n d . Therefore, this paper mainly studies the influence of P h e and T c o n d on η a l l . When the influences of pressure and condensing temperature are studied separately, as shown in Figure 6, when P h e increases, η a l l increases slightly and then decreases, mainly because the change in P h e causes a decrease in turbine inlet enthalpy, which leads to a decrease in discharge, and finally makes η a l l show a downward trend, reaching the highest value of 2.41 at approximately P h e = 13.6   M P a . With the increase in P h e , U A a l l decreases slightly at first and then increases. Contrary to the change trend of η a l l , the minimum value of U A a l l at P h e = 13.9   M P a is 193.9 kW/K.
According to the calculation results, since the parameters of the heat pump are almost unaffected when the critical parameters of the heat engine are studied, the heat storage temperature at this stage is always 119.8 °C, and the heat storage is 310.7 kW. Although the system performance index and heat storage capacity show a nonlinear change trend with the change in the critical parameters of the heat engine, the rate of change is less than 5%, so it can be approximated that the critical parameters of the heat engine have little influence on the system performance.

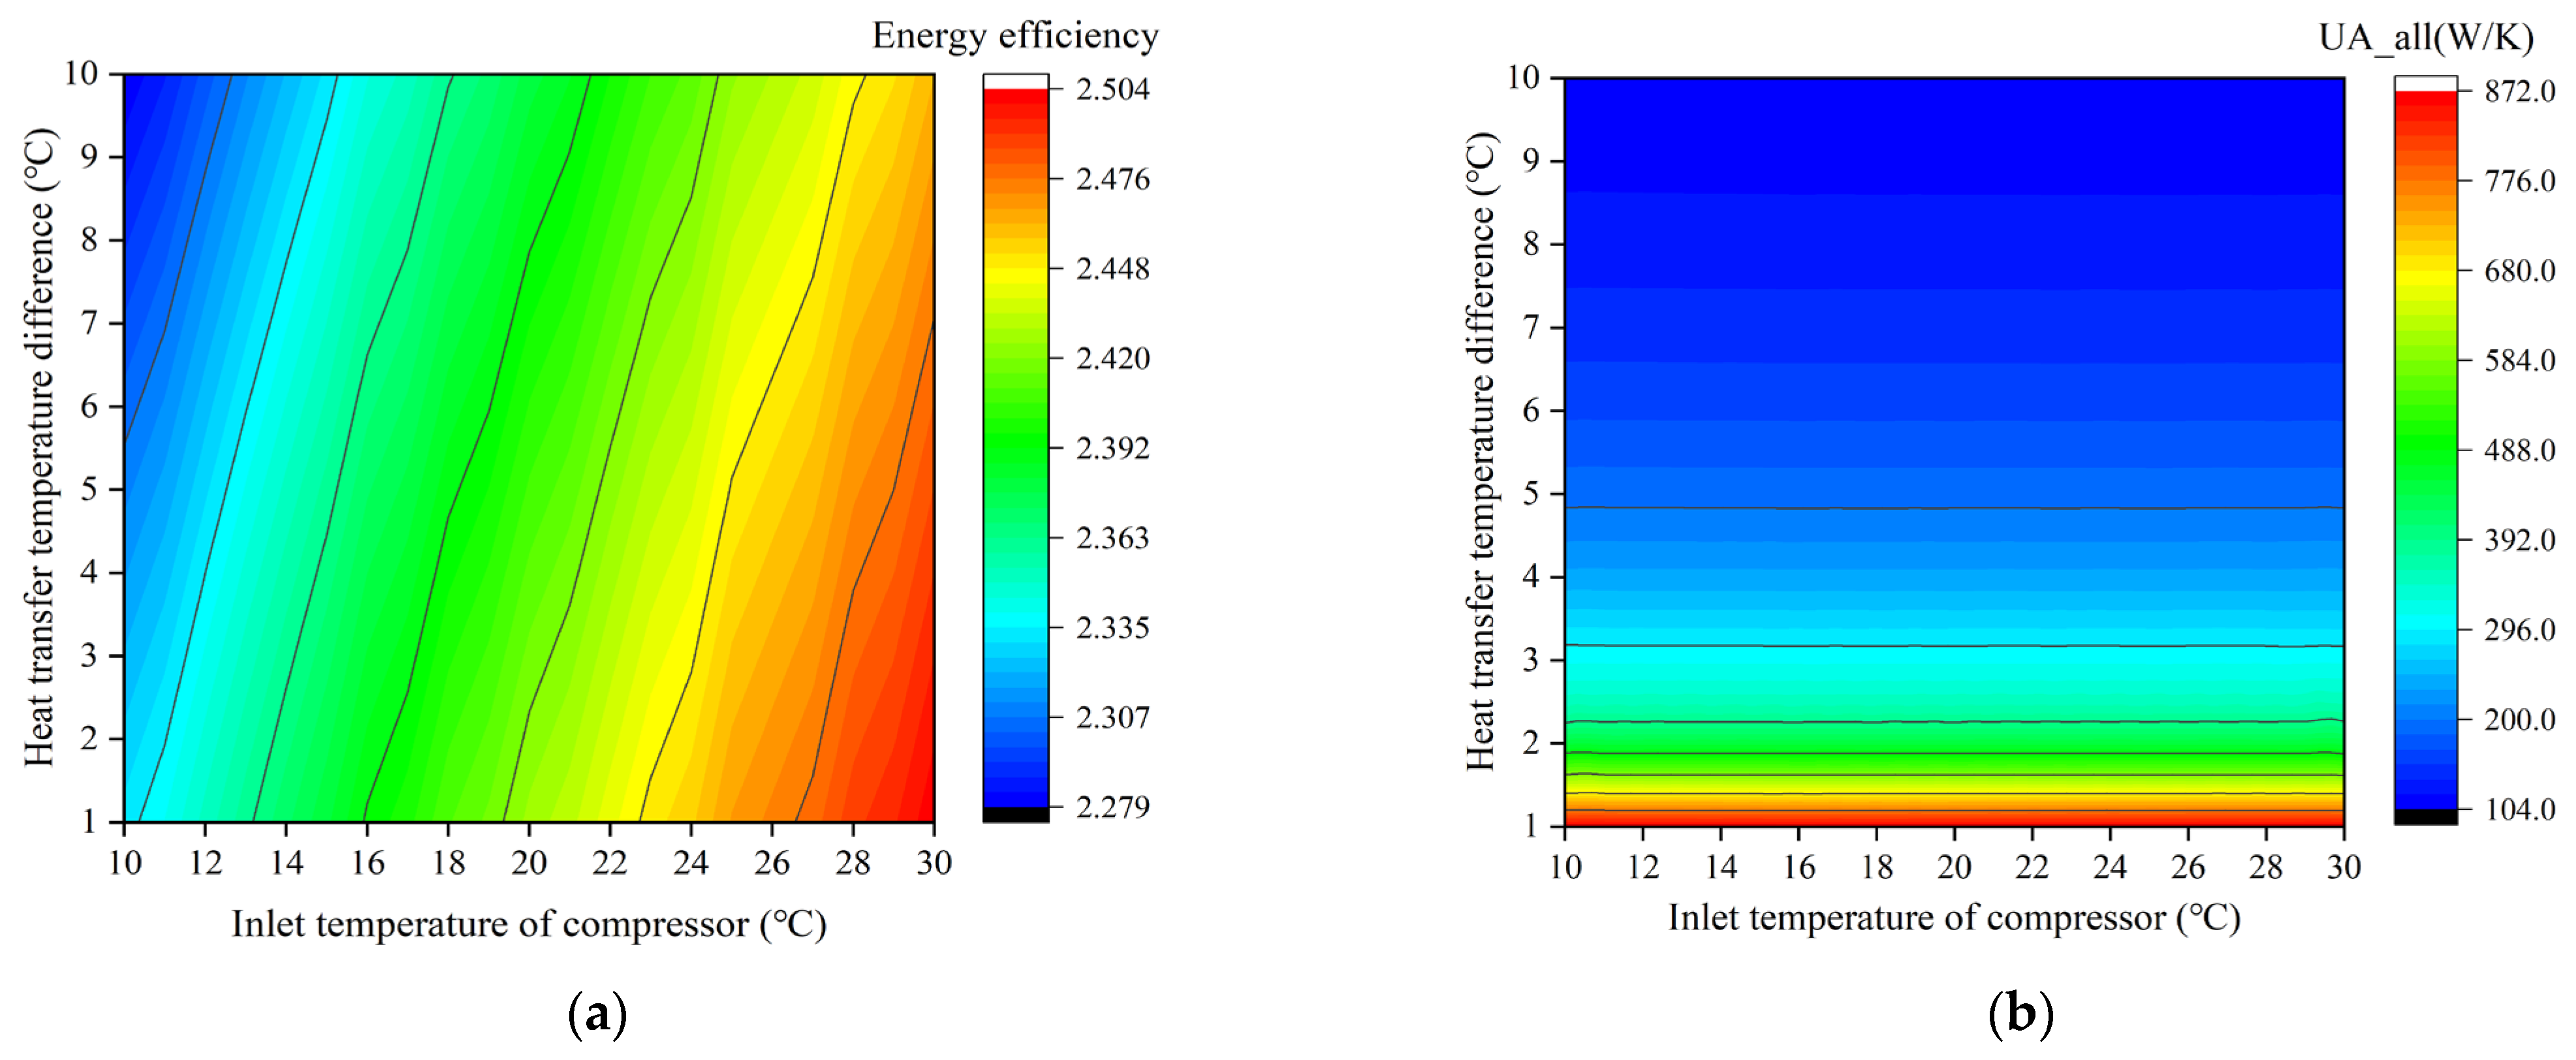
4.3. Coupling Parameters of Charge/Discharge System

This set of parameters reflects the influence of heat storage temperature on the overall thermodynamic performance of the energy storage/release cycle. When the evaporating temperature is determined, the heat exchange temperature difference in the heat exchanger determines the temperature of the cold storage medium, which affects the energy utilization effect of the energy storage/release cycle. Moreover, the inlet temperature (superheat) of the compressor is also one of the key factors affecting the heat storage temperature, so it is necessary to explore the influence of these two coupling parameters on the overall thermodynamic performance.
The effects of Δ T and T c o m on η a l l and U A a l l are shown in Figure 7 and Figure 8. It can be seen that η a l l increases with the increase in T c o m and decreases with the increase in Δ T . U A a l l decreases as Δ T increases but is almost unaffected by T c o m . When T c o m increases, the compressor outlet temperature increases, the heat storage increases, and the discharge power also increases, so the energy efficiency increases. When Δ T increases, the cold storage temperature increases and the heat storage temperature decreases, resulting in a decrease in the cold storage capacity, which in turn leads to a decrease in the discharge, so the energy efficiency η a l l shows a downward trend. Δ T affects the heat exchange temperature difference and heat exchange efficiency of each heat exchanger, so when Δ T increases, U A a l l decreases, and it can be seen that U A a l l decreases faster when the heat exchange temperature difference increases within 1~5 °C.
The result shows that smaller T c o m and Δ T will improve the overall efficiency, but the economic performance will be negatively affected. In order to achieve better thermodynamic and thermal economic performance simultaneously, it is necessary to use an optimization algorithm to design the specific operating parameters of the system.

4.4. Mechanical Component Efficiency of System

For a thermal system, the isentropic efficiency η i s of the expansion/compression components reflects the energy conversion effect. Generally speaking, the higher the isentropic efficiency η i s , the better the thermodynamic performance and economic performance of the system. However, in practical engineering applications, when selecting mechanical components according to the required capacity of the system, it remains to be determined which of the isentropic efficiencies of the compressor and turbine has a greater impact on the performance of the system and which should be given priority when the optimum cannot be met at the same time.
Figure 9 shows the results of system η a l l and U A a l l changes under different η i s , c o m and η i s , t u r b . As expected, η a l l increases with η i s , c o m and η i s , t u r b , and it is easy to understand that the higher the isentropic efficiency, the better the thermodynamic performance.
It can be calculated that the isentropic efficiency of the compressor has a greater impact on the performance of the system. When the isentropic efficiency of the compressor changes by 0.1, the energy efficiency changes by 0.35 on average, while when the isentropic efficiency of the expander changes by 0.1, the energy efficiency changes by 0.27 on average. Therefore, the compressor with higher isentropic efficiency is given priority when selecting components.

4.5. Multi-Objective Optimization and Decision Making

The PTES system in this paper is the same as in most of the engineering problems; the optimization of thermodynamic performance is a multi-objective optimization problem, and in most cases, an improvement in one index may mean a reduction in other indexes. It is almost impossible to achieve the optimal of multiple indexes at the same time. It is difficult to decide the only optimal solution; instead, coordination and compromise are made between them to make the overall goal as optimal as possible. Therefore, it is necessary to find the Pareto solution set through multi-objective optimization and to find a satisfactory solution through multi-objective decision so as to guide the setting of the system operating parameters.
Since η a l l and U A a l l show opposite trends, it is almost impossible to achieve the optimal for both at the same time. Therefore, η a l l and U A a l l are considered to adopt a multi-objective optimization algorithm to make the overall objective as optimal as possible. A multi-objective genetic algorithm optimization with energy efficiency η a l l and U A a l l as the optimization objectives is considered. For the multi-objective genetic algorithm optimization problem, the Pareto front method of genetic algorithm (GA) is adopted [25] to achieve the optimal scheme of balancing the energy utilization rate and total UA value. The mathematical model of the optimization is shown in Equation (28):
f P h p , T e v a , P h e , T c o n d , T c o m p , Δ T = max η a l l , min U A a l l
After the completion of the multi-objective optimization, the Pareto front of the objective function is generated, which contains multiple individuals [26,27]. In order to select the best individual, the TOPSIS decision-making method is used [28]. The TOPSIS method is a commonly used method in multi-objective decision analysis. Its basic method is to find out the ideal solution of each standardized objective function, judge the approximation degree of each configuration scheme and the ideal solution, and then sort the final scheme according to it. It was first proposed by C.L. Hwang and K. Yoon in 1981 [29]. Firstly, the index evaluation matrix was established for the optimized population, and then the matrix was normalized. The obtained population matrix was shown as follows:
E n e r g y   e f f i c i e n c y T o t a l   U A   v a l u e X 1 Y 1 X 2 Y 2 X n Y n
The data in the matrix are normalized, and the processing process is shown in Equations (29) and (30):
X i = X i X 1 2 + X 2 2 + X n 2
Y i = Y i Y 1 2 + Y 2 2 + Y n 2
The normalized matrix is as follows:
E n e r g y   e f f i c i e n c y T o t a l   U A   v a l u e X 1 Y 1 X 2 Y 2 X n Y n
The ideal solution refers to the combination of the maximum values of two indexes selected from the normalized matrix, and the non-ideal solution is a combination of the minimum values of two indexes selected from the normalized matrix. The calculation equations for the ideal and non-ideal solutions are shown in Equations (31) and (32), respectively:
X m a x , Y m a x = max ( X i , Y j )
X m i n , Y m i n = min ( X i , Y j )
The equations for calculating the distance between each group of numbers in the matrix after normalization and the ideal solution and the non-ideal solution are shown in Equations (33) and (34), respectively:
L m a x = ( X i X m a x ) 2 + ( Y i Y m a x ) 2
L m i n = ( X i X m i n ) 2 + ( Y i Y m i n ) 2
The evaluation indexes of the TOPSIS decision method are shown in Equation (35):
M = L m a x L m a x + L m i n
The optimal solution of the TOPSIS method is required to be closest to the positive ideal solution, while at the same time, far from the negative ideal solution. The smaller the evaluation index M of the optimized individual, the closer the individual is to the ideal solution; then, the individual is the optimal individual after GA optimization.
Genetic algebra is set to 500, population size is 100, crossover probability is 0.8, mutation probability is 0.1, and the optimal front solution set of the system is obtained through calculation.
The Pareto diagram is shown in Figure 10. The “positive ideal point” means the minimum value of “M”, which indicates that the distance between the individual and the ideal solution is the shortest. The “negative ideal point” means the maximum value of “M”, which indicates that the distance between the individual and the ideal solution is the longest. Each point in the optimal solution set is shown in the figure, and based on the energy efficiency of each point and the total UA value, the distance from the ideal solution can be calculated, and the positive and negative ideal points can be found.
Within the range of basic parameters set in Table 4, the optimal solution set is selected by finding solutions that meet the requirements of high energy utilization and low total UA of the heat exchanger. With the increase in energy efficiency, the total UA value also increases gradually. The optimal decision variables after the TOPSIS decision are shown in Table 5, and the performance index parameters of the system are shown in Table 6.
The data of system performance analysis are used precisely to provide the basis and parameter design range for system optimization. In the final selection of the optimal solution, the selection principle is to select the solution closest to the ideal point as the optimal solution in the optimal solution set selected by the algorithm. The optimization scheme not only can meet the requirements of thermal performance and thermal economic performance but also be the most suitable for system operation within the set parameter range. The optimal solution selected according to the TOPSIS decision-making method can reflect the working condition of each point of the system when the thermodynamic and thermal economic performances of the system are relatively excellent, which is an optimal condition of the PTES system. It provides a pattern for the optimal working condition design and practical application of the multiple energy storage system.

5. Conclusions

Based on the application prospect of CO2 PTES in the field of renewable energy storage, this paper constructs a multiple energy storage system, carries out system parameter analysis and performance optimization research, and draws the following main conclusions:
(1)
Through the form of the multistage compression heat pump cycle, the PTES system achieved a cascade heat storage pattern. The system can store about 0 °C of cold capacity, used to meet the needs of the cooling load. At the same time, it can store approximately 50 °C medium-temperature hot water, used to provide domestic hot water for the user side, and store the high-temperature heat above 115 °C for driving the turbine to generate electricity. The system not only can store renewable power, but also realize the flexible regulation of storage/release of power and meet the demand of multiple loads of heating and cooling in different periods.
(2)
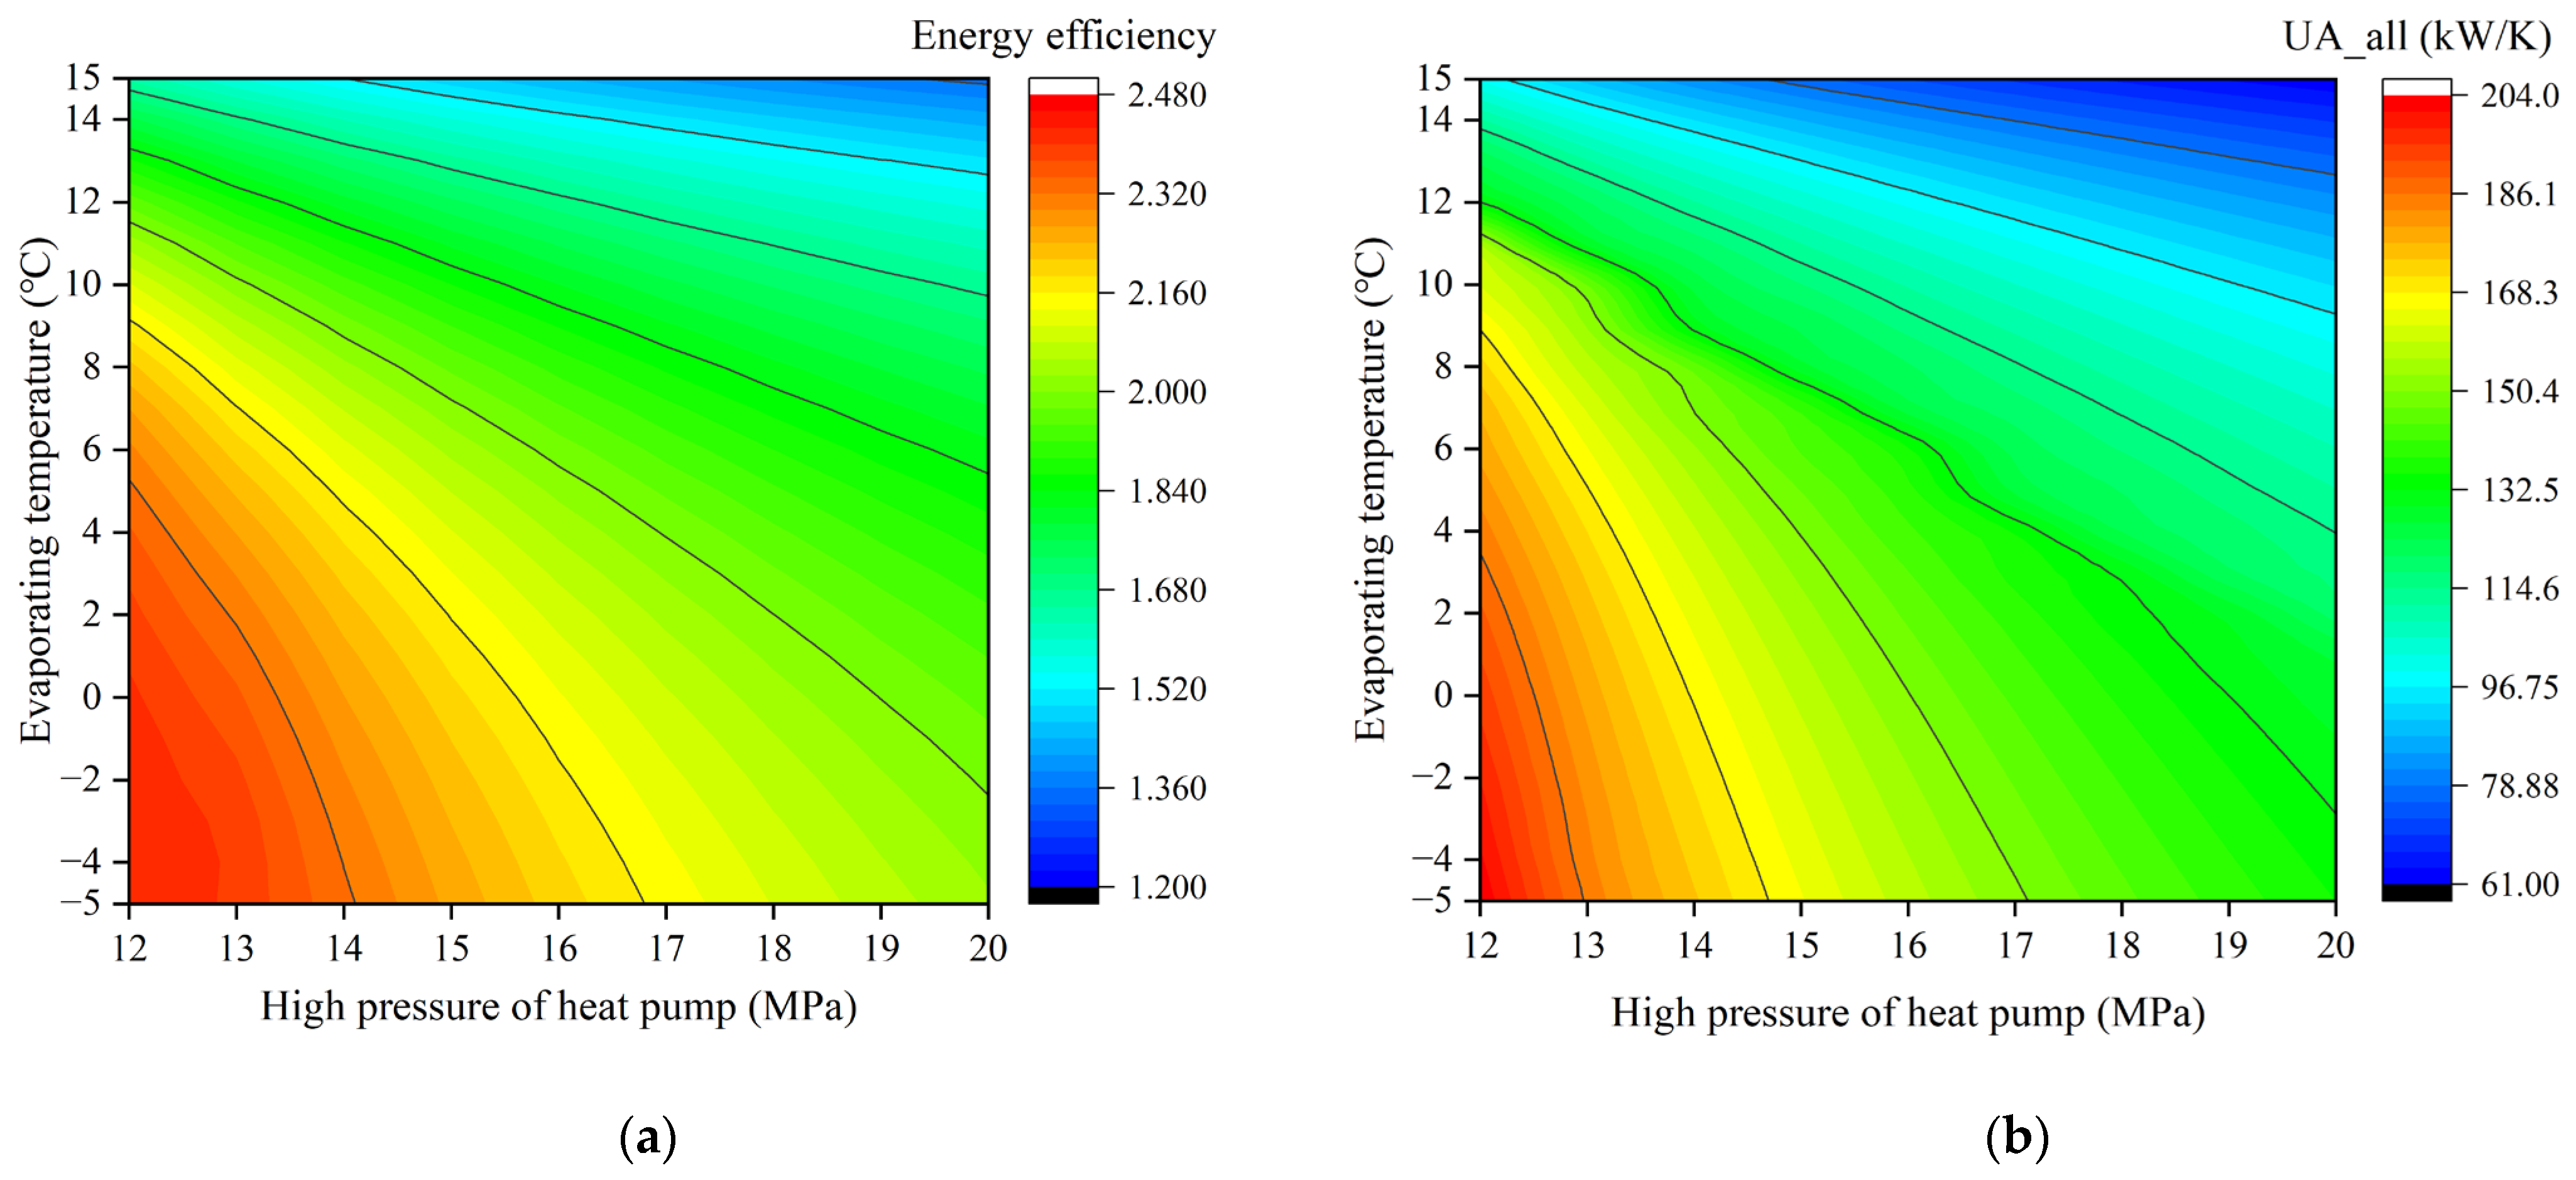
Through the comprehensive analysis of the key parameters of the system, it is found that the effect of the heat pump parameters on the system performance is greater than that of the heat engine parameters. When P h p = 12   M P a and T e v a = 5   ° C , the η a l l of the system reaches the highest value of 2.43. The change trend of U A a l l is the same as that of η a l l , and the minimum value of U A a l l is 61.32 kW/K when P h p = 20   M P a and T e v a = 15   ° C are used. However, η a l l and U A a l l do not show a simple linear relationship with the change in heat engine parameters.
(3)
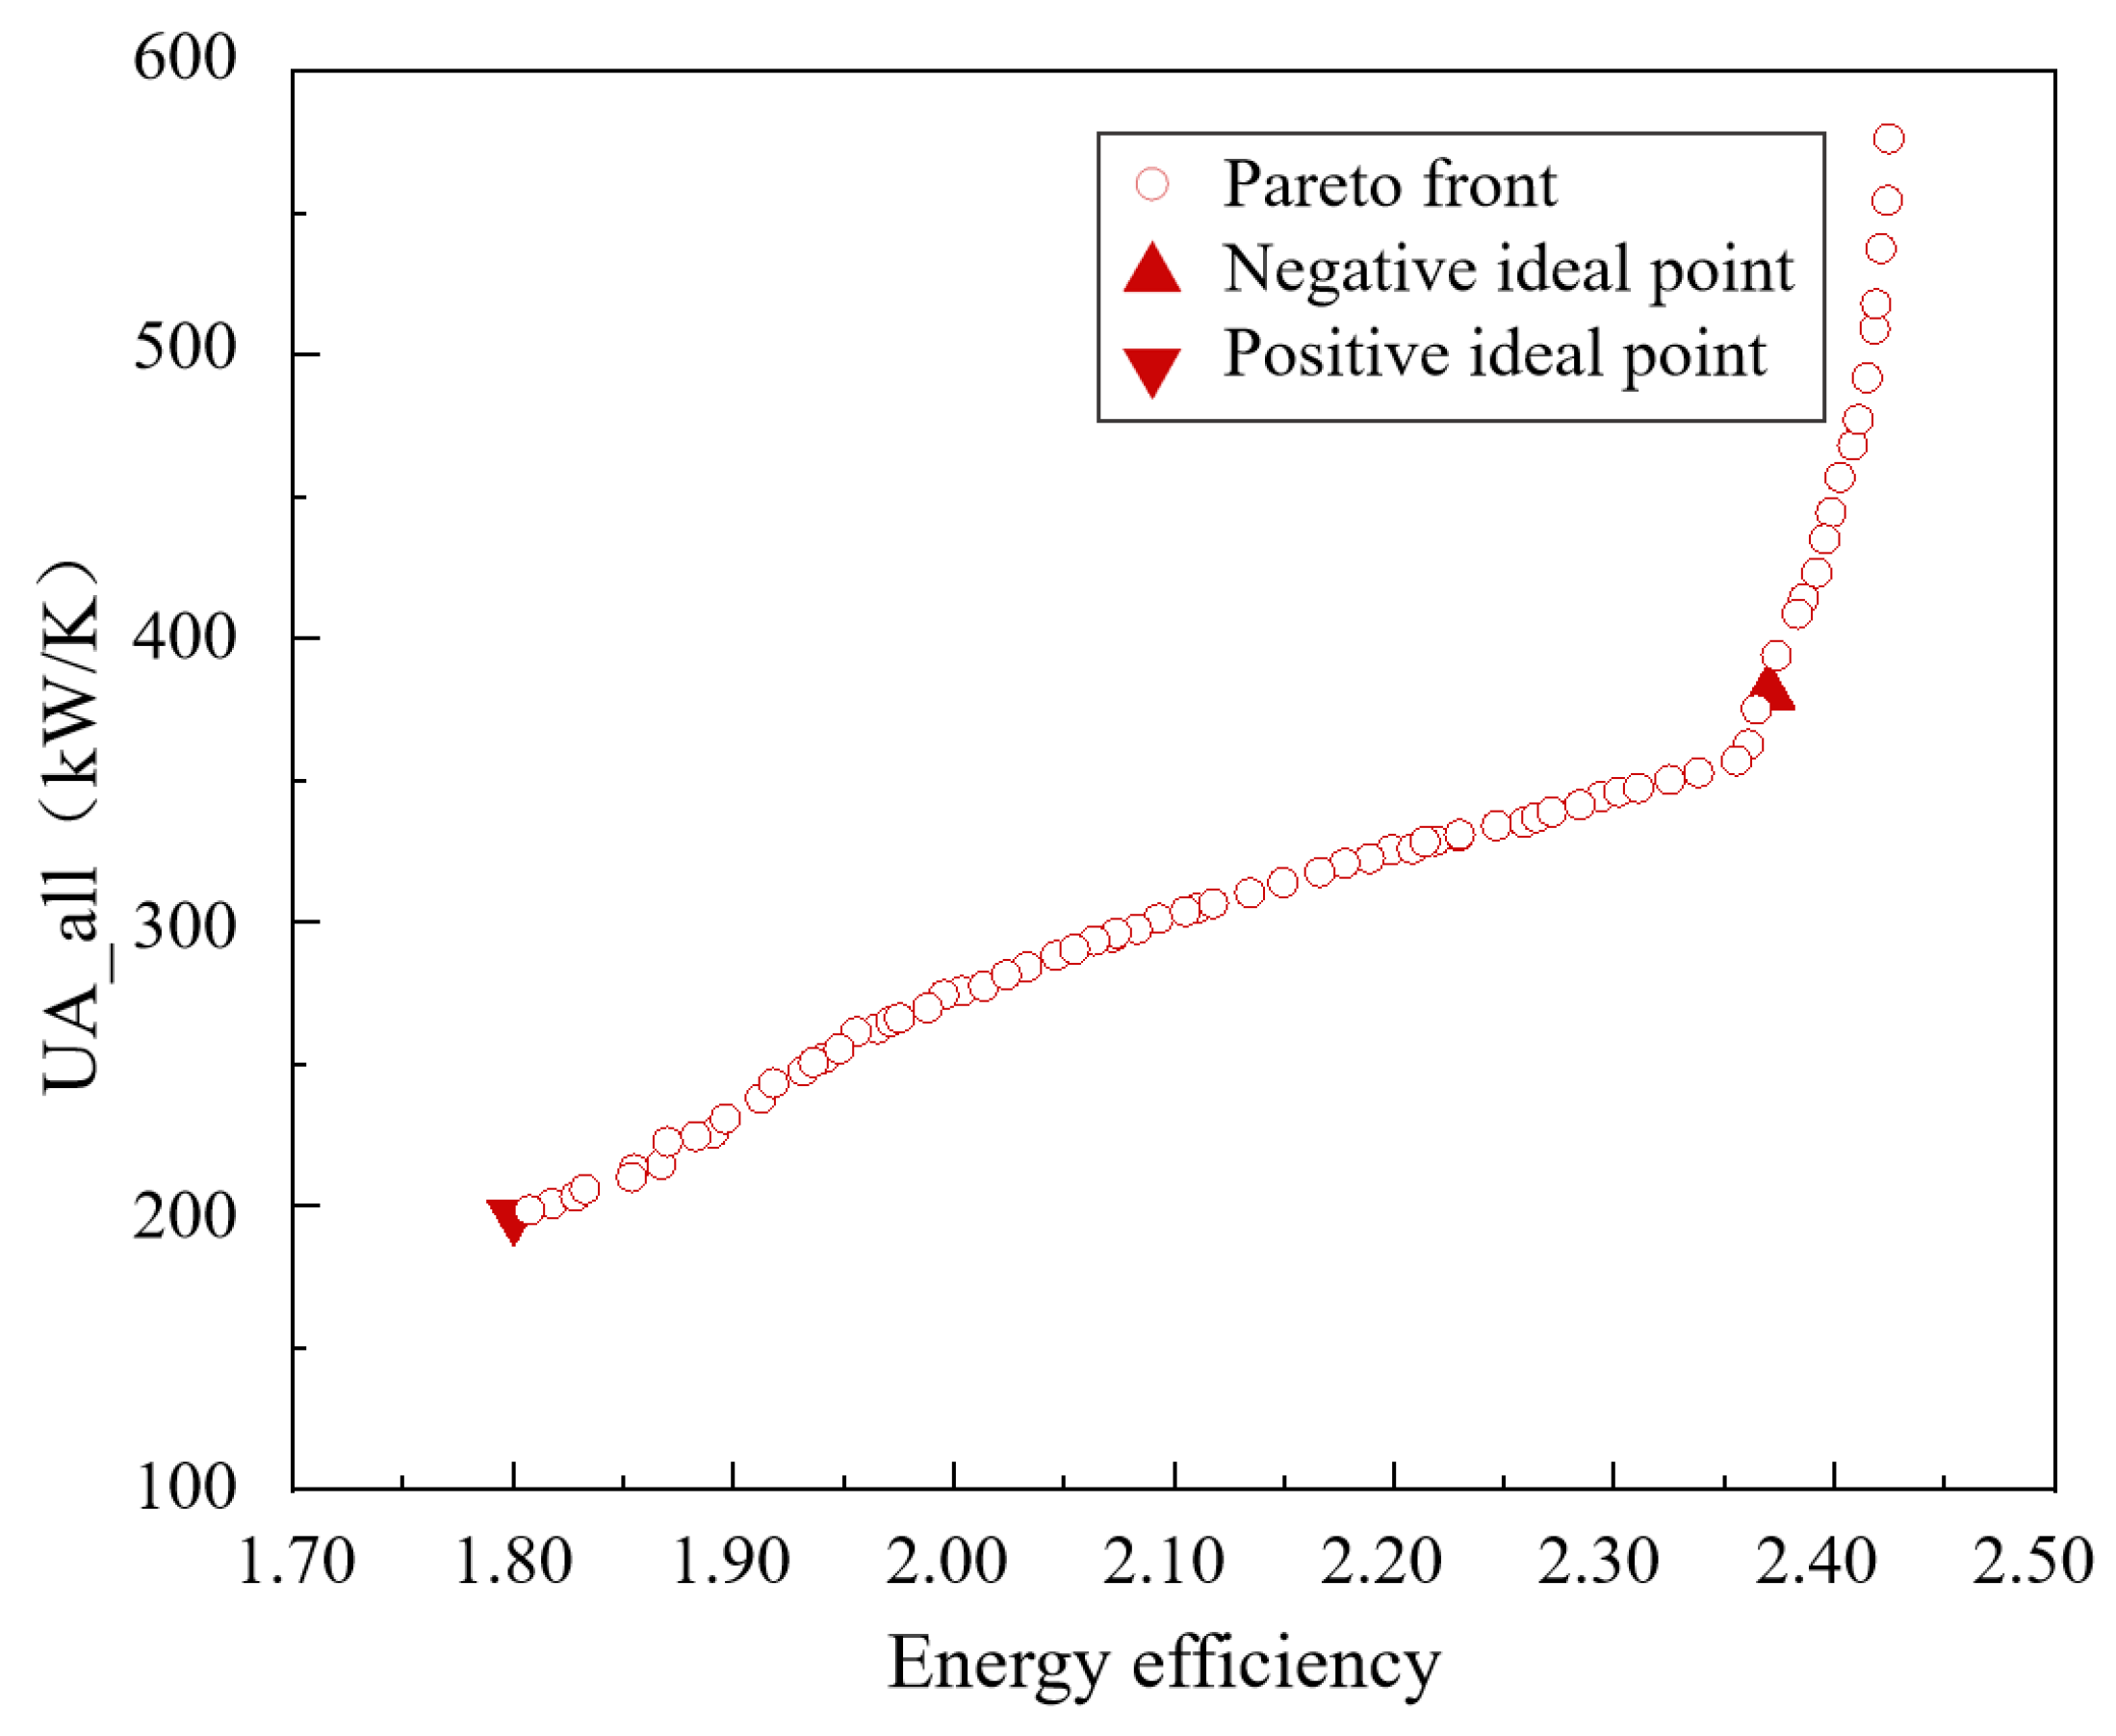
The genetic algorithm is used to realize the comprehensive optimization of the PTES system. In addition, the optimal solution of the Pareto front solution set is obtained by the TOPSIS decision-making method. The optimal energy efficiency of the system is 2.39, and the total UA value is 357.4 kW/K.
The results obtained in this paper can provide a basis for parameter analysis and performance optimization of CO2 PTES and provide ideas and schemes for renewable energy storage and diversified utilization.

6. Future Work

The energy storage system combining cold, heat, and power generation proposed in this article is a multistage compression heat pump energy-storage system based on the basic principle of the PTES system. In addition to the traditional electrothermal conversion ability, it also has the function of coupling multiple heat sources and providing multistage heat energy. Although PTES is a system-level concept, some technical challenges relating to materials and components remain to be overcome, and there are currently few related system experiments and landing engineering projects. Therefore, it is worth exploring to study the running performance and components of the system. Our future work will focus on the establishment and testing of the test bed as well as the evaluation of operational performance and overall optimization.

Author Contributions

Conceptualization, Y.Y.; methodology, Y.W.; software, Y.W.; validation, Y.W.; investigation, Y.W.; resources, Z.K.; data curation, Y.W.; writing—original draft preparation, Y.W.; writing—review and editing, J.F.; visualization, Y.W.; supervision, Y.W. All authors have read and agreed to the published version of the manuscript.

Funding

This research received no external funding.

Data Availability Statement

Data available upon request.

Conflicts of Interest

The authors declare no conflicts of interest.

Nomenclature

h Specific enthalpy, kJ/kg
m Mass flow rate, kg/s
W C Input electric power, kW
W o u t Output electric power, kW
Q Heat rate, kW
T Temperature, °C
Greek Symbols
T Temperature difference, K
η i s Isentropic efficiency of mechanical components
η a l l Energy efficiency of the system
η h e Thermodynamic efficiency of the heat engine
Subscripts
h p Heat pump
h e Heat engine
c o m ;   C Compressor
c o o l Cooling capacity
h o t , m Medium-temperature water
h o t , h High-temperature water
e v a Evaporator
c o n d Condenser
Abbreviations
P T E S Pumped thermal energy storage
U A Heat exchanger performance

References

  1. Bp. Energy Outlook. Available online: https://www.bp.com/en/global/corporate/energy-economics/energy-outlook.html (accessed on 1 October 2024).
  2. Rostirolla, G. A Survey of Challenges and Solutions for the Integration of Renewable Energy in Datacenters. Renew. Sustain. Energy Rev. 2022, 155, 111787. [Google Scholar] [CrossRef]
  3. Wang, S. Economic Study on the Application of Energy Storage in Regional Electricity Market System. Ph.D. Thesis, University of Chinese Academy of Sciences, Beijing, China, 2021. [Google Scholar]
  4. Erixno, O.; Rahim, N.A.; Ramadhani, F.; Adzman, N.N. Energy Management of Renewable Energy-Based Combined Heat and Power Systems: A Review. Sustain. Energy Technol. Assess. 2022, 51, 101944. [Google Scholar] [CrossRef]
  5. He, Z.; Qi, W.; Song, J.; Cui, S.; Li, H. The thermodynamic analysis of a liquefied air energy storage system coupled with liquefied natural gas. Energy Storage Sci. Technol. 2020, 10, 1589–1596. [Google Scholar]
  6. Liang, T.; Vecchi, A.; Knobloch, K.; Sciacovelli, A.; Engelbrecht, K.; Li, Y.; Ding, Y. Key Components for Carnot Battery: Technology Review, Technical Barriers and Selection Criteria. Renew. Sustain. Energy Rev. 2022, 163, 112478. [Google Scholar] [CrossRef]
  7. Novotny, V.; Basta, V.; Smola, P.; Spale, J. Review of Carnot Battery Technology Commercial Development. Energies 2022, 15, 647. [Google Scholar] [CrossRef]
  8. Saher, S.; Johnston, S.; Esther-Kelvin, R.; Pringle, J.M.; MacFarlane, D.R.; Matuszek, K. Trimodal Thermal Energy Storage Material for Renewable Energy Applications. Nature 2024, 636, 622–626. [Google Scholar] [CrossRef]
  9. Dumont, O. Carnot Battery Technology: A State-of-the-Art Review. J. Energy Storage 2020, 32, 101756. [Google Scholar] [CrossRef]
  10. Strasser, M.N. A Cost and Performance Comparison of Packed Bed and Structured Thermocline Thermal Energy Storage Systems. Sol. Energy 2014, 108, 390–402. [Google Scholar] [CrossRef]
  11. Zhang, Q.; Wang, L.; Xu, Y.; Chen, H. Research progress in pumped heat electricity storage system: A review. Proc. CSEE 2018, 38, 178–185. [Google Scholar]
  12. Wang, L. Unbalanced Mass Flow Rate of Packed Bed Thermal Energy Storage and Its Influence on the Joule-Brayton Based Pumped Thermal Electricity Storage. Energy Convers. Manag. 2019, 185, 593–602. [Google Scholar] [CrossRef]
  13. Mercangöz, M. Electrothermal Energy Storage with Transcritical CO2 Cycles. Energy 2012, 45, 407–415. [Google Scholar] [CrossRef]
  14. Morandin, M. Conceptual Design of a Thermo-Electrical Energy Storage System Based on Heat Integration of Thermodynamic Cycles—Part A: Methodology and Base Case. Energy 2012, 45, 375–385. [Google Scholar] [CrossRef]
  15. Morandin, M. Conceptual Design of a Thermo-Electrical Energy Storage System Based on Heat Integration of Thermodynamic Cycles—Part B: Alternative System Configurations. Energy 2012, 45, 386–396. [Google Scholar] [CrossRef]
  16. Morandin, M. Thermoeconomic Design Optimization of a Thermo-Electric Energy Storage System Based on Transcritical CO2 Cycles. Energy 2013, 58, 571–587. [Google Scholar] [CrossRef]
  17. Carro, A.; Chacartegui, R.; Ortiz, C.; Carneiro, J.; Becerra, J.A. Energy Storage System Based on Transcritical CO2 Cycles and Geological Storage. Appl. Therm. Eng. 2021, 193, 116813. [Google Scholar] [CrossRef]
  18. Benato, A. Heat Transfer Fluid and Material Selection for an Innovative Pumped Thermal Electricity Storage System. Energy 2018, 147, 155–168. [Google Scholar] [CrossRef]
  19. Sun, P. Design and Application of Pumped Thermal Energy Storage System Based on High and Low Temperature Energy Storage. Master’s Thesis, Zhejiang University, Hangzhou, China, 2023. [Google Scholar]
  20. Laterre, A.; Dumont, O.; Lemort, V.; Contino, F. Is Waste Heat Recovery a Promising Avenue for the Carnot Battery? Techno-Economic Optimisation of an Electric Booster-Assisted Carnot Battery Integrated into Different Data Centres. Energy Convers. Manag. 2024, 301, 118030. [Google Scholar] [CrossRef]
  21. Kasaeian, A. Solar-Driven Polygeneration Systems: Recent Progress and Outlook. Appl. Energy 2020, 264, 114764. [Google Scholar] [CrossRef]
  22. Yu, L.; Zhu, Y.; Wu, Y. Medium and Low Temperature Waste Heat Power Generation Technology, 1st ed.; Shanghai Jiao Tong University Press: Shanghai, China, 2015; pp. 123–125. [Google Scholar]
  23. Kim, Y.-M.; Shin, D.-G.; Lee, S.-Y.; Favrat, D. Isothermal Transcritical CO2 Cycles with TES (Thermal Energy Storage) for Electricity Storage. Energy 2013, 49, 484–501. [Google Scholar] [CrossRef]
  24. Hu, S.; Yang, Z.; Li, J.; Duan, Y. Thermo-Economic Analysis of the Pumped Thermal Energy Storage with Thermal Integration in Different Application Scenarios. Energy Convers. Manag. 2021, 236, 114072. [Google Scholar] [CrossRef]
  25. Deb, K.; Pratap, A.; Agarwal, S.; Meyarivan, T. A Fast and Elitist Multiobjective Genetic Algorithm: NSGA-II. IEEE Trans. Evol. Comput. 2002, 6, 182–197. [Google Scholar] [CrossRef]
  26. Nondy, J. Exergoeconomic Investigation and Multi-Objective Optimization of Different ORC Configurations for Waste Heat Recovery: A Comparative Study. Energy Convers. Manag. 2021, 245, 114593. [Google Scholar] [CrossRef]
  27. Yu, X. Sensitivity Analysis of Thermophysical Properties on PCM Selection under Steady and Fluctuating Heat Sources: A Comparative Study. Appl. Therm. Eng. 2021, 186, 116527. [Google Scholar] [CrossRef]
  28. Wang, L.; Bu, X.; Li, H. Multi-Objective Optimization and off-Design Evaluation of Organic Rankine Cycle (ORC) for Low-Grade Waste Heat Recovery. Energy 2020, 203, 117809. [Google Scholar] [CrossRef]
  29. Hwang, C.; Yoon, K. Multiple Attribute Decision Making: Methods and Applications; Springer: New York, NY, USA, 1981. [Google Scholar]
Figure 1. General description of the multiple energy storage system.
Energies 18 00525 g001
Figure 2. Schematic diagram of multiple energy storage system. (a) Schematic diagram of energy storage cycle. (b) Schematic diagram of energy release cycle.
Energies 18 00525 g002aEnergies 18 00525 g002b
Figure 3. (a) The impact of heat pump parameters for η a l l . (b) The impact of heat pump parameters for U A a l l .
Energies 18 00525 g003
Figure 4. (a) The impact of high pressure of the heat pump on system performance; (b) the impact of evaporating temperature on system performance; (c) the impact of high pressure of the heat pump on heat storage capacity; (d) the impact of evaporating temperature on heat storage capacity.
Energies 18 00525 g004
Figure 5. (a) The impact of heat engine parameters on η a l l ; (b) the impact of heat engine parameters on U A a l l .
Energies 18 00525 g005
Figure 6. (a) The impact of high pressure of heat engine on system performance; (b) the impact of condensing temperature on system performance.
Energies 18 00525 g006
Figure 7. (a) The impact of coupling parameters on η a l l ; (b) the impact of coupling parameters on U A a l l .
Energies 18 00525 g007
Figure 8. (a) The impact of heat transfer temperature difference on system performance; (b) the impact of inlet temperature of the compressor on system performance; (c) the impact of the heat transfer temperature difference on heat storage capacity; (d) the impact of the inlet temperature of the compressor on heat storage capacity.
Energies 18 00525 g008aEnergies 18 00525 g008b
Figure 9. (a) The impact of mechanical efficiency on η a l l ; (b) the impact of mechanical efficiency on U A a l l .
Energies 18 00525 g009
Figure 10. Pareto front of the result of multi-objective optimization.
Energies 18 00525 g010
Table 1. System design parameters of the literature.
ParameterPhysical MeaningValue
P h p , l Low pressure of heat pump1.8 MPa
P h p , h High pressure of heat pump12.2 MPa
T c o m Inlet temperature of compressor9.7 °C
T o u t Outlet temperature of gas cooler5.6 °C
P h e , l Low pressure of heat engine2.1 MPa
P h e , h High pressure of heat engine14.4 MPa
T t u r b Inlet temperature of turbine175.8 °C
Table 2. Relative error in system model validation.
ParameterCalculated ValueReference ValueRelative Error
Power consumption of compressor132.12 kW130.6 kW1.2%
Output work of turbine95.24 kW99.4 kW−4.2%
Power consumption of pump17.36 kW16.8 kW3.3%
Heat storage by heat pump358.8 kW352 kW1.9%
Heat consumption of heat engine337.36 kW336.4 kW0.3%
Table 3. Main parameters and values.
ParameterPhysical MeaningValue
W C Total input power100 kW
η i s , c Isentropic efficiency of compressor86%
η i s , p Isentropic efficiency of pump85%
η i s , t Isentropic efficiency of turbine88%
T a m b Ambient temperature25 °C
P h p High pressure of heat pump12 MPa
T e v a Evaporating temperature of heat pump0 °C
T h o t , m Medium heat storage temperature55 °C
T h o t , h High heat storage temperature115 °C
T c o m Inlet temperature of compressor20 °C
P h e High pressure of heat engine12 MPa
T c o n d Condensing temperature of heat pump25 °C
P w a t e r Water pressure0.5 MPa
Δ T Heat transfer temperature difference of evaporator5 °C
Δ t p p Pinch point temperature difference1 °C
Table 4. Parameters of multi-objective optimization algorithm.
ParameterPhysical MeaningValue Range
P h p High pressure of heat pump12~20 MPa
T e v a Evaporating temperature of heat pump−5~15 °C
P h e High pressure of heat engine12~20 MPa
T c o n d Condensing temperature of heat pump10~30 °C
T c o m Inlet temperature of compressor10~30 °C
Δ T Heat transfer temperature difference1~10 °C
Table 5. Results of multi-objective optimization decision making.
ParameterPhysical MeaningOptimal Value
P h p High pressure of heat pump16.1 MPa
T e v a Evaporating temperature of heat pump−0.12 °C
P h e High pressure of heat engine12.2 MPa
T c o n d Condensing temperature of heat pump10.7 °C
T c o m Inlet temperature of compressor15.08 °C
Δ T Heat transfer temperature difference3.1 °C
Table 6. System performance of multi-objective optimization decision making.
Energy
Efficiency
Total UA ValueThermal Storage CapacityCold Storage CapacityThermal Storage TemperatureCold Storage TemperatureOutput Electricity
2.39357.4 W/K38.2 kW195.8 kW136.9 °C2.2 °C37.7 kW
Disclaimer/Publisher’s Note: The statements, opinions and data contained in all publications are solely those of the individual author(s) and contributor(s) and not of MDPI and/or the editor(s). MDPI and/or the editor(s) disclaim responsibility for any injury to people or property resulting from any ideas, methods, instructions or products referred to in the content.

