Article

Closing the Loop of Biowaste Composting by Anaerobically Co-Digesting Leachate, a By-Product from Composting, with Glycerine

Department of Environmental Biotechnology, Faculty of Geoengineering, University of Warmia and Mazury in Olsztyn, 10-709 Olsztyn, Poland
*
Authors to whom correspondence should be addressed.
Energies 2025, 18(3), 537; https://doi.org/10.3390/en18030537
Submission received: 9 December 2024 / Revised: 17 January 2025 / Accepted: 21 January 2025 / Published: 24 January 2025
(This article belongs to the Special Issue New Challenges in Waste-to-Energy and Bioenergy Systems)

Abstract

:
To achieve the required recycling rates, organic recycling via composting should be widely introduced in Poland for selectively collected biowaste. However, this process not only produces compost but also leachate (LCB), a nitrogen- and organics-rich liquid by-product. So far there has been limited information on the application of anaerobic digestion (AD) for treating LCB, which has fermentative potential. However, for effective methane production (MP) via AD, the ratio of chemical oxygen demand to total Kjeldahl nitrogen (COD/TKN) and pH of LCB are too low; thus, it should be co-digested with other organics-rich waste, e.g., glycerine (G). The present study tested the effect of G content in feedstock (in the range of 3–5% (v/v)) on the effectiveness of co-digestion with LCB, based on MP and the removal of COD. MP was accessed by using an automatic methane potential test system (AMPTS). Regardless of the feedstock composition (LCB, or LCB with G), the efficiency of COD removal was over 91%. Co-digestion not only increased MP by 6–15%, but also the methane content in the biogas by 4–14% compared to LCB only (353 NL/kg CODadded, 55%). MP and COD removal proceeded in two phases. During co-digestion in the 1st phase, volatile fatty acids (VFA) accumulated up to 2800 mg/L and the pH decreased below 6.8. The presence of G altered the shares of individual VFA and promoted the accumulation of propionic acid in contrast to LCB only, where caproic acid predominated. An initial accumulation of propionic acid and acidification in the mixtures decreased the kinetic constants of MP (from 0.79 to 0.54 d−1) and the rate of COD removal (from 2193 to 1603 mg/(L·d)). In the 2nd phase, the pH recovered, VFA concentrations decreased, and MP was no longer limited by these factors. However, it should be noted that excessive amounts of G, especially in reactors with constant feeding, may cause VFA accumulation to a greater extent and create a toxic environment for methanogens, inhibiting biogas production. In contrast, digestion of LCB only may lead to ammonium buildup if the COD/TKN ratio of the feedstock is too low. Despite these limitations, the use of AD in the treatment of LCB as a sustainable “closed-loop nutrient” technology closes the loop in composting of biowaste.

1. Introduction

Until recently, landfilling remained the most popular method of disposing of municipal solid waste (MSW); however, this form of waste disposal harms the environment because of, e.g., greenhouse gas emissions, groundwater contamination, and long-term ground degradation. The Landfill Directive (2018) states that untreated MSW should not be accepted by landfills, and the share of MSW landfilled will be limited to 10% by 2035 [1]. EU countries must implement strategies to gradually reduce the amount of municipal biodegradable waste in landfills [1]. This means that organic recycling and recovery must be considered priority processes.
In response to these challenges, mechanical-biological treatment (MBT) installations have been developed [2], combining mechanical processes for sorting and separating with biological treatment of biodegradable waste. In the mechanical processes, secondary materials (plastics, glass, metals, high-calorific alternative fuel, i.e., so-called Refuse Derived Fuel) are selected. Moreover, in the biological part, the organic fraction of MSW (OFMSW) (the so-called undersieve fraction), which is mechanically separated on a sieve, is treated via aerobic stabilization in most cases [3,4,5]. This process is accompanied by leachate produced by the decomposition of organic matter. Although the aerobic stabilization of OFMSW decreases its biodegradability and ensures its stability, the final product, stabilizate, cannot be considered compost and must be landfilled [6,7]. Thus, this process cannot be considered organic recycling, and its final product cannot be counted toward the recycling rate using the revised framework for calculating recycling rates [8]. Relying solely on the recycling of metals, paper, glass, and similar materials will not be enough to achieve the required recycling target of 65% by 2035 [1]. Thus, existing MBT plants should not manage mixed MSW, but separately collected waste [9,10], including biowaste, which can be treated via composting, a method of organic recycling. Compost production allows the inclusion of biowaste in the amount of recycled waste, increasing the recycling rate [10,11]. It is expected that composting will soon be used in many installations. Finally, it should be emphasized that, even though aerobic stabilization and composting have the same course and mechanism, they differ with regard to the type of feedstock used and the final product [12]. Nevertheless, more previous studies still judge the aerobic stabilization/composting-like process of OFMSW as a composting process.
During both processes, leachate is generated as a waste by-product. The amount produced can differ depending on the composting/aerobic stabilization technology and the type of feedstock used. Open composting facilities are influenced by weather conditions [13], such as rainfall, and thus the amounts of leachate generated may be higher than those generated via tunnel composting technologies or enclosed composting systems [14]. Feedstocks with high moisture tend to produce larger amounts of leachate than dry, carbon-rich materials. Although the leachate produced by both processes contains a variety of dissolved and suspended substances, their compositions differ, depending on the chemical and physical nature of the waste being degraded (OFMSW or biowaste). Because OFMSW is separated from mixed MSW, the leachate from aerobic stabilization has a high content of organic matter and nutrients, but also contaminants, such as heavy metals, and a variety of harmful pollutants [15,16,17,18]. Proper management of this leachate is a challenge, but is necessary to prevent environmental pollution, particularly contamination of groundwater and surface water. In contrast, the leachate from biowaste composting (LCB) contains mostly organic matter and nutrients [19] because the process involves the decomposition of organic materials, which are inherently biodegradable and lack harmful additives.
Biowaste is a key waste stream, accounting for as much as 37% of MSW [20]. In Poland, biowaste constitutes one-third of MSW [21]. Thus, given that the annual production of MSW in Poland is ca. 13 billion tons, biowaste production is ca. 4 billion tons [21]. Thus, composting biowaste will be used in many installations, producing not only compost, but also LCB, and this type of LCB will predominate. Thus, the issue is how to manage and properly treat LCB to prevent pollution and comply with legislation concerning its discharge into the environment. A potential method for managing organics-rich LCB is anaerobic digestion (AD) [22,23]. Although AD does not treat LCB to the extent that it can be discharged to a receiver [24], it does produce energy and reduce pollutant loads, reducing the costs of further treatment. Therefore, to improve process efficiency, reduce LCB treatment costs, and potentially obtain energy for use in LCB treatment plants, Zayen et al. [25] recommended performing AD before physicochemical processes, such as reverse osmosis, microfiltration, and chemical precipitation. Very little research to date has been performed on the characteristics of LCB and methods for its treatment. The vast majority of scientists use landfill leachate in their research. A few studies have reported that this LCB is a nitrogen-rich (high total nitrogen and ammonium concentration) and organics-rich liquid, as indicated by high levels of organic compounds (expressed as chemical and biochemical oxygen demand (COD, BOD)) [19,26,27]. This makes it highly biodegradable and means it has the potential for fermentation via AD. However, LCB may present a challenge for AD due to its low pH and COD/TKN ratio, which means there is insufficient carbon relative to nitrogen, potentially causing ammonia buildup, which can inhibit the methanogenic bacteria responsible for MP. Additionally, the acidic nature of LCB can further hinder the digestion process, as anaerobic microorganisms thrive in more neutral conditions.
The optimal COD/TKN ratio and pH for AD depend mainly on the substrate composition; these values are generally considered acceptable when they range between 55 and 143 and 6.5 and 8.8, respectively. Thus, before treatment via AD, LCB with an unfavorable COD/TKN ratio should be supplemented by adding an organics-rich co-substrate. Waste glycerine (G), a cosmetics industry by-product, could be a potential co-substrate for LCB from composting biowaste [28]. G is generated (10 kg/100 kg final product) at the end of saponification [29,30]. Because G has little economic potential due to its low quality and the high expense of purification, novel approaches for its management are sought. There is growing interest in the biological pathways that convert G into useful products, e.g., methane [31,32,33].
The present study contributed to establishing a holistic approach to the composting of biowaste by effectively managing LCB, which, as a sustainable “closed-loop nutrient” technology, closes the process cycle. Due to the highly biodegradable nature of the organics-rich LCB, this study employed AD for its management. By incorporating G into the LCB used for AD, the COD/TKN ratio could be increased, and the pH could be tuned to an optimal level. The approach indicated in this study not only addresses environmental concerns, but also offers a cost-effective, sustainable solution for managing both kinds of waste. Some researchers have indicated that too high a G content in the feedstock can disrupt AD; thus, the G dose should be experimentally determined [34]. To address this concern, the present study tested the effect of doses of G in the range of 3–5% on the effectiveness of co-digestion with LCB. Kinetics models were used to describe both MP and COD removal during AD. These models enabled the determination of the rates of MP and the efficiency of organics removal, as well as the kinetics coefficients of the process. This knowledge will help to estimate the technological parameters of bioreactors used in AD of LCB. This constitutes a new contribution to the development of anaerobic treatment for LCB in the future, as so far there has been limited information on the application of AD for treating LCB.

2. Materials and Methods

2.1. Characteristics of Feedstocks for MP Tests

In the present study, leachate collected from full-scale composting of separately collected biowaste at a MBT installation located in Poland (54.3235° N, 18.5406° E) was used as a substrate during anaerobic fermentation for MP. The LCB was brown and had an unpleasant odor, which was attributed to the volatile fatty acids (VFA) produced during the composting of the biowaste. The LCB had high concentrations of organics, expressed as BOD, COD, and VFA, but lower pH than, e.g., leachate from stabilization of OFMSW (~5 pH vs. ~7 pH).
The second substrate used in the experiment was waste glycerine (G), a waste product from saponification in a cosmetics factory in south-western Poland (50.2940° N, 18.9545° E). G is characterized by a very high content of organic compounds and a low content of nitrogen compounds. Because of the high density of raw G, a 10% solution of G was used (100 g of raw G in 1 L of hot tap water) to obtain a liquid with a density similar to that of LCB, thus facilitating mixing. The characteristics of the raw G and of the LCB are presented in Table 1 and Table 2, respectively.

2.2. Inoculum Used in Testing the MP

In the present study, fermented sludge was used as the inoculum, which is a common practice in batch tests (e.g., in the automatic methane potential test system, AMPTS, Bioprocess control, Lund, Sweden). Fermented sludge contains a high concentration of microorganisms involved in the AD process, which are also necessary to initiate the MP process. According to the methodology, the inoculum should be used in excess in relation to the substrate whose MP is tested.
The inoculum was anaerobically digested sewage sludge from the closed mesophilic (37 °C) chamber of a municipal wastewater treatment plant for a city of 200,000 inhabitants in the northeast of Poland. The designed capacity of this plant is 60,000 m3/day. Before use, the inoculum was filtered through a sieve to remove particles larger than 1 mm. The dry matter (DM) and organic matter (OM) contents of inoculum were 1.42% and 66.5% DM, respectively. The use of inoculum in excess strongly influences the conditions of anaerobic degradation of any tested substrate, including the physicochemical parameters such as pH, total alkalinity (TA), ammonium (N-NH4), and others. Table 1 provides the characteristics of the inoculum.

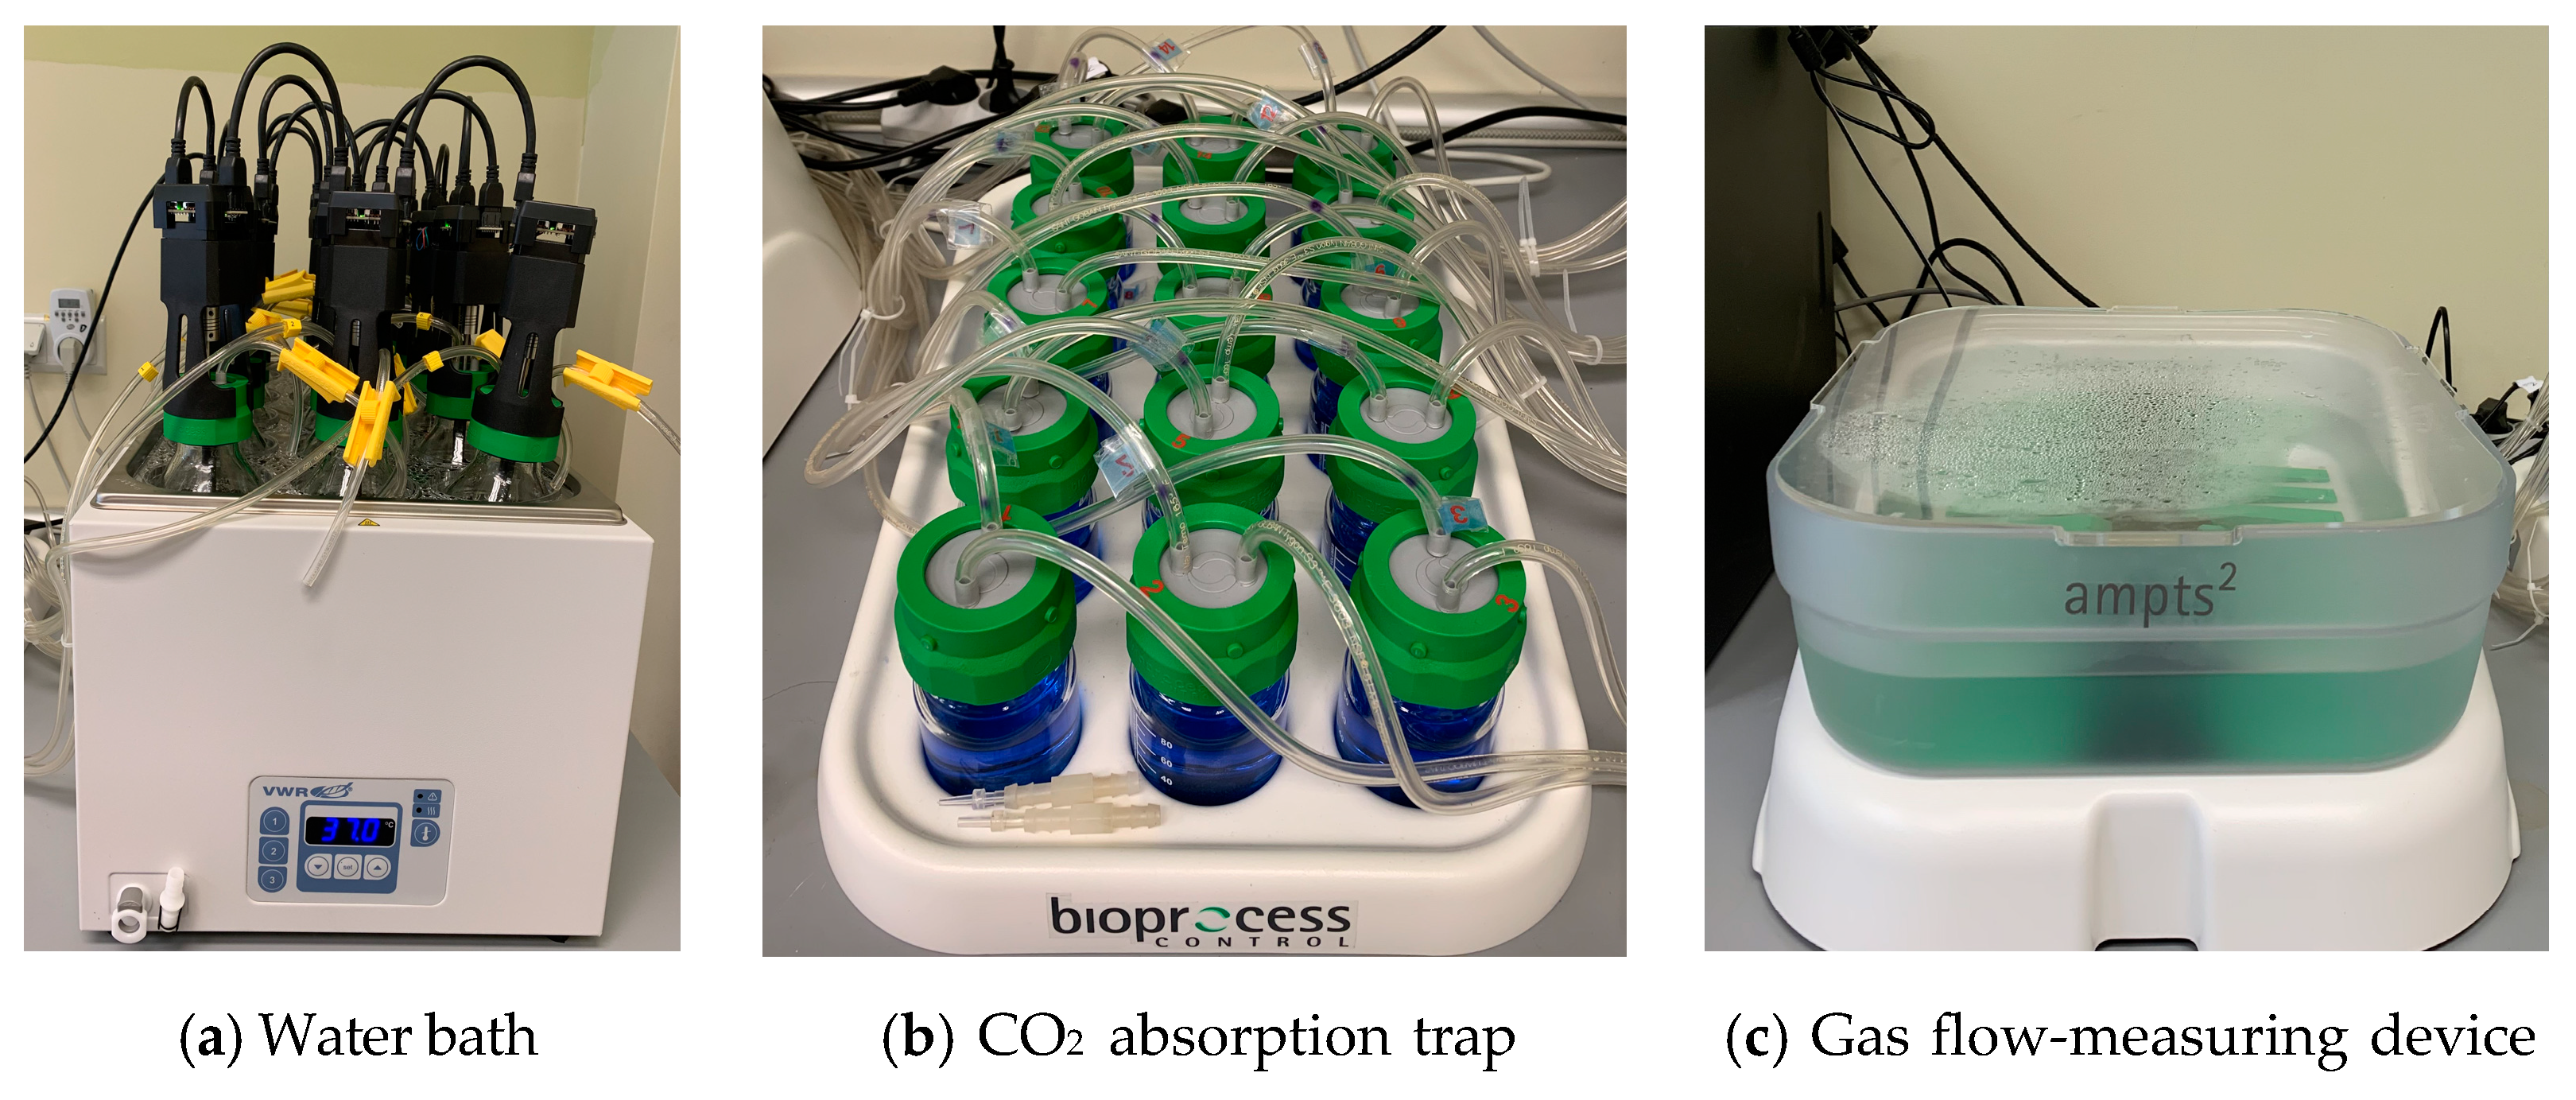
2.3. System for Measurement of MP

Due to its accuracy when testing MP from an organic substrate, AMPTS was used in the present study (Figure 1). AMPTS was developed for the automatic real-time measurement of MP during AD. The system was designed to perform 15 analyses at once. The water bath enabled simultaneous incubation at 35 °C of 15 bioreactors of 500 mL each (Figure 1a), which were connected to a mechanical stirrer to ensure good mixing conditions (1 min mixing/30 min break). The biogas, a mixture of methane and carbon dioxide produced in a temperature-controlled bioreactor, was passed through a directional valve and entered a continuously stirred alkali wash solution (Figure 1b). Here, CO2 and H2 were fixed, and only methane passed the scrubbing unit to enter the wet gas flow-measuring device (Figure 1c), which had 15 cells, one for each bioreactor, where the data were recorded.

2.4. Organization of the Experiments

In the present study, measurements were made of MP from LCB, as well as from mixtures of LCB and G, in which the content of G was 3, 4, or 5%. Three replicates of each variant were performed in AMPTS. Each bioreactor contained 300 mL of inoculum. To ensure an adjusted initial organic loading rate (OLR) of 7.5 kg COD/m3, appropriate doses of LCB and the mixtures were used (Table 2). To determine the physicochemical properties of the samples without interrupting MP (in AMPTS), seven additional bioreactors were prepared for each variant in the same way as for AMPTS. Thus, all of the bioreactors contained both inoculum and the substrate(s), and the physicochemical characteristics of the supernatant resulted from the mixture of inoculum and the substrate(s). To refer to these variants, we use the following abbreviations in the rest of the manuscript: LCB, LCB+3%G, LCB+4%G, LCB+5%G.

2.5. Analytical Methods

The content of DM in the inoculum was determined after drying at 105 °C, and that of OM as loss after ignition at 550 °C. The following characteristics were determined in the supernatant of the inoculum, LCB, and the mixtures of LCB and G: alkalinity; pH after titration with a potentiometric method (Titroline 6000, SI Analytics, Mainz, Germany); concentration of organic substances expressed as COD (LCK 514 cuvette tests, Hach Lange, Düsseldorf, Germany); BOD after 7 days (BOD7) [35] total Kjeldahl nitrogen (TKN) (LCK 338 cuvette tests, Hach Lange, Düsseldorf, Germany); and VFA and N-NH4 (both by distillation with titration, Büchi, Flawil, Switzerland).
During the 30-day methane fermentation, samples were taken from the additional bioreactors every 1–4 days and analyzed. After centrifuging, the supernatant was filtered through a 0.45-micron filter and the pH, TA, COD, VFA, and N-NH4 were measured with the same methodology as mentioned above. All analyses were performed according to standard methods [36].
Individual VFA were analyzed using a gas chromatograph (GC, Varian 3800, West Ryde, Australia) equipped with a capillary column (Factor Four VF-1 ms, 30 m × 0.25 mm i.d., 1.0 µm film; Varian) and a flame ionization detector (FID). Helium was used as the carrier gas at a flow rate of 1.0 mL/min. Prior to chromatographic analysis, samples were acidified with 50% phosphoric acid (H3PO4) and left overnight. They were then centrifuged at 15,000 rpm for 15 min to remove particles.

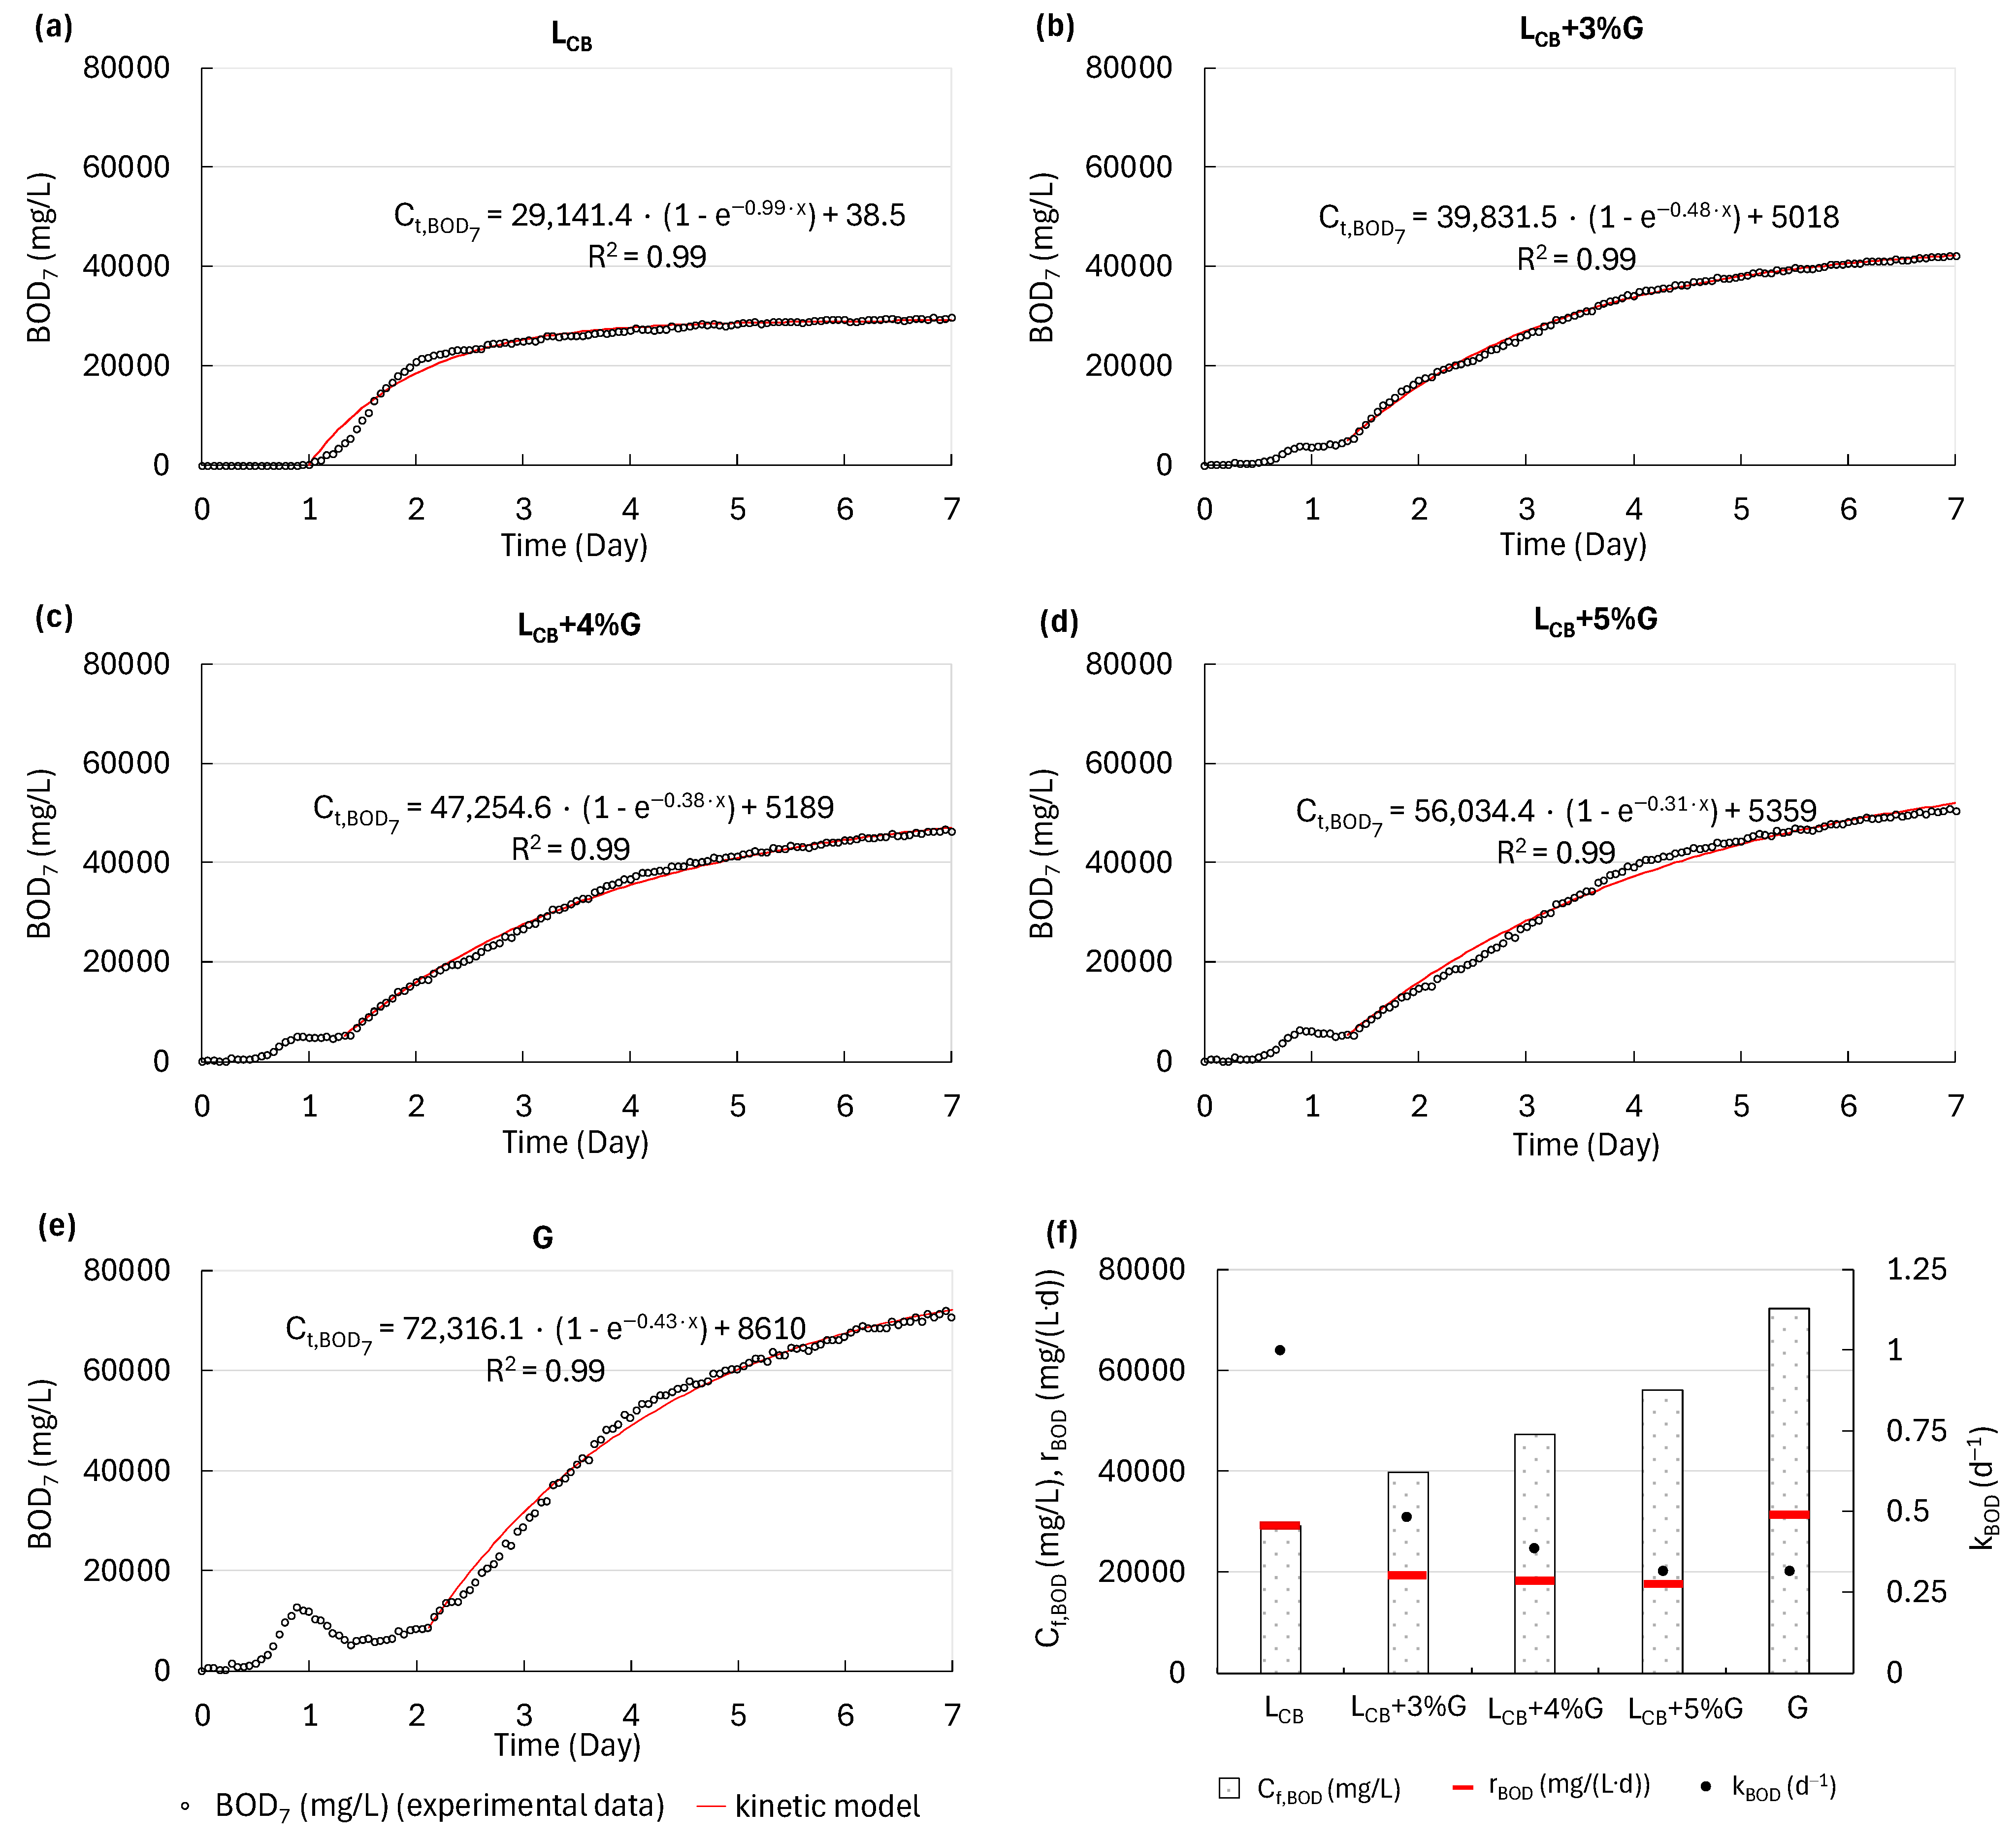
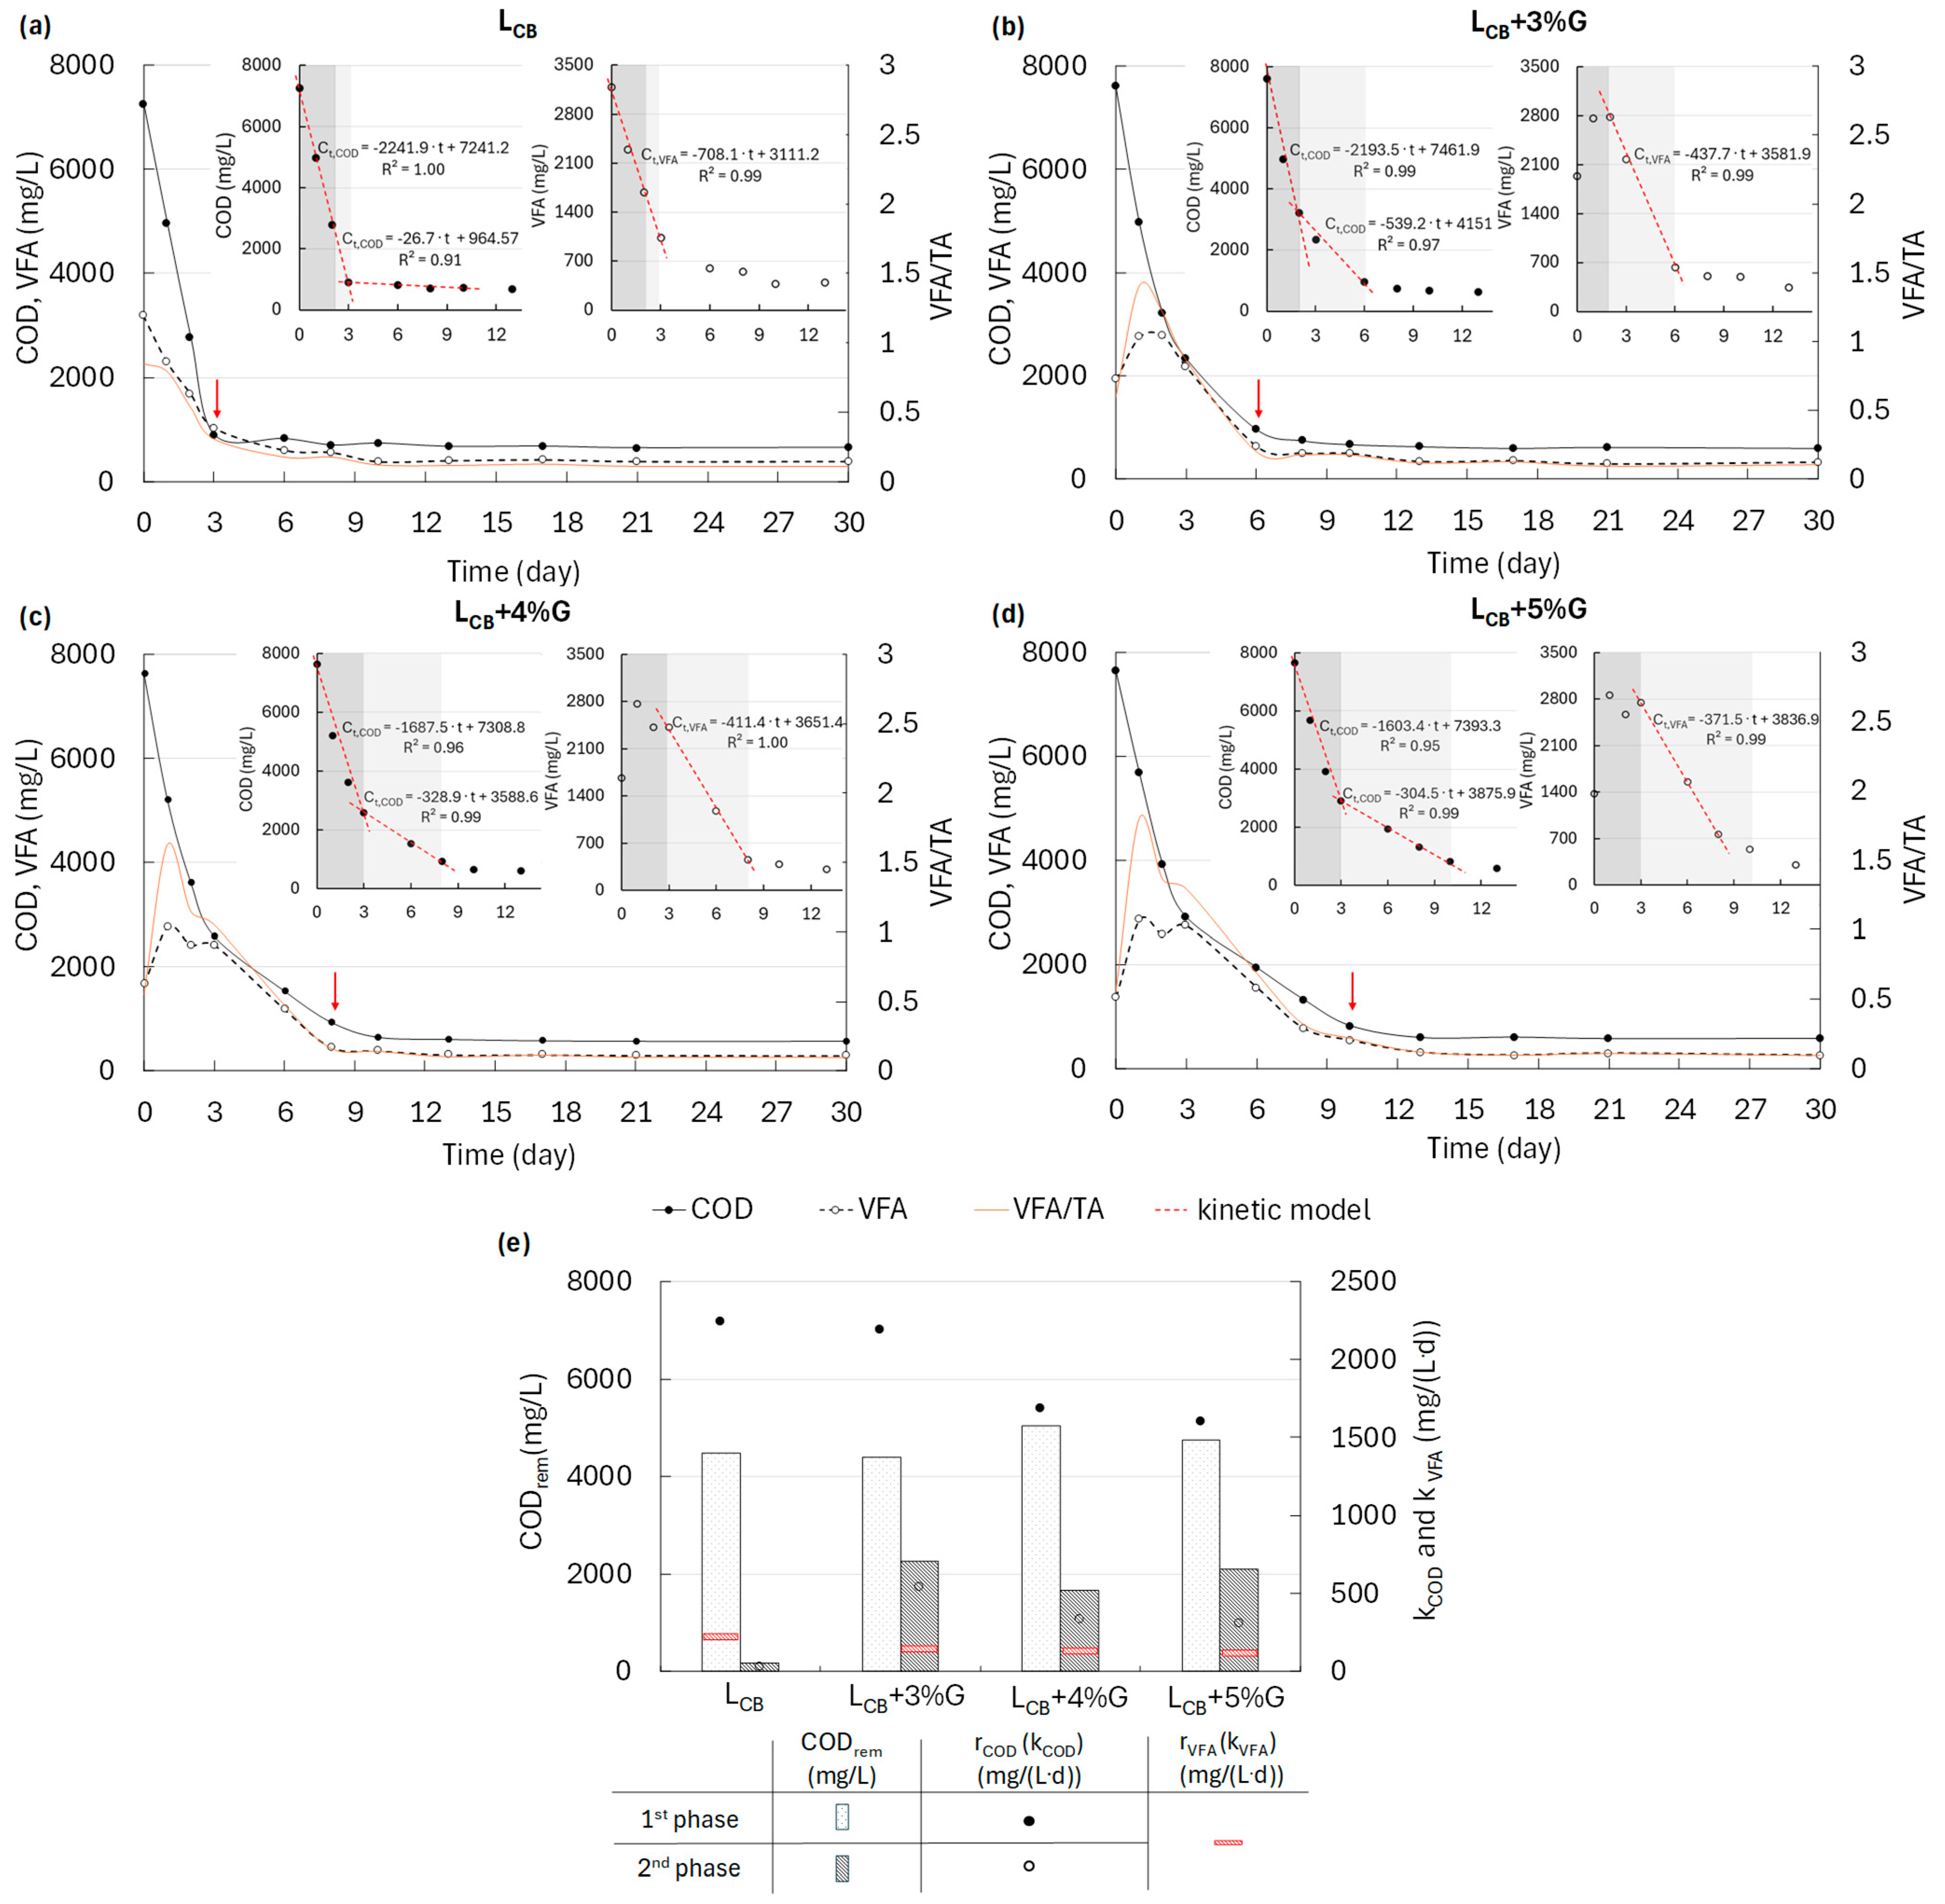
2.6. Kinetic Model for BOD Analyses, for MP, VFA and COD Removal

Anaerobic MP proceeded in two phases, and in each phase, MP displayed pseudo-first-order kinetics, and thus can be described with the following Equation (1):
C t , M P   =   C f , M P   ·   ( 1     e k M P · t )   +   C i , M P
where:
  • Ct,MP (NL/kg CODadded) is the cumulative MP at digestion time t (days);
  • Cf,MP (NL/kg CODadded) is the maximal MP;
  • Ci,MP (NL/kg CODadded) is the initial MP;
  • kMP (d−1) is the rate constant of MP.
The initial rate of MP (rMP in L/(kg CODadded·d)) is the product of kMP and Cf,MP.
The pseudo-first-order model used to determine the kinetics of BOD concentration can be described with Equation (2):
C t , B O D 7   =   C f , B O D 7   ·   ( 1     e k B O D 7 · t )   +   C i , B O D 7
where:
  • Ct,BOD7 (mg/L) is the cumulative BOD7 during 7 days (t) of measurements;
  • Cf,BOD7 (mg/L) is the final BOD7;
  • Ci,BOD7 (mg/L) is the initial BOD7;
  • kBOD7 (d−1) is the rate constant of oxygen consumption for the oxidation of BOD compounds.
The initial rate of oxygen consumption for BOD oxidation (rBOD7 in mg/(L·d)) is the product of kBOD7 and Cf,BOD7.
The COD was removed in two phases. COD removal in each phase followed a zero-order kinetics model, as given in Equation (3):
C t , C O D   =   k C O D   ·   t   +   C i , C O D
where:
  • Ct,COD (mg/L) is the COD concentration at digestion time t (days);
  • Ci,COD (mg/L) is the initial COD concentration;
  • kCOD (mg/(L·d)) is the rate constant of COD removal, which is equal to the rate of COD removal (rCOD, mg/(L·d)).
The decrease in VFA concentration, noted mostly in the 1st phase and at the beginning of the 2nd phase of COD removal during MP from LCB, and in the 2nd phase of COD removal during MP from mixtures, followed a zero-order kinetics model, as given in Equation (4):
C t , V F A   =   k V F A   ·   t   +   C i , V F A
where:
  • Ct,VFA (mg/L) is the VFA concentration at digestion time t (days);
  • Ci,VFA (mg/L) is the initial VFA concentration;
  • kVFA (mg/(L·d) is the rate constant of the decrease in VFA concentration, which is equal to the rate of VFA removal (rVFA, mg/(L·d)).
The values of Cf,MP, Cf,BOD7, Ct,COD, Ct,VFA, kMP, kBOD7, kCOD, and kVFA were obtained by non-linear regression analysis with Statistica software, version 13.3 (StatSoft 13.3).

3. Results and Discussion

3.1. The Amounts and Biodegradability of Leachate

In the processes of composting/aerobic stabilization, leachate production is influenced by the technology and the feedstock that are used, due to the fact that organic materials differ in terms of the rate at which they decompose, the amount of water they contain, and their structural characteristics. Larger amounts of leachate tend to be produced by materials with higher moisture contents, while smaller amounts are usually produced by dry, carbon-rich materials, because these materials absorb moisture, reducing the output of leachate. The specific amount of leachate that is generated can vary widely. At one extreme, an extremely large amount of leachate (2750 L/ton) was generated during open composting of organic waste (67% yard waste and source-separated food waste, 18% industrial sludge, 8% municipal sewage sludge, and 7% paper mill sludge) [37]. In a lab performing composting of green and biodegradable waste, 130 L/ton was produced [38]. During full-scale aerobic stabilization of MSW, lesser volumes of 77 L/ton [39] and 45 L/ton [18] were produced; the difference between those studies is attributable to the percentage of food waste in the MSW. Composting of 50% green waste and 50% sewage sludge resulted in leachate production in the range of 33–55 L/ton [40]. Finally, leachate production was very low (4 L/ton) during aerobic stabilization of OFMSW at an MBT plant [41]. The LCB used in the present study was produced (at a rate of ca. 165 L/ton) during the composting of biowaste in the biological part of a full-scale MBT installation located in Poland consisting of closed modules, then a closed and finally an open windrow. Thus, the LCB in this study was a mixture from all stages of composting. However, it should be emphasized that the very high nutrient load in that mixture was due to highly loaded LCB produced during the 1st phase of composting.
The detailed characteristics of the LCB from the composting of biowaste that was used in this study are presented in Table 2 (Section 2). As shown in Table 2, the COD/TKN ratio was ca. 29, while optimal values are in the range of 55 to 143. Thus, waste G was used to increase the COD/TKN ratio, increasing it to 55–86 when the content of G in the feedstocks was 3–5%. The LCB had high concentrations of COD, BOD, and VFA, whereas the G had a much higher content of COD and BOD, but lower concentrations of VFA. Figure 2 shows the BOD concentrations in LCB, G, and their mixture across the 7 days of measurement.
A one-day lag phase was noted during measurements of the BOD7 of LCB. This can be explained by the fact that the organic macromolecules could not be immediately degraded by the microorganisms. Before this, numerous microbes would have had to secrete various enzymes that broke down complex compounds into simpler forms. Then, hydrolysis and the activity of extracellular enzymes could convert carbohydrates, lipids, or proteins, which are inaccessible to microorganisms, into sugars, long-chain fatty acids, and amino acids [42,43,44]. When the organics became easily available to the microbes, the oxygen consumption (OC) for the oxidation of organics in LCB increased rapidly up to the second day, then it continued to increase slowly, reaching a final value of 29,866 mg O2/L. The course of OC for oxidation of organics in G during BOD7 measurements was different. After a half-day lag phase, some organics (which were immediately available in G) were rapidly oxidized. Then, some time was needed to break down complex compounds into simpler ones, after which the OC increased, and the final BOD7 concentration in G (70,730 mg O2/L) was more than two times higher than the value in LCB (Figure 2).
As the share of G in the mixture was raised from 3 to 5%, the BOD7 concentration increased from 42,125 to 50,298 mg O2/L. The degradability of substrates can be determined based on not only the BOD7 concentration but also the rate constant of OC for the oxidation of BOD compounds (kBOD7). As both of these values increase, so does the biodegradability of the substrate. Thus, the kBOD7 value was determined with the first-order kinetic models used to describe the BOD for oxidation of organics in LCB, G, and their mixtures. Despite the much lower BOD7 concentration in LCB than in G, the rate constant of OC for the oxidation of BOD compounds was higher for LCB (kBOD7 0.99 d−1 vs. 0.43 d−1). Although kBOD differed between the substrates, they were both highly biodegradable. However, the lower value of kBOD for G means that more time may be needed for its biodegradation. The addition of increasing doses of G to LCB caused a marked decrease in the kBOD7 values, from 0.48 d−1 (LCB+3%G) to 0.31 d−1 (LCB+5%G). It should be emphasized that the value with 5% of G was even lower than the one with G only (Figure 2).

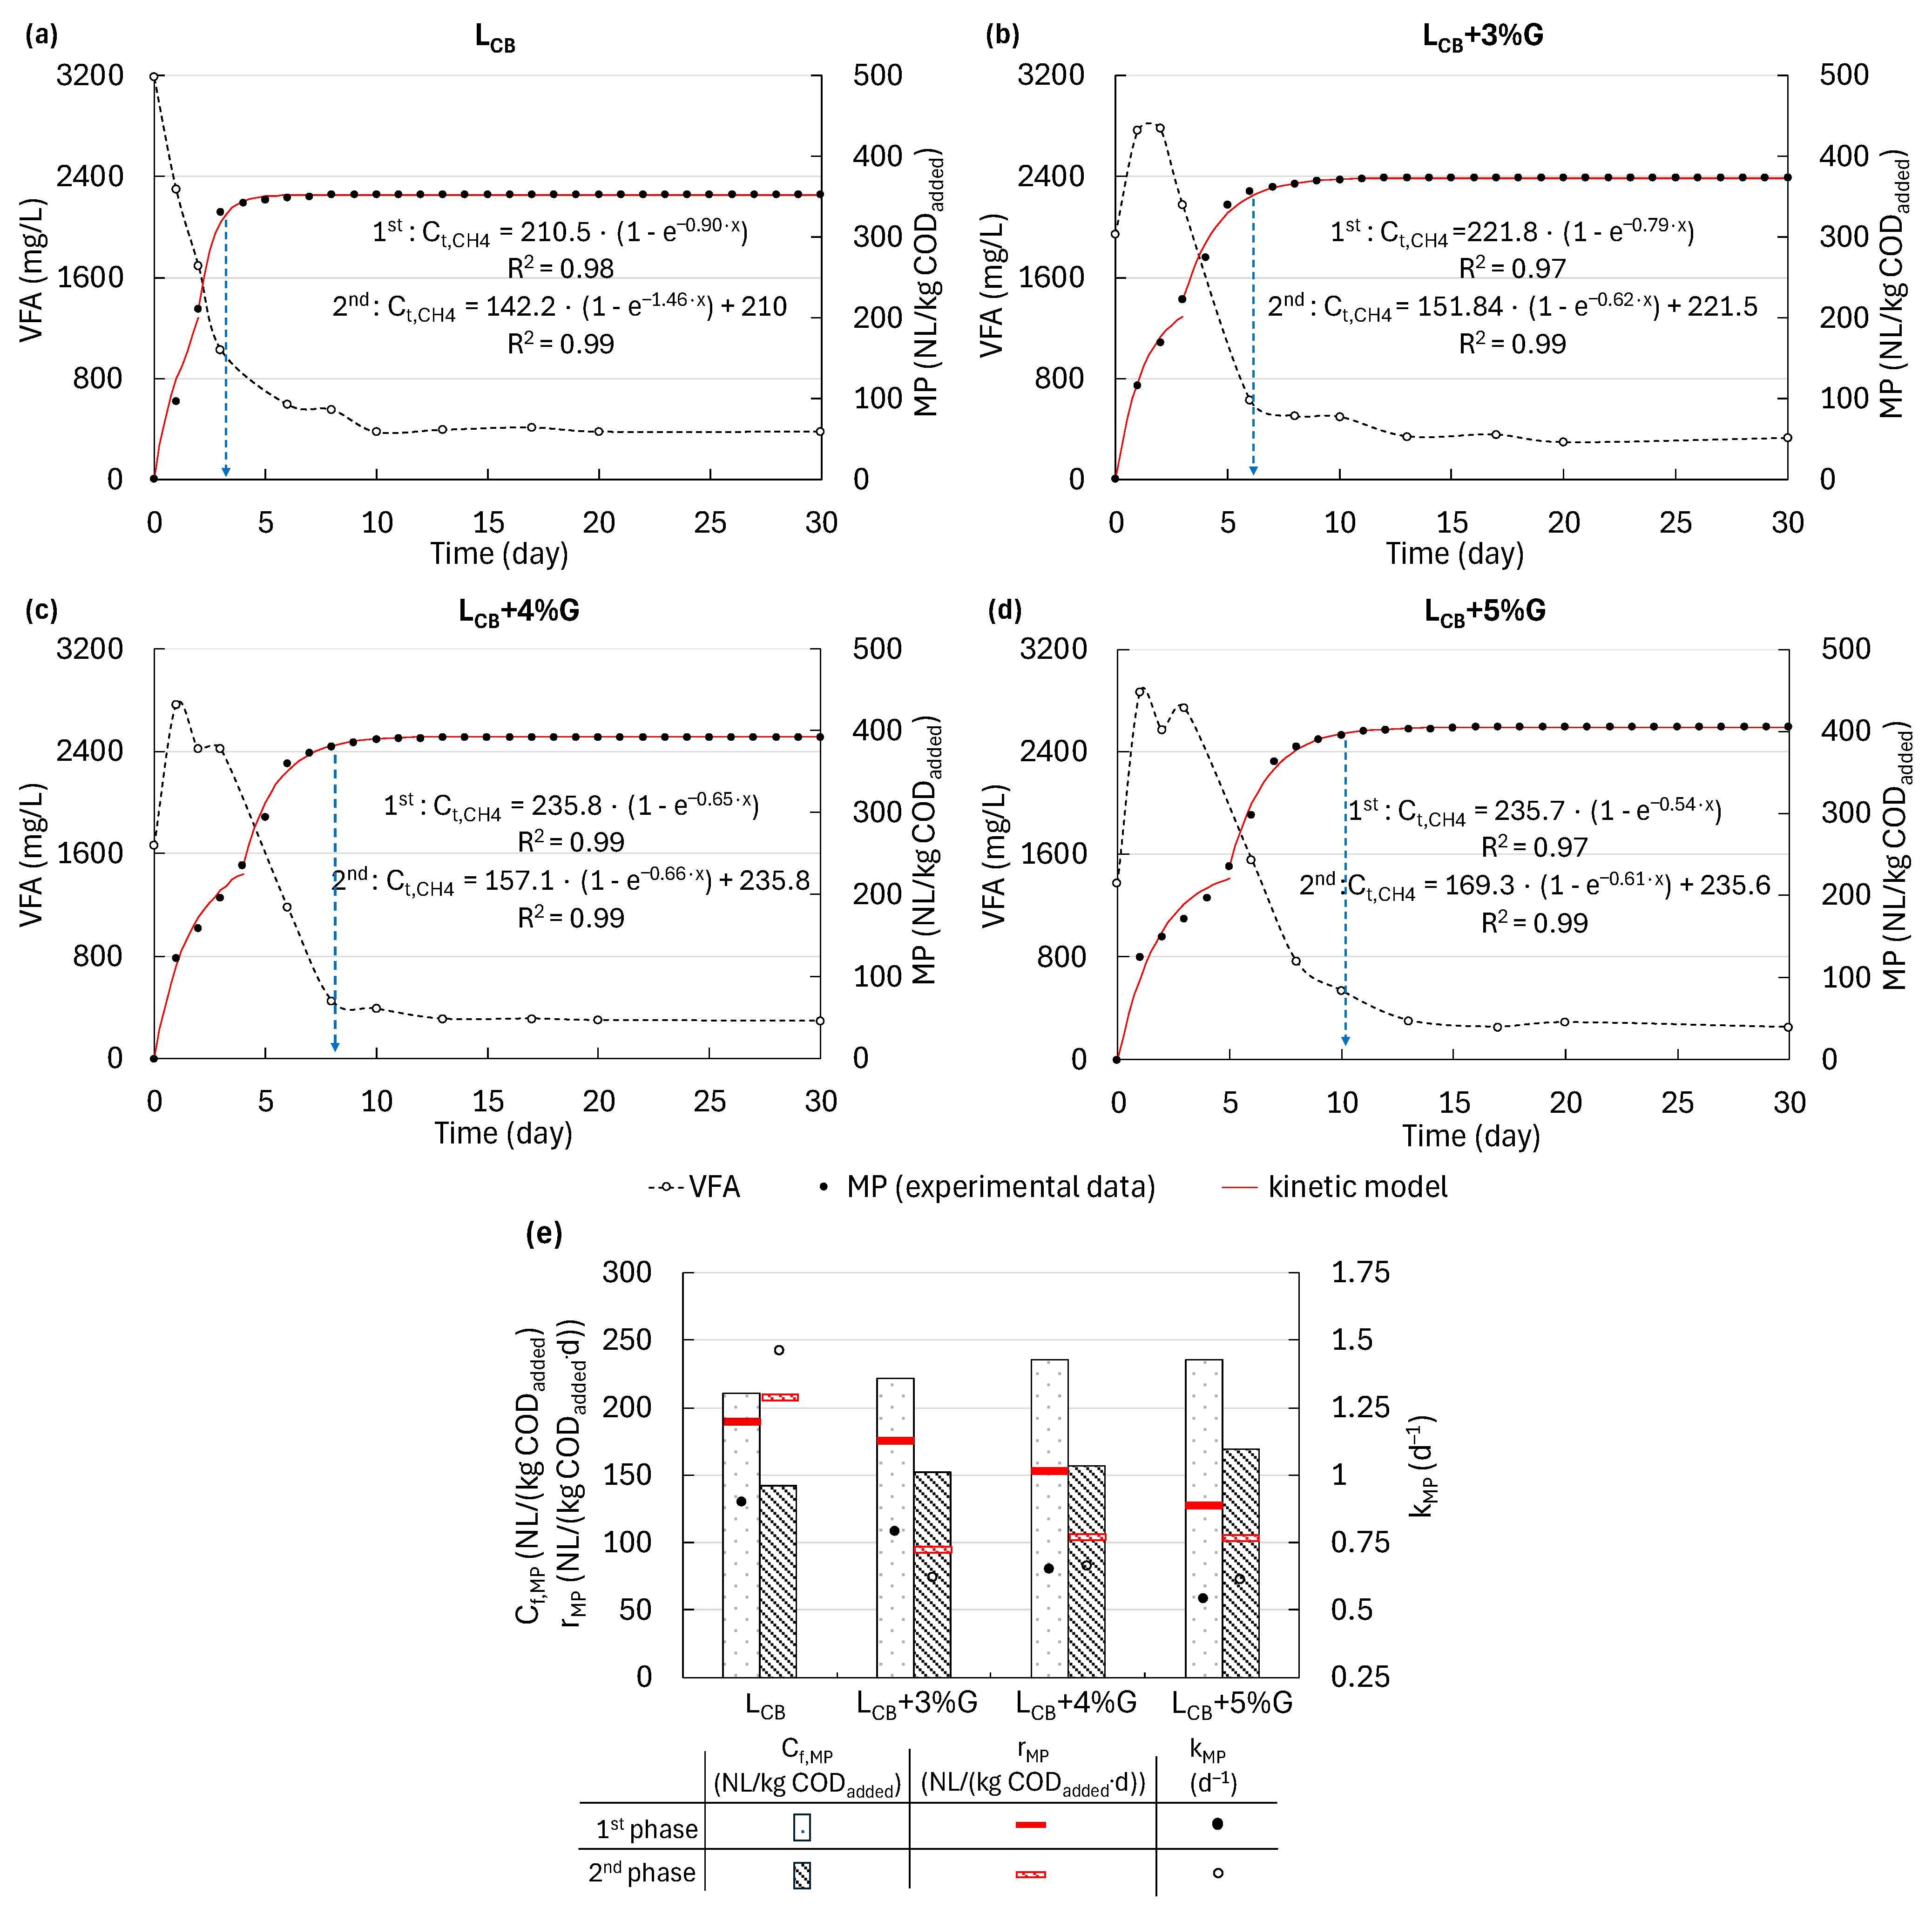
3.2. Changes in the Concentrations of Total VFA and COD During MP

As mentioned, to ensure an adjusted initial OLR of 7.5 kg COD/(m3·d) in all bioreactors, appropriate doses of LCB and the mixtures were used (Table 2). Thus, despite the increasing content of G in the mixtures with LCB, the initial concentration of COD was similar in all variants, at ca. 7500 mg/L. Just after starting measurements, the COD concentration started to decrease as a result of MP (Figure 3). Two phases of COD removal were distinguished. Each phase was described with zero-order kinetic models, from which the rate constants of COD removal (kCOD) were determined. In the latter part of this section, we will refer to the rates of COD removal (rCOD) which are equivalent to kCOD (Figure 3).
During the 1st phase in all variants, COD was removed very rapidly. Thus, the rates of COD removal were much higher in this phase than in the second one. With LCB, the durations of the 1st phases of MP and COD removal were similar, 2–3 days, and during this period, a large amount of COD was removed (decrease to 2773 mg/L) at a rate of 2242 mg/(L·d). With LCB+3%G, the COD concentration decreased to 3220 mg/L within 2 days, whereas with LCB+4%G and LCB+5%G, 3 days was necessary for it to decrease to 2591 and 2905 mg/L, respectively. With increasing shares of G, the rates of COD removal decreased from 2193.5 mg/(L·d) with LCB+3%G to 1603.4 mg/(L·d) with LCB+5%G. In all variants, COD was removed slowly in the 2nd phase. With LCB, the COD concentration decreased almost imperceptibly at a rate of 26.7 mg/(L·d), and after just 1 day, it stabilized at ca. 650 mg/L. When the content of G in the mixtures was increased to 3, 4, and 5%, the duration of the 2nd phase of COD removal was extended to 6, 8, and 10 days, respectively. The rates of COD removal gradually decreased with increasing contents of G, from 539.2 mg/(L·d) with 3% of G to 304.5 mg/(L·d) with 5% of G. The final COD concentrations in all the mixtures were similar, at ca. 580 mg/L.
As mentioned in the Materials and Methods section, the initial VFA concentration was highest in LCB, at ca. 17,464.3 mg/L, whereas it was lowest in G, at 1008 mg/L. Therefore, when the dose of G was increased, the VFA concentration in the mixtures (as feedstocks) decreased from 12,528.03 mg/L (LCB+3%G) to 8733.20 mg/L (LCB+5%G). Generally, the decrease in total VFA concentration proceeded in one phase described with a zero-order kinetic model, from which the rate constant of the decrease in total VFA concentration (kVFA) was determined. In the latter part of this section, we will refer to the rate of the decrease in total VFA concentration (rVFA), which is equivalent to kVFA (Figure 3). During MP from LCB, VFA did not accumulate, and the total VFA concentration decreased along with a decrease in COD (in the 1st phase and at the beginning of the 2nd phase of COD removal). During this time (3 days) a large amount of VFA was removed, and the total VFA concentration decreased to 1028 mg/L at a rate of 708 mg/(L·d).
With the mixtures, the total VFA concentration initially increased rapidly, indicating the beginning of acidogenesis, and these substances accumulated (at ca. 2800 mg/L) during the first 2–3 days of MP. This led to a decrease in the pH, and acidic conditions were present. The resulting impairment of microbial activity directed toward methanogenesis caused MP to be slower than with LCB only, and led to the appearance of two very distinct phases of MP [43,45]. After the period of VFA accumulation and pH recovery, VFA levels started to decrease. The durations of the decrease in VFA and of COD removal in the 2nd phase were the same, lasting 6, 8, and 10 days with 3, 4, and 5% G, respectively. Similar to the COD removal rates, the VFA removal rates decreased with increasing shares of G, from 437 mg/(L·d) with 3% of G to 371 mg/(L·d) with 5% of G.

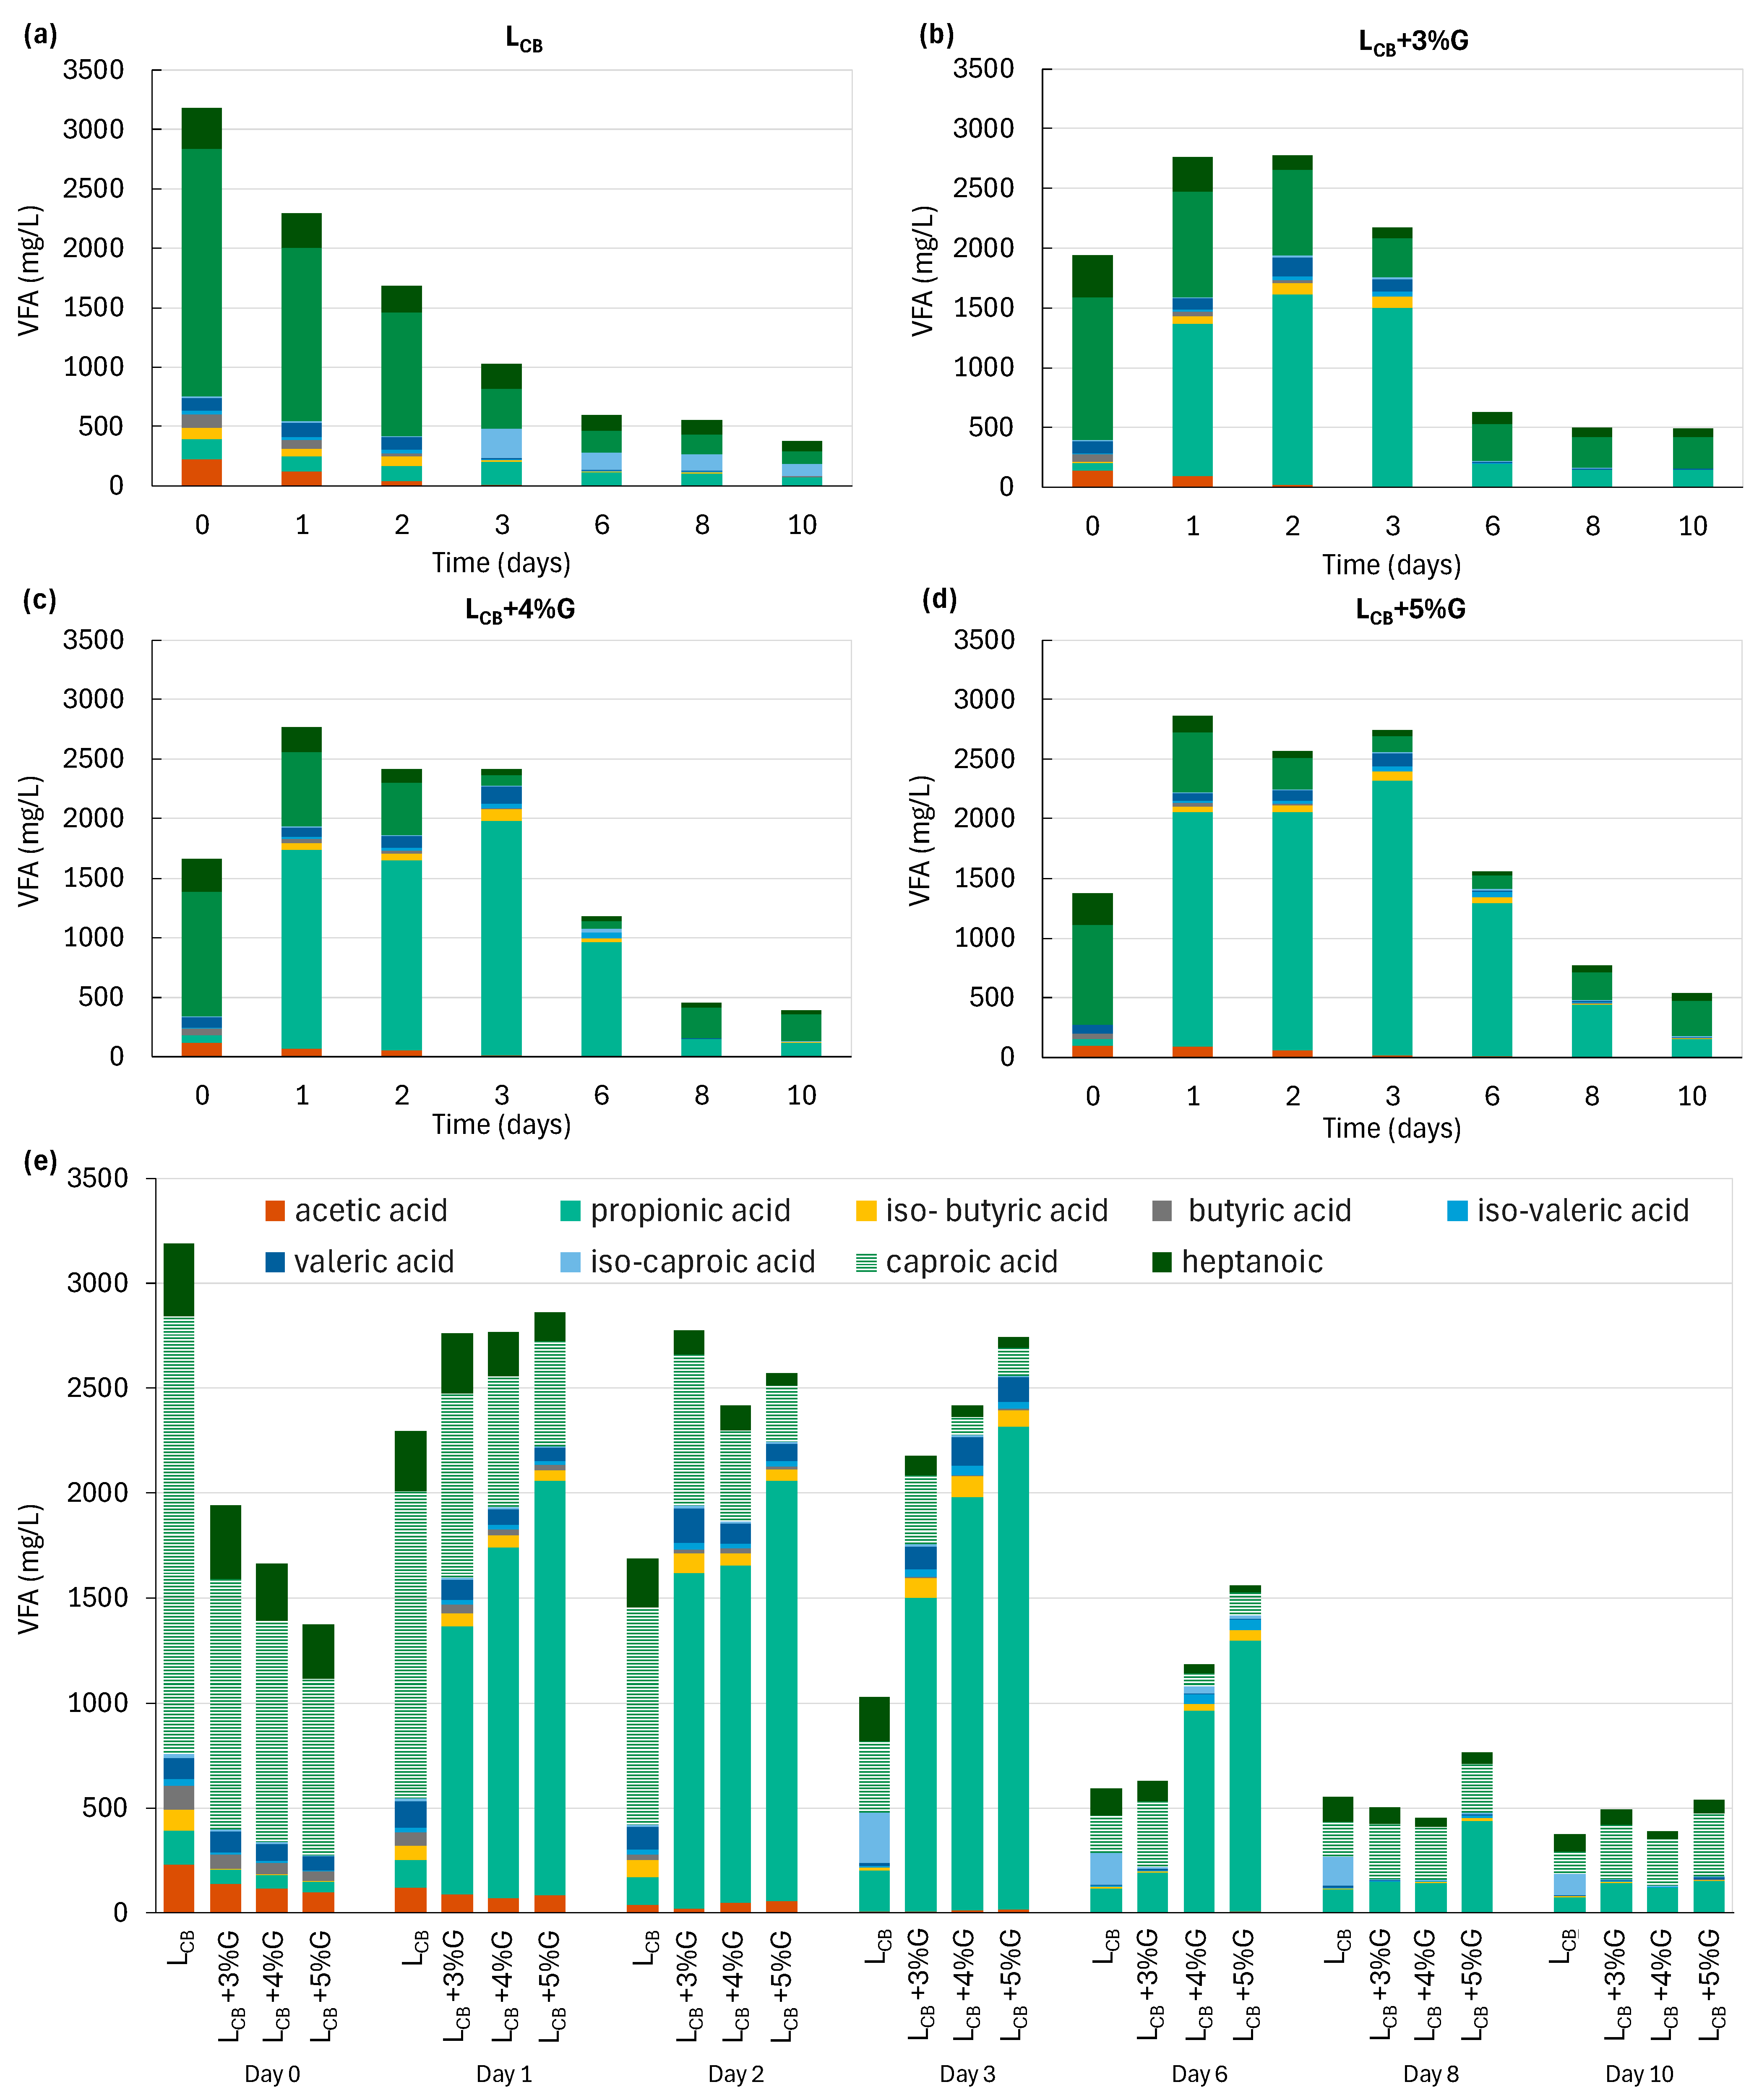
3.3. Changes in the Individual VFA Concentration and the Effect of VFA Accumulation on MP

At the beginning of the experiment (day 0), the total concentration of VFA differed significantly depending on the G content in the mixtures with LCB (Figure 4). With LCB alone, the total VFA concentration was highest, at 3186.36 mg/L, and caproic acid (C6) predominated with a concentration of 2085.47 mg/L (65.45% of total VFA). The addition of G significantly decreased the initial total VFA concentration to 1939.67 mg/L, 1665.41 mg/L, and 1372.60 mg/L in the mixtures containing 3, 4, and 5% of G, respectively. This decrease in total VFA concentration with increasing G content likely reflects a dilution effect caused by the addition of this organics-rich co-substrate, in which only 1% of the total amount of organics (expressed as COD) is in the form of VFA. However, it is known that G and its main component, glycerol, are converted anaerobically into a variety of products, including VFA (e.g., acetic acid, propionic acid, butyric acid). It is known that a large group of microorganisms can grow on a medium containing G and utilize it as a source of carbon and energy. During anaerobic conversion, the microorganisms are able to form acetate, H2, CO2, and formate, which are then converted into methane. However, not all reactions involved in acetogenesis take place under standard environmental conditions. For example, reactions that produce ethanol, propionate, or butyrate require a mechanism to remove hydrogen. MP can be subject to limitation during the acetogenic or methanogenic stages because acidogenic bacteria are readily able to utilize glycerol as a substrate. This can cause organic acids (e.g., valeric, butyric, and propionic acids) to be formed in the acidogenic stage; these acids are not digested by acetogenic or methanogenic microbes at the same rate as they are produced. If the alkalinity present in the system is not sufficient to balance the production of these acids, they can inhibit the action of methanogens, leading to system breakdown [33,46].
During measurement of MP, VFA concentrations displayed noticeable changes in the first 6–10 days. With LCB alone, the concentration of all VFA steadily decreased, with acetic acid (C2) decreasing rapidly from 230.06 mg/L on day 0 to 1.01 mg/L on day 3. Then, the concentration remained at the same level. The concentration of caproic acid (C6) also decreased substantially from 2085.47 mg/L on day 0 to 181.67 mg/L on day 6 and then remained at the same level, when it was still the predominant VFA, albeit by a smaller margin. In contrast, the share of propionic acid (C3) increased over time, accounting for 19.64% of the total VFA on day 10. The relative proportions of the iso-acids, such as iso-caproic (iso-C6) and iso-valeric acid (iso-C5) also increased, especially during the later days of MP. Iso-valeric acid (iso-C5) is often formed from amino acid metabolism, particularly in protein-rich substrates. Microorganisms typically use this molecule to post-synthetically modify structural molecules, thereby increasing membrane fluidity, which enables growth in unfavorable conditions [47,48].
The presence of G in the mixtures led to dramatic increases in total VFA concentration on day 1, which peaked at 2777.14 mg/L (LCB+3%G), 2765.14 mg/L (LCB+4%G), and 2862.86 mg/L LCB+5%G) and remained high until days 3, 4, and 6, respectively. This delayed VFA consumption coincided with the start of the 2nd phase of MP, which typically marks the transition to the 2nd phase of fermentation. After day 6, the total VFA concentrations in the mixtures continued to decrease, finally reaching values of 388.57 mg/L (LCB+3%G), 494.29 mg/L (LCB+4%G), and 537.14 mg/L (LCB+5%G).
The addition of G significantly altered the shares of individual VFA and promoted the accumulation of propionic acid (C3), especially at a higher G content in the mixture. With LCB+3%G, the concentration of propionic acid (C3) increased from 69.09 mg/L to a peak of 1595.39 mg/L on day 2, before decreasing to 144.23 mg/L by day 10. With 4% and 5% G, the propionic acid (C3) concentration peaked later, on day 3, when it reached 1969.27 mg/L and 2303.41 mg/L, respectively. The predominance of propionic acid (C3) was such that the percent share reached 81.47% and 83.98% of total VFA with LCB+4%G and LCB+5%G, respectively.
The increase in the concentration of propionic acid (C3) was accompanied by a decrease in the concentrations of other VFA, particularly acetic acid (C2) and caproic acid (C6). In the LCB+5%G, acetic acid (C2) accounted for less than 3% of total VFA by day 10, while caproic acid (C6) comprised less than 10% of the total by day 6. These changes in the VFA profile were likely influenced by the relative degradation rates of the different acids. Individual VFA are degraded according of first-order kinetics, whereby the degradation of propionic acid (C3) is slower compared to other VFA. Wang et al. [49] reported that propionic acid degraded more than two times slower than acetic acid during AD of pretreated and untreated activated sludge (kH,C3 = 0.0288 h−1 vs. kH,C2 = 0.0612 h−1). Due to the slower conversion rate of propionic acid (C3) to acetic acid (C2), hydrogen, and carbon dioxide, its methanogenesis is slower than that of acetic acid and butyric acid. This difference explains the slower rate of methane formation in the reactors containing the LCB and G mixtures. Finally, between 8 and 10 days into the experiment, the concentrations of caproic acid (C6) increased again, and it predominated with a share of over 50% of total VFA. Long-chain fatty acids production in late acidogenesis was due to the enrichment of specific microbial groups that convert short-chain to long-chain fatty acids [50]. Caproic acid is formed via the elongation of carboxylic acid chains by reverse β-oxidation, using acetic and/or butyric acid as substrates and ethanol or lactic acid as electron donors [51].

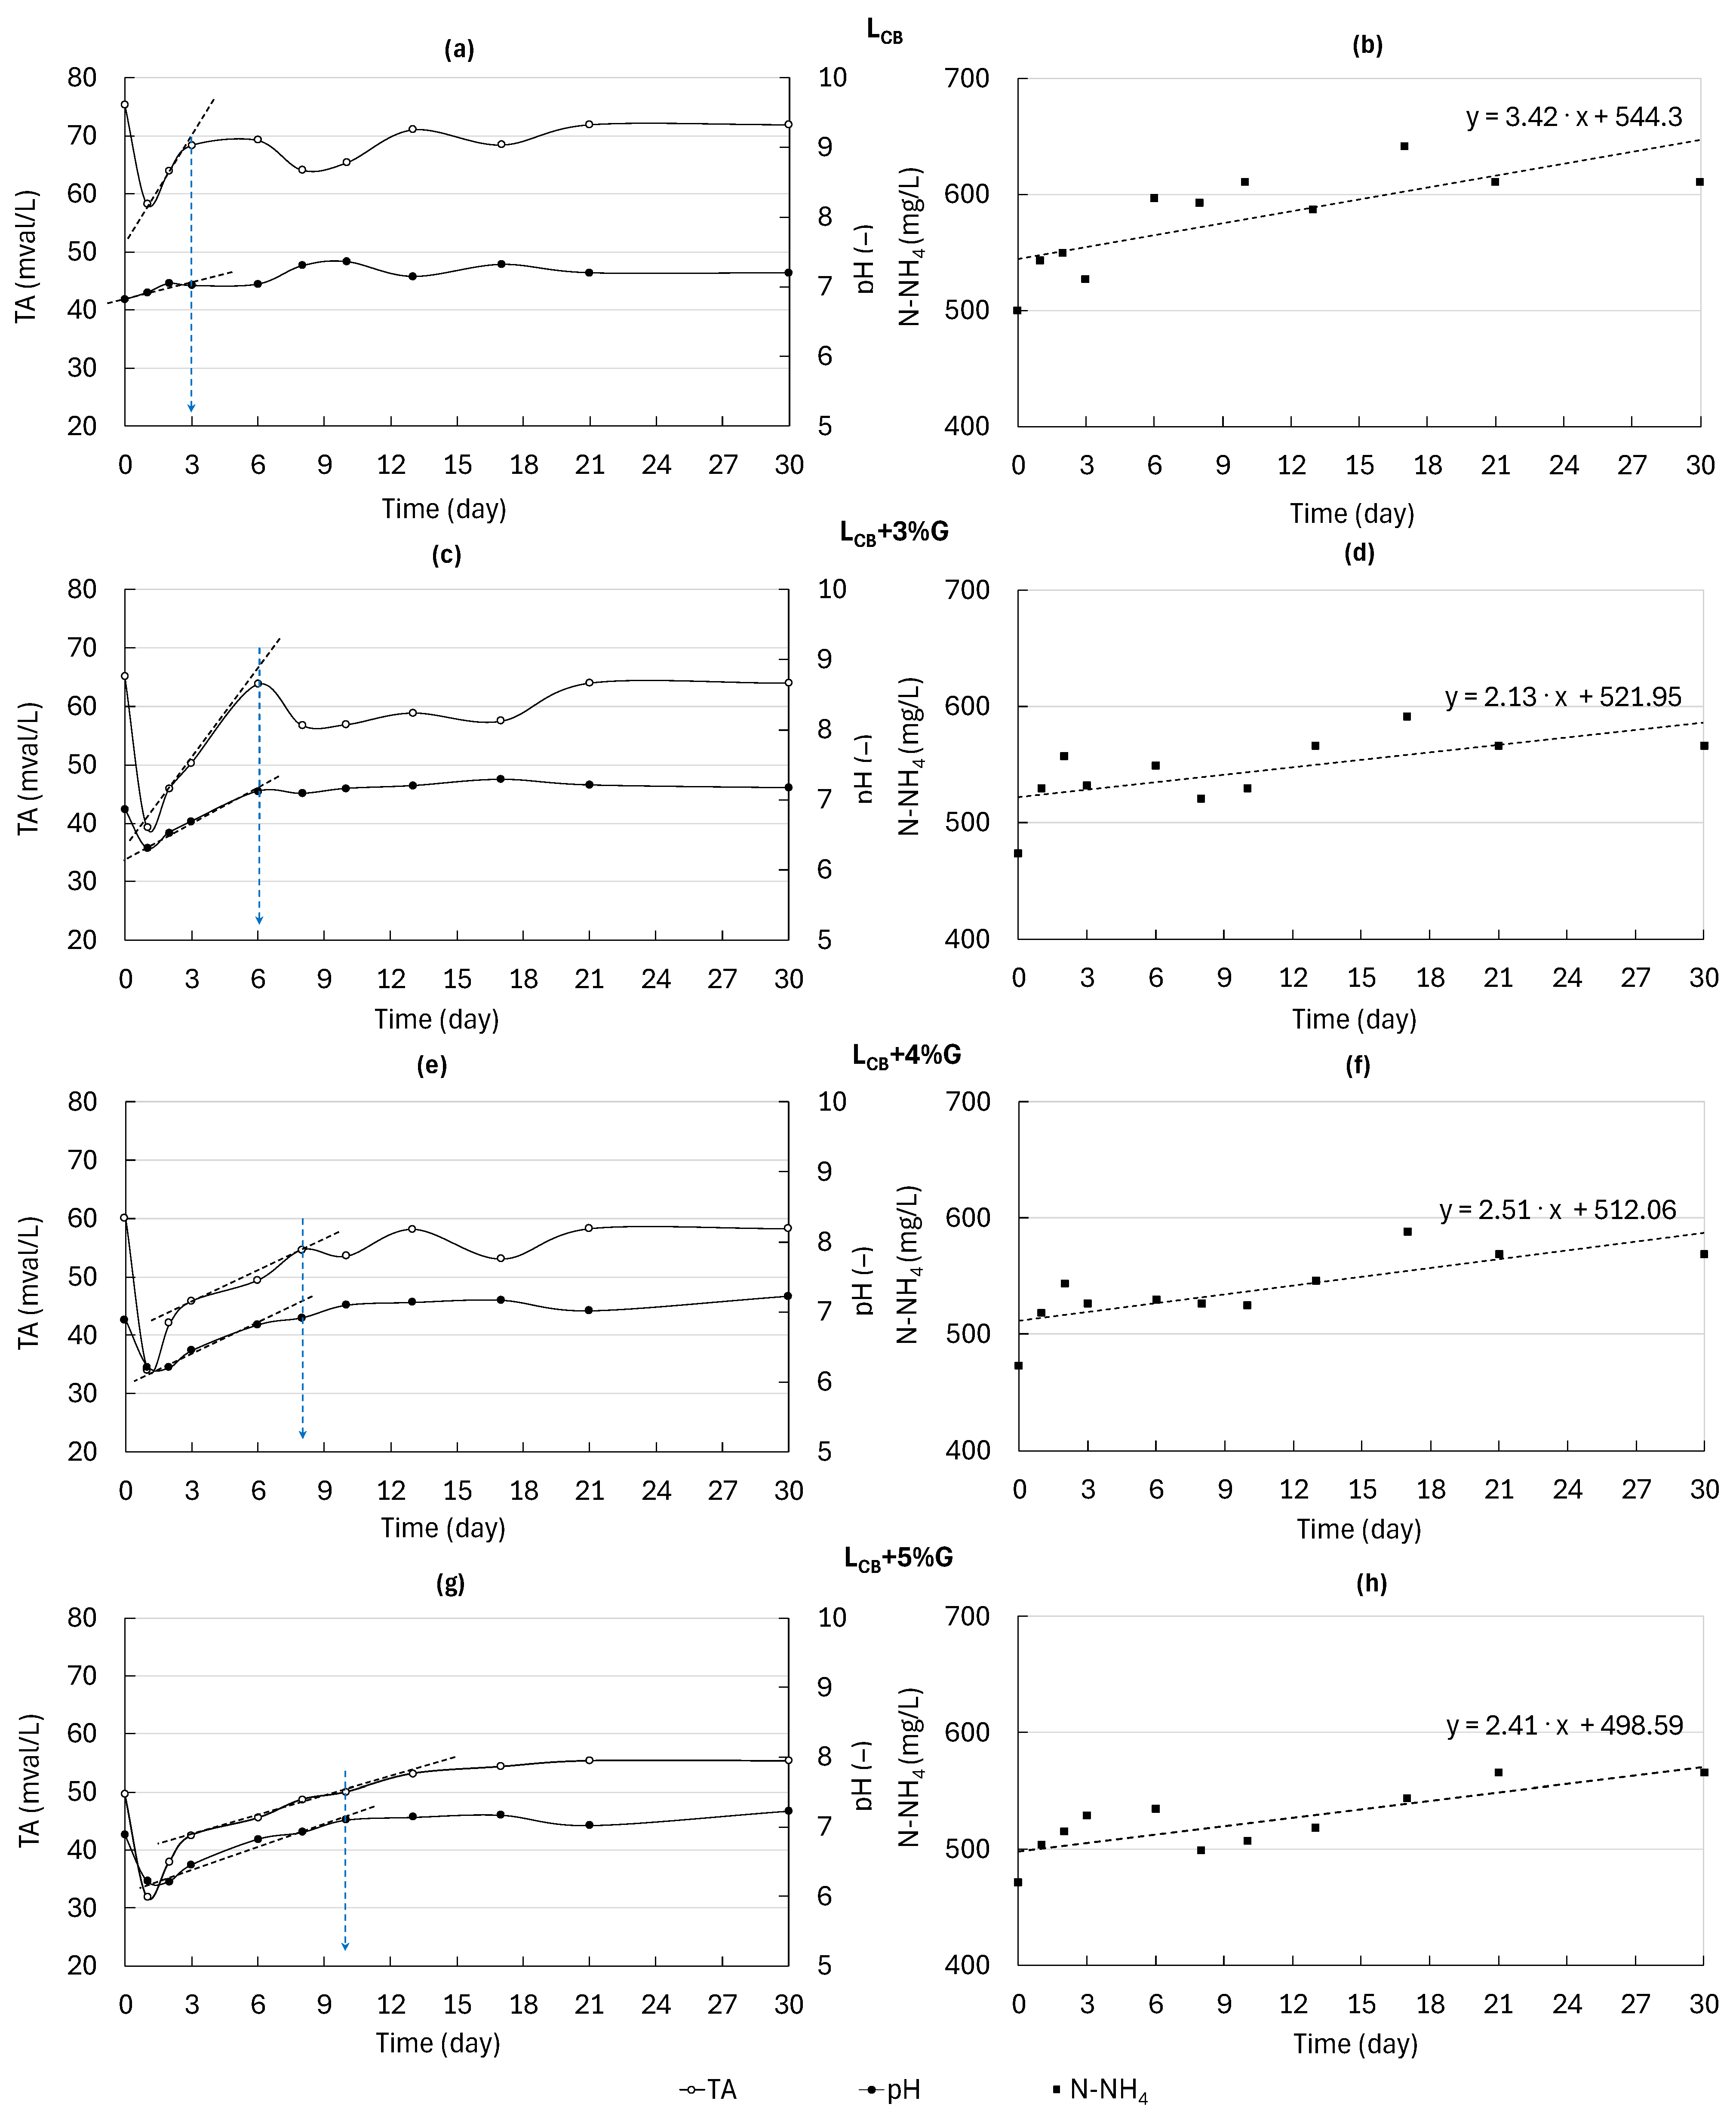
3.4. Environmental Conditions of AD of LCB and Co-Digestion of LCB and G

The pH and TA values were also measured because they are key determinants of the stability of MP, influencing the development and activity of the various microorganisms involved in the phases of AD. To produce methane with maximum efficiency and maintain a balance between the processes of anaerobic transformation (hydrolysis, acidogenesis, and methanogenesis), the optimal pH value is between 7.0 and 8.0. In all the experimental variants, the total alkalinity ranged from 50 to 80 mval/L, whereas the pH fluctuated between 6.15 and 8.03. As the acceptable pH range for AD is ca. 6.50–8.78, the only variant in which it was maintained at an acceptable level for the whole process was MP from LCB.
The higher the content of G in the other variants, the longer the pH was below the acceptable level. The pH values in all the variants were similar at the beginning and end of the measurements. As mentioned, VFA accumulation during AD strongly affected the pH and alkalinity in the system (Figure 5). With LCB, the pH started to increase at the beginning and took 3 days to reach stable values. The TA decreased rapidly during the first day and then started to increase, becoming fairly stable after 3 days. During MP from the mixtures, the pH and TA dropped sharply on the first day, then started to increase. With 4 and 5% of G content in the mixture, however, the pH remained low (<6.5) for 2–3 days. The time required to reach optimal values of pH and TA increased as the share of G was raised: 6, 8, and 10 days were needed for LCB+3%G, LCB+4%G, and LCB+5%G, respectively.
During the measurement of MP, the concentration of N-NH4 in the supernatant was monitored (Figure 5). As G contains a negligible amount of nitrogen, a higher dosage of G in the mixture with LCB (increasing COD/TKN ratio) generally corresponded to a lower concentration of N-NH4 both in the feedstock and at the beginning of the measurement of MP. As the experiments proceeded, the N-NH4 concentration displayed an increasing trend as a result of the ammonification of organic nitrogen from LCB. The largest increase in N-NH4 concentration, 3.42 mg/L per day, was found during MP with LCB. With mixtures of LCB and G, the increase in N-NH4 concentration was from 1.36- to 1.61-times lower than with L only. These results indicate that ammonium buildup may occur during biogas production in reactors regularly fed (at adjusted hydraulic retention time) with LCB only. Such a buildup may occur when the COD/TKN ratio of the feedstock is too low. In such a case, nitrogen may be released in the form of N-NH4, which leads to an increase in the pH of the environment. This in turn may disturb the nitrogen balance and have a toxic effect on the methanogenic bacteria. Thus, it would be more reasonable to conduct a co-digestion of LCB with G, in which the COD/TKN ratio is higher.

3.5. MP During AD of LCB and Co-Digestion of LCB and G

The MP of LCB and the mixtures of LCB and G were measured in the AMPTS system under the NL unit and then recalculated to express MP based on the CODadded concentration (Figure 6). In all variants, 90% of the total MP was achieved within the first few days.
The maximal cumulative MP of LCB was the lowest of all the experimental variants (approx. 353 NL/kg CODadded (388 NL/kg CODrem)), as well as the methane content in the biogas (55%). However, it took only 3 days for this variant to reach over 90% of its total MP. In contrast, when the G content was increased in the mixtures with LCB, it took longer to reach over 90% of total MP (5, 6, and 7 days with LCB+3%G, LCB+4%G, and LCB+5%G, respectively). Similarly, a longer time was required to reach maximal MP when the content of G was increased in the mixture with LCB. Although LCB+5%G needed 10 days to obtain a maximal cumulative MP of 405 NL/kg CODadded (445.5 NL/kg CODrem), this was the highest value of all the experimental variants, and the methane content of the biogas was also the highest, at 69%. LCB+4%G required 8 days to reach a maximal MP of 393 NL/kg CODadded (432.2 NL/kg CODrem) with a methane content of 65%, and LCB+3%G required 6 days to reach respective values of ca. 374 NL/kg CODadded (411.1 NL/kg CODrem) with 59% of methane content. The methane was produced in two phases, and generally, more methane was produced in the 1st phase than in the 2nd phase. As the content of G was increased, MP in both phases also increased. Each phase of MP was described with first-order kinetic models, which were used to determine the rates (rCH4) and rate constants (kCH4) of MP (Figure 6). Higher values of kCH4 reflect faster MP. Increasing the content of G in the mixture extended the duration of the 1st phase of MP: it lasted only 2 days with LCB, and 3, 4, and 5 days with LCB+3%G, LCB+4%G, and LCB+5%G, respectively. In the 1st phase of MP, kCH4 was highest, reaching a value of 0.90 d−1 when LCB was used as the substrate, and decreasing when the content of G in the mixture was increased: 0.79, 0.65, and 0.54 d–1 with 3, 4, and 5% of G, respectively. This resulted from the fact that, during MP from the mixtures, VFA accumulated, decreasing the pH (Figure 5), probably due to the activity of acidogenic and hydrolytic bacteria, which release large quantities of VFA concentration during the decomposition of organic material. After the time when the pH started to recover, the 2nd phase of MP started. In the 2nd phase of MP, LCB had the highest kCH4 value of all the variants, at 1.46 d−1. In contrast, the values of kCH4 for the 2nd phase with the mixtures were similar, at 0.61–0.66 d−1; thus, the share of G had little influence on this value. These lower values of kCH4 resulted from the fact that the substrate began to become depleted, causing a reduction in the activity of the methanogenic bacteria.
The rates of MP (rCH4) with LCB were similar (189.45 and 207.61 NL/(kg CODadded·d)) in both phases of MP, and these values were higher than the ones with the mixtures of LCB and G. With the mixtures, rCH4 in the 1st phase decreased as the share of G was increased, from 175.2 NL/(kg CODadded·d) with LCB+3%G to 127.3 NL/(kg CODadded·d) with LCB+5%G. In the 2nd phase of MP from the mixtures, the rCH4 values were similar at ca. 100 NL/(kg CODadded·d).
So far, studies of MP from LCB generated during the composting of biowaste have been limited. Some research has focused on MP from different types of leachate produced via the treatment of biodegradable waste, such as food waste alone or OFMSW. However, many researchers still use landfill leachate. As would be expected, the results of MP differ depending on the type of leachate and the conditions in which measurements are taken. For example, Lee et al. [52] tested MP from leachate (2 g VS/L) (volatile solids (VS)) in BMP experiments at 35 °C and an initial pH of 7.8. Leachate was collected from a crusher used before composting at a food waste recycling facility in South Korea. The authors found that the cumulative methane yield of leachate after 28 days was 478 L/(kg VS). Lee et al. [52] reported MP in units of liter per kg of VS. This resulted from the fact that leachate contained a relatively high content of total solids (TS), at 16% (VS/TS ratio of 0.91). The authors concluded that leachate is an easily soluble substrate with a biodegradability of 82.6%, which means that it can be processed by biological methods such as AD [52]. In contrast, the LCB used in the present study was in liquid form, and its TS content did not exceed 1%; thus, MP was expressed in L/kg COD (approx. 353 NL/kg CODadded), which is the more common practice in the case of liquid materials. Although these MP results cannot be directly compared, they indicate that both types of organics-rich leachate can be prospective substrates for biogas production.
In another study of MP with leachate, Nayono et al. [15] investigated mesophilic MP from leachate after pressing OFMSW on a mash-separator at a full-scale facility. This leachate had a very low pH of 4.3, and very high COD and TKN concentrations (100.1 g COD/L, 4.1 g TKN/L). Although the COD/TKN ratio of 24.4 in this leachate was even lower than the ratio in LCB of the present study, MP was high at 270 L/kg CODadded. It was possible to produce this much methane without disturbances during the process because the tests were conducted as batch experiments, in which the authors used 2.5 mL of leachate with 247.5 mL of inoculum, resulting in a high inoculum to substrate ratio of 99. About 90% of the total methane was released in the first four days, and after seven days of digestion, there was no longer any significant MP. Thus, they concluded that, after two weeks of digestion, the MP with leachate obtained by pressing OFMSW had reached its final state. In addition to MP, the authors measured the contents of individual heavy metals in leachate and found from several (e.g., 1.9 mg Cd/L) to several dozen (e.g., 96.4 mg Ni/L, 1249 mg Fe/L) milligrams per liter. This shows that leachate obtained after treatment of mixed MSW may contain heavy metals [15]. Nayono et al. [15] indicated that, except iron and nickel, the heavy metal concentrations were relatively low and far from inhibitory or toxic amounts for AD. Although a wide range of heavy metal ions may be essential for AD as modulators of enzymes required for proper energy metabolism of the microorganisms that drive anaerobic reactions, the heavy metals that remain in the digestate may spread into the environment. It should be remembered that, when biogas is produced from biodegradable waste such as OFMSW mechanically sorted from mixed MSW, the post-fermentative digestate may contain harmful contaminants, such as heavy metals. This is of great importance for further disposal or use of the post-fermentative digestate. If this digestate comes from the AD of OFMSW, for example, there may be a risk of spreading contaminants along with the post-fermentative digestate. On the other hand, however, biogas is undoubtedly an added-value product; thus, it is worth the effort to obtain it. If post-fermentative digestate comes from the AD, it will have potential for use as a fertilizer. Therefore, the current approach of treating OFMSW in the existing MBT installations must be changed to treating biowaste collected separately.
In addition to these studies of MP with leachate as the only substrate, some other studies have investigated the possibility of co-digestion of leachate with other organic substrates. If the leachate contains low concentrations of organic compounds, including highly biodegradable ones, and a high concentration of nitrogen (leachate from old landfills), it cannot be treated via mono-digestion. Instead, the leachate should be used as a co-substrate, which improves the balance of nutrients in the AD process. Such a study was carried out by Liao et al. [53], who used leachate with low concentrations of organics (2500 mg COD/L, 345 mg BOD5/L) and a high ammonium concentration (3625 mg N-NH4/L). Those authors found that L had a positive effect on biogas production during co-digestion with food waste.
There is also little information concerning the effectiveness of co-digestion and MP from any type of leachate in combination with waste G or crude glycerol. A study by Takeda et al. [54] optimized the feedstock composition for AD (in batch reactors at 37 °C) by combining substrates with complementary characteristics. They used leachate, specifically a mixture of young and mature (about 22 years) landfill leachates. It had a pH of 8.1 and a very low COD/TKN ratio of 1.65 (1400 mg COD /L and 851 mg TKN/L). Thus, to increase the COD concentration in the mixture (13–30 g/L) and the COD/TKN ratio (ca. 16), the authors co-digested this leachate with crude glycerol (0.7–1.77% (v/v)), a waste product extracted from processing soybean oil for biodiesel production, which is characterized by a high organics concentration (1661.0 g COD/L) [54]. Takeda et al. [54] found that the MP ranged between 191.46 and 776.83 L/kg CODrem. The highest MP (75% of CH4 in biogas) was noted at a crude glycerol content of 1.1%. In the present study, higher doses of G were used and tested (3–5%). Although it was found that the MP increased with the increasing doses of G in the mixture of LCB, even when 5% of G was used, the maximal cumulative MP, 405 NL/(kg CODadded) (445.5 NL/kg CODrem), was 1.74-times lower than that in the study by Takeda et al. [54]. Additionally, the methane content of the biogas was lower, at 69%.
Different studies have shown the benefits of adding G during AD, and it should be emphasized that the reported doses of G cover a wide range. So far, many studies have focused on anaerobic co-digestion of G with animal manure. In general, co-digestion with G helps to adjust COD/TKN ratio, providing a more balanced nutrient environment conducive to stable microbial activity. A balanced COD/TKN ratio improves the overall efficiency of the process, reducing the risk of process inhibition caused by excessive nitrogen levels or the accumulation of VFA, which can lead to acidification of the digester. However, studies suggest that the content of G in the mixture needs to be considered carefully. Excessive amounts of G can lead to accumulation of VFA, which may cause system acidification and inhibit biogas production. For example, Astals et al. [55] tested very high contents of G, ranging from 20% to 80%, in mixtures with pig manure. The authors found that co-digesting pig manure with 20% waste G increased MP (215 mL CH4/g COD) by 125% compared to mono-fermentation of pig manure. However, with 80% G content in the mixture, they found that VFA accumulated due to the low nitrogen concentration of the mixture [55]. In some studies, a lower G content (from 3–15%) was tested, and the optimal G content differed from the studies mentioned above. Simm et al. [56] indicated that addition of G at levels between 3 and 8% improved the efficiency of the process of co-digestion with dairy cattle manure. The maximal MP of 0.26 L/g TS was reached with 6% G content, constituting an increase of 13% over the use the manure alone. In contrast, Pazuch et al. [57] found that the addition of 4% G to dairy cattle waste provided a larger production of biogas; however, biogas production was lowest when the mixture contained 6% of G content. Amon et al. [58] investigated the supplementation of G to pig manure and a mixture of maize silage, maize corn, and pig manure. They found that 6% G content resulted in the highest increases in MP, at 285% and 131%, respectively, and emphasized that, for a stable digestion process, the amount of G should not exceed 6%. Robra et al. [59] tested the effect of G content (ranging from 5% to 15%) on MP from mixtures with cattle slurry, a substrate deficient in easily degradable carbon. Doses of G from 5 to 10% enabled highly effective mesophilic co-digestion. In comparison to cattle slurry alone, the addition of G to the mixtures not only increased the gas production but also the content of methane. However, addition of 15% of G led to MP process failure. Chou et al. [60] indicated that the addition of 2 and 4% of G to dairy cattle wastewater increased MP by 117% and 226%, respectively, compared to dairy cattle wastewater alone. From this literature review, it can be concluded that the doses of G depend on the type and characteristics of the substrate and the characteristics of G. It is important to identify the optimum G content to be added to other substrates to improve MP and avoid the risks of organics overload and accumulation of VFA during the process, which may inhibit methanogenic activity.

4. Conclusions

The composting of selectively collected biowaste, which can be considered a recycling method, not only produces compost but also leachate (LCB), which can potentially serve as a substrate for producing bioenergy through AD. However, due to its low COD/TKN ratio and pH, LCB should be co-digested with a substrate that improves these parameters, for example G, which was examined in this study. Digestion of LCB only may lead to ammonium buildup. In contrast, excessive amounts of G can lead to accumulation of VFA, which may cause system acidification and inhibit biogas production. A balanced COD/TKN ratio (the optimal range should be from ca. 55 to 145) improves the overall efficiency of the process, reducing the risk of process inhibition caused by excessive nitrogen levels or the accumulation of VFA, which can lead to acidification of the digester. It was shown that co-digestion with G increased not only MP, but also the methane content in the biogas (374, 393, and 405 NL/(kg CODadded) and 59, 65, and 69% with 3, 4, and 5% of G, respectively); the highest G share resulted in the highest MP and methane content. However, although MP in the batch tests in this study was higher with the LCB+G than with LCB only, in reactors with constant feeding, the content of G in the mixture needs to be established experimentally. To gain a comprehensive understanding of the potential for MP from LCB or a mixture of LCB and G, future studies should focus on analyzing the effectiveness of anaerobic co-digestion of LCB with G in reactors with constant feeding. Furthermore, over time, the use of LCB and G in AD will provide significant environmental benefits, as it not only reduces pollutants in LCB, but also generates renewable energy. These dual benefits highlight a sustainable solution for energy production via management of both of these waste products.

Author Contributions

Conceptualization, T.C.T.L. and K.B.; methodology, T.C.T.L., K.B., T.P. and D.K.; validation, T.C.T.L. and K.B.; formal analysis, T.C.T.L. and K.B.; investigation, T.C.T.L., K.B. and T.P.; resources, T.C.T.L. and K.B.; data curation, T.C.T.L. and K.B; writing—original draft preparation, T.C.T.L., K.B., T.P. and D.K.; writing—review and editing, T.C.T.L., K.B. and D.K.; visualization, T.C.T.L. and K.B.; supervision, K.B. All authors have read and agreed to the published version of the manuscript.

Funding

We are grateful for the financial support of the Ministry of Education and Science, Poland (statutory project No. 29.610.024-110).

Data Availability Statement

Data are contained within the article.

Conflicts of Interest

The authors declare no conflicts of interest.

References

  1. European Union. Directive (EU) 2018/850 of the European Parliament and of the Council of 30 May 2018. Amending Directive 1999/31/EC on the Landfill of Waste (Text with EEA Relevance). Off. J. Eur. Union. 2018, 150, 100–108. [Google Scholar]
  2. Eurostat. Municipal Waste Statistics. 2022. Available online: https://ec.europa.eu/eurostat/statistics-explained/index.php?title=Municipal_waste_statistics (accessed on 16 January 2025).
  3. Bayard, R.; Benbelkacem, H.; Gourdon, R.; Buffiere, P. Characterization of selected municipal solid waste components to estimate their biodegradability. J. Environ. Manag. 2018, 216, 4–12. [Google Scholar] [CrossRef]
  4. Bernat, K.; Wojnowska-Baryła, I.; Kamińska, A.; Zaborowska, M. Towards a circular economy for stabilized residual from organic municipal solid waste processed at an MBT installation—The potential of SR recycling and recovery. Desalin. Water Treat. 2021, 244, 63–76. [Google Scholar] [CrossRef]
  5. Bernat, K.; Zaborowska, M.; Wojnowska-Baryła, I.; Samul, I. Insight into the composition of the stabilized residual from a full-scale mechanical-biological treatment (MBT) plant in terms of the potential recycling and recovery of its contaminants. Sustainability 2021, 13, 5432. [Google Scholar] [CrossRef]
  6. Jędrczak, A.; den Boer, E.; Kamińska-Borak, J.; Kozłowska, B.; Szpadt, R.; Mierzwinski, A.; Krzysków, A.; Kundegórski, M. Analysis of Waste Management Costs—Assessment of Investment Needs in the Country in the Field of Waste Prevention and Waste Management in Connection with the New Eu Financial Perspective 2021–2027; IOS’-PIB, NFOS’iGW: Warsaw, Poland, 2020. (In Polish) [Google Scholar]
  7. Połomka, J.; Jędrczak, A. Efficiency of waste processing in the MBT system. Waste. Manag. 2019, 96, 9–14. [Google Scholar] [CrossRef]
  8. Zero Waste Europe. 2021. Available online: https://zerowasteeurope.eu/wp-content/uploads/2022/06/ZWE-Annual-Report-2021.pdf (accessed on 16 January 2025).
  9. European Commission (EC). Directive 2008/98/EC on Waste (Waste Framework Directive)—Environment. 2008. Available online: http://data.europa.eu/eli/dir/2008/98/oj (accessed on 16 January 2025).
  10. European Commission (EC). The European Green DealCOM 640 Final, Brussels, 11 December 2019b. 2019. Available online: https://eur-lex.europa.eu/resource.html?uri=cellar:b828d165-1c22-11ea-8c1f-01aa75ed71a1.0002.02/DOC_1&format=PDF (accessed on 16 January 2025).
  11. ECN (Ed.) ECN Data Report 2022-Compost and Digestate for a Circular Economy; European Compost Network (ECN) e.V.: Bochum, Germany, 2022. [Google Scholar]
  12. Defra. Mechanical Biological Treatment of Municipal Solid Waste, PB13890. Department for Environment, Food and Rural Affairs, London. 2013. Available online: https://assets.publishing.service.gov.uk/media/5a7c918640f0b626628acfb3/pb13890-treatment-solid-waste.pdf (accessed on 16 January 2025).
  13. EPA. Approaches to Composting. Available online: https://www.epa.gov/sustainable-management-food/approaches-composting (accessed on 16 January 2025).
  14. Čeh, B.; Luskar, L.; Hladnik, A.; Trošt, Ž.; Polanšek, J.; Naglič, B. The Quantity and Composition of Leachate from Hop Plant Biomass during Composting Process. Appl. Sci. 2022, 12, 2375. [Google Scholar] [CrossRef]
  15. Nayono, S.E.; Winter, J.; Gallert, C. Anaerobic digestion of pressed off leachate from the organic fraction of municipal solid waste. Waste. Manag. 2010, 30, 1828–1833. [Google Scholar] [CrossRef]
  16. Limonti, C.; Curcio, G.M.; Siciliano, A.; Le Pera, A.; Demirer, G.N. Kinetic study of anaerobic digestion of compost leachate from organic fraction of municipal solid waste. Fermentation 2023, 9, 297. [Google Scholar] [CrossRef]
  17. Pirsaheb, M.; Hossaini, H.; Amini, J. Operational parameters influenced on biogas production in zeolite/anaerobic baffled reactor for compost leachate treatment. J. Environ. Health Sci. Eng. 2021, 30, 1743–1751. [Google Scholar] [CrossRef] [PubMed]
  18. He, X.S.; Xi, B.D.; Zhang, Z.Y.; Gao, R.T.; Tan, W.B.; Cui, D.Y.; Yuan, Y. Composition, removal, redox, and metal complexation properties of dissolved organic nitrogen in composting leachates. J. Hazard. Mater. 2015, 283, 227–233. [Google Scholar] [CrossRef] [PubMed]
  19. Sanadi, N.F.A.; Fan, Y.V.; Lee, C.T.; Ibrahim, N.; Li, C.; Gao, Y.; Ong, P.Y.; Klemes, J.J. Nutrient in leachate of biowaste compost and its availability for plants. Chem. Eng. Trans. 2019, 76, 1369–1374. [Google Scholar] [CrossRef]
  20. National Waste Management Plan 2028 (Polish Monitor of 12 June 2023, Official Journal, Item 702), Resolution No. 96 of the Council of Ministers of the 12th of July 2023 Regarding to the National Waste Plan 2028. Available online: https://isap.sejm.gov.pl/isap.nsf/download.xsp/WMP20230000702/O/M20230702.pdf (accessed on 16 January 2025).
  21. EEA. Waste Recycling in Europe. 2021. Available online: https://www.eea.europa.eu/ims/waste-recycling-in-europe (accessed on 16 January 2025).
  22. Moujanni, A.E.; Qarraey, I.; Ouatmane, A. Anaerobic codigestion of urban solid waste fresh leachate and domestic wastewaters: Biogas production potential and kinetic. Environ. Eng. Res. 2019, 24, 38. [Google Scholar] [CrossRef]
  23. Bernat, K.; Zaborowska, M.; Zielińska, M.; Wojnowska-Baryła, I.; Ignalewski, W. Biological treatment of leachate from stabilization of biodegradable municipal solid waste in a sequencing batch biofilm reactor. Int. J. Environ. Sci. Technol. 2021, 18, 1047–1060. [Google Scholar] [CrossRef]
  24. Stegmann, R.; Heyer, K.U.; Cossu, R. Leachate treatment. In Proceedings of the Sardinia 2005, Tenth International Waste Management and Landfill Symposium, S. Margherita di Pula, Cagliari, Italy, 3–7 October 2005. [Google Scholar]
  25. Zayen, A.; Schories, G.; Sayadi, S. Incorporation of an anaerobic digestion step in a multistage treatment system for sanitar landfill leachate. Waste Manag. 2016, 53, 32–39. [Google Scholar] [CrossRef]
  26. Freire, R.C.M.; Aguiar, A.C.M.; Nascimento, M.A.; Cruz, F.S.O.; Mounteer, A.H.; Silva, A.A.; Lopes, R.P. Anaerobically treated leachate from a composting plant: Characterization and evaluation as a biofertilizer. J. Braz. Chem. Soc. 2024, 35, 1–9. [Google Scholar] [CrossRef]
  27. Kontodimos, I.; Ketikidis, C.; Grammelis, P. Valorization of food waste leachates through anaerobic digestion. Eng. Proc. 2023, 31, 25. [Google Scholar] [CrossRef]
  28. de Castro, T.M.; Torres, D.G.B.; Arantes, E.J.; de Carvalho, K.Q.; Passig, F.H.; Christ, D.; Gomes, S.D. Anaerobic co-digestion of industrial landfill leachate and glycerin: Methanogenic potential, organic matter removal and process optimization. Environ. Technol. 2019, 41, 2583–2593. [Google Scholar] [CrossRef]
  29. Thompson, J.C.; He, B.B. Characterization of crude glycerol from biodiesel production from multiple feedstocks. Appl. Eng. Agric. 2016, 22, 261–265. [Google Scholar] [CrossRef]
  30. Attarbachi, T.; Kingsley, M.D.; Spallina, V. New trends on crude glycerol purification: A review. Appl. Eng. Agric. 2016, 22, 261–265. [Google Scholar] [CrossRef]
  31. Vásquez, J.; Nakasaki, K. Effects of shock loading versus stepwise acclimation on microbial consortia during the anaerobic digestion of glycerol. Biomass Bioenergy 2016, 86, 129–135. [Google Scholar] [CrossRef]
  32. López, J.A.S.; Martín Santos, M.d.l.A.; Chica Pérez, A.F.; Martín Martín, A. Anaerobic digestion of glycerol derived from biodiesel manufacturing. Bioresour. Technol. 2009, 100, 5609–5615. [Google Scholar] [CrossRef]
  33. Viana, M.B.; Freitas, A.V.; Leitão, R.C.; Pinto, G.A.S.; Santaella, S.T. Anaerobic digestion of crude glycerol: A review. Environ. Technol. Rev. 2012, 1, 81–92. [Google Scholar] [CrossRef]
  34. de Castro, T.M.; Arantes, E.J.; de Mendonça Costa, M.S.S.; Gotardo, J.T.; Passig, F.H.; Carvalho, K.Q.; Gomes, S.D. Anaerobic co-digestion of industrial waste landfill leachate and glycerin in a continuous anaerobic bioreactor with a fixed-structured bed (ABFSB): Effects of volumetric organic loading rate and alkaline supplementation. Renew. Energy 2021, 164, 1436–1446. [Google Scholar] [CrossRef]
  35. DIN EN 1899-1/EN 1899-2 EPA Method, OxiTop WTW Wissenschaftlich-Technische Werkstätten GmbH, Weilheim, Germany. Available online: https://envcoglobal.com/wp-content/uploads/2014/10/oxitop-spec-sheet-2008.pdf (accessed on 16 January 2025).
  36. Greenberg, A.E.; Clesceri, L.S.; Eaton, A.D. Standard Methods for the Examination of Water and Wastewater, 18th ed.; American Public Health Association (APHA): Washington, DC, USA, 1992. [Google Scholar]
  37. Roy, D.; Benkaraache, S.; Azaïs, A.; Drogui, P.; Rajeshwar, D.T. Leachate treatment: Assessment of the systemic changes in the composition and biodegradability of leachates originating in an open co-composting facility in Canada. J. Environ. Chem. Eng. 2019, 7, 1103056. [Google Scholar] [CrossRef]
  38. Simonič, M. Compost leachate pretreatment by coagulation/flocculation followed by Filter press. J. Chem. Chem. Eng. Croat. 2023, 72, 545–549. [Google Scholar] [CrossRef]
  39. Liu, Q.; Chen, W.; Zhang, X.; Yu, L.; Zhou, J.; Xu, Y.; Qian, G. Phosphate enhancing fermentative hydrogen production from substrate with municipal solid waste composting leachate as a nutrient. Biores. Technol. 2015, 190, 431–437. [Google Scholar] [CrossRef]
  40. Ibrahim, I.C.; Prudent, P.; Théraulaz, F.; Farnet Da Silva, A.M.; Asia, L.; Gori, D.; Vassalo, L.; Durand, A.; Demelas, C.; Höhener, P.; et al. Treatment of sewage sludge compost leachates on a green waste biopile: A case study for an on-site application. Processes 2022, 10, 1196. [Google Scholar] [CrossRef]
  41. Bakhshoodeh, R.; Alavi, N.; Majlesi, M.; Paydary, P. Compost leachate treatment by a pilot-scale subsurface horizontal flow constructed wetland. Ecol. Eng. 2017, 105, 7–14. [Google Scholar] [CrossRef]
  42. Henze, M.; Mladenovski, C. Hydrolysis of particulate substrate by activated sludge under aerobic, anoxic and anaerobic conditions. Water Res. 1994, 25, 61–64. [Google Scholar] [CrossRef]
  43. Menzel, T.; Neubauer, P.; Junne, S. Role of microbial hydrolysis in anaerobic digestion. Energies 2020, 13, 5555. [Google Scholar] [CrossRef]
  44. Park, J.G.; Lee, B.; Jo, S.Y.; Lee, J.S.; Jun, H.B. Control of accumulated volatile fatty acids by recycling nitrified effluent. J. Environ. Health Sci. Eng. 2018, 6, 19–25. [Google Scholar] [CrossRef] [PubMed]
  45. Kumar, D.J.P.; Mishra, R.K.; Chinnam, S.; Binnal, P.; Dwivedi, N. A comprehensive study on anaerobic digestion of organic solid waste: A review on configurations, operating parameters, techno-economic analysis and current trends. Biotechnol. Notes. 2024, 5, 33–49. [Google Scholar] [CrossRef] [PubMed]
  46. Biebl, H.; Menzel, K.; Zeng, A.P.; Deckwer, W.D. Microbial production of 1,3-propanediol. Appl. Microbiol. Biotechnol. 1999, 52, 289–297. [Google Scholar] [CrossRef]
  47. Thierry, A.; Maillard, M.B.; Yvon, M. Conversion of L-leucine to isovaleric acid by Propionibacterium freudenreichii TL 34 and ITGP23. Appl. Environ. Microbiol. 2002, 68, 608–615. [Google Scholar] [CrossRef] [PubMed]
  48. Pogozheva, I.D.; Armstrong, G.A.; Kong, L.; Hartnagel, T.J.; Carpino, C.A.; Gee, S.E.; Picarello, D.M.; Rubin, A.S.; Lee, J.; Park, S.; et al. Comparative molecular dynamics simulation studies of realistic eukaryotic, prokaryotic, and archaeal membranes. J. Chem. Inf. Model. 2022, 62, 1036–1051. [Google Scholar] [CrossRef]
  49. Wang, Q.; Kuninobu, M.; Ogawa, H.I.; Kato, Y. Degradation of volatile fatty acids in highly efficient anaerobic digestion. Biomass Bioenergy 1999, 16, 6407–6416. [Google Scholar] [CrossRef]
  50. Chakraborty, D.; Karthikeyan, O.P.; Selvam, A.; Wong, J.W. Co-digestion of food waste and chemically enhanced primary treated sludge in a continuous stirred tank reactor. Biomass Bioenergy 2018, 111, 232–240. [Google Scholar] [CrossRef]
  51. Cavalcante, W.A.; Leitão, R.C.; Gehring, T.A.; Angenent, L.T.; Santaella, S.T. Anaerobic fermentation for n-caproic acid production: A review. Process Biochem. 2017, 54, 106–119. [Google Scholar] [CrossRef]
  52. Lee, D.H.; Behera, S.K.; Kim, J.W.; Park, H.S. Methane production potential of leachate generated from Korean food waste recycling facilities: A lab-scale study. Waste Manag. 2009, 29, 876–882. [Google Scholar] [CrossRef]
  53. Liao, X.; Zhu, S.; Zhong, D.; Zhu, J.; Liao, L. Anaerobic co-digestion of food waste and landfill leachate in single-phase batch reactors. Waste Manag. 2014, 34, 2278–2284. [Google Scholar] [CrossRef] [PubMed]
  54. Takeda, P.Y.; Gotardo, J.T.; Gomes, S.D. Anaerobic co-digestion of leachate and glycerol for renewable energy generation. Environ. Technol. 2020, 43, 1118–1128. [Google Scholar] [CrossRef] [PubMed]
  55. Astals, S.; Ariso, M.; Galí, A.; Mata-Alvarez, J. Co-digestion of pig manure and glycerine: Experimental and modelling study. J. Environ. Manag. 2011, 92, 1091–1096. [Google Scholar] [CrossRef]
  56. Simm, S.; Orrico, A.C.A.; Junior, M.A.P.O.; Sunada, N.S.; Schwingel, A.W.; Costa, M.S.S.M. Crude glycerin in anaerobic co-digestion of dairy cattle manure increases methane production. Sci. Agric. 2016, 74, 175–179. [Google Scholar] [CrossRef]
  57. Pazuch, F.A.; Siqueira, J.; Friedrich, L.; Lenz, A.M.; Nogueira, C.E.C.; Souza, S.N.M. Co-digestion of crude glycerin associated with cattle manure in biogas production in the State of Paraná, Brazil. Acta Sci. Technol. 2017, 39, 149–159. [Google Scholar] [CrossRef]
  58. Amon, T.H.; Amon, B.; Kryvoruchko, V.; Bodiroza, V.; Pötsch, E.; Zollitsch, W. Optimising methane yield from anaerobic digestion of manure: Effects of dairy systems and of glycerine supplementation. Int. Congr. Ser. 2006, 1293, 217–220. [Google Scholar] [CrossRef]
  59. Robra, S.; da Cruz, R.S.; De Oliveira, A.M.; Neto, J.A.; Santos, J.V. Generation of biogas using crude glycerin from biodiesel production as a supplement to cattle slurry. Biomass Bioenergy 2010, 34, 1330–1335. [Google Scholar] [CrossRef]
  60. Chou, Y.C.; Su, J.J. Biogas production by anaerobic co-digestion of dairy wastewater with the crude glycerol from slaughterhouse sludge cake transesterification. Animals 2019, 9, 618. [Google Scholar] [CrossRef]
Figure 1. The AMPTS II: water bath, CO2 absorption trap, and gas flow-measuring device.
Energies 18 00537 g001
Figure 2. Biochemical oxygen demand (BOD7) for oxidation of organics in LCB (a), G (e), and their mixtures (bd); the equations for the first-order kinetic models used to describe the BOD for oxidation of the organics in the substrates and their mixtures are given, and a summary of kinetic parameters are presented (f).
Energies 18 00537 g002
Figure 3. Changes in VFA/TA ratio and in the concentrations of COD and total VFA in the supernatant from LCB (a), LCB+3%G (b), LCB+4%G (c), and LCB+5%G (d) during measurements of MP; the equations for the zero-order kinetic models used to describe a decrease in the concentrations of COD and VFA, and a summary of the kinetic parameters of the decrease in the concentrations of COD and VFA are given (e). The dark grey area indicates the 1st phase of COD removal; the light grey area indicates the 2nd phase of COD removal; red arrow means the day to reach a maximal MP.
Energies 18 00537 g003
Figure 4. Changes in the individual VFA concentrations in the supernatant from LCB (a), LCB+3%G (b), LCB+4%G (c), and LCB+5%G (d), and the comparison of VFA concentrations depending on the feedstock composition in time (e) during measurements of MP.
Energies 18 00537 g004
Figure 5. Changes in pH and TA, and increasing trends in N-NH4 concentration (dotted line described equation of y = ax + b) in the supernatant from LCB (a,b), LCB+3%G (c,d), LCB+4%G (e,f), and LCB+5%G (g,h) during measurements of MP. Dotted blue arrow means the day to reach a maximal MP.
Energies 18 00537 g005
Figure 6. Methane production (MP) and the changes in total VFA concentration in the supernatant of LCB (a), LCB+3%G (b), LCB+4%G (c), and LCB+5%G (d); the equations for the first-order kinetic models used to describe MP (two phases: 1st (the grey area), 2nd) are given; dotted blue arrow means the day to reach a maximal MP; a summary of kinetic parameters of the MP are given (e).
Energies 18 00537 g006
Table 1. Characteristics of G and the supernatant of the inoculum that were used for MP.
CharacteristicUnitGlycerineInoculum
DM%1.42
OM%DM66.5
pH6.867.03
TAmval/L4.8052.50
CODmg/L100,000.001076.00
BOD7mg/L70,730.00
VFAmg/L1008.00591.00
TKNmg/L160.00
N-NH4mg/L14.00466.20
COD/TKN~625.00
Density in 20 °Ckg/L1.26
Glycerol content%94.10
Table 2. Characteristics of LCB and the mixtures of LCB and G; and doses of LCB and G in the mixtures.
CharacteristicUnitLCBLCB+3%GLCB+4%GLCB+5%G
pH5.646.876.896.90
TAmval/L76.8565.2060.2049.60
CODmg/L41,260.0058,882.0064,756.0070,630.00
BOD7mg/L29,866.0042,125.246,211.6550,297.98
BOD7/COD0.720.720.710.71
VFAmg/L17,464.2912,528.0310,941.978733.20
TKNmg/L1438.001066.60942.80819.37
COD/TKN28.7055.2068.7086.20
Doses of L/GmL54.5326.75/11.4620.85/13.9015.93/15.93
Inoculum/substrate ratio5.507.858.639.42
Disclaimer/Publisher’s Note: The statements, opinions and data contained in all publications are solely those of the individual author(s) and contributor(s) and not of MDPI and/or the editor(s). MDPI and/or the editor(s) disclaim responsibility for any injury to people or property resulting from any ideas, methods, instructions or products referred to in the content.

