


European LNG Import Network Analysis and Investigation of Supply Security
Abstract
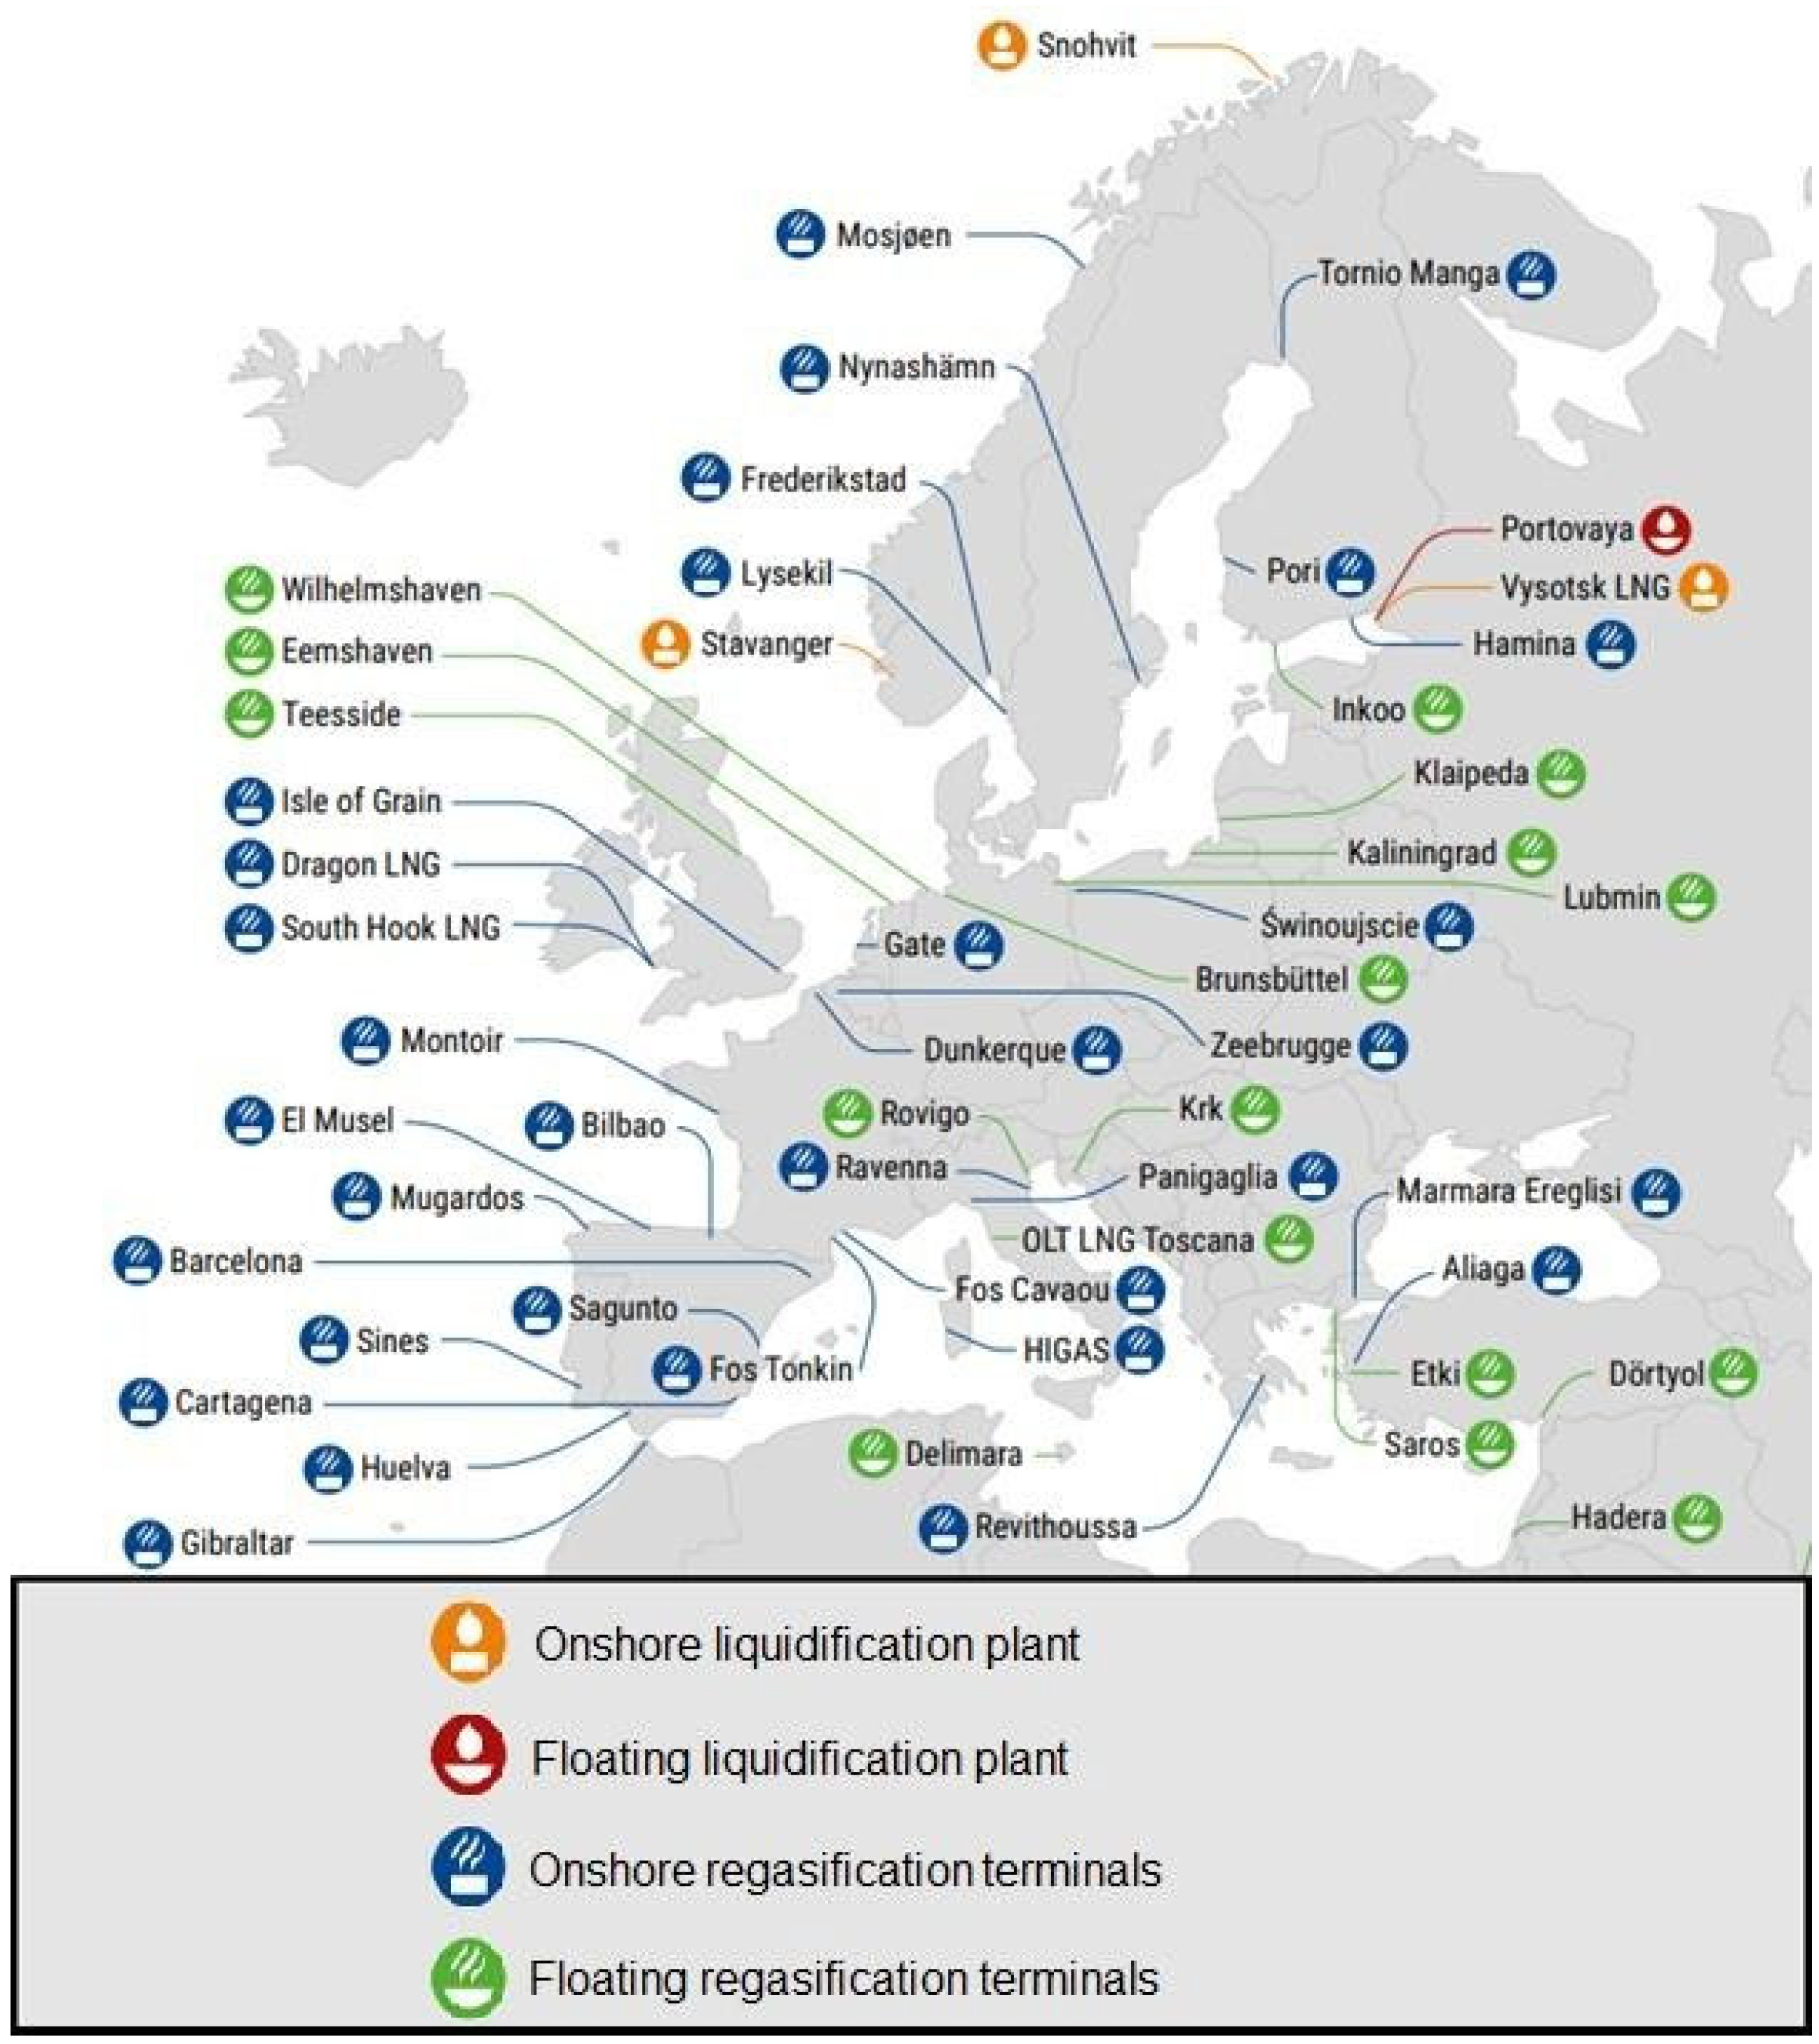
:1. Introduction
- What is the current landscape of the European LNG import market?
- Which are the main trading communities involved?
- Is the European LNG supply network able to cope with disruptions to the supply chain that could endanger the prosperity of European nations?
2. Literature Review
2.1. Freight Flow Network Analysis
- Optimization of the trade structure, with one study [30] attempting to optimize the oil trading network;
- Investigation of competitive relationships, as in the case of [31], in which the competitive relationships of international crude oil importers were examined. Additionally, [32] studied iron ore trade, [33] examined the graphite trade, [34] studied the coal trade, and [35,36] explored the tungsten trade and lithium trade, respectively. Finally, the rare earth trade was examined in terms of importers’ competition by [37] and in terms of exporters’ competition by [38].
2.2. Applied Methods of Investigating Security of Supply
3. Materials and Methods
3.1. Network Modelling
3.2. Topological Indicators
- Network size
- Network density
- Unweighted and weighted degree of connectivity
- Network connectivity
- Degree of network centrality
- Average shortest path length
- Clustering coefficient
- Network resilience
3.3. Community Detection Algorithm
3.4. Simulation of Network Failures
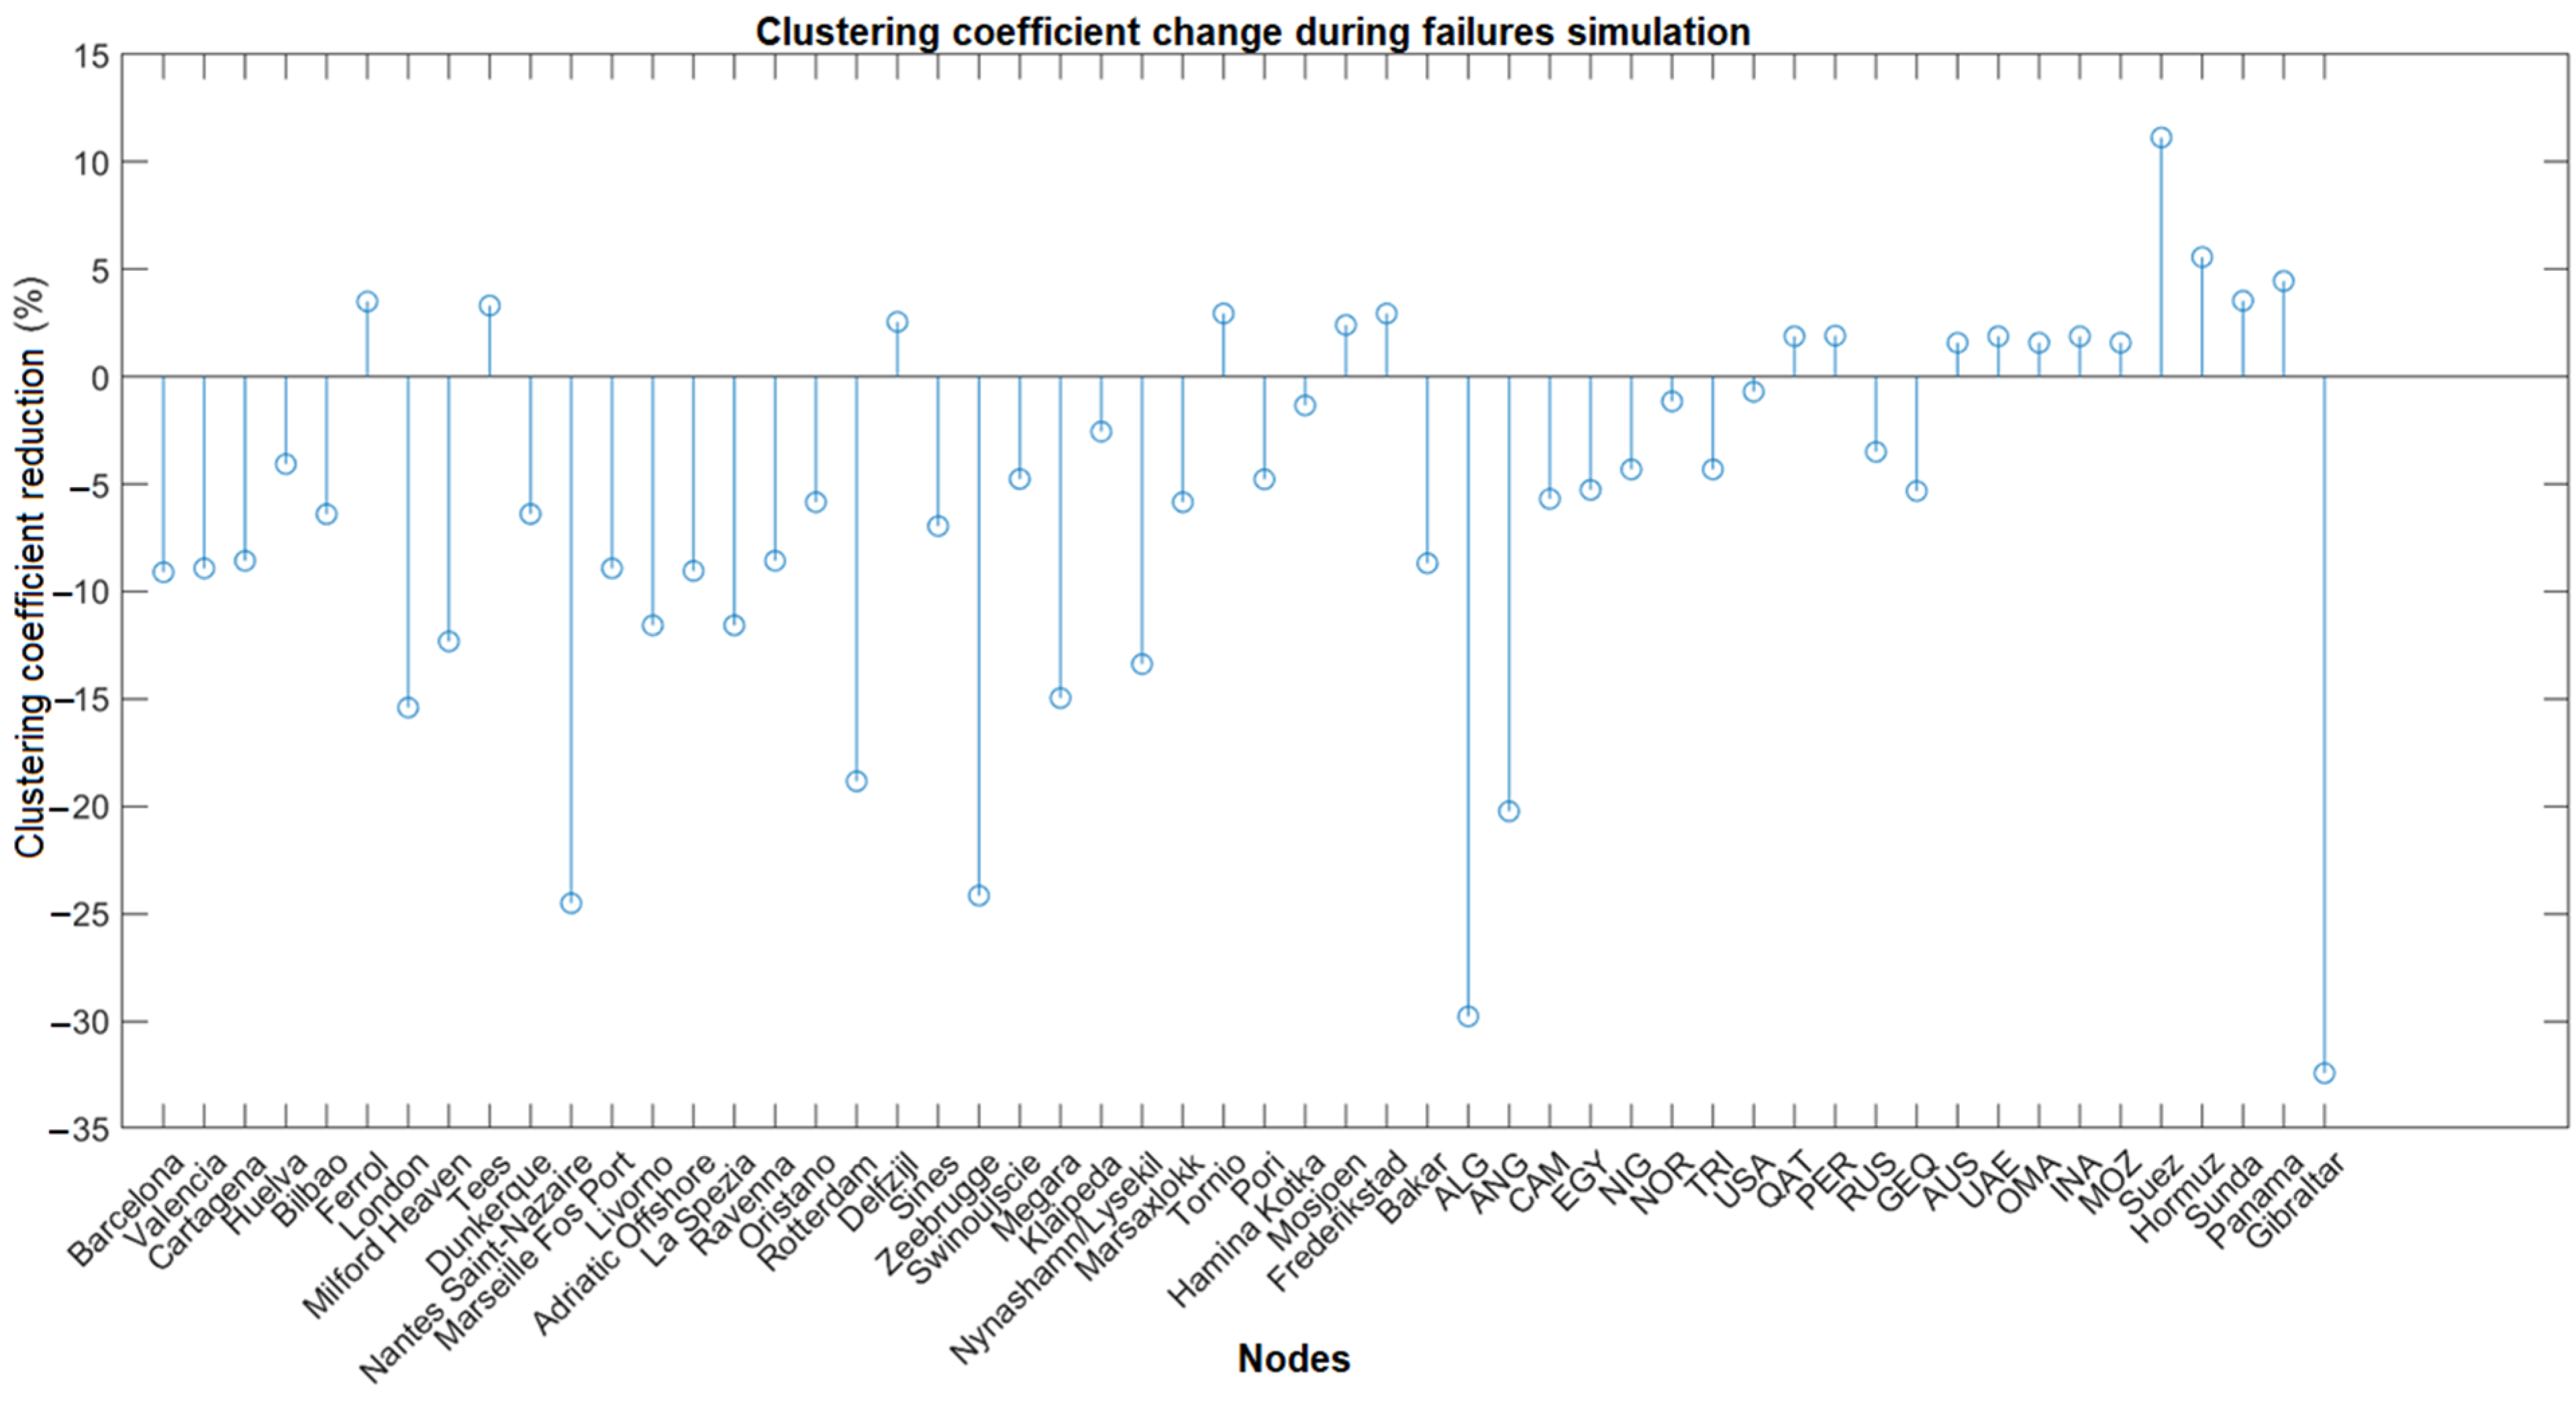
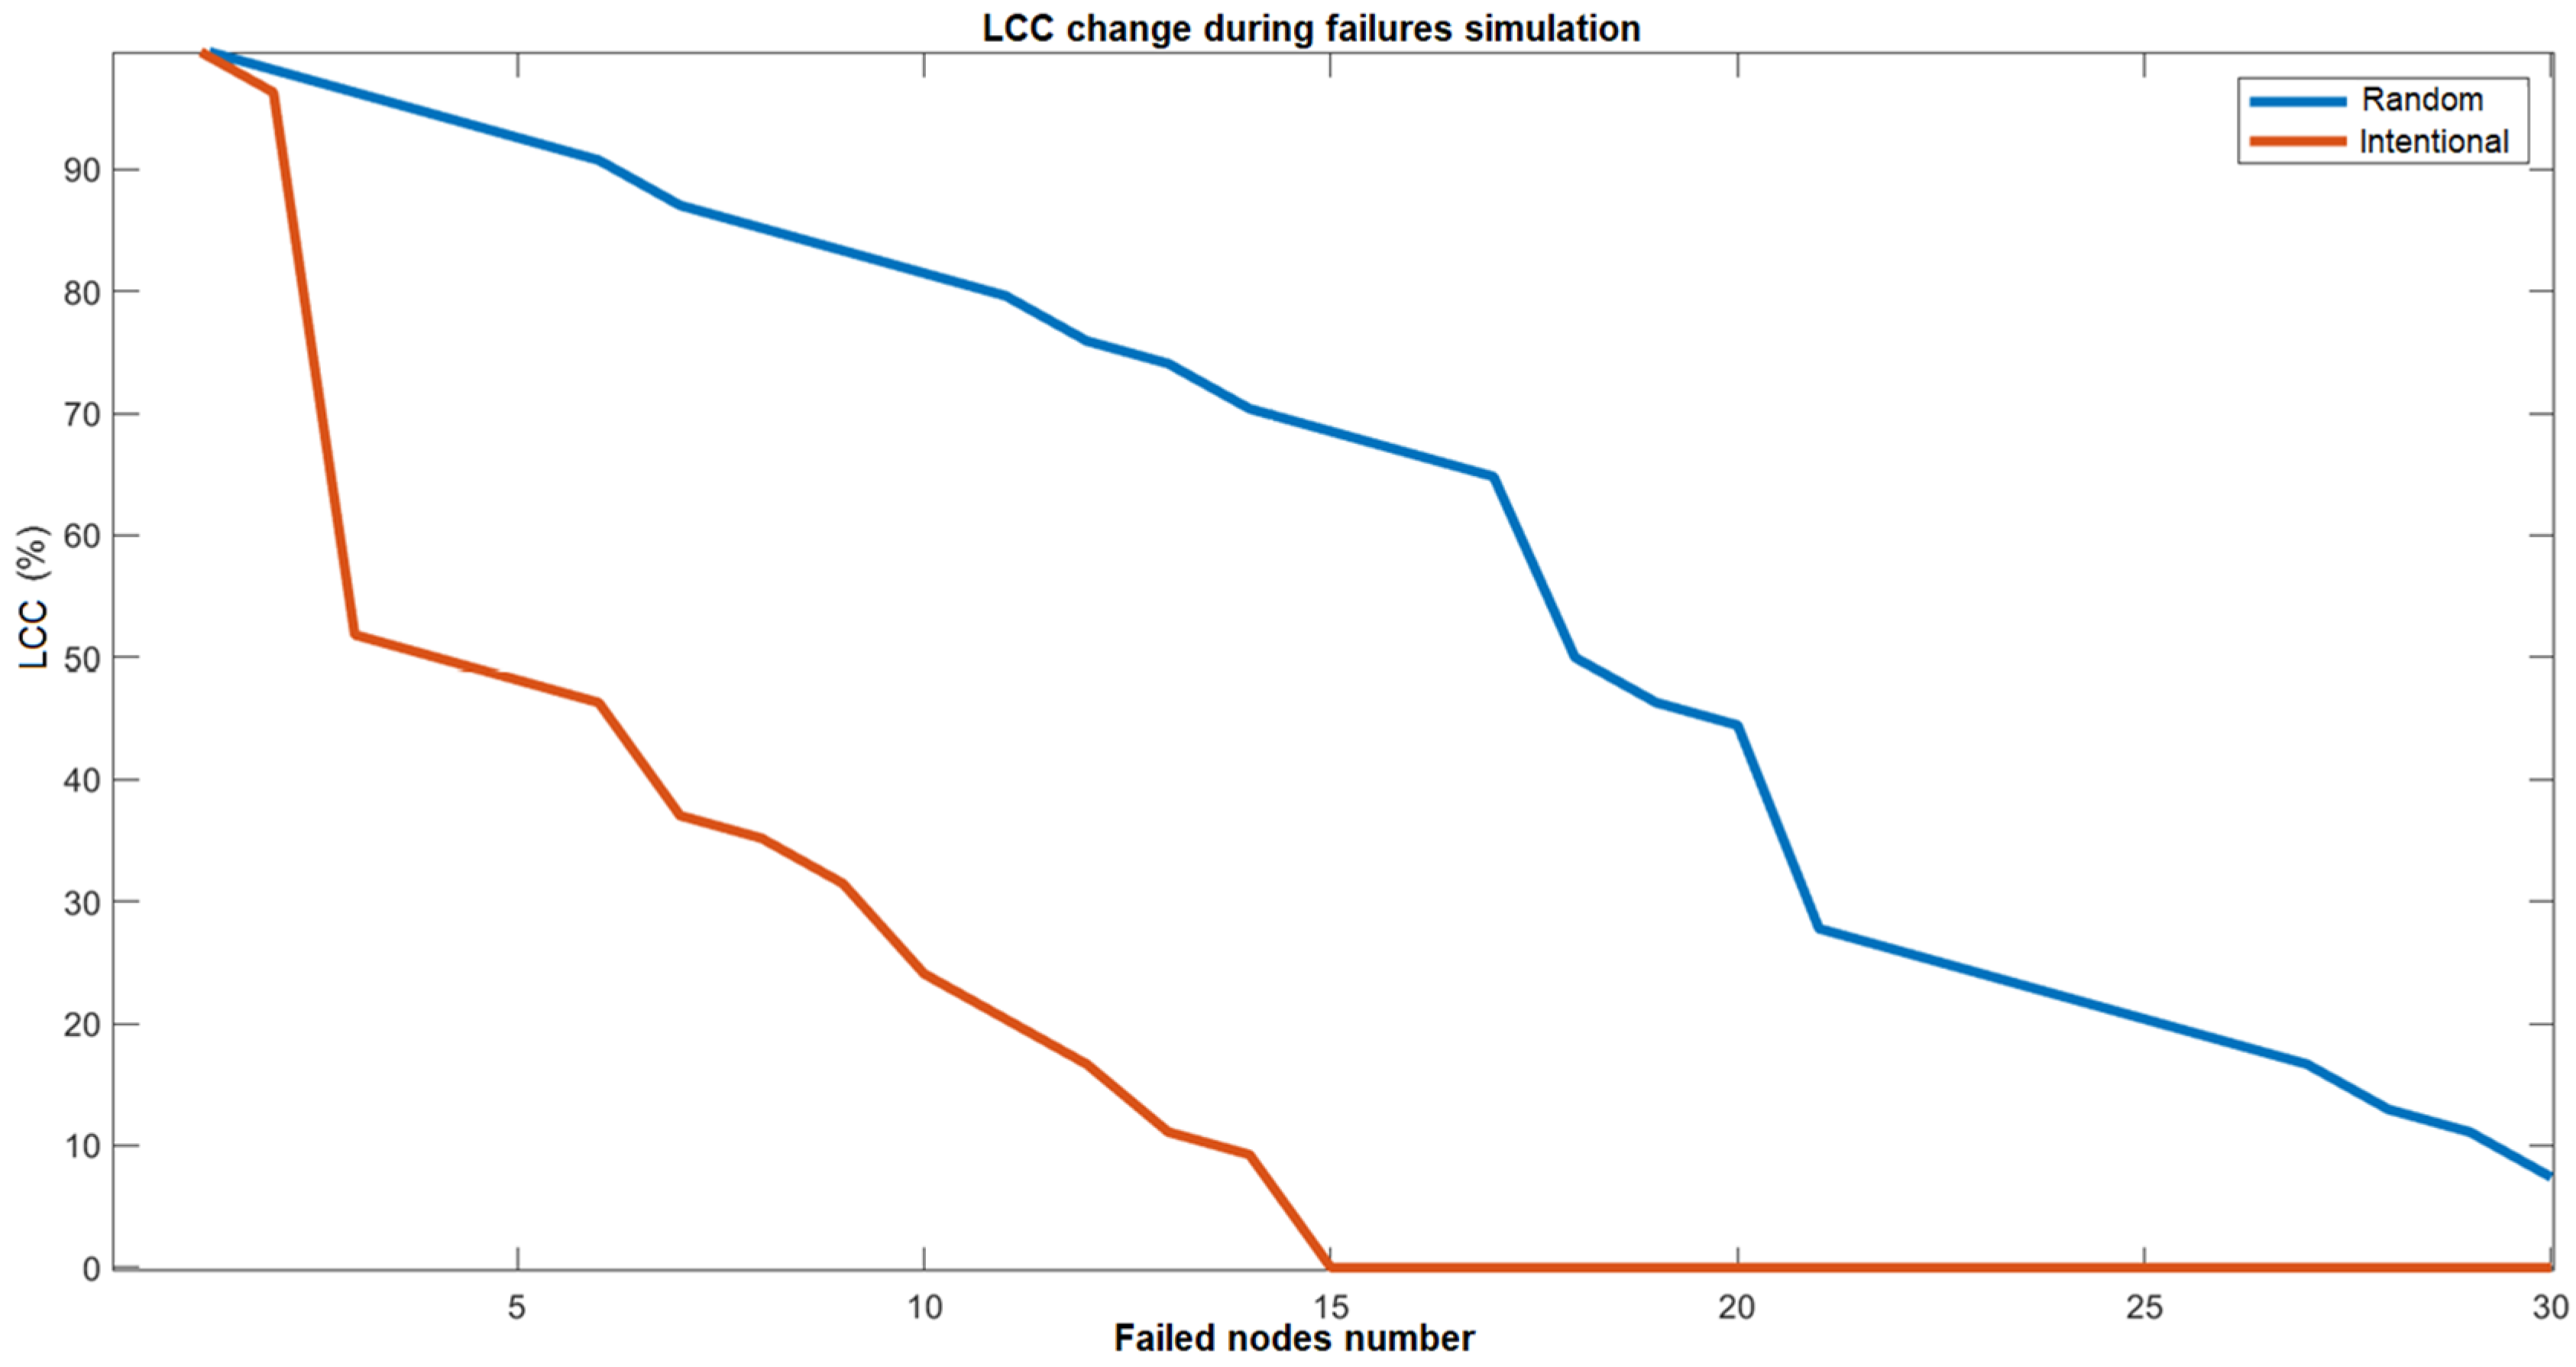
- Cumulative failures, which simulate consecutive sequential failures due to systemic factors within a limited timeframe that is insufficient for repair and recovery of the damages. They are further divided into random failures and intentional failures depending on the sequence of the node failure. In the case of random failures, nodes are randomly selected to fail, representing the scenario where certain nodes fail due to random factors such as natural disasters, technical issues, or sociopolitical factors affecting their operation. In intentional failures, nodes are removed in the order of their importance based on their weighted connectivity [4], simulating potential failures caused by targeted military operations, terrorist attacks, or acts of sabotage. During these simulated failures, the following three indexes are monitored in relation to the initial number of nodes in the network [46]: the network resilience index; the network clustering coefficient, and the percentage of nodes remaining in the largest connected component (LCC);
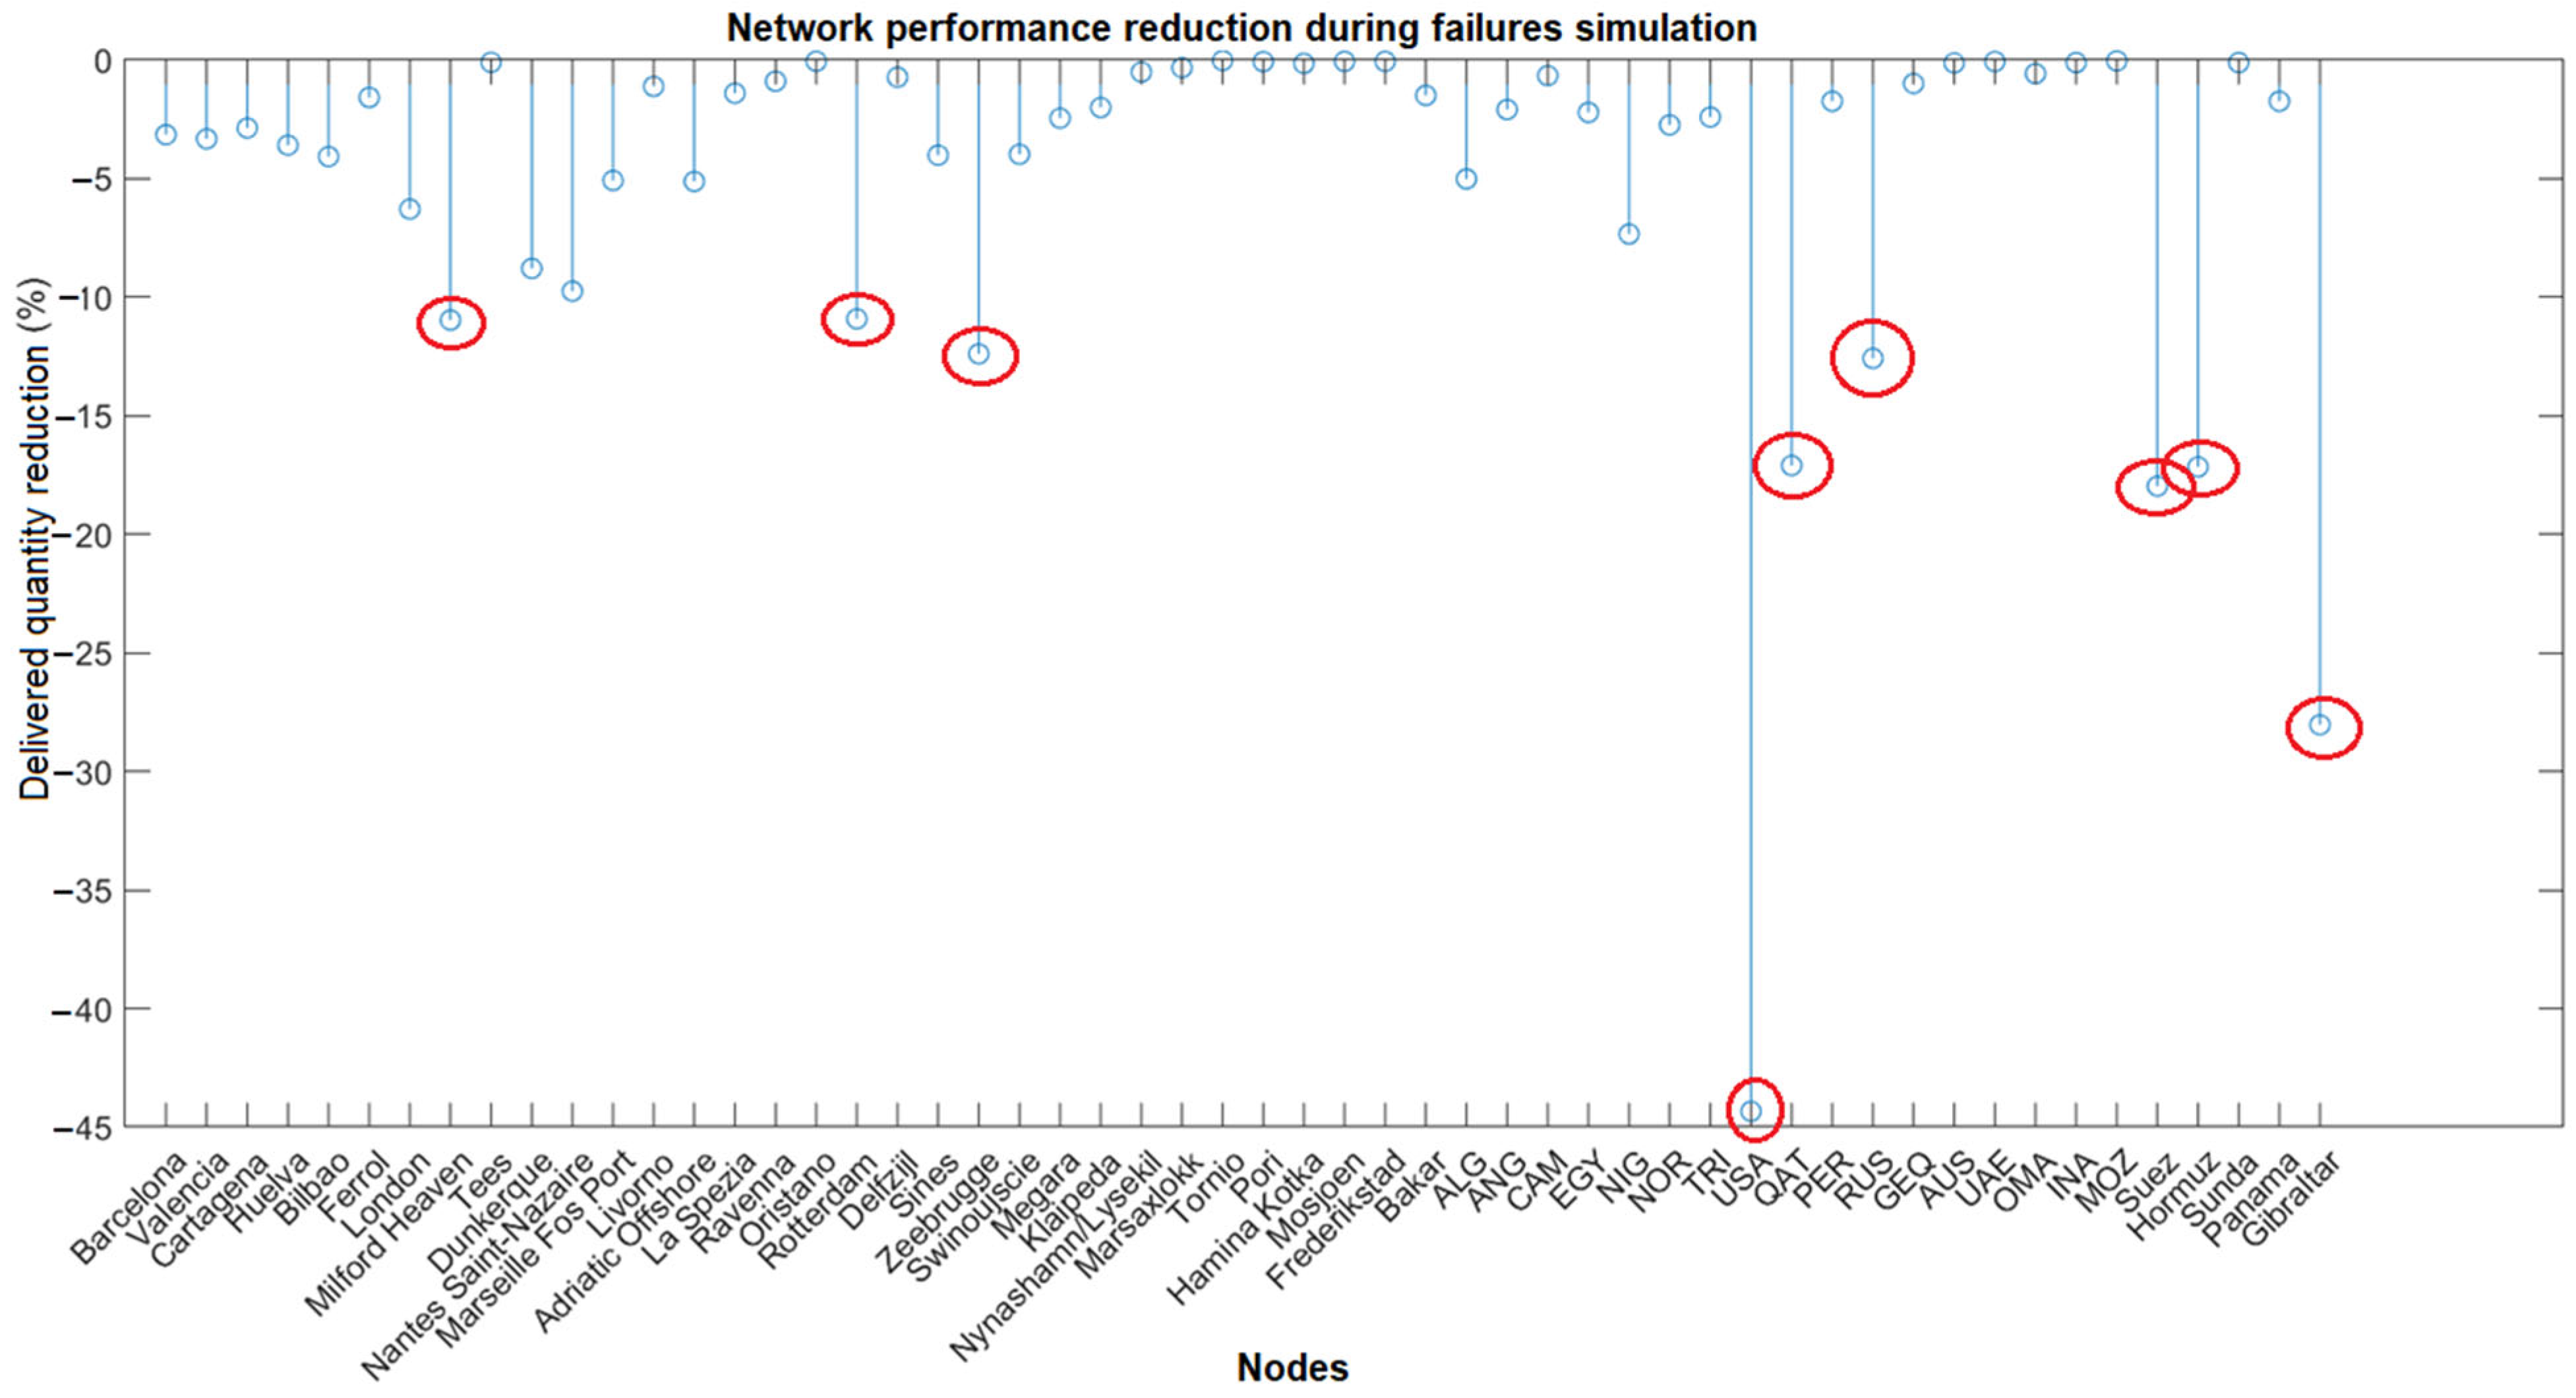
- Individual failures, where nodes fail independently [46,48]. The same indexes used in the previous case are calculated, along with an additional measure of network efficiency. In this study, network performance is defined as the percentage of total imported LNG that can still be delivered despite the failure of an individual node.
3.5. Data
- Trade volumes of LNG flows between countries;
- Volumes of LNG transported from European ports hosting LNG import terminals to all potential trading partners;
- Import volumes for each terminal based on regasification and sent-out volumes.
- The quarterly cargo volumes of the ports, extracted from the Eurostat database were are aggregated to convert the data to an annual level;
- The daily inflow values were extracted from the GIE ALSI database and summed up to convert them into annual quantities. The annual inflow volumes of terminals within the same port were then combined to convert the volumes to a port-level basis. The resulting data show minimal deviations compared to the transnationally traded volumes reported in the GIIGNL reports;
- Using the port data extracted from Eurostat, specifically the import flows of each port (inward flows), combined with the LNG transnational trade data from GIIGNL reports, direct commercial flows between exporters and importers were derived;
- The remaining flows were supplemented by following trade flows from exporting countries to other trading countries where transshipments were presumed to occur until they reach the importing country, according to GIIGNL reports.
4. Results
4.1. Evolution of Spatial Network Structure
4.2. Trade Communities
4.3. Security of Supply
5. Conclusions
- The European LNG import network in the years 2018–2022 experienced a significant shift in its center of gravity from the Mediterranean to the Atlantic coast. This shift occurred as the large increase in LNG demand in Europe was mainly met by the USA, possibly as a result of Europe’s efforts to decouple from Russian gas;
- The substantial increase in the number of LNG importers in Europe and the imported volumes did not see a corresponding increase in exporters. Europe’s growing dependence on a limited number of countries is creating strong monopolistic characteristics in the LNG export market, threatening European energy security;
- The number of non-member communities seems to be decreasing and the boundaries between communities are becoming less clear. This suggests the consolidation of Europe’s LNG import network as a possible result of the single energy strategy;
- Targeted attacks will have a much more significant and immediate impact on Europe’s supply network, causing its complete collapse much earlier than random failures. Critical points include ports with high transshipment traffic, ports serving as the exclusive route for certain exporters to Europe, the Strait of Gibraltar, and the hub representing the USA.
Author Contributions
Funding
Data Availability Statement
Conflicts of Interest
References
- Kumar, S.; Kwon, H.T.; Choi, K.H.; Hyun Cho, J.; Lim, W.; Moon, I. Current status and future projections of LNG demand and supplies: A global prospective. Energy Policy 2011, 39, 4097–4104. [Google Scholar] [CrossRef]
- Li, J.; Dong, X.; Jiang, Q.; Dong, K.; Liu, G. Natural gas trade network of countries and regions along the belt and road: Where to go in the future? Resour. Policy 2021, 71, 101981. [Google Scholar] [CrossRef]
- Hafezi, R.; Akhavan, A.N.; Pakseresht, S.; Wood, D.A. Global natural gas demand to 2025: A learning scenario development model. Energy 2021, 224, 120167. [Google Scholar] [CrossRef]
- Xiao, R.; Xiao, T.; Zhao, P.; Zhang, M.; Ma, T.; Qiu, S. Structure and resilience changes of global liquefied natural gas shipping network during the Russia-Ukraine conflict. Ocean Coast. Manag. 2024, 252, 107102. [Google Scholar] [CrossRef]
- Zhang, H.Y.; Xi, W.W.; Ji, Q.; Zhang, Q. Exploring the driving factors of global LNG trade flows using gravity modelling. J. Clean. Prod. 2018, 172, 508–515. [Google Scholar] [CrossRef]
- EIA. Global Trade in Liquefied Natural Gas Continued to Grow in 2023. 2024. Available online: https://www.eia.gov/todayinenergy/detail.php?id=62464 (accessed on 20 November 2024).
- Chen, Z.; An, H.; Gao, X.; Li, H.; Hao, X. Competition pattern of the global liquefied natural gas (LNG) trade by network analysis. J. Nat. Gas Sci. Eng. 2016, 33, 769–776. [Google Scholar] [CrossRef]
- Hou, Z.; Niu, X.; Yu, Z.; Chen, W. Spatiotemporal Evolution and Market Dynamics of the International Liquefied Natural Gas Trade: A Multilevel Network Analysis. Energies 2024, 17, 228. [Google Scholar] [CrossRef]
- Dudley, B. BP Statistical Review of World Energy, 69th ed.; Statistical Review of World Energy: London, UK, 2020. [Google Scholar]
- Mei, Q.; Qinyou, H.; Hu, Y.; Yang, Y.; Liu, X.; Huang, Z.; Wang, P. Structural analysis and vulnerability assessment of the European LNG maritime supply chain network (2018–2020). Ocean Coast. Manag. 2024, 253, 107126. [Google Scholar] [CrossRef]
- Peng, P.; Lu, F.; Cheng, S.F.; Yang, Y. Mapping the global liquefied natural gas trade network: A perspective of maritime transportation. J. Clean. Prod. 2021, 283, 124640. [Google Scholar] [CrossRef]
- Geng, J.-B.; Ji, Q.; Fan, Y. A dynamic analysis on global natural gas trade network. Appl. Energy 2014, 132, 23–33. [Google Scholar] [CrossRef]
- Filimonova, I.V.; Komarova, A.V.; Sharma, R.; Novikov, A.Y. Transformation of international liquefied natural gas markets: New trade routes. Energy Rep. 2022, 8 (Suppl. 9), 675–682. [Google Scholar] [CrossRef]
- Feng, S.; Li, H.; Qi, Y.; Guan, Q.; Wen, S. Who will build new trade relations? Finding potential relations in international liquefied natural gas trade. Energy 2017, 141, 1226–1238. [Google Scholar] [CrossRef]
- Zhu, K.; Hao, L.; Zhao, Y. Research on the evolution and influence mechanism of international liquefied natural gas import competition pattern. J. Clean. Prod. 2023, 414, 137602. [Google Scholar] [CrossRef]
- Ding, Y.; Zhang, M.; Chen, S.; Nie, R. Assessing the resilience of China’s natural gas importation under network disruptions. Energy 2020, 211, 118459. [Google Scholar] [CrossRef]
- Sun, X.; Wei, Y.; Jin, Y.; Song, W.; Li, X. The evolution of structural resilience of global oil and gas resources trade network. Glob. Netw. 2023, 23, 391–411. [Google Scholar] [CrossRef]
- Yang, Y.; Poon, J.P.H.; Liu, Y.; Bagchi-Sen, S. Small and flat worlds: A complex network analysis of international trade in crude oil. Energy 2015, 93 Pt 1, 534–543. [Google Scholar] [CrossRef]
- Du, R.; Dong, G.; Tian, L.; Wang, Y.; Liu, Y.; Wang, M.; Fang, G. A complex network perspective on features and evolution of world crude oil trade. Energy Procedia 2016, 104, 221–226. [Google Scholar] [CrossRef]
- Niu, X.; Chen, W.; Wang, N. Spatiotemporal Dynamics, and Topological Evolution of the Global Crude Oil Trade Network. Energies 2023, 16, 1728. [Google Scholar] [CrossRef]
- Peng, P.; Yang, Y.; Cheng, S.; Lu, F.; Yuan, Z. Hub-and-spoke structure: Characterizing the global crude oil transport network with mass vessel trajectories. Energy 2019, 168, 966–974. [Google Scholar] [CrossRef]
- Wang, W.; Li, Z.; Cheng, X. Evolution of the global coal trade network: A complex network analysis. Resour. Policy 2019, 62, 496–506. [Google Scholar] [CrossRef]
- Gao, C.; Sun, M.; Shen, B. Features and evolution of international fossil energy trade relationships: A weighted multilayer network analysis. Appl. Energy 2015, 156, 542–554. [Google Scholar] [CrossRef]
- Zhong, W.; An, H.; Fang, W.; Gao, X.; Dong, D. Features, and evolution of international fossil fuel trade network based on value of energy. Appl. Energy 2016, 165, 868–877. [Google Scholar] [CrossRef]
- Blondel, V.D.; Guillaume, J.-L.; Lambiotte, R.; Lefebvre, E. Fast unfolding of communities in large networks. J. Stat. Mech. Theory Exp. 2008, 2008, P10008. [Google Scholar] [CrossRef]
- Ji, Q.; Zhang, H.-Y.; Fan, Y. Identification of global oil trade patterns: Empirical research based on complex network theory. Energy Convers. Manag. 2014, 85, 856–865. [Google Scholar] [CrossRef]
- Zhong, W.; An, H.; Shen, L.; Dai, T.; Fang, W.; Gao, X.; Dong, D. Global pattern of the international fossil fuel trade: The evolution of communities. Energy 2017, 123, 260–270. [Google Scholar] [CrossRef]
- Wang, W.; Fan, L.W.; Zhou, P. Evolution of global fossil fuel trade dependencies. Energy 2022, 238 Pt C, 121924. [Google Scholar] [CrossRef]
- An, Q.; Wang, L.; Qu, D.; Zhang, H. Dependency network of international oil trade before and after oil price drop. Energy 2018, 165, 1021–1033. [Google Scholar] [CrossRef]
- Dong, G.; Qing, T.; Du, R.; Wang, C.; Li, R.; Wang, M.; Tian, L.; Chen, L.; Vilela, A.L.M.; Stanley, H.E. Complex network approach for the structural optimization of global crude oil trade system. J. Clean. Prod. 2020, 251, 119366. [Google Scholar] [CrossRef]
- Zhang, H.-Y.; Ji, Q.; Fan, Y. Competition, transmission, and pattern evolution: A network analysis of global oil trade. Energy Policy 2014, 73, 312–322. [Google Scholar] [CrossRef]
- Hao, X.; An, H.; Sun, X.; Zhong, W. The import competition relationship and intensity in the international iron ore trade: From network perspective. Resour. Policy 2018, 57, 45–54. [Google Scholar] [CrossRef]
- Wang, X.; Li, H.; Yao, H.; Chen, Z.; Guan, Q. Network features and influencing factors of global nature graphite trade competition. Resour. Policy 2019, 60, 153–161. [Google Scholar] [CrossRef]
- Wang, W.; Fan, L.; Li, Z.; Zhou, P.; Chen, X. Measuring dynamic competitive relationship and intensity among the global coal importing trade. Appl. Energy 2021, 303, 117611. [Google Scholar] [CrossRef]
- Huang, J.; Ding, Q.; Wang, Y.; Hong, H.; Zhang, H. The evolution and influencing factors of international tungsten competition from the industrial chain perspective. Resour. Policy 2021, 73, 102185. [Google Scholar] [CrossRef]
- Shao, L.; Hu, J.; Zhang, H. Evolution of global lithium competition network pattern and its influence factors. Resour. Policy 2021, 74, 102353. [Google Scholar] [CrossRef]
- Xu, J.; Li, J.; Charles, V.; Zhao, X. Evolution of the rare earth trade network: A perspective of dependency and competition. Geosci. Front. 2024, 15, 101653. [Google Scholar] [CrossRef]
- Zhang, H.; Wang, X.; Tang, J.; Guo, Y. The impact of international rare earth trade competition on global value chain upgrading from the industrial chain perspective. Ecol. Econ. 2022, 198, 107472. [Google Scholar] [CrossRef]
- Chen, S.; Xiao, Y.; Dai, Y.; Mi, J.J. The Evolution of the Global Liquefied Natural Gas (LNG) Seaborne Trade Network: A Complex Network Analysis. Procedia Comput. Sci. 2024, 242, 396–403. [Google Scholar] [CrossRef]
- Shaikh, F.; Ji, Q.; Fan, Y. Assessing the stability of the LNG supply in the Asia Pacific region. J. Nat. Gas Sci. Eng. 2016, 34, 376–386. [Google Scholar] [CrossRef]
- Bi, W.; MacAskill, K.; Schooling, J. Old wine in new bottles? Understanding infrastructure resilience: Foundations, assessment, and limitations. Transp. Res. Part D Transp. Environ. 2023, 120, 103793. [Google Scholar] [CrossRef]
- Meza, A.; Ari, I.; Sada, M.A.; Koç, M. Disruption of maritime trade chokepoints and the global LNG trade: An agent-based modeling approach. Marit. Transp. Res. 2022, 3, 100071. [Google Scholar] [CrossRef]
- Faturechi, R.; Miller-Hooks, E. Travel time resilience of roadway networks under disaster. Transp. Res. Part B Methodol. 2014, 70, 47–64. [Google Scholar] [CrossRef]
- Bhavathrathan, B.K.; Patil, G.R. Capacity uncertainty on urban road networks: A critical state and its applicability in resilience quantification. Comput. Environ. Urban Syst. 2015, 54, 108–118. [Google Scholar] [CrossRef]
- Li, Z.; Li, H.; Zhang, Q.; Qi, X. Data-driven research on the impact of COVID-19 on the global container shipping network. Ocean Coast. Manag. 2024, 248, 106969. [Google Scholar] [CrossRef]
- Liu, Q.; Yang, Y.; Ng, A.K.Y.; Jiang, C. An analysis on the resilience of the European port network. Transp. Res. Part A Policy Pract. 2023, 175, 103778. [Google Scholar] [CrossRef]
- Dong, K.; Li, J.; Zhang, H. LNG point supply of villages and towns in China: Challenges and countermeasures. Appl. Energy 2023, 334, 120741. [Google Scholar] [CrossRef]
- Wan, Z.; Su, Y.; Li, Z.; Zhang, X.; Zhang, Q.; Chen, J. Analysis of the impact of Suez Canal blockage on the global shipping network. Ocean Coast. Manag. 2023, 245, 106868. [Google Scholar] [CrossRef]
- Mou, N.; Sun, S.; Yang, T.; Yang, T.; Wang, Z.; Zheng, Y.; Chen, J.; Zhang, L. Assessment of the Resilience of a Complex Network for Crude Oil Transportation on the Maritime Silk Road. IEEE Access 2020, 8, 181311–181325. [Google Scholar] [CrossRef]
- Rodrigue, J.P. Straits, passages and chokepoints: A maritime geostrategy of petroleum distribution. Cah. Géogr. Qué. 2004, 48, 357–374. [Google Scholar] [CrossRef]
- Miah, M.M.A.; Ahmed, S.S.U.; Sultana, K.S. Control over Maritime Chokepoints an Assurance of Secure Lifeline. Bangladesh Marit. J. 2017, 3, 111–120. [Google Scholar]
- Girvan, M.; Newman, M.E. Community structure in social and biological networks. Proc. Natl. Acad. Sci. USA 2002, 99, 7821–7826. [Google Scholar] [CrossRef]
- Anand, S.; Rahul; Mallik, A.; Kumar, S. Integrating node centralities, similarity measures, and machine learning classifiers for link prediction. Multimed. Tools Appl. 2022, 81, 38593–38621. [Google Scholar] [CrossRef]
- Yang, S.-F.; Choi, S.-W.; Lee, E.-B. A Prediction Model for Spot LNG Prices Based on Machine Learning Algorithms to Reduce Fluctuation Risks in Purchasing Prices. Energies 2023, 16, 4271. [Google Scholar] [CrossRef]


| Study | Approach | Data Source | Reference Period |
|---|---|---|---|
| [11] | Global LNG and PNG trade network spatial structure and communities | AIS DATA (HiFleet) | 2013–2017 |
| [8] | Global LNG and PNG trade network spatial structure | UN Comtrade Database | 2000–2021 |
| [12] | Global LNG and PNG trade network spatial structure and integration | BP Statistical Review | 2000–2011 |
| [2] | BRI LNG trade network spatial structure and future projection | UN Comtrade Database | 1992–2016 |
| [13] | Global LNG trade network spatial structure and future projection | UN Comtrade Database | 2019 |
| [7] | Global LNG exporters competition network analysis | UN Comtrade Database | 2005–2014 |
| [14] | Global LNG trade network spatial structure and future projection | UN Comtrade Database | 2015 |
| [15] | Global LNG exporters competition network analysis | UN Comtrade Database | 2000–2020 |
| [4] | Global LNG trade network spatial resilience and communities during the Ukrainian War | AIS DATA (Shipxy) | 2021–2022 |
| [16] | China’s LNG trade network resilience | AIS DATA (HiFleet) | 2011–2017 |
| [17] | Global LNG trade network resilience | BP Statistical Review & UN Comtrade Database | 2010, 2015, 2020 |
| [10] | Global LNG trade network spatial structure, communities and resilience | AIS Data (HiFleet) | 2018–2020 |
| Description | Time Frequency | Source | Unit |
|---|---|---|---|
| Trade LNG volumes between countries | Annually | GIIGNL (International Group of LNG Importers) | Million tons |
| Volumes of European ports | - Quarterly - Annually | - Eurostat’s dataset: mar_go_qm_detl - GOV.UK table: Port0499 | Thousand tons |
| Import volumes for each terminal | Daily | GIE’s Aggregated LNG System Inventory (ALSI) database | Thousand m3 |
| Functions | Output |
|---|---|
| dataYEAR.m | Annual network register, with nodes including only the importing ports and exporting countries |
| dataYEARc.m | Annual network register, with nodes including chokepoints |
| nodesnumber.m | Initial size of LCC nodes, excluding other non-connected subnetworks New table with the remaining LCC nodes |
| degree.m | In-degree of connectivity Out-degree of connectivity Weighted in-strength of node Weighted out-strength of node |
| ncentrality.m | In-degree of network centrality Out-degree of network centrality |
| resilience.m | Network resilience |
| asplength.m | Average shortest path length |
| clusteringc.m | Clustering coefficient |
| nwanalysis.m | Complex function that includes 9 basic functions and calculates the set of network theory indicators |
| communities.m | Complex function that calculates modularity and community structure |
| simulation.m | LCC/Resilience/Clustering coefficient (Intnetional failures) LCC/Resilience/Clustering coefficient (Random failures) LCC/Resilience/Clustering coefficient (Individual failures) |
| Year | 2018 | 2019 | 2020 | 2021 | 2022 |
|---|---|---|---|---|---|
| Number of nodes | 38 | 39 | 39 | 43 | 49 |
| Number of links | 110 | 154 | 154 | 137 | 197 |
| Density (Δ) | 0.08 | 0.10 | 0.10 | 0.08 | 0.08 |
| Connectivity (NV) | 280 | 456 | 658 | 261 | 1270 |
| In-degree (Cin) | 69.27 | 78.10 | 93.05 | 81.64 | 137.77 |
| Out-degree (Cout) | 154.69 | 168.44 | 194.13 | 170.89 | 561.33 |
| Average shortest path length (L) | 0.16 | 0.24 | 0.33 | 0.11 | 0.23 |
| Clustering coefficient (Ci) | 0.000902 | 0.000495 | 0.001348 | 0.000654 | 0.000857 |
| Resilience (Rs) | 1963.41 | 2191.29 | 2653.95 | 1812.15 | 5392.72 |
| Modularity (Q) | 0.67 | 0.52 | 0.43 | 0.52 | 0.04 |
| Number of trade communities | 11 | 15 | 15 | 12 | 16 |
| Network Nodes Degree Change | ||||||
|---|---|---|---|---|---|---|
| 2018 | 2020 | 2022 | ||||
| 1 | Qatar | 14.206 | Gibraltar | 20.196 | USA | 48.648 |
| 2 | Suez | 14.206 | Qatar | 19.726 | Gibraltar | 30.760 |
| 3 | Hormuz | 14.206 | Suez | 19.726 | Suez | 19.713 |
| 4 | Gibraltar | 12.065 | Hormuz | 19.726 | Hormuz | 18.820 |
| 5 | Algeria | 5.805 | USA | 16.269 | Qatar | 18.757 |
| 6 | Nigeria | 5.780 | Russia | 12.400 | Russia | 13.799 |
| 7 | Marseille Fos | 5.337 | Nigeria | 8.350 | Zeebrugge | 13.591 |
| 8 | Rovigo LNG | 4.580 | Milford Haven | 7.745 | Milford Haven | 12.028 |
| 9 | Russia | 4.456 | Rotterdam | 5.897 | Rotterdam | 11.973 |
| 10 | Nantes Saint-Nazaire | 4.372 | Zeebrugge | 5.875 | Nantes Saint-Nazaire | 10.690 |
| 11 | Barcelona | 3.895 | Algeria | 5.836 | Dunkerque | 9.637 |
| 12 | Rotterdam | 3.595 | Nantes Saint-Nazaire | 5.829 | Nigeria | 8.044 |
| 13 | Milford Haven | 3.566 | London | 5.275 | London | 6.891 |
| 14 | Huelva | 3.435 | Rovigo LNG | 5.230 | Rovigo LNG | 5.612 |
| 15 | Norway | 3.263 | Marseille Fos | 4.875 | Marseille Fos | 5.569 |
Disclaimer/Publisher’s Note: The statements, opinions and data contained in all publications are solely those of the individual author(s) and contributor(s) and not of MDPI and/or the editor(s). MDPI and/or the editor(s) disclaim responsibility for any injury to people or property resulting from any ideas, methods, instructions or products referred to in the content. |
© 2025 by the authors. Licensee MDPI, Basel, Switzerland. This article is an open access article distributed under the terms and conditions of the Creative Commons Attribution (CC BY) license (https://creativecommons.org/licenses/by/4.0/).
Share and Cite
Savvakis, K.I.; Moschovou, T.P. European LNG Import Network Analysis and Investigation of Supply Security. Energies 2025, 18, 634. https://doi.org/10.3390/en18030634
Savvakis KI, Moschovou TP. European LNG Import Network Analysis and Investigation of Supply Security. Energies. 2025; 18(3):634. https://doi.org/10.3390/en18030634
Chicago/Turabian StyleSavvakis, Konstantinos I., and Tatiana P. Moschovou. 2025. "European LNG Import Network Analysis and Investigation of Supply Security" Energies 18, no. 3: 634. https://doi.org/10.3390/en18030634
APA StyleSavvakis, K. I., & Moschovou, T. P. (2025). European LNG Import Network Analysis and Investigation of Supply Security. Energies, 18(3), 634. https://doi.org/10.3390/en18030634