Review

Decarbonisation of Natural Gas Grid: A Review of GIS-Based Approaches on Spatial Biomass Assessment, Plant Siting and Biomethane Grid Injection

by
Thanuja Gelanigama Mesthrige
and
Prasad Kaparaju
*
School of Engineering and Built Environment, Nathan Campus, Griffith University, 170 Kessels Road, Brisbane, QLD 4111, Australia
*
Author to whom correspondence should be addressed.
Energies 2025, 18(3), 734; https://doi.org/10.3390/en18030734
Submission received: 24 December 2024 / Revised: 31 January 2025 / Accepted: 31 January 2025 / Published: 5 February 2025
(This article belongs to the Section A4: Bio-Energy)

Abstract

:
Most nations are shifting towards renewable energy sources to reduce energy-related emissions and achieve their net zero emissions targets by mid-century. Consequently, many attempts have been made to invest in clean, accessible, inexpensive, sustainable and reliable renewable energy sources while reducing dependency on fossil fuels. Recently, the production of biogas and upgrading it to produce biomethane is considered a sustainable way to reduce emissions from natural gas consumption. However, uncertainties in the biomass supply chain and less attention to decarbonising the natural gas grid have led to fewer investors in biomethane injection projects. Thus, researchers have applied Geographic Information System (GIS) as the best decision-making tool with spatial analytical and optimisation capabilities to address this issue. This study aims to review GIS-based applications on planning and optimising the biomass supply chain. Accordingly, this review covers different GIS-based biomass assessment methods with the evaluation of feedstock types, GIS-based approaches on selecting and optimising bioenergy plant locations and GIS-based applications on facilitating biomethane injection projects. This review identified four major biomass assessment approaches: Administrative division-based, location-based, cluster-based and grid-based. Sustainability criteria involved in site selection were also discussed, along with suitability and optimality techniques. Most of the optimising studies investigated cost optimisation based on a single objective. However, optimising the whole supply chain, including all operational components of the biomass supply chain, is still seldom investigated. Furthermore, it was found that most studies focus on site selection and logistics, neglecting biomethane process optimisation.

Graphical Abstract

1. Introduction

Modern anthropogenic activities produce increasing amounts of biomass resources that hold the considerable potential of replacing fossil fuels to expedite the world’s greenhouse gas (GHG) emissions reduction. The annual biomass production by terrestrial plants is estimated to be three to four times higher than the existing energy demand [1]. Globally, the majority of GHG emissions are derived from fossil fuel combustion, with coal, oil and natural gas accounting for 45%, 33% and 22%, respectively [2]. The decarbonisation plans for the energy sector are mandatory to attain the net zero emissions target. It was predicted that renewables will replace 55% of the world’s electricity generation by 2050 [3]. Despite this progress, other sectors are lagging in clean energy transitions. Although global coal consumption is projected to decrease by 15% between 2020 and 2050, oil and natural gas use is projected to rise by 15% and 50%, respectively [3]. Over half of the global renewable energy comes from modern bioenergy in the form of solid, liquid and gas [4]. According to the Stated Policies Scenario (STEPS), the demand for modern bioenergy will rise from 42 exajoules (EJ) to over 70 EJ by 2050 [5]. Biogas and biomethane comprise the smallest portion of the global bioenergy supply chain. However, interest in biomethane as a more compatible renewable energy source for the existing gas infrastructure is increasing [4].
Biomethane serves as the primary component of green gas, which refers to renewable gas generated through the anaerobic digestion (AD) of biomass [6]. The anaerobic fermentation of organic matter by microorganisms yields biogas, mainly consists of 50–70% methane (CH4) and 30–50% carbon dioxide (CO2) [7]. Biomethane is produced either by upgrading biogas or through the gasification of solid biomass followed by methanation [7]. Around 90% of biomethane production is still produced by upgrading biogas [7]. In comparison to hydrogen, the chemical composition of biomethane is very similar to that of natural gas [8]. Therefore, biomethane is recognised as the only viable solution for decarbonising the natural gas sector with the existing infrastructure and appliances [8]. Accordingly, biomethane grid injection has been given considerable attention worldwide in decarbonising the natural gas sector. Moreover, biogas and biomethane mitigate CO2 emissions from fossil fuel combustion while avoiding methane emissions from agriculture/livestock and waste sectors, which account for 60% of global anthropogenic methane emissions [9]. By 2040, biomethane is estimated to avoid approximately 1000 million tonnes (Mt) of GHG emissions from both natural gas consumption and methane emissions from feedstock decomposition [7]. Additionally, biogas from waste is part of the bio-circular economy and sustainable development [10]. The International Energy Agency (IEA) shows that global biomethane production is around 3.5 million tonnes of oil equivalent (Mtoe), representing 0.1% of today’s global natural gas demand [7]. Furthermore, it is estimated that agricultural residues within 20 kilometres of major gas distribution networks could produce up to 300 billion cubic metres (bcm) of biomethane (Figure 1) [7].
A sustainable biomethane supply system must work on three main components: biomass estimation, biogas/upgrading plant locations and end-user network. Optimising these three elements is essential to attract investors for biogas and biomethane projects at both local and national levels. The biomass resources have spread in terms of space and time. Thus, determining the best transportation network to prevent excessive costs and energy consumption is crucial in the planning process [11]. Locating biogas plants in optimal sites with ideal capacities is a challenging task [12,13]. The biogas plant siting needs careful consideration of various socio-economic and environmental factors, which should be thoroughly addressed during the planning phase. Therefore, Geographic Information System (GIS)-based approaches have been developed to assess the technical potential and economic feasibility of biomass-based renewable energy generation [12,13,14]. GIS offers various tools and techniques for assessing spatial resources while ensuring the precise positioning of these resources. Furthermore, GIS facilitates the processing of spatial data on various socio-economic and environmental elements while enabling the optimisation of biomass supply logistics [15] under real-world scenarios.
A review of these GIS-based decision-supporting systems and models is vital to identify the most reliable and user-friendly approaches for sustainable biomethane supply chain management. Notably, in the context of biomethane grid injection, a comprehensive review of GIS-based approaches to optimise the biomass supply chain is yet to be undertaken. Accordingly, this study thoroughly reviews the GIS-related applications that aid in planning biomass supply chains across various countries. This review is structured based on three specific objectives: (1) to assess GIS-based tools for spatial biomass assessments, (2) to examine GIS methods for selecting and optimising biogas plant locations and (3) to explore GIS applications for planning biomethane grid injection.

2. Review Method

The review was conducted following the principles in the Preferred Reporting Items for Systematic Reviews and Meta-Analysis (PRISMA) approach. This review was conducted utilising the COVIDENCE online platform, which facilitates the import of references from various sources, title and abstract screening, full-text review and extraction of data in accordance with specific requirements. Web of Science and Scopus research databases were explored to identify relevant studies using defined keywords and inclusion and exclusion criteria (Table 1). The search was conducted from May 2023 to September 2024.
The COVIDENCE system screened 667 studies, comprising 452 articles from Scopus and 215 from Web of Science. After automatically removing 168 duplicate entries, 499 articles were left for further screening. Of these, 329 articles were considered irrelevant, resulting in 169 studies qualifying for a full-text eligibility assessment. Ultimately, 95 articles were excluded in the final selection process, leaving 72 articles for review (Table 2). A database was created on the COVIDENCE platform to extract relevant information from the review papers. EndNote 20 software was also used alongside the COVIDENCE platform to highlight and cite references.

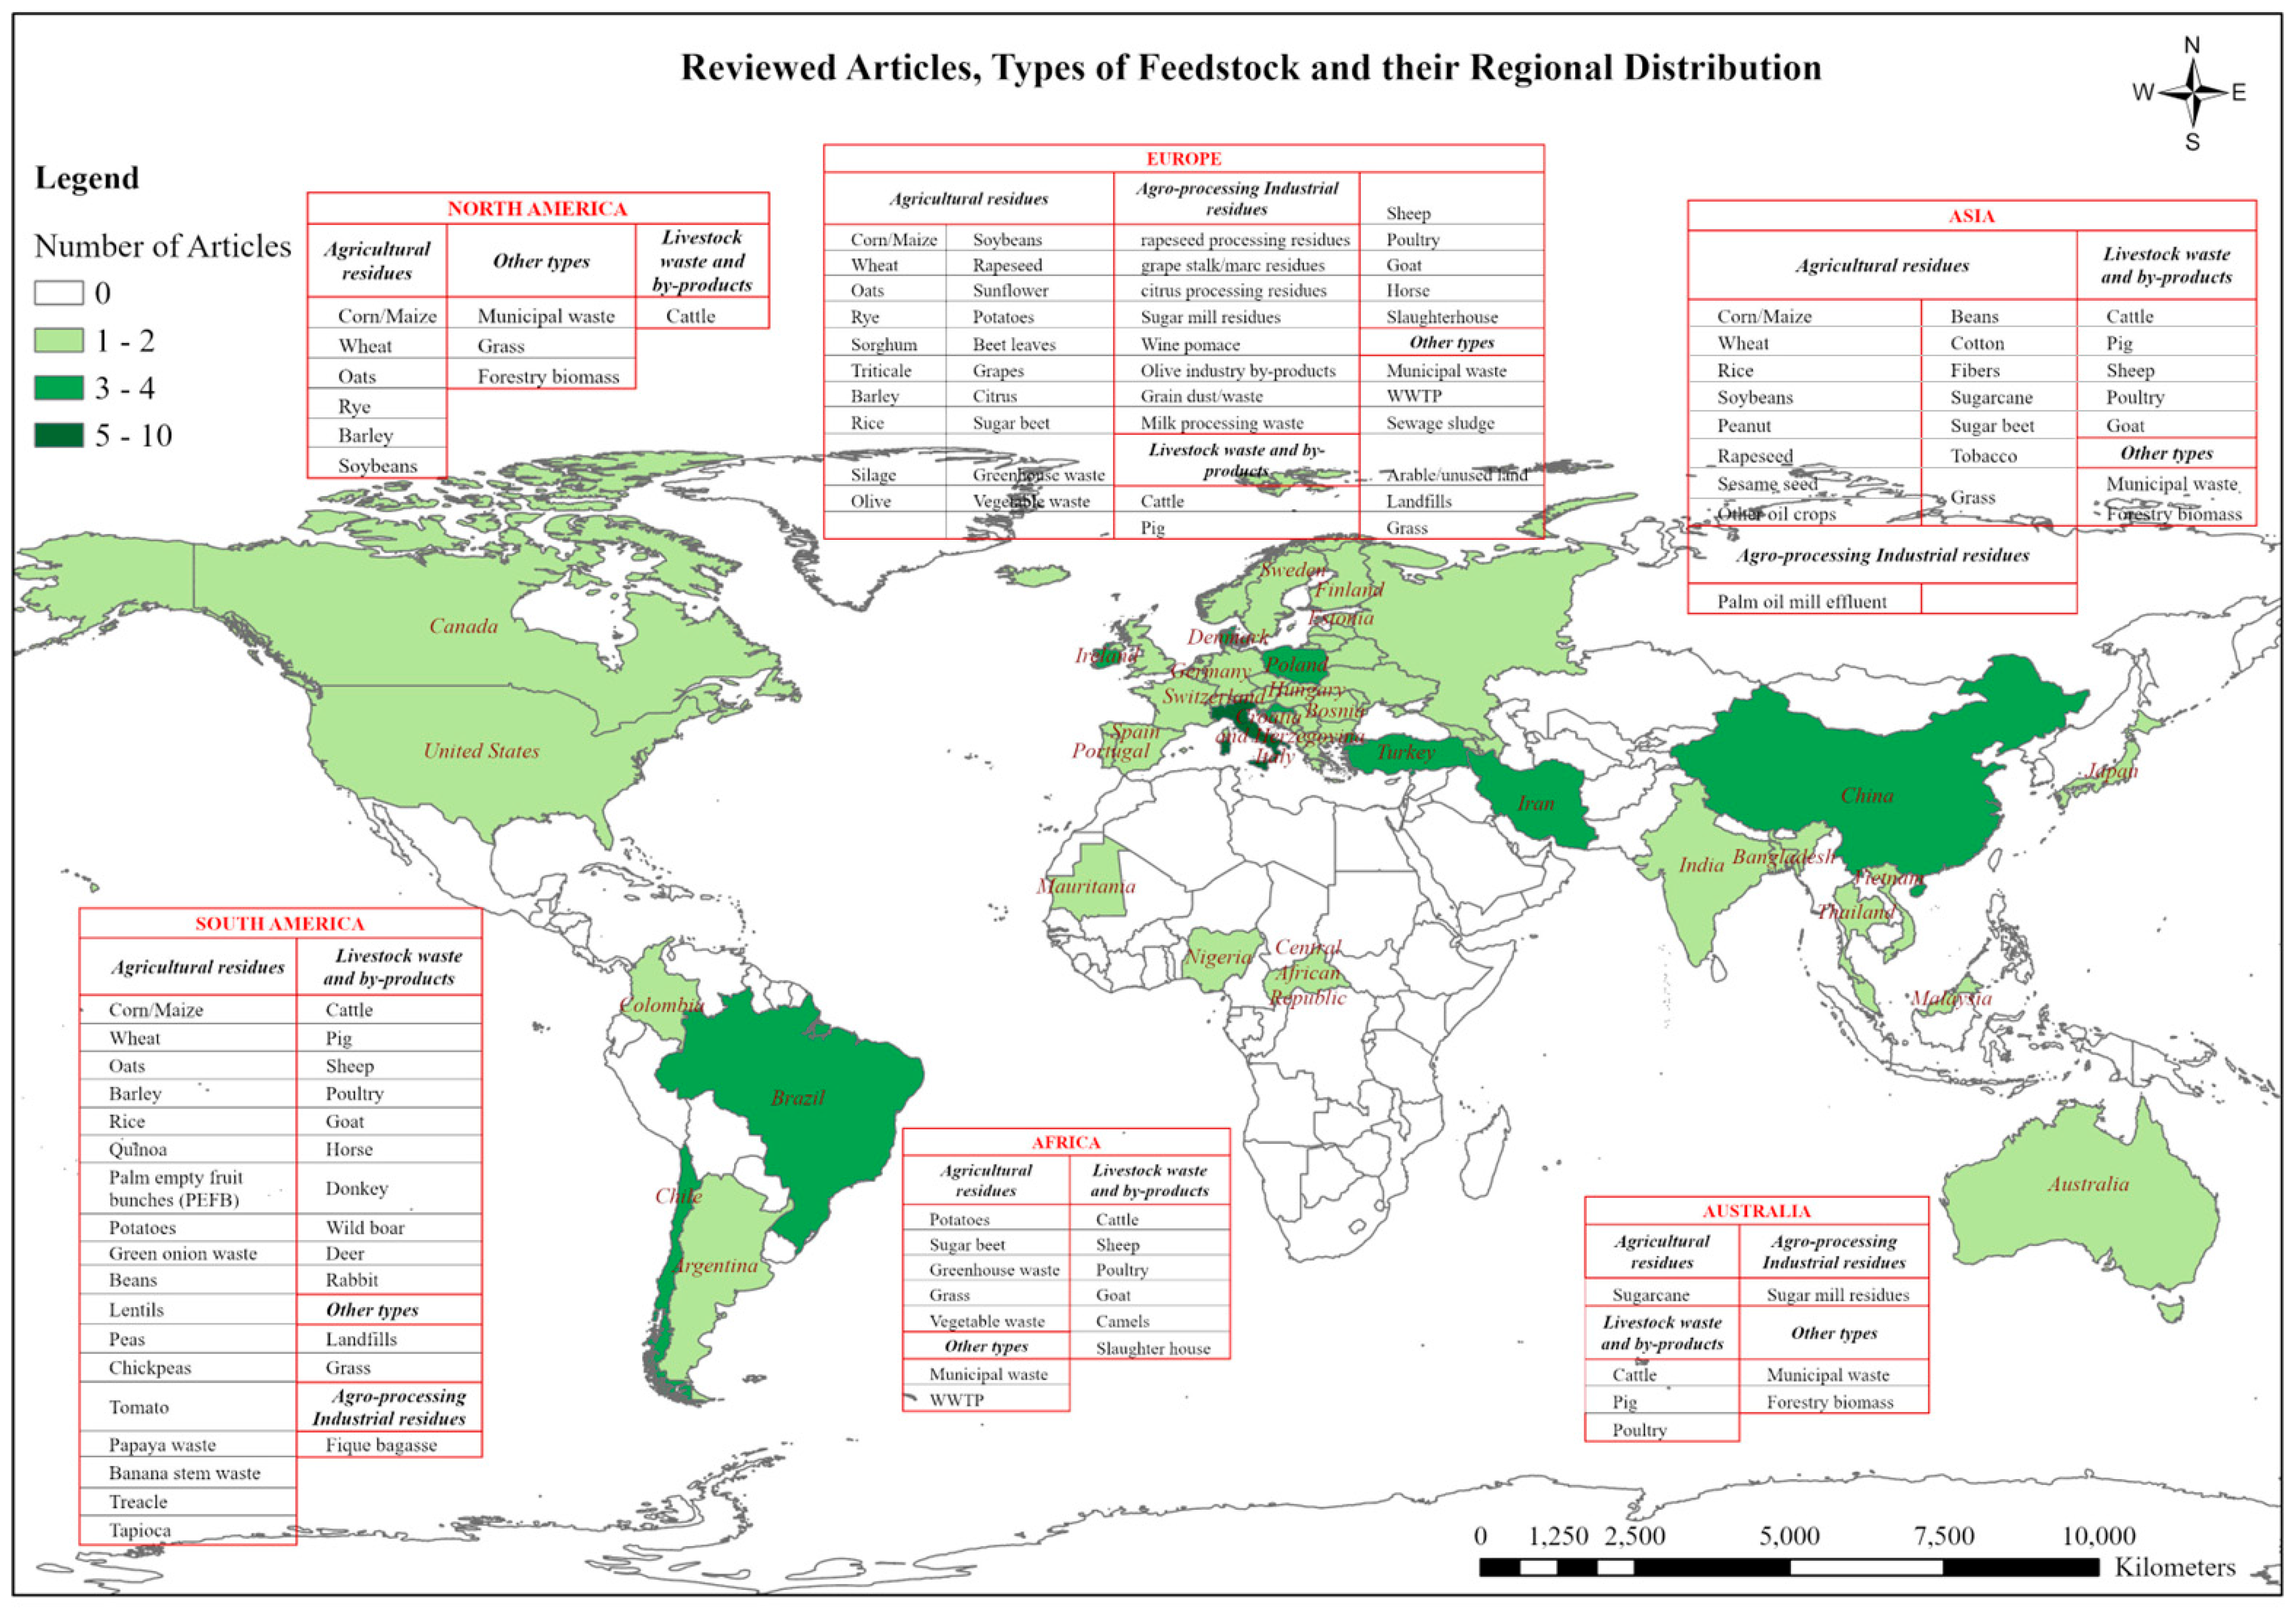
3. Results and Discussion

3.1. Biomass for Biogas Production

Biomass is represented by a large variety of organic materials available on a renewable basis, ranging from simple compounds to complex, high-solid matters. They usually have a high sugar content, starch, proteins or fats; a common feature is their ability to decompose through AD [16]. Animal waste, agricultural residues, industrial by-products, municipal waste, aquatic biomass and biomass from unused lands were the main sources of biomass found in the studied articles. The utilisation of diverse feedstock types has experienced substantial growth since 2018. An overview of the feedstock categories based on the review findings is illustrated in Figure 2.

3.1.1. Livestock Waste

The livestock sector is one of the critical GHG emitters, accounting for 14.5% of global anthropogenic GHG emissions [17]. Previously, there were no restrictions on spreading manure on agricultural lands. However, many countries now enforce increasingly strict environmental regulations that mandate manure treatment and management technologies such as AD. The usage of AD technology for animal waste treatment has gained worldwide attention due to its numerous benefits. Specifically, AD generates renewable energy while mitigating air and water pollution [16]. Based on the findings shown in Figure 2 and Figure 3, animal waste was identified as the most commonly used feedstock for biogas production worldwide. An analysis of biogas production from livestock manure at the district level in Turkey identified 66 districts as emerging hotspots for new biogas plants with power capacities ranging from 6.30 megawatts of electricity (MWel) to 22.54 MWel [18]. Similarly, the economic feasibility of a biogas plant network in southern Chile based on livestock farm waste was conducted using data from 572 farm locations, including a total of 173,631 cows [19]. Interestingly, twelve publications (21%) of the review evaluated the biomass potential for biogas generation considering solely the livestock sector.
The utilisation of manure and slurries as feedstock for AD presents several challenges. One of the key limitations identified is the low dry matter content of livestock slurries, which typically range between 3–5% for pig slurries and 6–9% for cattle slurries. This results in a low methane yield per unit volume of the feedstock, typically between 10 and 20 m3 methane/m3 of digested slurry [16]. Furthermore, the transportation of biomass represents a significant cost factor that must be taken into account [16]. Both slurries and manures contain various amounts of straw and fibre particles high in lignocelluloses. The lignocellulosic fractions are known to be recalcitrant to anaerobic decomposition and usually pass through a biogas reactor undigested without contributing to methane production. While manure has the potential to be a good feedstock for biogas, its relatively low methane yield makes mono-digestion economically unsustainable. Therefore, co-digestion with co-substrates that have a high methane yield is necessary for economic viability [16].

3.1.2. Crop Residues

This category includes various types of plant residues such as agricultural by-products, harvest residues, plants and plant parts, low-quality or spoiled crops, fruits and vegetables, spoiled feed silage and more. Typically, plant residues are digested with animal manures and other feedstock types as co-substrates [16]. Research conducted in Hungary has proven that using manure and crop residue-based feedstock supply chains can enhance the feasibility and sustainability of biogas projects [20]. Manure co-digestion with crop residues can be particularly beneficial when identifying AD plant sites. This strategy helps to minimise the distance required to transport manure, thereby strengthening the economic viability of biogas generation. It is important to avoid selecting inappropriate sites based solely on manure availability and neglecting the potential availability of crop residues during the planning stage [20]. This review has identified 35 types of crop residues used for biomass analyses for biogas production in different countries (Table 3).
Wang et al. [21] developed a straw feed model to simulate corn straw feedstock supply to a major corn production region in Northeast China. Further, Sharmin et al. [22] demonstrated that 21 biogas-based power plants using cattle manure and rice straw could produce 6389.14 kilowatts (kW) of electrical energy per year, which meets 5.73% of the demand of the study district. Havrysh et al. [23] determined the energy potential of agricultural waste in Poland using crop residues (triticale, barley, wheat, oat, corn, rapeseed, sugar beet and mixed grain) and animal husbandry (cattle, pig, sheep, goat and poultry) waste. The total energy potential of agricultural waste has been estimated at 279.94 petajoules (PJ), which can cover up to 15% of national power generation. Similarly, the economic feasibility of mono-digestion of manure and agricultural residues and the co-digestion of both substrates at a national level was carried out in Chile [24]. The above study found that co-digestion of manure offered a significant increase of approximately 46% in economic potential at the exact representative cost as mono-digestion.

3.1.3. Energy Crops

During the 1990s, countries such as Germany and Austria developed an approach to cultivating crops that could be used for energy production [16]. These crops, also known as energy crops, include maize, triticale and sweet sorghum. They are often used to increase biogas production from agricultural residues, organic waste and manure. Maize is the most commonly used energy crop for biogas generation due to its high biomass and methane yields (9–30 tons dry matter (DM)/ha). However, the crop type, genotype and biomass treatment influence the methane yield. Some researchers have suggested that there are no significant differences in the methane content between maize and other energy crops such as barley, rye and triticale. Table 4 illustrates the methane yields associated with several energy crops as reported in the reviewed literature.
O’Shea et al. [26] conducted a study in Ireland to determine the source of cattle slurry and grass silage for 42 potential biomethane plant locations. The study calculated the annual DM production of grass from pasture, grassland allocated to hay production and grass silage from land dedicated to grass silage production. The results indicated that the biomethane potential of grass silage was 128.4 PJ/year, while that of cattle slurry was 9.6 PJ/year. The production of biomethane from cattle manure and grass silage in Ireland in 2014/15 was equivalent to 6% and 76% of the country’s total natural gas consumption, respectively.
Cultivating energy crops requires a significant amount of fertilisers, pesticides and energy for harvesting and transportation. As a result, this practice reduces the overall environmental sustainability of using such crops for biogas and renewable energy production [16]. Moreover, this inefficient use of arable land competes with food production and does not align with sustainable development principles. Accordingly, the biogas sectors of European countries have limited the use of maize silage and corn to a maximum of 30–50% of the total feedstock input [16]. Some researchers refer to “energy crops” as the total biomass produced on agricultural lands, not just the plants specifically cultivated for energy production [27].

3.1.4. Industrial By-Products

Many industrial activities produce organic by-products, waste and residues. These materials can be used as feedstock to generate energy. Researchers have studied the biomethane potential of these by-products and wastes at national and regional scales to develop renewable energy sources. These industries include food and beverage, milk, starch, sugar, fodder, fish processing, pharmaceuticals, biochemicals, cosmetics, pulp and paper, slaughterhouses, etc. Most of these materials are homogeneous, easily digestible and rich in lipids, proteins or sugars and are utilised as “methane boosters” due to their significantly high methane potential [16]. This review has identified 11 different industrial feedstocks across 10 published articles, which are summarised in Table 5.
Lovrak et al. [10] conducted an analysis of the by-products generated in sugar, wine, vegetable and olive oil industries, focusing on their spatial and seasonal variations in production. The findings in the above study indicated that industries situated within a 20 km radius of potential biogas sites possess a potential of 8,119,280 m3 of methane. Nevertheless, the research highlighted that seasonal fluctuations in the production of industrial residues have a substantial impact on the economic viability of biogas site operations. One major drawback of using industrial organic waste for biogas production is the potential presence of undesirable matter such as biological, physical or even chemical pollutants when the resulting digestate is used as a crop fertiliser [16].

3.1.5. Municipal Solid Waste (MSW)

Organic waste has high biodegradability and methane yield, and it contains a balanced nutrient profile that supports the metabolism of anaerobic microorganisms [16]. The separate collection of organic fractions of MSW, such as food and garden waste, offers an excellent source of feedstock for AD. While municipal waste presents significant challenges for numerous countries, some nations recognise it as a valuable resource. Furthermore, this approach decreases the volume of organic waste directed to landfills and incinerators.
This review identified 14 scholarly articles that incorporate the organic fraction of MSW (OFMSW) in their biomass assessments. Akther et al. [28] analysed the energy production potential of OFMSW as a solution for waste management in Dhaka City, Bangladesh. In addition, OFMSW was identified as a promising source of renewable electricity generation [29]. Consequently, the potential of electricity generation from OFMSW was analysed in Khuzestan Province, Iran. Further, OFMSW is frequently co-digested with other feedstocks. Bedoic et al. [30] studied the potential of biogas production using agri-food industry by-products, lignocellulosic residues and OFMSW in a region of Croatia. However, the key challenges in utilising OFMSW as feedstock for biogas production were the substantial costs related to the separate waste collection and purity levels [16].

3.1.6. Sewage Sludge (SS) and Wastewater Treatment Plant Sludge (WWTPS)

Globally, SS and WWTPS are commonly treated using AD technology as a standard waste treatment method. However, researchers have started exploring the use of SS and WWTPS as potential feedstocks for renewable energy generation. The major drawbacks of the use of these two feedstocks are the requirement of long retention time of SS and industrial WWTPS, resulting in low biogas potential due to high water content and poor volatile solids contents [30].
In this review, only a few articles have studied the assessment of WWTPS (2) and SS (3). For instance, Hohn et al. [31] used the sludges from municipal wastewater treatment plants, food industries and paper and pulp mills as feedstocks with livestock manure and energy crops. Similarly, biomass assessment of WWTPS and SS was also reported for a region of Finland [13].
Many countries have established national legislation and quality standards to regulate the utilisation of SS as a feedstock source. This is due to the significant amount of biological and chemical pollutants present in SS, depending on its origin. As a result, some countries have prohibited the use of digested SS for agricultural activities or as a fertiliser. Furthermore, some countries have stringent standards for regulating the use of sludge-based fertilisers, taking into account the levels of heavy metals, organic pollutants and sanitation requirements for pathogen and other biological vector inactivation [16].

3.1.7. Landfills

Many countries practice an unsustainable waste management approach by transferring the collected MSW directly to landfills. The organic fraction of MSW in landfills decomposes and releases biogas, which contains methane. This methane contributes to local air pollution and accelerates global climate change due to its average methane content of 50% [32]. However, the authors of the work [32], shows the potential of using this gas as a substitute for fossil fuels in the energy sectors, as it has a high methane content that is energetically equivalent to natural gas.
This review found one article that includes landfills as a source of feedstocks in their biomass assessment. Veiga et al. [32] identified the locational viability of using landfill gas to produce biomethane and injecting it into pipelines. The above study investigated the biomethane potential of existing landfills within 50 km of Brazil’s pipeline network. It was estimated that the potential for biomethane production from landfills in Brazil was equivalent to 3,407,027 Nm3/day, accounting for 6% of the country’s natural gas consumption in 2019.

3.1.8. Aquatic Biomass

The decarbonisation target has led countries to explore different substrates for the AD process. In Germany, a nationwide survey was conducted to identify the amount of aquatic macrophyte biomass collected by aquatic de-weeding operations in rivers and lakes [33]. The results from the above study revealed that there are potentially 172 locations of de-weeding operations in flowing waters and 93 in standing waters. The overall amount of biomass that could be harvested was calculated to be 36,244 tonnes per year (t/year). The maximum fresh biomass potential was estimated at 100,000 t/year if missing data are considered. Furthermore, the above study also demonstrated the viability of aquatic macrophyte biomass as a substrate for biogas generation [33]. The mixture of aquatic plant species, the time of harvesting and biomass logistics (harvested amount, storage and transport) are the primary factors that influence the biogas potential of aquatic plants [33].

3.2. GIS-Based Approaches on Biomass Assessments

An accurate assessment of available biomass resources is essential for effectively designing and optimising the biomass supply chain. However, many countries face a significant challenge due to insufficient data, which has hindered the exploration of biomass resources available for biogas production. Identifying and estimating biomass resources at both local and national levels is vital for attracting investors for biogas projects. The evaluation of biomass potential is primarily conducted through two methods: statistical and spatial assessments. Historically, statistical techniques were the predominant approach. However, researchers have highlighted the importance of spatial biomass assessment in various aspects, including biogas plant siting, determining plant capacities, estimating transportation costs and related emissions and the management of logistics. GIS plays a crucial role in this context.
GIS is a significant decision-making tool because of its vital geographic/spatial data-handling capabilities. Spatial distribution of the available biomass resources can accurately be extracted using GIS and/or Remote Sensing (RS) techniques, and biomass estimation can subsequently be carried out by taking production and other statistical data into account. This review analysed 57 articles on estimating biomass potential using GIS techniques and identified four approaches based on how the total biomass potential was presented in the outcome. Figure 4 shows the temporal distribution of applying these approaches.

3.2.1. Administrative Division-Based Biomass Assessment

The administrative division-based approach has been a widely used GIS method for assessing biomass over the years, as evidenced by 20 papers (Table 6) published between 2009 and 2023. This approach determines the total biomass potential for each administrative division within the study area. Typically, researchers have calculated biomass potential using non-spatial data, including production statistics, livestock capacities and the cultivated land extent. These results are then integrated with relevant administrative shapefiles using the “Join Attributes” method in the GIS. Finally, the spatial distribution at the division level is illustrated through thematic maps. However, some researchers have applied this method using spatial analysis. First, they have identified the spatial distribution of the feedstock sources in the study area. Accordingly, these researchers illustrated the spatial distribution of crop growing areas as polygon features, while other location-based features such as livestock farms, industries and wastewater treatment plants (WWTP) are typically mapped as point features. The data used for these studies are primarily sourced from national or regional GIS-based inventories and other statistical data sources, although a few researchers have also collected primary data through field surveys. The biomass potential is then calculated using field calculators and spatial statistics tools within GIS software. Then, outputs were represented at the administrative divisional level.
Ali et al. [34] outlined the steps involved in conducting a GIS-based biomass assessment for Mauritania. The process included identifying biomass resources such as livestock manure and slaughterhouse waste. Later, data on the quantities of waste, as well as the biogas and energy produced by various departments in Mauritania, were obtained. After geo-referencing and transforming these data, geo-processing and spatial density analysis were performed to generate the final outputs. Similarly, Valenti et al. [35] introduced a GIS-based model to analyse the olive pomace production potential of a region in Italy. Data were collected through surveys. Subsequently, the olive-producing land extents and olive production were calculated for each municipality. Finally, the average percentage of olive pomace production and its availability were estimated using spatial analysis and model builder techniques. Zareei et al. [36] estimated the biogas potential of livestock manure and rural waste using GIS in Iran. The methane production and annual methane potential of each feedstock type were saved in a geo-referenced database to visualise the spatial distribution at the divisional level. Accordingly, three layers (cow manure, light livestock manure and rural household wastes) have been developed using the thematic mapper. However, the inability to identify the exact spatial distribution of biomass resources within the division is the main limitation of this approach.
Table 6. Summary of the articles that used an administrative division-based approach for biomass assessment.
Study ScaleGIS MethodologiesSources of FeedstocksReference
1NationalSpatial analysis,
Thematic Mapper
Agricultural residues (multi crops); livestock; food and garden[27]
2RegionalSpatial analysis,
Raster analysis (100 m),
raster overlay
Agricultural residues (multi crops); livestock; food and garden; agro-industrial sub products[37]
3NationalThematic mapper Agricultural residues (multi crops); livestock[24]
4RegionalImage analysis,
Spatial analysis
Agricultural residues (single crop); livestock; food and garden[11]
5RegionalSpatial analysis,
Thematic mapper
Livestock; energy crops; energy crops (grass silage)[26]
6NationalThematic mapperLivestock; food and garden; slaughterhouse waste, milk processing waste[38]
7RegionalThematic mapperAgricultural residues (multi crops); livestock[39]
8RegionalSpatial analysis,
Thematic mapper
Industrial by-products (citrus pulp)[40]
9RegionalThematic mapperGrass (waste grass, riverbanks and roadsides grass, natural and rural areas)[41]
10NationalSpatial analysis,
Thematic mapper
Livestock; food and garden[36]
11RegionalSpatial analysis,
Thematic mapper
Industry by-products (olive pomace)[35]
12RegionalThematic mapperAgricultural residues (multi crops); livestock; food-processing wastes (citrus pulp, olive pomace and whey), forage crops (corn silage)[42]
13NationalThematic mapperLivestock; slaughterhouses[34]
14RegionalThematic mapperAgricultural residues (multi crops); livestock; food and garden; WWTP; energy crops; residue grass, industry waste[30]
15NationalThematic mapperAgricultural residues (multi crops); livestock[23]
16NationalSpatial analysis,
Thematic mapper
Livestock; grass silage[43]
17NationalSpatial analysis,
Thematic mapper
Livestock[18]
18RegionalSpatial analysis,
Thematic mapper
Municipal waste (household-generated, industrial waste and commercial waste)[29]
19NationalSpatial Analysis,
Thematic Mapper
Agricultural residues (multi crops); forestry waste; livestock; municipal solid waste; sewage; industrial waste[44]
20RegionalSpatial Analysis,
Thematic Mapper
Livestock waste[45]

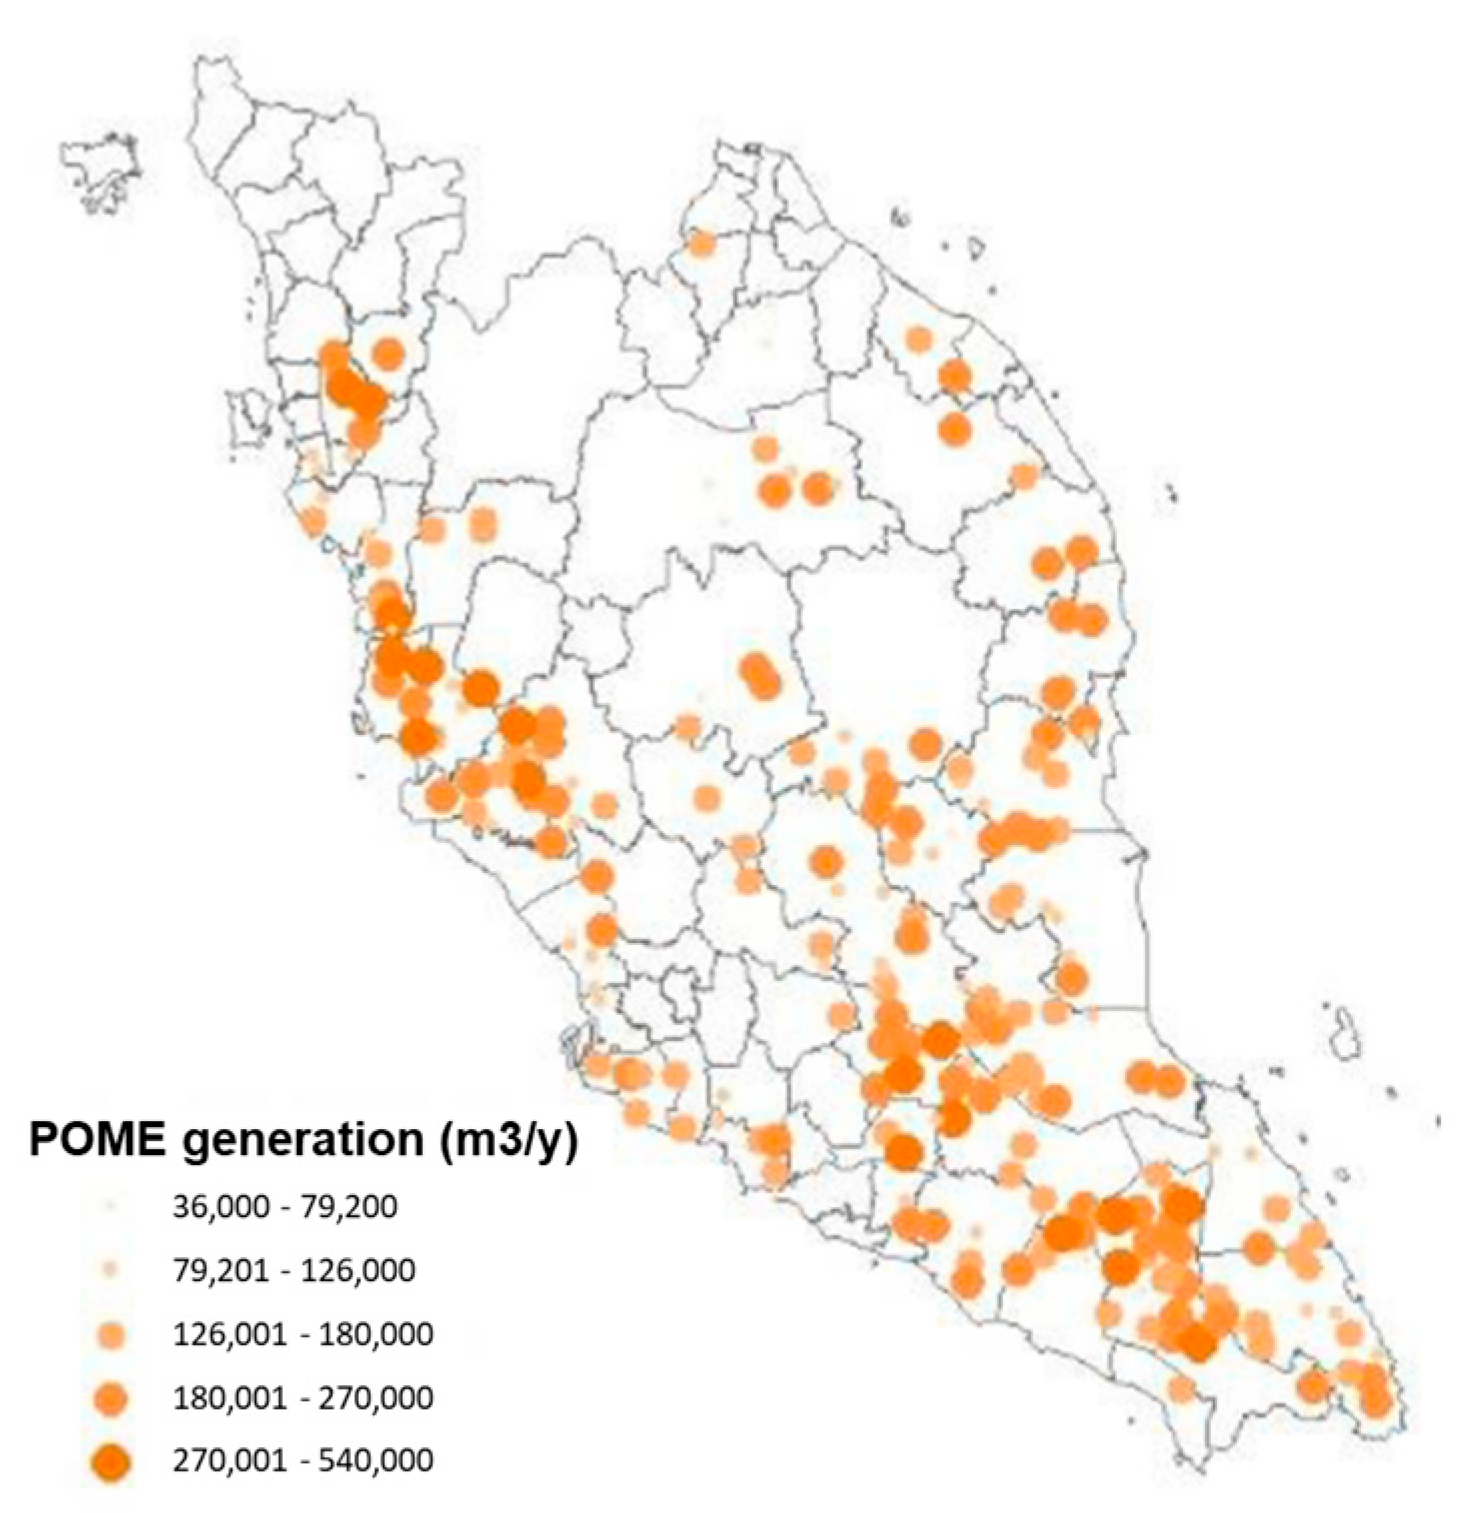
3.2.2. Location-Based Biomass Assessment

The location-based approach primarily identifies the precise locations of feedstock sources, which is essential for calculating transportation costs within the feedstock supply chain. This method involved the following steps in 12 articles (Table 7).
  • Extraction (from secondary spatial data sources) or mapping (self-digitised data) the locations of feedstock sources (e.g., locations of animal farms, industries, etc.);
  • Combine other required non-spatial data (e.g., number of animals, production statistics, etc.) with the location layers and calculate the biomass and energy potential using the field calculator or spatial statistical tools and relevant equations.
Or
  • Calculate the biomass and energy potential using non-spatial data (e.g., production statistics, number of animals, etc.) using other statistical methods or mathematical models;
  • Combine the results with the location shapefile using the Join Attributes method and represent the results using thematic mapper and appropriate symbolising methods.
The biomass potential of Palm Oil Mill Effluent (POME) in Malaysia was calculated by using this approach and is presented in Figure 5 [46]. The potential generation of POME from each mill was estimated based on several assumptions: a daily operating time of 12 h, 300 days of operation per year and the generation of 1 m3 of POME from every ton of fresh fruit bunches. Location-based results were illustrated using the thematic mapper and graduated symbols. A location-based assessment on biowaste in Anambra State of Nigeria [12] estimated the biomass potential of livestock farms and slaughterhouses in the study area. A field survey was conducted to collect the location data and other information. Survey data were used to develop GIS layers on the spatial distribution of biomass. Biowaste generation potential was estimated based on several assumptions, including the daily manure generation of various livestock: 120 kg for 1000-layer chickens, 80 kg for meat chickens, 200 kg for turkeys and 150 kg for ducks. The thematic mapper was used to represent the spatial distribution of the biomass availability.
Moreover, Rohl et al. [33] used this approach to estimate the aquatic de-weeding biomass in 172 locations in flowing waters and 93 locations in standing waters. Another study [32] determined the locational feasibility of bioenergy production from landfill gas in Brazil using this method. Accordingly, the potential for biomethane production in landfills was calculated based on raw biogas production, and then QGIS was used for the geoprocessing and attribute joining.
Table 7. Summary of the articles used location-based analysis for biomass assessment in this review.
Study ScaleGIS MethodologiesFeedstock Types StudiedReference
1RegionalSA, TMLivestock[47]
2NationalSA, TMAquatic macrophyte biomass[33]
3RegionalSA, TMIndustrial residues[48]
4RegionalSA, TMLivestock[49]
5RegionalSA, TMLivestock[50]
6RegionalSA, TMLivestock; slaughterhouse waste[12]
7RegionalSA, TMLivestock[19]
8NationalSA, TMLivestock, crop by-products[51]
9NationalSA, TMLandfills[32]
10RegionalSA, TMIndustrial residues (sugar, wine, vegetable and olive oil industries)[10]
11RegionalSA, TMMunicipal solid waste (waste transfer stations)[52]
12RegionalSA, TMAgricultural residues (multi crops)[53]
The application of this approach is limited to location-based activities such as industries, livestock farms, landfills, etc. Polygon-based resources, such as crop residues, cannot be accurately represented using this method.

3.2.3. Grid-Based Biomass Assessment

This method has been applied to determine the biomass potential of multiple feedstock sources using a rectangular grid layer developed to cover the study area. According to this review, 13 articles (Table 8) have applied this methodology to calculate the biomass potential. The following steps were undertaken to complete the assessment.
  • Extraction (from secondary spatial data sources) or mapping (self-digitised data) the areas/locations of feedstock sources (e.g., crop-cultivating areas, locations of animal farms, industries, etc.);
  • Combine other required non-spatial data (e.g., number of animals, production statistics, etc.) and calculate the geometrics to identify the extent of cultivated lands of feedstock sources;
  • Create a rectangular grid layer covering the study area with the required resolution;
  • Clip the feedstock layers with the grid layer to obtain the biomass in each cell separately;
  • Calculate the biomass availability and energy potential using field calculator or spatial statistics and relevant equations within each grid;
  • Calculate the aggregate biomass and energy potential using attribute joining and spatial statistics.
This method shows the total biomass potential in each cell at the required resolution. The grid resolution is critical to avoid spatial errors in estimating the transport distance of biomass.
Hoo et al. [59] employed a similar approach to estimate the biomass potential of various feedstock sources, including POME, food waste, cattle manure and chicken manure. They transformed the data into the spatial format to calculate the energy potential (PJ/year) for each feedstock type. A grid index feature was then created for the Johor region in Malaysia, utilising a scale of 10 km × 10 km. The final biomass grid layer was developed by integrating all feedstock layers with the grid layer to provide a comprehensive overview of biomass potential in the area. Similarly, Jayarathna et al. [15] also illustrated the use of spatial distribution of biomass potential in Queensland State, Australia. The first step generated a rectangular grid layer at 1 km2 resolution. Then, it was integrated with the land-use layer and AREMI (Australian Renewable Energy Mapping Infrastructure) biomass data to demonstrate the biomass distribution. However, the above research has indicated that when compared to a higher resolution level of 1 km × 1 km, the spatial biomass availability was underestimated by the 5 km × 5 km grid-level biomass assessment [15].

3.2.4. Cluster-Based Biomass Assessment

Cluster-based biomass assessment is a technique used to identify the areas with a high concentration of biomass that are most promising for bioenergy production. In this review, twelve articles (Table 9) employed a cluster-based approach to evaluate the biomass potential. The approach involves several steps.
  • Extraction (from secondary spatial data sources) or mapping (self-digitised data) the locations of feedstock sources (locations of animal farms, industries, etc.);
  • Combine other required non-spatial data (e.g., number of animals, production statistics, etc.) with the location layers and calculate the biomass potential using field calculator or spatial statistics and relevant equations;
  • Develop a density map by employing interpolation tools with predefined search radius to identify the clusters of densely distributed areas of biomass (Figure 6).
Hohn et al. [31] used a cluster-based method to show the spatial distribution of biomass potential from multiple feedstock sources in Southern Finland. To achieve this, they stored each feedstock data layer along with biomass potential estimates in a geo-referenced database. The Kernel Density tool was then employed to determine the areas with high biomass concentration within the radius of 3 km. On the other hand, Incremental Spatial Autocorrelation (Spatial Statistics) was used by Venier et al. [65] to determine the clusters of biomass based on animal farms in Buenos Aires Province, Argentina.
However, assessment methodologies are highly influenced by the availability of reliable spatial data on biomass resources. Each method has its own advantages and disadvantages, which should be considered when selecting an approach. By carefully considering these factors, decision-makers can choose the most suitable method that aligns with their goals for optimal results. Table 10 provides a summary of the advantages and disadvantages of each approach.
Biomass assessment must include all the spatial factors that influence optimal biogas production. Optimal biogas production is mainly influenced by three factors: operational conditions, reactor design and feedstock characteristics [74]. An evaluation of important feedstock characteristics, such as the carbon/nitrogen (C/N) ratio, should be included in biomass assessments to indicate optimal biogas production potential. The performance of AD is significantly affected by the C/N ratio of the influent substrate [75,76,77]. A C/N ratio between 20 and 30 is considered as an optimal C/N ratio for the AD process [76]. A C/N ratio that is either too high or too low can suppress the methanogenic population, affecting methane production. An imbalanced ratio may lead to the accumulation of volatile fatty acids (VFAs) or ammonia in the reactor, thereby reducing the methane generation rate [77]. A threshold value of 30 is commonly used to define the most appropriate C/N ratio for biogas production [78]. Therefore, it is essential to provide details on the aggregated C/N ratio of the feedstocks in the biomass assessment. So far, no previous studies have performed a spatial biomass assessment with a process point of view that incorporates the spatial analysis of the C/N ratio. This gap presents a significant challenge in identifying optimal locations for co-digestion facilities that can effectively process biomass under an ideal C/N ratio. The lack of this information highlights the need for additional research to make decisions on energy production potentials during the planning stage.

3.3. Biogas Plant Siting

The methodologies used for site selection in different bioenergy plants show significant similarities. Therefore, this review encompasses the siting of biogas and biomethane facilities, along with other types of bioenergy plants, to provide a thorough overview of the GIS-based site selection process. The selection of suitable sites for biogas plants presents a critical strategic decision in biomass supply chain management. Appropriate plant location enhances the economic benefits while minimising environmental and social impacts. The geographically widespread nature, low energy density and the seasonality of the biomass resources, together with environmental and social impacts of biogas plants, make the siting decision more complex, involving many socio-economic and environmental factors. Thus, researchers have applied a GIS as the best decision-making tool to address this complexity and achieve the expected sustainable outcomes of the projects. It provides a variety of tools for managing different stages of the biomass supply chain, such as assessing biomass availability, planning logistics and locating optimal biomass energy plants [61].

3.3.1. Identification of Exclusive and Selective Criteria (Constraints and Preference Criteria)

Rolewicz-Kalinska et al. [79] discussed the importance of the relevant criteria in the site selection process. The above authors have demonstrated that highly airtight technology (closed halls with mechanical ventilation and deodorisation units) was used in some countries, which can reduce odour and nuisance significantly, but it increases the project’s costs. Thus, airtightness is not a technological option in AD facilities located at a distance from densely populated urban areas. Accordingly, consideration of relevant criteria was identified as a key step for sustainable bioenergy projects. This review identified three major dimensions of criteria: environmental, social and safety and economic factors involved with biogas plants. The environmental criteria were given the highest priority to avoid the impacts of odour, nuisance and public sentiment in this context.
Based on the review results, criteria can further be divided into two major groups: exclusive (constraints) and selective criteria (preference criteria). Constraints mainly involve restricted areas based on environmental, socio-economic or cultural importance. Constraints always consider two alternative classes as suitable or unsuitable [28]. Apart from the exclusive constraints, the selective criterion influences the technical and economic viability of the project [67]. This criterion helps to determine the preferential zones for the biogas plants in the study area.

Environmental Criteria

The bioenergy site selection process should consider water and other biophysical components with ecological and environmental values [28]. Accordingly, biogas plants should be located as far as possible from these elements. Environmental criteria are very important to prevent or minimise the possible environmental impacts of biogas plant project activities. These can vary depending on the physical environment of the region or country where the project will be implemented. Therefore, researchers typically do not follow a standard set of criteria. Several researchers have often chosen criteria based on their study environment and adapted them to align with the environmental laws and regulations of their countries. Environmental criteria can be considered under four sub-categories: environmental protected areas, water and wetlands, geological/geomorphological and hazards (Table 11). Environmentally protected areas such as forests, nature reserves, wildlife areas, etc., have always been considered as restricted areas for establishing biogas plants. Further, buffer zones are applied for these protection areas, and the lengths of buffer zones can vary from one study to another based on the laws and regulations of the country.
The distance between the water body and the biogas plant is important to avoid the risk of contamination caused by the digestate, residual material from the biogas plant rich in nutrients and undegraded carbon. This risk will be very high in flood-potential areas. Akther et al. [28] used only a 500 m restricted zone from the river as the study area was not at high risk for flooding. Some researchers have also considered landslide and volcanic hazards by considering existing risks of natural hazards in the study area. Slope or the elevation factor is also identified as an essential criterion as it directly affects the capital cost of construction and biomass supply and transportation. Dao et al. [69] showed that a lower elevation is the better option to optimise collection and transportation and that it is ideal for locating the biogas plants in the lowlands. Hilly highlands are unsuitable since they cause material collection, transportation and grid network difficulties.

Economic Criteria

Economic factors directly impact the project’s feasibility. Therefore, most articles considered these criteria to produce a reliable and feasible outcome. Table 12 shows the economic criteria identified in this review. The proximity of the biogas plant to biomass sources significantly saves feedstock transportation costs. Biomass potential, distance to biomass sources and distance to access roads have been the most recurrent criteria in the literature. The plant’s continuous operation at planned capacity relies on a consistent supply of feedstocks and their appropriate quality and quantity. This ensures the expected economic benefits of the project.
Easy access to the road network has been an essential factor for the biogas plant location as it is directly related to material transportation. De Jesus [70] considered the distance up to 30 m from the roads and gas pipelines as an excluded area. The region between 30 and 250 m from these roads and pipelines has a high potential for constructing a biogas plant. Distance to the power line and gas pipeline is considered for planning the end-user network. Ferrari [60] emphasised that selective criteria related to the distance from the gas grid play a crucial role in determining the locations of upgrading facilities and grid injection points. In addition to these factors, energy demand, workforce potential and organic carbon in the soil (as most carbon-poor soils can benefit more from the digestate produced in plants) were also considered as economic variables for site selection.

Social Criteria

Social criteria address the possible impacts on social, commercial and cultural activities. Waste-handling plants should be located at a considerable distance from settlements due to public concerns such as aesthetics, odour and related health issues [28]. It is essential to consider the potential community impact of biogas plant operations, including noise pollution and congestion due to increased vehicle traffic and material circulation. These factors could lead to community protests. Therefore, they should be carefully evaluated in the planning and implementation stages. Table 13 shows the social criteria identified in this review. Moreover, certain researchers have identified GDP (gross domestic product) per capita and visual impact as pivotal criteria for site selection. The authors aim to promote employment growth in economically disadvantaged areas while reducing visual disturbances to safeguard the landscape [60].

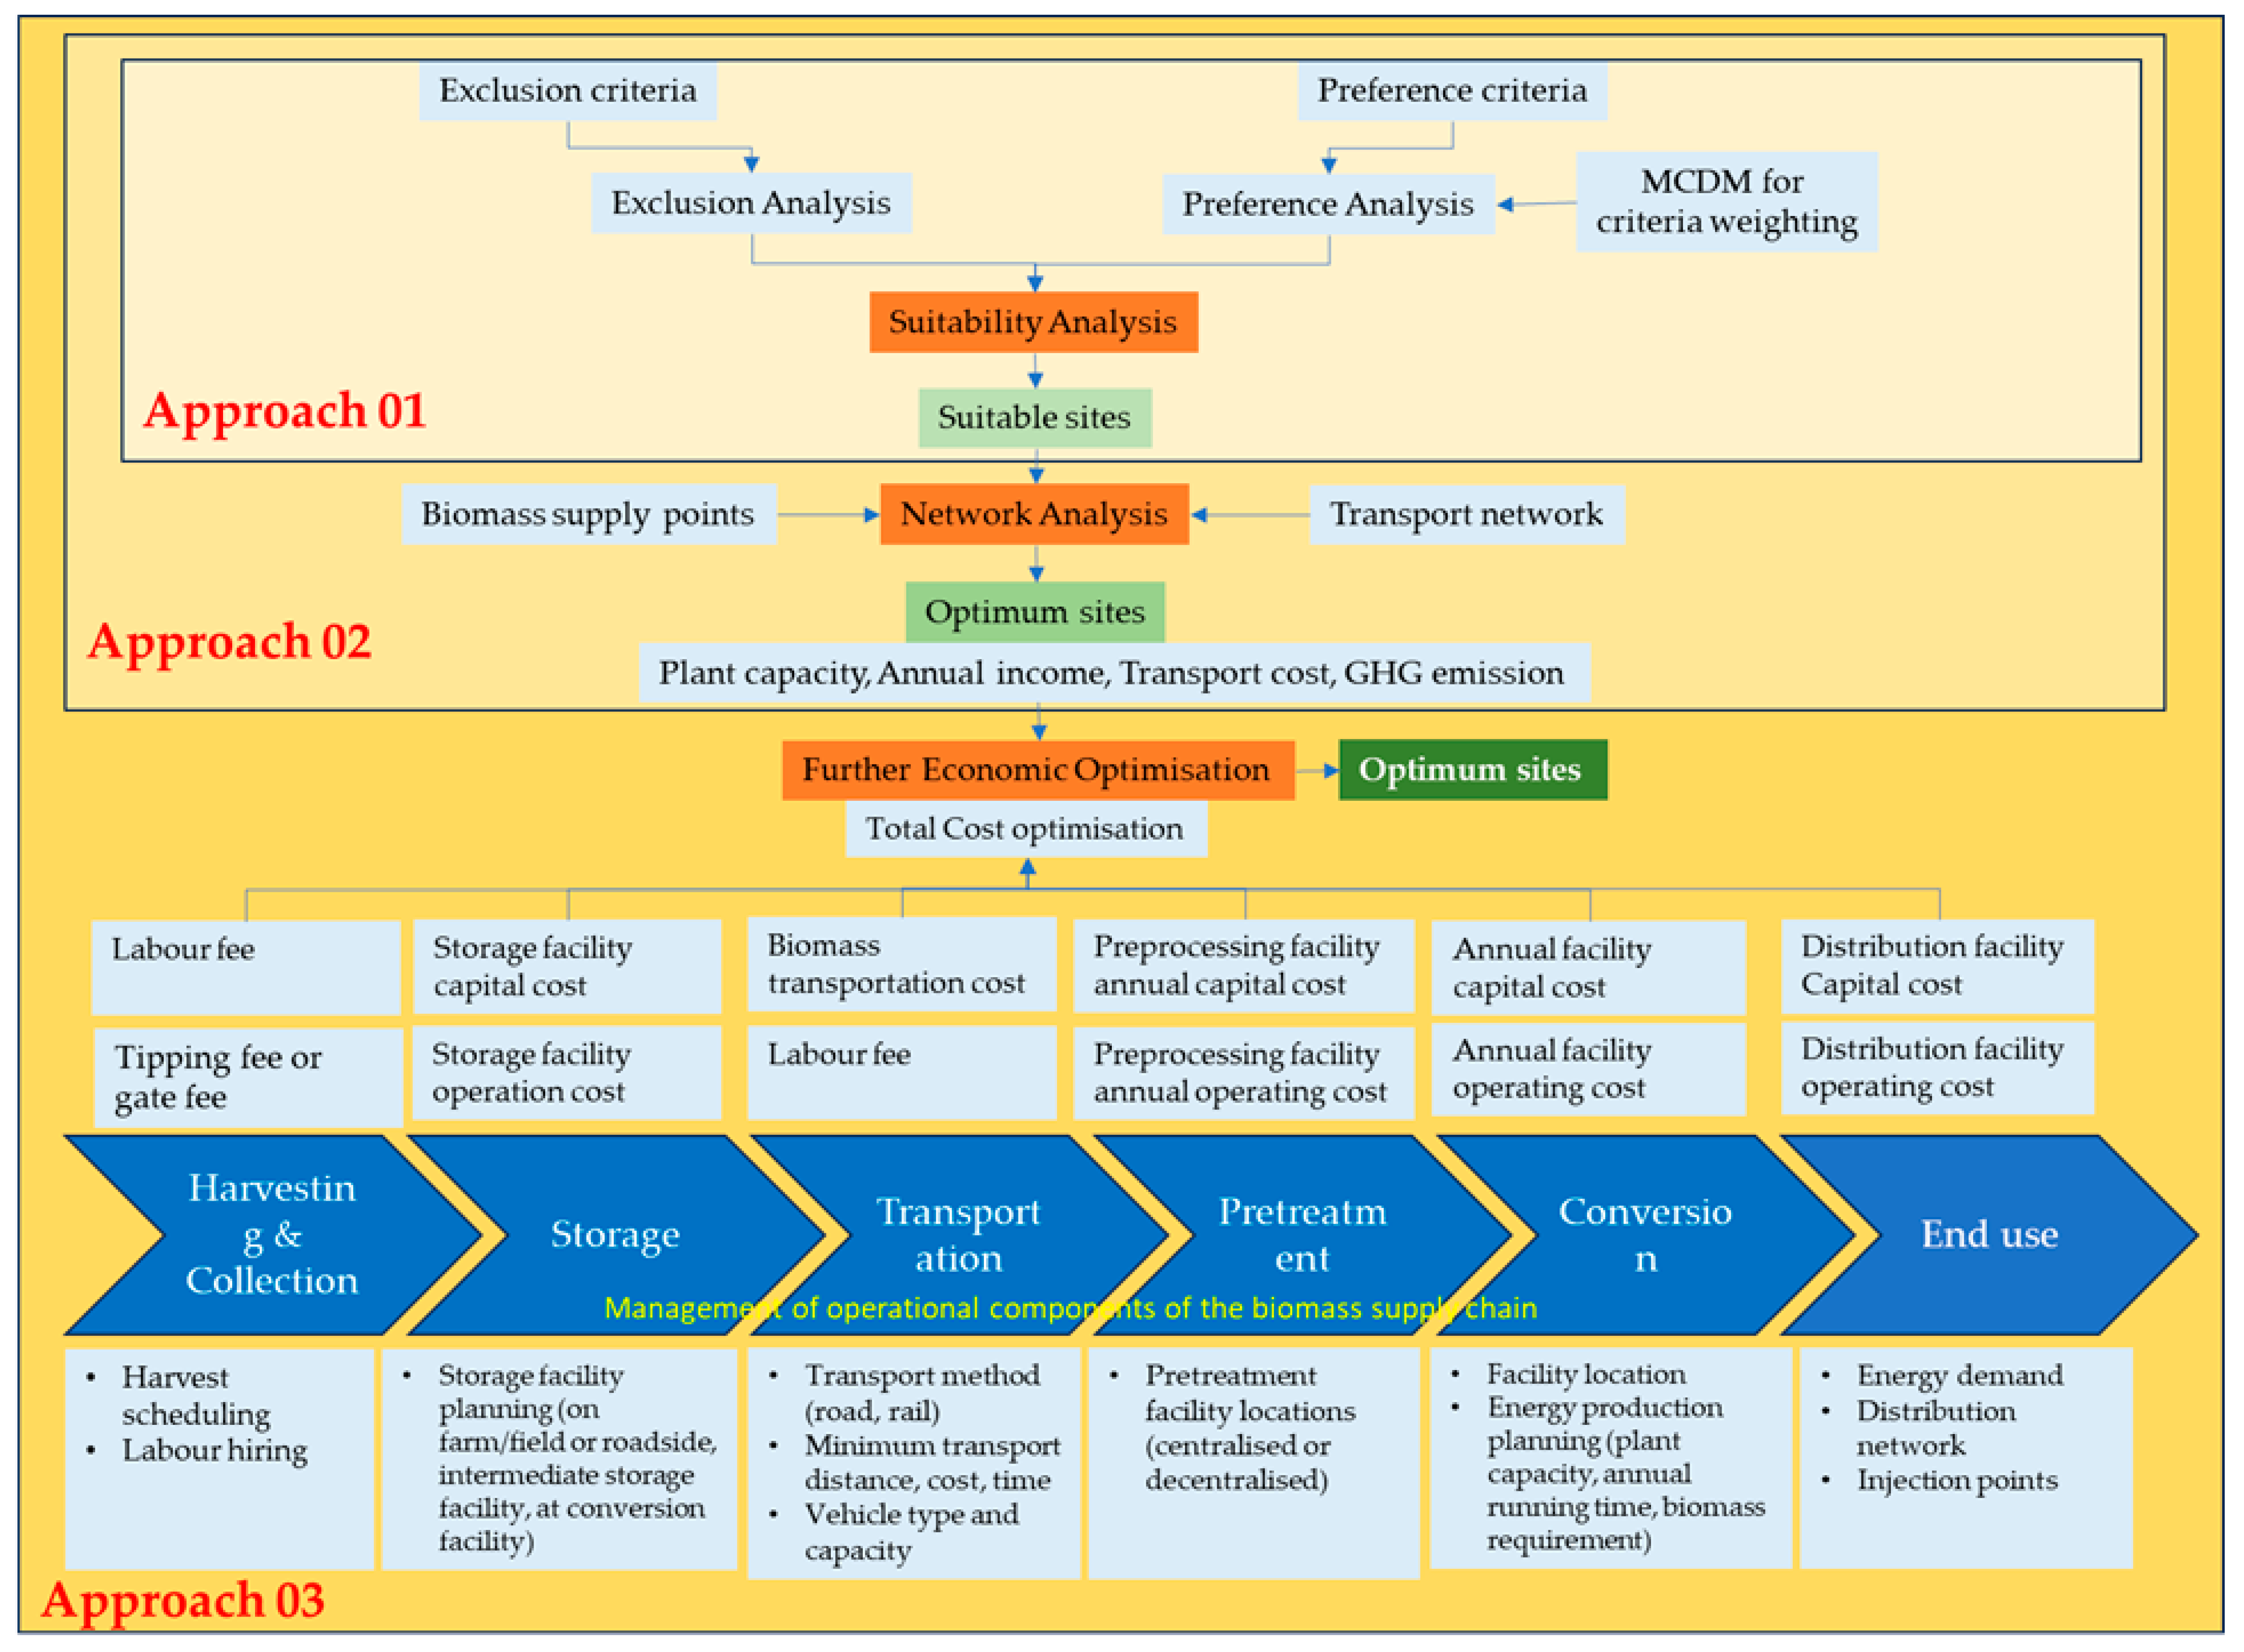
3.3.2. GIS-Based Approaches on Selecting and Optimising the Biogas Plant Locations

Different approaches have been applied to address the question: Where is the optimal location for establishing a biogas plant? The main methods applied in this field include mathematical programming, multi-criteria analysis (MCA) and the GIS [89]. Multi-criteria analysis (MCA) can be identified as an effective approach to handle the complexity of siting problems [90]. It provides a systematic way to evaluate and compare different options based on multiple criteria, considering their relative importance. MCA in a GIS environment help to capture the spatially diverse nature of real-world solutions [91,92].
This review focused only on GIS-based approaches applied to select and optimise the biogas plant siting. The geographical problem-solving capability of the GIS encourages researchers to apply the GIS in their studies to minimise uncertainties and improve decision-making. Overall, 36 articles were identified in this review that used the GIS to determine the appropriate location for establishing biogas plants. According to the review, the following two GIS-based methods are the most frequently used techniques for selecting and optimising the locations of biogas plants (Figure 7).
  • Suitability Analysis (Multi-Criteria Analysis)
  • Optimality Analysis (Network Analysis)
The process of suitability analysis is used to identify the appropriate areas based on specific socio-economic and environmental criteria, along with their relative significance. Moreover, researchers who have utilised optimality analysis often take a further step to optimise their site selection decisions by considering cost estimates. This approach involves a more thorough analysis to identify the most ideal locations while considering the project’s feasibility. Accordingly, this review identified three approaches on site selection: site selection based on suitability analysis, site selection based on suitability and network analysis and site selection based on suitability, network and further economic optimisation analysis (Figure 8 and Table 14).

Suitability Analysis

Suitability analysis aids in selecting, comparing and ranking locations or areas based on how closely they comply with the predetermined criteria. MCA has been used as the common GIS approach for suitability analysis. The main steps of suitability analysis include exclusion analysis and preference analysis [61].

Exclusion Analysis

The rules and regulations on natural and artificial protected areas, as well as geophysical and culturally significant sites, should be reflected in the suitability analysis [61]. Accordingly, exclusion analysis helps to exclude the restricted areas from the study area based on a pre-determined list of constraints. Binary values are used to make the binary maps, assigning 0 for restricted areas and 1 for available regions. Billal et al. [52] created fourteen binary maps with restricted areas and their buffer zones based on fourteen constraints. Dao et al. [69] explained the steps of exclusion analysis done using the GIS. These include identifying exclusion criteria, creating required buffers for restricted areas, converting vector layers to rasters and combining all restriction layers to obtain the final restriction map. For instance, Jayarathna et al. [61] excluded environmentally protected areas, sensitive areas, historical/cultural importance areas, built-up areas and man-made facilities with pre-defined buffers to ensure the proposed plant locations would not negatively affect these features.

Preference Analysis and Criteria Weighting

Preference analysis applies to relatively rank the most suitable sites within the study area while determining high-priority sites for establishing facility [52]. Identification of preference criteria, criteria weighting and weighted overlay analysis are the main steps in preference analysis. The selection of sustainability criteria is an important phase in the preference analysis, and selected criteria should have reliable, appropriate and practical parameters [61].
Different Multi-Criteria Decision-Making (MCDM) methods have been incorporated with GIS approaches to evaluate complex criteria. The Analytic Hierarchy Process (AHP) method was identified as a common MCDM method [60] for criteria, weighting in 50% of the reviewed articles. The AHP is a pairwise comparison of the criteria introduced by Saaty in 1980. This approach was combined with GIS multi-criteria analysis. AHP methodology has been designed to facilitate decision-makers to capture information from qualitative and quantitative aspects [70]. Dao et al. [69] used the AHP and preference analysis to set priorities and make the best decision using a series of pairwise comparisons. The authors in the above study further show the basic steps of the AHP: identify the issue and evaluation criteria; weight the criteria based on experts’ consultation and previous studies; develop the pairwise comparisons matrix; normalise the result matrix; calculate the average value to obtain the corresponding rate; calculate the consistency ratio and analyse the consistency of judgments [70].
In addition to AHP, other MCDM methods, such as ELECTRE TRI, Best Worst Method (BWM) and Full Consistency Method (FUCOM), have also been applied in various studies. The ELECTRE TRI method categorises the issues and sorts the alternatives into predetermined classes based on several factors. Dima et al. [84] applied an MCDA-GIS-based ELECTRE TRI method to evaluate suitable sites for biogas plants. Tulun et al. [82] used the FUCOM method following three steps: ranking criteria based on importance, identifying the relative priorities and calculating the criteria weights. Then, the most suitable site was selected using the weighted overlay analysis incorporating the weights calculated based on the FUCOM method. Researchers highlighted several drawbacks of expert opinion-based MCDM methods (AHP, SWARA, BWM, etc.), including the need for numerous pairwise comparisons, lengthy solution processes and issues with inconsistency [82].
After assigning the weights of each criterion, all raster layers of criteria must be superimposed into a single layer to obtain the results of preference analysis. Weighted Overlay was identified as the most common tool used for this part.

Land Suitability Analysis

Land suitability analysis is the final step of the suitability assessment that combines the results of exclusion and preference analysis. Accordingly, the result will represent the suitability index (SI) of each cell, representing a quantitative measure of suitability for locating biomass energy plants. However, the GIS allows researchers to customise the suitability assessment by combining different MCDM methods and other mathematical models according to user-preferred techniques (Table 14).

Optimality Analysis

Network analysis (NA) in GIS has become a popular approach among researchers, providing a set of optimisation tools with spatial data handling capabilities. GIS-NA provides several optimising tools, including optimal route, closest facility, service area analysis, location-allocation analysis and origin–destination analysis. The NA tools determine the service areas surrounding each potential site by analysing the road network and considering various factors such as travel time, cost and distance constraints. The locations of feedstock supply points are essential in this analysis to obtain a reliable outcome. Several articles stated the objectives of applying network analysis in their studies.
  • To identify the most suitable location for a biogas plant while minimising transportation costs among the potential sites in the study area [81];
  • To assign each biomass source to potential plants, considering all accessible roads within a specific distance, defining the biomass supply areas and avoiding the competition for biomass between biogas plants [61];
  • To minimise the distance between biomass sources and biogas facilities and maximise the profit of the entire supply chain [50].
According to Ferrari et al. [60], the main three steps of network analysis are as follows:
  • Defining the road network (geometry, road parameters: maximum speed, one- or two-way or forbidden roads);
  • Defining the origin–destination matrix (feedstock supply points and candidate sites);
  • Identifying the transport model parameters (problem type (cost function, % of market), travel setting (cutoff (maximum biomass travel distance) and maximum number of facilities).
According to the review, the most recurrent NA tool used in bioenergy site selection was the Location-Allocation Model (LAM). Location allocation is a problem-solving method based on the Hillsman theory for location problems. It involves K candidate facilities and J origin points, each with a weight of m. The algorithm aims to determine a subset of facilities P that minimises the sum of weighted distances d between each J and P [43]. Researchers and decision-makers can effectively address a wide range of challenges related to optimising biogas plant locations through this method [72]. Each biomass energy plant location has unique characteristics of biomass supply areas, biomass concentration, harvesting and collecting issues and transport distance. A GIS-based location-allocation model aids in making accurate accounts of all these factors, including identification of a biomass supply area, plant capacity, the transport distance with real road data, the transport cost, geographical transportation issues, etc. Several researchers also used the Service Area Function (SAF) of the NA tools to identify the optimal locations based on biomass availability and transport distance.
Soha et al. [20] used the location-allocation tool and its maximised capacitated coverage option to find the proper source of crop residues for AD plants in the study area. The tool fulfilled the crop residue requirements of the potential sites by allocating wheat straw or corn stalks based on the road network. Akca et al. [72] applied the LAM to identify the optimum locations for biogas plants, considering the maximum biomass transport distance of 40 km.
Mathematical models were used with GIS suitability analysis instead of applying NA tools in some research. Durmaz and Bilgen [50] used the MOMILP method to optimise the biomass supply chain by integrating the candidate biogas facility locations (selected using QGIS and AHP methods). However, the study does not mention the method applied to calculate the actual transport distance. Billal et al. [52] has used a GIS-based optimisation framework for locating waste-to-energy facilities in Canada. First, they performed suitability analysis and location-allocation analysis to determine the most appropriate sites for biogas plants. Then, they employed an MILP model integrated with GIS to minimise the per-unit electricity production costs by optimising the number, locations and sizes of the candidate sites.

3.4. Identification of Biomethane Injection Points

Decarbonising the natural gas grid through biomethane injection is a well-established concept worldwide. Although various studies have been conducted on biogas production for electricity generation, relatively few have specifically examined biogas production for biomethane injection. Only six articles in this review paid attention to biomethane grid injection. Therefore, this section summarises the methods and results of these six articles reviewed by this study.
Bedoić et al. [30] determined the potential of existing and newly added biogas plants for biomethane grid injection. Accordingly, the spatial distribution of the natural gas grid was considered for decision-making. They discovered that some existing biogas plants located within 2 km of the grid could be upgraded for biomethane production. Additionally, the above authors have conducted a site selection analysis for new biogas plants, considering feedstock availability within a 15 km radius. The new biogas plants were strategically installed in locations that directly connect to the natural gas grid, following the guidelines of the European Biogas Association. The study’s findings indicate that the proposed measures could significantly reduce carbon emissions, yielding environmental benefits 36 times greater than a business-as-usual approach.
Bidart et al. [24] evaluated a GIS-based biomass resource inventory to assess the potential use of manure and agricultural residue as substrates for generating electricity or biomethane for injection into the natural gas grid in Chile. The criteria utilised in this study are detailed in Table 15. According to the findings, the estimated potential for electricity generation from manure processing is 0.8 TWh/year, with a representative generation cost of 25 ct€ kWhel−1. In terms of biomethane, the estimated potential is 182 million Nm3/year, with a generation cost of 98 € per million British thermal unit (BTU). Additionally, the economic potential for the mono-digestion of agricultural residue is estimated at 1.1 TWh/year, with a generation cost of 15.4 ct€ kWhel−1. The potential for biomethane generation from agricultural residue is 280 million Nm3/year at a generation cost of 40 € per million BTU. However, economic modelling indicates that producing electricity is more economically advantageous than producing Bio-SNG (substitute natural gas from biomass).
O’Shea et al. [26] conducted a study to calculate the biomethane potential at the regional level in Ireland. Accordingly, 42 potential injection points on the gas transmission system were identified based on the discussions they had with GNI (Gas Networks Ireland), and the locations corresponded to above-ground installations (AGIs). The AGI locations were the nodes on the gas network where gas pressure is reduced from transmission pressures of approximately 70 bar to below 16 bar for onward delivery to distribution networks, which typically operate at 4 bar. The results indicated that total biomethane production from plants with a positive plant net present value (NPV) ranged from 3.51 PJ/year to 12.19 PJ/year, considerably less than the total resource. The potential GHG emission reduction was estimated at 74–79% compared to natural gas.
Hoo et al. [46] undertook a study to identify the optimal locations of biogas plants and the corresponding biomethane injection infrastructures. The research demonstrates that biogas generated from the AD of POME could be upgraded to biomethane, achieving a 90–97% methane content. This upgraded biomethane would then be compressed to meet the natural gas grid pressure, which ranges from 240 to 345 kilopascal (kPa) before it is injected. The study identified district gas gates as potential biomethane injection points. These points would be connected to the selected biogas plants through specific stainless-steel pipelines. The research identified between 135 and 227 potential biogas upgrading plants, which could meet approximately 40% to 67% of the residential fossil gas demand.
Keogh et al. [43] presented a novel method for incorporating seasonal variations in gas demand when assessing the economic viability of biomethane grid injection in Ireland. A grid simulation model of a representative gas distribution network was developed to determine the annual capacity for biomethane. Scenarios for maximum, minimum and no demand were analysed at a CNG filling station connected to the distribution network. The study investigated three potential locations for biomethane production and injection facilities. Additionally, a spatially explicit GIS model was created to map the distribution of feedstocks and determine transportation distances. The results indicated that the plant size required would be 115 GWh/year for maximum CNG demand, 82.2 GWh/year for minimum CNG demand and 81.8 GWh/year for no CNG demand. These outputs would replace 40%, 34% and 35% of the annual natural gas demand in the distribution network, respectively.
Siegrist et al. [51] identified the agricultural biogas production potentials for electricity, heat and biomethane at 6.3, 8.5 and 13.8 PJ/year, respectively, in Switzerland. Since there was no available information regarding the extent of the low-pressure gas grid in Switzerland, its layout had to be fully estimated using a minimum spanning tree approach. This was based on the high-pressure gas grid and the settlement areas of municipalities that have access to the national grid.
According to the review, a comprehensive study focusing on biomethane grid injection has not yet been conducted. However, researchers have employed various approaches to identify potential biomethane injection points within the natural gas grid. These decisions have been significantly influenced by the availability of spatial data related to the characteristics of the natural gas grid. Despite this, the criteria used for selecting biomethane grid injection points remain problematic.
The analysis presented in this study highlights a significant increase in GIS-based bioenergy studies from 2020, as illustrated in Figure 4 and Figure 7. Notably, GIS-based biomass assessments have shown a rising trend since 2016 (Figure 4), aligning with the adoption of the Paris Agreement on Climate Change in 2015. In comparison, site selection and optimisation approaches have demonstrated a significant upward trend beginning in 2020 (Figure 7). Furthermore, 87% of the reviewed studies were published after 2016, and 54% of the total were published since 2020, highlighting the growing interest in this area in recent years. This trend reflects the growing recognition of the GIS as a powerful tool for spatial analysis and decision-making in the bioenergy sector. Accordingly, numerous studies have employed the GIS to assess biomass potential, select and optimise bioenergy plants and evaluate transport logistics for the biomass supply chains. However, despite this growth in GIS applications for bioenergy, research specifically focusing on biomethane production and grid injection remains very limited. This gap is significant, considering that GIS tools are uniquely suited to address the spatially dependent challenges of biomethane production, such as locating optimal sites for anaerobic digestion plants, mapping the proximity of feedstock sources and assessing the feasibility of biomethane grid injection to natural gas grids. However, the growth of the biomethane sector has been influenced by various challenges such as economic barriers (high initial investment costs, lack of stable financial incentives, market competition, etc.), policy and regulatory challenges (policy fluctuations, lack of uniform standards, insufficient carbon pricing policies), infrastructure limitations (insufficient grid connectivity, biogas upgrading technology availability), feedstock availability and competition (seasonal variation of feedstocks, competition with other uses), public awareness and social acceptance and environmental challenges (methane leakage, water and energy use) [7,93,94].
For instance, in Australia, the Emissions Reduction Fund (ERF), which is designed to incentivise Australian businesses and farms to adopt technologies that can reduce GHG emissions from their activities. This increases the opportunities to deliver abatement and create Australian Carbon Credit Units (ACCUs). Currently, projects dealing with animal effluent management, electricity generation from landfill gas and domestic, commercial and industrial wastewater treatment are eligible for carbon credits under the scheme [95]. There is no methodology for agricultural biomass. This restriction limits the scope of projects that can generate carbon credits, which are a key financial incentive for the biomethane projects using agricultural wastes. However, a draft biomethane method package is being developed based on the existing ERF methodology of waste, including biomethane project activities. These biomethane projects can earn carbon credits for reducing GHG emissions when (1) biogas is captured, upgraded to biomethane and combusted and (2) biomethane is used in place of natural gas. No research has been conducted on Australia’s biomass potential for biomethane production and grid injection in this situation. In contrast, biogas upgrading and biomethane production commenced in Europe in 2011. Despite the growing biogas production across European nations (Figure 9), its main use continues to be for heat and electricity generation [96]. The results of the study are also aligned with this, showing that most European studies (58%) identified heat and electricity as the final products (Table 14). Additionally, 25% did not specify the end product, while only 12% considered biomethane as the final product. However, under the Renewable Energy Directive II (RED II) (2018) biomethane has become a key player in decarbonising the natural gas grid in Europe [97].
Accordingly, the broader challenges in the biomethane field highlight a critical need for supportive policies and stable funding mechanisms and required research initiatives for this sector. Therefore, further research is needed to explore the underlying reasons for the limited focus on biomethane grid injection studies among researchers. Furthermore, it is important to note that this review excludes biomass assessments and bioenergy plant siting studies that are based on mathematical modelling and statistical analysis. Consequently, this review focuses solely on GIS-based methods used to optimise the biomass supply chain.

4. Conclusions

This study reviewed the application of GIS-based methods in biomass potential assessments, biogas plant siting and optimisation and biomethane grid injection. A total of 57 articles were analysed, covering nine major feedstock sources, along with their respective advantages and limitations. Additionally, four distinct GIS-based approaches for feedstock assessment were identified: administrative-based, location-based, grid-based and cluster-based methods. Among these, grid-based methods were recognised as the most valuable for logistics planning, yet it has been utilised in only 23% of the reviewed studies. In contrast, administrative-based methods, used in 35% of studies, remain the most common due to their simplicity in calculating biomass potential using non-spatial data. This review also examined 13 environmental, 14 social and 11 economic criteria relevant to biomass energy plant siting, with economic factors being the most frequently considered. Site selection approaches were categorised into three types: Approach 1 (suitability analysis, used in 17 studies, but lacking logistics planning), Approach 2 (suitability and network analysis, applied in 13 studies for improved site selection and logistics planning) and Approach 3 (suitability, network and economic optimisation analysis, used in only five studies, highlighting its limited application). Additionally, the spatial evaluation of the C/N ratio in biomass assessments remains underexplored, which poses a challenge in identifying optimal co-digestion plant locations for stable anaerobic digestion. A significant research gap was identified regarding the criteria for selecting biomethane injection points in the planning of biomethane grid injection. Specifically, there is a lack of studies addressing the optimal location, technical feasibility and economic considerations for injecting biomethane into the existing natural gas infrastructure.

5. Recommendations

Based on the findings of this study, all researchers have developed their methodologies from a site selection and logistics planning perspective, with no studies considering the process optimisation of biomethane production. Future research should integrate a process-oriented approach from the initial biomass assessment stage to enhance the efficiency of biomethane plants. This includes evaluating key feedstock characteristics, such as the C/N ratio, to ensure an efficient anaerobic digestion process. Neglecting these factors may lead to misleading site selection decisions, particularly for co-digestion plants, if locations are chosen solely based on the availability of carbon-rich or nitrogen-rich biomass. Therefore, it is recommended that future biomass assessments incorporate both logistical and process-oriented perspectives to optimise biomethane production and improve the overall sustainability of the sector. Research on biomethane grid injection remains limited, which poses a challenge in developing technical criteria for determining suitable injection points. Further research is needed to establish comprehensive guidelines for efficient and sustainable biomethane injection planning. Furthermore, it is recommended to explore the underlying reasons for the limited attention on biomethane grid injection studies among researchers.

Author Contributions

T.G.M.: Conceptualisation, methodology, data collection, database development, summarising, software, validation, formal analysis, investigation, visualisation, writing original draft manuscript and revising; P.K.: Conceptualisation, methodology, visualisation, supervision, review and editing. All authors have read and agreed to the published version of the manuscript.

Funding

This research did not receive any specific grant from funding agencies in the public, commercial or not-for-profit sectors.

Data Availability Statement

The data supporting the findings of this study are available from the corresponding author upon request.

Conflicts of Interest

The authors declare that they have no known competing financial interests or personal relationships that could have appeared to influence the work reported in this paper.

Abbreviations

The following abbreviations are used in this manuscript:
GISGeographic Information System
GHGGreenhouse gas
STEPSStated Policies Scenario
EJExajoule
ADAnaerobic digestion
MTMillion tonnes
IEAInternational Energy Agency
PRISMAPreferred Reporting Items for Systematic Reviews and Meta-Analysis
MWelMegawatt electricity
kWKilowatt
PJPetajoule
DMDry matter
VSVolatile solids
MSWMunicipal solid waste
OFMSWOrganic fraction of MSW
SSSewage sludge
WWTPSWastewater treatment plant sludge
t/yearTonnes per year
C/N ratioCarbon/Nitrogen ratio
MCAMulti-criteria analysis
AHPAnalytic Hierarchy Process
NANetwork analysis
LAMLocation allocation model
SASpatial analysis
EAEuclidean allocation
CACluster Analysis
FWODFuzzy weighted Overlap Dominance
SAFService Area Function
ZSAZonal statistics analysis
VRP SolverVehicle Routing Problem Solver
BWMBest worst method
CRITICCriteria Importance Through Intercriteria Correlation
MABACMulti-attributive Border Approximation Area Comparison
MILPMixed-Integer Linear Programming

References

  1. Guo, M.; Song, W.; Buhain, J. Bioenergy and biofuels: History, status, and perspective. Renew. Sustain. Energy Rev. 2015, 42, 712–725. [Google Scholar] [CrossRef]
  2. International Energy Agency. Greenhouse Gas Emissions from Energy Data Explorer. 2024. Available online: https://www.iea.org/data-and-statistics/data-tools/greenhouse-gas-emissions-from-energy-data-explorer (accessed on 23 October 2024).
  3. International Energy Agency. Net Zero by 2050: A Roadmap for the Global Energy Sector; IEA: Paris, France, 2021; Available online: https://iea.blob.core.windows.net/assets/deebef5d-0c34-4539-9d0c-10b13d840027/NetZeroby2050-ARoadmapfortheGlobalEnergySector_CORR.pdf (accessed on 16 January 2024).
  4. International Energy Agency. World Energy Outlook 2023; IEA: Paris, France, 2023; Available online: https://iea.blob.core.windows.net/assets/614bb748-dc5e-440b-966a-adae9ea022fe/WorldEnergyOutlook2023.pdf (accessed on 16 January 2024).
  5. International Energy Agency. World Energy Outlook 2024; IEA: Paris, France, 2024; Available online: https://iea.blob.core.windows.net/assets/5e9122fc-9d5b-4f18-8438-dac8b39b702a/WorldEnergyOutlook2024.pdf (accessed on 18 January 2024).
  6. Wall, D.M.; Dumont, M.; Murphy, J. GREEN GAS: Facilitating a Future Green Gas Grid Through the Production of Renewable Gas, IEA Bioenergy Task 37; IEA Bioenergy: Paris, France, 2018; Available online: https://www.ieabioenergy.com/wp-content/uploads/2018/04/green_gas_web_end.pdf (accessed on 18 December 2023).
  7. International Energy Agency. Outlook for Biogas and Biomethane: Prospects for Organic Growth; IEA: Paris, France, 2020; Available online: https://iea.blob.core.windows.net/assets/03aeb10c-c38c-4d10-bcec-de92e9ab815f/Outlook_for_biogas_and_biomethane.pdf (accessed on 24 December 2023).
  8. ENEA Australia Pty Ltd.; Deloitte Financial Advisory Pty Ltd. Australia’s Bioenergy Roadmap: Appendix–Market Activity and Opportunities; ARENA: Sydney, Australia, 2021. Available online: https://arena.gov.au/assets/2021/11/appendix-market-activity-and-opportunities-australias-bioenergy-roadmap.pdf (accessed on 6 June 2024).
  9. International Energy Agency. Renewables 2023: Analysis and Forecast to 2028; IEA: Paris, France, 2024; Available online: https://iea.blob.core.windows.net/assets/96d66a8b-d502-476b-ba94-54ffda84cf72/Renewables_2023.pdf (accessed on 12 November 2024).
  10. Lovrak, A.; Pukšec, T.; Grozdek, M.; Duić, N. An integrated Geographical Information System (GIS) approach for assessing seasonal variation and spatial distribution of biogas potential from industrial residues and by-products. Energy 2022, 239, 122016. [Google Scholar] [CrossRef]
  11. Brahma, A.; Saikia, K.; Hiloidhari, M.; Baruah, D.C. GIS based planning of a biomethanation power plant in Assam, India. Renew. Sustain. Energy Rev. 2016, 62, 596–608. [Google Scholar] [CrossRef]
  12. Chukwuma, E.C.; Okey-Onyesolu, F.C.; Ani, K.A.; Nwanna, E.C. GIS bio-waste assessment and suitability analysis for biogas power plant: A case study of Anambra state of Nigeria. Renew. Energy 2021, 163, 1182–1194. [Google Scholar] [CrossRef]
  13. Laasasenaho, K.; Lensu, A.; Lauhanen, R.; Rintala, J. GIS-data related route optimization, hierarchical clustering, location optimization, and kernel density methods are useful for promoting distributed bioenergy plant planning in rural areas. Sustain. Energy Technol. Assess. 2019, 32, 47–57. [Google Scholar] [CrossRef]
  14. Lovrak, A.; Pukšec, T.; Duić, N. A Geographical Information System (GIS) based approach for assessing the spatial distribution and seasonal variation of biogas production potential from agricultural residues and municipal biowaste. Appl. Energy 2020, 267, 115010. [Google Scholar] [CrossRef]
  15. Jayarathna, L.; Kent, G.; O’Hara, I.; Hobson, P. A Geographical Information System based framework to identify optimal location and size of biomass energy plants using single or multiple biomass types. Appl. Energy 2020, 275, 115398. [Google Scholar] [CrossRef]
  16. Biosantech, T.A.S.; Rutz, D.; Janssen, R.; Drosg, B. 2-Biomass resources for biogas production. In The Biogas Handbook; Wellinger, A., Murphy, J., Baxter, D., Eds.; Woodhead Publishing: Sawston, UK, 2013; pp. 19–51. [Google Scholar]
  17. Gerber, P.J.; Steinfeld, H.; Henderson, B.; Mottet, A.; Opio, C.; Dijkman, J.; Falcucci, A.; Tempio, G. Tackling Climate Change Through Livestock–A Global Assessment of Emissions and Mitigation Opportunities; Food and Agriculture Organization of the United Nations (FAO): Rome, Italy, 2013. [Google Scholar]
  18. Yalcinkaya, S.; Ruhbas, Y. Spatiotemporal analysis framework for identifying emerging hot spots and energy potential from livestock manure in Turkey. Renew. Energy 2022, 193, 278–287. [Google Scholar] [CrossRef]
  19. Casas, R.; Casas, F.; Bustos, J. Design of profitable networks of biogas plants in Chile. SN Appl. Sci. 2021, 3, 1–23. [Google Scholar] [CrossRef]
  20. Soha, T.; Papp, L.; Csontos, C.; Munkacsy, B. The importance of high crop residue demand on biogas plant site selection, scaling and feedstock allocation—A regional scale concept in a Hungarian study area. Renew. Sustain. Energy Rev. 2021, 141, 110822. [Google Scholar] [CrossRef]
  21. Wang, S.; Yin, C.; Jiao, J.; Yang, X.; Shi, B.; Richel, A. StrawFeed model: An integrated model of straw feedstock supply chain for bioenergy in China. Resour. Conserv. Recycl. 2022, 185, 106439. [Google Scholar] [CrossRef]
  22. Sharmin, S.; Yabar, H.; Richards, D. Green Energy Optimization in Dinajpur, Bangladesh: A Path to Net Neutrality. Sustainability 2023, 15, 1336. [Google Scholar] [CrossRef]
  23. Havrysh, V.; Kalinichenko, A.; Brzozowska, A.; Stebila, J. Agricultural Residue Management for Sustainable Power Generation: The Poland Case Study. Appl. Sci. 2021, 11, 5907. [Google Scholar] [CrossRef]
  24. Bidart, C.; Frohling, M.; Schultmann, F. Livestock manure and crop residue for energy generation: Macro-assessment at a national scale. Renew. Sustain. Energy Rev. 2014, 38, 537–550. [Google Scholar] [CrossRef]
  25. Kulichkova, G.I.; Ivanova, T.S.; Köttner, M.; Volodko, O.I.; Spivak, S.I.; Tsygankov, S.P.; Blume, Y.B. Plant feedstocks and their biogas production potentials. Open Agric. J. 2020, 14, 219–234. [Google Scholar] [CrossRef]
  26. O’Shea, R.; Wall, D.M.; Kilgallon, I.; Browne, J.D.; Murphy, J.D. Assessing the total theoretical, and financially viable, resource of biomethane for injection to a natural gas network in a region. Appl. Energy 2017, 188, 237–256. [Google Scholar] [CrossRef]
  27. Dzene, L.; Bodescu, F. Evaluation of Biomass Availability For Biogas Production At Regional Level. Environ. Clim. Technol. 2009, 3, 54–62. [Google Scholar] [CrossRef]
  28. Akther, A.; Ahamed, T.; Noguchi, R.; Genkawa, T.; Takigawa, T. Site suitability analysis of biogas digester plant for municipal waste using GIS and multi-criteria analysis. Asia-Pac. J. Reg. Sci. 2019, 3, 61–93. [Google Scholar] [CrossRef]
  29. Safieddin, A.S.M.; Asakereh, A.; Soleymani, M. An analysis of renewable electricity generation potential from municipal solid waste: A case study (Khuzestan Province, Iran). Biomass Convers. Biorefinery 2023, 13, 89–97. [Google Scholar] [CrossRef]
  30. Bedoić, R.; Smoljanić, G.; Pukšec, T.; Čuček, L.; Ljubas, D.; Duić, N. Geospatial analysis and environmental impact assessment of a holistic and interdisciplinary approach to the biogas sector. Energies 2021, 14, 5374. [Google Scholar] [CrossRef]
  31. Hohn, J.; Lehtonen, E.; Rasi, S.; Rintala, J. A Geographical Information System (GIS) based methodology for determination of potential biomasses and sites for biogas plants in southern Finland. Appl. Energy 2014, 113, 1–10. [Google Scholar] [CrossRef]
  32. Veiga, A.P.B.; Silva, R.S.; Martins, G. Geographic Information Systems based approach for assessing the locational feasibility for biomethane production from landfill gas and injection in pipelines in Brazil. Eng. Sanit. E Ambient. 2022, 27, 41–46. [Google Scholar] [CrossRef]
  33. Rohl, M.; Roth, S.; Schutz, W.; Zehnsdorf, A.; Herbes, C. Biogas production from submerged macrophytesa case study of regional biomass potentials in Germany. Energy Sustain. Soc. 2019, 9, 1–12. [Google Scholar]
  34. Ali, M.M.; Ndongo, M.; Bilal, B.; Yetilmezsoy, K.; Youm, I.; Bahramian, M. Mapping of biogas production potential from livestock manures and slaughterhouse waste: A case study for African countries. J. Clean. Prod. 2020, 256, 120499. [Google Scholar] [CrossRef]
  35. Valenti, F.; Arcidiacono, C.; Chinnici, G.; Cascone, G.; Porto SM, C. Quantification of olive pomace availability for biogas production by using a GIS-based model. Biofuels Bioprod. Biorefin. 2017, 11, 784–797. [Google Scholar] [CrossRef]
  36. Zareei, S. Evaluation of biogas potential from livestock manures and rural wastes using GIS in Iran. Renew. Energy 2018, 118, 351–356. [Google Scholar] [CrossRef]
  37. Zubaryeva, A.; Zaccarelli, N.; Del Giudice, C.; Zurlini, G. Spatially explicit assessment of local biomass availability for distributed biogas production via anaerobic co-digestion—Mediterranean case study. Renew. Energy 2012, 39, 261–270. [Google Scholar] [CrossRef]
  38. O’Shea, R.; Kilgallon, I.; Wall, D.; Murphy, J.D. Quantification and location of a renewable gas industry based on digestion of wastes in Ireland. Appl. Energy 2016, 175, 229–239. [Google Scholar] [CrossRef]
  39. Villamar, C.A.; Rivera, D.; Aguayo, M. Anaerobic co-digestion plants for the revaluation of agricultural waste: Sustainable location sites from a GIS analysis. Waste Manag. Res. 2016, 34, 316–326. [Google Scholar] [CrossRef]
  40. Valenti, F.; Porto SM, C.; Chinnici, G.; Cascone, G.; Arcidiacono, C. Assessment of citrus pulp availability for biogas production by using a GIS-based model: The case study of an area in southern Italy. Chem. Eng. Trans. 2017, 58, 529–534. [Google Scholar] [CrossRef]
  41. Mattioli, A.; Boscaro, D.; Dalla, V.F.; Correale, S.F.; Pezzuolo, A.; Sartori, L.; Bolzonella, D. Biogas from Residual Grass: A Territorial Approach for Sustainable Bioenergy Production. Waste Biomass Valorizat. 2017, 8, 2747–2756. [Google Scholar] [CrossRef]
  42. Valenti, F.; Liao, W.; Porto SM, C. A GIS-based spatial index of feedstock-mixture availability for anaerobic co-digestion of Mediterranean by-products and agricultural residues. Biofuels Bioprod. Biorefin. 2018, 12, 362–378. [Google Scholar] [CrossRef]
  43. Keogh, N.; Corr, D.; O’Shea, R.; Monaghan RF, D. The gas grid as a vector for regional decarbonisation-a techno economic case study for biomethane injection and natural gas heavy goods vehicles. Appl. Energy 2022, 323, 119590. [Google Scholar] [CrossRef]
  44. De Sousa, L.V.; Lora, E.E.; de Lisboa, F.C.; Dovichi, F.B.; Del Olmo, O.A. Holistic assessment of Brazil’s bioenergetic potential. Biofuels Bioprod. Biorefin. 2023, 18, 675–685. [Google Scholar] [CrossRef]
  45. Uyan, M.; Ertunç, E. GIS-based optimal site selection of the biogas facility installation using the Best-Worst Method. Process Saf. Environ. Prot. 2023, 180, 1003–1011. [Google Scholar] [CrossRef]
  46. Hoo, P.Y.; Patrizio, P.; Leduc, S.; Hashim, H.; Kraxner, F.; Tan, S.T.; Ho, W.S. Optimal Biomethane Injection into Natural Gas Grid—Biogas from Palm Oil Mill Effluent (POME) in Malaysia. Energy Procedia 2017, 105, 562–569. [Google Scholar] [CrossRef]
  47. Rodrigues, C.; Rodrigues, A.C.; Vilarinho, C.; Alves, M.; Alonso, J.M. Spatial multicriteria gis-based analysis to anaerobic biogas plant location for dairy waste and wastewater treatment and energy recovery (Barcelos, NW Portugal). In Innovation, Engineering and Entrepreneurship; Springer: Cham, Switzerland, 2019; Volume 505, pp. 626–632. [Google Scholar] [CrossRef]
  48. Famoso, F.; Prestipino, M.; Brusca, S.; Galvagno, A. Designing sustainable bioenergy from residual biomass: Site allocation criteria and energy/exergy performance indicators. Appl. Energy 2020, 274, 115315. [Google Scholar] [CrossRef]
  49. Worawimut, C.; Vivanpatarakij, S.; Watanapa, A.; Wiyaratn, W.; Assabumrungrat, S. Geographical information system based planning and economic assessment of centralized and decentralized biogas plants for electricity generation. Chem. Eng. Trans. 2020, 80, 349–354. [Google Scholar] [CrossRef]
  50. Durmaz, Y.G.; Bilgen, B. Multi-objective optimization of sustainable biomass supply chain network design. Appl. Energy 2020, 272, 115259. [Google Scholar] [CrossRef]
  51. Siegrist, A.; Bowman, G.; Burg, V. Energy generation potentials from agricultural residues: The influence of techno-spatial restrictions on biomethane, electricity, and heat production. Appl. Energy 2022, 327, 120075. [Google Scholar] [CrossRef]
  52. Billal, M.M.; Sebastian, R.M.; Kumar, A. The development of an integrated GIS-based optimization framework for power generation from municipal solid waste-to-energy facilities. J. Clean. Prod. 2024, 434, 139865. [Google Scholar] [CrossRef]
  53. Ma, C.; Zhang, Y.; Ma, K. A method for determining the optimal number and location of biomass energy facilities. J. Environ. Manag. 2023, 348, 119313. [Google Scholar] [CrossRef] [PubMed]
  54. Nie, Y.; Chang, S.; Cai, W.; Wang, C.; Fu, J.; Hui, J.; Yu, L.; Zhu, W.; Huang, G.; Kumar, A.; et al. Spatial distribution of usable biomass feedstock and technical bioenergy potential in China. GCB Bioenergy 2020, 12, 54–70. [Google Scholar] [CrossRef]
  55. Bojesen, M.; Birkin, M.; Clarke, G. Spatial competition for biogas production using insights from retail location models. Energy 2014, 68, 617–628. [Google Scholar] [CrossRef]
  56. Bojesen, M.; Skov-Petersen, H.; Gylling, M. Forecasting the potential of Danish biogas production—Spatial representation of Markov chains. Biomass Bioenergy 2015, 81, 462–472. [Google Scholar] [CrossRef]
  57. Sahoo, K.; Mani, S.; Das, L.; Bettinger, P. GIS-based assessment of sustainable crop residues for optimal siting of biogas plants. Biomass Bioenergy 2018, 110, 63–74. [Google Scholar] [CrossRef]
  58. Scarlat, N.; Fahl, F.; Dallemand, J.F.; Monforti, F.; Motola, V. A spatial analysis of biogas potential from manure in Europe. Renew. Sustain. Energy Rev. 2018, 94, 915–930. [Google Scholar] [CrossRef]
  59. Hoo, P.Y.; Hashim, H.; Ho, W.S.; Yunus, N.A. Spatial-economic optimisation of biomethane injection into natural gas grid: The case at southern Malaysia. J. Environ. Manag. 2019, 241, 603–611. [Google Scholar] [CrossRef]
  60. Ferrari, G.; Marinello, F.; Lemmer, A.; Ranzato, C.; Pezzuolo, A. Network analysis for optimal biomethane plant location through a multidisciplinary approach. J. Clean. Prod. 2022, 378, 134484. [Google Scholar] [CrossRef]
  61. Jayarathna, L.; Kent, G.; O’Hara, I.; Hobson, P. Geographical information system based fuzzy multi criteria analysis for sustainability assessment of biomass energy plant siting: A case study in Queensland, Australia. Land. Use Policy 2022, 114, 105986. [Google Scholar] [CrossRef]
  62. Wang, M.M.; Ji, L.; Xie, Y.L. Strategic planning and optimal tactical management of regional bioethanol supply-chain system with high spatial resolution and uncertainties. Biofuels Bioprod. Biorefin. 2024, 18, 464–481. [Google Scholar] [CrossRef]
  63. Wang, R.; Cai, W.J.; Yu, L.; Li, W.; Zhu, L.; Cao, B.W.; Li, J.; Shen, J.X.; Zhang, S.H.; Nie, Y.Y.; et al. A high spatial resolution dataset of China’s biomass resource potential. Sci. Data 2023, 10, 1–15. [Google Scholar] [CrossRef]
  64. Zhao, G.; Jiang, P.; Zhang, H.; Li, L.; Ji, T.; Mu, L.; Lu, X.; Zhu, J. Mapping out the regional low-carbon and economic biomass supply chain by aligning geographic information systems and life cycle assessment models. Appl. Energy 2024, 369, 123599. [Google Scholar] [CrossRef]
  65. Venier, F.; Yabar, H. Renewable energy recovery potential towards sustainable cattle manure management in Buenos Aires Province: Site selection based on GIS spatial analysis and statistics. J. Clean. Prod. 2017, 162, 1317–1333. [Google Scholar] [CrossRef]
  66. Calvert, K.; Mabee, W. Spatial analysis of biomass resources within a socio-ecologically heterogeneous region: Identifying opportunities for a mixed feedstock stream. ISPRS Int. J. Geo-Inf. 2014, 3, 209–232. [Google Scholar] [CrossRef]
  67. Sliz-Szkliniarz, B.; Vogt, J. A GIS-based approach for evaluating the potential of biogas production from livestock manure and crops at a regional scale: A case study for the Kujawsko-Pomorskie Voivodeship. Renew. Sustain. Energy Rev. 2012, 16, 752–763. [Google Scholar] [CrossRef]
  68. Valenti, F.; Porto SM, C.; Chinnici, G.; Cascone, G.; Arcidiacono, C.; Dale, B.E.; Liao, W. Spatial analysis of feedstock supply and logistics to establish regional biogas power generation: A case study in the region of Sicily. Renew. Sustain. Energy Rev. 2018, 97, 50–63. [Google Scholar] [CrossRef]
  69. Dao, K.M.; Yabar, H.; Mizunoya, T. Unlocking the Energy Recovery Potential from Sustainable Management of Bio-Resources Based on GIS Analysis: Case Study in Hanoi, Vietnam. Resources 2020, 9, 133. [Google Scholar] [CrossRef]
  70. De Jesus, R.H.G.; Barros, M.V.; Salvador, R.; De Souza, J.T.; Piekarski, C.M.; De Francisco, A.C. Forming clusters based on strategic partnerships and circular economy for biogas production: A GIS analysis for optimal location. Biomass Bioenergy 2021, 150, 106097. [Google Scholar] [CrossRef]
  71. Escalante, H.; Castro, L.; Gauthier-Maradei, P.; De la Vega, R.R. Spatial decision support system to evaluate crop residue energy potential by anaerobic digestion. Bioresour. Technol. 2016, 219, 80–90. [Google Scholar] [CrossRef]
  72. Akca, M.S.; Sarikaya, O.V.; Doker, M.F.; Ocak, F.; Kirlangicoglu, C.; Karaaslan, Y.; Satoglu, S.I.; Altinbas, M. A detailed GIS based assessment of bioenergy plant locations using location-allocation algorithm. Appl. Energy 2023, 352, 121932. [Google Scholar] [CrossRef]
  73. Guido, R.E.; Rodríguez, C.R.; Javi, V.M.; Oviedo, O.A. A multicriteria GIS-based approach for mapping biomass agricultural residues availability for biopower plants. Clean Technol. Environ. Policy 2024, 26, 1989–2006. [Google Scholar] [CrossRef]
  74. Cioabla, A.E.; Ionel, I.; Dumitrel, G.A.; Popescu, F. Comparative study on factors affecting anaerobic digestion of agricultural vegetal residues. Biotechnol. Biofuels 2012, 5, 39. [Google Scholar] [CrossRef]
  75. Bertasini, D.; Battista, F.; Rizzioli, F.; Frison, N.; Bolzonella, D. Decarbonization of the European natural gas grid using hydrogen and methane biologically produced from organic waste: A critical overview. Renew. Energy 2023, 206, 386–396. [Google Scholar] [CrossRef]
  76. Labatut, R.A.; Pronto, J.L. Chapter 4—Sustainable Waste-to-Energy Technologies: Anaerobic Digestion. In Sustainable Food Waste-to-Energy Systems; Trabold, T.A., Babbitt, C.W., Eds.; Academic Press: Cambridge, MA, USA, 2018; pp. 47–67. [Google Scholar]
  77. Rajlakshmi Jadhav, D.A.; Dutta, S.; Sherpa, K.C.; Jayaswal, K.; Saravanabhupathy, S.; Mohanty, K.T.; Banerjee, R.; Kumar, J.; Rajak, R.C. Chapter 7—Co-digestion processes of waste: Status and perspective. In Bio-Based Materials and Waste for Energy Generation and Resource Management; Hussain, C.M., Kushwaha, A., Bharagava, R.N., Goswami, L., Eds.; Elsevier: Amsterdam, The Netherlands, 2023; pp. 207–241. [Google Scholar]
  78. Melis, E.; Asquer, C.; Carboni, G.; Scano, E.A. Chapter 4—Role of Cannabis sativa L. in energy production: Residues as a potential lignocellulosic biomass in anaerobic digestion plants. In Current Applications, Approaches, and Potential Perspectives for Hemp; García-Tejero, I.F., Durán-Zuazo, V.H., Eds.; Academic Press: Cambridge, MA, USA, 2023; pp. 111–199. [Google Scholar]
  79. Rolewicz-Kalinska, A.; Oniszk-Poplawska, A.; Wesolowska, J.; Rynska, E.D. Conditions for the development of anaerobic digestion technologies using the organic fraction of municipal solid waste: Perspectives for Poland. Environ. Dev. Sustain. 2016, 18, 1279–1296. [Google Scholar] [CrossRef]
  80. Nosratinia, M.; Tofigh, A.A.; Adl, M. Determining optimal locations for biogas plants: Case study of Tehran province for utilization of bovine and aviculture wastes. J. Renew. Energy Environ. 2021, 8, 36–44. [Google Scholar] [CrossRef]
  81. Metson, G.S.; Feiz, R.; Lindegaard, I.; Ranggard, T.; Quttineh, N.H.; Gunnarsson, E. Not all sites are created equal—Exploring the impact of constraints to suitable biogas plant locations in Sweden. J. Clean. Prod. 2022, 349, 131390. [Google Scholar] [CrossRef]
  82. Tulun, S.; Arsu, T.; Gurbuz, E. Selection of the most suitable biogas facility location with the geographical information system and multi-criteria decision-making methods: A case study of Konya Closed Basin, Turkey. Biomass Convers. Biorefinery 2023, 13, 3439–3461. [Google Scholar] [CrossRef]
  83. Ankathi, S.; Watkins, D.; Sreedhara, P.; Zuhlke, J.; Shonnard, D.R. GIS-Integrated Optimization for Locating Food Waste and Manure Anaerobic Co-digestion Facilities. Acs Sustain. Chem. Eng. 2021, 9, 4024–4032. [Google Scholar] [CrossRef]
  84. Dima, F.A.F.; Li, Z.F.; Mang, H.P.; Zhu, L.X. Feasibility Analysis of Biogas Production by Using GIS and Multicriteria Decision Aid Methods in the Central African Republic. Sustainability 2022, 14, 13418. [Google Scholar] [CrossRef]
  85. Chukwuma, E.C. Facility location allocation modelling for bio-energy system in Anambra State of Nigeria: Integration of GIS and location model. Renew. Energy 2019, 141, 460–467. [Google Scholar] [CrossRef]
  86. Guler, D.; Charisoulis, G.; Buttenfield, B.P.; Yomralioglu, T. Suitability modeling and sensitivity analysis for biomass energy facilities in Turkey. Clean. Technol. Envir 2021, 23, 2183–2199. [Google Scholar] [CrossRef]
  87. Yabe, N. Environmental and economic evaluations of centralized biogas plants running on cow manure in Hokkaido, Japan. Biomass Bioenergy 2013, 49, 143–151. [Google Scholar] [CrossRef]
  88. Franco, C.; Bojesen, M.; Hougaard, J.L.; Nielsen, K. A fuzzy approach to a multiple criteria and Geographical Information System for decision support on suitable locations for biogas plants. Appl. Energy 2015, 140, 304–315. [Google Scholar] [CrossRef]
  89. Zhang, F.; Johnson, D.M.; Sutherland, J.W. A GIS-based method for identifying the optimal location for a facility to convert forest biomass to biofuel. Biomass Bioenergy 2011, 35, 3951–3961. [Google Scholar] [CrossRef]
  90. Rodríguez, R.; Gauthier-Maradei, P.; Escalante, H. Fuzzy spatial decision tool to rank suitable sites for allocation of bioenergy plants based on crop residue. Biomass Bioenergy 2017, 100, 17–30. [Google Scholar] [CrossRef]
  91. Kordi, M.; Brandt, S.A. Effects of increasing fuzziness on analytic hierarchy process for spatial multicriteria decision analysis. Comput. Environ. Urban. Syst. 2012, 36, 43–53. [Google Scholar] [CrossRef]
  92. Jelokhani-Niaraki, M.; Malczewski, J. A group multicriteria spatial decision support system for parking site selection problem: A case study. Land. Use Policy 2015, 42, 492–508. [Google Scholar] [CrossRef]
  93. Nevzorova, T.; Kutcherov, V. Barriers to the wider implementation of biogas as a source of energy: A state-of-the-art review. Energy Strat. Rev. 2019, 26, 100414. [Google Scholar] [CrossRef]
  94. Franco, A.C.; Franco, L.S.; Tesser, D.P.; Salvador, R.; Piekarski, C.M.; Picinin, C.T.; Puglieri, F.N. Benefits and barriers for the production and use of biomethane. Energy Sources Part A Recovery Util. Environ. Eff. 2021, 1–17. [Google Scholar] [CrossRef]
  95. Clean Energy Regulator. Biomethane Method Package 2022—Simple Method Guide: User Guide for Biomethane Projects. 2022. Available online: https://cer.gov.au/document_page/biomethane-method-package-simple-method-guide (accessed on 26 January 2025).
  96. Swinbourn, R.; Li, C.; Wang, F. A Comprehensive Review on Biomethane Production from Biogas Separation and its Techno-Economic Assessments. ChemSusChem 2024. [Google Scholar] [CrossRef] [PubMed]
  97. European Biogas Association. Transparency Register: 18191445640-83; European Biogas Association: Brussels, Belgium, 2021; Available online: https://www.europeanbiogas.eu/wp-content/uploads/2021/11/Renewable-Energy-Directive_EBA-Position.pdf (accessed on 26 January 2025).
  98. International Energy Agency. Biomethane: A Global Stocktake; IEA: Paris, France, 2024; Available online: https://iea.blob.core.windows.net/assets/33c29a6e-a2f2-4e20-9fa1-e057263c893a/IEA_Biomethanewebinar_GergelyMOLNAR.pdf (accessed on 26 January 2025).
Figure 1. Estimated annual biomethane potential from agricultural wastes and distribution of natural gas transmission pipelines. Source: [4].
Energies 18 00734 g001
Figure 2. Different Feedstock types found in studied articles.
Energies 18 00734 g002
Figure 3. Different feedstock types included in biomass assessments of reviewed articles and their regional distribution.
Energies 18 00734 g003
Figure 4. Different GIS-based approaches used for biomass assessments of reviewed articles.
Energies 18 00734 g004
Figure 5. Location-based approach for biomass assessment. Source: [46].
Energies 18 00734 g005
Figure 6. Cluster-based approach for biomass assessment. Source: [67].
Energies 18 00734 g006
Figure 7. GIS-based applications on biogas plant site selection.
Energies 18 00734 g007
Figure 8. Different approaches on siting the location of biomass energy plants.
Energies 18 00734 g008
Figure 9. Biomethane production by region 2013–2023. Source: [98].
Energies 18 00734 g009
Table 1. Inclusion and exclusion criteria adopted in this review.
CriteriaIncludeExclude
Timeline and publication source2008–2024Articles published in conference/seminar proceedings and non-peer-reviewed papers.
LanguageResearch papers published in English.Papers published in other languages.
MethodologyArticles used GIS-based methods.Mathematical modelling and statistical analysis.
DataStudies based on spatial data.Studies based on non-spatial data.
Table 2. Number of articles used to address each objective.
Review ObjectivesNumber of Articles
1. To review GIS-based applications on biomass assessment 57
2. To review GIS-based methods used for selecting or optimising biogas plant locations36
3. To review the GIS application for facilitating biomethane grid injection06
Table 3. Types of crop biomasses used as feedstocks for biogas production reported in the reviewed articles.
Corn/Maize Green onion wastePalm Papaya waste
Wheat BeansOliveBanana stem waste
Oats LentilsSoybeansTricale
Rye PeasPeanutTapicoa
Sorghum ChickpeasRapeseedCotton
TriticaleBeet leavesSesame seedSugarcane
BarleyGrapesSunflowerSugar beet
Rice CitrusPotatoesTobacco
QuinoaTomatoGrass
Table 4. Methane yields obtained from various energy crops used as feedstock in biogas plants. Source: [25].
Energy CropMethane Yield
(m3/tVSadded) 1
Energy CropMethane Yield (m3/tVSadded)
Maize (whole crop)205–450Sorghum207–387
Wheat (grain)384–426Peas390
Oats (grain)250–295Sunflower154–400
Rye (grain)283–492Potatoes276–400
Grass298–467Sugar beet236–381
Barley353–658Straw242–324
Triticale337–555Leaves417–453
1 m3/tVSadded—m3 per tonne volatile solids (VS) added.
Table 5. Different industrial by-products used in reviewed articles.
Industrial TypeNumber of Articles
Sugar mill residues6
Slaughterhouse waste6
Olive industry by-products4
Citrus processing residues3
Grain mill residues3
Milk-processing waste3
Other food industrial residues3
Rapeseed-processing residues2
Wine industry residues2
Palm oil mill effluent2
Fique bagasse1
Table 8. Summary of the articles that used grid-based analysis for biomass assessment in this review.
Study ScaleGIS MethodsFeedstock Types StudiedGrid SizeReference
1NationalSpatial analysisAgricultural residues (multi crops); livestock; food and garden; forest biomass; grass residues, shrubbery residues, energy crop (sweet sorghum)1 km × 1 km[54]
2NationalSpatial analysisAgricultural residues (multi crops); livestock; food and garden1 km × 1 km[14]
3RegionalSpatial analysisAgricultural residues (single crop); forest biomass (softwood sawmill residues, softwood forest harvest residues, softwood pulp logs)1 km × 1 km[15]
4NationalSpatial analysisLivestock1 km × 1 km[55]
5NationalSpatial analysisLivestock1 km × 1 km[56]
6RegionalRaster analysisAgricultural residues (multi crops)30 m × 30 m[57]
7NationalSpatial analysisLivestock1 km × 1 km[58]
8RegionalSpatial analysisAgricultural residues (single crop); livestock; food waste10 km × 10 km[59]
9RegionalSpatial analysisAgricultural residues (multi crops); livestock1 km × 1 km[60]
10RegionalSpatial analysisAgricultural residues (single crop); livestock; food and garden; forest waste (native forestry residues, plantation softwood residues), urban waste (biosolids, solid waste)1 km × 1 km[61]
11RegionalSpatial AnalysisAgricultural residues (multi crops)3 km × 3 km[62]
12NationalSpatial AnalysisAgricultural residues (multi crops); forestry residues; energy crops1 km × 1 km[63]
13RegionalSpatial AnalysisAgricultural residues (multi crops)1.2 km × 1.2 km[64]
Table 9. Summary of the articles used cluster-based analysis for biomass assessment in this review.
Study ScaleGIS MethodsFeedstock Types StudiedReference
1RegionalSpatial analysis, Kernel DensityAgricultural residues (multi crops); livestock; food and garden; WWTP; industrial waste[31]
2RegionalSpatial mapping, Spatial Statistics (Incremental Spatial Autocorrelation), Hotspot Analysis Livestock[65]
3RegionalSpatial Analysis, Zonal Statistics Agricultural residues (multi crops); forest biomass; underutilised round-wood, grassland residues[66]
4RegionalSpatial analysis, Focal Statistic-sum tool Agricultural residues (multi crops); livestock[67]
5Regionalheatmap (hotspot analysis)Agricultural residues (multi crops); livestock; food industrial by-products (citrus processing plants, olive farms, dairy processing plants)[68]
6RegionalSpatial analysis, Kernel DensityLivestock; sewage sludge; biowaste (municipal, shops, tourist centres, vocational schools)[13]
7RegionalCluster analysis, spatial statisticsLivestock[69]
8RegionalCluster analysis (GIS, R)Livestock[70]
9RegionalNeighborhood functions (focal statistics)Agricultural residues (multi crops)[71]
10NationalCluster AnalysisAgricultural residues (multi crops); livestock[23]
11RegionalSpatial Analysis, Kernel DensityLivestock; sewage sludge[72]
12RegionalSpatial Analysis, Cluster AnalysisAgricultural residues (multi crops)[73]
Table 10. Advantages and disadvantages of GIS-based methods of biomass assessment.
MethodAdvantagesDisadvantages
Admin-basedEasy to calculate using non-spatial data.Actual spatial distribution cannot be presented.
Location-basedProvide the precise locations of biomass resources.It cannot be applied to area-based biomass sources such as crop residues.
Cluster-basedDensely distributed areas of biomass can be identified. Output raster does not represent the exact locations and quantities of biomass.
Grid-basedCan apply for multiple biomass assessments.Low-resolution grid size will affect the results.
Table 11. The list of environmental criteria used in reviewed articles.
Environmental CriteriaSuitabilityCriteria TypeExcluded Buffer (m) DistanceReferences
MinimumMaximum
Environmental protected/sensitive areas (Nature reserves, forests, etc.)BooleanExclusive505000[12,22,29,36,37,39,47,48,50,52,53,57,61,65,67,69,71,72,73,80,81,82,83]
WaterbodiesBooleanExclusive301000[12,22,28,29,36,37,39,47,48,50,53,57,60,61,62,65,67,69,70,71,72,73,82,83,84,85,86]
WetlandsBooleanExclusive501000[12,28,48,50,52,53,57,72,73]
Coastal areasBooleanExclusive1003000[29,50,72]
Soil conservation areasFuzzySelective [71,84]
Nitrate vulnerable zoneFuzzySelective [60]
Wind directionFuzzySelective [81]
SlopeFuzzySelective<5% 20%[12,22,28,29,37,47,48,52,53,57,60,61,62,69,73,80,82,84,85,86,87]
AltitudeFuzzySelective<500 m a.s.l *[37,47,48,53,80]
FloodplainsBooleanExclusive501000[12,22,28,29,36,57,60,67,69,71,72,85]
Landslide areas/Mass movement areasFuzzySelective [60,71]
Volcanic hazard areasBooleanExclusive [71]
Mining areasBooleanExclusive1000[52,57,61,71,72,73,80]
* m a.s.l.: Altitude in metres above sea level.
Table 12. The list of economic criteria used in reviewed articles.
Economic CriteriaSuitabilityCriteria TypeReferences
Biomass potentialFuzzySelectiveAll articles
Seasonality of biomass availability [10,31,57,60,61,83]
Distance to access roadsFuzzySelectiveAll articles
Distance to railwaysFuzzySelective[29,36,37,52,57,60,61,67,69,86]
Distance to power lineFuzzySelective[12,22,28,37,45,47,52,61,67,72,73,80,81,82,83]
Distance to gas pipelinesFuzzySelective[31,37,47,52,57,61,67,70,73,80]
Energy demandFuzzySelective[61]
Workforce potential/unemployment rateFuzzySelective[48,61]
Land valueFuzzySelective[28]
Organic carbon in the soilFuzzySelective[60]
Transport costFuzzySelective[53]
Table 13. The list of social criteria used in reviewed articles.
Social CriteriaSuitabilityCriteria TypeExcluded Buffer (m) References
Minimum Maximum
Built-up areasBooleanExclusive3005000 [22,29,36,47,48,61,67,72,80,81,83,84]
Settlements (urban/rural)BooleanExclusive30 2000 [12,22,28,29,39,45,47,50,52,53,57,60,62,65,69,70,72,73,80,81,82,84,85,86]
Distance to public and commercial placesBooleanExclusive1000[22,28,52,65,69,72,81,83,84]
AirportsBooleanExclusive5001000[29,36,52,61,69,81]
Military zonesBooleanExclusive [81]
Power/water/pump stationBooleanExclusive100 500 [22,47,52,61,69,82]
Industrial areasBooleanExclusive [28,37,47,48,60,72,73,81,82,84]
Population density/exposedFuzzySelective [48,53,60,61,86,88]
GDP per capitaFuzzySelective [48,60]
Agricultural landsFuzzySelective50[28,29,37,48,50,72]
Arable landsFuzzySelective [48,53]
Land use/land cover (classes)FuzzySelective [10,45,47,52,60,61,71,82,83,84,87]
Archeological/Cultural sitesBooleanExclusive50[37,50,53,61]
Visual impactFuzzySelective [60,61]
Table 14. GIS application for the selection of biogas plant sites.
CountryMain ApproachTechniquesMinimum Transport Distance or Distance from the RoadNumber of Suitable SitesConsidered End-ProductReference
1PolandApproach 01: Suitability analysisSA, EA40 km41Electricity; biomethane injection; heat[67]
2ItalyApproach 01: Suitability analysisAHP, MCA-Suitable areasElectricity[37]
3FinlandApproach 02: Optimality analysisSA, NA10, 40 km49Biomethane injection[31]
4DenmarkApproach 02: Optimality analysisp-median solver, LAM30 km10-[55]
5DenmarkApproach 02: Optimality analysisAHP, FWOD, LAM30–40 km20CHP[88]
6ColombiaApproach 01: Suitability analysisFAHP, MCA, TP25 km168-[71]
7ChileApproach 01: Suitability analysisAHP, map algebra, MCA-178-[39]
8BangladeshApproach 01: Suitability analysisAHP, MCA -1Electricity[28]
9ArgentinaApproach 01: Suitability analysisSA, SS20 km *90, 46, 39Electricity[65]
10NigeriaApproach 02: Optimality analysisLAM, OF10 km3-[85]
11United StatesApproach 02: Optimality analysisMCIEA, LAM50 km1 to 25-[57]
12ItalyApproach 01: Suitability analysisSA-4Electricity[68]
13NigeriaApproach 01: Suitability analysisAHP, MCA-Suitable areasElectricity[12]
14TurkeyApproach 03: Optimality analysisOF, SA, AHP, MOMILP60 and 40 km12Electricity[50]
15ItalyApproach 02: Optimality analysisAHP, MCA, NA-3Electricity[48]
16United StatesApproach 03: Optimality analysisNA, OF, MILP13 miles1Electricity[83]
17BrazilApproach 01: Suitability analysisAHP, CA, MCA15 km *2-[70]
18TurkeyApproach 01: Suitability analysisBWM, FMCA, WLC-Suitable areas-[86]
19CroatiaApproach 01: Suitability analysisSM20 km *2CHP[10]
20IranApproach 01: Suitability analysisAHP, MCA10 km *Suitable areas-[80]
21HungaryOptimality analysis (suitability analysis is not included)LAM40 kmSuitable Livestock farms-[20]
22Central African RepublicApproach 01: Suitability analysisELECTRE TRI, MCDA-1Electricity[84]
23ItalyApproach 02: Optimality analysisAHP, MCA, LAM30 km93Biomethane injection[60]
24AustraliaApproach 02: Optimality analysis AHP, heat map, FMCA, SAF, ZSA40 km57Electricity[61]
25SwedenApproach 02: Optimality analysisSM, Modified optimisation model-105-[81]
26SwitzerlandApproach 02: Optimality analysisSA, LAM20 kmSuitable areasElectricity; heat; biomethane[51]
27IranApproach 01: Suitability analysisFAHP, MCA-Suitable areasElectricity[29]
28BangladeshApproach 01: Suitability analysisAHP, MCA-21Electricity[22]
29TurkeyApproach 01: Suitability analysisCRITIC, MABAC, FUCOM, MCA-1-[82]
30Turkey Approach 02: Optimality AnalysisAHP, VRP solver, LAM40 km, 100 km5, 14, 24Electricity[72]
31CanadaApproach 03: Optimality Analysis AHP, MCA, LA, MILP100 km30Electricity[52]
32ArgentinaApproach 03: Optimality AnalysisCA, MCA, Simulation60 km5Electricity[73]
33ChinaApproach 02: Optimality AnalysisAHP, MCA, LAM40 km30Heat[53]
34TurkeyApproach 01: Suitability AnalysisBWM, MCA-Suitable areas-[45]
35ChinaApproach 03: Optimality AnalysisFMCA, TSP, CCP, MILP50 km6Biofuel[62]
36ChinaApproach 02: Optimality AnalysisSA, NA, SAF-1-[64]
* In the suitability analysis, distance from the road network was considered instead of calculating the actual transport distance from the biogas plant to the feedstock supply point. It helped only to establish the plant in an area with sufficient transport facilities.
Spatial Analysis (SA), Euclidean Allocation (EA), Analytic Hierarchy Process (AHP), Multi-Criteria Analysis (MCA), Multi-Criteria Decision Analysis (MCDA), Network Analysis (NA), Location-Allocation Model (LAM), Fuzzy Weighted Overlap Dominance (FWOD), Thiessen Polygon (TP), Fuzzy AHP (FAHP), Spatial Statistics (SS), Spatial Mapping (SM), Objective Function (OF), Multi-Criteria Inclusion–Exclusion Analysis (MCIEA), Cluster Analysis (CA), Best Worst Method (BWM), Weighted Linear Combination (WLC), Zonal Statistical Analysis (ZSA), Criteria Importance Through Intercriteria Correlation (CRITIC), Multi-Attributive Border Approximation Area Comparison (MABAC) method, Full Consistency Method (FUCOM), Mixed-Integer Linear Programming (MILP), Multi-Objective Mixed Integer Linear Programming Model (MOMILP), Service Area Function (SAF), Vehicle Routing Problem Solver (VRP Solver), Two-stage Stochastic Programming (TSP) and Chance-Constrained programming (CCP).
Table 15. GIS-based applications on biomethane injection projects.
Criteria for Biomethane Injection PointsMaximum Distance from Natural Gas Grid to Biogas PlantsNetwork PressureCountryReference
Distance to biogas plants2 km-Croatia[30]
Digester, annual operation and maintenance cost of digester upgrading unit, annual operation and maintenance cost upgrading injection into the net, 45 bar maximum network pressure and 1 km length, annual operation and maintenance cost of injection-45 bar max.Chile[24]
Network pressure-the minimum pressure in excess of 16 barIreland[26]
Natural gas grid and district gas gates, gas demand--Malaysia[46]
Gas demand and seasonal variation at Compressed Natural Gas (CNG) station, Network pressure 3.9 barg.Ireland[43]
Network pressure1 km-Switzerland[51]
Disclaimer/Publisher’s Note: The statements, opinions and data contained in all publications are solely those of the individual author(s) and contributor(s) and not of MDPI and/or the editor(s). MDPI and/or the editor(s) disclaim responsibility for any injury to people or property resulting from any ideas, methods, instructions or products referred to in the content.

