
Influence of Non-Uniform Airflow on Two-Phase Parallel-Flow Heat Exchanger in Data Cabinet Cooling System


Abstract
1. Introduction
2. Experiment Method
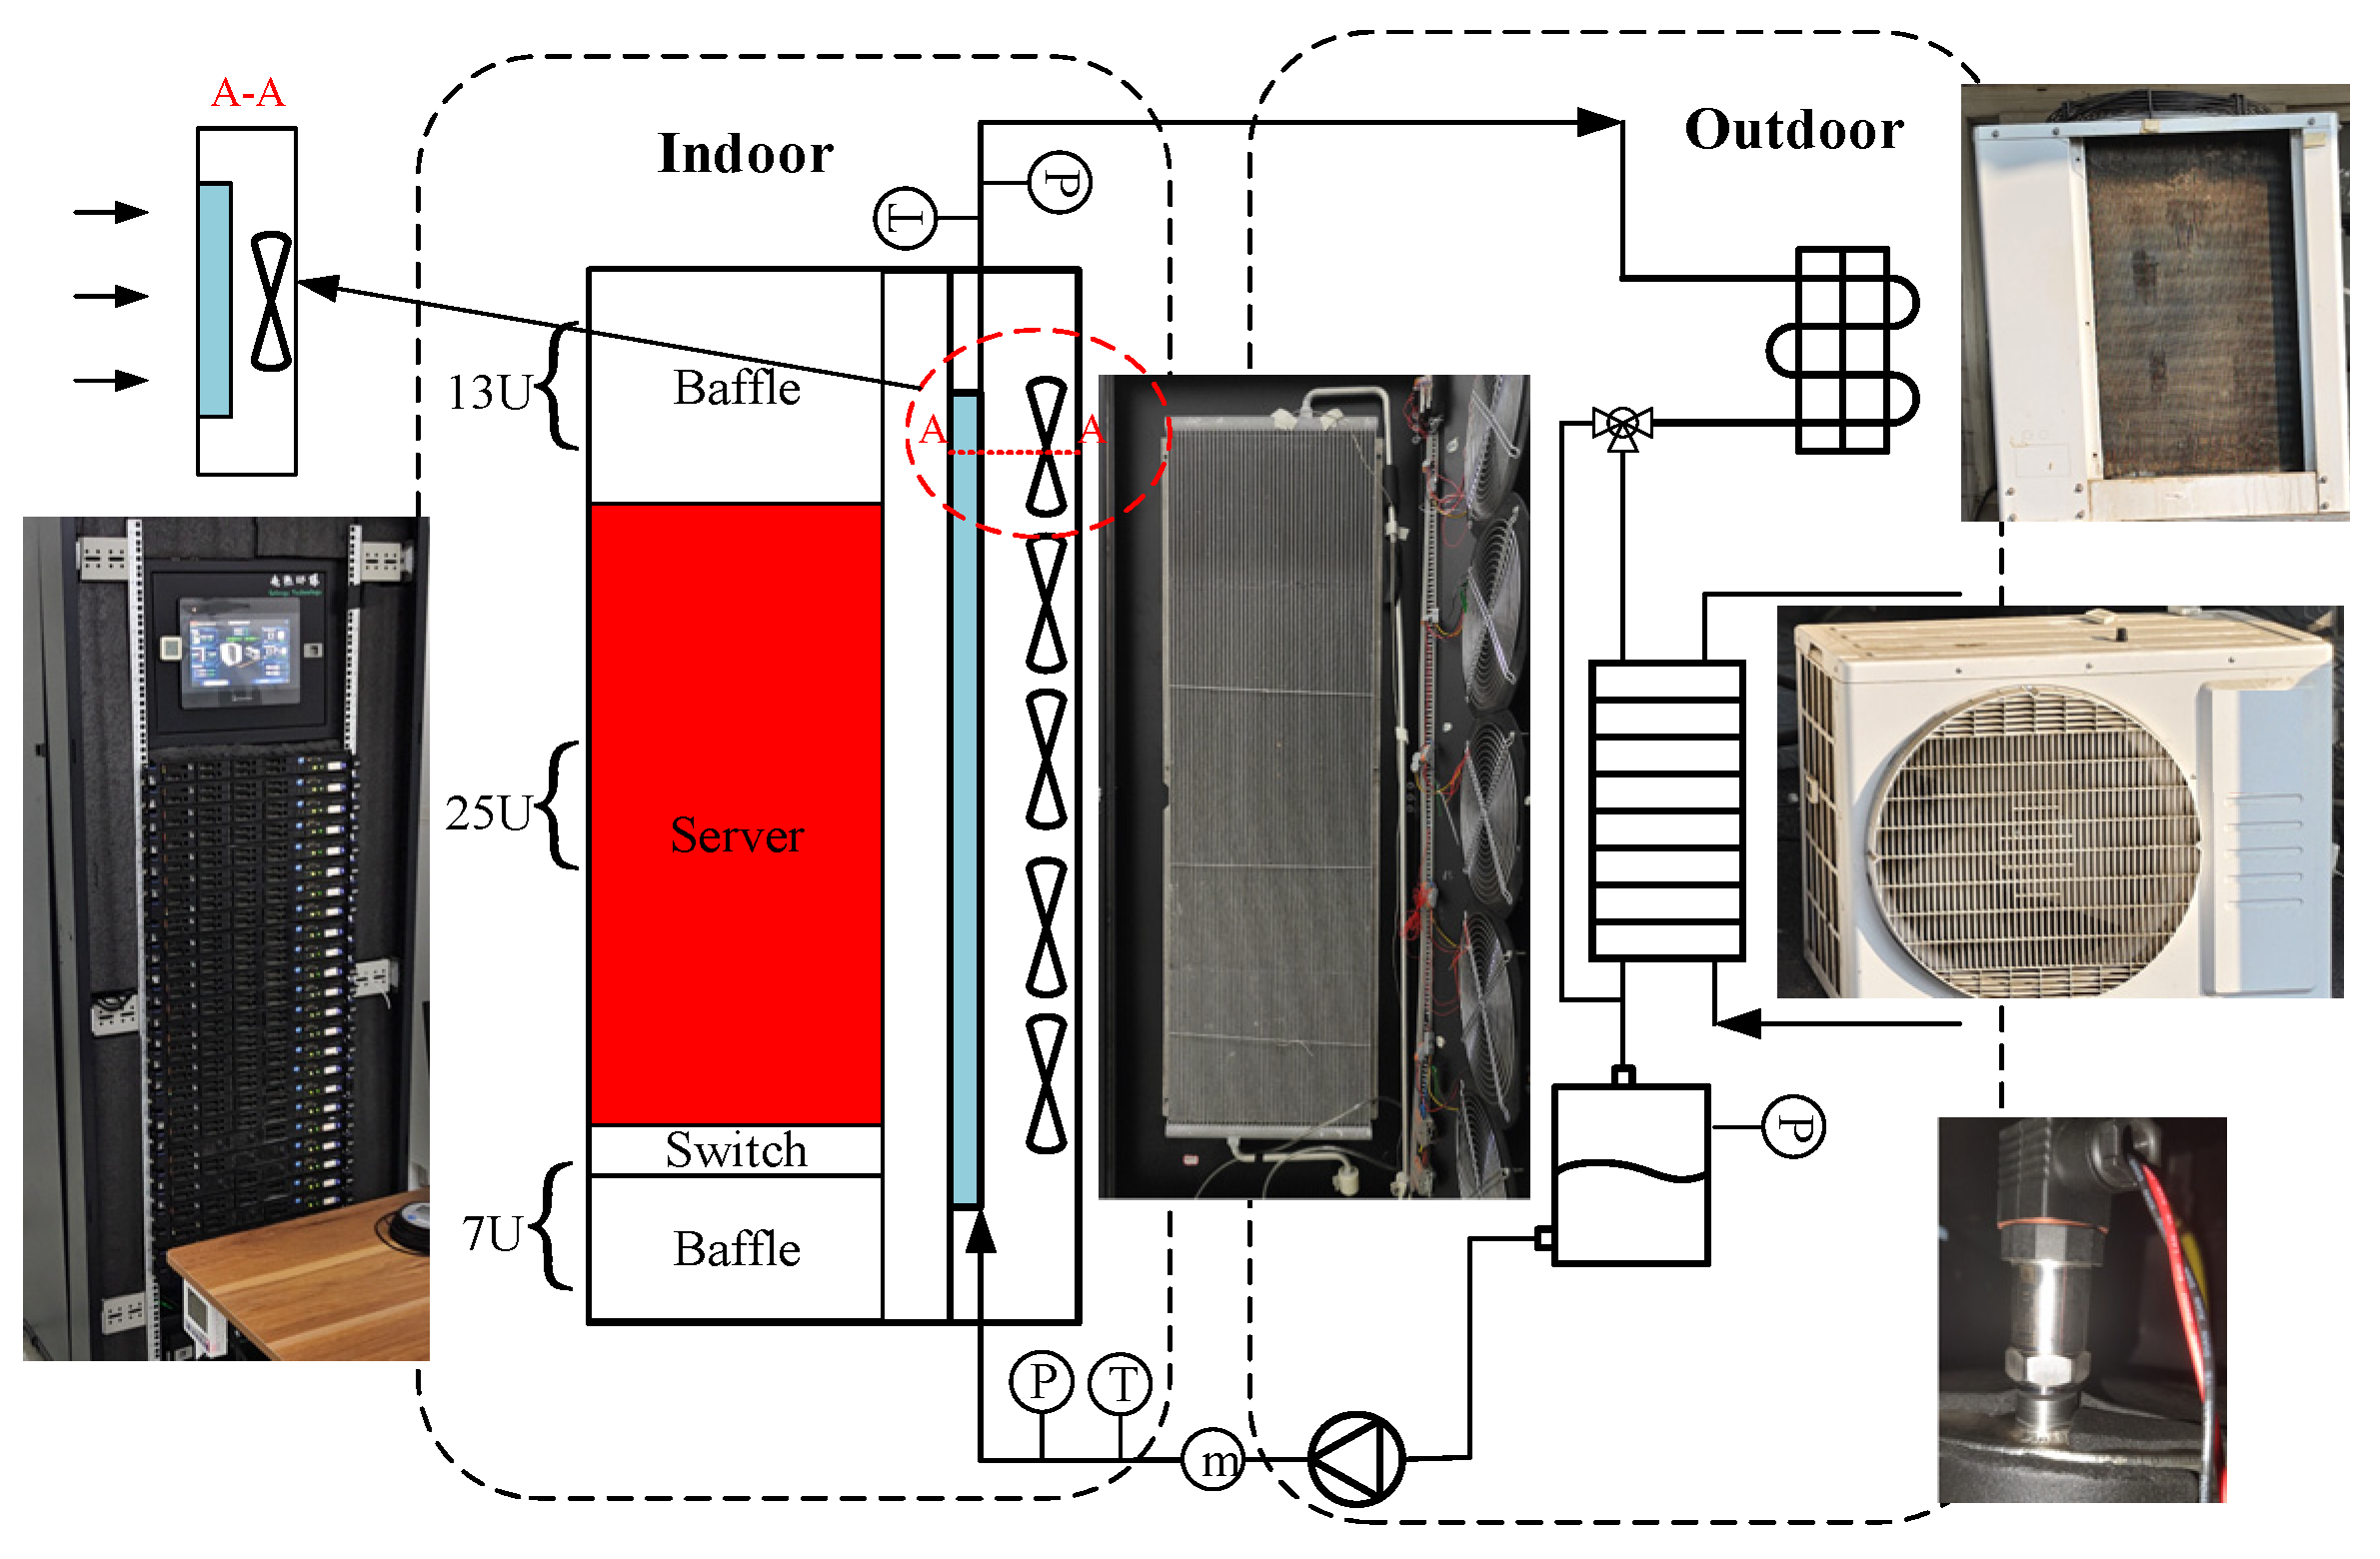
2.1. Experimental System Description
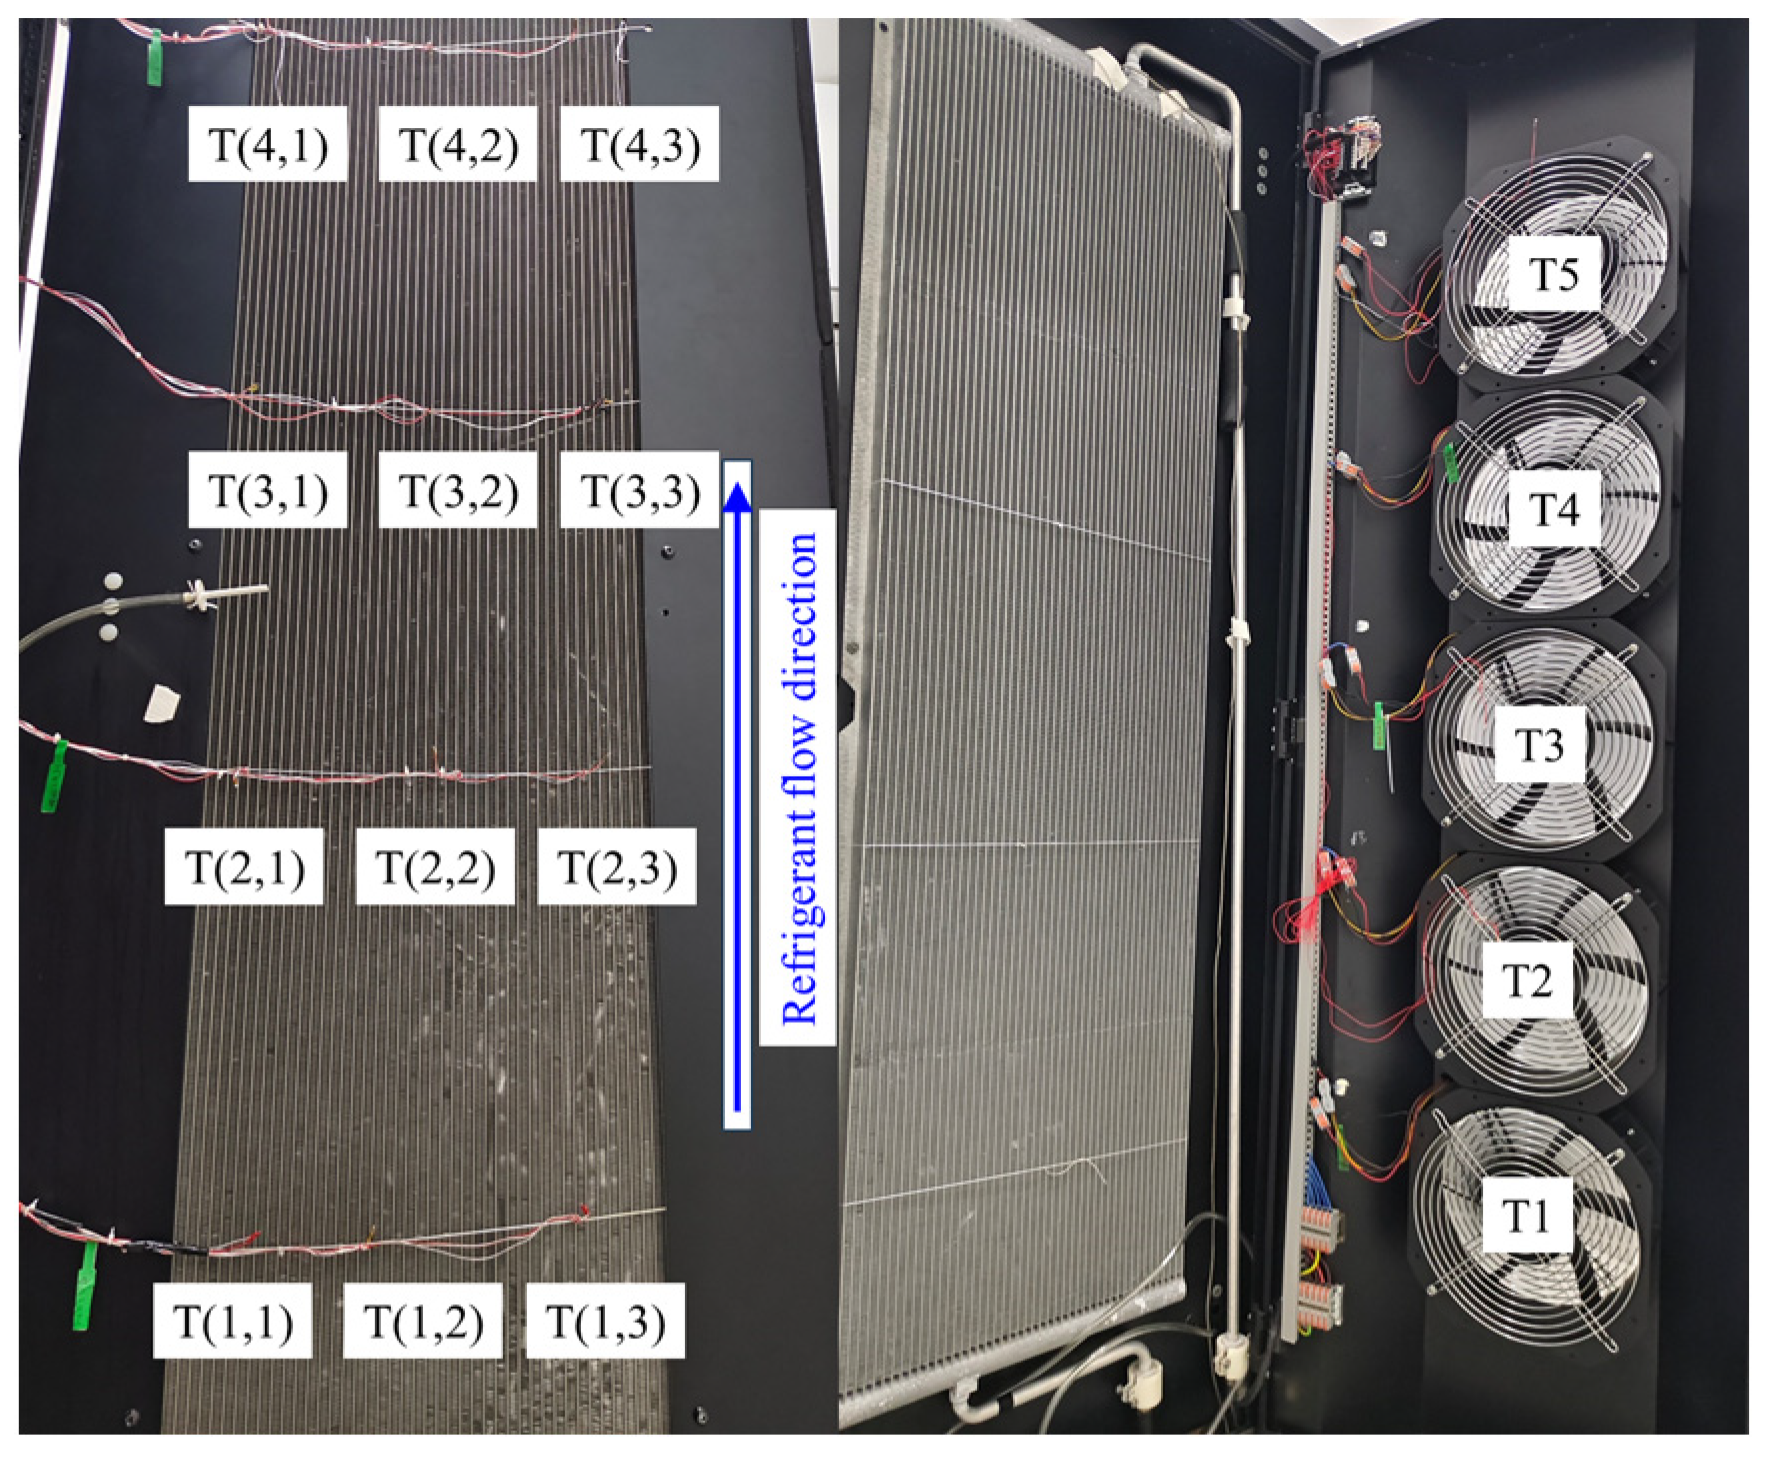
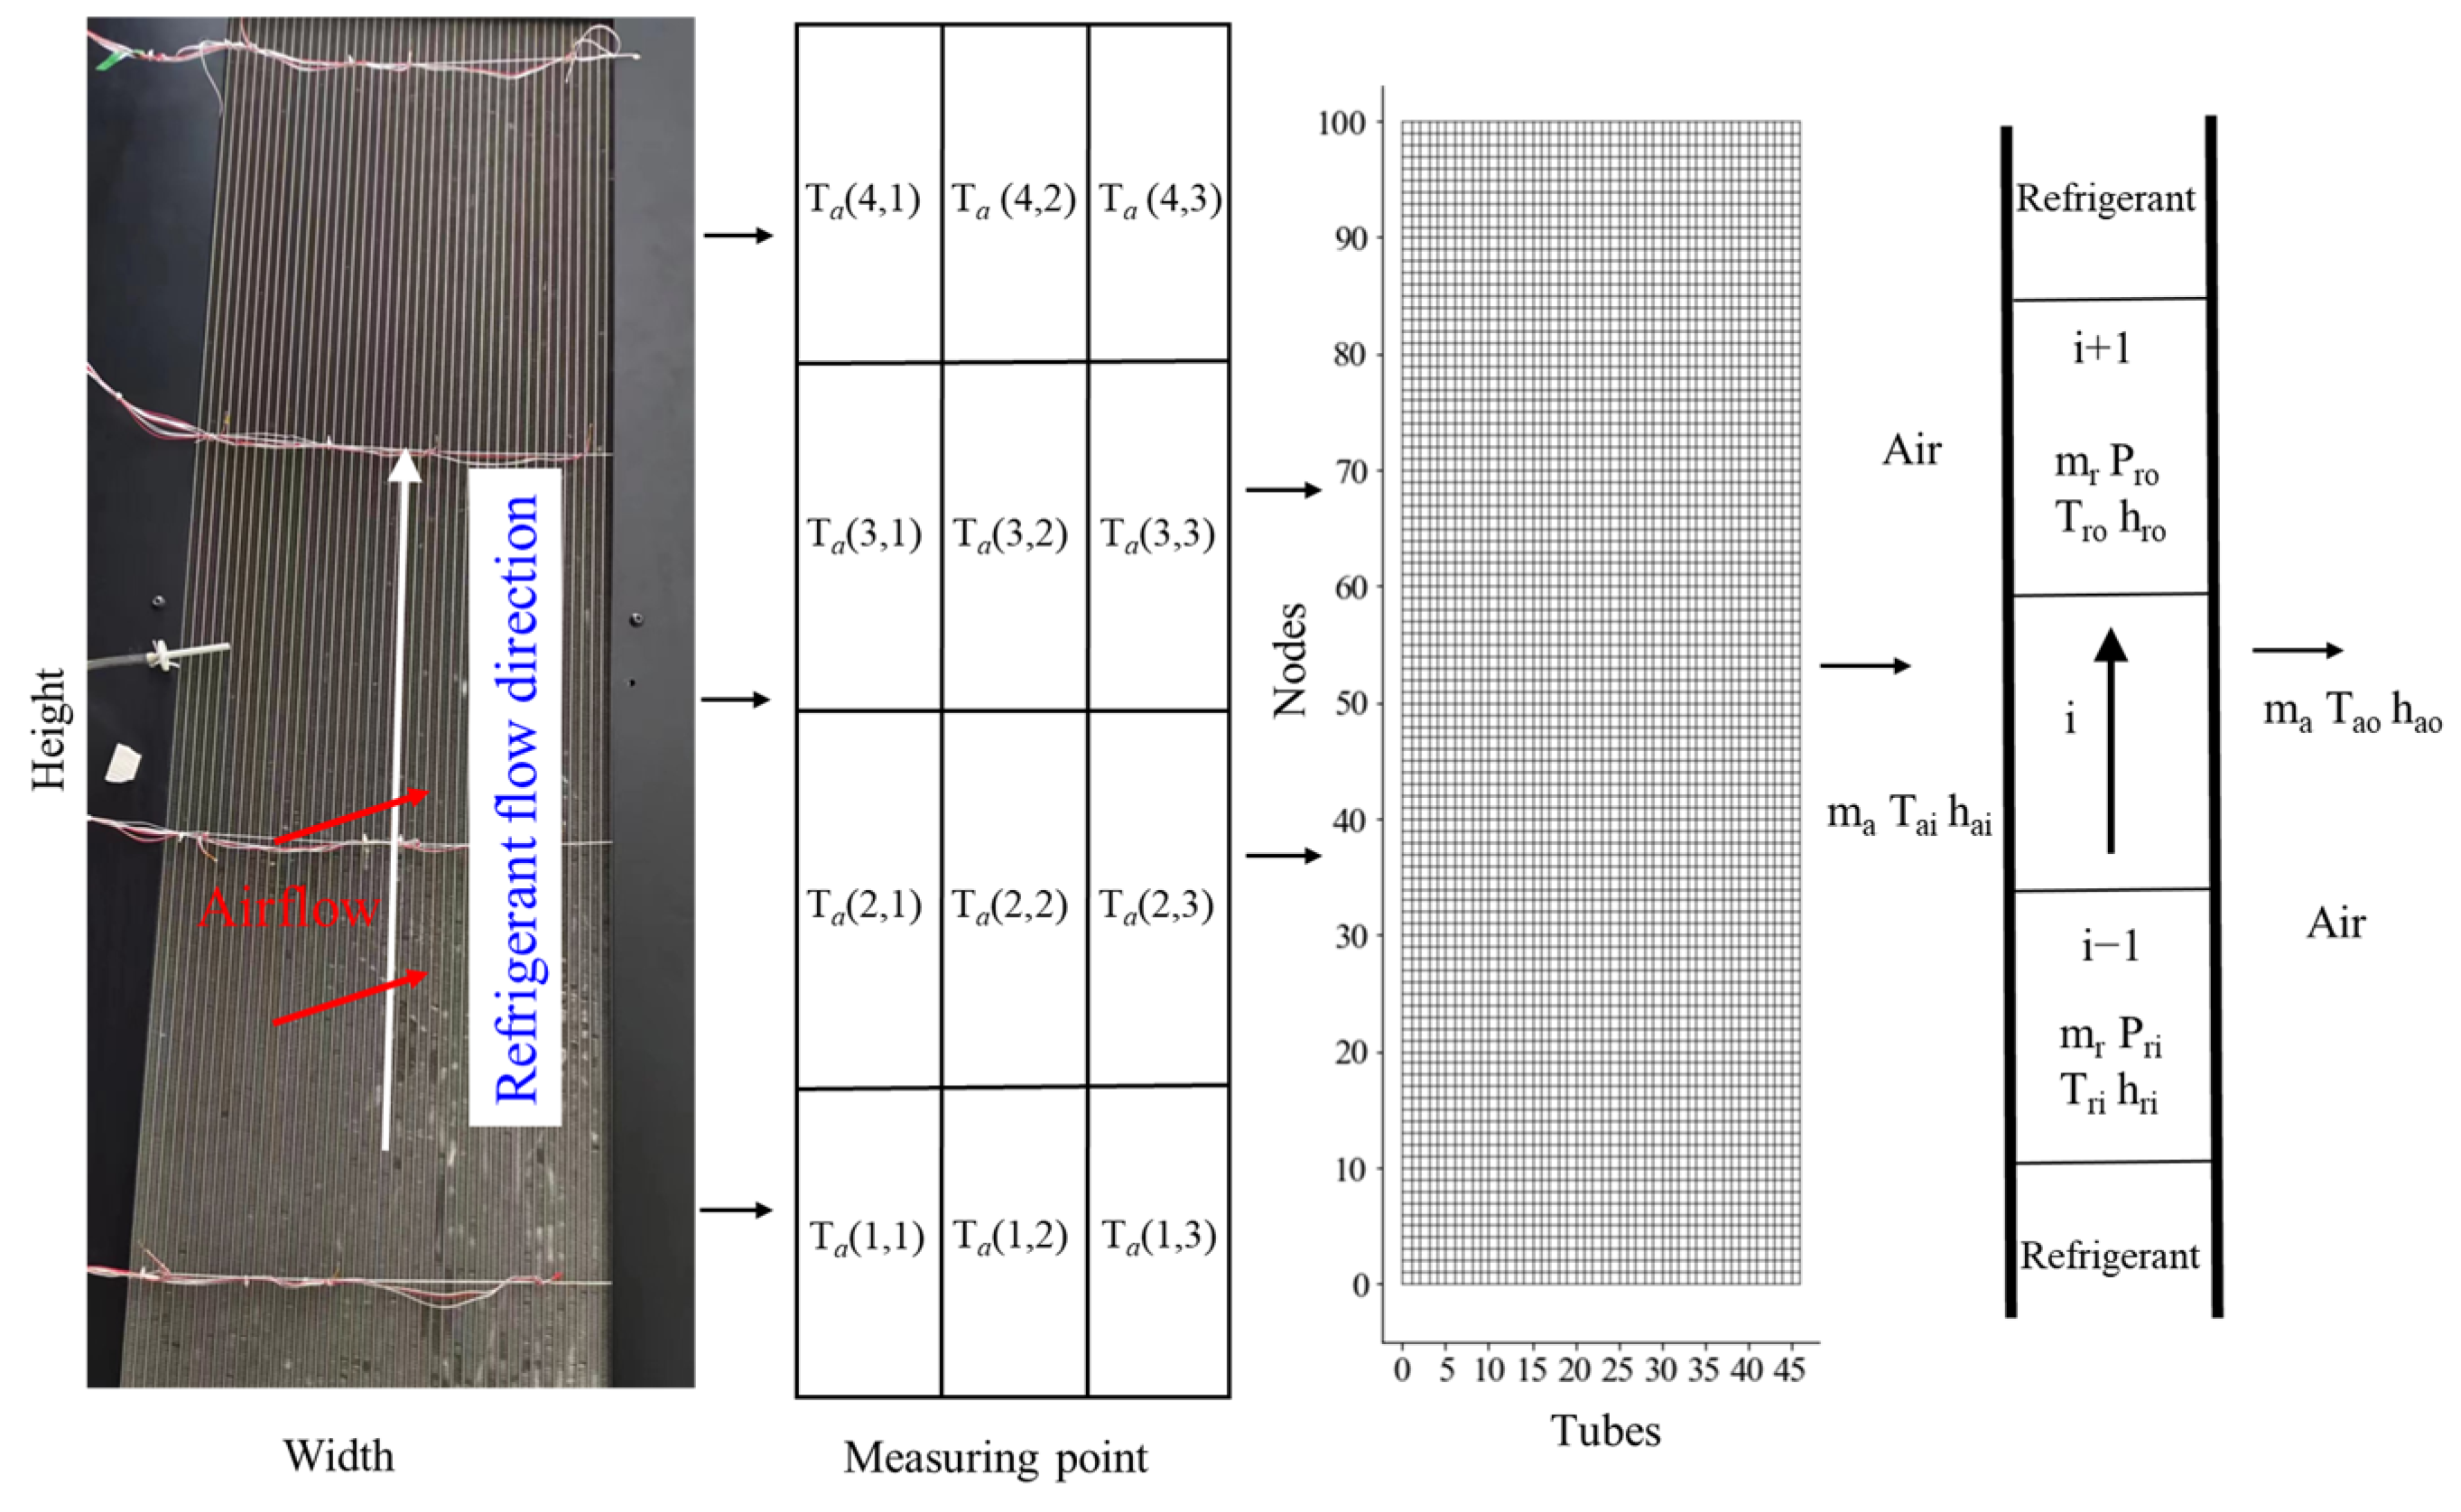
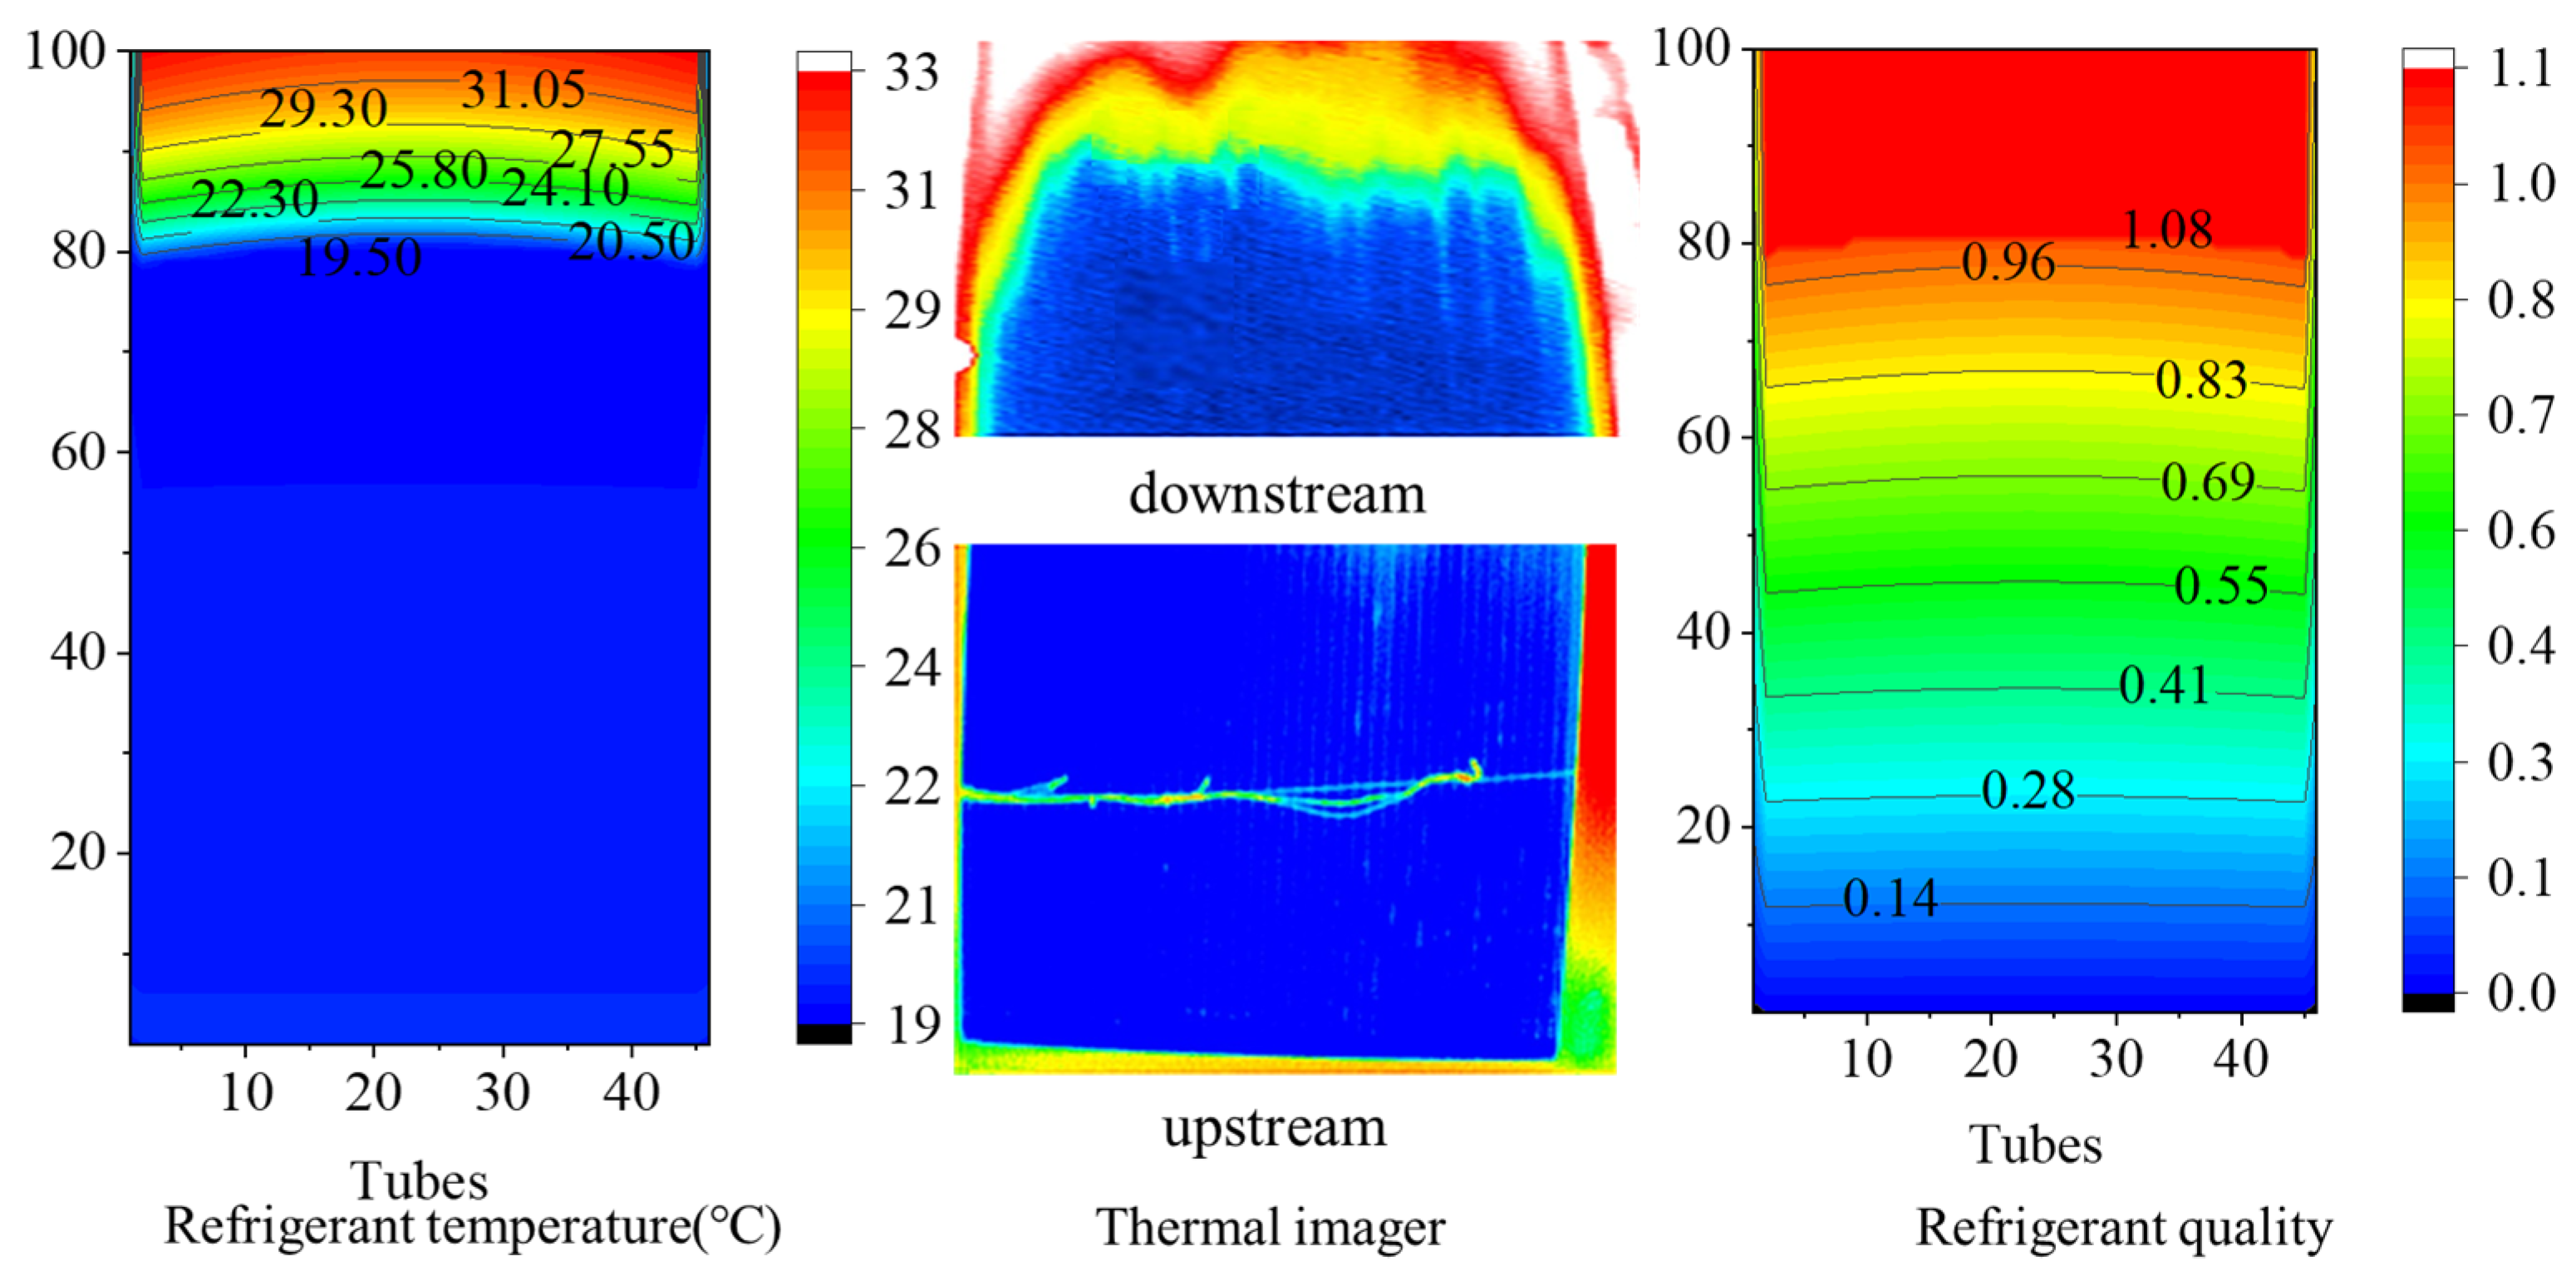
2.2. Velocity and Temperature Distribution
3. Mathematical Model
- The convection heat transfer and flow of refrigerant in the flat tube are one-dimensional steady processes;
- The air side is a one-dimensional flow, but the velocity and temperature distribution are non-uniform;
- The heat transfer between the air and the refrigerant is crossflow, ignoring the heat transfer in the non-mainstream direction;
- Computation is considered to be a steady state process;
- The refrigerant is evenly divided in the flat tube.
3.1. Control Equations
3.2. Heat Transfer and Pressure Drop Correlations of Refrigerant
3.3. Heat Transfer and Pressure Drop Correlations of Air
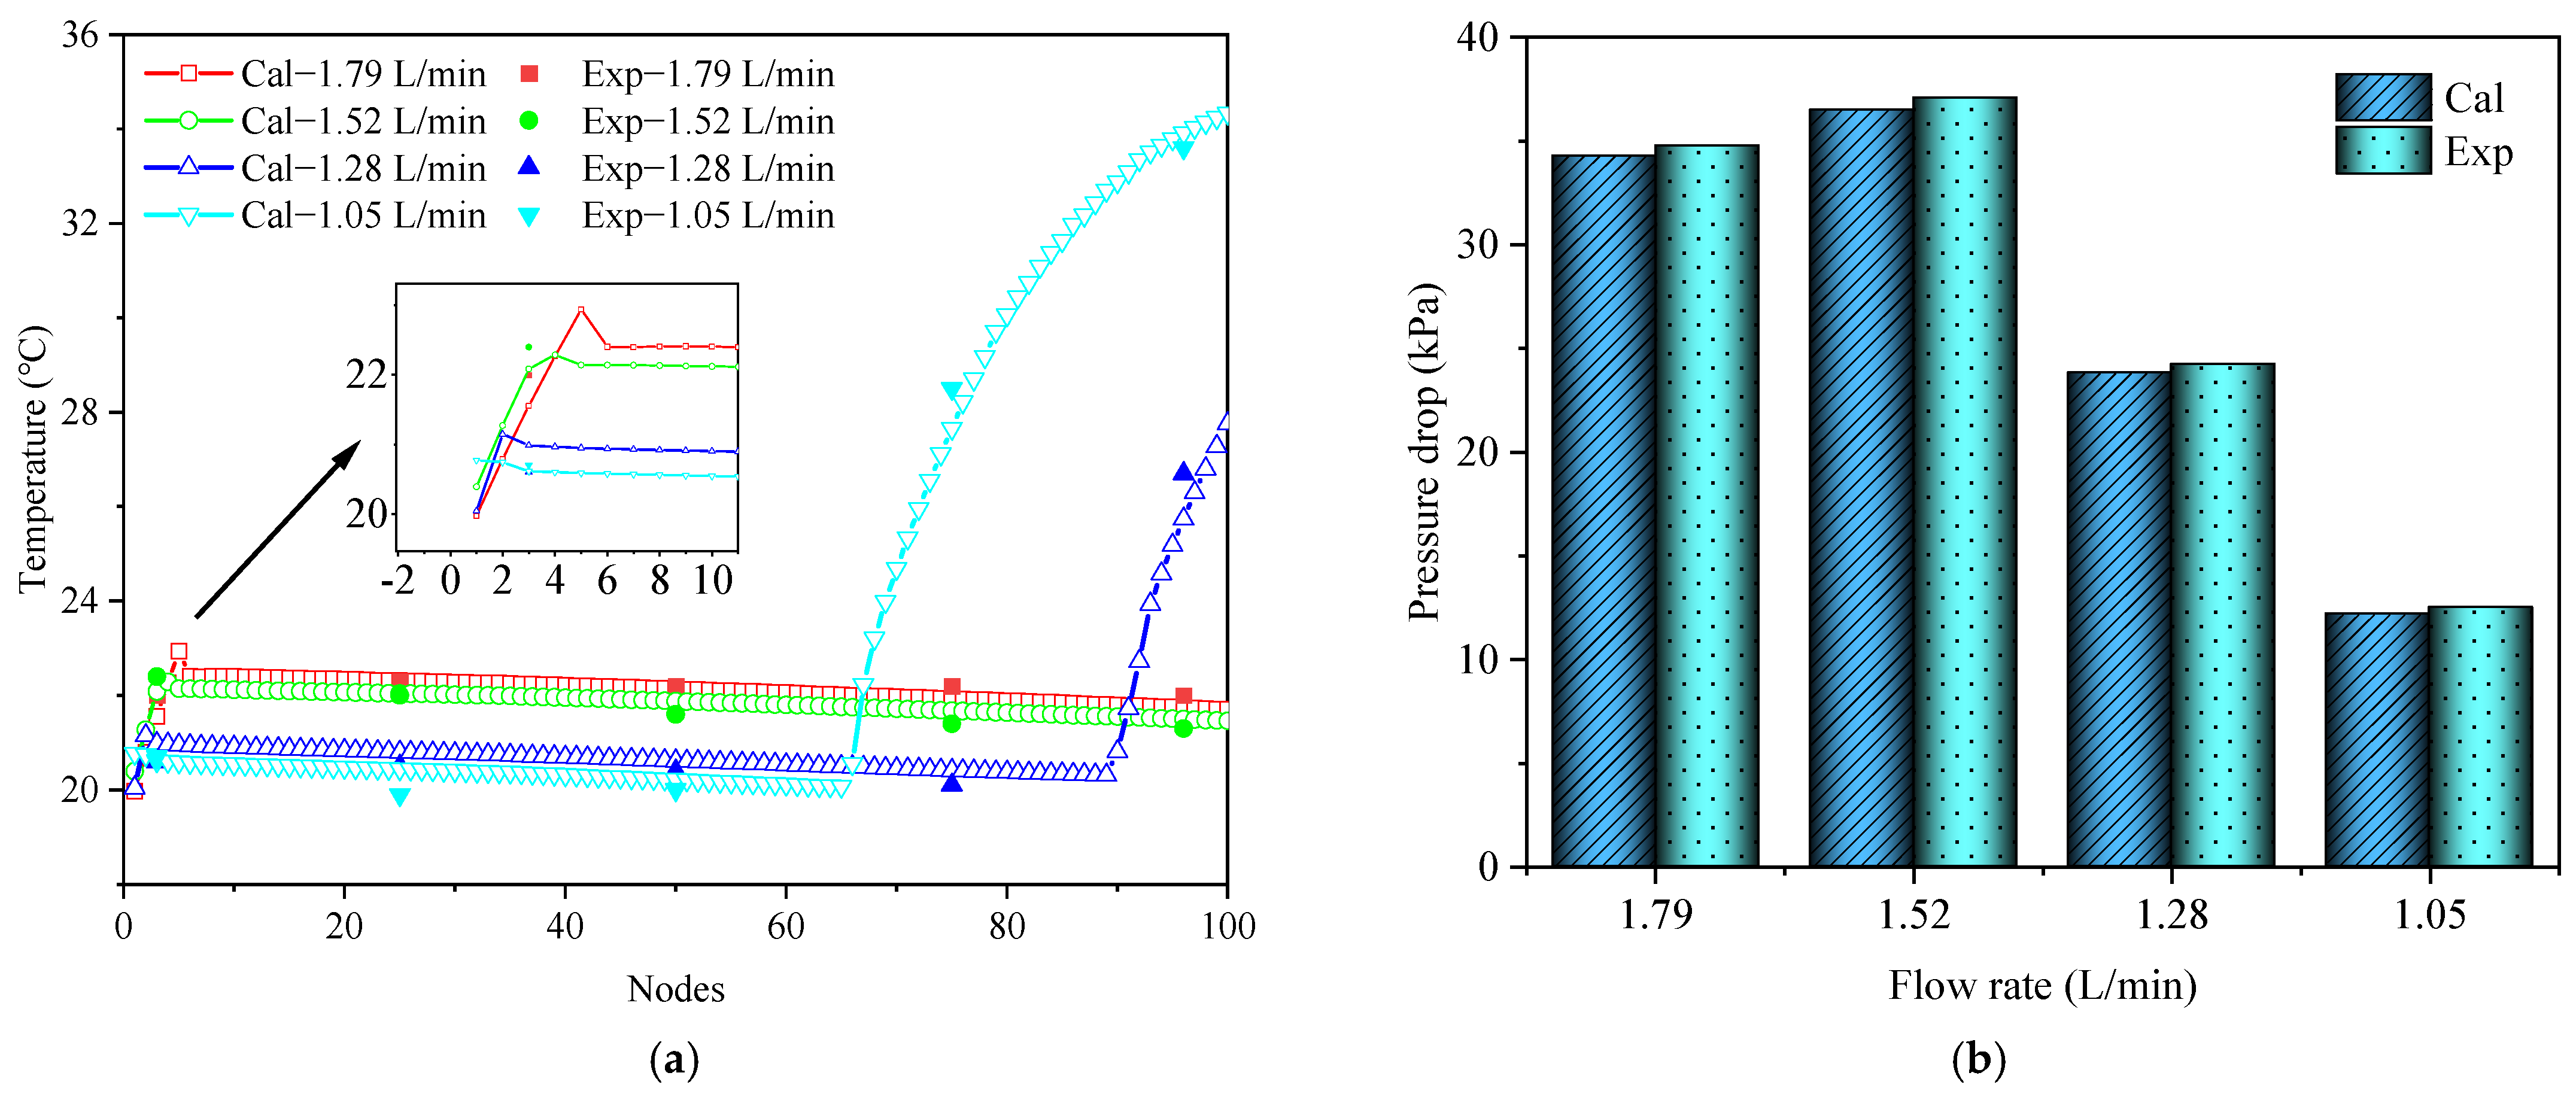
3.4. Model Verification
4. Results and Discussion
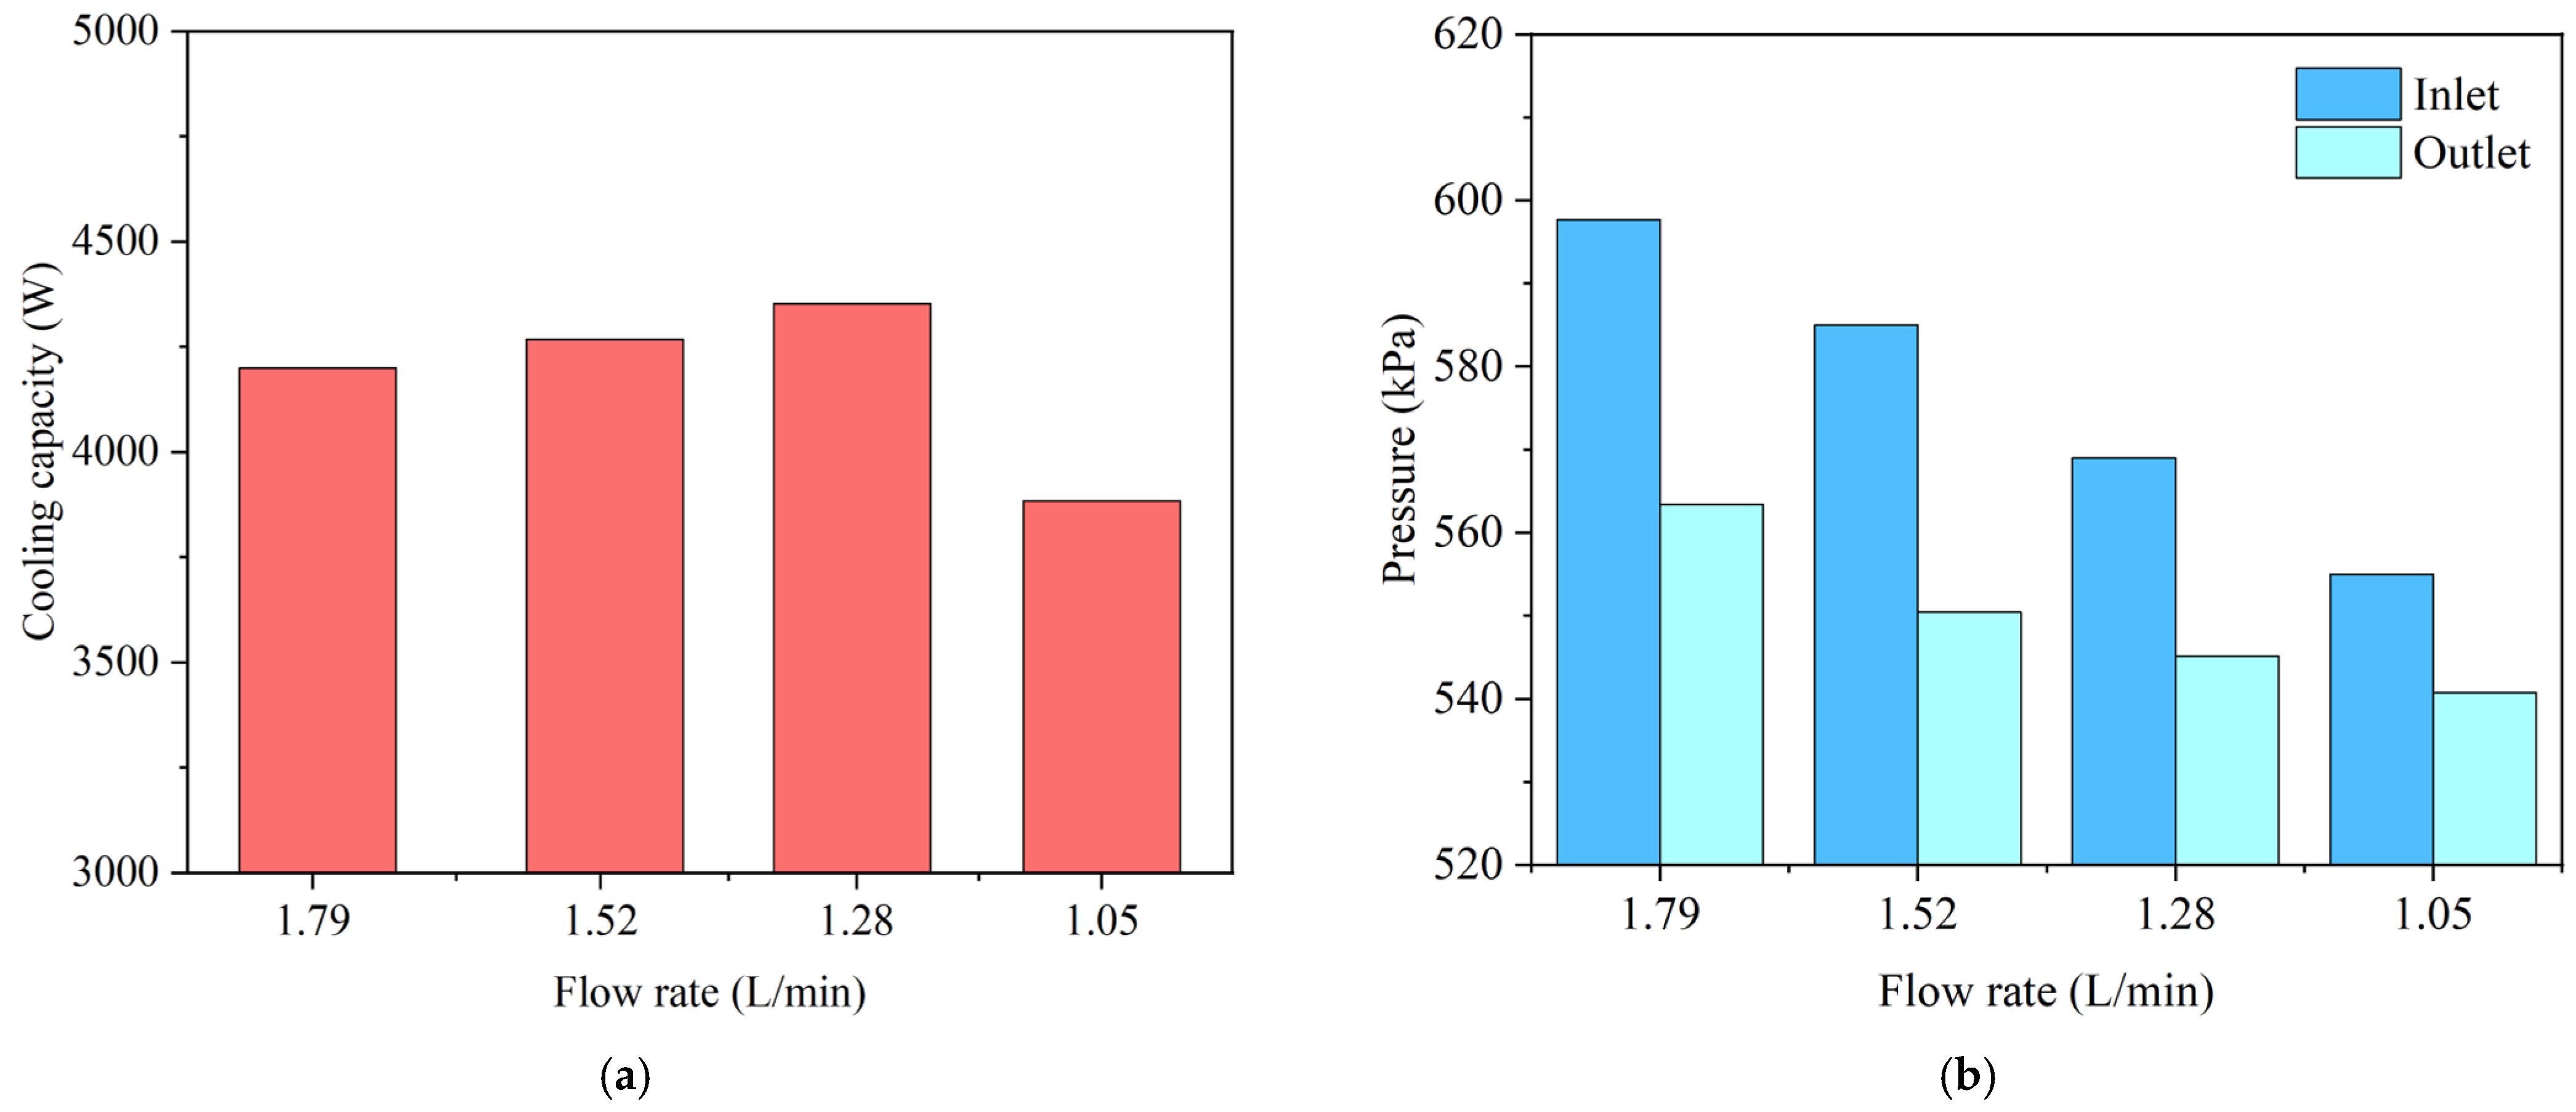
4.1. Effect of Refrigerant Flow Rate
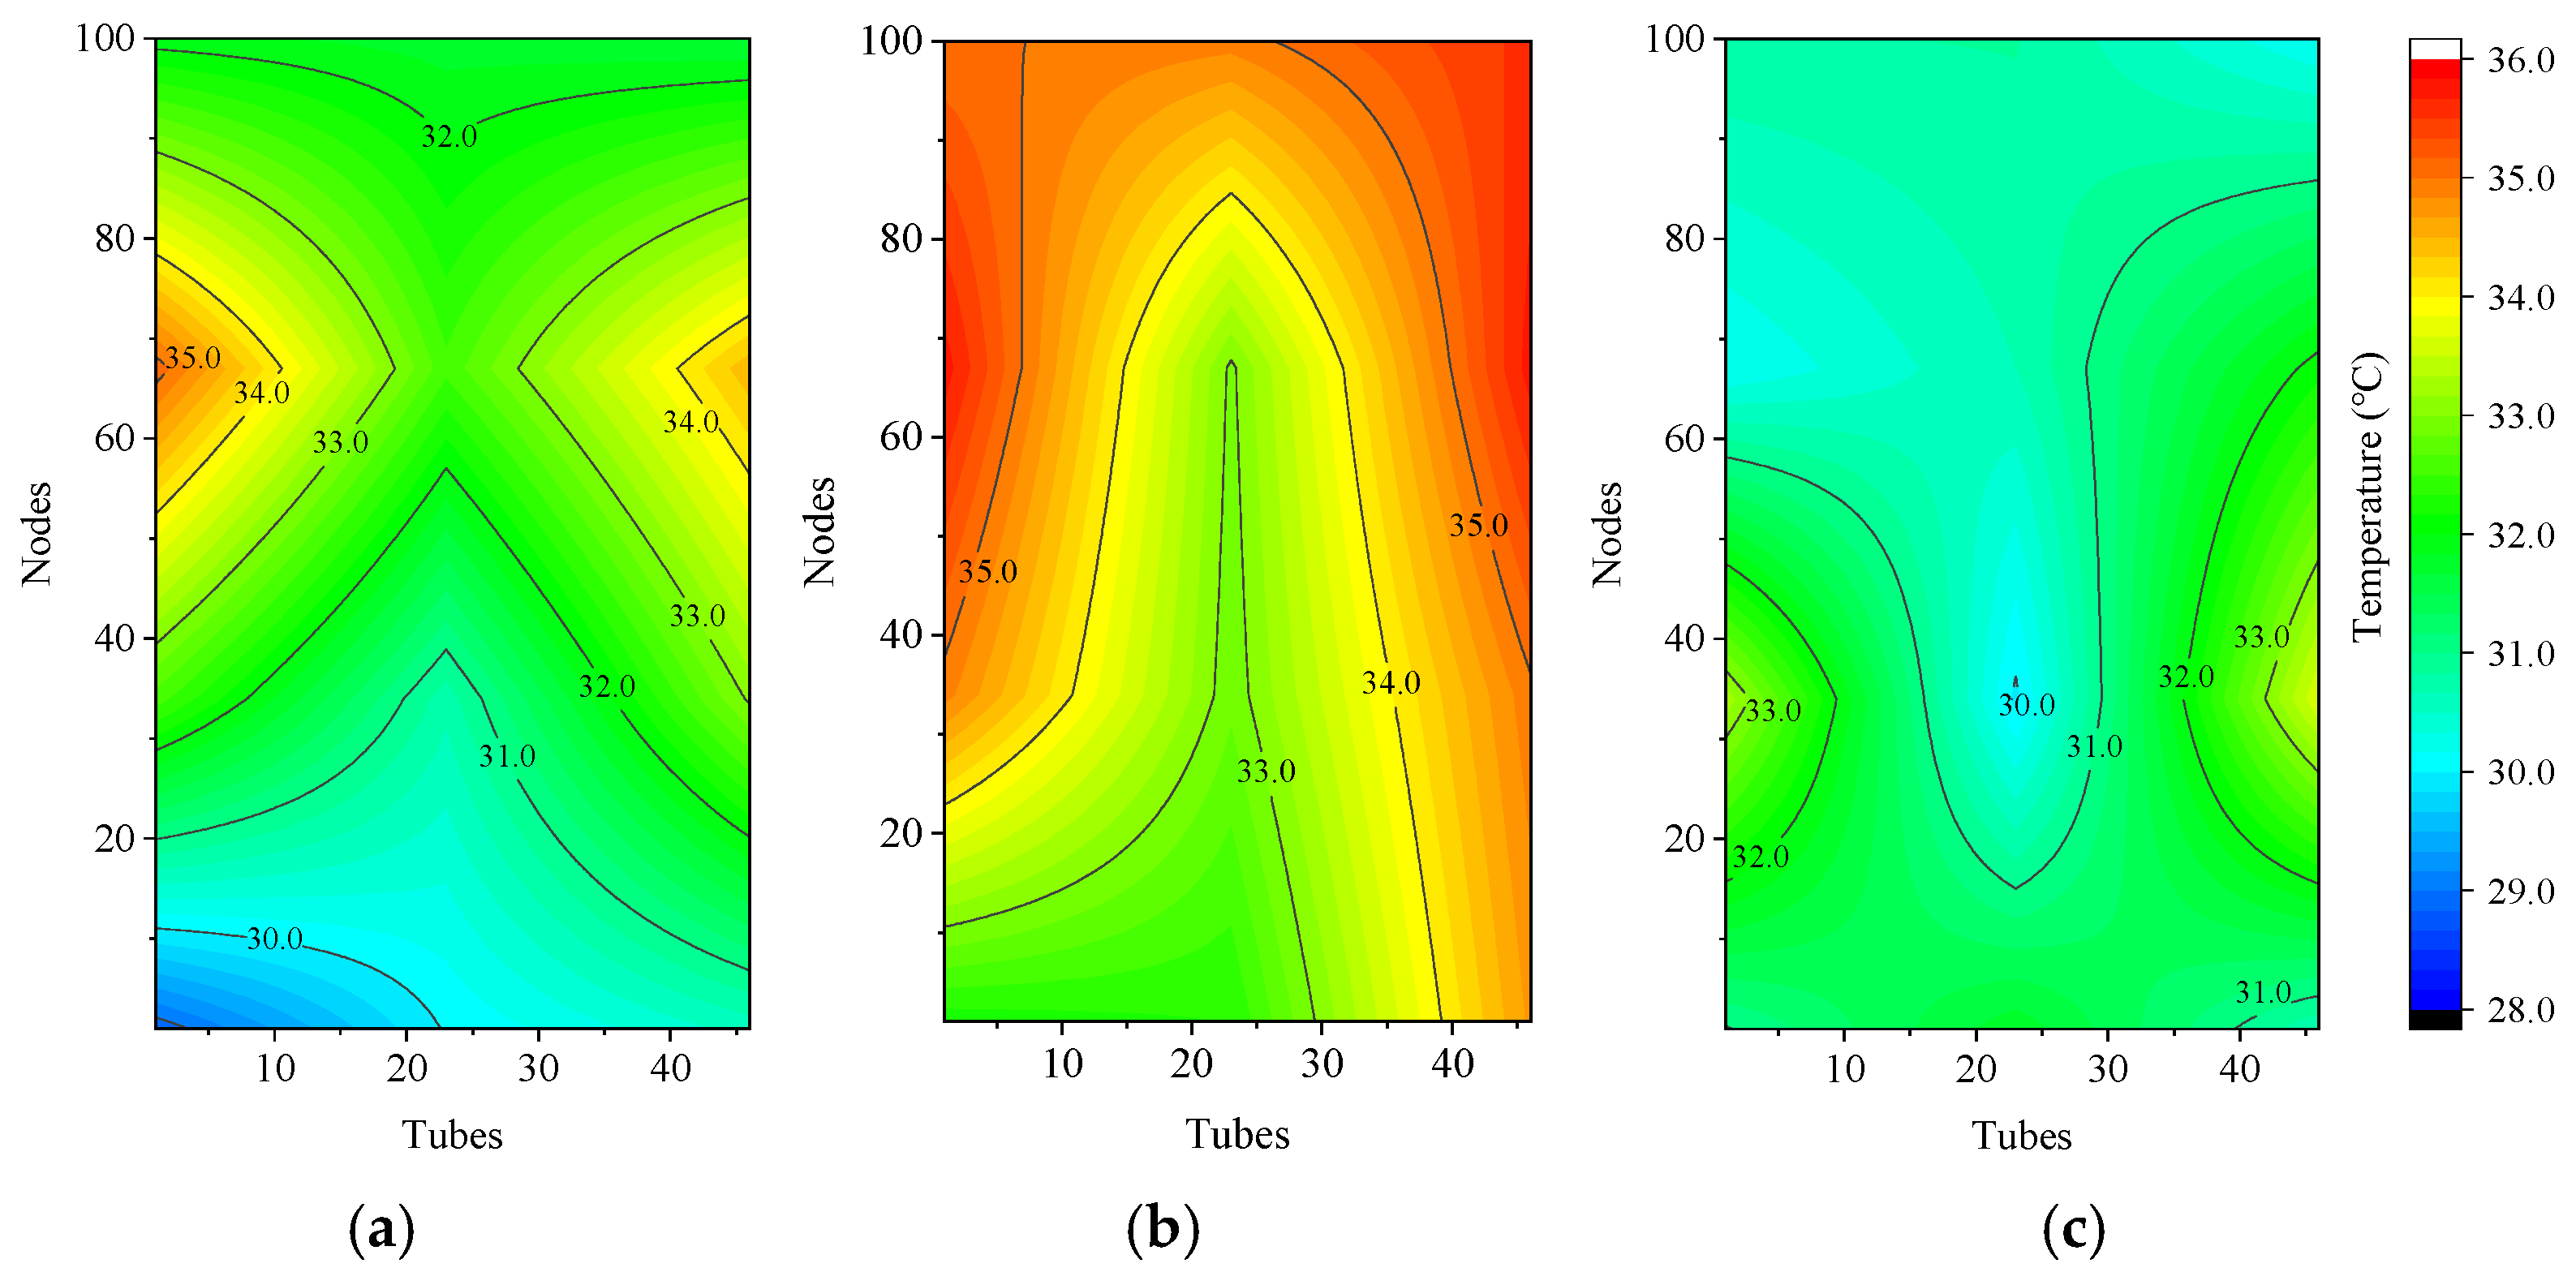
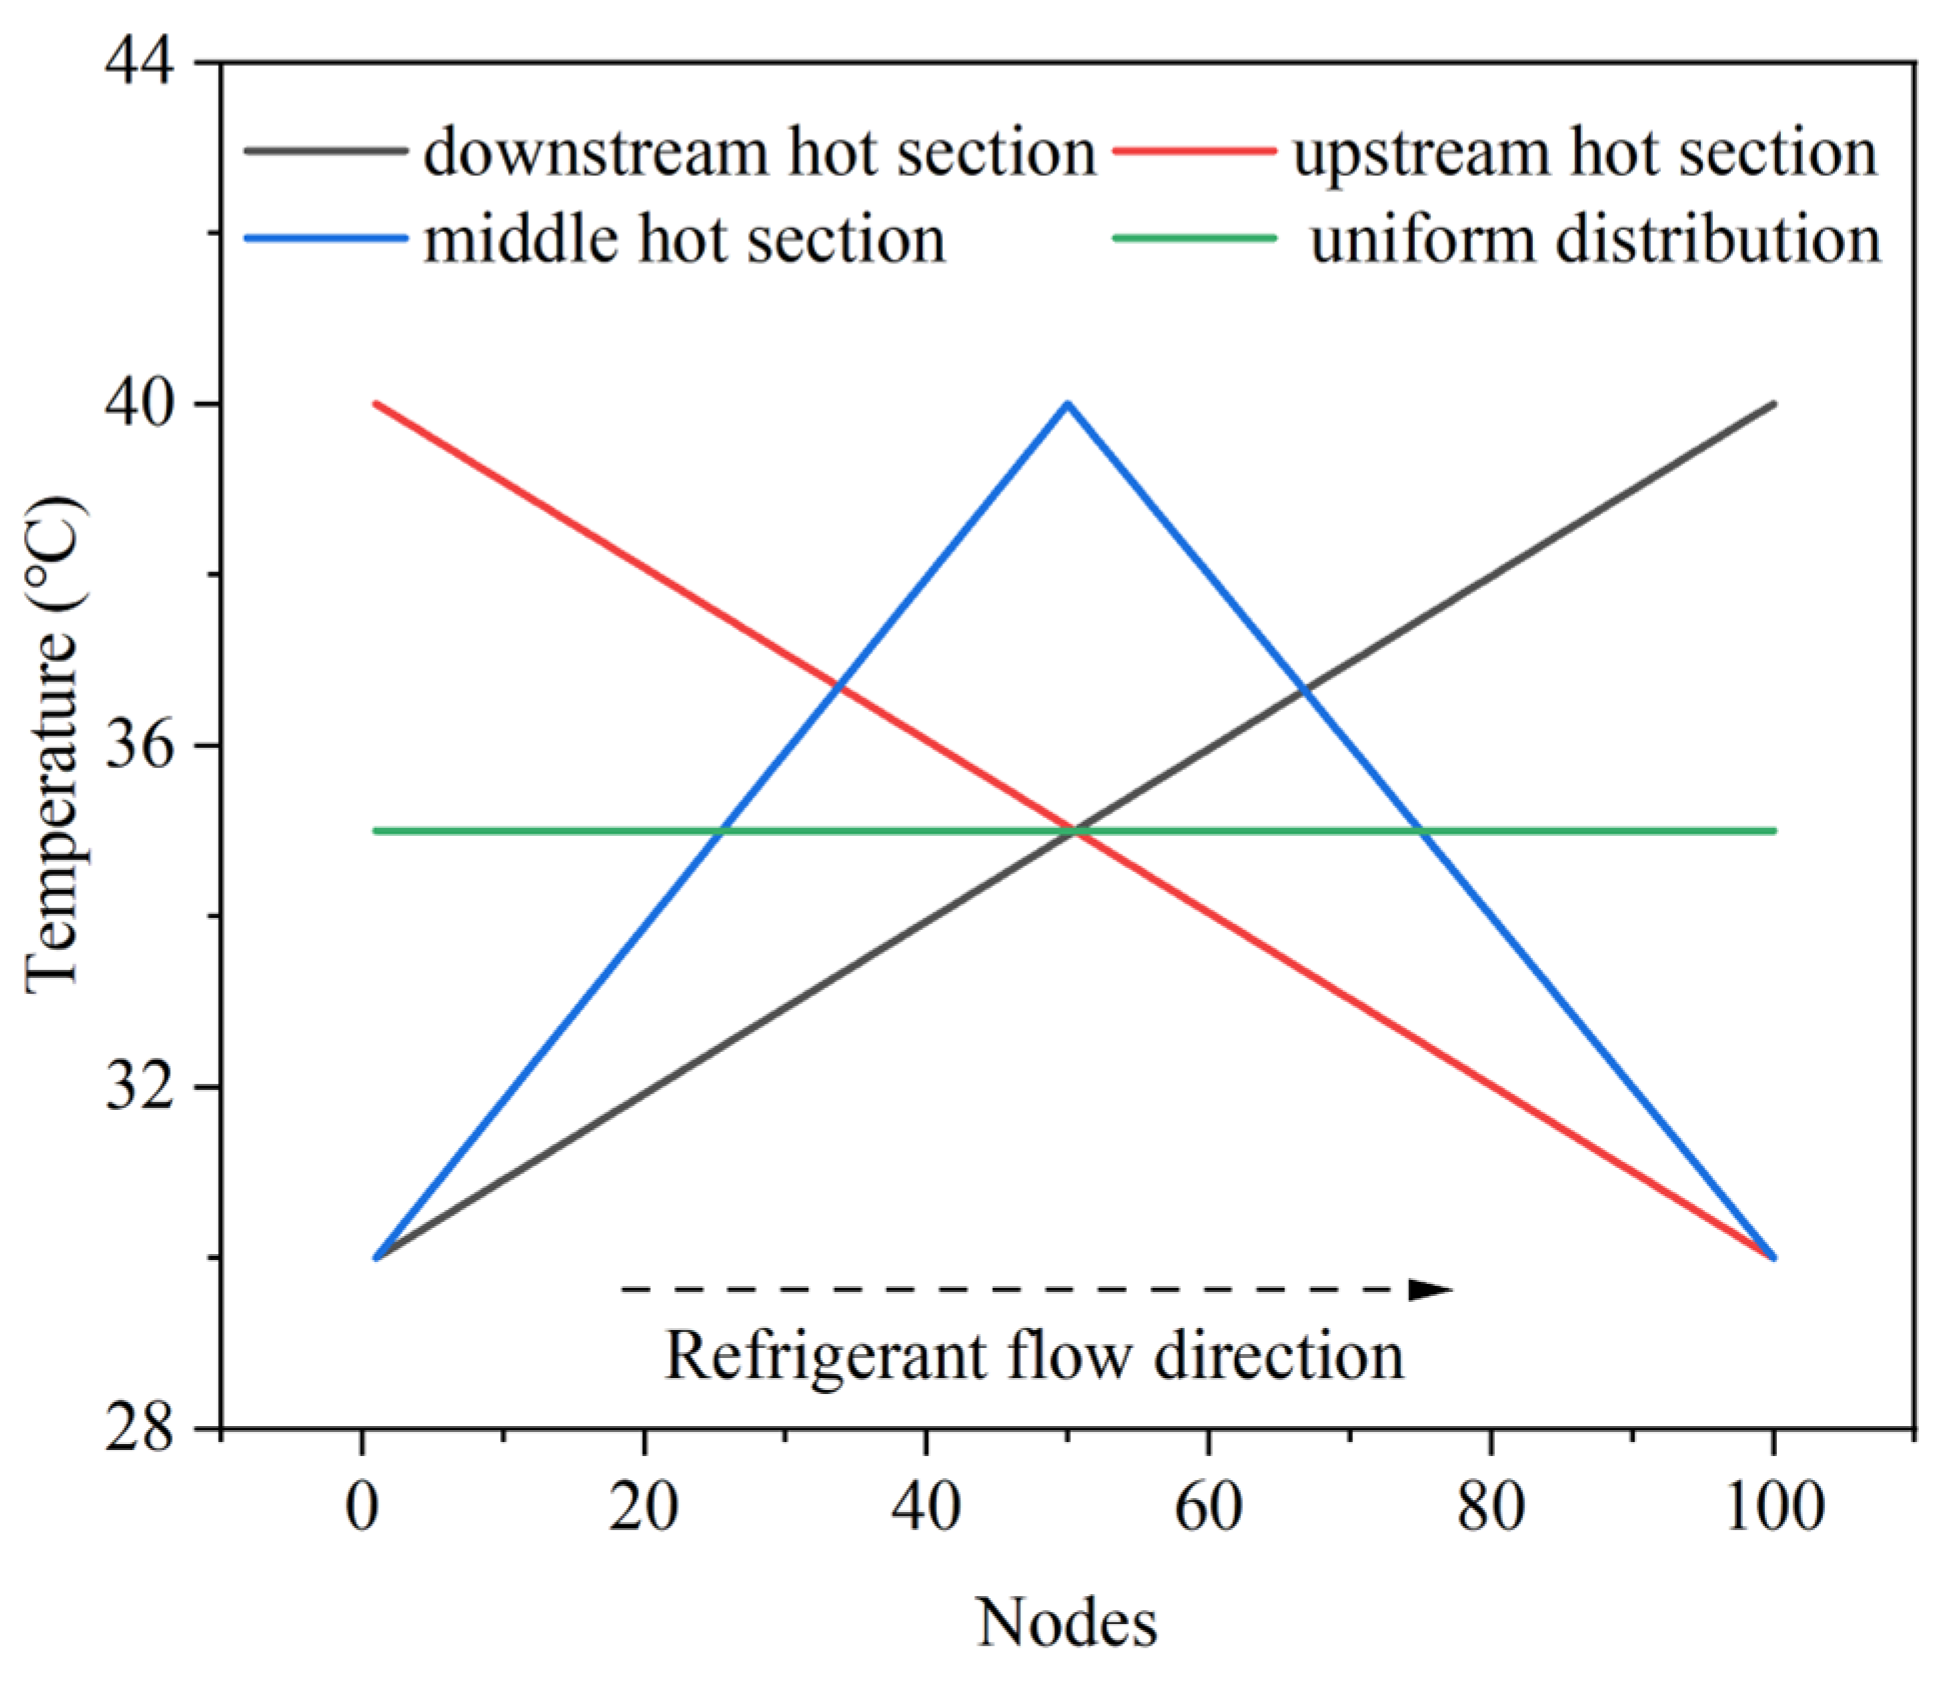
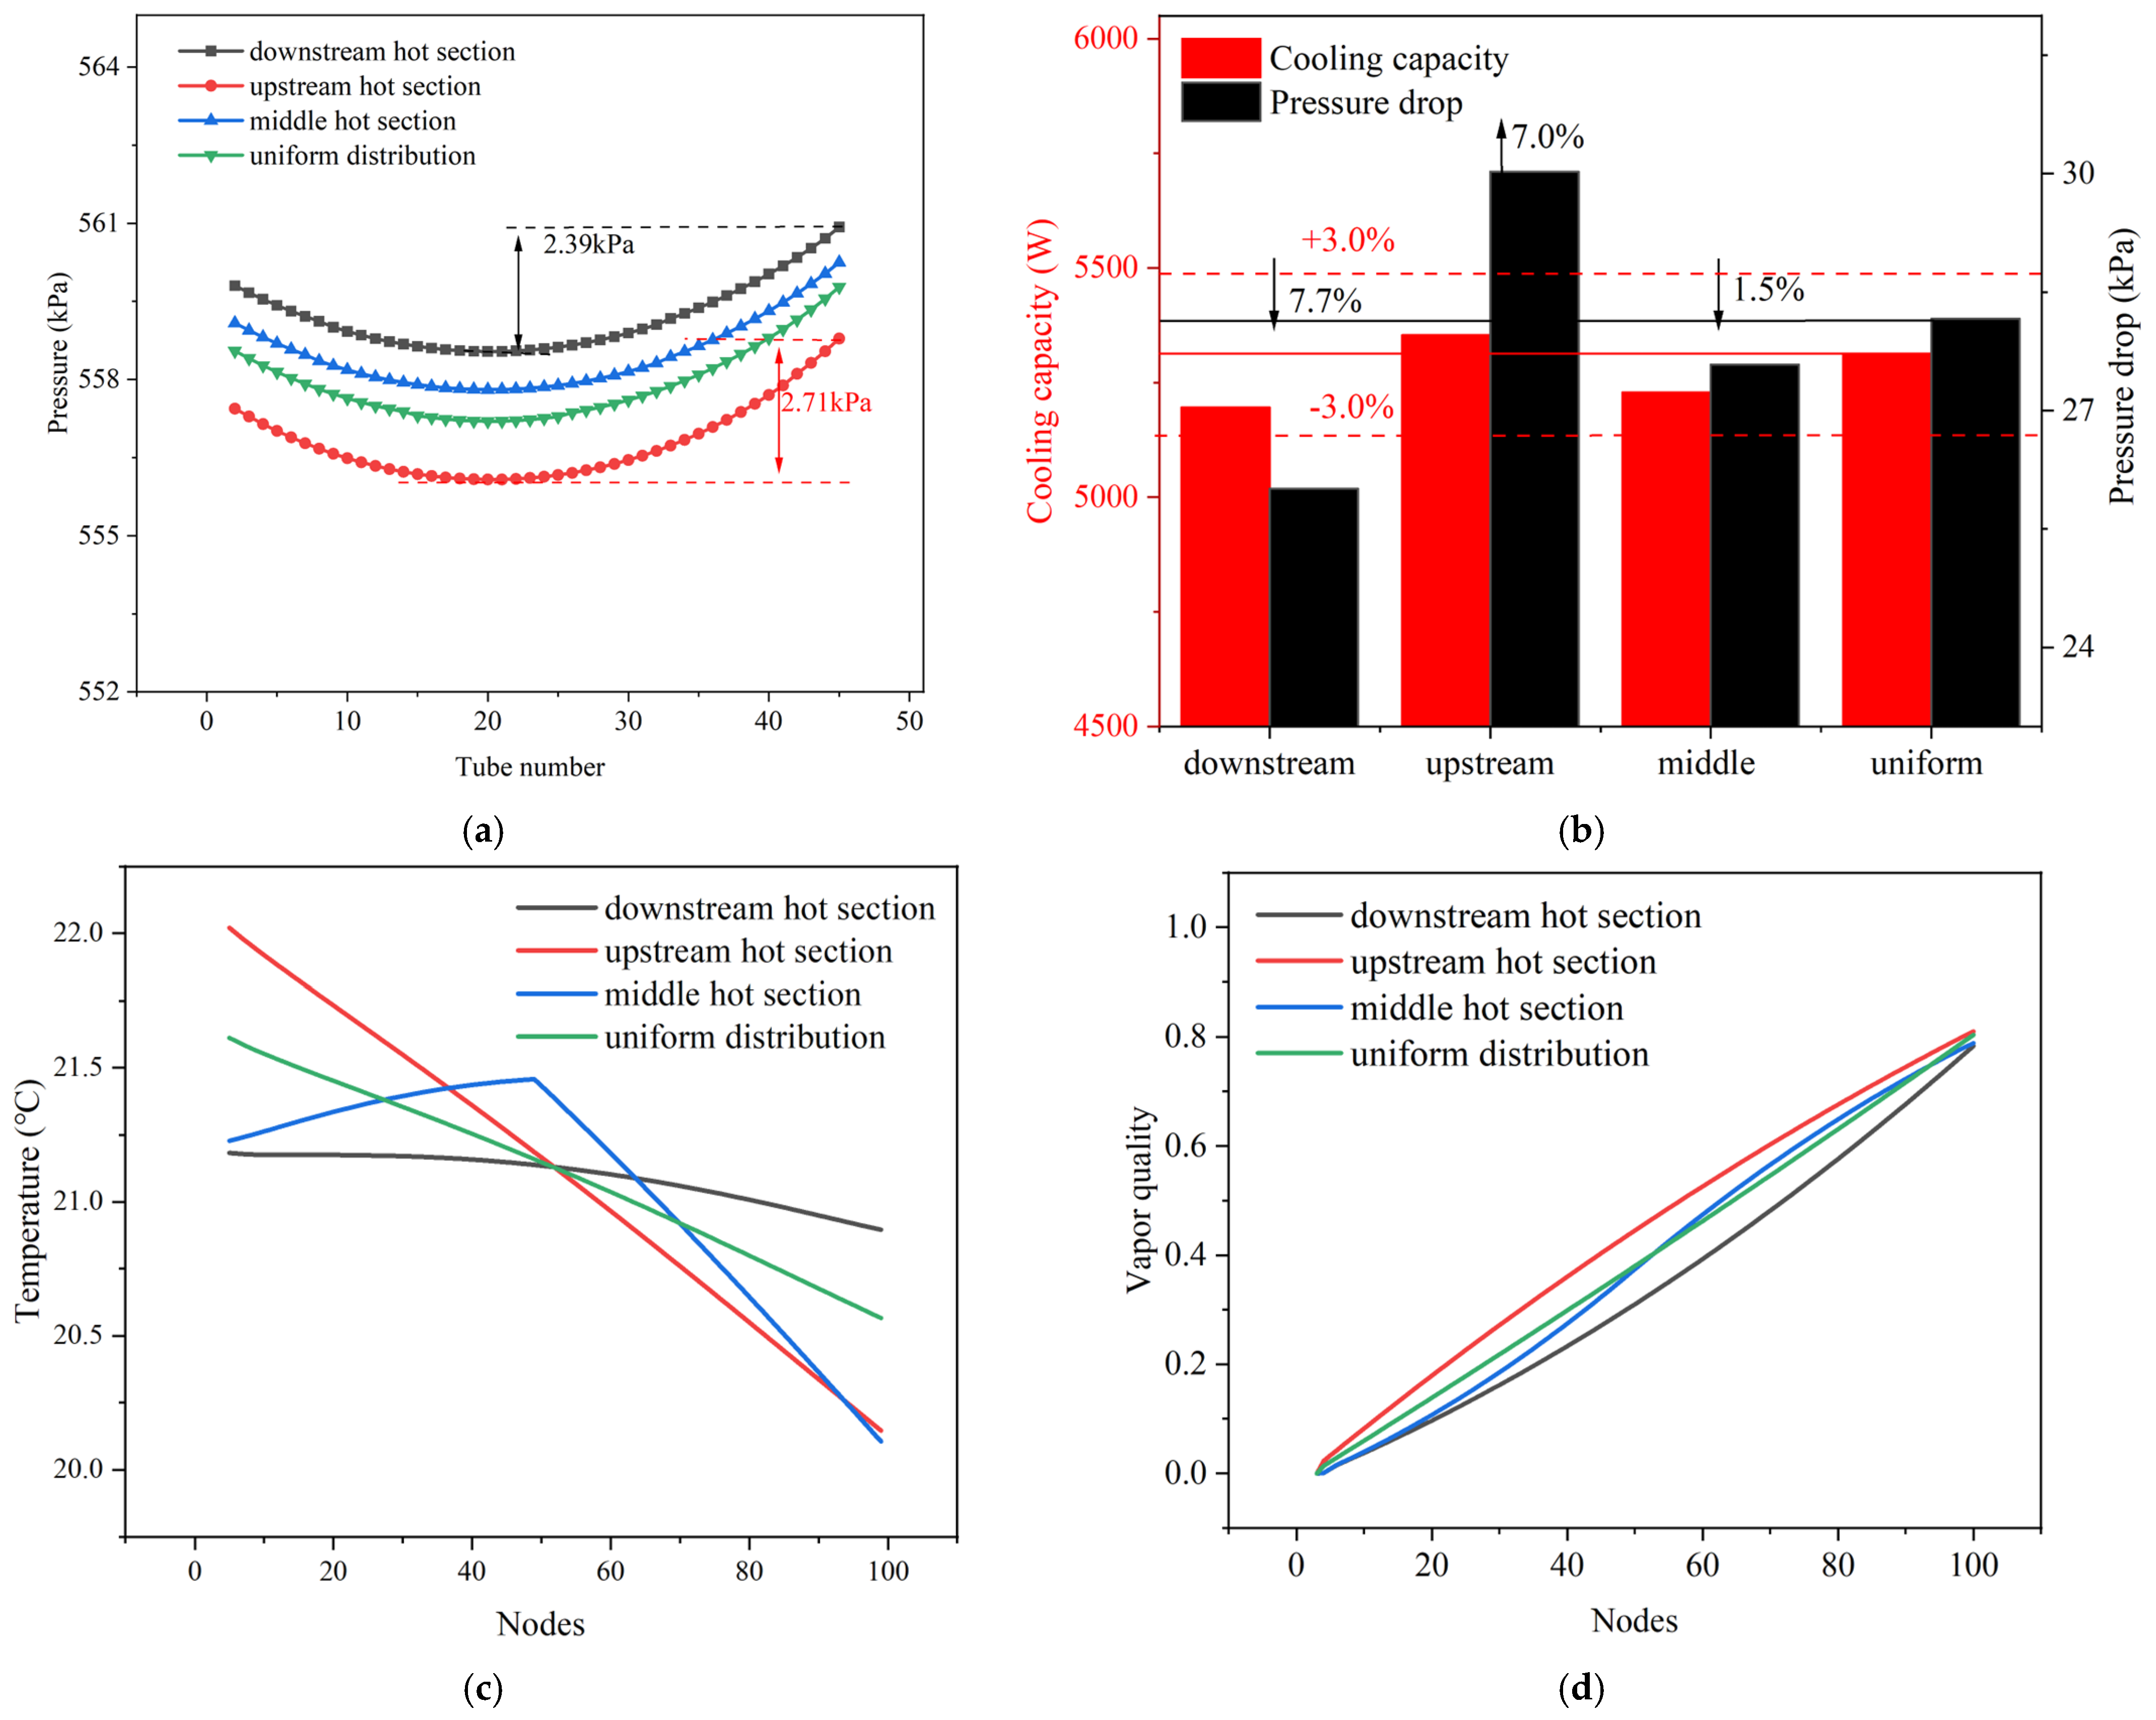
4.2. Effect of Inlet Air Temeprature Distribution on the PFHE Performance
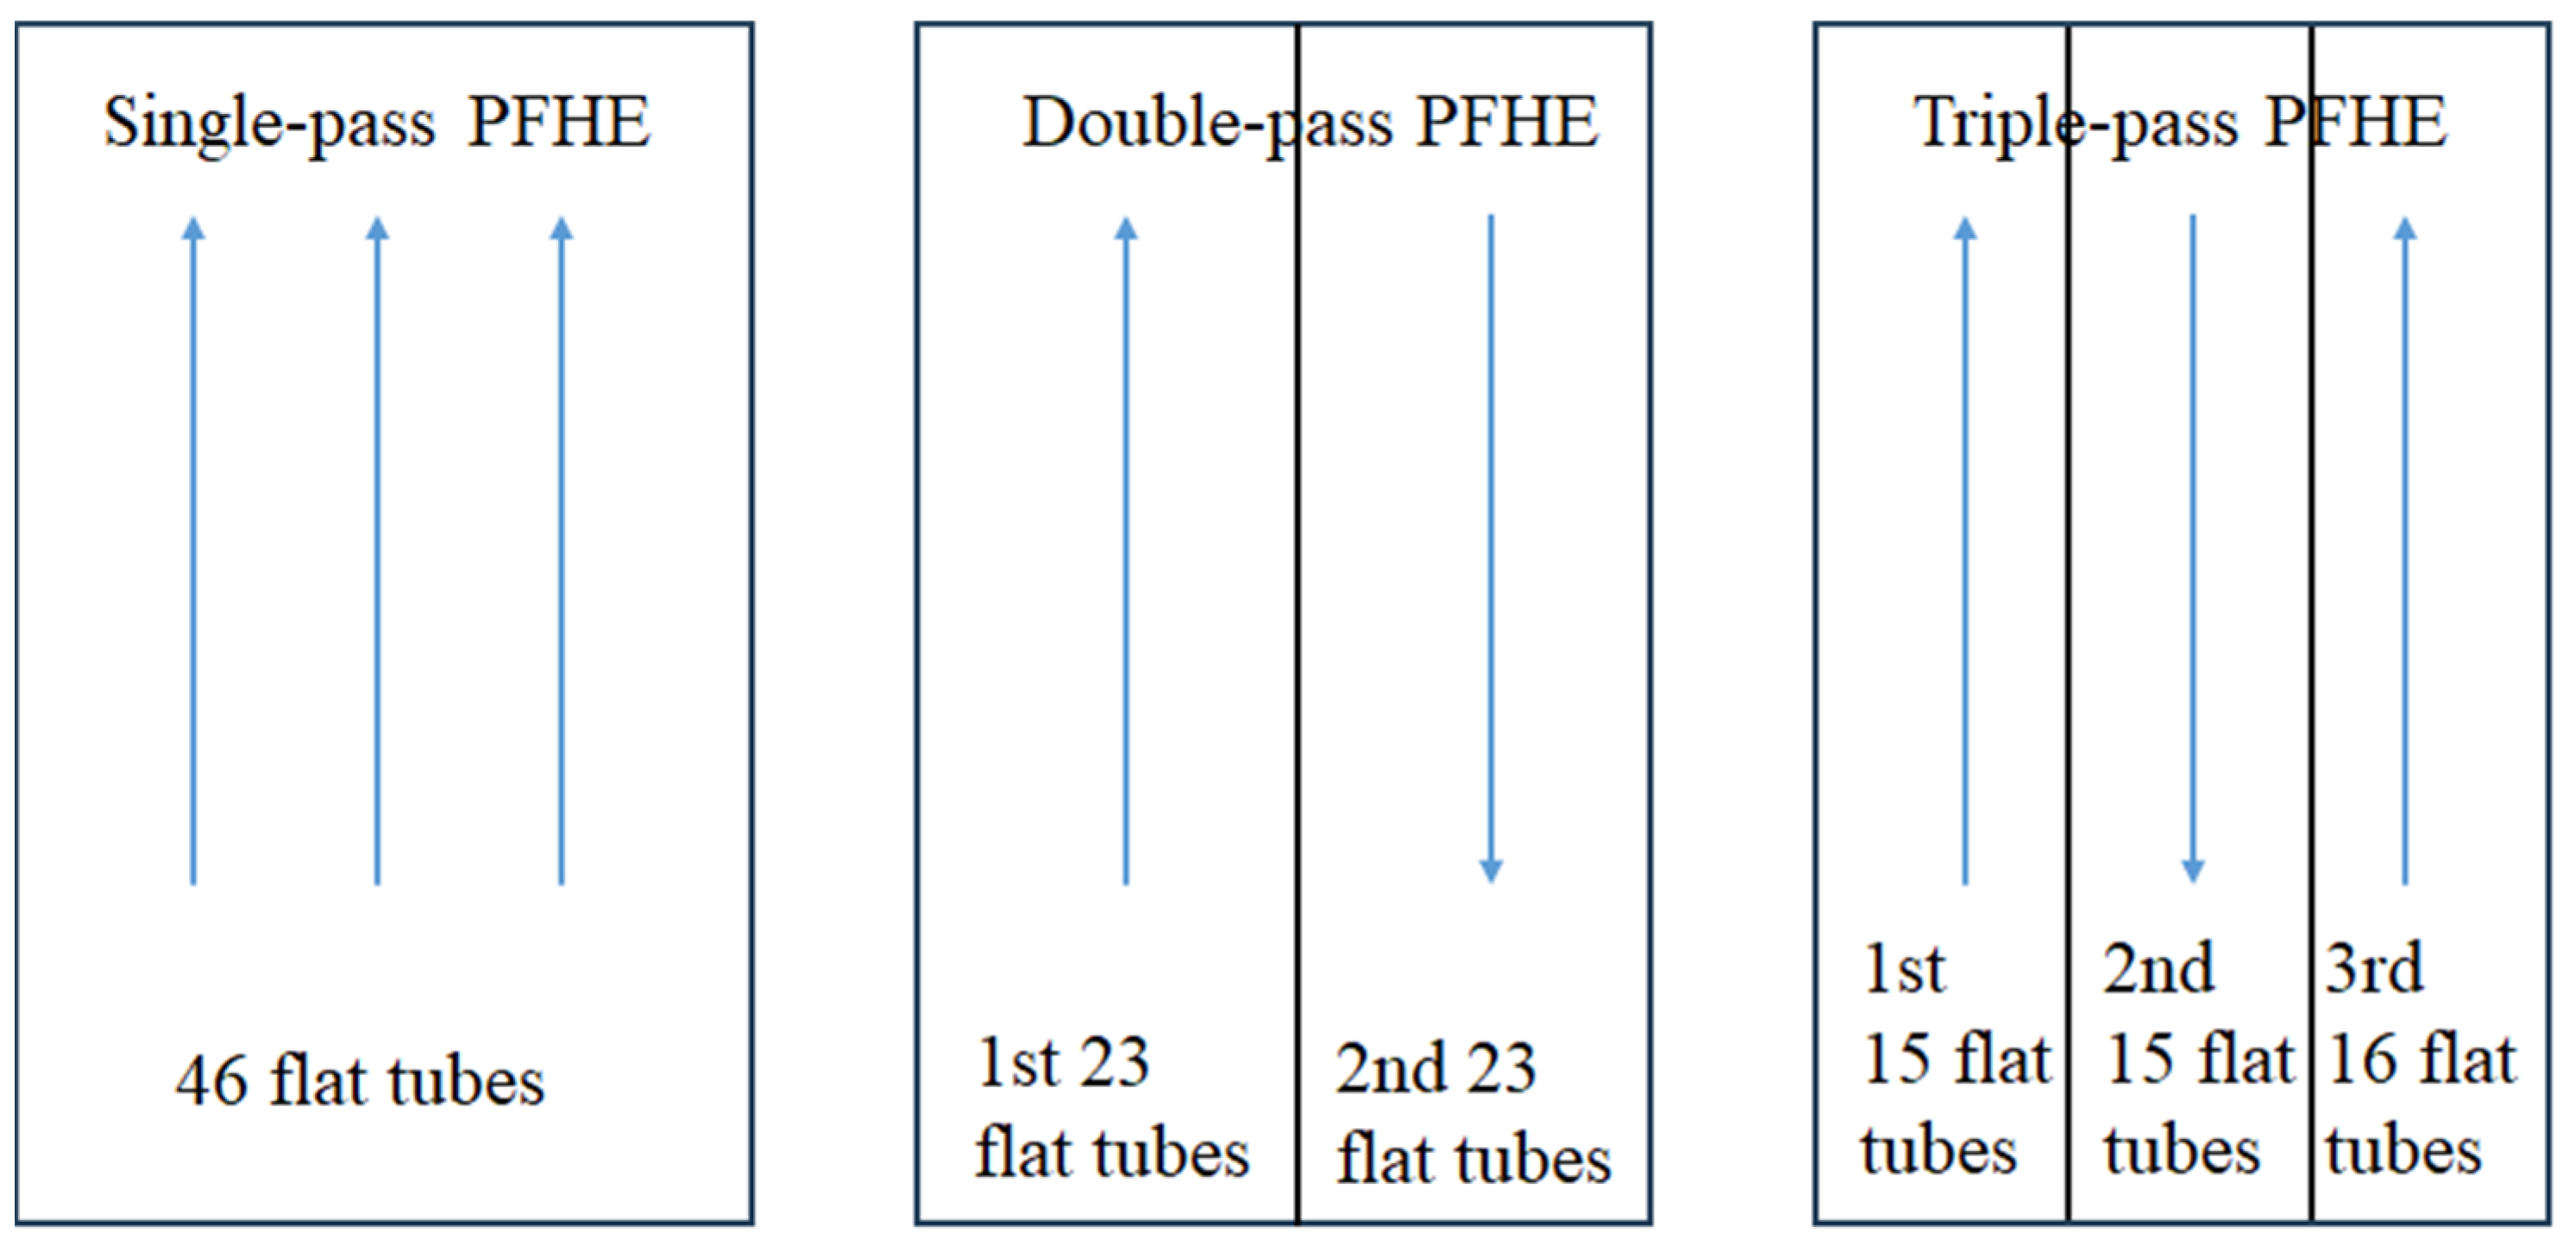
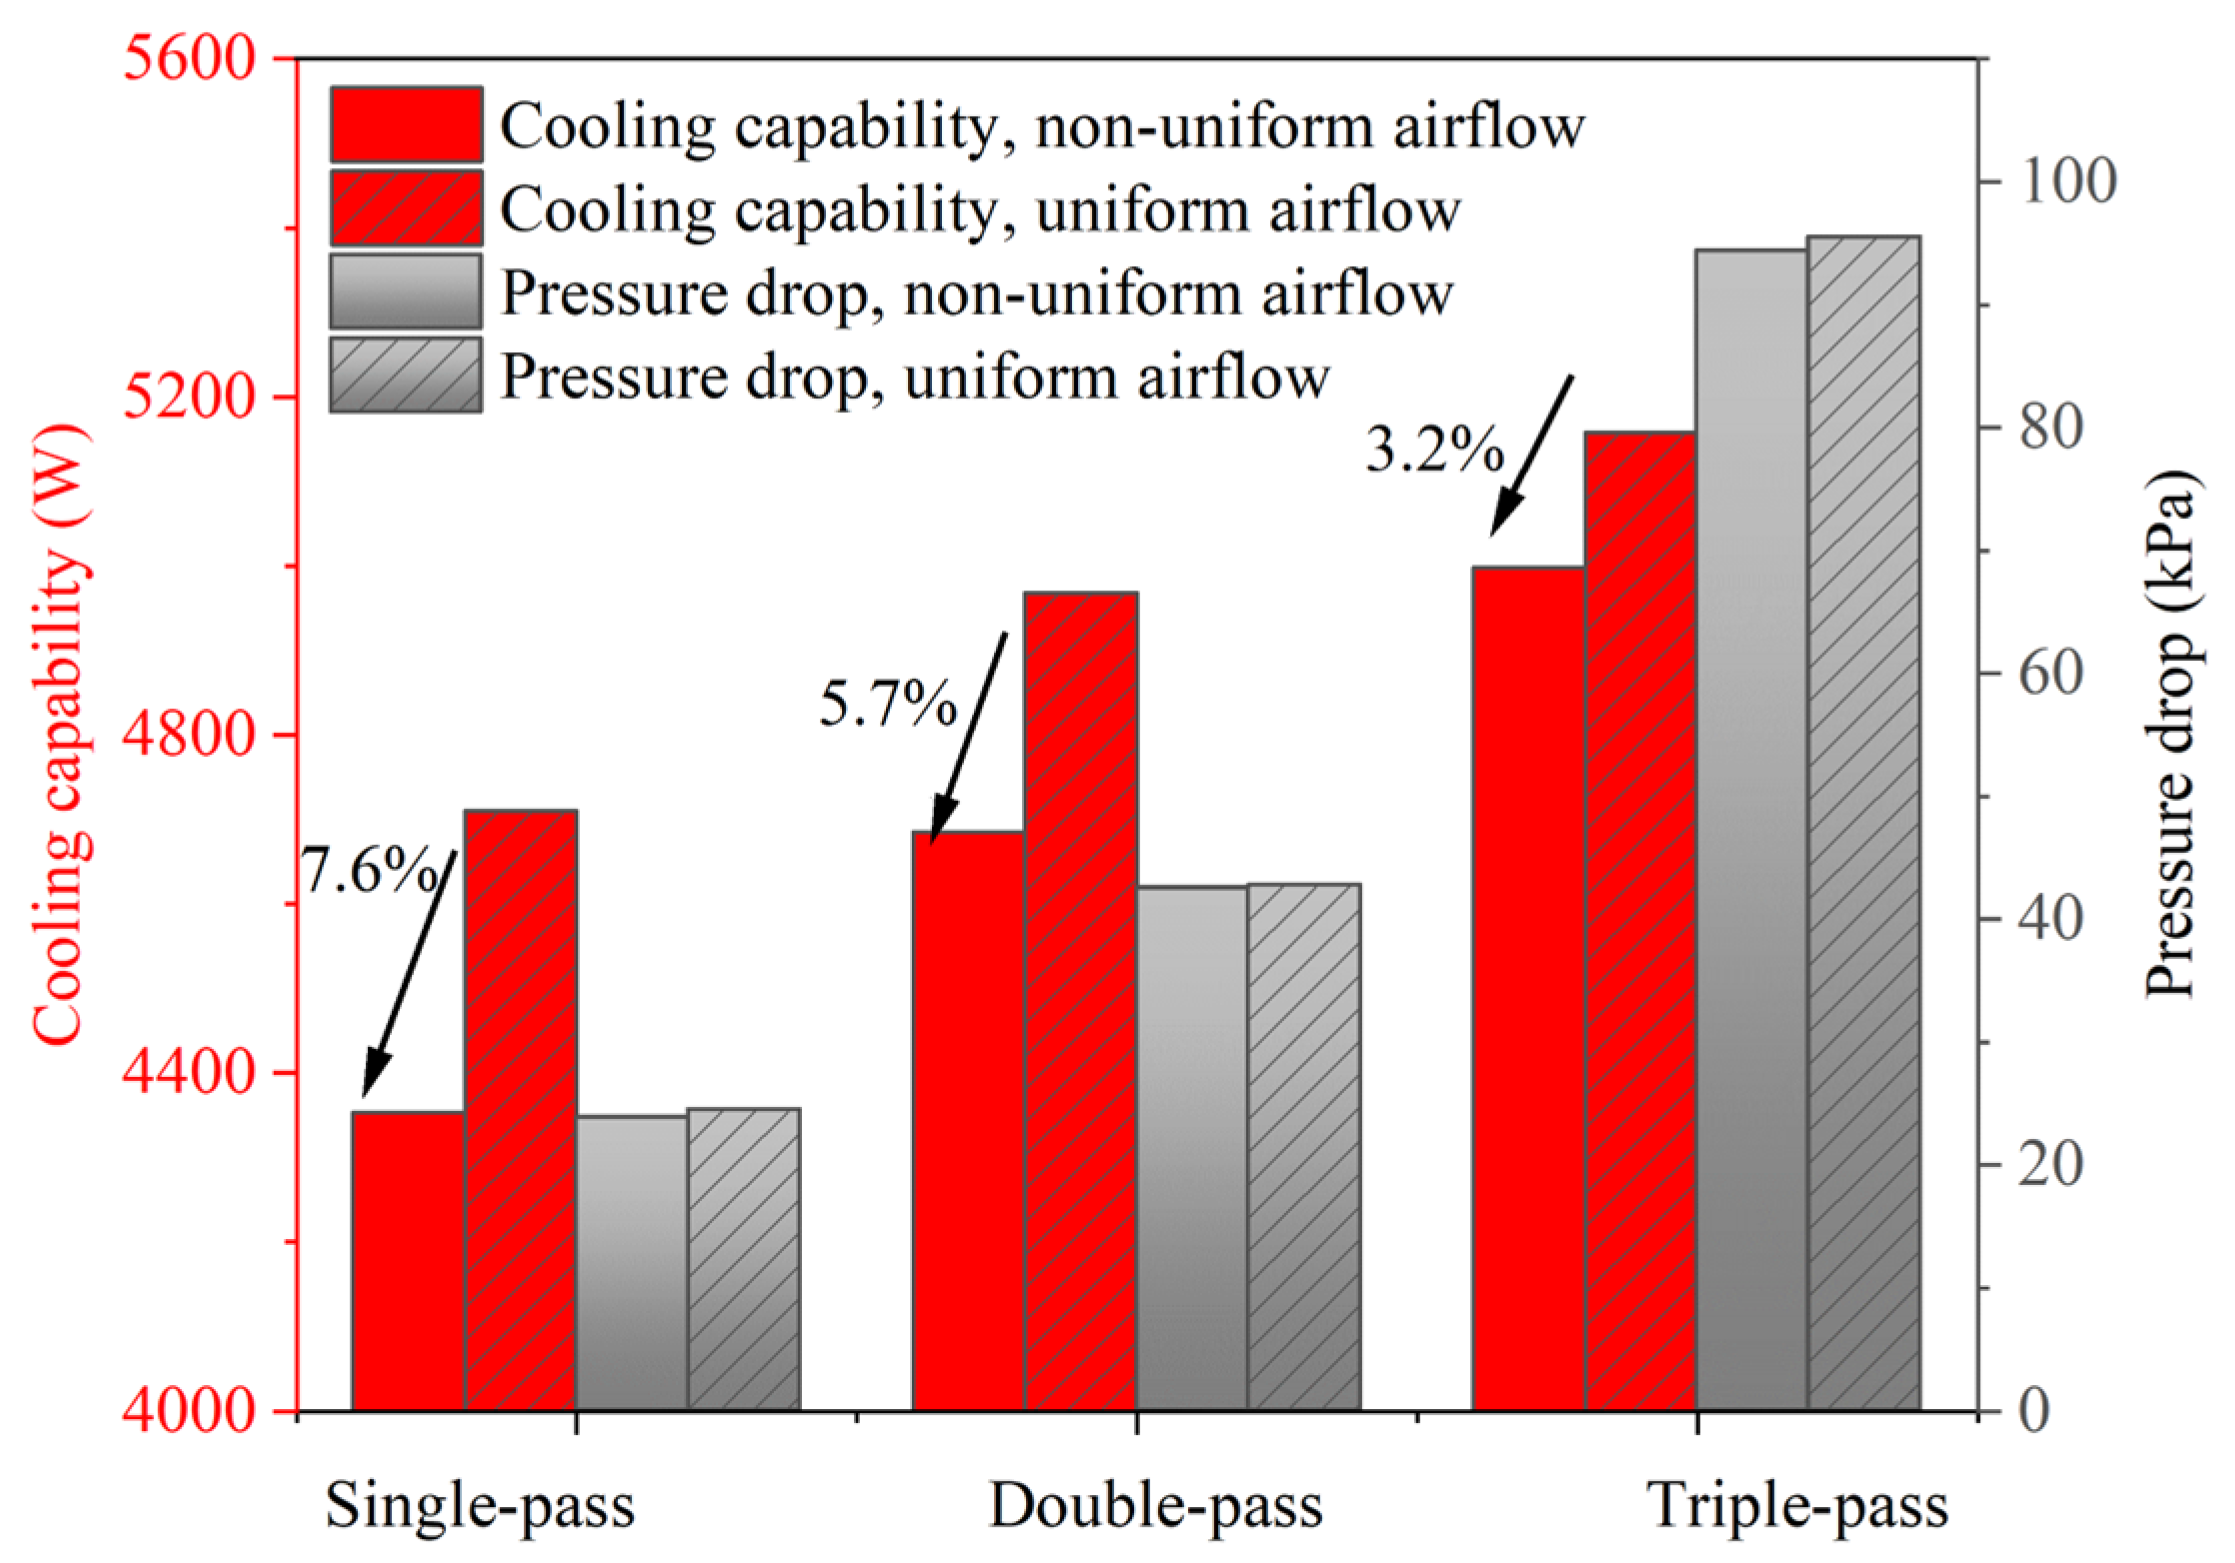
4.3. Effect of Non-Uniform Air Flow on the Multi-Pass PFHE
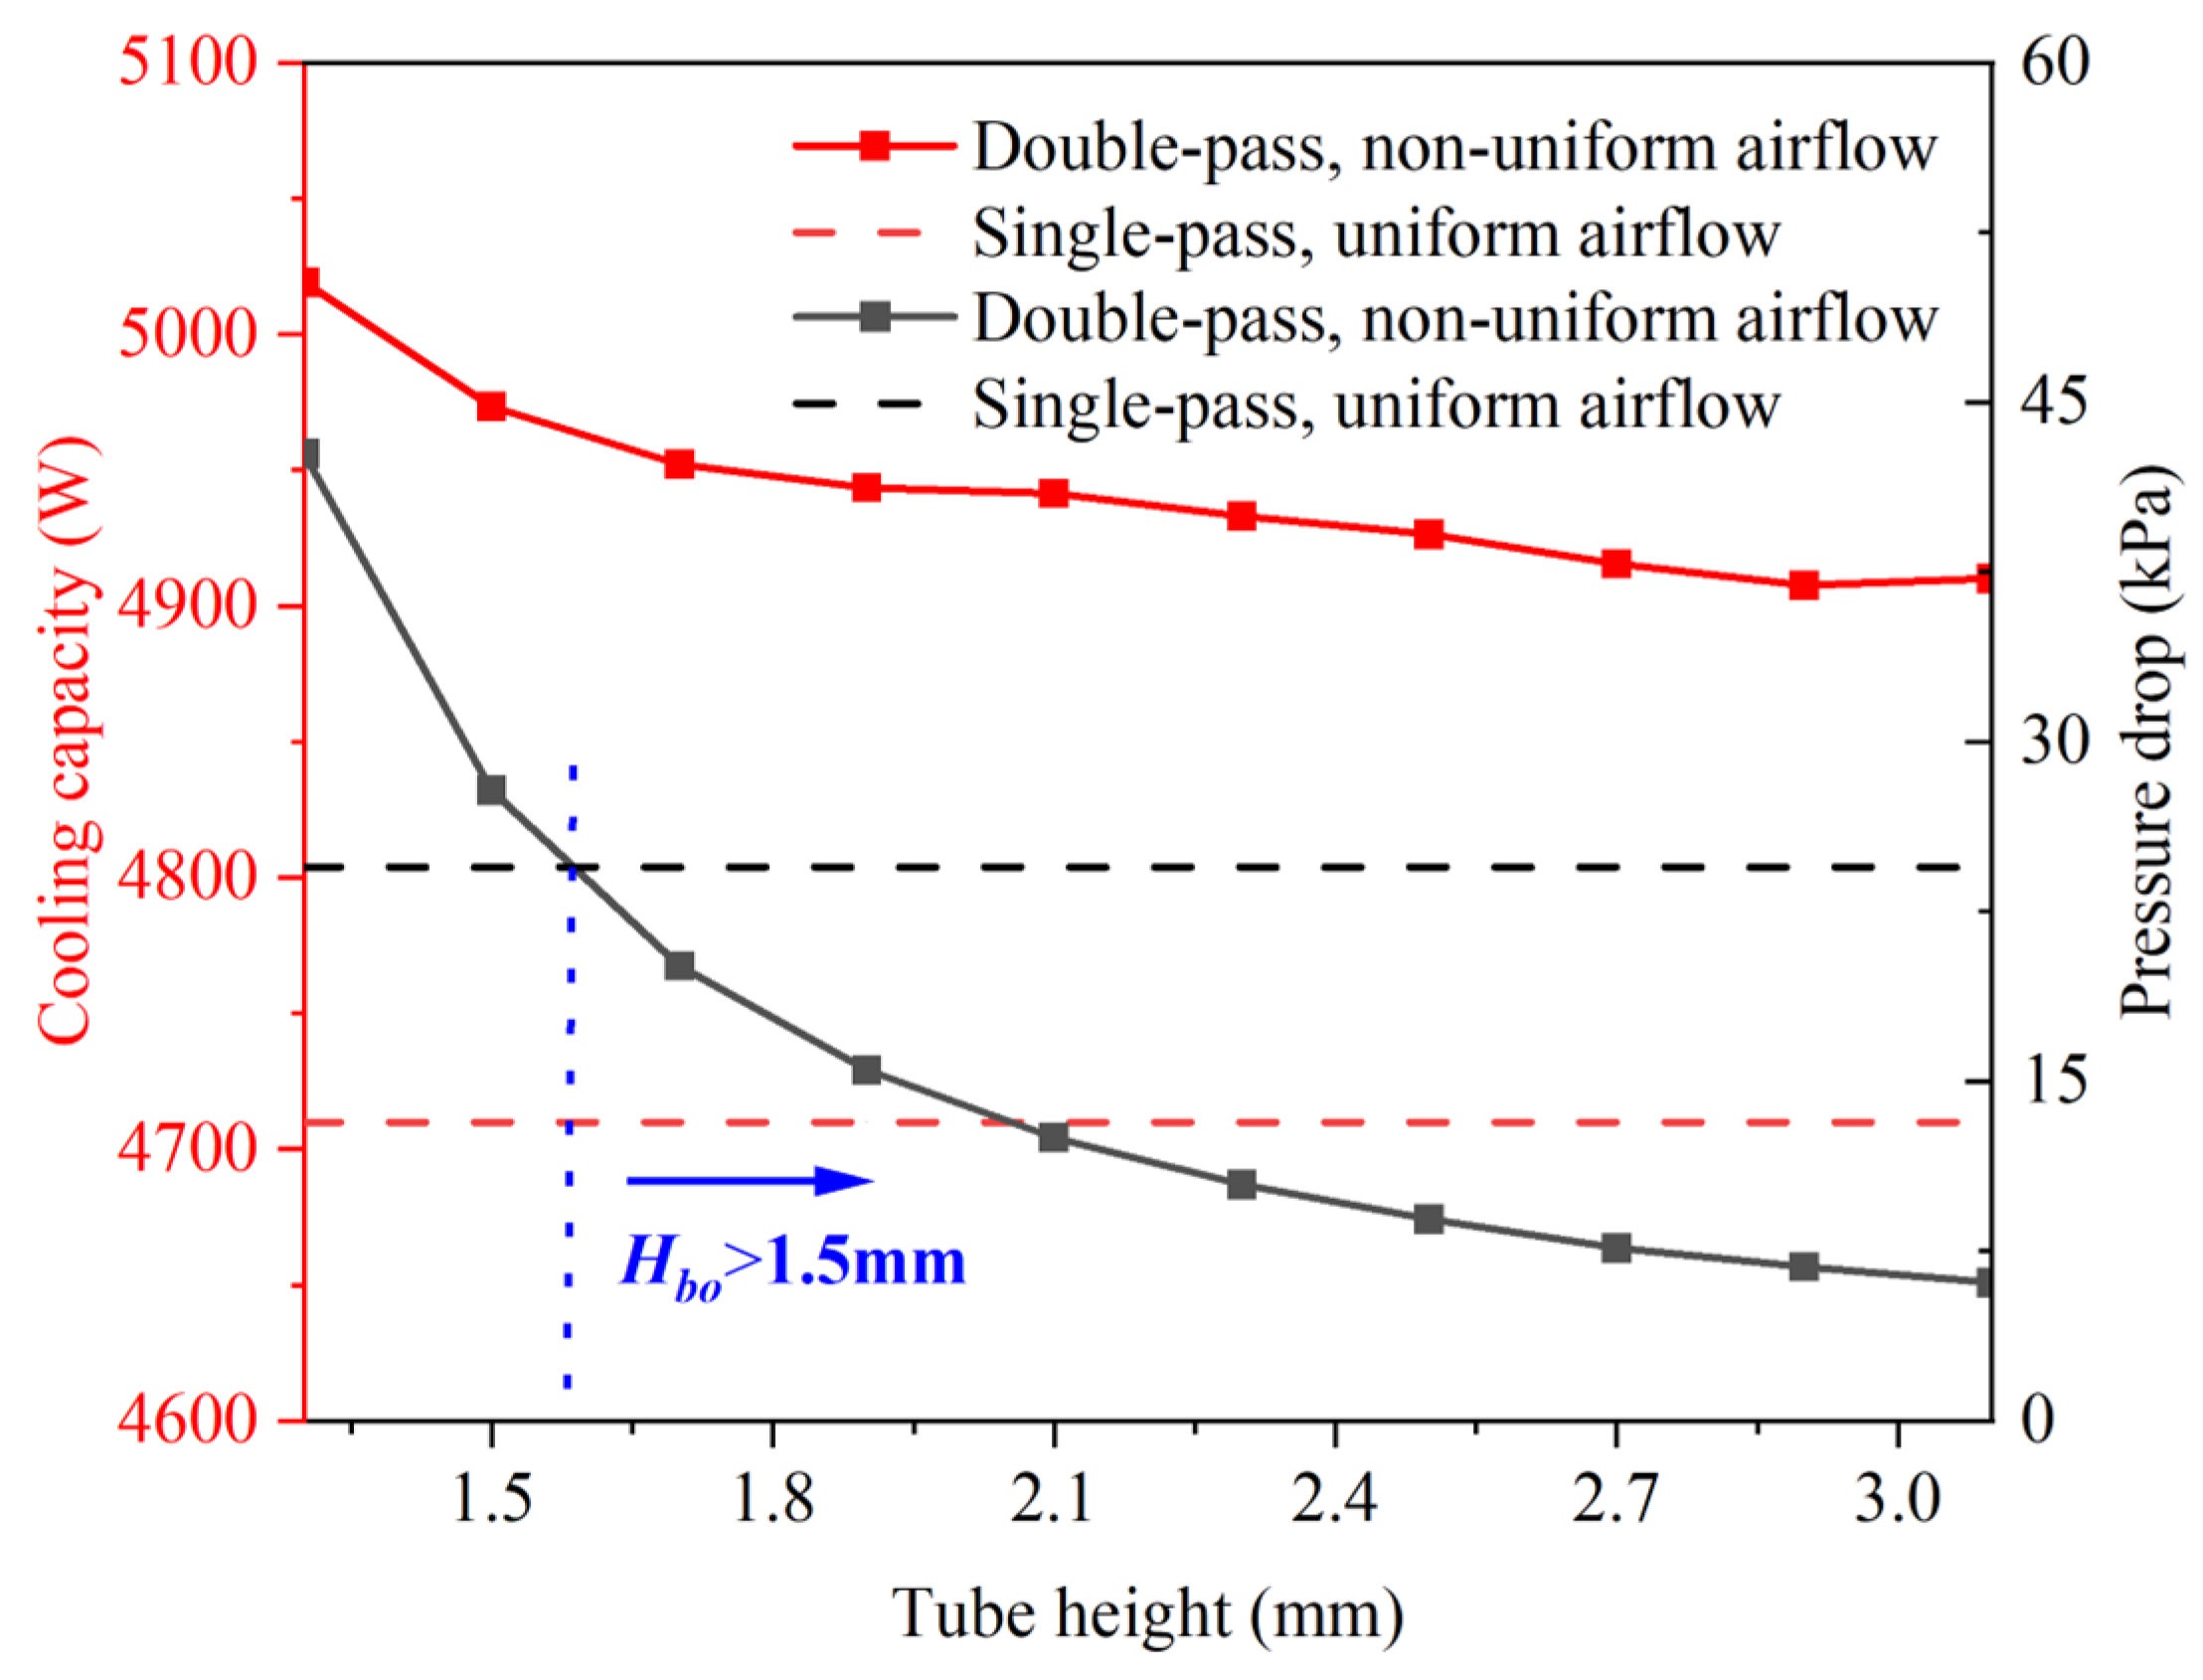
4.4. Structural Optimization
5. Conclusions
- Enhancing the vapor quality at the outlet improves system performance. The PTCS achieves optimal performance when the PFHE outlet reaches a vapor quality of one or exhibits slight superheating. However, non-uniform airflow induces localized overheating, which restricts further increases in outlet vapor quality, thereby limiting system performance improvements.
- For cooling systems where the PFHE outlet remains in a two-phase state, non-uniform temperature distributions have a limited impact on cooling capacity, with variations remaining within 3% compared to uniform airflow conditions. However, the influence on pressure drop is more pronounced: when the air temperature is higher in the upstream region, the pressure drop increases by 7%, whereas higher temperatures in the downstream region reduce the pressure drop by 7.7%. Therefore, in data center cooling applications where the PFHE outlet remains in a two-phase state, concentrating heat dissipation in the downstream section of the heat exchanger is preferred.
- Multi-pass configurations effectively alleviate localized overheating caused by airflow non-uniformity. Compared to uniform airflow conditions, the cooling capacity of single-pass, dual-pass, and triple-pass PFHEs decreases by 7.6%, 5.7%, and 3.2%, respectively. However, increasing the number of passes significantly raises the pressure drop, leading to a substantial increase in system resistance.
- Optimizing flat tube height effectively controls flow resistance associated with multi-pass configurations. By adjusting the flat tube height, dual-pass PFHEs demonstrate superior cooling performance and lower pressure drops under non-uniform airflow conditions, making them a more effective solution for pump-driven two-phase cooling systems in data center cabinets.
Author Contributions
Funding
Data Availability Statement
Conflicts of Interest
References
- Zhao, R.; Du, Y.; Yang, X.; Zhou, Z.Y.; Wang, W.; Yang, X.-X. A critical review on the thermal management of data center for local hotspot elimination. Energy Build. 2023, 2023, 113486. [Google Scholar] [CrossRef]
- Chu, W.; Wang, C.-C. A review on airflow management in data centers. Appl. Energy 2019, 240, 84–119. [Google Scholar] [CrossRef]
- Lim, S.-Y.; Chang, H.-J. Airflow management analysis to suppress data center hot spots. Build. Environ. 2021, 197, 107843. [Google Scholar] [CrossRef]
- Yuan, X.; Zhou, X.; Liu, J.; Wang, Y.; Risto, K.; Xu, X. Experimental and numerical investigation of an airflow management system in data center with lower-side terminal baffles for servers. Build. Environ. 2019, 155, 308–319. [Google Scholar] [CrossRef]
- Patankar, S.V. Airflow and Cooling in a Data Center. J. Heat Transf. 2010, 132, 073001. [Google Scholar] [CrossRef]
- Cho, J.; Yang, J.; Park, W. Evaluation of air distribution system’s airflow performance for cooling energy savings in high-density data centers. Energy Build. 2014, 68, 270–279. [Google Scholar] [CrossRef]
- Srinarayana, N.; Fakhim, B.; Behnia, M.; Armfield, S.W. Thermal Performance of an Air-Cooled Data Center With Raised-Floor and Non-Raised-Floor Configurations. Heat Transf. Eng. 2013, 35, 384–397. [Google Scholar] [CrossRef]
- Arghode, V.K.; Sundaralingam, V.; Joshi, Y.; Phelps, W. Thermal characteristics of open and contained data center cold aisle. J. Heat Transf. 2013, 135, 061901. [Google Scholar] [CrossRef]
- Choo, K.; Galante, R.M.; Ohadi, M.M. Energy consumption analysis of a medium-size primary data center in an academic campus. Energy Build. 2014, 76, 414–421. [Google Scholar] [CrossRef]
- Gupta, R.; Asgari, S.; Moazamigoodarzi, H.; Pal, S.; Puri, I.K. Cooling architecture selection for air-cooled Data Centers by minimizing exergy destruction. Energy 2020, 201, 117625. [Google Scholar] [CrossRef]
- Zhang, H.; Shao, S.; Xu, H.; Zou, H.; Tian, C. Free cooling of data centers: A review. Renew. Sustain. Energy Rev. 2014, 35, 171–182. [Google Scholar] [CrossRef]
- Wang, C.; Li, Z.; Xu, P.; Hou, Y.; Tan, D.; Li, L. Collision modeling approach and transient response mechanism of ring-ribbed cylindric shells for underwater vehicles. Appl. Math. Model. 2025, 141, 115923. [Google Scholar] [CrossRef]
- Tan, Y.; Ni, Y.; Wu, J.; Li, L.; Tan, D. Machinability evolution of gas–liquid-solid three-phase rotary abrasive flow finishing. Int. J. Adv. Manuf. Technol. 2024, 131, 2145–2164. [Google Scholar] [CrossRef]
- Guo, H.-B.; Chen, J.-Y.; Li, Z.-D.; Liu, X.-H.; Li, N.; Tao, W.-Q. FNM-based rack model and CFD-FNM coupling framework for data center rack-level simulation. Build. Environ. 2025, in press.
- Saiyad, A.; Fulpagare, Y.; Bhargav, A. Comparison of Detached Eddy Simulation and Standard k—ε RANS Model for Rack-Level Airflow Analysis Inside a Data Center. Build. Simul. 2022, 15, 1595–1610. [Google Scholar] [CrossRef]
- Cui, D.E.; Zhou, C.; Luo, Y.; Lei, Q.; Tian, Z.; Zhang, S.; Fan, J.; Zhang, L. Multi-scale modeling and fast inference for thermal environment analysis of air-cooled data center. J. Build. Eng. 2023, 78, 107722. [Google Scholar] [CrossRef]
- Samadiani, E.; Joshi, Y.; Allen, J.K.; Mistree, F. Adaptable Robust Design of Multi-Scale Convective Systems Applied to Energy Efficient Data Centers. Numer. Heat Transf. Part A Appl. 2010, 57, 69–100. [Google Scholar] [CrossRef]
- Joshi, Y.; Kumar, P. Energy Efficient Thermal Management of Data Centers; Springer Science & Business Media: Berlin/Heidelberg, Germany, 2012. [Google Scholar]
- Liu, W.; Lian, S.; Fang, X.; Shang, Z.; Wu, H.; Zhu, H.; Hu, S. An open-source and experimentally guided CFD strategy for predicting air distribution in data centers with air-cooling. Build. Environ. 2023, 242, 110542. [Google Scholar] [CrossRef]
- Kim, M.-H.; Bullard, C. Air-side thermal hydraulic performance of multi-louvered fin aluminum heat exchangers. Int. J. Refrig. 2002, 25, 390–400. [Google Scholar] [CrossRef]
- Abu-Hamdeh, N.H.; Salilih, E.M. Numerical modelling of a parallel flow heat exchanger with two-phase heat transfer process. Int. Commun. Heat Mass Transf. 2021, 120, 105005. [Google Scholar] [CrossRef]
- Yang, P.; Ling, W.; Tian, K.; Zeng, M.; Wang, Q. Flow distribution and heat transfer performance of two-phase flow in parallel flow heat exchange system. Energy 2023, 270, 126957. [Google Scholar] [CrossRef]
- Yue, C.; Zhang, Q.; Zhai, Z.; Ling, L. Numerical investigation on thermal characteristics and flow distribution of a parallel micro-channel separate heat pipe in data center. Int. J. Refrig. 2019, 98, 150–160. [Google Scholar] [CrossRef]
- Yue, C.; Zhang, Q.; Zhai, Z.; Ling, L. CFD simulation on the heat transfer and flow characteristics of a microchannel separate heat pipe under different filling ratios. Appl. Therm. Eng. 2018, 139, 25–34. [Google Scholar] [CrossRef]
- Moazamigoodarzi, H.; Pal, S.; Down, D.; Esmalifalak, M.; Puri, I.K. Performance of a rack mountable cooling unit in an IT server enclosure. Therm. Sci. Eng. Prog. 2020, 17, 100395. [Google Scholar] [CrossRef]
- Zhou, X.; Yuan, X.; Xu, X.; Liu, J.; Kosonen, R.; Liu, C. Research on the thermal performance of rack-level composite baffle diversion system for data centre. Energy Effic. 2020, 13, 1245–1262. [Google Scholar] [CrossRef]
- Tian, H.; He, Z.; Li, Z. A combined cooling solution for high heat density data centers using multi-stage heat pipe loops. Energy Build. 2015, 94, 177–188. [Google Scholar] [CrossRef]
- Tong, Z.; Liu, X.-H.; Jiang, Y. Experimental study of the self-regulating performance of an R744 two-phase thermosyphon loop. Appl. Energy 2017, 186, 1–12. [Google Scholar] [CrossRef]
- Yao, H.; Guo, L.; Liu, H.; Wang, X.; Chen, H.; Wang, Y.; Zhu, Y. Characteristics of phase-change flow and heat transfer in loop thermosyphon: Three-dimension CFD modeling and experimentation. Case Stud. Therm. Eng. 2022, 35, 102070. [Google Scholar] [CrossRef]
- Chang, S.W.; Lo, D.C.; Chiang, K.F.; Lin, C.Y. Sub-atmospheric boiling heat transfer and thermal performance of two-phase loop thermosyphon. Exp. Therm. Fluid Sci. 2012, 39, 134–147. [Google Scholar] [CrossRef]
- Zhou, F.; Wei, C.; Ma, G. Development and analysis of a pump-driven loop heat pipe unit for cooling a small data center. Appl. Therm. Eng. 2017, 124, 1169–1175. [Google Scholar] [CrossRef]
- Zhou, F.; Li, C.; Zhu, W.; Zhou, J.; Ma, G.; Liu, Z. Energy-saving analysis of a case data center with a pump-driven loop heat pipe system in different climate regions in China. Energy Build. 2018, 169, 295–304. [Google Scholar] [CrossRef]
- Zhou, F.; Duan, W.; Ma, G. Thermal performance of a multi-loop pump-driven heat pipe as an energy recovery ventilator for buildings. Appl. Therm. Eng. 2018, 138, 648–656. [Google Scholar] [CrossRef]
- Sun, X.; Zhang, C.; Han, Z.; Dong, J.; Zhang, Y.; Li, M.; Li, X.; Wang, Q.; Wen, Z.; Zheng, B. Experimental study on a novel pump-driven heat pipe/vapor compression system for rack-level cooling of data centers. Energy 2023, 274, 127335. [Google Scholar] [CrossRef]
- Xiang, J.; Luo, L.; Wang, X.; Shittu, S.; Wang, Z.; Zhao, X.; Weng, C. Experimental investigation of a novel micro-channel flat loop heat pipe (MC-FLHP) for data center cooling and heat recovery. Int. J. Green Energy 2022, 19, 1318–1332. [Google Scholar] [CrossRef]
- Nadjahi, C.; Louahlia-Gualous, H.; Le Masson, S.J.H.; Transfer, M. Experimental study and analytical modeling of thermosyphon loop for cooling data center racks. Heat Mass Transf. 2020, 56, 121–142. [Google Scholar] [CrossRef]
- Hu, M.; Luo, L.; Badiei, A.; Chen, F.; Zheng, S.; Wang, Z.; Zhao, X. Performance investigation of a micro-channel flat separated loop heat pipe system for data centre cooling. Int. J. Low-Carbon Technol. 2021, 16, 98–113. [Google Scholar] [CrossRef]
- Xue, Z.H.; Qu, W.; Xie, M.H. High performance loop heat pipe with flat evaporator for energy-saving cooling systems of supercomputers. J. Heat Transf. 2020, 142, 031901. [Google Scholar] [CrossRef]
- Ling, L.; Zhang, Q.; Yu, Y.; Liao, S.; Sha, Z. Experimental study on the thermal characteristics of micro channel separate heat pipe respect to different filling ratio. Appl. Therm. Eng. 2016, 102, 375–382. [Google Scholar] [CrossRef]
- Wittmeier, F.; Kuthada, T. Open Grille DrivAer Model-First Results. SAE Int. J. Passeng. Cars-Electron. Electr. Syst. 2015, 8, 252–260. [Google Scholar] [CrossRef]
- Zhang, C.; Uddin, M.; Robinson, A.C.; Foster, L. Full vehicle CFD investigations on the influence of front-end configuration on radiator performance and cooling drag. Appl. Therm. Eng. 2018, 130, 1328–1340. [Google Scholar] [CrossRef]
- Zhao, L.; Wang, B.; Wang, J.; Zhu, Z.; Li, T.; Guo, B.; Zhang, J.; Zhang, H.; Yang, Z. Effect of non-uniform airflow on the performance of a parallel-flow heat exchanger considering internal fluid distribution—Simulation studies and its experimental validation. Appl. Therm. Eng. 2020, 180, 115685. [Google Scholar] [CrossRef]
- Jugert, R.; Martin, K.T.; Mönkediek, T.; Rieberer, R. Influences of Non-Uniform Airflow on the Performance of a R134a Mobile Air Conditioning System. In Proceedings of the Thermal System Efficiencies Summit, Stockholm, Sweden, 14–17 June 2009. [Google Scholar]
- Pisano, A. Analysis of the Condensation Process and Air Maldistribution in Finned Tube and Minichannel Condensers. Ph.D. Thesis, Universitat Politecnica de Valencia, Valencia, Spain, 2017. [Google Scholar]
- Datta, S.P.; Das, P.K.; Mukhopadhyay, S. Performance of a condenser of an automotive air conditioner with maldistribution of inlet air—Simulation studies and its experimental validation. Int. J. Heat Mass Transf. 2016, 98, 367–379. [Google Scholar] [CrossRef]
- Song, X.; Huang, D.; Liu, X.; Chen, Q. Effect of non-uniform air velocity distribution on evaporator performance and its improvement on a residential air conditioner. Appl. Therm. Eng. 2012, 40, 284–293. [Google Scholar] [CrossRef]
- Ellsworth, M.J. New ASHRAE Thermal Guidelines for Air and Liquid Cooling; SC Companion: Salt Lake City, UT, USA, 2012; pp. 942–961. [Google Scholar]
- Gnielinski, V. New equations for heat and mass transfer in the turbulent flow in pipes and channels. NASA STI/Recon Tech. Rep. A 1975, 41, 8–16. [Google Scholar]
- Gungor, K.E.; Winterton, R.H.S. Simplified general correlation for saturated flow boiling and comparisons of correlations with data. Chem. Eng. Res. Des. 1987, 65, 148–156. [Google Scholar]
- Churchill, S.W. Friction-factor equation spans all fluid-flow regimes. Chem. Eng. Res. Des. 1977, 84, 91–92. [Google Scholar]
- Ling, L.; Zhang, Q.; Yu, Y.; Wu, Y.; Liao, S.; Sha, Z. Simulation of a micro channel separate heat pipe (MCSHP) under low heat flux and low mass flux. Appl. Therm. Eng. 2017, 119, 25–33. [Google Scholar] [CrossRef]
- Friedel, L. Improved Friction Pressure Drop Correlation for Horizontal and Vertical Two-Phase Pipe Flow. In Proceedings of the European Two-Phase Flow Group Meet, Ispra, Italy, 5–8 June 1979; pp. 485–491. [Google Scholar]
- Müller-Steinhagen, H.M.; Heck, K. A simple friction pressure drop correlation for two-phase flow in pipes. Chem. Eng. Process. 1986, 20, 297–308. [Google Scholar] [CrossRef]
- Zhang, P.; Li, X.; Shi, W.; Wang, B.; Rong, X. Experimentally comparative study on two-phase natural and pump-driven loop used in HVAC systems. Appl. Therm. Eng. 2018, 142, 321–333. [Google Scholar] [CrossRef]
- Wang, X.; Wen, Q.; Yang, J.; Xiang, J.; Wang, Z.; Weng, C.; Chen, F.; Zheng, S. A review on data centre cooling system using heat pipe technology. Sustain. Comput. Inform. Syst. 2022, 35, 100774. [Google Scholar] [CrossRef]


| Parameter | Value (Unit) | Parameter | Value (Unit) |
|---|---|---|---|
| Tube outer width Bbo | 32 mm | Tube inner width Bbi | 30.7 mm |
| Tube outer height Hbo | 1.3 mm | Tube inner height Hbi | 0.74 mm |
| Tube inner height Hbi | 31 | Wall thickness δw | 0.31 mm |
| Fin width Bf | 32 mm | Fin height Hf | 8 mm |
| Fin spacing Pf | 1.1 mm | Fin thickness δf | 0.1 mm |
| Lover angle θ | 30° | Louver pitch Pl | 1 mm |
| Louver length Ll | 8 mm | Header diameter D | 38 mm |
| Tube length L | 1400 mm | Number of flat pipes | 46 |
| Refrigerant Flow Rate (L/min) | Outlet Air Temperature (°C) 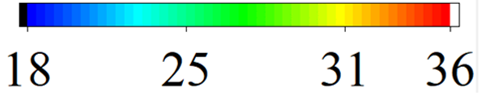 | Vapor Quality  | Refrigerant Local HTC (W/m2 °C)  |
|---|---|---|---|
| Q = 1.79 | 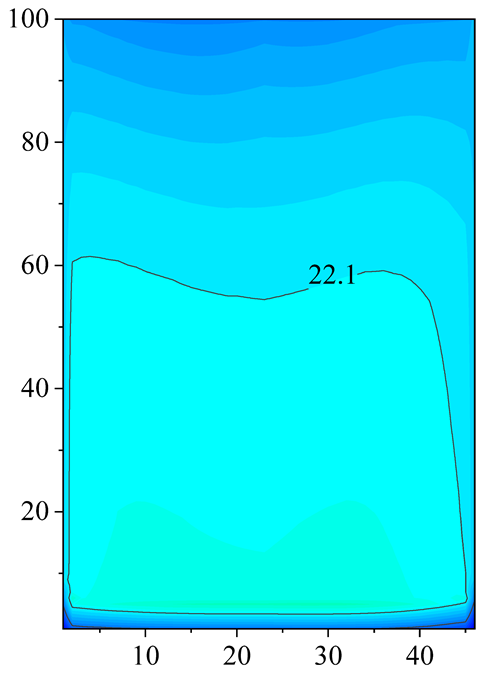 |  | 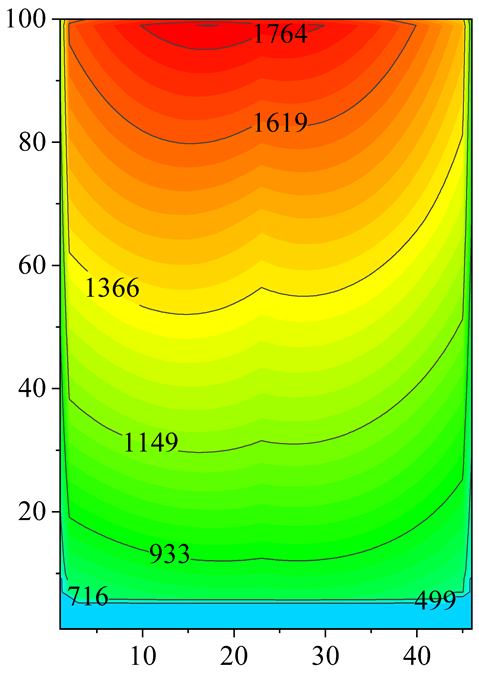 |
| Q = 1.52 | 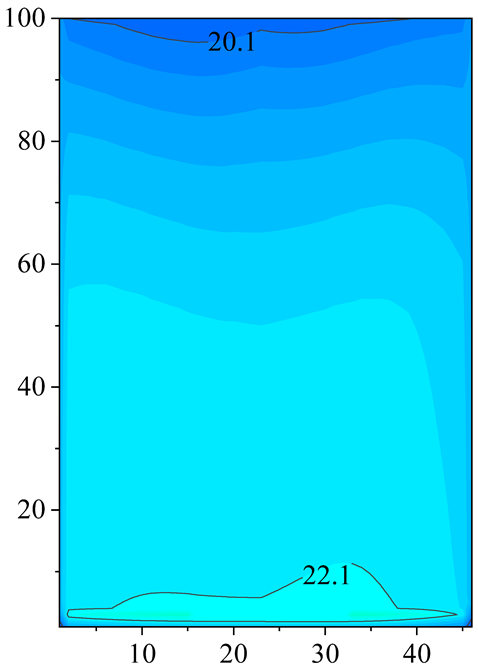 |  |  |
| Q = 1.28 |  |  |  |
| Q = 1.05 |  |  |  |
| Parameter | Outlet Air Temperature (°C)  | Vapor Quality  | Refrigerant Local HTC (W/m2 °C)  |
|---|---|---|---|
| Double-pass |  |  |  |
| Triple-pass |  |  |  |
Disclaimer/Publisher’s Note: The statements, opinions and data contained in all publications are solely those of the individual author(s) and contributor(s) and not of MDPI and/or the editor(s). MDPI and/or the editor(s) disclaim responsibility for any injury to people or property resulting from any ideas, methods, instructions or products referred to in the content. |
© 2025 by the authors. Licensee MDPI, Basel, Switzerland. This article is an open access article distributed under the terms and conditions of the Creative Commons Attribution (CC BY) license (https://creativecommons.org/licenses/by/4.0/).
Share and Cite
Cheng, H.; Yang, T.; Cheng, Q.; Zhao, Y.; Wang, L.; Yuan, W. Influence of Non-Uniform Airflow on Two-Phase Parallel-Flow Heat Exchanger in Data Cabinet Cooling System. Energies 2025, 18, 923. https://doi.org/10.3390/en18040923
Cheng H, Yang T, Cheng Q, Zhao Y, Wang L, Yuan W. Influence of Non-Uniform Airflow on Two-Phase Parallel-Flow Heat Exchanger in Data Cabinet Cooling System. Energies. 2025; 18(4):923. https://doi.org/10.3390/en18040923
Chicago/Turabian StyleCheng, Hao, Tongzhi Yang, Quan Cheng, Yifan Zhao, Leixin Wang, and Weixing Yuan. 2025. "Influence of Non-Uniform Airflow on Two-Phase Parallel-Flow Heat Exchanger in Data Cabinet Cooling System" Energies 18, no. 4: 923. https://doi.org/10.3390/en18040923
APA StyleCheng, H., Yang, T., Cheng, Q., Zhao, Y., Wang, L., & Yuan, W. (2025). Influence of Non-Uniform Airflow on Two-Phase Parallel-Flow Heat Exchanger in Data Cabinet Cooling System. Energies, 18(4), 923. https://doi.org/10.3390/en18040923