Article

Copper as a Critical Resource in the Energy Transition

by
Marta Podobińska-Staniec
*,
Anna Wiktor-Sułkowska
,
Arkadiusz Kustra
and
Sylwia Lorenc-Szot
Economics and Management of Raw Materials and Energy Transition Group, Faculty of Civil Engineering and Resource Management, AGH University, 30-059 Krakow, Poland
*
Author to whom correspondence should be addressed.
Energies 2025, 18(4), 969; https://doi.org/10.3390/en18040969
Submission received: 19 December 2024 / Revised: 25 January 2025 / Accepted: 13 February 2025 / Published: 17 February 2025
(This article belongs to the Special Issue Energy Consumption at Production Stages in Mining)

Abstract

:
The energy transition requires significant amounts of critical raw materials, with demand projected to continue increasing. Analyses indicate that the supply of these materials will fall short of the requirements for the energy transition plans based on renewable energy sources. To address this challenge, it is essential to examine the global value chains of critical raw materials and their intermediates, identifying the risks linked to concentrating downstream processes in countries that may not operate under market-oriented principles. Such countries could become “price makers” on international markets, influencing costs and availability. This article focuses on copper, a key raw material for the energy transition, and explores its global value chains in detail. It highlights the risks associated with copper extraction in regions with the largest identified deposits, such as South America and Africa, as well as challenges related to smelting and refining, which are predominantly carried out in China. Additionally, the article presents an analysis of the operations of KGHM Polska Miedź S.A., one of Europe’s largest copper producers, headquartered in Poland but also active in North and South America.

1. Introduction

Faced with the challenges of climate change, in the past decade, decarbonization and the energy transition have become key priorities and major challenges for many countries and communities around the world. One of the key aspects of the energy transition, for which the main projected values have been calculated for the period up to 2050, is the replacement of generation of energy from fossil fuels, including oil, gas and coal, with generation from renewable resources, such as wind, hydroelectric and solar power. In the EU, this development strategy to transform the European Union into a climate-neutral area has, since December 2019, been referred to as the European Green Deal. The strategy has more ambitious goals for 2030 and 2050. It calls for a 55% reduction in greenhouse gas emissions by 2023 compared to 1990, zero greenhouse gas emissions by 2050, and a shift away from fossil fuels to implementation of sustainable and clean energy with prioritization of the area of energy efficiency improvements [1]. The indicated goals seem extremely important, especially for hard to decarbonize industries where it is particularly difficult or impossible to move away from coal in favour of renewable energy, e.g., metallurgy, transportation, chemicals, etc.
As Xu et al. point out, the energy transition refers both to the reconstruction of the energy system from energy production to energy use, but also includes the transformation of economic and social systems brought about by the digitization and intelligence of new scenarios for energy management, transportation and use [2]. It is pointed out that the motivation for the energy transition is not only to reduce climate change and the environmental impact of the energy sector, but also to improve energy efficiency, ensure energy security, maintain the reliability of energy access, reduce costs, and promote sustainable development [3,4]. However, achieving these ambitious goals requires not only advanced technologies, but also access to key, sustainable raw materials needed for clean energy generation technologies, as well as digital, space or defence technologies [5]. In advanced technologies, a key role is played by devices that use elements containing elements classified as CRMs (critical raw materials)—the raw materials whose economic importance to the EU is growing year by year, and which are inherently exhaustible. These raw materials have a strategic impact on the energy transition (they are used in photovoltaic cells, electrolysers, synthetic fuels, wind turbines, and batteries or fuel cells, among others), but due to the scarcity of geological resources, their concentration in different regions of the world, geopolitical issues, trade policy issues or the lack of good, affordable substitutes, their supply is very likely to be disrupted. In this context, consideration of critical raw materials (CRMs) and their relationship to the risk of supply chain disruption, appears to be one of the key issues for achieving a global green energy transition. According to the World Bank, the list of critical minerals that are essential for the transition to green energy mainly includes aluminium, chromium, cobalt, copper, graphite, indium, iron, lead, lithium, manganese, molybdenum, neodymium, nickel, silver, titanium, vanadium and zinc [6].
Of particular importance in this set is copper, which, due to its properties, is fundamental for the energy transition. All the technologies considered in this context, whether related to photovoltaics, wind farms, energy storage or electromobility, consume copper. According to a Goldman Sachs report [7], the critical role that copper plays in achieving climate goals cannot be overstated. Due to its electrical conductivity and low reactivity, copper is the most cost-effective material for renewable energy storage and transportation. Based on the Goldman Sachs report [7], copper is the ’new oil’ of the 21st century, and complete decarbonization will not be possible without this commodity. According to forecasts, the green transition will contribute to a surge in demand for copper: analysts estimate that the copper demand associated with the energy transition will increase by nearly 600% by 2030 to 5.4 million tons in the baseline scenario (with rapid and intensive deployment of green technologies, the demand could increase by as much as 900% to 8.7 million tons) [7].
This article aims to contribute to the discussion on the energy transition currently taking place in the world, especially in Europe. The role of critical raw materials in the process of change is highlighted, and the risks that are associated with the acquisition of raw materials and the possible lack thereof for the development of renewable technologies for generating electricity are noted.
Special attention was paid to the role of copper in the energy transition and its acquisition, along with identification of the copper value chain worldwide.
Since Poland also has copper ore reserves and is a significant producer, the country’s copper value chain was also identified and the exports and imports of products that arise at the main stages of this chain were analysed. In order to practically illustrate the phenomena occurring in the industry, the Polish copper producer KGHM Polska Miedź SA was analysed as a provider of strategic raw materials and other materials for low carbon and renewable installations providing capabilities for the transformation and energy security at the same time.
The research questions that the authors of this article seek to answer are as follows:
  • What is the role of copper used in technologies for the energy transition, and how can the growing demand be met while addressing the supply gap?
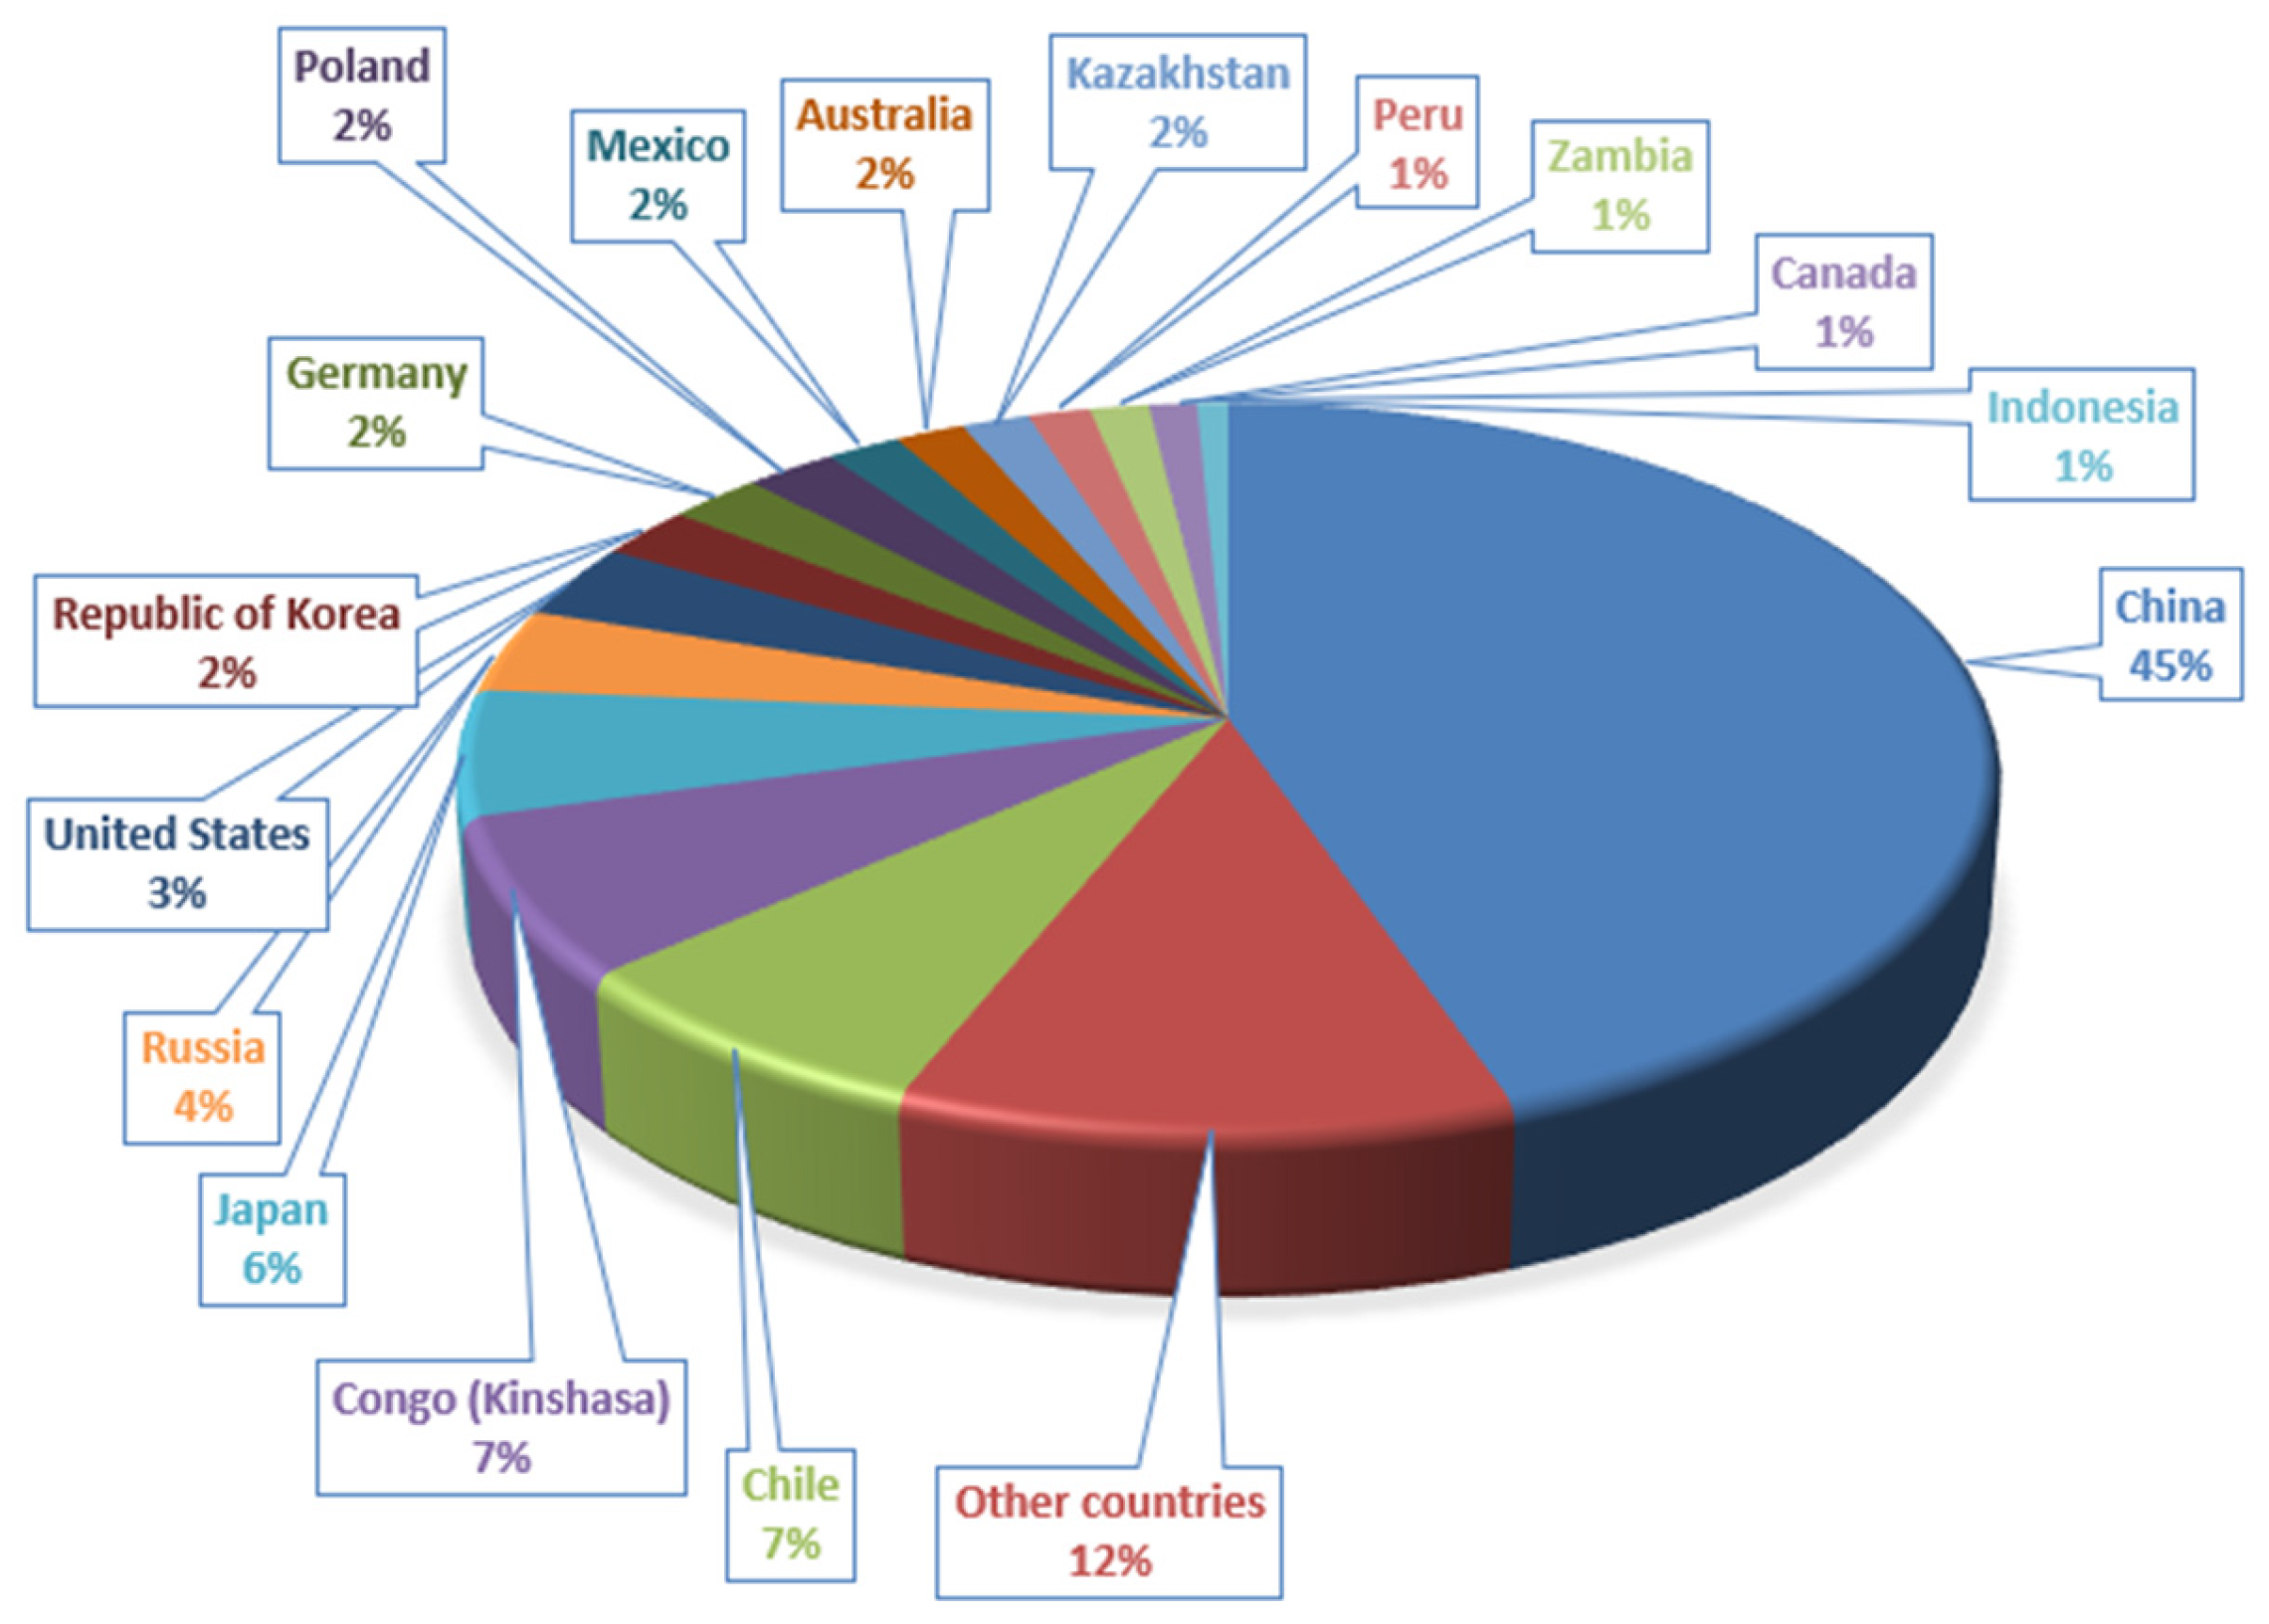
  • How are the copper products that form the particular value chain stages traded on world markets?
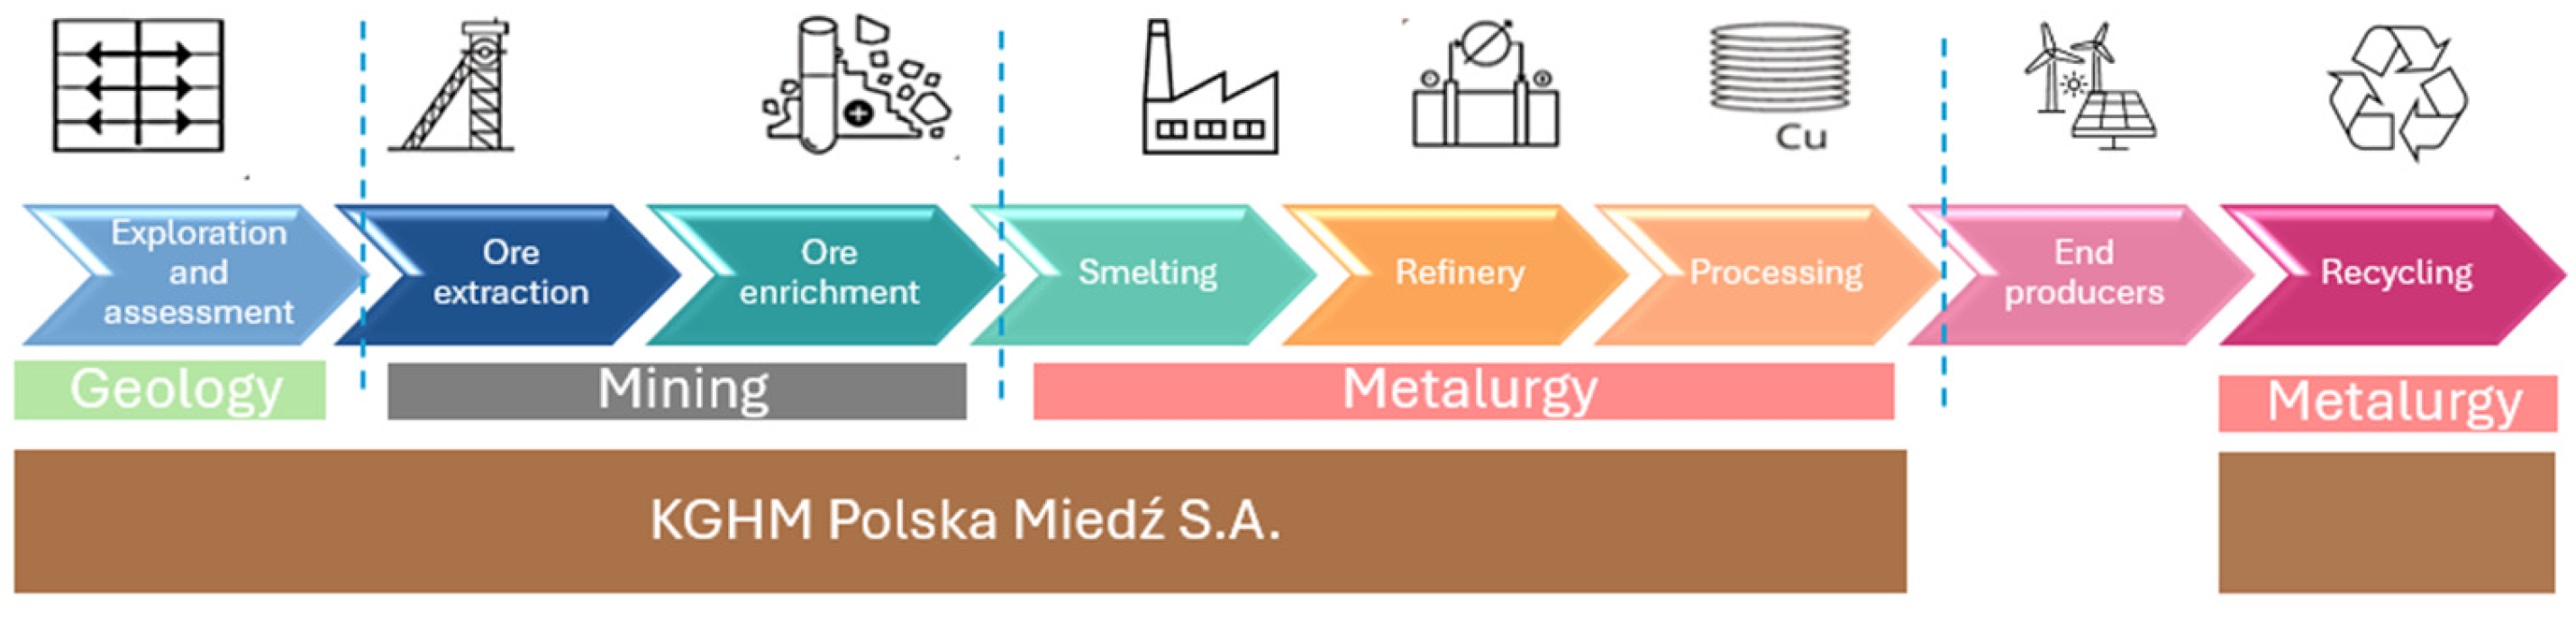
  • How does Poland as a country provide copper products for the energy transition and how is this activity organized through KGHM SA?

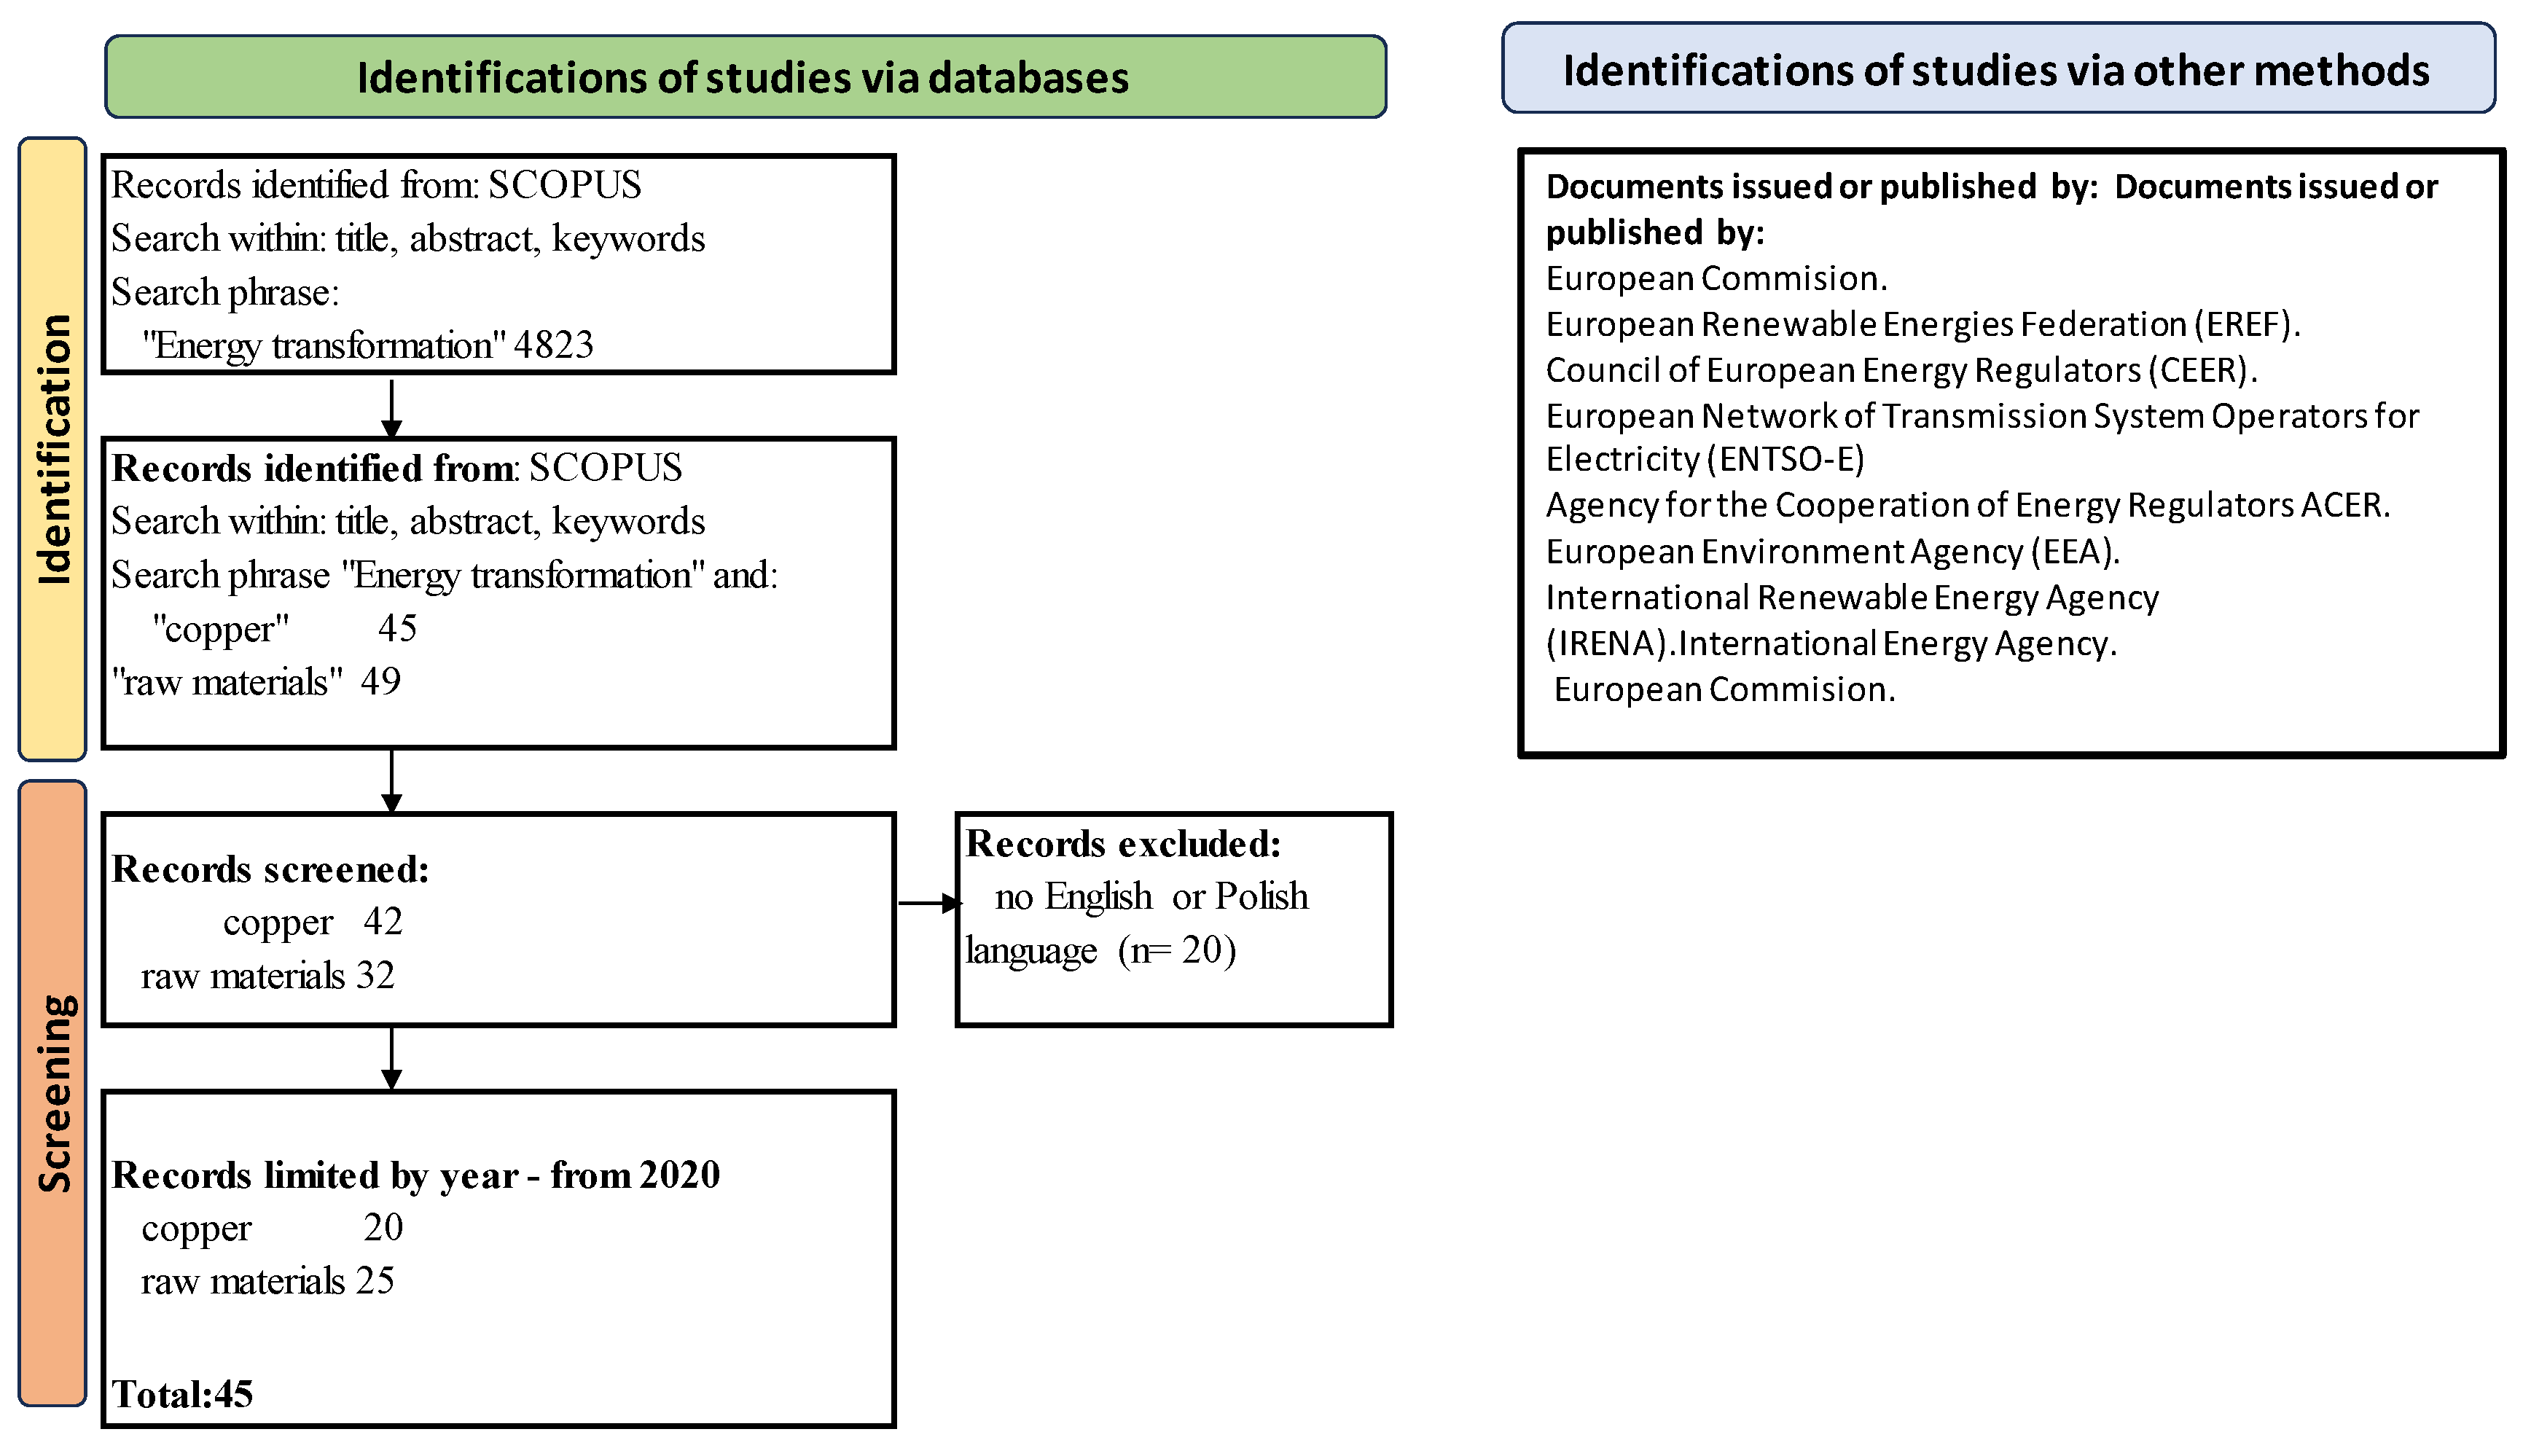
2. Materials and Methods

To determine the current state of the art, a literature search was conducted by looking for papers related to the issue of “Energy transformation” in the Scopus database. This search showed that, over the years, the term has appeared as many as 4823 times, mostly since 2020. To examine the literature of the subject matter covered in this paper, the Scopus database was searched (with an initial result of 4823 papers) according to the Prisma method presented in Figure 1. This process finally yielded 45 papers published since 2020 and indicated the existence of a secondary source of literature, which is documents issued by European decision-making units.
The growing global demand for energy and environmental restrictions on the use of fossil fuels have prompted intensive research into sustainable, clean, low-cost and, above all, environmentally friendly energy sources. Most of the selected papers deal with topics related to the study of the chemical properties of minerals for the purpose of better generation or conduction of new generation energy, including [8,9,10,11,12,13,14,15,16,17].
Climate change and the energy transition have caused massive changes in the energy system, leading to a great degree of uncertainty around materials, energy and carbon emissions in the power generation infrastructure. Chinese researchers are well aware of this fact, with numerous studies analysing the links between materials, energy and carbon emissions in China [18,19,20,21,22,23,24,25].
The effective use of critical raw materials while ensuring optimal economic conditions in countries is examined in two studies [26,27].
It is also possible to distinguish a group of studies in which the use of copper in the context of energy creation and storage is central. These include work investigating tetrapyrrole ligands, such as porphyrin-, phthalocyanine- and corrole-based systems, which are versatile and can catalyse ORR very efficiently when bound to metals such as Fe, Co and Cu [28]. Going further, in [29,30], researchers studied copper nanoparticles, which are highly valued in engineering and technological research due to their wide potential applications. In addition, the study [31] includes an examination of insulating materials, for example, when using copper to manufacture the aforementioned electric motors.
This article continues with an analysis of the energy transformation and demand for copper due to this process. A detailed analysis of the main global copper value chains was carried out, taking into account copper’s production, processing and distribution. Next, the role of KGHM Polska Miedź S.A., one of the largest copper companies in the world, as a key link in the global copper supply chain, including supplying high-purity copper for advanced energy technologies, was analysed.

3. Results

3.1. Demand for Copper Due to the Energy Transition

The Energy Transition Commission [32] estimates that global electricity consumption in 2050 will quadruple in comparison with the consumption in 2022, i.e., from 28,000 TWh to 110,000 TWh.
The assumptions are that 75 percent of energy in 2050 will be supplied by wind and solar power, with the rest of the demand met by nuclear, hydroelectric and other zero-carbon sources.
Figure below (Figure 2) shows the necessary changes that must occur by 2050 to meet the energy transition goals. These developments are discussed below in the context of the demand for copper:
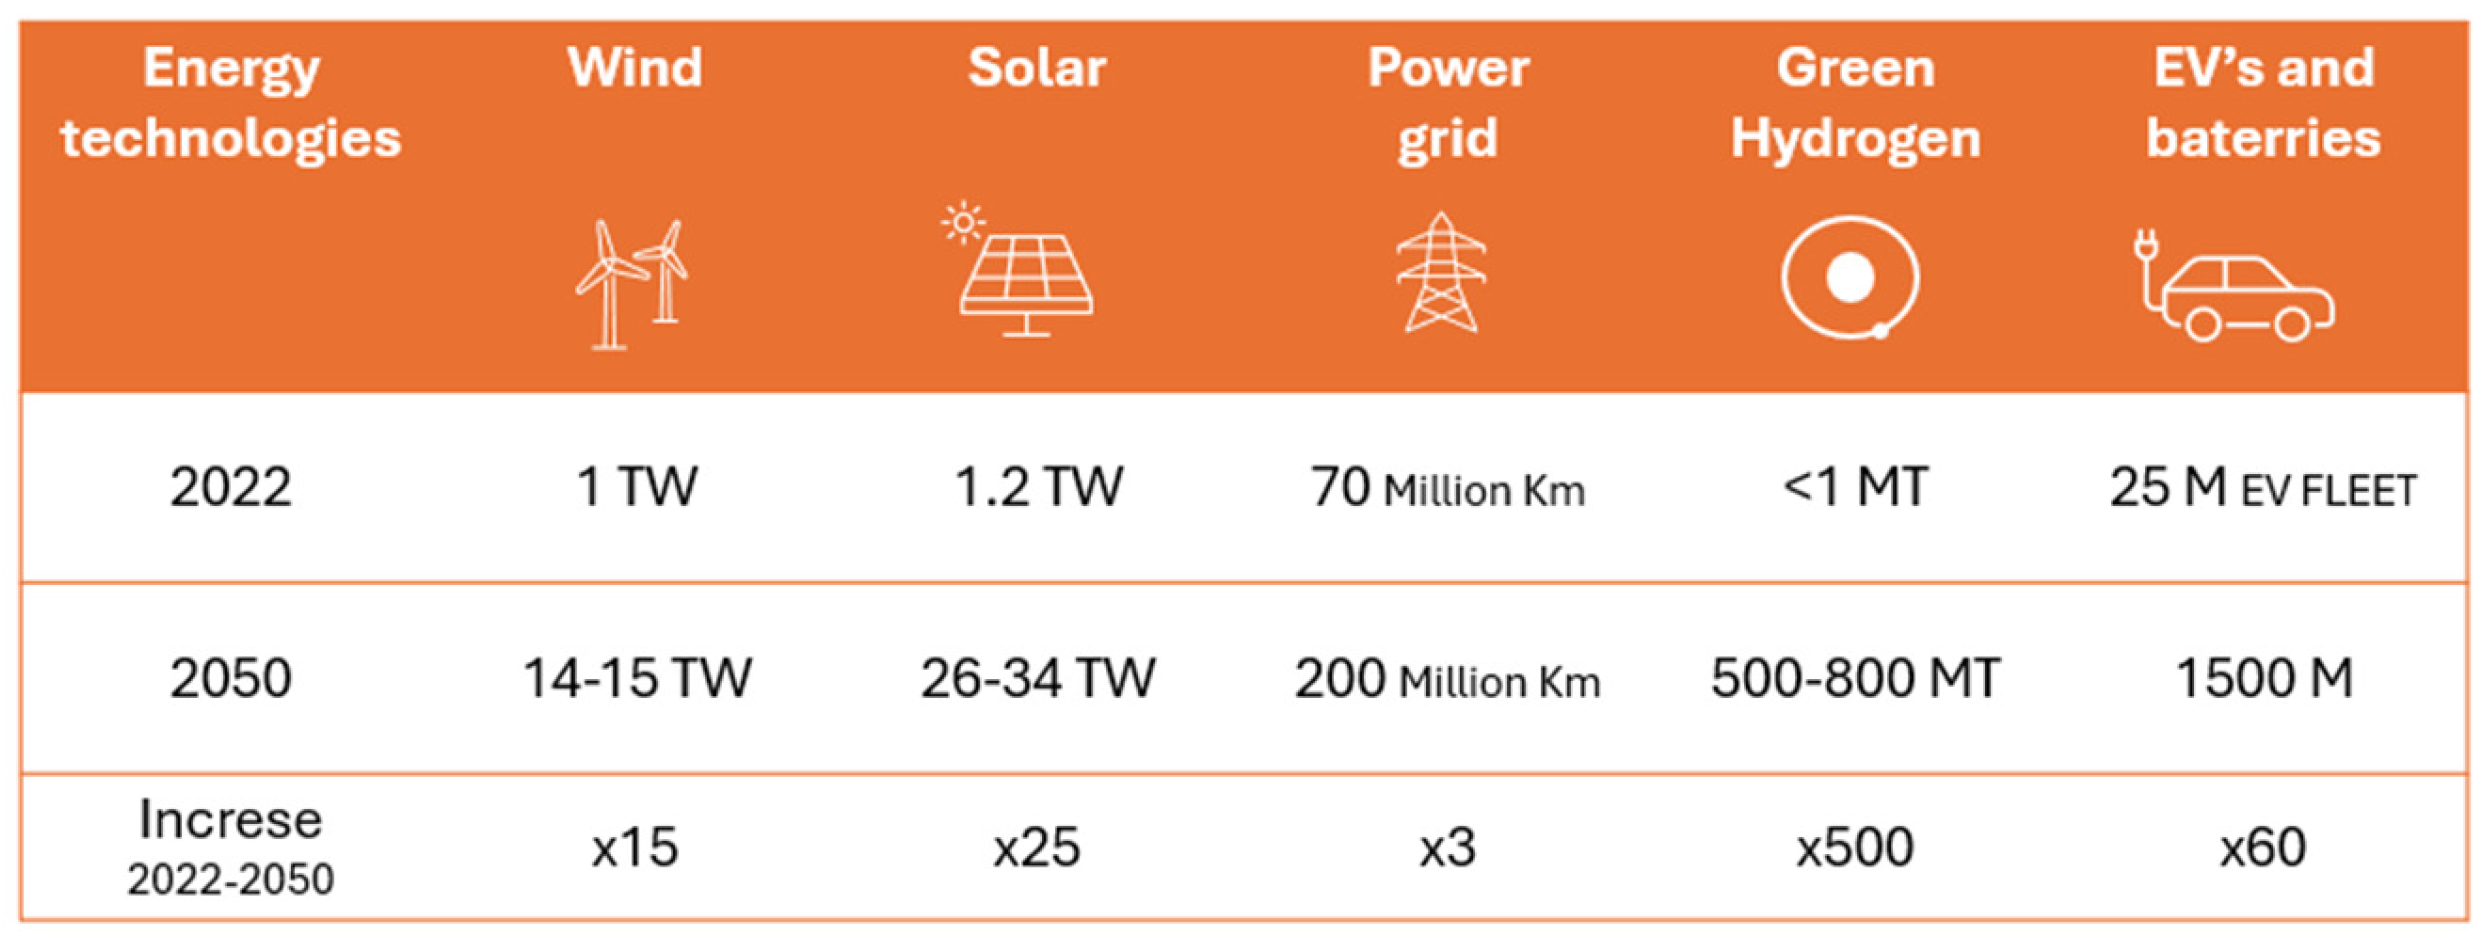
  • The current installed capacity for wind power is 1 TW, and it will have to increase about fifteen times to 14–15 TW. An average of 4.7 t of Cu is used for building a single 3 MW wind turbine. Copper is also needed for offshore wind power, as its specific gravity, compared to aluminum, makes it easier to install underwater connections.
  • The installed capacity for solar power is 1.2 TW and will have to increase about twenty-five times to 26–34 TW. An average of 3.8 t of Cu must be used for building a 1 MW solar power plant.
  • The power grid will have to be expanded from the current 75 million km to 200 million km. Copper would be best used for expanding the power grid, as it is one of the metals with the best electrical conductivity, which offsets losses in the transmission itself, and its thermal conductivity is more than half that of aluminum.
  • Low-carbon hydrogen consumption will have to increase from the current level of 1 MT to as much as 500–800 MT.
  • By 2050, the plan is to almost completely replace internal combustion cars with electric ones, so more than 1.5 billion EVs should be produced, as well as about 200 million electric trucks and buses. This requires a total battery capacity of up to 150 TWh. For EVs, copper is needed for batteries, electrical components, and in charging stations. Electric cars contain an average of two to three times more copper than their counterparts with internal combustion engines Figure 3. It is also difficult here to talk about substituting copper with, for example, aluminum. Copper does not heat up as aluminum does, and the reductions in energy consumption when using copper reach about 25%.
Figure 3. Concentration of critical materials used in battery vehicles [kg/vehicle].
Energies 18 00969 g003
Figure 4 show the consumption of critical raw materials in the technologies that are to contribute to the energy transition. In the chart, it can be seen that each technology entails significant copper consumption. To build an offshore wind power plant, about eight times as many tons of copper per 1 MW are needed in comparison with a conventional power plant. Additions of onshore wind farms and solar power plants require two to three times more copper per 1 MW of installed capacity compared to conventional power plants [33] (Figure 5).
Figure 3 shows a summary of the consumption of critical raw materials used for building various batteries produced for EVs and compares the consumption of these raw materials for the motor and power trains, as well as the glider in EVs. This chart shows that, on average, to build an EV requires ca. 36 kg of copper per battery, ca. 16 kg per EV motor and powertrain and ca. 18 kg per glider, which makes ca. 70 kg of copper in total. For internal combustion engines (ICE) cars, the copper consumption is ca. 15 kg for the internal combustion engine and powertrain and ca. 20 kg for the glider, which makes 35 kg in total. That is, it takes at least twice as much copper to produce one EV.
Due to the energy transition, as much as 22 million tons of copper should be supplied to the market by 2050, a figure equal to the entire world’s output in 2023. At this point, it should also be emphasized that 22 million tons of copper by 2050 is only the copper needed to implement the energy transition targets. The Energy Transition Commission (ETC) estimates that annual output should rise to a maximum of 34 million t by 2030 under basic decarbonization assumptions, and a minimum of 30 million t with additional increases in efficiency and recycling rates [32]. In addition, copper is used in other sectors, i.e., building construction, transportation equipment, consumer and general products, and industrial machinery (Figure 4).
ETC estimates that, to meet the needs of all sectors, the cumulative demand for copper by 2050 should be 1135 million t, with estimated available reserves of 1000 million t and resources of 5600 million t. This means that at present (2024), there is still a copper shortfall of 135 million tons.

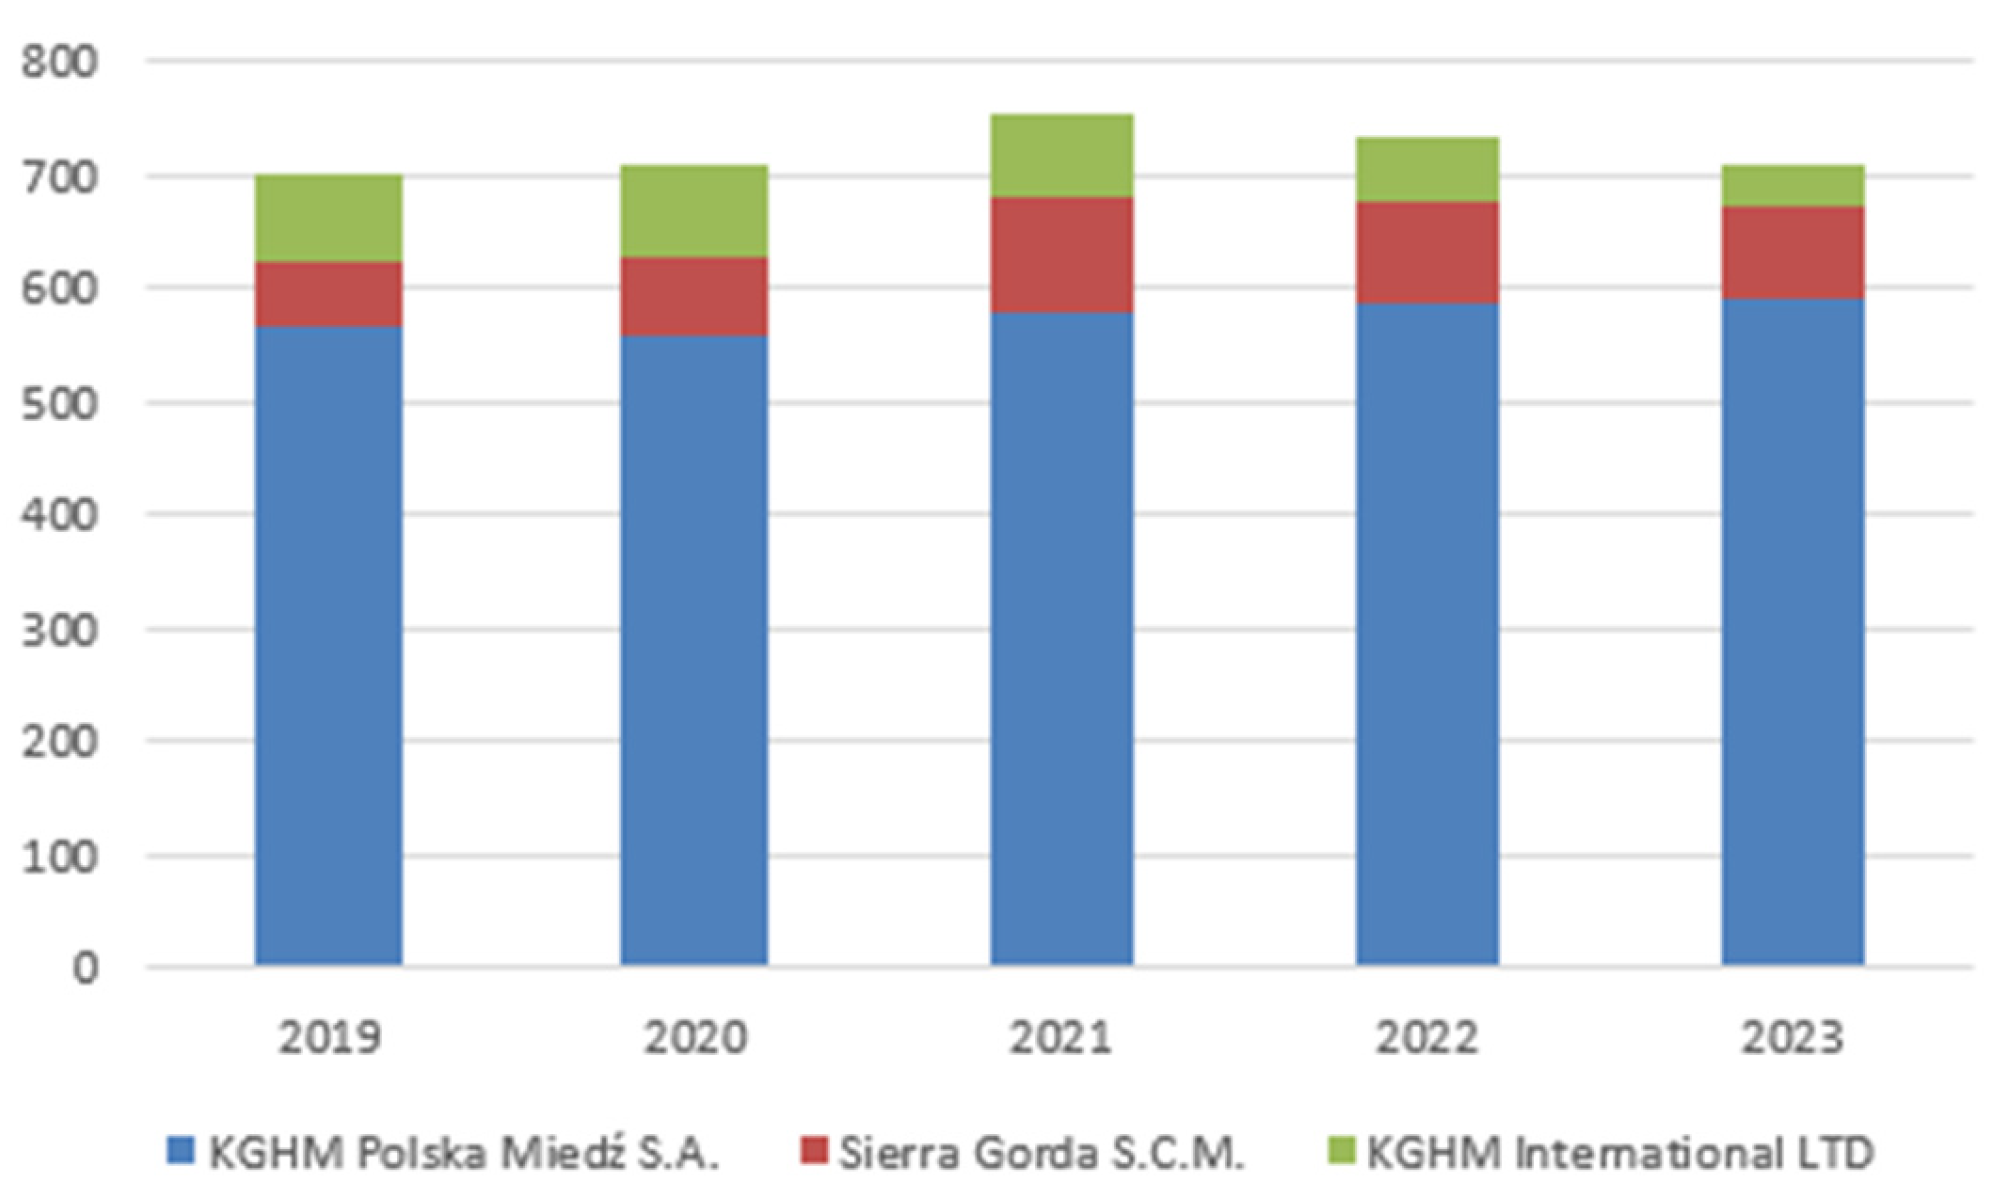
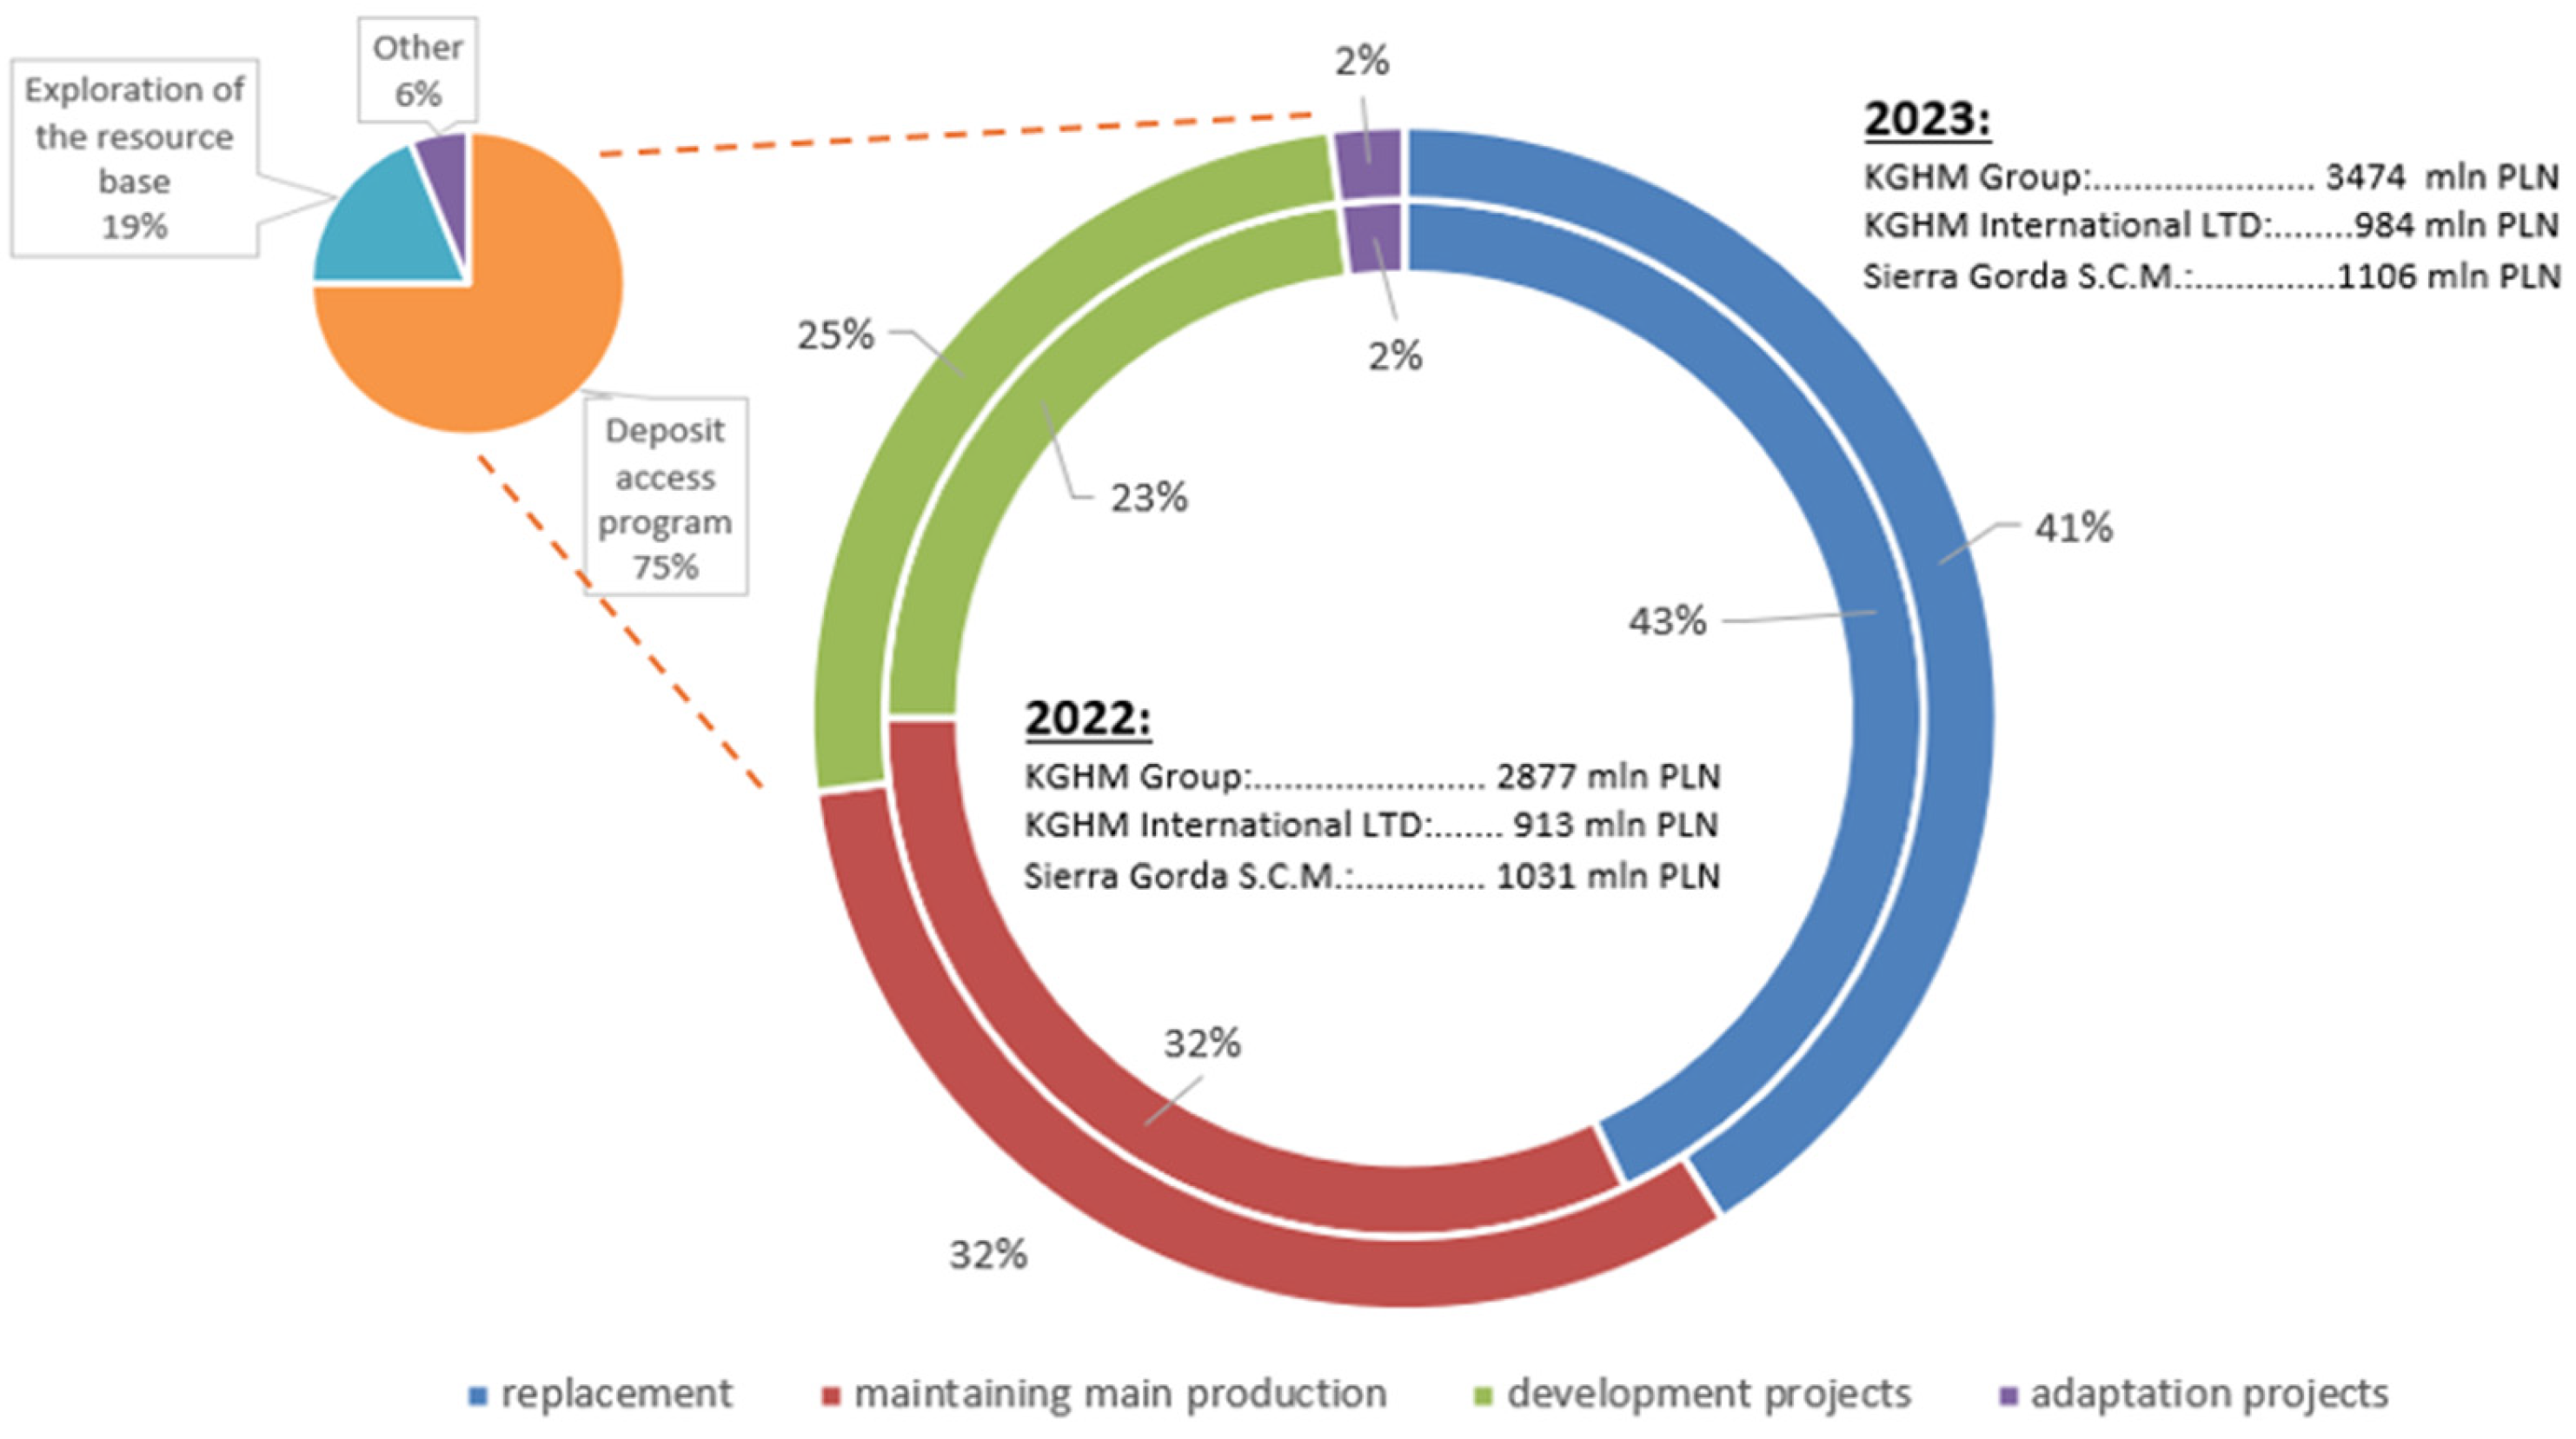
3.2. Filling the Copper Supply Gap Through Investments

As a result, it is necessary to increase reserves. Such increases take place all the time. Figure 6 below shows how reserves have changed over the past ten years (2013–2023) from 600 million tons to 1000 million tons. Also shown is the change from 2022 to 2023, when reserves increased by 110 million tons. This value shows that, in the near future, reserves may change so that the currently expected supply gap will perhaps be completely closed in a year’s time. The chart below shows that the largest reserves are located in Chile, Peru, Australia and Russia [34,35,36]. Poland ranks eighth in terms of domestic resources (34 million tons). KGHM, in turn, has 40 million t of copper reserves at all of its mines [37].
The data on reserves (Figure 6) show where they can be expanded and where production can be increased. In Europe, the largest and most significant supplier of copper is KGHM (output 445.5 thousand tons, refining 592 thousand tons). The chart shows that Polish reserves are growing, with the latest value of 34 million tons. In 2023, domestic reserves grew by 13%. KGHM, in its 2022 report [34], states that it controls 40 million t of resources within the group.
With the huge demand for copper due to the energy transition, the reserves, as well as the mining and production capacity on the Old Continent, must be steadily increased. This will reduce imports and, in turn, significantly reduce global CO2 emissions. The carbon footprint of domestic production is lower than in Asia. Local production will also reduce the carbon footprint associated with transportation. Compared to 1990 levels, Europe’s copper industry has reduced unit energy consumption by 60%, and emissions from the production of the metal in Europe now amount to just 0.4% of the EU’s total greenhouse gas emissions [38].
To be able to increase reserves, mining capacity and, as a result, Cu production capital expenditures must be continuously incurred and increased. Figure 7 below shows the spending pattern for selected critical raw materials related to the energy transition from 2008 to 2022.
Figure 7 demonstrates that, globally, the largest critical capital expenditures on raw materials (CRMs) are incurred for copper exploration. Since 2016, there has been a gradual increase in spending. There was a decline after 2019, which is likely related to the COVID-19 pandemic. In 2022, the increase in investment in copper exploration was 21%, in comparison with the previous year, and the level of spending was the highest since 2014 at about 3000 USD million [33].
Figure 8 shows the structure of capital expenditure on copper exploration by country. In 2022, Latin America (Chile, Peru) had the largest copper exploration expenditures, followed closely by Australia and Canada. The chart shows that, compared to 2021, all of the mentioned countries increased their spending in 2022—Latin America and Australia by more than 30%, and the US and Canada by approximately 15%. In Africa, there was a slight increase, mainly due to the DRC and Ecuador [33]. However, the average annual increase in capital expenditure on copper exploration does not translate into discoveries of new deposits, the number of which has been declining steadily since 2007. Figure 9 shows the number of newly discovered deposits in the context of copper prices on world markets.
Exploration-related capital expenditures, shown in Figure 9, translate into global copper production, which are a consequence of exploration processes. In 2023, 22 million tons of copper was mined worldwide, 70% of which was mined by five countries: Chile (5 million tons), Peru (2.6 million tons), Congo (2.5 million tons), China (1.7 million), the US (1.1 million tons) [36] (Figure 10).

3.3. Filling the Copper Supply Gap by Recycling—Urban Mining

It is aimed to fill the copper supply gap by recycling. It is estimated that up to 80% of the copper produced to date is still in production use [38]. In theory, copper is a metal that can be recycled many times and still maintain its properties. Currently, 60% of end-of-life copper is recycled. The energy transition assumptions assume that the figure should be 90% by 2040.
It has already been mentioned in this article that, as part of the energy transition, by 2050, 22 million tons of copper will have been used mainly in wind turbines, solar panels, transmission grids, electric cars and all the infrastructure to support them. The current energy transition has been underway since 2019, and some copper has already entered the energy market. However, by 2030, small amounts of copper will have become recoverable from equipment used for the transition itself. The average lifespan of wind turbines and solar panels is 25 years, while electric cars have an average lifespan of 15 years. That is, the first electric appliances from the energy transition will be able to be processed after 2030, and most of them only after 2040. Therefore, it is necessary to look for copper-containing raw materials in other sources, i.e., in the already-built power system and outside it, i.e., in transportation, buildings, equipment, flotation tailings, etc.
Recycling has much potential to achieve a reduction in the demand for raw material extraction, but the whole process needs considerable improvement. Several years ago, it was estimated that up to 700 million unused devices were unclaimed across the EU, and among EVs that had reached their EOL (end of life), 3.5 million had not returned to the EU closed loop [33,39]. Recycling should be based on efficient collection of waste, so perhaps it would be worthwhile to introduce economic incentives that would make people take action themselves to return, for example, e-waste, to the right place. An infrastructure accessible to everyone should be built for the proper collection of such waste, where it would be subject to demolition and selection. The IEA estimates that by 2040, the recovered CRM volumes from used batteries could reduce the overall copper demand by up to 10% [40]. The energy transition’s circular economy activities can achieve more than 7 MT of copper by 2050, which should meet more than 40% of the total energy transition demand [32].

4. Discussion

In light of the above-presented trends concerning copper demand driven by the energy transition, the next step involved analysing the main supply chains of this resource.
The tables (Table 1, Table 2 and Table 3) indicate the value migration associated with the trade in copper products, arising at different stages of the entire value chain. Considering the upstream processes and the ores and concentrates produced therein, it should be noted that the world’s largest exporters were countries with the largest copper ore deposits. Thus, South America is dominant here, represented especially by Chile and Brazil. The shares of Asia, i.e., Indonesia and Kazakhstan, and Australia, are also significant. In turn, the largest buyers of copper ore and imported concentrate are countries that are more technologically advanced and that are engaged in further processing and production of subsequent products in the value chain. These include China, Japan and Germany, but also Scandinavian countries such as Sweden and Finland, as well as emerging Asian markets such as the Philippines and India.
Unrefined copper and anodes for electrolysis are produced and exported by producers who have already sold ores and concentrates at an earlier stage (Chile, Peru, the United States). One can also distinguish countries that imported ores and concentrates and engaged in their further processing, such as Sweden, Bulgaria, Spain and the Philippines. However, the dominant country in the set of exporters is Zambia, which has significant copper ore reserves but is not a significant player at the stage of ore extraction and concentrate production.
When it comes to imports of unrefined copper and anodes, the highest value is again shown by China, but also by countries which previously imported fewer processed products in the form of ore or concentrates, including India, Germany, Finland, and Canada.
As for exports of more processed copper cathodes, the largest exporters are countries that have significant deposits and sell copper products at earlier stages of processing: Chile, Peru, and Zambia. Exporters include countries that import fewer processed products, instead increasing the value of early-stage products and exporting them to other countries, thereby earning the margin generated from the increase in value. These include Japan, the Philippines, Bulgaria, Kazakhstan, and China. The list of exporters also includes Poland, which had not previously appeared in the lists, but is known to be a European player that produces ores and concentrates but does not sell significant quantities of them, and is trying to lengthen the value chain by selling and exporting more processed products, such as cathodes.
Importers are dominated by China again, but also includes countries such as Germany and India, which have already imported other products. There are also countries such as Italy, Turkey, Thailand, Malaysia which have the capacity to conduct further processing and produce alloys and other copper products for which cathodes are needed.
This analysis of the value of exports and imports in each country shows that China is the dominant country, which, having no ore deposits, buys the respective products created at subsequent stages of the value chain as well as processes them. In this way, profitability of the implemented processes is achieved by offering products that provide higher margins. This is illustrated by the flow chart for the copper value chain prepared by the Fraunhofer Institute, which features a strong increase in the value stream over the subsequent stages of the chain [42].
In turn, South American countries, especially Chile, Peru, and Brazil, but also Latin American counties such as Panama and Mexico, have a strong value flow in the upstream in the stages of ore extraction and concentrate production. As the value chain progresses, the stream becomes smaller and smaller. This is confirmed by a diagram prepared by the Fraunhofer Institute [42]. It confirms that more advanced production is performed by the countries with more innovative technologies and solutions, and at the same time these countries take over the margins in these value chains.
The instability of the geopolitical situation of the European Union countries and the disruption to the stability of the supply of energy resources have led to a reorientation of strategic measures in the area of energy security. For years, in legal terms, the European Parliament has been issuing directives on green governance and indicating emission standards. The RED III Directive (2023/2413) and the EED Energy Efficiency Directive (2023/1791), mentioned in the introduction to this paper, provide some of the basic standards. In 2022, the European Union introduced the RE-Power EU plan, the main objective of which is to diversify supply and accelerate the green transition process to enhance energy security [43].
To meet these challenges, the European Union continues to introduce new initiatives to help achieve the goals of the green transition and minimize the risk of disruptions in the supply of critical raw materials necessary for the transition. In the second half of 2023, two key pieces of legislation came into effect: the RED III Renewable Energy Directive (2023/2413) and the EED Energy Efficiency Directive (2023/1791) [43,44]. In the first half of 2024, while implementing these directives and regulations, the European Union has set specific targets for 2030, including increasing the share of renewable energy in total energy consumption to 42.5%, improving energy efficiency, achieving climate neutrality, and recycling, processing, or extracting strategic raw materials. From the point of view of the pursuit of a seamless transition, the European Parliament’s Regulation, in particular, appears to be particularly important, as it represents a significant step towards ensuring the stability and sustainable supply of critical raw materials for the EU’s economy. Implementation of the Act’s objectives should strengthen the supply of these raw materials from the EU’s own sources and reduce dependence on individual external suppliers. It is also intended to encourage the development of new strategic projects for the extraction, processing, recycling of and substitution for any of the strategic raw materials [45].

Copper Production in Poland vs. Global Production

Given the importance of copper in the energy transition, it is also a significant resource for Poland, especially since Poland is a major producer in Europe. In Poland, copper-bearing deposits are located in the western part of the country, and are mined by KGHM Polska Miedź S.A. (KGHM). Considering the copper value chain which contributes to the energy transition, KGHM will be among the companies operating seven of the eight stages of the chain, i.e., exploitation and assessment, ore extraction, ore enrichment, smelting, refining, processing and recycling (Figure 11). Therefore, it is worth analysing the situation of Poland in a global context and consider the requirements of the energy transition in order to be able to draw conclusions about the feasibility of projects aimed at reducing CO2 emissions.
In Poland, KGHM mined 2% of the world’s Cu output. Mining is carried out at the three Lubin mines, with a total of 72,300 tons mined in 2023, as well as at Polkowice-Sieroszowice (198.6 thousand tons), and Rudna mine (174.5 thousand tons). The aggregate output from the three sites adds up to 445,500 t, and this volume ranks Poland 13th in the United States Geological Survey (USGS) (Figure 6). In addition, KGHM also exploits foreign deposits. KGHM International LTD (a subsidiary of KGHM Polska Miedź S.A.) exploits copper bearing deposits in the United States; these are the Robinson mines (31.5 thousand t) and Carlota (3.9 thousand t). It has additional deposits in Canada, in the Sudbury Basin (4500 t) and holds a 55% stake in mining company Sierra Gorda S.C.M. in Chile (143,000 t) [37]. The sum of the Polish company’s domestic and foreign output is 628.3 thousand t, which is nearly 3% of the world’s output.
Copper ore mined in Poland contains an average of 1.5% Cu, so the next step is enrichment, or mechanical processing of the ore, which results in a concentrate with a higher Cu content. The concentrate is sent to the copper smelters HM Głogów and HM Legnica, where two other stages of smelting and refining follow. In smelters, in addition to their own concentrate, the input consists of purchased copper-bearing materials (concentrates, copper scrap, blister copper). In 2023, HM Głogów produced 470.1 thousand t of electrolytic (cathode) copper, and HM Legnica produced 122.3 thousand t, of which copper scrap accounted for 25% of electrolytic copper production (142.2 thousand t Cu). A total of 592,000 t of Cu were produced in Poland in 2023. Figure 12 below shows that, over the past four years (2019–2023), the upward trend in domestic copper production continued. The volume of ore remained at a similar level, but the copper content was higher. Foreign deposits have seen a decline over the past three years, mainly due to the sale of the Chilean Franke mine in 2022, lower production at the Robinson mine and lower copper content in ore at Sierra Gorda S.C.M. In 2023, the KGHM Group produced a total of 711,000 tons of Cu.
The volume of domestic production, amounting to 592,000 tons in 2023 (Figure 12), placed Poland in ninth position globally (Figure 13). At the time, global refined copper production was 27 million tons, and China alone produced as much as 45% (12 million t) of Cu. However, if domestic and foreign copper production were taken into account, it would rank seventh, just after the United States.
The main product manufactured and sold by KGHM’s Polish divisions is electrolytic copper (99.99% Cu), which is produced after the refining stage. At the processing stage, KGHM processes 49% of the electrolytic copper at HM Cedynia into other products desired in the market, i.e., copper wire rod, oxygen-free copper wire, low-alloy oxygen-free copper wire with silver, and copper pellets. Domestic concentrates are sold rather sporadically. It is rather the domestic subsidiaries that purchase concentrates to optimize capacity utilization at smelters. The copper mined in KGHM’s foreign companies is mainly sold in the form of concentrates.
KGHM sells its copper products mainly on the European market, i.e., Poland (24%), Germany (21%), the Czech Republic (8%), Italy (7%), and Hungary (5%). About 10% of KGHM’s copper also goes to China, where 60% of global copper was consumed in 2023 [37].
Figure 14 shows how capital expenditures in the KGHM Group evolved between 2022 and 2023. These expenses are divided into four categories, but the money for exploration and development is included in the development projects category. In each year, they accounted for more than 20% of expenditure. Compared to 2022, in 2023, spending on development projects increased by 5 pp. In 2022, it was about 662 million, and in 2023 it was almost 800 million, an increase of more than 20%. These figures indicate that the Polish KGHM Group capital expenditure does not lag behind the leading copper producers, but is among the highest.
The chart also shows the structure of development projects. KGHM spends most on the deposit access program (75%), and 19% is spent on the costs of exploration of the resource base.
Domestically, in order to secure future production, KGHM is working to explore copper ore deposits in the Radwanice and Retków areas. In 2023, the company also expanded the scope of operations within the Głogów Głęboki-Przemysłowy mining area.
KGHM International LTD is working on the Victoria Project in Ontario, Canada, where a new underground mine is planned. In 2002, mineral rights were acquired, exploration work began, and at the time of writing (2024), preparatory work is still underway. The lifetime of the mine is estimated at 16 years, with a projected annual copper production of 17,000 t Cu.
Regarding the Sierra Gorda development in 2023, 54% of expenses were related to the removal of overburden in order to make more portions of the deposit available for mining, and the remainder were related to the development and restoration of property, plant and equipment [38].
In addition to the above new investments, KGHM International’s assets include a copper-bearing deposit in British Columbia, Canada. An open pit mine is planned there and is known as the Ajax Project. Based on exploratory work, it was estimated that annual production could be 53,000 t Cu, and the mine itself could operate for 19 years. Unfortunately, as of now (2024), the project has not received an EA Certificate, so the Canadian government has not issued an operating permit.
Nevertheless, the scale of demand for copper remains enormous. The growth in mining production capacity is estimated at an average of 4.9% annually [38], which still may not be sufficient to meet the increasing demand. The ETC estimates that 25–30 new mines should be developed by 2050. However, it should be noted that the average time to complete such projects is approximately 17 years, considering the phases of exploration, obtaining licenses, and constructing mining facilities [40].
The KGHM Group has included two recycling-related goals in its strategy for 2030 titled “Strategy of the KGHM Group to 2030 with an outlook to 2040” [46]. In HM Legnica and HM Głogów, in 2022, copper scrap accounted for 22% of electrolytic copper production and was 131 thousand t Cu. In 2023 there was an increase in the share of scrap in electrolytic copper production to 25% (i.e., 142.2 thousand t Cu). KGHM is clearly showing progress in terms of copper recycling. In order to meet its targets, KGHM is stepping up activities related to the purchase of copper-bearing scrap from the so-called urban mining.
The company is also working to increase the efficiency of its copper recycling process. A high-grade copper scrap melting unit has been constructed in HM Legnica’s process line. Ultimately, it will be supplemented with a scrap trading base, where feedstock will be prepared for smelting at HM Legnica and HM Głogów. In 2023, 83 thousand t of scrap metal was processed at HM Legnica (including 26 thousand t in the melting and refining furnace), which was thus recycled and would not contribute to landfill waste. Among the scrap metal recycled in 2023 at HM Legnica’s facilities, 1,876 t comprised returns from other KGHM divisions [38].
In addition, through landfilling, KGHM disposes of flotation tailings, which account for 94% of the mined ore, or 28 million t per year [37]. Since 1974, flotation tailings have been deposited at the Żelazny Most Mining Waste Neutralization Facility (2100 hectares). At the beginning of KGHM’s operation, the process of extracting copper from the ore was less efficient, and over time, the technology was improved, but this does not change the fact that considerable amounts of valuable elements, including copper, ended up in the Żelazny Most landfill. These elements still end up there, although their waste content has already been significantly reduced. However, KGHM is developing a plan to “explore and implement solutions to utilize landfills as secondary deposits” [38].

5. Conclusions

The energy transition is a major challenge for the entire world. One of the biggest threats is the supply of critical raw materials, without which the planned transformation of the world’s shift to renewables and greening will not take place. It is estimated that demand for critical raw materials will be much higher than the level that is currently mined or recycled.
One of the most desirable raw materials is copper, the value chain of which is closely analysed in terms of the risks that are evident from the production of intermediates at each stage of value addition. Likewise, the margins generated at the respective stages of the production of copper intermediates and financial products are also analysed.
The value chain of copper produced for the energy transition and beyond is unstable. There is a high level of concentration in the scope of mining, with 70% mined by five countries: Chile, Peru, Congo, Zambia, and the USA. There is a similar concentration in refining, where China alone refines 45% of copper, which constitutes a significant threat. This high level of concentration poses a risk to supply stability, where all it takes is one political conflict or bad weather conditions for a significant supply stream to be curtailed and thus copper prices to skyrocket.
Future demand for copper exceeds the actual current supply, and recycling levels are insufficient. Europe is heavily dependent on the “big players” in all of this, and it takes at least 17 years to launch new copper mines.
According to studies, the number of newly discovered deposits declined between 2004 and 2023, despite increasing exploration expenditures. All this makes it possible to conclude that the salvation for Europe is the Polish company KGHM Polska Miedź S.A., which has the resources and ambitions stay among the top copper producers in the world. This is where the main investment streams from the EU should go. Therefore, the authors of this study focused on presenting the case of KGHM Polska Miedź S.A. in the context of global supply chains, thereby emphasizing the importance of this company in the EU’s energy transition.
On the one hand, there are scientific units where research work is being carried out on basic principles to reduce planned copper consumption. Work is underway to reduce the use of copper in renewable energy installations and EVs, which could cause the cumulative demand to fall by 30%. On the other hand, there are the mining and smelting plants, including KGHM’s plants, which are keeping up with global trends, where investments are being made and work is being conducted to identify deposits, increase mining efficiency and increase the efficiency of the refining process.
At the same time, it is planned to raise the level of recovery of recycled copper (urban mining) from 60% to at least 90%, but a significant increase in recycling will not be possible until after 2030, when the copper involved in the transformation process will begin to return to circulation. It is estimated that more than 7 MT of copper can be obtained by 2050, which should meet more than 40% of the total demand for the energy transition. This means that appropriate regulations and economic incentives must be developed to make this assumption a reality. KGHM is prepared to accept copper from urban mining, while working to increase its capacity in this area.

Author Contributions

Conceptualization, A.K., M.P.-S., S.L.-S. and A.W.-S.; methodology, M.P.-S. and S.L.-S.; resources, A.K., M.P.-S., S.L.-S. and A.W.-S.; data curation, A.K., M.P.-S., S.L.-S. and A.W.-S.; writing—original draft preparation, A.K., M.P.-S., S.L.-S. and A.W.-S.; writing—review and editing, A.K.; visualization, A.W.-S.; All authors have read and agreed to the published version of the manuscript.

Funding

The authors wish to thank the Faculty of Civil Engineering and Resource Management at the AGH University of Krakow for the financial support for this research (no. 16.16.100.215).

Data Availability Statement

The original contributions presented in this study are included in the above article; further inquiries can be directed to the corresponding author.

Conflicts of Interest

The authors declare no conflicts of interest.

References

  1. European Commission. Communication from the Commission to the European Parliament, the European Council, the Council, the European Economic and Social Committee and the Committee of the Regions. In The European Green Deal, COM/2019/640 Final; European Commission: Brussels, Belgium, 2019; Available online: https://eur-lex.europa.eu/legal-content/EN/TXT/HTML/?uri=CELEX:52019DC0640 (accessed on 16 July 2024).
  2. Xu, Y.; Liu, A.; Li, Z.; Li, J.; Xiong, J.; Fan, P. Review of Green Supply-Chain Management Diffusion in the Context of Energy Transformation. Energies 2023, 16, 686. [Google Scholar] [CrossRef]
  3. Genc, T.S.; Kosempel, S. Energy Transition and the Economy: A Review Article. Energies 2023, 16, 2965. [Google Scholar] [CrossRef]
  4. IEA. World Energy Outlook 2023; Organisation for Economic Co-Operation and Development (OECD): Paris, France, 2023. [Google Scholar] [CrossRef]
  5. Rietveld, E.; Bastein, T.; van Leeuwen, T.; Wieclawska, S.; Bonenkamp, N.; Peck, D.; Klebba, M.; Le Mouel, M.; Poitiers, N. Strengthening the Security of Supply of Products Containing Critical Raw Materials for the Green Transition and Decarbonisation; European Parliament: Strasbourg, France, 2022; Available online: http://www.airaassociazione.it/wp-content/uploads/2023/01/Strengthening-the-security-of-supply-of-products-containing-CRMs-for-the-green-transition-and-decarbonisation.pdf (accessed on 11 July 2024).
  6. Hund, K.; la Porta, D.; Fabregas, T.P.; Laing, T.; Drexhage, J. Minerals for Climate Action: The Mineral Intensity of the Clean Energy Transition; International Bank for Reconstruction and Development, The World Bank: Washington, DC, USA, 2020; Available online: https://pubdocs.worldbank.org/en/961711588875536384/Minerals-for-Climate-Action-The-Mineral-Intensity-of-the-Clean-Energy-Transition.pdf (accessed on 11 July 2024).
  7. Bobba, S.; Carrara, S.; Huisman, J.; Mathieux, F.; Pavel, C. Critical Raw Materials for Strategic; Technologies and Sectors in the EU—A Foresight Study. 2020. Available online: https://rmis.jrc.ec.europa.eu/uploads/CRMs_for_Strategic_Technologies_and_Sectors_in_the_EU_2020.pdf (accessed on 11 July 2024).
  8. Zhang, Z.; Chen, S.; Zhang, H.; Yao, C.; Lou, H.; Chen, M.; Xia, B.; Sun, Y.; Lang, X.; Cai, K. Enhanced oxygen reduction kinetics of SrCoO3-δ by Ta/Cu or Nb/Cu co-doping as high-performance cathodes for SOFC. Ceram. Int. 2023, 49, 39003–39012. [Google Scholar] [CrossRef]
  9. Quan, B.; Wang, Y.; Chen, Y.; Lu, X.; Teng, S.; Zhou, X.; Qiao, M.; Lai, H.; Huang, X. Manipulation of nano-metals to implement rational conduction tailoring for high-efficiency microwave absorption. Carbon 2023, 210, 118045. [Google Scholar] [CrossRef]
  10. Das, S.; Ali, A.; Jana, R.N. Insight into the dynamics of magneto-casson hybrid nanoliquid caused by a plate rotation. World J. Eng. 2021, 18, 66–84. [Google Scholar] [CrossRef]
  11. Wu, Y.; Lv, J.; Xie, F.; An, R.; Zhang, J.; Huang, H.; Shen, Z.; Jiang, L.; Xu, M.; Yao, Q.; et al. Single and double transition metal atoms doped graphdiyne for highly efficient electrocatalytic reduction of nitric oxide to ammonia. J. Colloid Interface Sci. 2024, 656, 155–167. [Google Scholar] [CrossRef]
  12. Toyooka, G.; Tanaka, T.; Kitayama, K.; Kobayashi, N.; Watanabe, T.; Fujita, K.-I. Hydrogen production from cellulose catalyzed by an iridium complex in ionic liquid under mild conditions. Catal. Sci. Technol. 2021, 11, 2273–2279. [Google Scholar] [CrossRef]
  13. Guo, F.; Qiao, Q.; Mao, S.; Bai, J.; Dong, K.; Shu, R.; Xu, L.; Wei, H.; Qian, L.; Wang, Y. A comprehensive study on the pyrolysis behavior of pine sawdust catalyzed by different metal ions under conventional and microwave heating conditions. Energy 2023, 272, 127115. [Google Scholar] [CrossRef]
  14. Chen, H.; Hsu, H.-Y.; Hsieh, J.-E.Y.; Hung, H.-E. A differential privacy-preserving federated learning scheme with predictive maintenance of wind turbines based on deep learning for feature compression and anomaly detection with state assessment. J. Mech. Sci. Technol. 2024, 38, 3413–3429. [Google Scholar] [CrossRef]
  15. Kushnir, V.; Koshkin, I.; Ibragimova, S. Electric Heating of Non-conductive Dispersed Raw Materials in Activated Carbon Production. In Lecture Notes in Mechanical Engineering, Proceedings of the 6th International Conference on Industrial Engineering ICIE 2020, Sochi, Russia, 18–22 May 2020; Radionov, A.A., Gasiyarov, V.R., Eds.; Springer: Berlin/Heidelberg, Germany, 2021. [Google Scholar] [CrossRef]
  16. Yang, M.; Li, L.; Shi, J.; Xia, H.; Xu, J. Electrocatalytic hydrogenation of lignin-derived compounds in heteropolyacid fluidized system. Biomass Convers. Biorefinery 2024, 1–11. [Google Scholar] [CrossRef]
  17. Khrunina, N.P.; Cheban, A.; Yu, A. A theoretical approach to disintegration equipment design for mineral raw materials. Eurasian Min. 2023, 40, 66–69. [Google Scholar] [CrossRef]
  18. Li, D.; Shen, L.; Zhong, S.; Elshkaki, A.; Li, X. Spatial and temporal evolution patterns of material, energy and carbon emission nexus for power generation infrastructure in China. Resour. Conserv. Recycl. 2023, 190, 106775. [Google Scholar] [CrossRef]
  19. Li, H.; Yao, X.; Tachega, M.A.; Ahmed, D.; Ismaail, M.G.A. Technology selection for hydrogen production in China by integrating emergy into life cycle. J. Clean. Prod. 2021, 294, 126303. [Google Scholar] [CrossRef]
  20. Eheliyagoda, D.; Wei, F.; Shan, G.; Albalghiti, E.; Zeng, X.; Li, J. Examining the temporal demand and sustainability of copper in China. Environ. Sci. Technol. 2019, 53, 13812–13821. [Google Scholar] [CrossRef]
  21. Guo, J.; Zhu, K.; Cheng, Y. Deployment of clean energy technologies towards carbon neutrality under resource constraints. Energy 2024, 295, 131012. [Google Scholar] [CrossRef]
  22. Wang, Y.; Guo, C.H.; Zhuang, S.R.; Chen, X.J.; Jia, L.Q.; Chen, Z.Y.; Xia, Z.L.; Wu, Z. Major contribution to carbon neutrality by China’s geosciences and geological technologies. China Geol. 2021, 4, 329–352. [Google Scholar] [CrossRef]
  23. Li, Y.; Pan, S.; Ning, S.; Shao, L.; Jing, Z.; Wang, Z. Coal measure metallogeny: Metallogenic system and implication for resource and environment. Sci. China Earth Sci. 2022, 65, 1211–1228. [Google Scholar] [CrossRef]
  24. Li, L.; Tang, Q.-Y.; Zhang, Y. Comparative Study of Magmatic Sulfide Type Nickel-Cobalt Deposits in Cratons and Orogenic Belts—A Case Study of Jinchuan and Xiarihamu Deposits. In Proceedings of the 11th Academic Conference of Geology Resource Management and Sustainable Development, Beijing, China, 16–17 December 2023; Volume 1, pp. 426–432. [Google Scholar] [CrossRef]
  25. Jia, J.; Xin, L.; Lu, C.; Wu, B.; Zhong, Y. China’s CO2 emissions: A systematical decomposition concurrently from multi-sectors and multi-stages since 1980 by an extended logarithmic mean divisia index. Energy Strategy Rev. 2023, 49, 101141. [Google Scholar] [CrossRef]
  26. Domaracka, L.; Matuskova, S.; Tausova, M.; Senova, A.; Kowal, B. Efficient Use of Critical Raw Materials for Optimal Resource Management in EU Countries. Sustainability 2022, 14, 6554. [Google Scholar] [CrossRef]
  27. Jarosiñski, M.; Krzyœcin, J.; Ustrnul, Z.; Kochanek, K.; Janik, T. Geophysical research in solving civilization problems relevant to Poland. Przegląd Górniczy 2023, 71, 418–429. [Google Scholar]
  28. Bhowmik, S.; Chaudhary, A.; Patra, M.; Patra, R. Oxygen reduction reaction by metallocorroles and metallophthalocyanines. In Oxygen Reduction Reaction: Fundamentals, Materials, and Applications; Elsevier: Amsterdam, The Netherlands, 2022. [Google Scholar] [CrossRef]
  29. Khan, M.R.; Alqahtani, A.M.; Alhazmi, S.E.; Elkotb, M.A.; Sidi, M.O.; Alrihieli, H.F.; Tag-Eldin, E.; Yassen, M.F. Numerical Investigation of Darcy–Forchheimer Hybrid Nanofluid Flow with Energy Transfer over a Spinning Fluctuating Disk under the Influence of Chemical Reaction and Heat Source. Micromachines 2023, 14, 48. [Google Scholar] [CrossRef] [PubMed]
  30. Memon, S.A.; Shaikh, H.I.; Raza, R.; Mughal, Z.U.N.; Memon, A.A.; Memon, S. Graphene incorporated mesoporous perovskite with excellent conductivity and catalytic activity for low temperature solid oxide fuel cells. New J. Chem. 2022, 46, 12530–12539. [Google Scholar] [CrossRef]
  31. Kim, S.H.; Lee, D.H. Polyetherimide for Magnet Wire Applications. SAE Int. J. Adv. Curr. Pr. Mobil. 2022, 5, 517–520. [Google Scholar] [CrossRef]
  32. ETC. Material and Resources Requirements for the Energy Transition. Available online: https://www.energy-transitions.org/publications/material-and-resource-energy-transition/ (accessed on 9 July 2024).
  33. EY. Critical Raw Materials for the Energy Transition—How to Achieve the Targets. Available online: https://www.ey.com/en_bg/insights/energy-resources/critical-raw-materials-for-energy-transition (accessed on 4 July 2024).
  34. U.S. Geological Survey 2024. Available online: https://pubs.usgs.gov/publication/mcs2024 (accessed on 6 July 2024).
  35. U.S. Geological Survey 2013. Available online: https://pubs.usgs.gov/publication/mineral2013 (accessed on 6 July 2024).
  36. U.S. Geological Survey 2023. Available online: https://www.usgs.gov/publications/mineral-commodity-summaries-2023 (accessed on 6 July 2024).
  37. Raport Zintegrowany KGHM. Available online: https://raportcsr2022.kghm.com/ (accessed on 8 July 2024).
  38. Sprawozdanie Zarządu KGHM. Available online: https://kghm.com/sites/default/files/2024-08/Sprawozdanie%20Zarz%C4%85du%20z%20dzia%C5%82alno%C5%9Bci%20Grupy%20Kapita%C5%82owej%20KGHM%20Polska%20Mied%C5%BA%20S.A.%20w%20I%20p%C3%B3%C5%82roczu%202024.pdf (accessed on 6 July 2024).
  39. Rizos, V.; Bryhn, J.; Alessi, M.; Campmas, A.; Zarra, A. Identifying the Impact of the Circular Economy on the Fast-Moving Consumer Goods Industry; The European Economic and Social Committee: Bruxelles, Belgium, 2019. [Google Scholar]
  40. IEA. The Role of Critical Minerals in Clean Energy Transitions. Available online: https://www.iea.org/reports/the-role-of-critical-minerals-in-clean-energy-transitions (accessed on 10 July 2024).
  41. World Integrated Trade Solution. World Bank. Available online: https://wits.worldbank.org/ (accessed on 18 September 2024).
  42. Fraunhofer Institute for Systems and Innovation Research ISI. Available online: https://www.isi.fraunhofer.de/en.html (accessed on 23 September 2024).
  43. Directive (EU) 2023/2413 of the European Parliament and of the Council. Available online: https://eur-lex.europa.eu/legal-content/EN/TXT/HTML/?uri=OJ:L_202302413 (accessed on 8 July 2024).
  44. Directive (EU) 2023/1791 of the European Parliament and of the Council. Available online: https://eur-lex.europa.eu/legal-content/EN/TXT/HTML/?uri=CELEX:32023L1791 (accessed on 8 July 2024).
  45. Regulation (EU) 2024/1252 of the European Parliament and of the Council of 11 April 2024 Establishing a Framework for Ensuring a Secure and Sustainable Supply of Critical Raw Materials and Amending Regulations (EU) No 168/2013, (EU) 2018/858, (EU) 2018/1724 and (EU) 2019/1020 Text with EEA Relevance. Available online: https://eur-lex.europa.eu/legal-content/EN/TXT/HTML/?uri=OJ:L_202401252 (accessed on 16 July 2024).
  46. Strategy of the KGHM Group to 2030 with an Outlook to 2040. Available online: https://kghm.com/en/strategy-kghm-group-2030-outlook-2040 (accessed on 10 July 2024).
Figure 1. Literature review—outline.
Energies 18 00969 g001
Figure 2. Changes in energy mix in 2050 compared to 2022.
Energies 18 00969 g002
Figure 4. Total copper demand structure in 2023.
Energies 18 00969 g004
Figure 5. Consumption of critical raw materials in the technologies that are to contribute to the energy transition [tons/MW].
Energies 18 00969 g005
Figure 6. Global copper reserves [thousand metric tons].
Energies 18 00969 g006
Figure 7. Exploration budget for selected critical minerals [USD million].
Energies 18 00969 g007
Figure 8. Copper exploration budget by country [USD million].
Energies 18 00969 g008
Figure 9. Major copper discoveries 2004–2023.
Energies 18 00969 g009
Figure 10. World copper mine production in 2023.
Energies 18 00969 g010
Figure 11. KGHM Group activities in the copper value chain for energy transition needs.
Energies 18 00969 g011
Figure 12. Copper production by KGHM Polska Miedź S.A. in 2019–2023 [thousand tons].
Energies 18 00969 g012
Figure 13. Copper refining.
Energies 18 00969 g013
Figure 14. Group capital expenditure in 2022–2023.
Energies 18 00969 g014
Table 1. Exports and imports of copper ores and concentrates in 2023 [41].
Exports of Copper Ores and ConcentratesImports of Copper Ores and Concentrates
Thousand USD Thousand USD
1Chile24,322,1701China59,941,382
2Peru19,991,4492Japan11,740,694
3Indonesia8,326,4763Germany3,306,776
4Australia4,344,5554Philippines3,265,666
5Mexico3,715,9315India3,057,890
6Brazil3,465,8136Spain2,486,153
7Canada3,185,2317Bulgaria1,938,247
8Kazakhstan3,068,3228Finland916,922
9United States2,607,2419Sweden913,885
10Panama2,469,04910Canada719,882
Table 2. Exports and imports of unrefined copper and copper anodes for electrolysis in 2023 [41].
Exports of Unrefined Copper, Copper Anodes for ElectrolysisImport of Unrefined Copper, Copper Anodes for Electrolysis
Thousand USD Thousand USD
1Zambia5,030,9311China8,418,061
2Chile2,134,8442India2,009,002
3Sweden1,325,6653Belgium1,763,111
4Bulgaria962,6324Canada1,276,751
5South Africa367,9415Finland305,274
6United States244,5596Austria216,312
7Slovak Republic215,1217Kazakhstan109,694
8Spain207,8208Germany66,051
9Peru207,6749Australia56,131
10Philippines 202,51810Serbia48,566
Table 3. Exports and imports of copper cathodes and cathode components in 2023 [41].
Exports of Copper Cathodes
and Cathode Components
Imports of Copper Cathodes
and Cathode Components
Thousand US Thousand USD
1Chile16,948,0071China30,110,902
2Japan5,511,5582United States6,671,446
3Australia3,370,0273Italy4,888,128
4Kazakhstan2,840,4654Germany3,922,802
5Peru2,689,3865Turkey3,596,195
6Poland2,565,5626United Arab Emirates3,386,355
7China2,421,3377Thailand2,988,155
8Philippines1,941,1338India2,793,250
9Bulgaria1,614,0149Malaysia2,037,671
10Zambia1,552,58610Brazil1,992,967
Disclaimer/Publisher’s Note: The statements, opinions and data contained in all publications are solely those of the individual author(s) and contributor(s) and not of MDPI and/or the editor(s). MDPI and/or the editor(s) disclaim responsibility for any injury to people or property resulting from any ideas, methods, instructions or products referred to in the content.

