Article

A Data Reconciliation-Based Method for Performance Estimation of Entrained-Flow Pulverized Coal Gasification

1
School of Energy and Environmental Engineering, University of Science and Technology Beijing, Beijing 100083, China
2
Beijing MWAY Technology Co., Ltd., Beijing 100176, China
3
Beijing Key Laboratory for Energy Saving and Emission Reduction of Metallurgical Industry, Beijing 100083, China
*
Author to whom correspondence should be addressed.
Energies 2025, 18(5), 1079; https://doi.org/10.3390/en18051079
Submission received: 20 January 2025 / Revised: 15 February 2025 / Accepted: 19 February 2025 / Published: 23 February 2025
(This article belongs to the Section B: Energy and Environment)

Abstract

:
Accurate performance estimation of the entrained-flow pulverized coal gasification unit is essential for production scheduling and process optimization, but these are often hindered by inaccurate or insufficient measurements in the industrial system. This paper proposes a data reconciliation-based method to address this challenge. The thermodynamic equilibrium model is employed as constraints of the gasification and quench processes, and the Particle Swarm Optimization (PSO) algorithm is applied for parameter estimation. Measured data under stable and variable operating conditions are reconciled, detecting and eliminating a 12% error in syngas flow rate at the scrubber outlet, thereby improving gasification performance accuracy. Two characteristic models concerning carbon conversion rate and the flow rate of reacted quench water are derived from the reconciled results. By combining these models with thermodynamic equilibrium models, the modified R2 of offline predicted syngas flow rate exceeds 0.92, and those of syngas compositions reach 0.72–0.85. Additionally, an Artificial Neural Network (ANN) model, trained on reconciled and predicted data, is proposed for real-time performance estimation. The ANN model calculates performance metrics within 10 s and achieves R2 values above 0.95 for most parameters. This method can be integrated into control systems and serves as a valuable tool for gasification process monitoring and optimization.

1. Introduction

Gasification of carbon-containing materials, such as coal and biomass, is a fundamental method for producing chemical feedstock and gaseous fuels, both of which are essential for industrial production and daily life [1]. Entrained-flow coal gasification is a clean coal utilization technology that utilizes pulverized coal particles reacting with limited oxidant to generate syngas at high temperatures and pressures. This method offers several advantages, including rapid reaction rates, high carbon conversion efficiency, and environmental benefits [2]. Consequently, it has been widely adopted in various industrial processes and power generation systems.
Entrained-flow pulverized coal gasification is a complex, heterogeneous, and nonlinear process. Process modeling and performance prediction can provide valuable insights into the understanding of the gasification process, as well as facilitate product design and operational optimization. Computational fluid dynamics (CFD) simulation is one of the commonly employed methods for modeling the gasification process [3,4,5]. However, due to the time-consuming nature of the calculations, this method is not yet suitable for real-time industrial simulation and prediction [6]. Several studies have developed chemical kinetics models for the gasification process to analyze the impact of operational parameters on gasification performance [7,8,9]. Nonetheless, in real industrial applications, obtaining accurate reaction kinetics data can be challenging, as the actual conditions within gasifiers are often much more complex than the experimental settings used to determine chemical kinetic parameters [10,11]. Thermodynamic equilibrium models are also commonly utilized [12,13,14], based on the assumption that reactions reach equilibrium while requiring fewer parameters compared to kinetic models. However, thermodynamic equilibrium models are unable to assess the mass and heat transfer between the gas and particles, which limits their ability to directly calculate carbon conversion rates [15]. This limitation is critical for performance analysis.
In recent years, machine-learning models have emerged alongside mechanistic models for predicting gasification performance. Numerous studies have employed machine-learning techniques to forecast the quality of syngas and the performance of gasification units [16,17,18,19,20,21,22,23,24,25,26]. The accuracy of these predictions significantly hinges on the training data, which, in most studies, is derived from two primary sources: simulation results or experimental results. For example, some neural network models have been developed using the simulation results of thermodynamic equilibrium models [16,17] and reduced-order models [18,19] to predict gasifier output parameters. Other research efforts have focused on utilizing experimental data to train models [20,21,22,23,24,25,26]. An example of this is a study that compares the performance of various AI models in predicting the syngas quality from biomass gasification [22] using experimental data sourced from a literature database as the training data [20].
Although machine-learning methods leveraging simulation results and literature data have shown promise, operational data from actual industrial plants are infrequently incorporated into these applications. Industrial plant data often contain inaccuracies, including random errors and gross errors, stemming from measurement inaccuracies or insufficient data collection. As a result, the measured data typically do not adhere to fundamental conservation laws, such as mass and energy conservation. Consequently, industrial data are seldom utilized directly for machine-learning modeling, as doing so may lead to inaccurate or, in some cases, erroneous predictions [27]. Taking the industrial gasification plant as an example, the limitations of commonly used measurement methods in industry prevent the direct or real-time acquisition of certain critical parameters. These include the syngas temperature at the reactor chamber exit, the real-time flow rate and residual carbon content of slag and ash, and the reaction amount of quench water. Such shortcomings impede the energy and mass balance analysis of the gasifier. In addition, measurement inaccuracies, such as discrepancies in syngas and pulverized coal flow measurements, lead to errors in assessing coal and oxygen consumption. All these factors restrict the direct application of industrial data.
Data reconciliation is a data preprocessing technology that estimates the true values of measured parameters by leveraging data redundancy and incorporating constraints from process mechanistic models [28,29]. Gross error detection, developed as an extension of data reconciliation, serves to identify and eliminate gross errors. In crude oil refineries, these technologies have been employed to refine measured data in heat exchange networks of oil distillation units and to detect gross errors [30]. In thermal power plants, data reconciliation and gross error detection have facilitated fault detection and reconstruction in high-pressure feed water heaters and extraction steam pipeline systems [31,32]. Moreover, in industrial gasification plants, data reconciliation has enhanced the accuracy of performance evaluations and aided in diagnosing field instrument failures [33]. The data reconciliation problem in coal gasification differs from that in oil refining and heat exchange systems due to its more complex physical constraints. The coal gasification process involves multiphase interactions, reaction kinetics, and thermodynamic equilibrium. This introduces nonlinear equations governing chemical equilibrium, increasing computational complexity. By utilizing data reconciliation, more accurate simulations of industrial systems and improved performance evaluation methods can be developed. For instance, operational data from a cogeneration plant have been reconciled and used to train a neural network, which significantly reduced errors in the analyzed output parameters [27]. Furthermore, an inequality-constrained data reconciliation method, in conjunction with regression analysis, has been applied to thermal system simulations, effectively minimizing simulation errors [34,35,36].
To enhance the accuracy of performance estimation and prediction in industrial entrained-flow gasification units, a data reconciliation-based model is proposed in this paper. Firstly, a data reconciliation model for the gasification process is established, and parameter estimation is performed using the PSO algorithm. Measured data from three conditions are reconciled, leading to the identification and elimination of one gross error, thereby enhancing the accuracy of performance analysis. Secondly, two characteristic equations for key parameters are derived from the reconciled results, addressing the limitations of thermodynamic equilibrium models and enabling offline prediction of gasification output and performance. Finally, an online estimation model utilizing Artificial Neural Network (ANN) is applied, facilitating real-time performance evaluation of the gasification units. The proposed method provides effective tools for performance estimation and prediction in real-world industrial applications, benefiting gasification process monitoring and optimization.

2. Materials and Methods

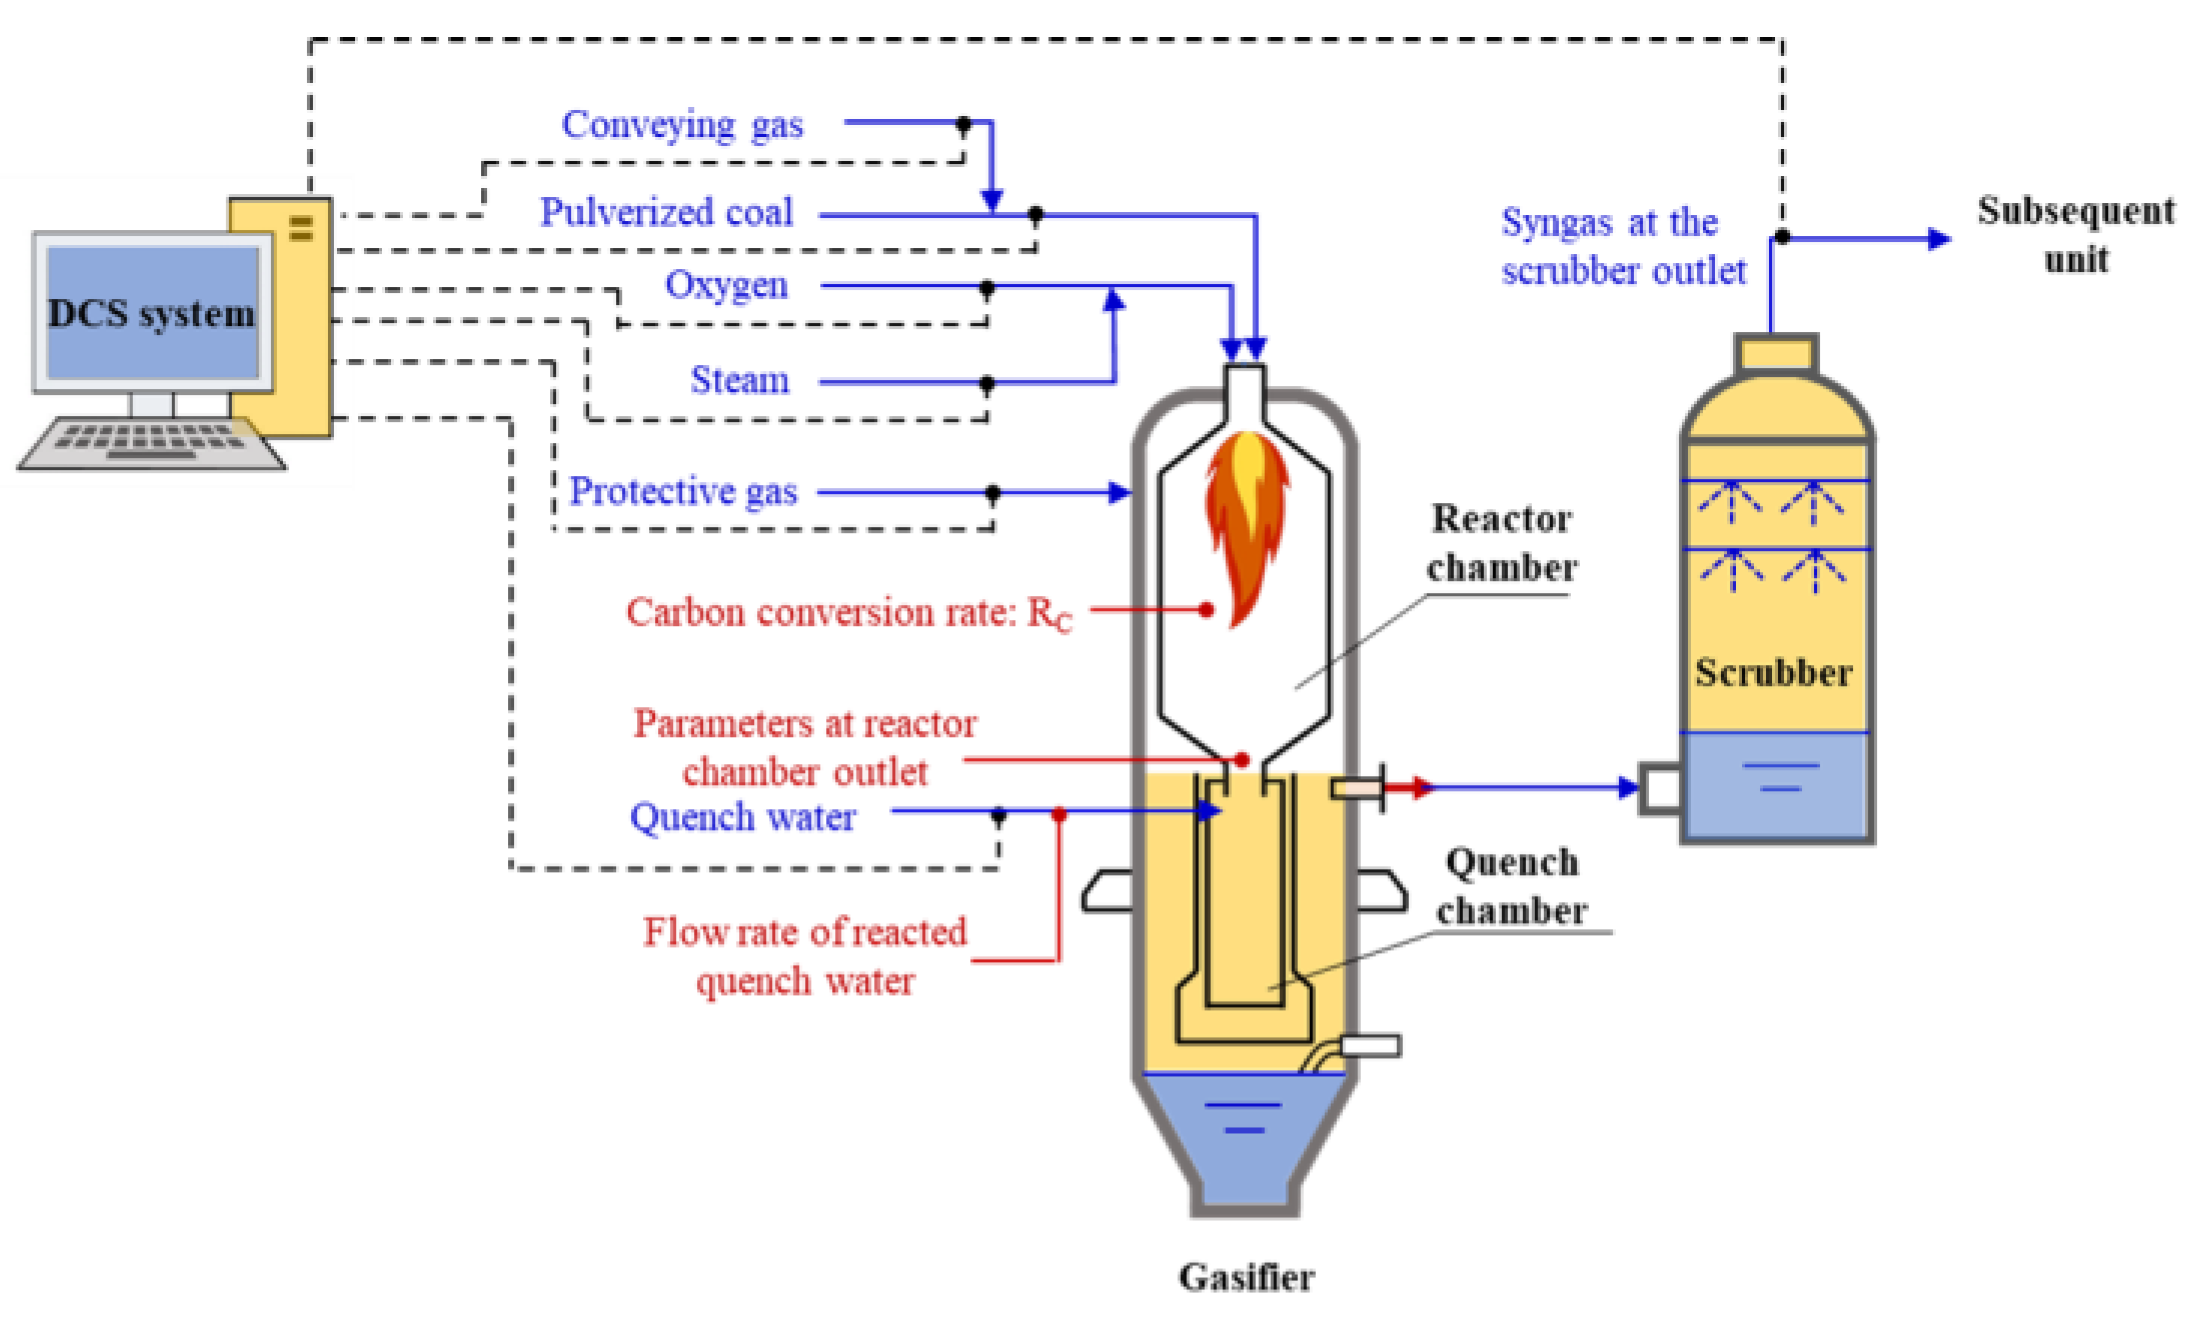
2.1. Coal Gasification Unit and the Operational Data

The gasification unit discussed in this paper consists of a gasifier and a scrubber. The gasifier is of the quench type, featuring a reactor chamber at the top and a quench chamber at the bottom, as shown in Figure 1. The design pressure of the gasifier is 4.0 MPaG, and the designed syngas production is 100,000 Nm3(CO+H2)/h. The gasification burner is located at the top of the gasifier. Pulverized coal is used as the gasification feedstock, which is conveyed by inert gas. Oxygen and a small amount of steam are employed as the gasifying agents. Within the reactor chamber, pulverized coal undergoes intense gasification and combustion reactions with oxygen and steam, generating syngas at temperatures exceeding 1300 °C. The high-temperature syngas, along with slag and ash, are directed to the quench chamber located beneath the reactor chamber, where it is rapidly cooled using substantial amounts of quench water. During this rapid cooling process, a portion of the water vaporizes into steam. Additionally, a small fraction of this steam participates in a reaction with the high-temperature syngas, known as the Water–Gas Shift Reaction (WGSR), represented by the equation CO + H2O ↔CO2+ H2. This reaction results in alterations to the syngas composition [37,38,39]. The quenched and wet syngas then progress to the scrubber, where they undergo further washing before moving on to the subsequent processing unit. The coal utilized in the gasifier during the data collection phase of this paper is Shanxi anthracite, with its coal composition and properties presented in Table 1.
Numerous sensors are installed on industrial gasification units to gather real-time data, such as flow rates, temperatures, and pressures, which are subsequently transmitted and stored in the Distributed Control System (DCS, provied by SUPCON, Hangzhou, China). For example, the mass flow rate of pulverized coal is measured by a capacitive dense-phase solid flow meter (provided by FLOWTEC, Tianjin, China), with a measurement accuracy of 3%. The measurement of gas flow rates, such as oxygen flow, coal conveying gas flow, and wet syngas flow at the scrubber outlet, employs orifice plate flowmeters calibrated using standard flowmeters, achieving a measurement accuracy of 1%. However, due to the presence of significant water vapor and complex gas composition in the syngas, calibrating these flowmeters poses challenges, often leading to measurement errors. Given that the wet syngas at the scrubber outlet is in a saturated state, the proportion of dry syngas can be derived from the temperature and pressure, allowing for the calculation of the dry syngas flow rate. Therefore, the flow rate measurement of dry syngas incorporates the measurement errors from the flow rate of wet syngas, temperature, and pressure, potentially leading to even greater overall error. The main components of dry syngas include CO, H2, CO2, N2, and CH4, with the concentration of each component quantified using online chromatographic (provided by Yokogawa Electric Corporation, Tokyo, Japan) or infrared (provided by BeiFen MaiHack, Beijing, China) gas analyzers, achieving a measurement accuracy of 1–2%. The measurement of syngas composition is periodically calibrated based on laboratory analysis values. The data collected by the sensors are compiled into the DCS system and can be exported as needed. The principal parameters of the gasification unit are summarized in Table 2. In addition to the measured parameters, several unmeasured parameters critical for understanding the operating status of the gasifier, as well as the gasification performance metrics, are also specified in Table 2.
For the operational status assessment of the gasifier, the carbon conversion rate (Rc) and the syngas temperature at the reactor chamber outlet (Tgas,sd) are selected indicators, while coal consumption (Ccoal) and oxygen consumption (Coxy) are chosen for estimating the operational costs of the gasification unit. The carbon conversion rate can be articulated through the following two equations [40]:
R C = F l o w r a t e o f c a r b o n i n s y n g a s ( k g / s ) F l o w r a t e o f c a r b o n i n c o a l ( k g / s ) × 100 % ,
R C = [ 1 - F l o w r a t e o f   c a r b o n i n s l a g a n d a s h ( k g / s ) F l o w r a t e o f c a r b o n i n c o a l ( k g / s ) ] × 100 % .
Coal consumption and oxygen consumption can be expressed as:
C c o a l = F l o w r a t e o f c o a l ( k g / h ) F l o w r a t e o f e f f e c t i v e s y n g a s ( 1000 N m 3 / h ) × 100 % ,
C o x y = F l o w r a t e o f o x y g e n ( N m 3 / h ) F l o w r a t e o f e f f e c t i v e s y n g a s ( 1000 N m 3 / h ) × 100 % .
Obtaining accurate performance parameters often poses significant challenges in practical industrial applications. Firstly, direct measurement of the syngas temperature within the reactor chamber is typically not feasible due to the extreme temperature, high pressure, and slag-containing environment, which prevents sensors from functioning effectively over extended periods. Secondly, the inability to measure the slag flow rate and residual carbon content in real-time makes it impossible to calculate the carbon conversion rate using Equation (1); instead, calculations rely on periodic sampling. Additionally, measurements of syngas flow rate at the scrubber outlet frequently exhibit considerable deviations [31]. Although the flow rate can be estimated based on subsequent product yield, this approach yields only average values over time, rather than real-time data. The inaccuracies in measuring the syngas flow rate further contribute to discrepancies in assessing coal and oxygen consumption. Finally, within the quench chamber, the reaction between water and syngas alters the composition of the syngas. However, accurately measuring the amount of water involved in the WGSR is challenging, resulting in the absence of key input parameters needed for a comprehensive balance analysis of the gasification process. In conclusion, inaccurate and insufficient measurements significantly impede the performance evaluation and prediction of the industrial gasification unit.

2.2. Data Reconciliation-Based Method for Performance Estimation

The framework of the data reconciliation-based method is depicted in Figure 2. The approach comprises three modules: data reconciliation, offline prediction, and online estimation. In the data reconciliation module, parameters with gross errors are identified and corrected, while unmeasured parameters are estimated to derive virtual measurements. The measured values are then adjusted to conform to the constraints of the mechanistic model, culminating in the formation of a reconciled database. Using the reconciliation results from the historical data, the relationships between two key parameters—the carbon conversion rate and the flow rate of reacted quench water—and the input parameters are analyzed to construct data-based characteristic equations. These equations are subsequently integrated with the mechanistic model to develop the offline prediction module, which is designed for forecasting the output of the gasification unit during the production planning phase. The online estimation module, built around the ANN model, is intended for rapid response. It can swiftly predict real-time operational performance based on real-time operational data. The ANN model is trained using data from the reconciled database along with the predicted data generated by the offline prediction module. All models discussed in this paper are developed using Python 3.12, which offers high compatibility with industrial control systems for seamless integration.

2.3. Data Reconciliation

Data reconciliation leverages redundancy in measurement data to estimate the true values of the measured parameters while adhering to the constraints of the process mechanistic model. Mathematically, this is articulated as a constrained optimization problem in the following equation:
M i n i m i z e F o b j = x i - x i * σ i 2 S u b j e c t t o : F n ( x * , y * , z * ) = 0 ,
wherein, x represents the measured values of the parameters to be reconciled, x is the corresponding reconciled values, y is the virtual measurement values of the unmeasured parameters, and z is the reconstructed values of the measured parameters with gross errors. σi is the measurement standard deviation or the measurement uncertainty, which can be calculated from Equation (6) according to the allowable error of the measured values [34].
σ i = ξ i 1.96 N i .
Equation (5) describes the mechanistic model governing the gasification process. In this paper, a thermodynamic equilibrium model is employed, comprising a set of nonlinear equations, including elemental conservation equations, energy conservation equations, and chemical reaction equilibrium equations.
Element balance in the reactor chamber:
n C , c o a l m c o a l R C - V g a s , g ( n C , C O 2 F C O 2 , g + n C , C O F C O , g + n C , C H 4 F C H 4 , g ) × 0.536 = 0 ,
n H , c o a l m c o a l + n H , H 2 O m s t e a m - V g a s , g ( n H , H 2 F H 2 , g + n H , H 2 O F H 2 O , g + n H , C H 4 F C H 4 , g ) × 0.045 = 0 ,
n O , c o a l m c o a l + n O , o x y V o x y × 0.714 + n O , H 2 O m s t e a m - V g a s , g ( n O , C O 2 F C O 2 , g + n O , C O F C O , g + n O , H 2 O F H 2 O , g ) × 0.714 = 0 ,
n N , c o a l m c o a l + ( V c o n + V p r o ) × 1.25 - V g a s , g F N 2 , g × 1.25 = 0 ,
wherein, np,q represents the mass content of element p in substance q.
The chemical equilibrium in the reactor chamber is modeled using the Water–Gas Shift Reaction (WGSR) and the Dry Reforming of Methane (DRM). The WGSR is the most critical reaction determining the main composition of syngas (i.e., CO, H2, and CO2). The methane concentration serves as a key indicator of gasification temperature, so DRM is selected with the extra advantage of avoiding water participation, which can simplify the calculations. Below are the equilibrium equations for these two reactions:
F C O 2 , g F H 2 , g - K 1 F C O , g F H 2 O , g = 0 ,
F C O , g 2 F H 2 , g 2 P g a s , g 2 - K 2 F C O 2 , g F C H 4 , g = 0 ,
wherein, K1 and K2 are the equilibrium constants of WGSR and DRM. The relationships between the equilibrium constants and the temperature, i.e., K 1 = f 1 ( T g a s , g ) and K 2 = f 2 ( T g a s , g ) , can be calculated using the van ’t Hoff equation, which is given by:
l n K = - Δ H 0 R 1 T + Δ S 0 R ,
wherein, ΔH0 is the standard enthalpy change of the reaction, ΔS0 is the standard entropy change of the reaction, R is the universal gas constant (8.314 J/mol·K), and T is the absolute temperature in Kelvin.
Energy balance in the reactor chamber:
H c o a l m c o a l + H o x y V o x y + H s t e a m m s t e a m + H c o n V c o n + H p r o V p r o - Q - H i , g F i , g V g a s , g = 0 ,
wherein, H is the total enthalpy including sensible enthalpy and chemical formation enthalpy; the enthalpy of gas (except steam) is in kJ/Nm3, and the enthalpy of solid, liquid and steam is in kJ/kg; Q is the heat loss from the reactor chamber, and H i , g F i , g V g a s , g represents the sum of the enthalpies of all components in the syngas at the outlet of the reactor chamber.
Water vapor balance at the scrubber outlet is P s / P g a s , s ( T g a s , s ) = F H 2 O , s , where Ps is the saturation vapor pressure of water under the temperature of syngas at the scrubber outlet; FH2O,s represents the volume fraction of H2O in the wet syngas at the scrubber outlet. The dry syngas flow rate at the scrubber outlet can be calculated using V g a s , s = d V g a s , s / ( 1 - F H 2 O , s ) .
The changes in gas composition from the outlet of the reactor chamber to the scrubber outlet due to the WGSR are expressed as follows:
V g a s , g F C O 2 , g + M w , r × 1.244 - V g a s , s F C O 2 , s d = d 0 ,
V g a s , g F C O , g - M w , r × 1.244 - V g a s , s F C O , s d = d 0 ,
V g a s , g F H 2 , g + M w , r × 1.244 - V g a s , s F H 2 , s d = d 0 ,
V g a s , g F N 2 , g - V g a s , s F N 2 , s d = d 0 ,
V g a s , g F C H 4 , g - V g a s , s F C H 4 , s d = d 0 ,
wherein, Mw,r is the flow rate of quench water that reacted with the syngas in the quench chamber. The reaction with quench water alters the amount of CO2, CO, and H2, while CH4 and N2 remain unaffected [38,39].
Compositional normalization equation:
F C O , g + F H 2 , g + F C O 2 , g + F H 2 O , g + F N 2 , g + F C H 4 , g - 1 = 0 ,
F C O , s + d F H 2 , s + d F C O 2 , s + d F N 2 , s + d F C H 4 , s - d 1 = 0 .
In this study, trace gases, such as H2S, COS, and Argon, with concentrations at the ppm level, are excluded from the analysis due to the negligible impact on major gas components.
Equations (7) to (20) form the constraints necessary for data reconciliation. The parameters to be reconciled include the measured parameters listed in Table 2. Among these, Vgas,s, Pgas,s, and Tgas,s are utilized to calculate Vgas,sd, which is considered a single parameter for reconciliation. The unmeasured parameters, as detailed in Table 2, include the carbon conversion rate RC, the flow rate of the reacted quench water Mw,r, the temperature, flow rate, and compositions of the syngas at the outlet of the reactor chamber.
The process of data reconciliation and gross error detection is illustrated in Figure 3. Initially, the measurements are assumed to be free of gross errors, and a data reconciliation model is constructed. Parameters are estimated using the Particle Swarm Optimization (PSO) algorithm. The objective function value, calculated using Equation (5), is then compared with the chi-square critical value at a significance level of α = 0.05. The degree of freedom (N) for the chi-square test is determined by the difference between the number of measured parameters and the number of parameters required to define the process. If the objective function value is less than the critical value, the null hypothesis of no gross error is confirmed, completing the data reconciliation process. Conversely, if the chi-square test rejects the null hypothesis, a stepwise regression method is employed. Measured parameters suspected of containing gross errors are sequentially removed from the model and treated as unmeasured parameters, while the impact on the objective function is analyzed. When the objective function shows a significant decrease and falls below the chi-square critical value, the eliminated measured parameter is identified as containing a gross error, and its value is subsequently estimated using the PSO solver.
To evaluate the basic robustness of the data reconciliation model, a sensitivity test was conducted. A set of precomputed values was designated as the “real values”; synthetic measured values were generated by superimposing normally distributed random noise (magnitude: ±1%) onto these reference values; these perturbed inputs were processed through the data reconciliation framework. The reconciled outputs exhibited residual deviations below 1% relative to the “real values”. This confirms that the model effectively mitigates input uncertainties within the tested perturbation range, establishing preliminary robustness against small-scale stochastic variations.

2.4. ANN Model

The ANN model boasts the advantages of timeliness, excellent adaptability to nonlinear problems, and strong generalization capabilities. Therefore, it is utilized in the online estimation module of this paper to rapidly predict real-time operational performance based on real-time operation data. A feedforward neural network model is adopted, consisting of 7–14 input features and 5–11 output features, along with one hidden layer containing 100 neurons that utilize the ReLU activation function. The input to the ANN model is the real-time operational data of the gasification unit, while the output represents the real-time performance of the unit.
The performance of the ANN model prediction is evaluated using the coefficient of determination (R2), the root mean square error (RMSE), and the relative root mean square error (RRMSE) [31]. These three performance indicators are defined as follows:
R 2 = 1 -   i = 1 N ( X i - X i p ) 2 i = 1 N ( X i - X p ¯ ) 2 ,
R M S E = 1 N i = 1 N ( X i - X i p ) 2 ,
R R M S E = 1 N i = 1 N ( X i - X i p ) 2 X ¯ ,
where X is the measured value, Xp is the predicted value, N is the number of samples, X ¯ is the average value of the predicted values, and X ¯ P is the average value of the measured values.

3. Results and Discussion

3.1. Results of Data Reconciliation

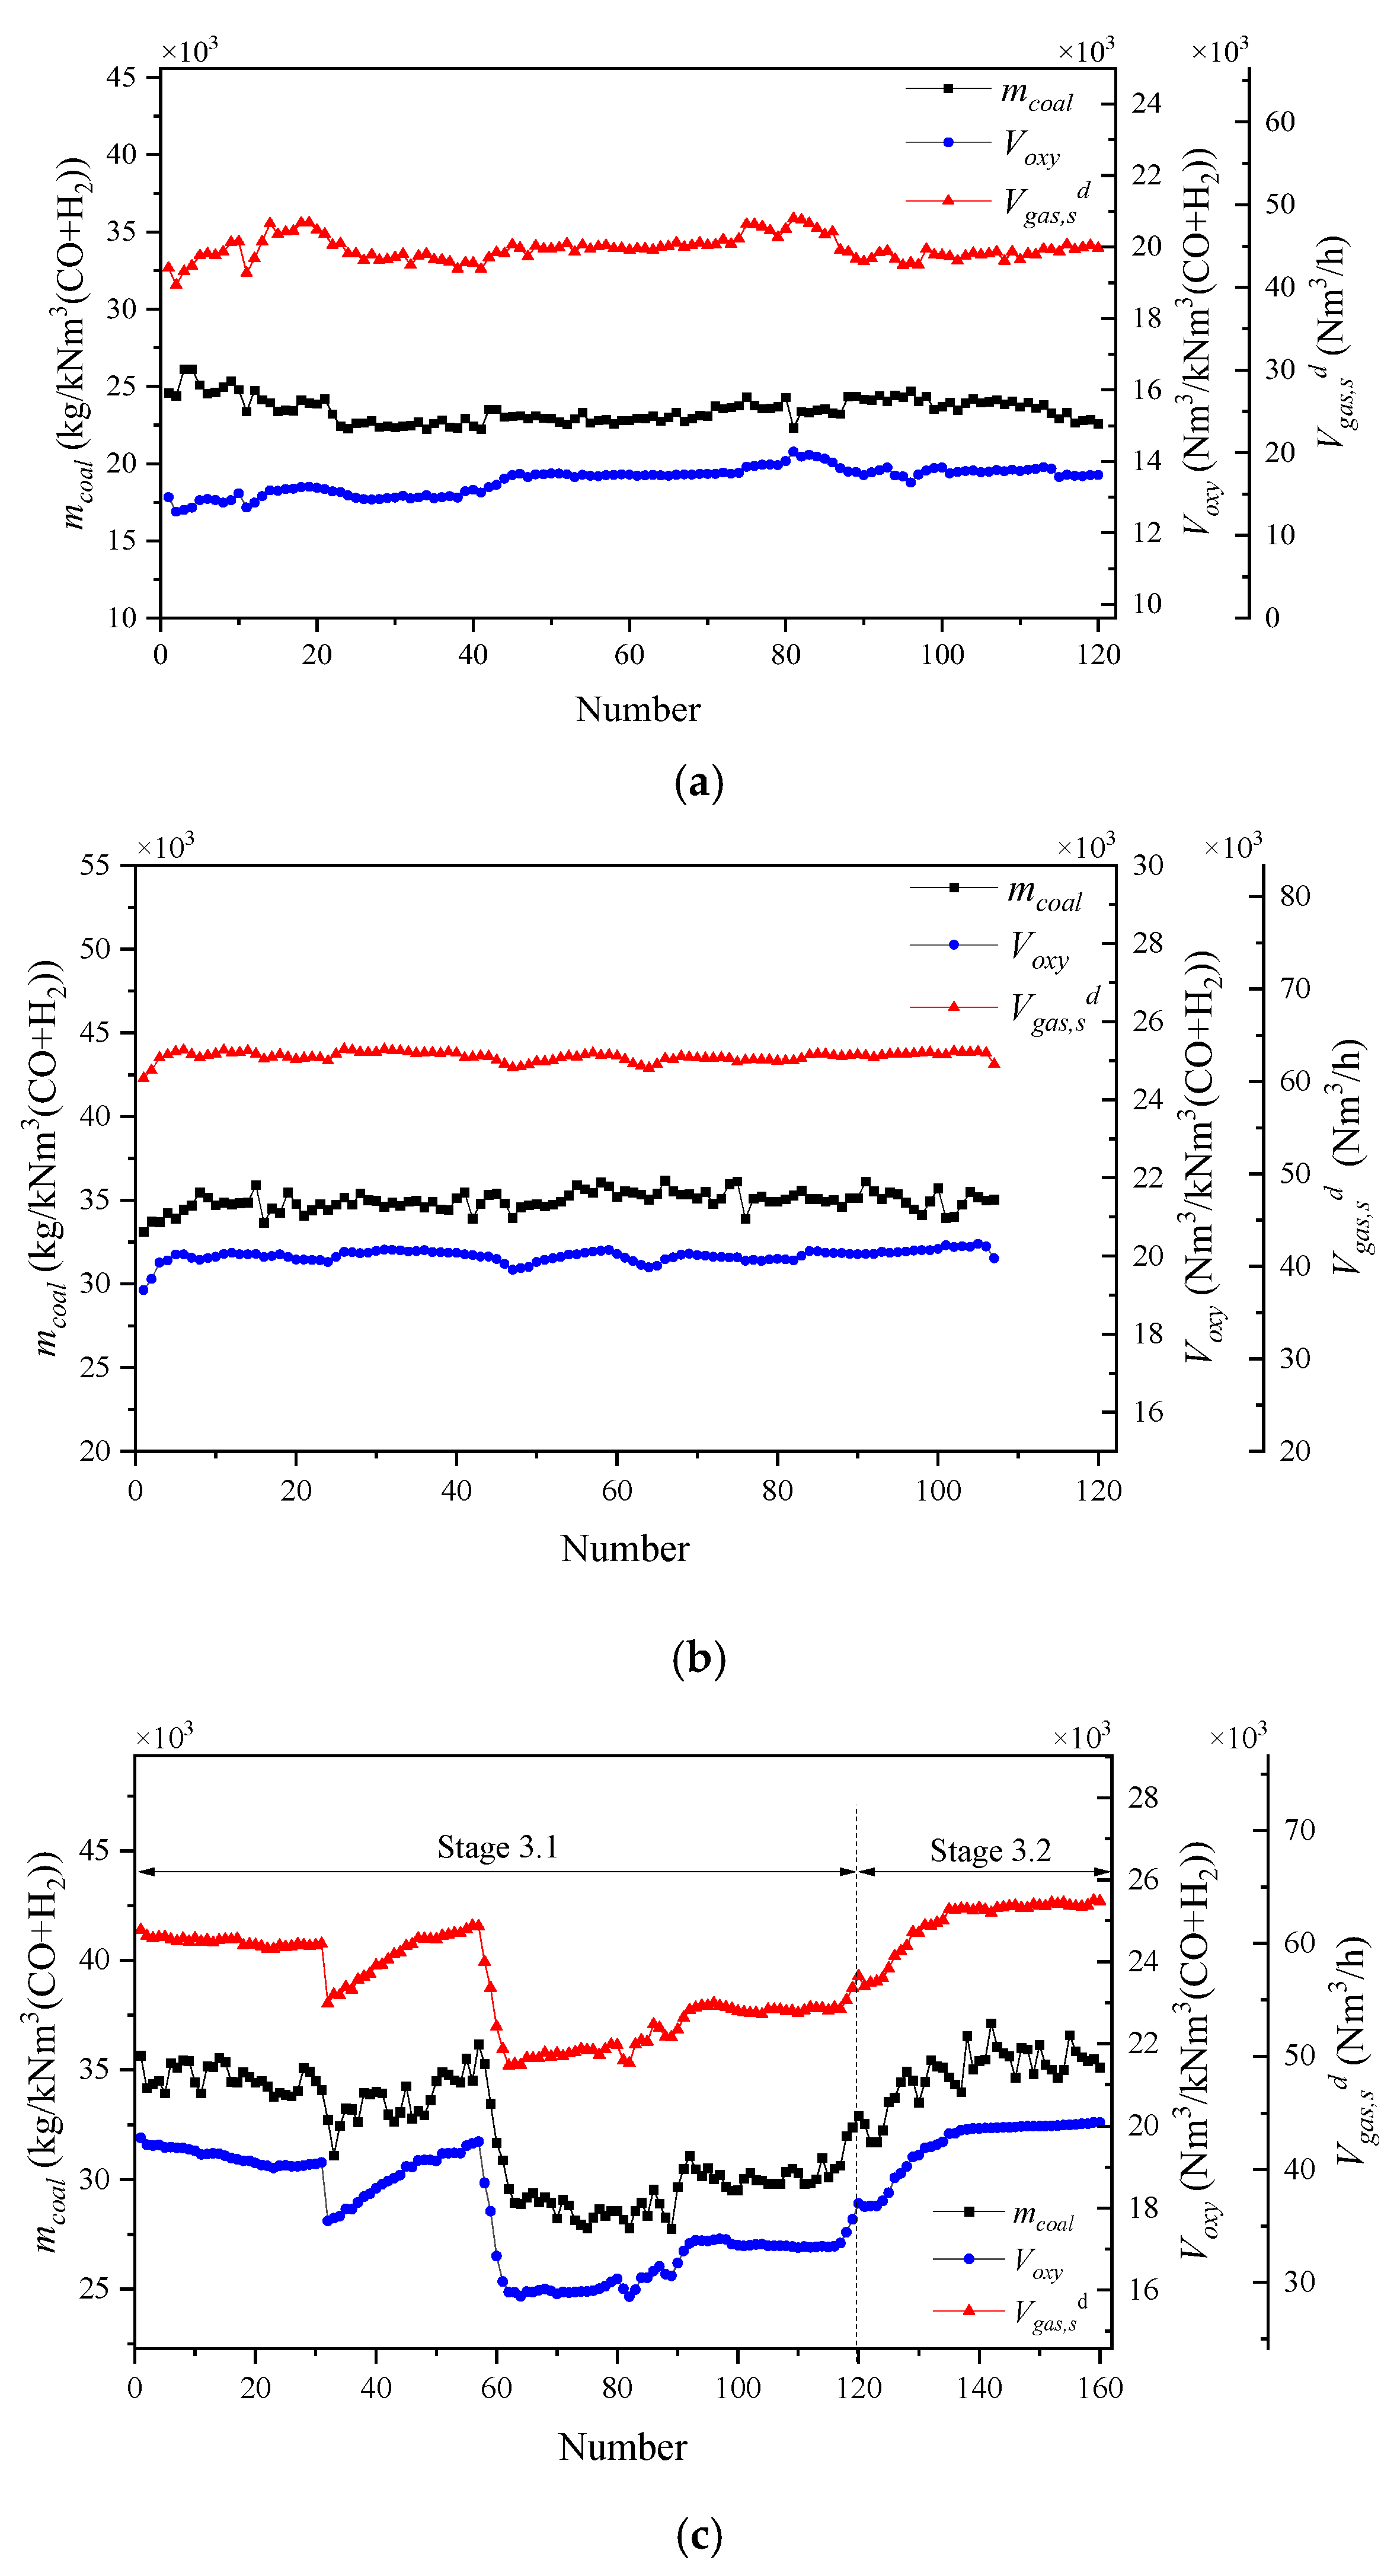
3.1.1. Operational Data in Three Operating Stages

For an operating entrained-flow pulverized coal gasification unit, this study analyzes operational data recorded through the DCS during three consecutive time stages. Variations in the main parameters across these stages are illustrated in Figure 4. In Stage 1, the operating pressure of the gasifier is 2.40 ± 0.2 MPaG, the coal flow is about 23,500 ± 2000 kg/h, the oxygen flow is 13,500 ± 800 Nm3/h, and the oxygen-to-coal ratio is 0.70 ± 0.09 kg/kg; in Stage 2, the operating pressure is 4.0 ± 0.1 MPaG, the coal flow is about 34,900 ± 1500 kg/h, the oxygen flow is 20,000 ± 600 Nm3/h, and the oxygen-to-coal ratio is 0.79 ± 0.03 kg/kg; in Stage 3, the operating pressure is 4.0 ± 0.4 MPaG, the coal flow is about 33,000 ± 5000 kg/h, the oxygen flow is 18,000 ± 2000 Nm3/h, and the oxygen-to-coal ratio is 0.80 ± 0.05 kg/kg. The water-to-oxygen ratio of the three stages was controlled at about 0.1. Among the main operating parameters, the measurement of oxygen flow is generally highly accurate. Although the measurement of coal quantity is prone to errors, it is considered to be relatively accurate as well because it has been calibrated using the weighing method during the data acquisition stage. However, due to the difficulty in calibration, there are often errors in the measurement of synthesis gas flow rate. Each stage lasts approximately 10 to 16 h, with a sampling interval of 6 min, allowing for the collection of average values of operating parameters every 6 min. The number of samples for the three stages is 120, 107, and 160, respectively. The third stage is further divided into two sections; the data from Stage 3.1 are utilized for data reconciliation, while Stage 3.2 data are employed for validating performance predictions. During Stages 1 and 2, the flow rates of both coal and oxygen remain relatively stable. Consequently, these stages are classified as stable operating conditions, where only the average value for each stage is reconciled. In contrast, Stage 3 exhibits fluctuations in load, leading to its classification as a variable operating condition, in which data from each sampling point are reconciled. In the plant, measurements of slag and ash quantity, along with carbon residue content in both slag and ash, are conducted every 12 h, and product yield is also recorded within the same time frame. These offline measurements provide multi-source data that can be leveraged to validate the results of data reconciliation.

3.1.2. Data Reconciliation Results of Stable Operating Conditions

In both Stage 1 and Stage 2, the measured data are averaged over the entire period, with the average values presented in the “measured” column of Table 3. Operating performance is calculated directly based on these average measured values. According to Equation (1), the carbon conversion rates for the two stages are determined to be 88.4% and 86.0%, respectively. However, when calculating the carbon conversion rates using the measurements of ash and slag amounts, along with residual carbon content, as described in Equation (2), the rates are found to be approximately 95% and 96%, reflecting a significant discrepancy. Additionally, according to Equation (3), the coal consumption for the two stages is calculated to be 680 and 685 kg/kNm3 (CO+H2), respectively. According to Equation (4), the oxygen consumption is measured at 382 and 396 Nm3/kNm3 (CO+H2), respectively. This relatively high oxygen consumption exceeds the operational range for a pulverized coal gasifier utilizing anthracite, suggesting the potential existence of significant errors in the measurements.
Take the data in Stage 1 as an example for data reconciliation and gross error detection. Initially, data reconciliation is conducted under the assumption that there are no gross errors in the measurement values. The optimal value of the objective function obtained from the PSO algorithm is 46.58, which significantly exceeds the chi-square critical value of 11.07 for 5 degrees of freedom at a significance level of α = 0.05. This indicates the presence of gross errors in the measurement values. Subsequently, by sequentially removing the measured values of coal flow rate, oxygen flow rate, and dry syngas flow rate at the scrubber outlet, the optimal values of the objective function are found to be 48.25, 43.66, and 0.72, respectively. Notably, the removal of the dry syngas flow rate has a substantial impact on the objective function, suggesting that there is a gross error in the measurement of this parameter. As for Stage 2, the optimal value of the objective function obtained in the initial data reconciliation is 55.85 and becomes 54.75, 55.77, and 0.45, respectively, after the sequential exclusion of the coal, oxygen, and syngas flow rates. Consistent with Stage 1, the exclusion of syngas flow rate measurements significantly reduces the optimal value of the objective function, suggesting that gross error may exist in the syngas flow rate measurements. Consequently, the dry syngas flow rate is treated as an unmeasured parameter and will be estimated in the subsequent steps.
The data reconciliation results for Stage 1 and Stage 2 are presented in Table 3. The difference between the estimated dry syngas flow rate at the scrubber outlet and the measured value for Stag 1 and Stage 2 is 11.28% and 12.5% respectively, which exceeds the permissible measurement error and is classified as a gross error. The inaccurate measurement of syngas flow at the scrubber outlet is a common problem in entrained-flow coal gasification plants, which is also mentioned in reference [33]. The main reasons for the error are as follows: (1) The syngas at the outlet of the scrubber usually contains a large amount of water vapor, which will form a gas–liquid two-phase flow if it is not sufficiently separated. The presence of liquid or water drops will interfere with the measurement accuracy of the orifice flowmeter. (2) Syngas usually contains CO, H2, CO2, water vapor, and other components, and the proportion may fluctuate with the process. If the gas composition parameters are not corrected in real time, a measurement error will be caused. Although the synthetic gas flow rate can be calculated based on the production of chemical products in subsequent sections, there is a lag and a lack of real-time value. In view of the large flow rate, large amount of water vapor, and complex composition of syngas at the scrubber outlet, how to optimize the flow measurement is an urgent problem to be solved in the optimization of industrial plants.
Stage 1 and Stage 2 are relatively stable operating conditions, hence the syngas flow rate can be calculated based on the chemical product output in the subsequent sections, as shown in the parameter Vgas,sd-2 in Table 3. The calculated syngas flow rate matches the reconciled value very well. In addition, the estimated carbon conversion rate is also comparable to that calculated from periodically sampled values of slag and ash amounts and residual carbon content, which further supports the reliability of reconciled results. Finally, utilizing the reconciled data, the gasification performances of the two stages are determined to be 611 and 608 kg/kNm3 (CO+H2) for coal consumption, and 343 and 352 Nm3/kNm3 (CO+H2) for oxygen consumption, respectively, which are more in line with operating experience.
As illustrated in Table 3, the load in Stage 2 exceeds that of Stage 1, accompanied by an increased oxygen-to-coal ratio. The carbon conversion rate in Stage 2 is approximately 1% higher than that in Stage 1, and the syngas temperature at the reactor chamber outlet also exhibits a corresponding increase. The flow rates of the reacted quench water in the two stages are recorded at 2942 kg/h and 5878 kg/h, respectively, accounting for 2–4% of the total quench water flow rate, which is consistent with previous studies [37]. Compared to Stage 1, both the flow rate and temperature of the syngas in Stage 2 show significant increases, leading to a considerable rise in the flow rate of the reacted quench water. This, in turn, results in increased CO2 and H2 content and a decrease in CO content in the syngas. Moreover, a comparison of the syngas compositions reveals a marked increase in CO2 and H2 and a decrease in CO at the scrubber outlet, attributable to the involvement of quench water in the WGSR, consistent with previous research [37,38].

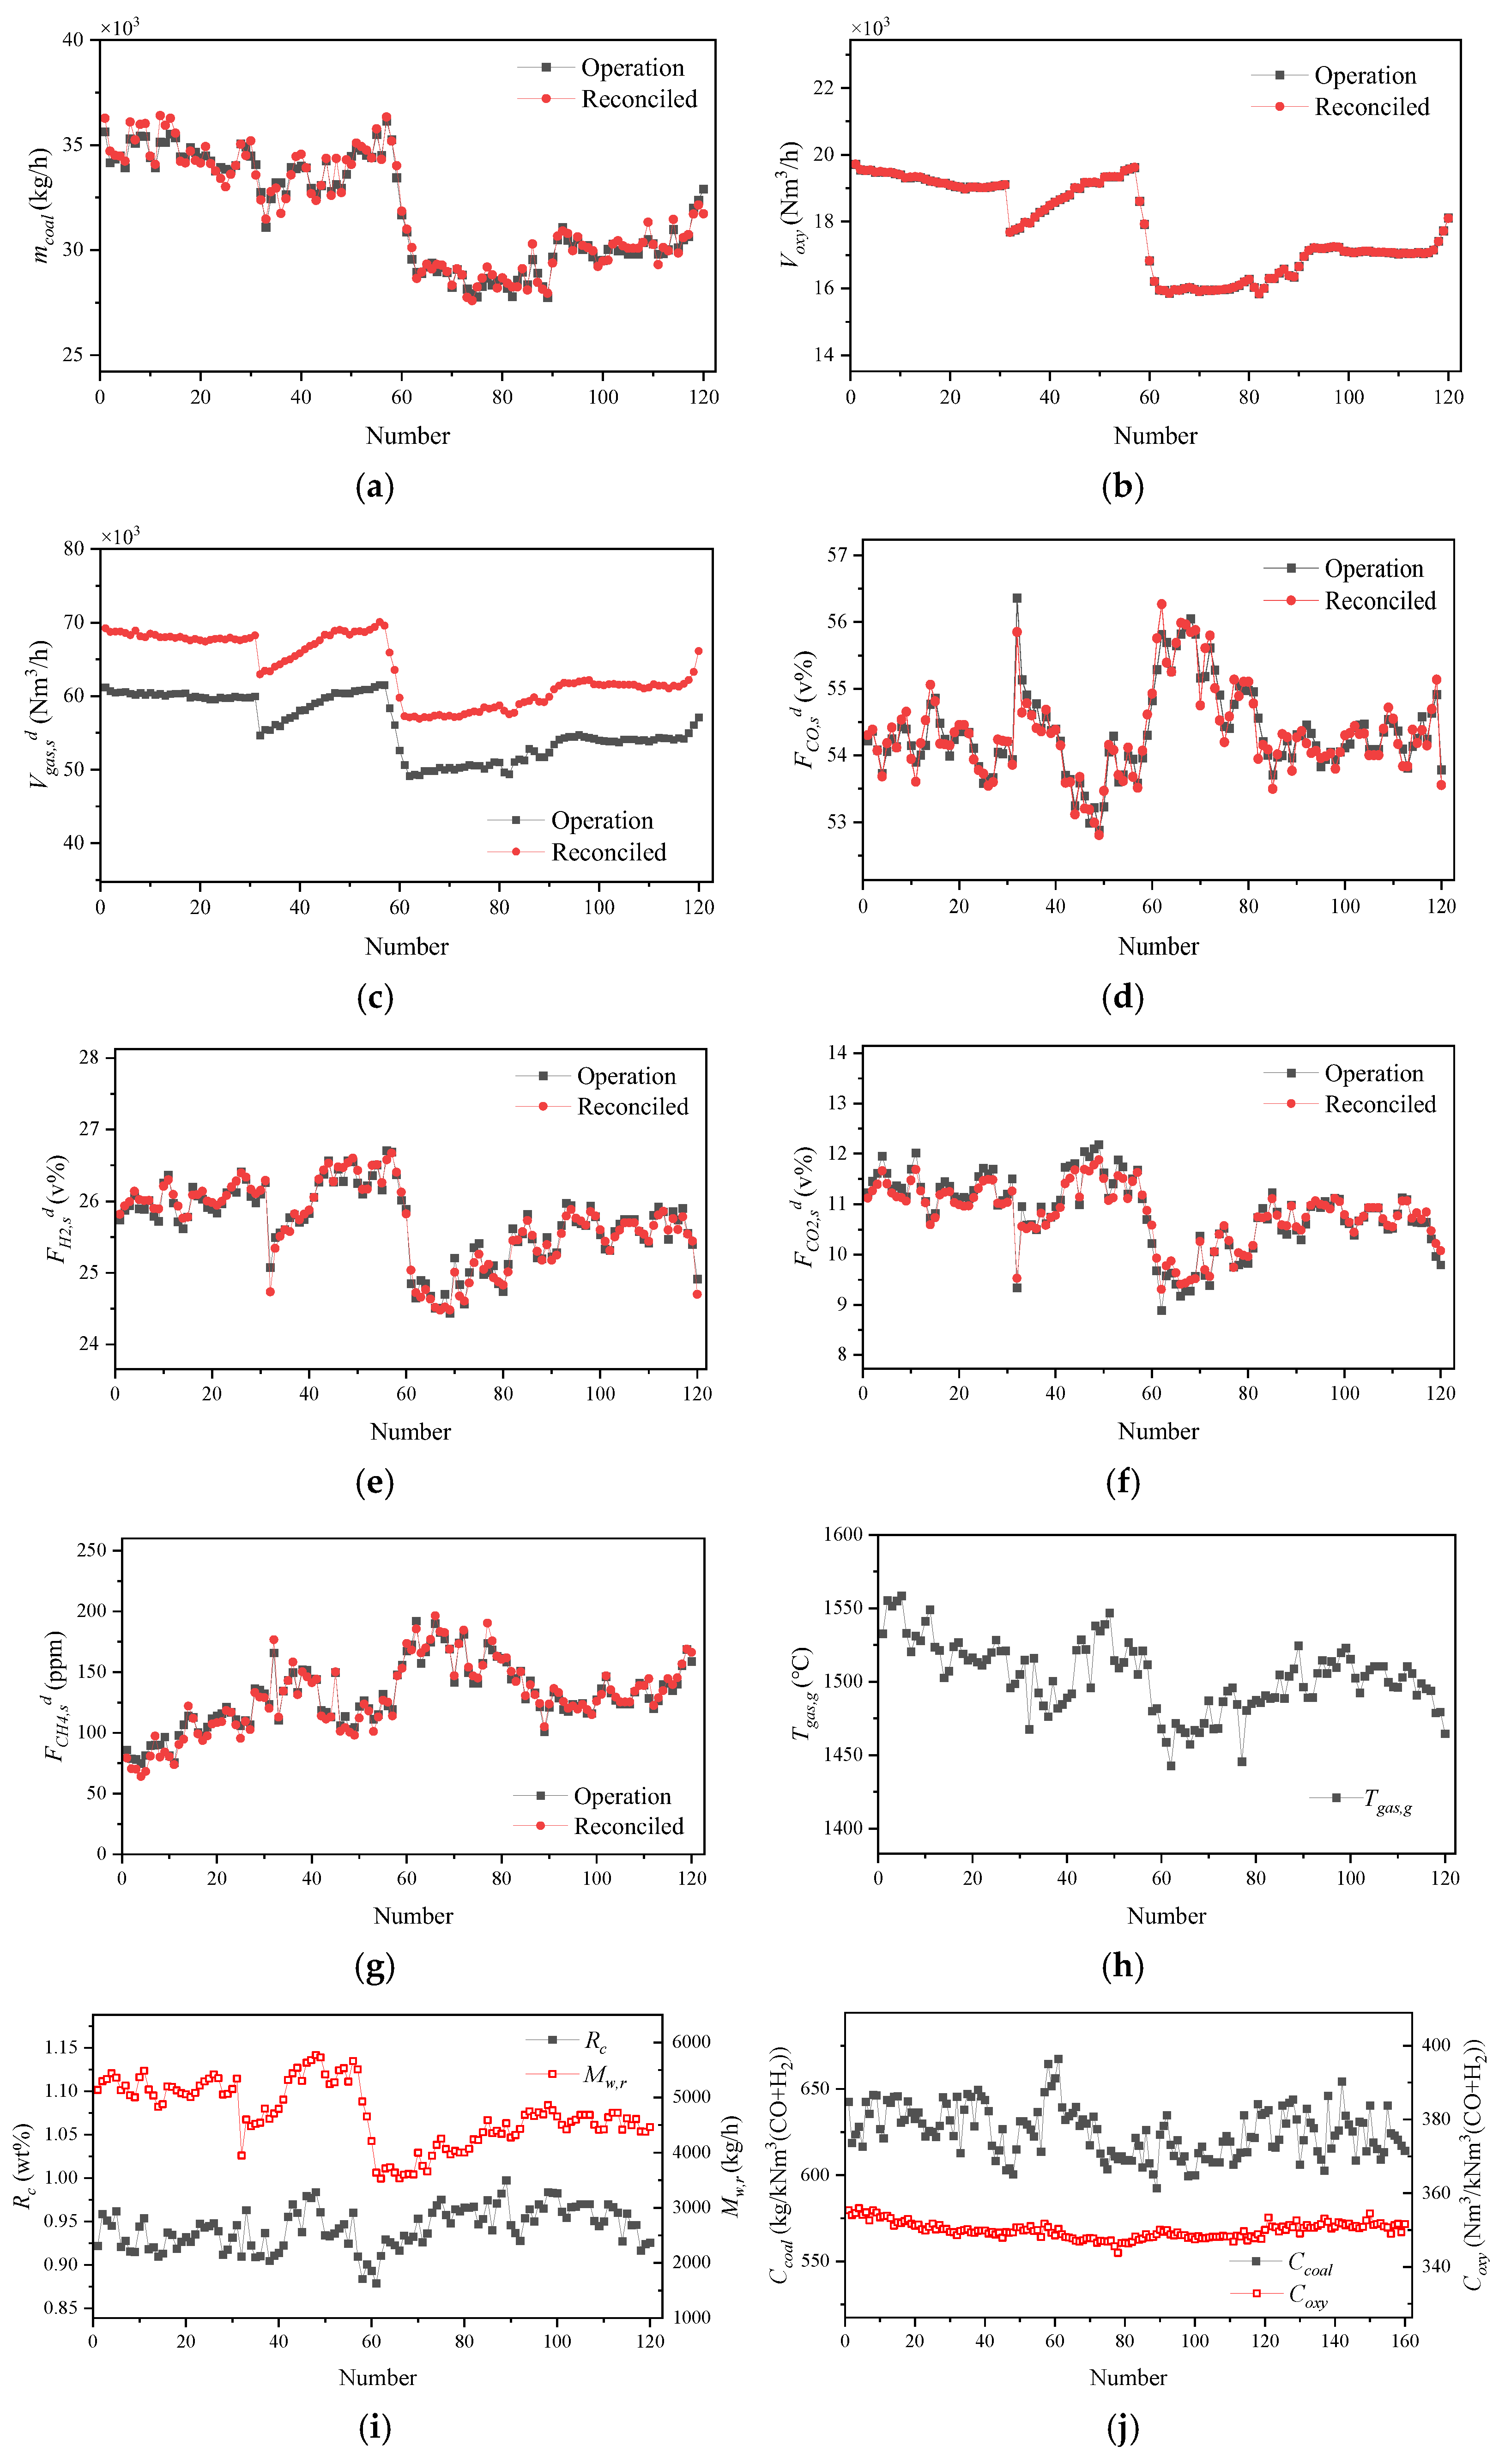
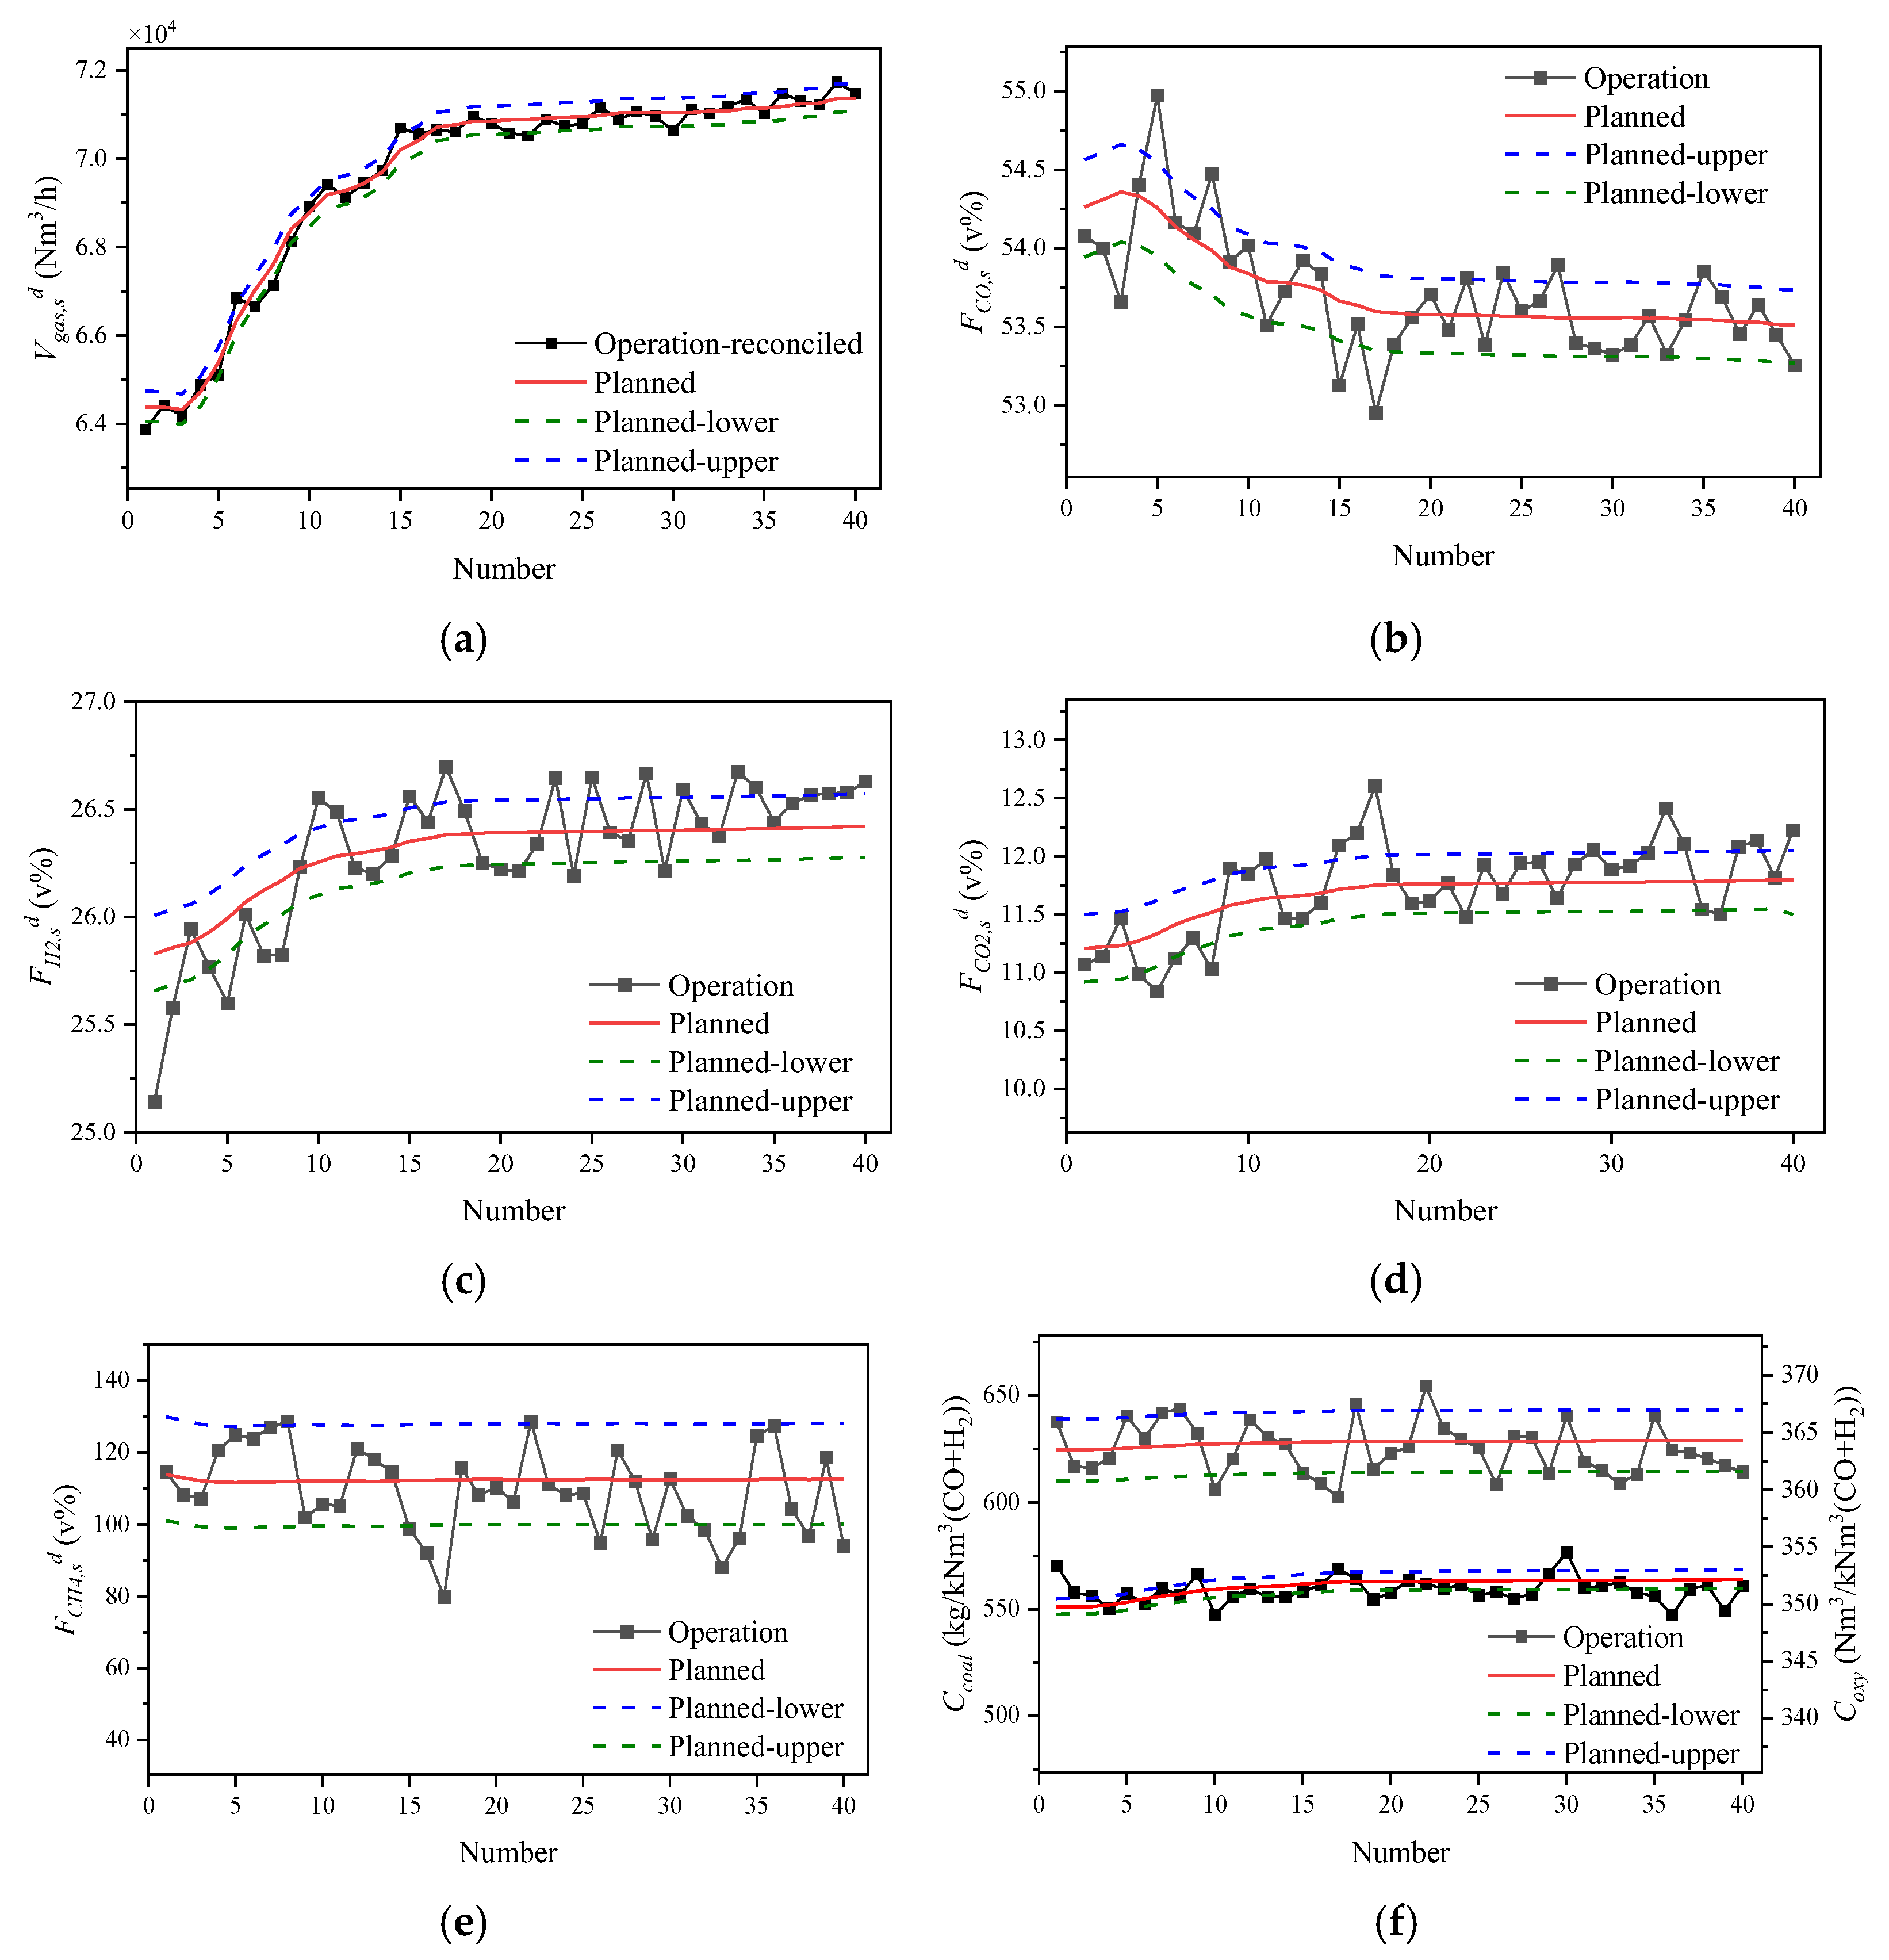
3.1.3. Data Reconciliation Results of Variable Operating Conditions

The gasification unit frequently operates under variable conditions, such as fluctuating gasifier loads and oxygen-to-coal ratios, which depend on the requirements of subsequent units. Consequently, operating parameters are adjusted in real time, necessitating a thorough analysis of the unit’s performance. Typically, the residence time of reactants in an entrained-flow gasifier is measured in seconds, while the adjustments to operating parameters occur every few minutes; for this study, a 6-min sampling interval has been established. During each sampling period, the transient instability resulting from parameter adjustments is brief and often negligible compared to the overall sampling duration. Therefore, the gasification state at each sampling point is considered quasi-steady, still adhering to the principles of energy and mass conservation, as well as reaction equilibrium. The results of data reconciliation for Stage 3.1 are illustrated in Figure 5.
As depicted in Figure 5a–j, with the notable exception of the significant deviation between the estimated and operational values for dry syngas flow at the scrubber outlet, the deviations between the reconciled and operational values for coal flow rate, oxygen flow rate, and syngas compositions fall within the measurement error range. Figure 5h–i present the temperature of the syngas at the reactor chamber outlet, the carbon conversion rate, and the flow rate of reacted quench water following data reconciliation. These figures indicate that both the carbon conversion rate and the flow rate of reacted quench water vary in response to changes in oxygen flow rate. The syngas temperature at the reactor chamber outlet fluctuates within the 1450–1550 °C range. The real-time gasification performances, specifically coal and oxygen consumption, are shown in Figure 5j. It is evident that oxygen consumption remains relatively stable around 350 Nm3/kNm3 (CO+H2), while coal consumption exhibits greater variability, fluctuating between 600 and 650 kg/kNm3 (CO+H2). This variability is attributed to the unstable two-phase flow resulting from the pneumatic conveying method used for coal transport.
The carbon conversion rate and the flow rate of reacted quench water are critical parameters for assessing the operational state of the gasifier and serve as key input parameters for thermodynamic equilibrium calculations. However, these parameters cannot be directly measured. In this study, real-time virtual measurements for these key parameters are obtained through data reconciliation. The relationship between the virtual values and the primary input parameters of the gasification unit is analyzed, as illustrated in Figure 6.
Linear regression analysis is conducted using Ordinary Least Squares (OLS), with the correlation equations between the two key parameters and the gasification inputs presented in Equations (24) and (25), respectively. The regression analysis results indicate R2 values of 0.99 and 0.95, demonstrating that the models explain 99% and 95% of the variance in the dependent variables, respectively.
R C = - 0.0536 - 1.965 × 1 0 - 6 V o x y + 1.291 R O T C ,
M w , r = - 11560 + 0.421 V o x y + 10992 R O T C .
wherein, ROTC represents the oxygen-to-coal ratio. As shown in Figure 6, the carbon conversion rate increases with the oxygen-to-coal ratio, which is consistent with general understanding. Conversely, the carbon conversion rate decreases with an increase in oxygen flow rate, likely due to reduced mixing effects in the gasifier. In addition, the fitting effect of RC is better than Mw,r. This discrepancy may result from turbulence at the reactor chamber outlet or uneven distribution of quench water, leading to uncertainty in the reacted amount of quench water, which requires further verification. The significance of this paper lies in identifying the variation patterns of these two key parameters through data reconciliation, revealing the characteristics of specific devices and operating conditions. The two data-based models will be integrated with the thermodynamic equilibrium model in the offline module.

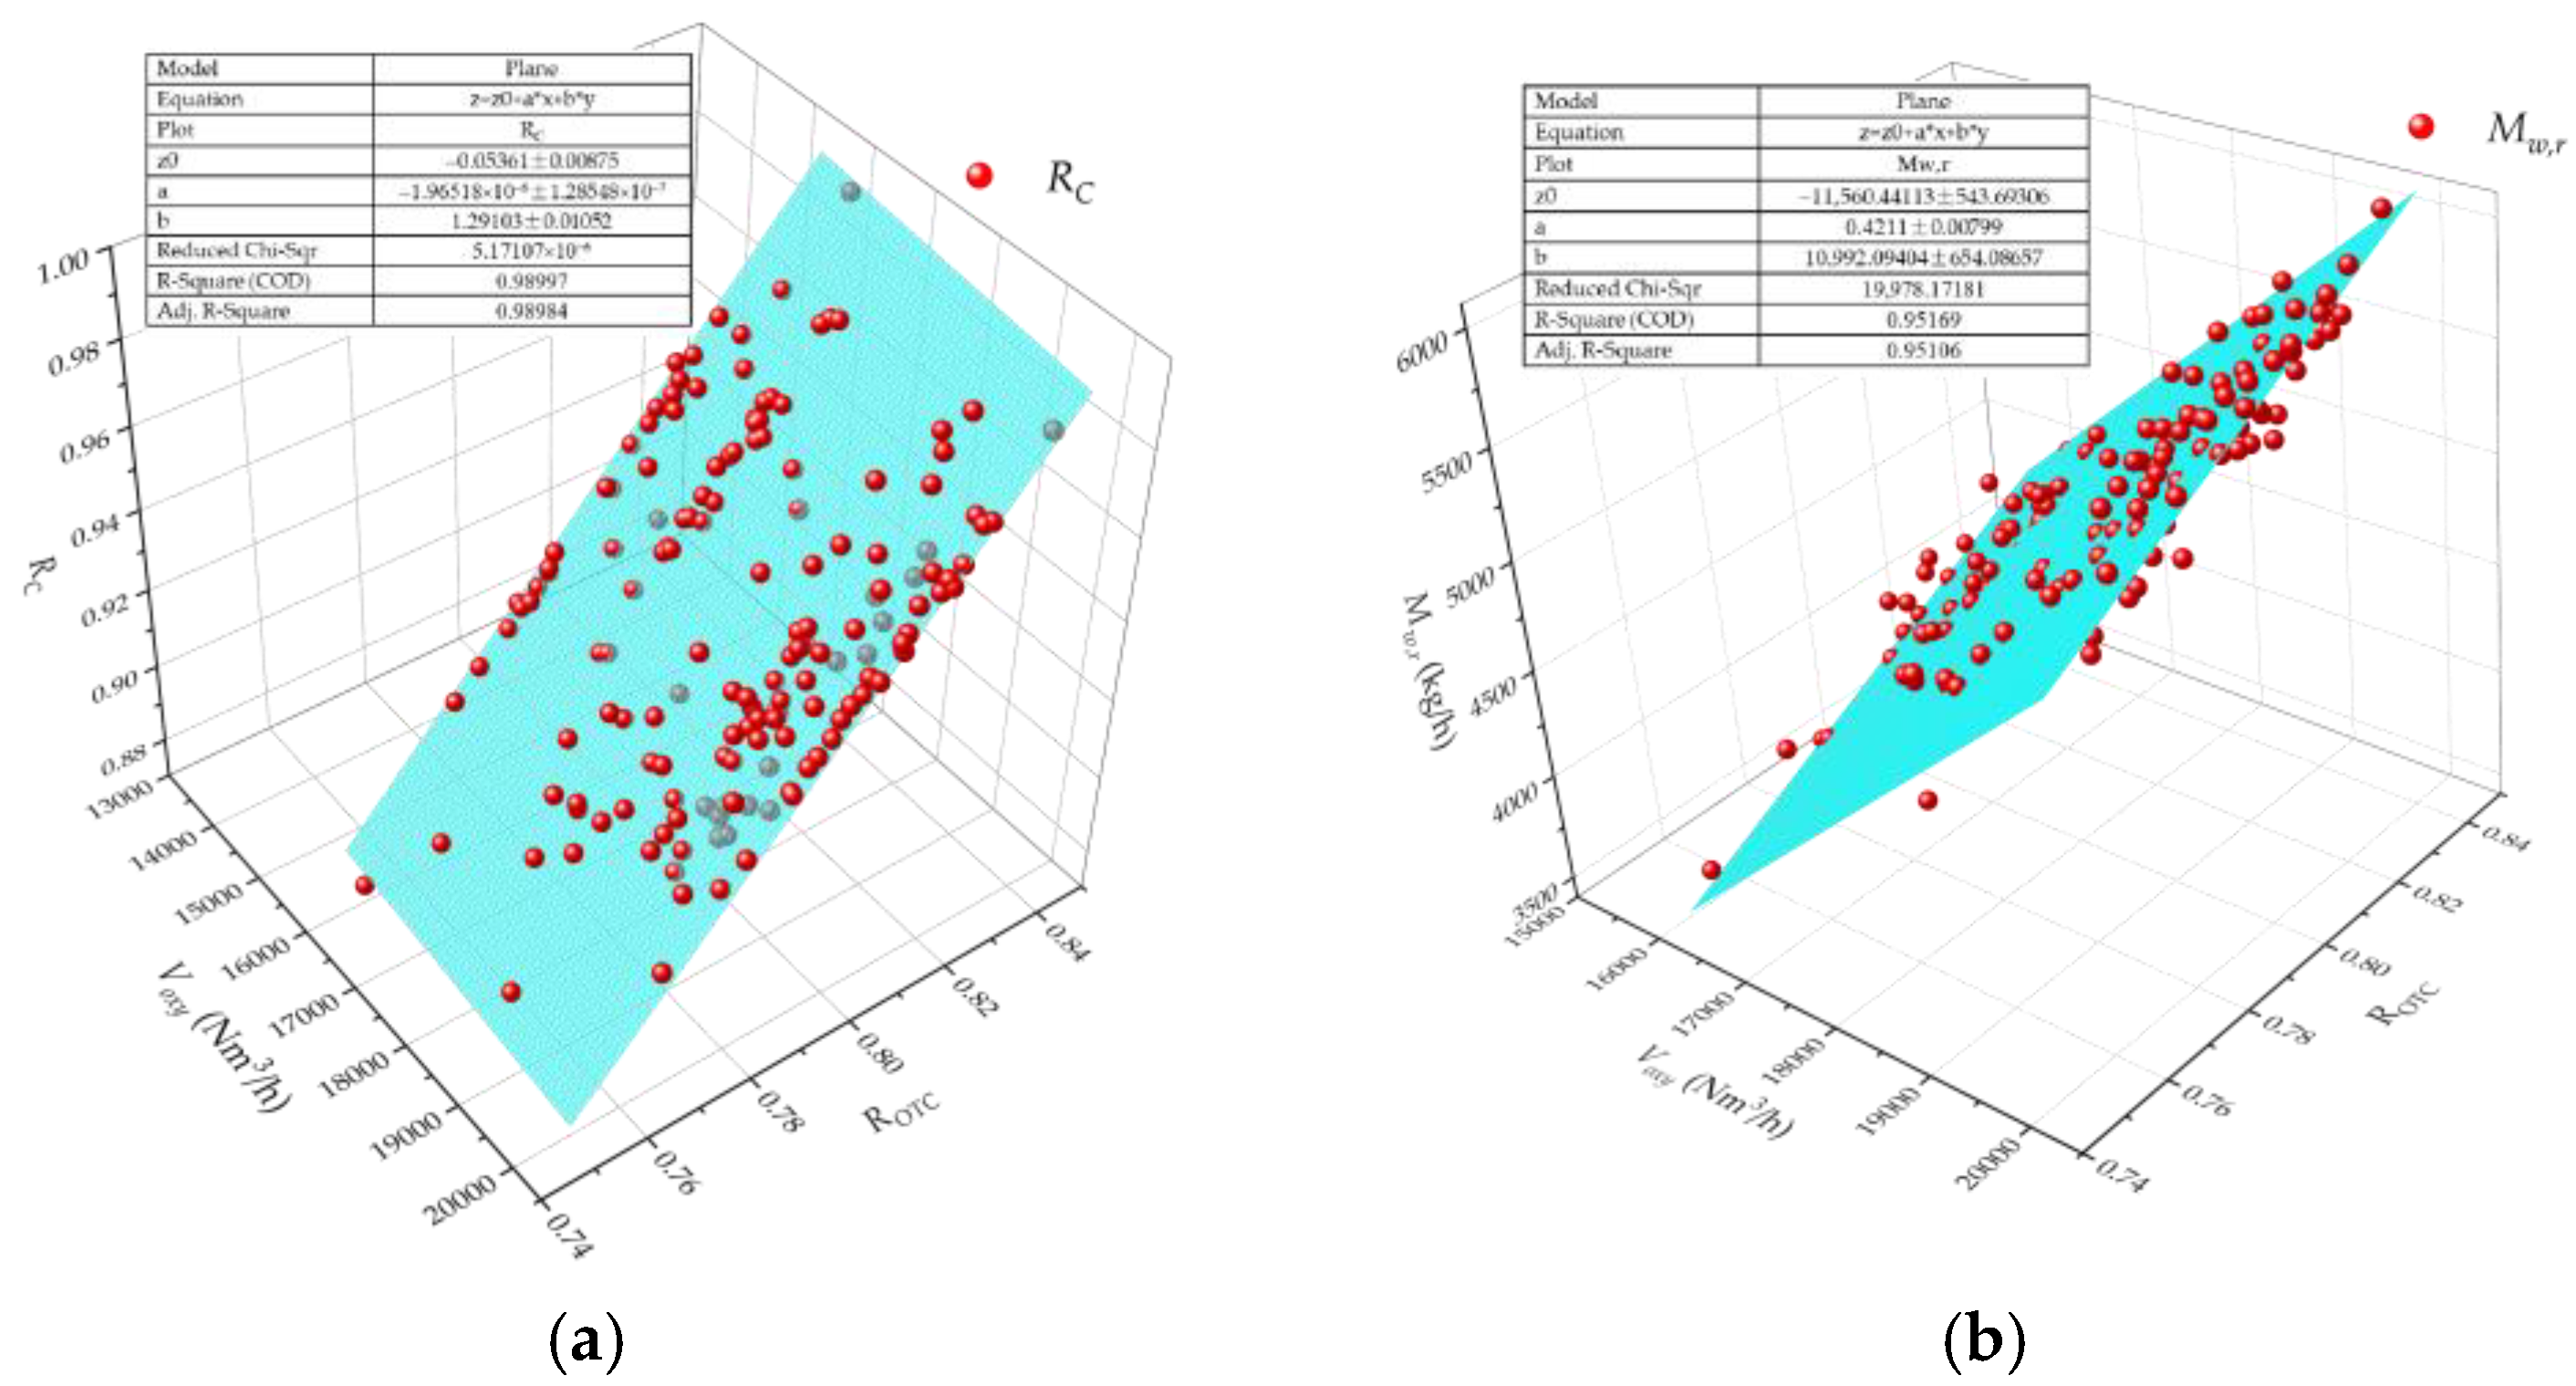
3.2. Results of the Offline Prediction Module

During the production planning stage of the gasification plant, it is essential to predict the gasification outputs and performance to develop a detailed production plan. Addressing this need, this paper presents an offline prediction module based on a thermodynamic equilibrium model. However, the thermodynamic equilibrium model has two main limitations: (1) it cannot assess the carbon conversion rate, and (2) it cannot evaluate changes in gas composition during the water quenching process. To overcome these challenges, the data-based characteristic models, namely Equations (24) and (25), are incorporated into the thermodynamic equilibrium model.
The offline prediction method is exemplified below using Stage 3.2. As depicted in Figure 4c, Stage 3.2 is marked by an increase in load corresponding to the oxygen flow rate rising from 18,000 Nm3/h to 20,000 Nm3/h. The coal flow rate exhibits fluctuations, which are associated with the instability in dense-phase pneumatic conveying of pulverized coal. The control accuracy of the pulverized coal flow rate is suboptimal, with a typical error margin of approximately ±3%. Consequently, when formulating the production schedule, it is crucial to account for the impact of these coal flow fluctuations on outputs and overall performance. After establishing the targeted oxygen flow rate, a fluctuation range for the oxygen-to-coal ratio is defined. In this study, the planned oxygen-to-coal ratio is set at 0.8, with a fluctuation range established between 0.776 and 0.824.
The predicted results are illustrated in Figure 7, where the red curve represents the designed values, the green and blue curves depict the potential fluctuation range, and the black squares indicate the actual operating values. As shown in Figure 7a, the fluctuations in coal quantity have a minimal impact on the syngas flow rate, with most of the operating values falling within the predicted range. However, the coal quantity fluctuations significantly affect the composition of the syngas, with approximately 80% of the operating values appearing within the predicted range. Additionally, the fluctuation range for coal consumption is larger, while the range for oxygen consumption is comparatively smaller, which can still be attributed to the substantial fluctuations in coal quantity. The prediction results of the offline model can be quantitatively evaluated using Equations (21) to (23). However, considering that the prediction result of the offline model is not only a value but a range, Equation (21) has been modified as follows:
R o f f = 2 1 -   i = 1 N ( X i - o X i ) p 2 i = 1 N ( X i - p - u X i ) p - l 2 ,
wherein, X i o represents the operation value; X i p , X i p - u , and X i p - l represent the planned value, the planned-upper value, and the planned-lower value predicted by the offline model, respectively; X i - p - u X i p - l presents the range of predicted values; and R o f f 2 can be understood as the modified R2 for the offline model. The prediction accuracy calculated by Equations (22), (23), and (26) are listed in Table 4.
Although the offline prediction module may not yield precise values due to the low control accuracy of the coal flow rate, it does provide a relatively accurate range, which remains advantageous for industrial operations. Utilizing this predicted data allows the plant to assess variations in product yield, evaluate the quality of synthesis gas, and calculate economic performance indicators.

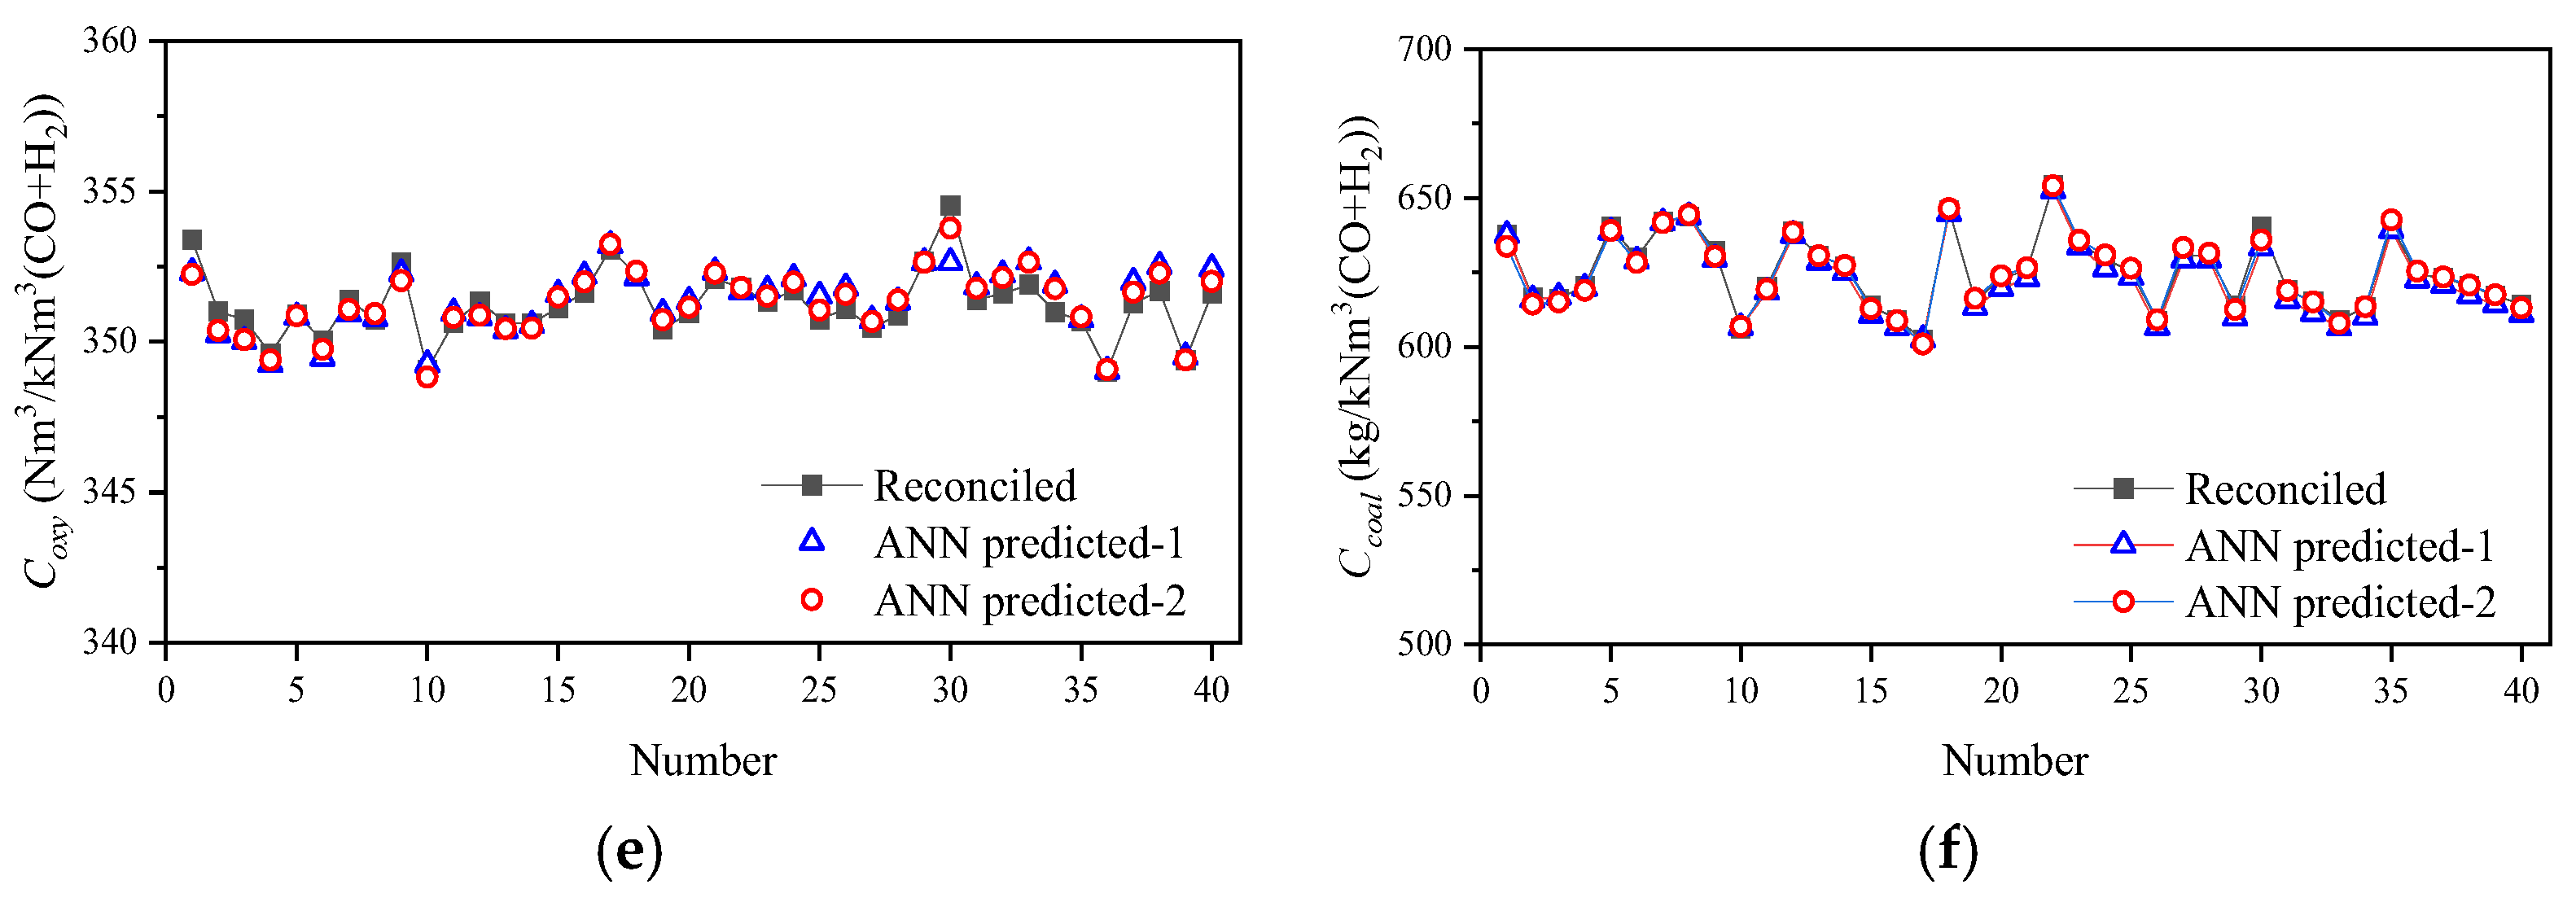
3.3. Results of the Online Estimation Module

During the operation of the gasification unit, operating parameters such as load and oxygen-to-coal ratio frequently fluctuate, leading to variable performance outcomes. Consequently, it is essential to obtain the real-time performance of the unit and adjust operational strategies promptly to enhance performance or mitigate safety risks. In this context, this paper develops an online estimation module that evaluates the performance of the gasification unit utilizing a neural network model. The methodology is illustrated using data from Stage 3 as a case study.
The reconciled results from Stage 3.1 are used as the training set, while data from Stage 3.2 serve as the test set. The inputs to the ANN model comprise the measured data from the gasification unit, as outlined in Table 2. The outputs of the ANN model include unmeasured parameters and gasification performance metrics, such as syngas temperature at the reactor chamber outlet, carbon conversion rate, flow rate of reacted quench water, coal consumption, oxygen consumption, etc. The ANN model functions as a surrogate for the data reconciliation model, significantly enhancing calculation speed. While the data reconciliation model, leveraging the PSO algorithm, typically requires 5–10 min to produce results, the computation time for the ANN model is less than 10 s, thus fulfilling real-time application requirements.
However, the ANN model does present a limitation: the prediction error significantly increases when the predicted range exceeds that of the training data. For example, in the test set, when the oxygen flow rate exceeds 19,600 Nm3/h, the predicted values diverge noticeably from the actual values, as the maximum oxygen flow rate in the training set is capped at 19,600 Nm3/h. To address this, predicted data generated by the offline prediction module are incorporated into the training set to enhance coverage. The results from the online estimation module are presented in Figure 8, where “ANN predicted-1” represents the prediction results derived exclusively from the Stage 3.1 data, “ANN predicted-2” indicates the prediction results that include the additional offline prediction data, and “reconciled” denotes the results obtained by resolving the data reconciliation model. It is evident that prior to point Number 15, the predictions from both methods are similar; however, beginning at point Number 15, the predictions from the second method exhibit greater alignment with the actual operating values in comparison to the first method. This indicates a significant improvement in prediction accuracy for all parameters upon expanding the training set.
The predictive performance of the ANN model is outlined in Table 5. The R2 values for each parameter using the second method exceed those obtained using the first method, exceeding 0.95 in all cases except for oxygen consumption. Additionally, the RMSE values for each parameter derived from the second method are lower than those from the first method. The RRME values for all parameters using the second method are below 1%, demonstrating that incorporating prediction data from the offline prediction module to enhance the training dataset significantly improves the prediction accuracy of the ANN model.
In conclusion, the online performance estimation module efficiently and accurately evaluates the real-time operational performance of the gasification unit. This capability allows operators to continuously monitor the gasifier’s real-time status and make timely, informed operational decisions.

4. Conclusions

This study establishes a data reconciliation-based framework for accurate performance estimation in entrained-flow coal gasification units, yielding the following advancements:
Detection and elimination of a 12% gross error in syngas flow rate at the scrubber outlet, enhancing overall measurement accuracy under both stable and variable operating conditions.
Derived carbon conversion rate and quench water flow models directly correlate with oxygen-to-coal ratios and reacted quench water flow rate (R2 > 0.95).
Offline prediction achieves modified R2 > 0.92 for syngas flow rate and 0.72–0.85 for composition prediction through the integration of thermodynamic equilibrium models with data-driven characteristic equations.
The ANN-based model delivers >0.95 R2 accuracy for critical parameters within 10 s, fulfilling real-time application requirements.
In the subsequent research, this framework will be incorporated into the gasification control system and validated with different types of gasification technologies.

Author Contributions

Conceptualization, Y.Z. and K.Y.; methodology, Y.Z., K.Y. and C.Y.; software, Y.Z., C.Y. and J.X.; validation, Y.Z. and C.Y.; formal analysis, Y.Z.; investigation, Y.Z. and K.Y.; resources, K.Y. ; data curation, Y.Z.; writing—original draft preparation, Y.Z. and J.X.; writing—review and editing, Y.Z. and K.Y.; visualization, Y.Z.; supervision, K.Y.; project administration, K.Y.; funding acquisition, K.Y. All authors have read and agreed to the published version of the manuscript.

Funding

This research was funded by the Fundamental Research Funds for the Central Universities, grant number No. FRF-BD-20-09A.

Data Availability Statement

Data are contained within the article.

Conflicts of Interest

Author Yan Zhang was employed by the company Beijing MWAY Technology Co., Ltd. The remaining authors declare that the research was conducted in the absence of any commercial or financial relationships that could be construed as a potential conflict of interest.

References

  1. Janajreh, I.; Adeyemi, I.; Raza, S.S.; Ghenai, C. A review of recent developments and future prospects in gasification systems and their modeling. Renew. Sustain. Energy Rev. 2021, 138, 110505. [Google Scholar] [CrossRef]
  2. Wang, K.; Zhang, J.; Shang, C.; Huang, D. Operation optimization of Shell coal gasification process based on convolutional neural network models. Appl. Energy 2021, 292, 116847. [Google Scholar] [CrossRef]
  3. Chen, C.-J.; Hung, C.-I.; Chen, W.-H. Numerical investigation on performance of coal gasification under various injection patterns in an entrained flow gasifier. Appl. Energy 2012, 100, 218–228. [Google Scholar] [CrossRef]
  4. Watanabe, H.; Kurose, R. Modeling and simulation of coal gasification on an entrained flow coal gasifier. Adv. Powder Technol. 2020, 31, 2733–2741. [Google Scholar] [CrossRef]
  5. Mularski, J.; Pawlak-Kruczek, H.; Modlinski, N. A review of recent studies of the CFD modelling of coal gasification in entrained flow gasifiers, covering devolatilization, gas-phase reactions, surface reactions, models and kinetics. Fuel 2020, 271, 117620. [Google Scholar] [CrossRef]
  6. Kim, M.; Ye, I.; Jo, H.; Ryu, C.; Kim, B.; Lee, J. New reduced-order model optimized for online dynamic simulation of a Shell coal gasifier. Appl. Energy 2020, 263, 114634. [Google Scholar] [CrossRef]
  7. Kim, H.J.; Li, R.; Yang, Z.; Duan, Y. Modeling, prediction and multi-objective optimization of the coal gasification system. In Proceedings of the E3S Web of Conferences, the 7th International Conference on Renewable Energy Technologies (ICRET 2021), Lumpur, Malaysia, 8–10 January 2021; Volume 242. [Google Scholar]
  8. Feng, L.; Zhang, G.; Zhai, R. Study on gasification reaction and energy conversion characteristics of the entrained flow coal gasification based on chemical kinetics simulation. Heliyon 2024, 10, e30997. [Google Scholar] [CrossRef] [PubMed]
  9. Dang, Q.; Zhang, X.; Zhou, Y.; Jia, X. Prediction and optimization of syngas production from a kinetic-based biomass gasification process model. Fuel Process. Technol. 2021, 212, 106604. [Google Scholar] [CrossRef]
  10. Prabhakar, A.; Kumar Gupta, A.; Kumar Sadhukhan, A.; Gupta, P. Estimation of gasification kinetics of coal char fines in steam ambience. Mater. Today Proc. 2022, 68, 905–909. [Google Scholar] [CrossRef]
  11. Netter, T.; Fendt, S.; Spliethoff, H. A collection of model parameters describing the gasification behavior of different fuels under entrained flow conditions. Fuel 2021, 296, 120536. [Google Scholar] [CrossRef]
  12. Shabbar, S.; Janajreh, I. Thermodynamic equilibrium analysis of coal gasification using Gibbs energy minimization method. Energy Convers. Manag. 2013, 65, 755–763. [Google Scholar] [CrossRef]
  13. Zhou, B.; Chang, J.; Li, J.; Hong, J.; Wang, T.; Zhu, Z.; Zhang, L.; Ma, C. Two-stage gasification process simulation and optimization of pulverized coal for hydrogen-rich production using Aspen plus. Int. J. Hydrog. Energy 2024, 49, 849–860. [Google Scholar] [CrossRef]
  14. Li, J.; Xu, K.; Yao, X.; Chen, S. Prediction and optimization of syngas production from steam gasification: Numerical study of operating conditions and biomass composition. Energy Convers. Manag. 2021, 236, 114077. [Google Scholar] [CrossRef]
  15. Gazzani, M.; Manzolini, G.; Macchi, E.; Ghoniem, A.F. Reduced order modeling of the Shell–Prenflo entrained flow gasifier. Fuel 2013, 104, 822–837. [Google Scholar] [CrossRef]
  16. Safarian, S.; Ebrahimi Saryazdi, S.M.; Unnthorsson, R.; Richter, C. Artificial neural network integrated with thermodynamic equilibrium modeling of downdraft biomass gasification-power production plant. Energy 2020, 213, 118800. [Google Scholar] [CrossRef]
  17. Li, J.; Yao, X.; Xu, K. A comprehensive model integrating BP neural network and RSM for the prediction and optimization of syngas quality. Biomass Bioenergy 2021, 155, 106278. [Google Scholar] [CrossRef]
  18. Wang, H.; Chaffart, D.; Ricardez-Sandoval, L.A. Modelling and optimization of a pilot-scale entrained-flow gasifier using artificial neural networks. Energy 2019, 188, 116076. [Google Scholar] [CrossRef]
  19. Wang, H.; Ricardez-Sandoval, L.A. Dynamic optimization of a pilot-scale entrained-flow gasifier using artificial recurrent neural networks. Fuel 2020, 272, 117731. [Google Scholar] [CrossRef]
  20. Ayub, Y.; Hu, Y.; Ren, J. Estimation of syngas yield in hydrothermal gasification process by application of artificial intelligence models. Renew. Energy 2023, 215, 118953. [Google Scholar] [CrossRef]
  21. Kim, J.Y.; Kim, D.; Li, Z.J.; Dariva, C.; Cao, Y.; Ellis, N. Predicting and optimizing syngas production from fluidized bed biomass gasifiers: A machine learning approach. Energy 2023, 263, 125900. [Google Scholar] [CrossRef]
  22. Baruah, D.; Baruah, D.C.; Hazarika, M.K. Artificial neural network based modeling of biomass gasification in fixed bed downdraft gasifiers. Biomass Bioenergy 2017, 98, 264–271. [Google Scholar] [CrossRef]
  23. Wang, Z.; Mu, L.; Miao, H.; Shang, Y.; Yin, H.; Dong, M. An innovative application of machine learning in prediction of the syngas properties of biomass chemical looping gasification based on extra trees regression algorithm. Energy 2023, 275, 127438. [Google Scholar] [CrossRef]
  24. Ascher, S.; Sloan, W.; Watson, I.; You, S. A comprehensive artificial neural network model for gasification process prediction. Appl. Energy 2022, 320, 119289. [Google Scholar] [CrossRef]
  25. Ren, S.; Wu, S.; Weng, Q. Physics-informed machine learning methods for biomass gasification modeling by considering monotonic relationships. Bioresour Technol 2023, 369, 128472. [Google Scholar] [CrossRef]
  26. Yang, Q.; Zhang, J.; Zhou, J.; Zhao, L.; Zhang, D. A hybrid data-driven machine learning framework for predicting the performance of coal and biomass gasification processes. Fuel 2023, 346, 128338. [Google Scholar] [CrossRef]
  27. Antonio Vélez Godiño, J.; José Jiménez-Espadafor Aguilar, F. Joint data reconciliation and artificial neural network based modelling: Application to a cogeneration power plant. Appl. Therm. Eng. 2024, 236, 121720. [Google Scholar] [CrossRef]
  28. Narasimhan, S.; Jordache, C. Data Reconciliation and Gross Error Detection: An Intelligent Use of Process Data, 2nd ed.; Gulf Publishing Company: Houston, TX, USA, 2000. [Google Scholar]
  29. Zhang, Z.; Chuang, Y.-Y.; Chen, J. Methodology of data reconciliation and parameter estimation for process systems with multi-operating conditions. Chemom. Intell. Lab. Syst. 2014, 137, 110–119. [Google Scholar] [CrossRef]
  30. Loyola-Fuentes, J.; Smith, R. Data reconciliation and gross error detection in crude oil pre-heat trains undergoing shell-side and tube-side fouling deposition. Energy 2019, 183, 368–384. [Google Scholar] [CrossRef]
  31. Jiang, X.; Liu, P.; Li, Z. Data reconciliation and gross error detection for operational data in power plants. Energy 2014, 75, 14–23. [Google Scholar] [CrossRef]
  32. Jiang, X.; Liu, P.; Li, Z. data reconciliation for sensor fault monitoring. J. Tsinghua Univ. (Sci. Technol.) 2014, 54, 6. [Google Scholar]
  33. Zhang, T.; Gräbner, M.; Xu, S. Data reconciliation of an industrial coal gasification plant. Comput. Chem. Eng. 2021, 155, 107503. [Google Scholar] [CrossRef]
  34. Yu, J.; Han, W.; Chen, K.; Liu, P.; Li, Z. Gross error detection in steam turbine measurements based on data reconciliation of inequality constraints. Energy 2022, 253, 124009. [Google Scholar] [CrossRef]
  35. Yu, J.; Petersen, N.; Liu, P.; Li, Z.; Wirsum, M. Hybrid modelling and simulation of thermal systems of in-service power plants for digital twin development. Energy 2022, 260, 125088. [Google Scholar] [CrossRef]
  36. Yu, J.; Liu, P.; Li, Z. Data reconciliation-based simulation of thermal power plants for performance estimation and digital twin development. Comput. Chem. Eng. 2022, 168, 108063. [Google Scholar] [CrossRef]
  37. Zhang, Q.; Dai, Z.; Huang, B.; Wang, Y.; Liu, H.; Gong, X. Influence of Water Quench on Syngas Composition of Entrained Flow Pulverized Coal Gasification Process. J. East China Univ. Sci. Technol. (Nat. Sci. Ed.) 2018, 44, 6. [Google Scholar]
  38. Wiinikka, H.; Carlsson, P.; Marklund, M.; Grönberg, C.; Pettersson, E.; Lidman, M.; Gebart, R. Experimental investigation of an industrial scale black liquor gasifier. Part 2: Influence of quench operation on product gas composition. Fuel 2012, 93, 117–129. [Google Scholar] [CrossRef]
  39. Wiinikka, H.; Carlsson, P.; Granberg, F.; Löfström, J.; Marklund, M.; Tegman, R.; Lindblom, M.; Gebart, R. Design and methodology of a high temperature gas sampling system for pressurized black liquor gasification. Fuel 2010, 89, 2583–2591. [Google Scholar] [CrossRef]
  40. Higman, C.; van der Burgt, M. Gasification, 2nd ed.; Gulf Professional Publishing: Houston, TX, USA, 2003; ISBN 0-7506-7707-4. [Google Scholar]
Figure 1. Schematic diagram of a coal gasification unit.
Energies 18 01079 g001
Figure 2. Framework diagram of the data reconciliation-based method.
Energies 18 01079 g002
Figure 3. Flowchart of data reconciliation and gross error detection.
Energies 18 01079 g003
Figure 4. Variations in the main parameters across three stages. (a) Stage 1; (b) Stage2; (c) Stage 3.
Energies 18 01079 g004
Figure 5. Reconciled results of Stage 3.1. (a) Coal flow rate; (b) oxygen flow rate; (c) dry syngas flow rate at the scrubber outlet; (dg) CO, H2, CO2, and CH4 contents in dry syngas at the scrubber outlet; (h) gas temperature at the reactor chamber outlet; (i) carbon conversion rate and reacted quench water flow rate; (j) coal and oxygen consumption.
Energies 18 01079 g005
Figure 6. 3D scatter plot of carbon conversion rate and reacted quench water flow rate. (a) Carbon conversion rate versus oxygen flow rate and oxygen-to-coal ratio; (b) reacted quench water flow rate versus oxygen flow rate and oxygen-to-coal ratio.
Energies 18 01079 g006
Figure 7. Results of the offline prediction module. (a) Syngas flow rate at the scrubber outlet; (be) CO, H2, CO2, and CH4 contents in dry syngas at the scrubber outlet; (f) coal and oxygen consumption.
Energies 18 01079 g007
Figure 8. Results of the online estimation module. (a) Carbon conversion rate; (b) flow rate of reacted quench water; (c) syngas temperature at reactor chamber outlet; (d) flow rate of dry syngas at scrubber outlet; (e) coal consumption; (f) oxygen consumption.
Energies 18 01079 g008aEnergies 18 01079 g008b
Table 1. Coal composition and properties.
Proximate Analysis (wt%)Ultimate Analysis (wt%)Heat Value (MJ/kg)
MadVdafAadCadHadOadNadSadQgr,ad
2.38.9019.271.92.02.60.51.526.3
Table 2. Principle parameters of the gasification unit.
Parameter NameSymbolUnitAccuracy
Measured parameters:
Flow rate of coalmcoalkg/h3%
Flow rate of oxygenVoxyNm3/h1%
Flow rate of steam entering the gasifiermstkg/h1%
Flow rate of coal conveying gasVconNm3/h2%
Flow rate of protective gasVproNm3/h1%
Pressure of the gasifierPgas,sMPaG1%
Flow rate of wet syngas at the scrubber outletVgas,sNm3/h2%
Temperature of wet syngas at the scrubber outletTgas,s°C1%
Pressure of wet syngas at the scrubber outletPgas,sMPaG1%
Compositions of syngas at the scrubber outlet: COFCO,sdv%2%
Flow rate of protective gasVproNm3/h1%
H2FH2,sdv%2%
CO2FCO2,sdv%2%
CH4FCH4,sdppm2%
N2FN2,sdv%2%
Unmeasured parameters:
Carbon conversion rateRcwt%-
Flow rate of reacted quench watermw,rkg/h-
Temperature of syngas at the reactor chamber outletTgas,g°C-
Flow rate of wet syngas at the reactor chamber outletVgas,gNm3/h
Compositions of wet syngas at the reactor chamber outlet: COFCO,gv%-
H2FH2,gv%-
CO2FCO2,gv%-
CH4FCH4,gppm-
N2FCO,gV%-
Performance metrics:
Coal consumptionCcoalkg/kNm3(CO+H2)-
Oxygen consumptionCoxyNm3/kNm3(CO+H2)-
Table 3. The results of data reconciliation of Stage 1 and Stage 2.
ParameterStag 1Stage 2
MeasuredReconciledAdjusted PercentageMeasuredReconciledAdjusted Percentage
mcoal23,462.023,979.52.21%34,945.634,552.4−1.1%
Voxy13,472.913,466.2−0.05%19,999.619,989.60.0%
mst1769.71776.30.37%2857.12876.20.7%
Vcon2331.12385.02.31%3609.23552.4−1.6%
Vpro1733.21729.5−0.21%1935.11924.8−0.5%
Vgas,sd44,609.749,641.411.28%62,678.070,527.512.5%
Vgas,sd-2 (1)50,200.0--71,068.0--
FCO,sd56.1956.230.07%54.2954.270.0%
FH2,sd22.8922.84−0.23%26.2326.260.1%
FCO2,sd8.188.190.13%11.4411.43−0.1%
FCH4,sd183.48187.462.17%111.82108.83−2.7%
FN2,sd12.7212.72−0.01%8.038.030.0%
Rc95.0 (2)95.810.86%96.0 (2)97.351.4%
mw,r-2941.65--5877.92-
Tgas-1440--1573-
Vgas,g-46,339.7--64,013.2-
FCO,g-67.82--70.91-
FH2,g-16.44--17.37-
FCO2,g-0.83--1.11-
FH2O,g-0.77--1.24-
FCH4,g-199.76--119.30-
FN2,g-13.62--8.84-
Ccoal680611−10.13%685608−11.15%
Coxy382343−10.17%396352−11.19%
(1) The flow rate of syngas is calculated based on the product yield; (2) The carbon conversion rate is calculated based on the amounts of slag and ash and the residual carbon content.
Table 4. Prediction accuracy of the offline model.
Roff2RMSERRMSE Roff2RMSERRMSE
Vgas,sd0.9212240.330.35%FCH4,sd0.813412.41011.03%
FCO,sd0.85480.27390.51%Ccoal0.824012.7772.04%
FH2,sd0.78190.21740.83%Coxy0.67631.29610.37%
FCO2,sd0.72470.30332.60%
Table 5. Predictive performance of the ANN model.
ParameterANN Predicted-1ANN Predicted-2
R2RMSERRMSER2RMSERRMSE
RC0.96890.00340.36%0.99450.00140.15%
Mw,r0.9083114.632.07%0.989838.3030.69%
Tgas,g0.87925.77660.38%0.95973.33710.22%
Vgas,sd0.8423907.101.30%0.9560479.160.69%
Ccoal0.95832.49030.40%0.98591.44610.23%
Coxy0.73450.63250.18%0.85730.67800.19%
Disclaimer/Publisher’s Note: The statements, opinions and data contained in all publications are solely those of the individual author(s) and contributor(s) and not of MDPI and/or the editor(s). MDPI and/or the editor(s) disclaim responsibility for any injury to people or property resulting from any ideas, methods, instructions or products referred to in the content.

