Article

Valorization of Forest Biomass Through Pyrolysis: A Study on the Energy Potential of Wood Tars

by
Jakub Brózdowski
1,*,
Magdalena Witczak
2,
Klaudia Sikorska
2,
Izabela Ratajczak
3,
Magdalena Woźniak
3,
Monika Bartkowiak
1,
Grzegorz Cofta
1,
Grażyna B. Dąbrowska
4 and
Magdalena Zborowska
1
1
Department of Chemical Wood Technology, Faculty of Forestry and Wood Technology, Poznań University of Life Sciences, 60637 Poznan, Poland
2
Łukasiewicz Research Network—Poznań Institute of Technology, 61755 Poznan, Poland
3
Department of Chemistry, Faculty of Forestry and Wood Technology, Poznań University of Life Sciences, 60637 Poznan, Poland
4
Department of Genetics, Faculty of Biological and Veterinary Sciences, Nicolaus Copernicus University in Toruń, 87100 Toruń, Poland
*
Author to whom correspondence should be addressed.
Energies 2025, 18(5), 1113; https://doi.org/10.3390/en18051113
Submission received: 13 January 2025 / Revised: 21 February 2025 / Accepted: 23 February 2025 / Published: 25 February 2025
(This article belongs to the Special Issue Biomass to Liquid Fuels)

Abstract

:
Forest biomass is a renewable source of environmentally friendly material—wood. However, wood processing generates large amounts of by-products, including branches. These byproducts are often used as firewood; however, they can be used much more effectively. In this study, the pyrolysis of two woods, namely birch and pine, was proposed. The liquid products of pyrolysis were studied by FTIR spectroscopy, and the heating value of these products was evaluated. In order to find the optimal pyrolysis temperature from the point of view of the calorific value of the product, the process was carried out at four temperatures: 450, 500, 550, and 600 °C. The liquid product yielded three fractions, from which two were analyzed, namely the dense tar fraction and light liquid fraction. FTIR analysis results clearly demonstrated that samples from different fractions differ from one another, yet the results within the same fraction are remarkably similar. The tar fraction was characterized with a higher gross calorific value between 42 to 50 MJ/kg, while the liquid fraction gross calorific value was between 29 and 39 MJ/kg; in general, pine wood yielded products with higher calorific values. The pyrolysis of small wood industry by-products is an interesting method of utilization, yielding not only a liquid product with good calorific properties, but also a solid product, namely biochar, which may be used in carbon storage or used as a soil amendment.

1. Introduction

Thanks to the renewable character of forest biomass, products derived from it are considered environmentally friendly. However, the processing of trees into usable goods generates significant quantities of by-products, including branches, bark, and sawmill residues. Biomass, including wood, is now known as a carbon-zero source of energy. In general, biomass accounts for 14% of energy consumption, but in the countries with growing economies, this number rises to 38% [1]. Currently, one of the most common methods of utilizing biomass and biomass by-products is through combustion [2]. This method is simple and straightforward; however, it raises some environmental concerns. Is straightforward burning truly the most sustainable option?
In 2019, biomass was the number one source for heat production in Europe (97% of production), and in the Americas and Asia (100% of renewable heat production). The same report shows that the supply of liquid biofuels from biomass increased by almost 10 times between 2000 and 2020, from 0.44 to 4.06 EJ, respectively. Also, the production of wood charcoal is increasing on almost every continent; only in Asia has production decreased since 2015. In Europe, the production of charcoal has more than doubled, from 0.30 to 0.64 mln tons [3]. This increase in wood charcoal production means that liquid by-product production is also growing, by-products which, after careful investigation, may become another important biofuel. Additionally, this type of fuel is forest-derived. Forests are huge global storage sites of CO2; in Europe alone, forest biomass annually sequestered 155 mln tons of net carbon (eq. 568 mln tons of CO2) in 2022, equivalent to 10% of Europe’s greenhouse gas emission [4]. This numbers looks good, but when forest biomass is combusted, either for household purposes or for industry, sequestered carbon dioxide is released back to the atmosphere, which diminishes the storage effect. Nowadays, we should work on the valorization of forest biomass in a way which extends the CO2 sequestration of trees. There are several methods of producing energy from biomass. The simplest seems to be combustion—burning the wood. Other methods include biogas production by inorganic combustion, the Fischer–Tropsch method, which produces liquid product by catalytic chemical method, or pyrolysis, which also yields liquid products [5]. The production of energy from biomass is always connected with the release of CO2, but it is possible to minimize this emission. One way of minimizing the release of carbon dioxide is to use processes which lead to the production of products rich in solid carbon. Combustion, when conducted correctly, yields only energy and inorganic ash, while other processes typically yield three products, gas, liquid and solid. In the case of pyrolysis, three types are obtained: biochar as a solid product, wood tar as a liquid product, and gas [6]. Biomass wood tar was used for centuries as a wood-protecting agent, in medicine, and as a magical ingredient in folklore cults. Recent studies show that wood tar can be added to conventional polymeric materials to obtain films with antimicrobial properties [7,8,9]. In addition, liquid pine wood pyrolysis products were used as an additive to films obtained on the matrix of carboxymethylcellulose, and their bactericidal and bacteriostatic effects against human pathogens were demonstrated [10]. In turn, tar made from birch bark has been used as a liquid preparation to protect crops against canola (Brassica napus L.) pathogens supported by microorganisms [11]. The importance of wood tar decreased with the coming of the industrial era, which led to the replacement of wood tar with fossil-based chemicals [12]. Currently, wood tar is mostly a by-product of biochar production; however, it can be a main product in the production of liquid fuels, and biochar is also a by-product with the capacity for CO2 storage [13]. Previous studies describe wood tar as a product with a higher heating value of 21.3 MJ kg−1 [14]. Moreover, a study of Fagernas et al. indicated the need for a detailed study on the heating value of liquid products of wood pyrolysis [15].
In the face of pressing challenges related to the depletion of energy resources, it has become increasingly important to explore and evaluate all potential solutions. Despite this urgency, the scientific literature on the use of wood tars as a fuel source remains limited. This article seeks to address this gap and to contribute to the understanding of this underexplored area.
The primary objective of this study was to investigate the impact of the pyrolysis process temperature on the energy properties of wood tar and to estimate the possibilities of its wider use as an energy source.

2. Materials and Methods

2.1. Materials

2.1.1. Raw Material—Wood

The raw material for the pyrolysis was debarked pine and birch wood, purchased at the local market. Prior to the pyrolysis, the wood was cut into pieces with dimensions of 7 × 3 × 3 cm.

2.1.2. Material Used in the Tests—Wood Tar

A total of 200 g of wood, prepared as described before, was placed in the laboratory pyrolytic oven (retort), and the oven was then closed with sealed, airtight doors. The pyrolytic oven was then heated up with the temperature increasing at a rate of 3 °C/min, starting from room temperature. The process was conducted until the desired temperatures were achieved, namely 450, 500, 550, and 600 °C. The vapor–gas mixture generated as a product of thermal decomposition was directed from the oven to the cooling system, where part of it underwent condensation, forming the liquid product of the pyrolysis process (wood tar). Non-condensable gases, on the other hand, were burned in a mixture with natural gas methane. After the pyrolysis process was completed, charcoal (biochar) remained in the retort. The efficiency of the pyrolysis products is described in Table 1.
The obtained liquid product were placed in a separatory funnel where they were divided into three fractions over time. The fractions were subjected to further analysis. However, the top fraction was present in a small volume and was composed mainly of water; therefore, it was not used in the thermal analysis. The other two fractions, namely tar (t) and liquid (l), from each temperature (450, 500, 550, and 600 °C) from each raw material (pine and birch) were subjected to FT-IR and calorimetric analysis. The samples are described in Table 2.

2.2. Methods

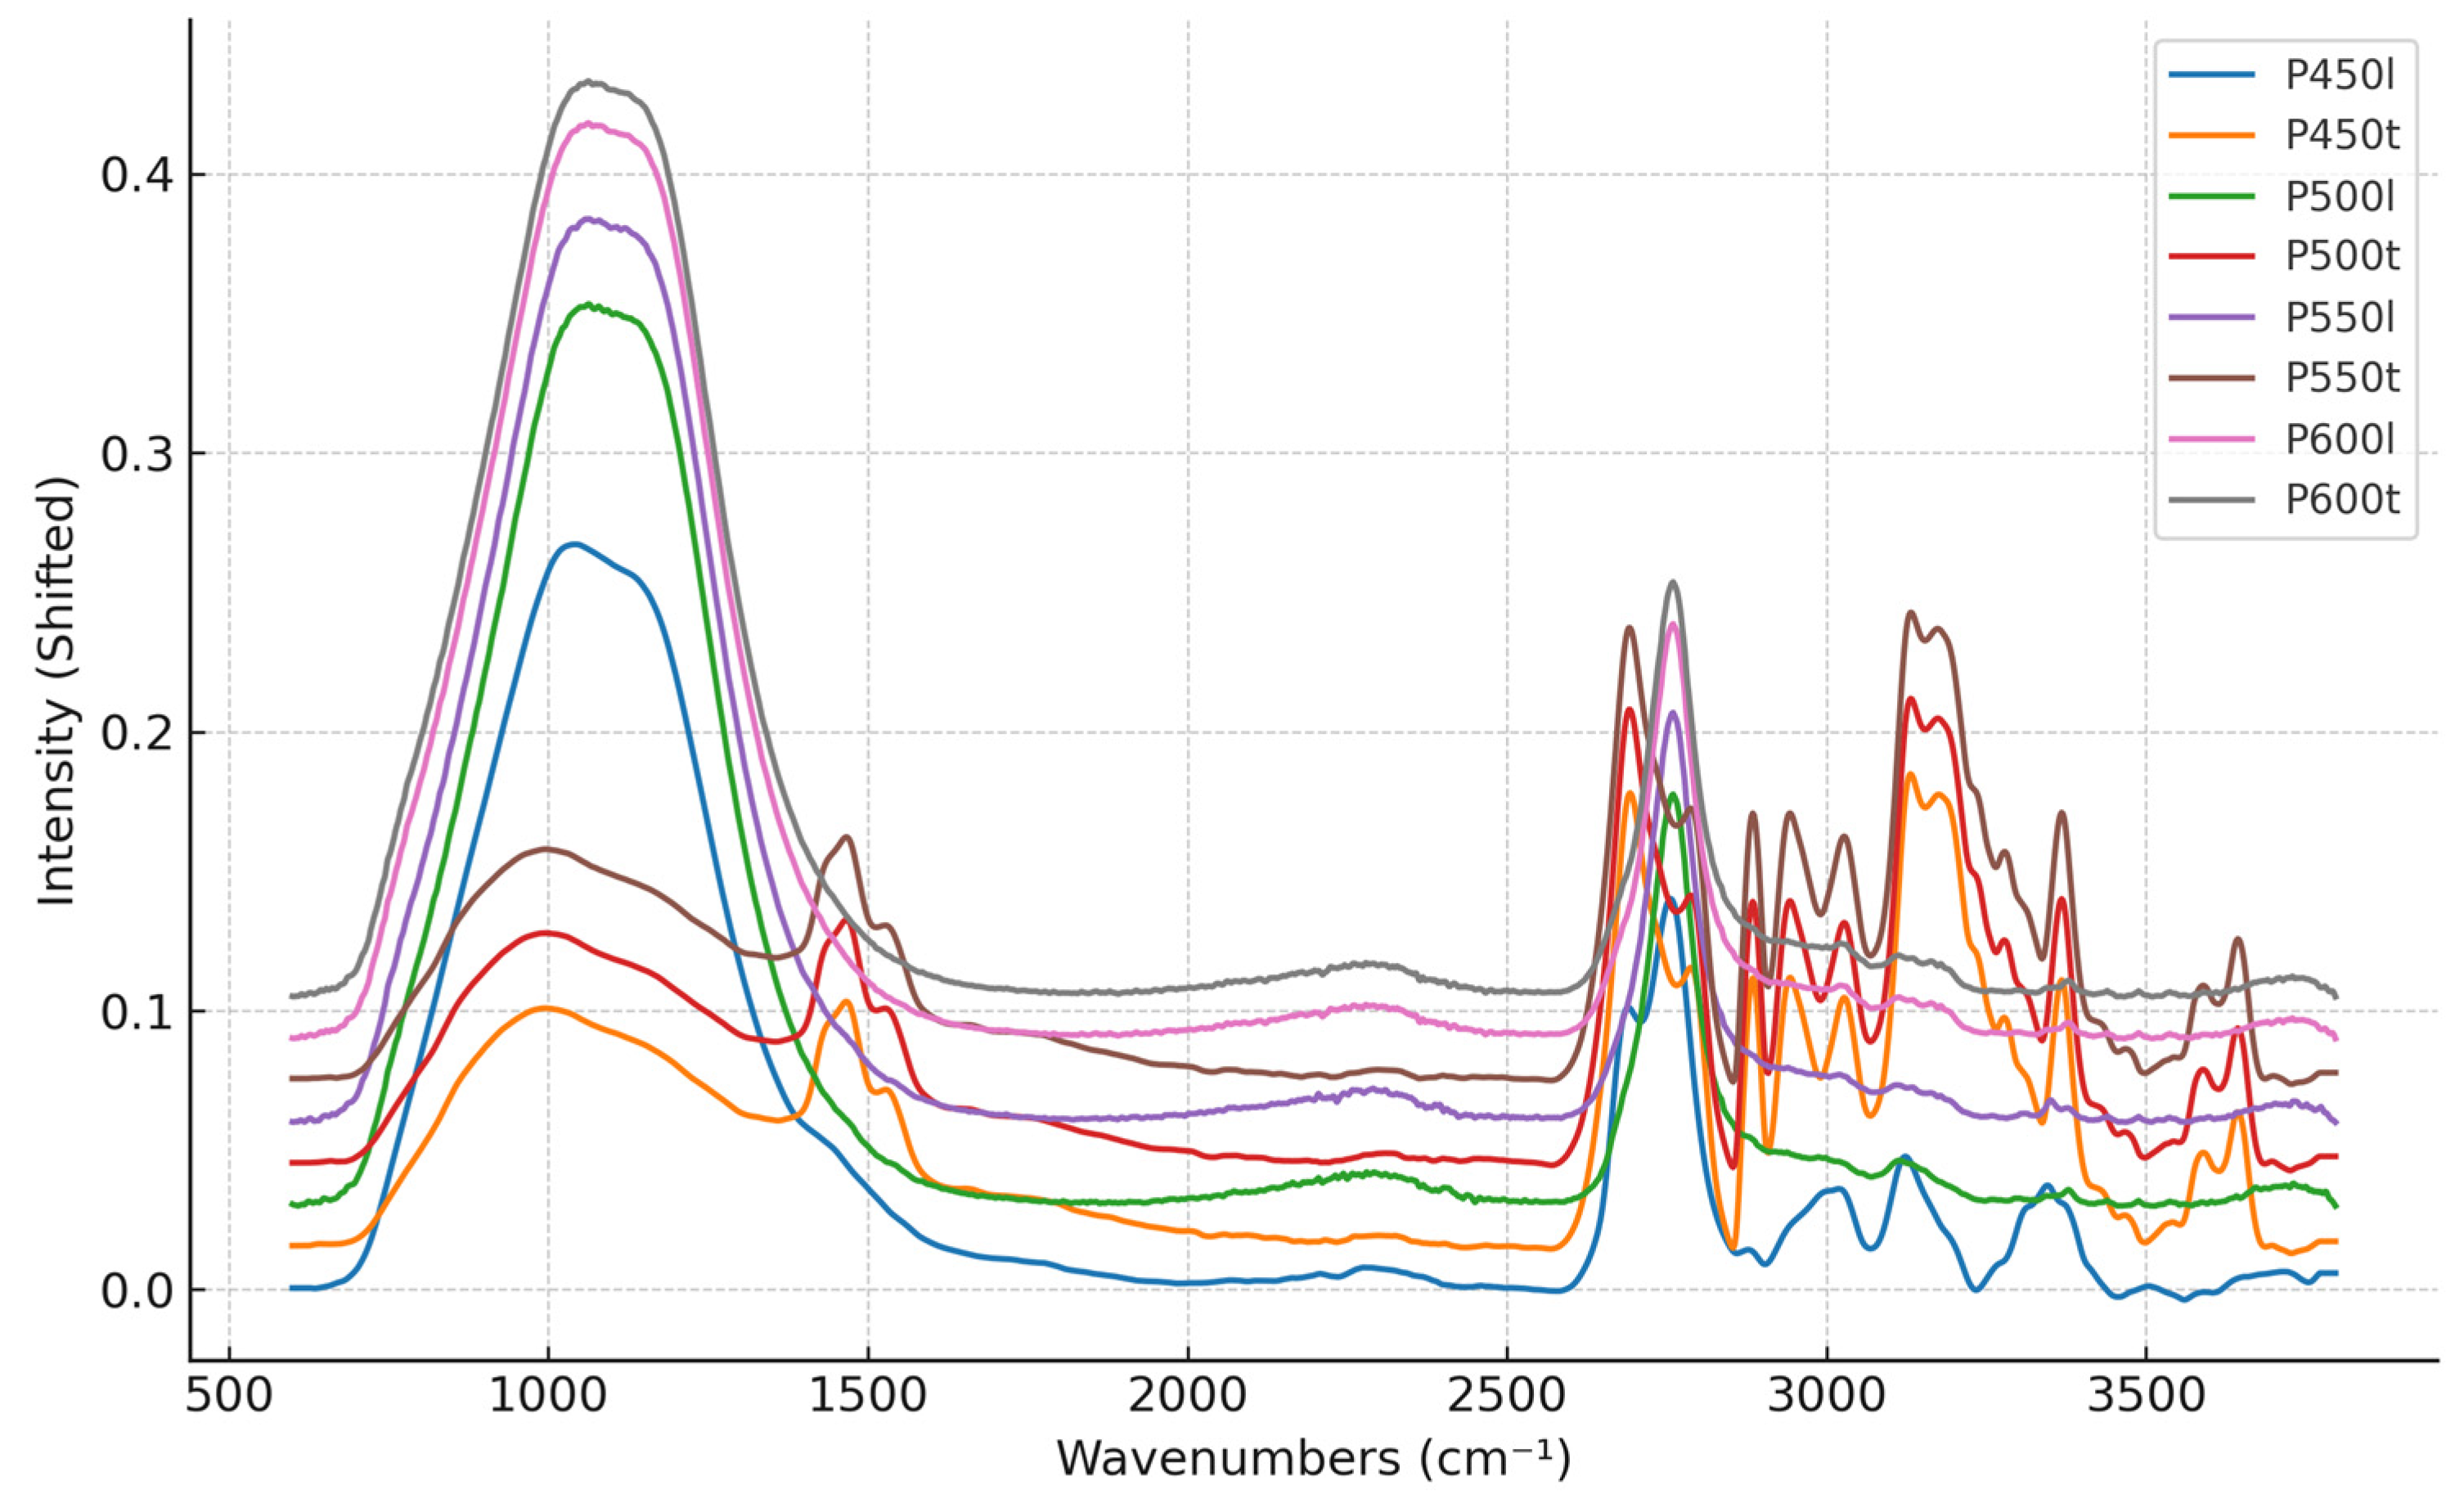
2.2.1. FTIR Analysis

Fourier transform infrared (FT-IR) spectroscopy was used to identify chemical differences between the analyzed samples. This technique enables the detection of characteristic absorption bands corresponding to the vibrations of chemical bonds in the studied materials, such as pitch, tar, and other organic compounds.
The analysis was performed using an FT-IR spectrometer manufactured by Bruker Optics GmbH (Göttingen, Germany), equipped with an attenuated total reflectance (ATR) accessory with a diamond crystal. Thanks to the ATR technique, no additional sample preparation (e.g., KBr pellet formation) was required. The samples were placed directly onto the diamond crystal surface and pressed to ensure maximum contact.
Number of scans: 32 scans per sample—this enhances the signal-to-noise ratio and improves spectral precision.
-
Wavenumber range: 3700 cm−1–700 cm−1—covers the vibrational regions of key functional groups.
-
Resolution: 4 cm−1—provides sufficient spectral resolution for detailed peak analysis.
-
Background correction: performed before each measurement to eliminate environmental interference (e.g., water vapor and carbon dioxide absorption).
The obtained spectra were analyzed with reference to the literature on FTIR studies of pitch [16,17,18,19], tar, and organic compounds, as well as the data available on the Sigma-Aldrich website (www.sigmaaldrich.com, accessed 10 December 2024).
To process and interpret the acquired spectra, Spectragryph v1.2.16.1 software was used. This specialized tool allows for visualization, spectral correction, and comparative analysis of FT-IR data.
Using Spectragryph, v1.2.15.1 the following data processing steps were performed:
-
Spectral normalization to eliminate differences in sample thickness.
-
Baseline correction to minimize background interference from atmospheric absorption.
-
Smoothing algorithms to reduce noise and enhance peak clarity.
-
Differential analysis to highlight spectral differences between samples.

2.2.2. Moisture Content, Elemental Composition, and Ash Content

Moisture content was determined using a drying and weighing method at a temperature of 105 ± 2 °C. Determination of the content of carbon (C), nitrogen (N), and hydrogen (H) was performed using the procedures described in ISO 16948:2015 [20]) using the elementary analyzer Flash 1112 of (Thermo Electron Corporation, Waltham, MA, USA). The ash content in the samples was determined according to EN ISO 18122:2016 [21]. Samples were roasted at a temperature of 550 ± 10 °C.

2.2.3. Calorific Value

The heat of combustion was determined according to EN ISO 18125:2017 [22]. The samples were burnt in a calorimetric bomb filled with oxygen under a pressure of 3.0 ± 0.2 MPa using the IKA C6000 calorimeter (Staufen, Germany). The heat of combustion was calculated using the Regnault–Pfaundler method, considering the temperature increases and the thermal capacity of the calorimeter. Calculations of the calorific value were performed according to EN ISO 18125:2017. The sulfur (S) content was determined using the ICS-1100 ionic chromatograph (Thermo Scientific, Waltham, MA, USA) according to EN ISO 16994:2016 [23].

3. Results and Discussion

3.1. Results of FTIR Analysis

The FTIR spectroscopy method allows us to identify functional groups and molecular structures within the tar, providing insights into its chemical characteristics and other potential applications, particularly as a fuel or chemical feedstock. The results of the tar wood FTIR analysis are shown in Figure 1 and Figure 2. They clearly demonstrate that samples from different fractions differ from one another, yet the results within the same fraction are remarkably similar. All samples exhibit a characteristic peak in their spectrum attributed to carbonyl groups at 1709 cm−1 and a peak at 1642 cm−1 corresponding to the vibrations of an unsaturated C=C bond. These compounds can have a high energy value and be used as fuel components [24]. The presence of phenolic compounds is confirmed by peaks at 1515 cm−1 and 1600 cm−1. Aromatic systems, especially phenolic derivatives, can improve calorific value because they are thermally stable and can participate in exothermic combustion reactions. Due to the presence of oxygen in phenolics and other compounds present in the tested samples, the influence of oxygen in other aspects described in the literature should be considered [25]. The presence of hydrocarbon chains is indicated by peaks at 1456 cm−1 and 1374 cm−1. Stretching vibrations of C–O bonds in various structures are visible within the range of 1300–1000 cm−1. The region between 900 and 700 cm−1 contains various bands associated with C–H bonds in aromatic structures with different degrees of substitution. The FTIR spectra confirm differences in the chemical composition of the analyzed fractions, while maintaining similarity among samples from the same fraction obtained at different temperatures. The most different FTIR spectra were obtained for liquid fractions obtained in 550 and 600 °C, which lack peaks in the range from 3000 to 2750 cm−1. This may suggest the degradation of long hydrocarbon chains, leading to the loss of calorific value. These samples had large peak at 3350 cm−1 characteristic of the OH groups present in alcohols and phenols. As mentioned earlier, the presence of oxygen affects the combustion of fuels [25]. All other samples had two characteristic peaks in this region. The first was at 2925 cm−1, attributed to the asymmetric stretching of C-H bonds in methyl (CH3) and methylene (CH2) groups attributed to aliphatic hydrocarbons. These kind of organic structures are typical of paraffins, waxes, oils, and other organic compounds with long carbon chains. The second peak at 2860 cm−1 corresponded to the symmetric stretching of C-H bonds in methyl (CH3) and methylene (CH2) groups, while lower vibrational energy was associated with the symmetric vibrations of the aromatic ring. This type of structure is characteristic of saturated fatty acids in lipids and fats. These compounds have a high calorific value, which suggests their potential as fuel. It was also observed that both liquid fractions obtained at 600 °C have no visible peaks in the fingerprint region between 1200 to 500 cm−1.
FTIR analysis gives an insight into the chemical compositions of the tested samples. Interestingly, two peaks were found at 1642 and 1709 cm−1, with both indicating stretching of the C=C bond. Peaks at 1642 cm−1 in alkenes and aromatic rings and at 1709 cm−1 in carbonyl groups may indicate the calorific value of the samples. A higher ratio between them and absorbance at between 1709 cm−1 and 1642 cm−1 (shown in Figure 3) are connected to a higher calorific value. This connection is highly visible in tar obtained from pine wood. The tar fraction of birch tar has similar ratios to pine tar; however, the liquid fractions of birch tar have higher variation in this ratio. In other research, the connection between soot production and aromatic structure was reported. Lefort and Tsang [26] showed that biomass with more high-molecular-weight aromatic structures should exhibit slower combustion and higher flame temperatures, which may lead to greater soot production. This may suggest that liquid samples will demonstrate slower combustion and greater soot production.

3.2. Elemental Composition

The elemental composition of the examined samples is presented in Table 3.
During the combustion of natural plant oil, chemical compounds containing elementary elements (carbon, hydrogen, nitrogen, and sulfur) are oxidized, resulting in heat generation. Knowledge of the elemental composition of fuels allows an accurate assessment of their calorific value and allows the estimation of the risks associated with the emission of toxic combustion products. The carbon content in the wood tar fractions ranged between 68.4% in B600t and 70.5% in sample P550t, and in the liquid fractions from 57.0% for sample B500l to 65.1% for sample P600l. These results correspond to the values of bio-oil reported in the literature [27,28].
The hydrogen content in the tested fractions ranged from 6.4% to 7.4%. Higher nitrogen content was determined in the liquid fractions (0.19–0.28%). In the wood tar fractions, the content of nitrogen ranged from 0.11% (sample P500t) to 0.20% (sample B600t, P550t and P600t). The obtained values for hydrogen and nitrogen are consistent with those obtained by other authors who studied the wood pyrolysis process [27,29].
To evaluate the quality of biofuels, it is important to know their sulfur content. For the tested liquid fractions, the sulfur content was, on average, 0.019% for birch wood and 0.016% for pine wood, respectively, while for the tar fractions, it was 0.028% for birch wood and 0.027% for pine wood, respectively (Table 3).

3.3. Moisture Content, Ash Content, and Thermal Properties

The ash content of the fuel is of high importance when choosing the appropriate combustion and gas cleaning technologies. Fuels with low ash content are, therefore, preferable. In most of the samples tested, the ash content was below 0.01%, as presented in Table 4. This value was only higher for three samples of coniferous wood: 0.03% (sample P450t), 0.04% (sample P450l), and 0.06% (sample P500t).
The most important thermo-physical parameters of the fuel are its heat of combustion (gross calorific value, HHV) and net calorific value (LHV) (Table 4). These values determine the possibility and profitability of the product as fuel. The net calorific value is calculated from the heat of combustion set in a calorimeter bomb, the elemental composition, and the moisture content. The gross calorific value of the studied tar fractions was about 40 MJ/kg, reaching the highest value of 49.5 MJ/kg for sample P450t (Figure 4).
In general, liquid samples had a lower HHV in comparison to tar samples. Pine tar samples from all temperature had a very similar HHV (46.5–49.5 MJ/kg), which was higher that the best birch tar sample 75.3 MJ/kg. The value of the combustion heat corresponds to the HHV value of petroleum oil (40 MJ/kg) [30].
The liquid product of the pyrolysis of alternative biomasses, often called bio-oil, has been previously investigated. The gross calorific value of oil palm trunk and empty fruit shells bio-oils was reported as being between 24.9 to 31.2 MJ/kg with no clear influence of process temperature on calorific value [31]. Another study on palm oil waste pyrolysis oil reported bio-oil heating values from 10 to 15 MJ/kg [32]. Cashew nutshell bio-oil produced at temperatures between 400 to 550 °C exhibited a calorific value up to 40 MJ/kg [33]. Sewage sludge has also undergone valorization through pyrolysis, resulting in a bio-oil with a gross calorific value of 33–36 MJ/kg [34], while another study on sludge pyrolysis oil reported a calorific value of 36 MJ/kg [35]. In another study, the HHV reported for the liquid product from the pyrolysis of agricultural biomass was between 18.7 to 22.5 MJ/kg, while for wood, it was 24.1 MJ/kg [36]. The abovementioned results show that the liquid fraction product of wood pyrolysis has similar thermal properties to many bio-oils. On the other hand, the tar product of wood pyrolysis exhibits much higher gross calorific values, which may indicate that it is a very good source of energy.

4. Conclusions

Pyrolysis is an interesting method of biomass valorization. This process yields three products, of which the liquid was investigated, as this is one of the least studied products. The liquid product divides, over time, into liquid and tar. This product can be used as a source of energy. When comparing the products investigated in this work with the energetic properties of previously investigated bio-oils, the products reported here have good thermal properties, with really good results for the tar fraction, ranging from 42 to 50 MJ/kg. Other potential applications include adhesive use in the palletization of sawdust, during which the products will not only act as adhesives but will also increase the calorific value of the resulting pellets. The results of this work confirm that the pyrolysis of wood waste is a good alternative to simple combustion.

Author Contributions

Conceptualization, M.Z., J.B. and M.W. (Magdalena Witczak); methodology, M.W. (Magdalena Witczak), I.R. and M.Z.; software, J.B. and K.S.; validation, K.S. and M.W. (Magdalena Woźniak); formal analysis, M.Z.; investigation, J.B., M.W. (Magdalena Woźniak), K.S., I.R. and M.W. (Magdalena Witczak); resources, M.B. and M.Z.; data curation, M.Z. and J.B.; writing—original draft preparation, J.B. and M.W. (Magdalena Witczak); writing—review and editing, M.Z., G.C. and G.B.D.; visualization, J.B.; supervision, M.Z., M.W. (Magdalena Witczak) and I.R.; funding acquisition, M.Z. All authors have read and agreed to the published version of the manuscript.

Funding

The research presented in this work was financed within the framework of Ministry of Education and Science program “Nauka dla Społeczeństwa”, Project No. NdS/544557/2021/2022 “Dziegieć i smoła drzewna—historyczne materiały i wykorzystanie w innowacyjnych technologiach”.

Data Availability Statement

Data are available on request.

Acknowledgments

This article is based upon work from COST Action EU-PoTaRCh (CA22155) supported by COST (European Cooperation in Science and Technology).

Conflicts of Interest

The authors declare no conflicts of interest.

References

  1. Mignogna, D.; Szabó, M.; Ceci, P.; Avino, P. Biomass Energy and Biofuels: Perspective, Potentials, and Challenges in the Energy Transition. Sustainability 2024, 16, 7036. [Google Scholar] [CrossRef]
  2. Odzijewicz, J.I.; Wołejko, E.; Wydro, U.; Wasil, M.; Jabłońska-Trypuć, A. Utilization of Ashes from Biomass Combustion. Energies 2022, 15, 9653. [Google Scholar] [CrossRef]
  3. Global Bioenergy Statistics 2022; World Bioenergy Association: Stockholm, Sweden, 2022.
  4. Kilpeläinen, A.; Peltola, H. Carbon Sequestration and Storage in European Forests. In Forest Bioeconomy and Climate Change; Springer International Publishing: Cham, Switzerland, 2022; pp. 113–128. [Google Scholar]
  5. Ali, F.; Dawood, A.; Hussain, A.; Alnasir, M.H.; Khan, M.A.; Butt, T.M.; Janjua, N.K.; Hamid, A. Fueling the Future: Biomass Applications for Green and Sustainable Energy. Discov. Sustain. 2024, 5, 156. [Google Scholar] [CrossRef]
  6. Ighalo, J.O.; Iwuchukwu, F.U.; Eyankware, O.E.; Iwuozor, K.O.; Olotu, K.; Bright, O.C.; Igwegbe, C.A. Flash Pyrolysis of Biomass: A Review of Recent Advances. Clean Technol. Environ. Policy 2022, 24, 2349–2363. [Google Scholar] [CrossRef]
  7. Richert, A.; Malinowski, R.; Ringwelska, M.; Dąbrowska, G.B. Birch Tar Introduced into Polylactide and Its Influence on the Barrier, Thermal, Functional and Biological Properties of the Film Obtained by Industrial Extrusion. Materials 2022, 15, 7382. [Google Scholar] [CrossRef] [PubMed]
  8. Richert, A.; Kalwasińska, A.; Brzezinska, M.S.; Dąbrowska, G.B. Biodegradability of Novel Polylactide and Polycaprolactone Materials with Bacteriostatic Properties Due to Embedded Birch Tar in Different Environments. Int. J. Mol. Sci. 2021, 22, 10228. [Google Scholar] [CrossRef] [PubMed]
  9. Richert, A.; Olewnik-Kruszkowska, E.; Dąbrowska, G.B.; Dąbrowski, H.P. The Role of Birch Tar in Changing the Physicochemical and Biocidal Properties of Polylactide-Based Films. Int. J. Mol. Sci. 2021, 23, 268. [Google Scholar] [CrossRef] [PubMed]
  10. Dąbrowska, G.B.; Szydłowska-Czerniak, A.; Raszkowska-Kaczor, A.; Antoszewski, M.; Jędrzejewski, T.; Dąbrowski, H.P.; Bartkowiak, M.; Katolik, Z.; Brózdowski, J.; Cofta, G.; et al. The Physicochemical, Biocidal, and Antioxidant Properties of Carboxymethylcellulose-Based Films with Liquid Pyrolysis Products of Wood Pine. In Proceedings of the 4th Edition of International Conference “Plant Productivity and Food Safety: Microbiology, Soil Science, Food Quality and Agricultural Genetics”, Toruń, Poland, 26 September 2024; p. 118. [Google Scholar]
  11. Dąbrowska, G.; Garstecka, Z.; Narbutt, O.; Dąbrowski, H.P.; Pyrkosz, W. Trichoderma Harzianum ZggD-19 Fungus Strain, Method for Biostimulation of the Growth of Rapeseed and Crop Plants from the Brassicaceae Family, Method for Protecting Rapeseed and Crop Plants from the Brassicaceae Family and Solution for Protecting Rapeseed and Crop Plants from the Brassicaceae Family. PL Patent Pat.239,212, 1 October 2021. [Google Scholar]
  12. Zborowska, M.; Brózdowski, J.; Starlander, J.; Woitsch, J.; Ribechini, E.; Ion, R.-M.; Nelle, O.; Deforce, K.; Varga, A.; Szabó, P. Network for Forest By-Products Charcoal, Resin, Tar, Potash (COST Action EU-PoTaRCh). Open Res. Eur. 2024, 4, 176. [Google Scholar] [CrossRef] [PubMed]
  13. Jung, S.; Park, Y.-K.; Kwon, E.E. Strategic Use of Biochar for CO2 Capture and Sequestration. J. CO2 Util. 2019, 32, 128–139. [Google Scholar] [CrossRef]
  14. Rezende, M.E.A.; Pasa, V.M.D.; Lessa, A. Continuous Charcoal Production—A Brazilian Experience. In Advances in Thermochemical Biomass Conversion; Springer: Cham, Switzerland, 1994; pp. 1289–1298. [Google Scholar]
  15. Fagernäs, L.; Kuoppala, E.; Tiilikkala, K.; Oasmaa, A. Chemical Composition of Birch Wood Slow Pyrolysis Products. Energy Fuels 2012, 26, 1275–1283. [Google Scholar] [CrossRef]
  16. Degen, I.A. Detection of the Methoxyl Group by Infrared Spectroscopy. Appl. Spectrosc. 1968, 22, 164–166. [Google Scholar] [CrossRef]
  17. Silverstein, R.M.; Bassler, G.C.; Morrill, T.C. Characteristic Group Absorptions of Organic Molecules. In Spectrometric Identification of Organic Compounds, 5th ed.; Wiley: New York, NY, USA, 1991; Volume 103. [Google Scholar]
  18. Ribechini, E.; Orsini, S.; Silvano, F.; Colombini, M.P. Py-GC/MS, GC/MS and FTIR Investigations on LATE Roman-Egyptian Adhesives from Opus Sectile: New Insights into Ancient Recipes and Technologies. Anal. Chim. Acta 2009, 638, 79–87. [Google Scholar] [CrossRef]
  19. Alcañiz-Monge, J.; Cazorla-Amorós, D.; Linares-Solano, A. Characterisation of Coal Tar Pitches by Thermal Analysis, Infrared Spectroscopy and Solvent Fractionation. Fuel 2001, 80, 41–48. [Google Scholar] [CrossRef]
  20. P. 16948: 2015-07; Solid Biofuels—Determination of Total Carbon, Hydrogen and Nitrogen Content. International Organization for Standardization: Geneva, Switzerland, 2015.
  21. P. 18122: 2016-01; English Version—Solid Biofuels—Determination of Ash Content. ISO: Geneva, Switzerland, 2016.
  22. E.N. 18125: 2017; Solid Biofuels. Determination of Calorific Value. Polish Committee for Standardization: Warsaw, Poland, 2017.
  23. P. 16994: 2016-10; Biopaliwa Stałe–Oznaczanie Całkowitej Zawartości Siarki i Chloru [Solid Biofuels—Determination of Total Content of Sulfur and Chlorine]. Polski Komitet Normalizacyjny: Warsaw, Poland, 2016.
  24. Jin, H.; Yuan, W.; Li, W.; Yang, J.; Zhou, Z.; Zhao, L.; Li, Y.; Qi, F. Combustion Chemistry of Aromatic Hydrocarbons. Prog. Energy Combust. Sci. 2023, 96, 101076. [Google Scholar] [CrossRef]
  25. Song, H.; Quinton, K.S.; Peng, Z.; Zhao, H.; Ladommatos, N. Effects of Oxygen Content of Fuels on Combustion and Emissions of Diesel Engines. Energies 2016, 9, 28. [Google Scholar] [CrossRef]
  26. Lefort, B.; Tsang, W. High Temperature Stability of Larger Aromatic Compounds. Combust. Flame 2011, 158, 657–665. [Google Scholar] [CrossRef]
  27. Trubetskaya, A.; Von Berg, L.; Johnson, R.; Moore, S.; Leahy, J.J.; Han, Y.; Lange, H.; Anca-Couce, A. Production and Characterization of Bio-Oil from Fluidized Bed Pyrolysis of Olive Stones, Pinewood, and Torrefied Feedstock. J. Anal. Appl. Pyrolysis 2023, 169, 105841. [Google Scholar] [CrossRef]
  28. Wang, J.; Wang, S.; Lu, J.; Yang, M.; Wu, Y. Improved Bio-Oil Quality from Pyrolysis of Pine Biomass in Pressurized Hydrogen. Appl. Sci. 2021, 12, 46. [Google Scholar] [CrossRef]
  29. Negahdar, L.; Gonzalez-Quiroga, A.; Otyuskaya, D.; Toraman, H.E.; Liu, L.; Jastrzebski, J.T.B.H.; Van Geem, K.M.; Marin, G.B.; Thybaut, J.W.; Weckhuysen, B.M. Characterization and Comparison of Fast Pyrolysis Bio-Oils from Pinewood, Rapeseed Cake, and Wheat Straw Using 13C NMR and Comprehensive GC × GC. ACS Sustain. Chem. Eng. 2016, 4, 4974–4985. [Google Scholar] [CrossRef] [PubMed]
  30. Al Ichsan, G.M.H.; Nugrahaningtiyas, K.D.; Widjonarko, D.M.; Rahmawati, F.; Lestari, W.W. Conversion of Wood Waste to Be a Source of Alternative Liquid Fuel Using Low Temperature Pyrolysis Method. J. Kim. Sains Apl. 2019, 22, 7–10. [Google Scholar] [CrossRef]
  31. Ling, C.K.; Kyin, E.H.; Hua, L.S.; Chen, L.W.; Yee, C.Y. Yield and Calorific Value of Bio Oil Pyrolysed from Oil Palm Biomass and Its Relation with Solid Residence Time and Process Temperature. Asian J. Sci. Res. 2015, 8, 351. [Google Scholar] [CrossRef]
  32. Abnisa, F.; Arami-Niya, A.; Daud, W.M.A.W.; Sahu, J.N. Characterization of Bio-Oil and Bio-Char from Pyrolysis of Palm Oil Wastes. Bioenergy Res. 2013, 6, 830–840. [Google Scholar] [CrossRef]
  33. Das, P.; Ganesh, A. Bio-Oil from Pyrolysis of Cashew Nut Shell—A near Fuel. Biomass Bioenergy 2003, 25, 113–117. [Google Scholar] [CrossRef]
  34. Mujahid, R.; Riaz, A.; Insyani, R.; Kim, J. A Centrifugation-First Approach for Recovering High-Yield Bio-Oil with High Calorific Values in Biomass Liquefaction: A Case Study of Sewage Sludge. Fuel 2020, 262, 116628. [Google Scholar] [CrossRef]
  35. Lin, J.; Sun, S.; Ma, R.; Fang, L.; Zhang, P.; Qu, J.; Zhang, X.; Geng, H.; Huang, X. Characteristics and Reaction Mechanisms of Sludge-Derived Bio-Oil Produced through Microwave Pyrolysis at Different Temperatures. Energy Convers. Manag. 2018, 160, 403–410. [Google Scholar] [CrossRef]
  36. Raveendran, K.; Ganesh, A. Heating Value of Biomass and Biomass Pyrolysis Products. Fuel 1996, 75, 1715–1720. [Google Scholar] [CrossRef]
Figure 1. FTIR spectra of liquid (l) and tar (t) birch (B) samples (B450l, B450t, B500l, B500t, B550l, B550t, B600l, and B600t).
Energies 18 01113 g001
Figure 2. FTIR spectra of liquid (l) and tar (t) pine (P) samples (P450l, P450t, P500l, P500t, P550l, P550t, P600l, and P600t).
Energies 18 01113 g002
Figure 3. Peak ratios (1709/1642) across samples: liquid (l) and tar (t) of birch (B) and pine (P) wood products.
Energies 18 01113 g003
Figure 4. Gross calorific value [MJ/kg] of of liquid (l) and tar (t) samples (birch (B) and pine (P) wood products).
Energies 18 01113 g004
Table 1. Efficiency of pyrolysis products (P and B represent pine and birch wood, respectively).
Pyrolysis Efficiency [%]
Pine ProductBirch Product
P450P500P550P600B450B500B550B600
Liquid (wood tar)3433564553545454
Biochar2818222031282827
Gases3849223516181819
Table 2. Description of the samples (pine (P) and birch (B) woods) used in the experiments.
Material, Temperature, and ProductSymbol Material, Temperature, and ProductSymbol
Pine wood 450 °C, tarP450tBirch wood 450 °C, tarB450t
Pine wood 450 °C, liquidP450lBirch wood 450 °C, liquidB450l
Pine wood 500 °C, tarP500tBirch wood 500 °C, tarB500t
Pine wood 500 °C, liquidP500lBirch wood 500 °C, liquidB500l
Pine wood 550 °C, tarP550tBirch wood 550 °C, tarB550t
Pine wood 550 °C, liquidP550lBirch wood 550 °C, liquidB550l
Pine wood 600 °C, tarP600tBirch wood 600 °C, tarB600t
Pine wood 600 °C, liquidP600lBirch wood 600 °C, liquidB600l
Table 3. Elemental composition of the liquid (l) and tar (t) samples (birch (B) and pine (P) wood products).
Element [%]B450lB450tB500lB500tB550lB550tB600lB600t
Hydrogen6.7 ± 0.37.3 ± 0.16.4 ± 0.17.3 ± 0.16.4 ± 0.17.2 ± 0.16.6 ± 0.17.2 ± 0.1
Carbon62.9 ± 0.369.3 ± 0.257.0 ± 0.368.7 ± 0.258.7 ± 0.668.5 ± 4.365.1 ± 0.3368.4 ± 0.4
Nitrogen0.27 ± 0.040.18 ± 0.050.27 ± 0.050.15 ± 0.010.27 ± 0.070.14 ± 0.020.26 ± 0.050.20 ± 0.03
Sulfur0.02 ± 0.010.03 ± 0.010.02 ± 0.010.03 ± 0.010.02 ± 0.010.02 ± 0.010.02 ± 0.010.02 ± 0.01
Element [%]P450lP450tP500lP500tP550lP550tP600lP600t
Hydrogen6.7 ± 0.27.3 ± 0.16.6 ± 0.17.4 ± 0.16.6 ± 0.17.3 ± 0.16.7 ± 0.17.2 ± 0.1
Carbon57.7 ± 0.870.2 ± 0.859.9 ± 0.570.0 ± 0.361.5 ± 0.270.5 ± 0.361.8 ± 0.370.4 ± 0.2
Nitrogen0.25 ± 0.050.18 ± 0.030.19 ± 0.010.11 ± 0.040.28 ± 0.070.20 ± 0.040.26 ± 0.050.20 ± 0.04
Sulfur0.01 ± 0.010.03 ± 0.010.01 ± 0.010.03 ± 0.010.01 ± 0.010.03 ± 0.010.02 ± 0.010.02 ± 0.01
Table 4. Thermal properties of liquid (l) and tar (t) samples (birch (B) and pine (P) wood products).
PropertyB450lB450tB500lB500tB550lB550tB600lB600t
Moisture content [%]87.1 ± 3.252.5 ± 2.382.2 ± 3.053.8 ± 3.582.2 ± 3.053.9 ± 3.172.1 ± 5.149.6 ± 2.4
Ash [%]<0.01<0.01<0.01<0.01<0.01<0.01<0.01<0.01
Gross calorific value [MJ/kg] 36.4 ± 2.845.2 ± 0.729.3 ± 3.047.2 ± 2.239.4 ± 5.844.0 ± 0.832.3 ± 1.641.7 ± 2.4
Net calorific value [MJ/kg]
[kWh/kg]
2.4 ± 1.2
0.7 ± 0.3
19.4 ± 1.1
5.4 ± 0.3
2.9 ± 1.0
0.8 ± 0.3
19.7 ± 1.9
5.5 ± 0.5
4.7 ± 1.6
1.3 ± 0.4
18.2 ± 1.4
5.1 ± 0.4
6.8 ± 3.4
1.9 ± 0.9
19.1 ± 1.6
5.3 ± 0.4
PropertyP450lP450tP500lP500tP550lP550tP600lP600t
Moisture content [%]64.8 ± 4.142.7 ± 1.660.5 ± 5.545.17 ± 1.7063.0 ± 8.349.0 ± 1.959.7 ± 16.347.1 ± 1.8
Ash [%]0.04 ± 0.020.03 ± 0.01<0.010.06 ± 0.01<0.01<0.01<0.01<0.01
Gross calorific value [MJ/kg] 30.1 ± 1.149.5 ± 1.831.7 ± 1.347.9 ± 1.229.8 ± 2.748.3 ± 4.830.1 ± 1.646.5 ± 1.4
Net calorific value [MJ/kg]
[kWh/kg]
8.5 ± 0.9
2.7 ± 0.4
26.4 ± 1.3
7.3 ± 0.4
10.5 ± 1.6
2.9 ± 0.5
24.3 ± 1.0
6.7 ± 0.3
8.9 ± 5.2
2.5 ± 0.4
22.6 ± 2.6
6.3 ± 0.7
10.1 ± 1.2
2.8 ± 0.4
22.6 ± 1.1
6.3 ± 0.3
Disclaimer/Publisher’s Note: The statements, opinions and data contained in all publications are solely those of the individual author(s) and contributor(s) and not of MDPI and/or the editor(s). MDPI and/or the editor(s) disclaim responsibility for any injury to people or property resulting from any ideas, methods, instructions or products referred to in the content.

