Article

Comprehensive Modeling of SiC Inverter Driven Form Wound Motor Coil for Insights on Coil Insulation Stress

by
Benjamin Sirizzotti
1,
Emmanuel Agamloh
1,*,
Annette von Jouanne
1 and
Alex Yokochi
2
1
Department of Electrical and Computer Engineering, Baylor University, Waco, TX 76798, USA
2
Department of Mechanical Engineering, Baylor University, Waco, TX 76798, USA
*
Author to whom correspondence should be addressed.
Energies 2025, 18(5), 1262; https://doi.org/10.3390/en18051262
Submission received: 6 February 2025 / Revised: 27 February 2025 / Accepted: 28 February 2025 / Published: 4 March 2025
(This article belongs to the Section F3: Power Electronics)

Abstract

:
This paper comprehensively presents an approach for modeling form wound coils of a motor driven by an inverter, with focus on the electric stresses on the coil insulation. A 10 kV SiC testbed for medium voltage form wound coils was developed to support and validate the modeling techniques discussed. A finite element analysis (FEA) model of the motor coil is presented using COMSOL 6.1. The FEA model was used to determine parameters for an electrical model based on the multi-conductor transmission line theory. The linking of these models allows for a rapid analysis of the electrical stresses the insulation can be exposed to. An experimental method for model validation using the empirical transfer function estimation (ETFE) approach to find the impedance response of the testbed for comparison to the proposed electrical model is presented and employed. The paper also uses the model to analyze the impact of insulation delamination and voids and to demonstrate the implementation of a metric called insulation state of health monitoring for both healthy and damaged coils.

1. Introduction

With the increasing push for highly powered dense and efficient motor drive systems, the use of wide-bandgap (WBG) devices such as silicon carbide (SiC) within inverter drive systems has reached new demands. These devices are desirable due to their higher switching frequencies, increased voltage blocking capabilities, high power ratings, and lower losses when compared to traditional silicon semiconductor devices. This makes them incredibly desirable for application in traction motors, industrial, and aerospace applications [1,2,3,4]. For all these applications the demand for high reliability is a priority, increasing the importance of an accurate prediction of stresses on insulation [5]. It has long been established that insulation deterioration is aggravated when using inverters due to the increased electrical stress they create in the form of high frequency voltage transients inherent in the operation of an inverter [6,7,8]. Many of the improvements WBG devices enjoy over traditional Si devices stem from the greatly improved slew rates and voltage blocking capability. This naturally allows them to better operate at high voltages and with higher switching frequencies. These factors are all known to contribute to the stress on electrical insulation meaning the use of WBG devices can potentially cause insulation deterioration significantly faster than predicted by prior models which assumed the use of Si devices.
Partial discharge (PD) monitoring is a traditional method for assessing insulation health, particularly for medium voltage (MV) and high voltage (HV) machines [9,10,11,12] that has recently seen application in low voltage machines (LV) with the advent of WBG devices [1,13,14]. However, WBG devices have also presented some problems with traditional PD tracking methods [8]. Additionally, the effect of WBG devices on insulation health outside of PD has been relatively neglected with most of the focus placed on LV random wound machines. MV coils have historically benefited from a known geometry allowing for designers to optimize insulation, but with the increased stress from WBG operation new modeling and design approaches are needed.
Previous research has developed modeling approaches for representing the machine’s electrical behavior, particularly at high frequency (HF), to better capture the voltage distributions [9,15,16,17,18]. Finite element analysis (FEA) has frequently been used to estimate coil parameters [19,20]. Particular attention has been paid to the overvoltage phenomenon and the switching oscillations [17,21,22,23]. Both phenomena are known to increase electrical stress on the groundwall (GW) and turn to turn (TT) insulation [23,24,25]. Additionally, both have been linked to the voltage rise time of the inverter, indicating that WBG devices could greatly increase their impact when compared to Si inverters.
This paper comprehensibly presents the process for modeling form wound stator coils to analyze the electric stress placed on the insulation by SiC inverters. Specific focus is placed on modeling stress factors other than PD activity. The process for using FEA to create an equivalent circuit model of the coils’ HF behavior is discussed and applied to an example testbed. The modeling process is also expanded to include steps for modeling voids, delamination or other air-filled cavities within the insulation. The use of the model for examining the electric stress on the coil insulation is demonstrated for several test cases including healthy and damaged coils. A 10 kV SiC testbed is used for model validation and investigation of insulation health tracking, with special attention placed on methods applicable to industrial uses outside a laboratory environment. This is done to outline an approach for the holistic modeling and analysis of insulation stress of motors using WBG inverters, including machines already in service.

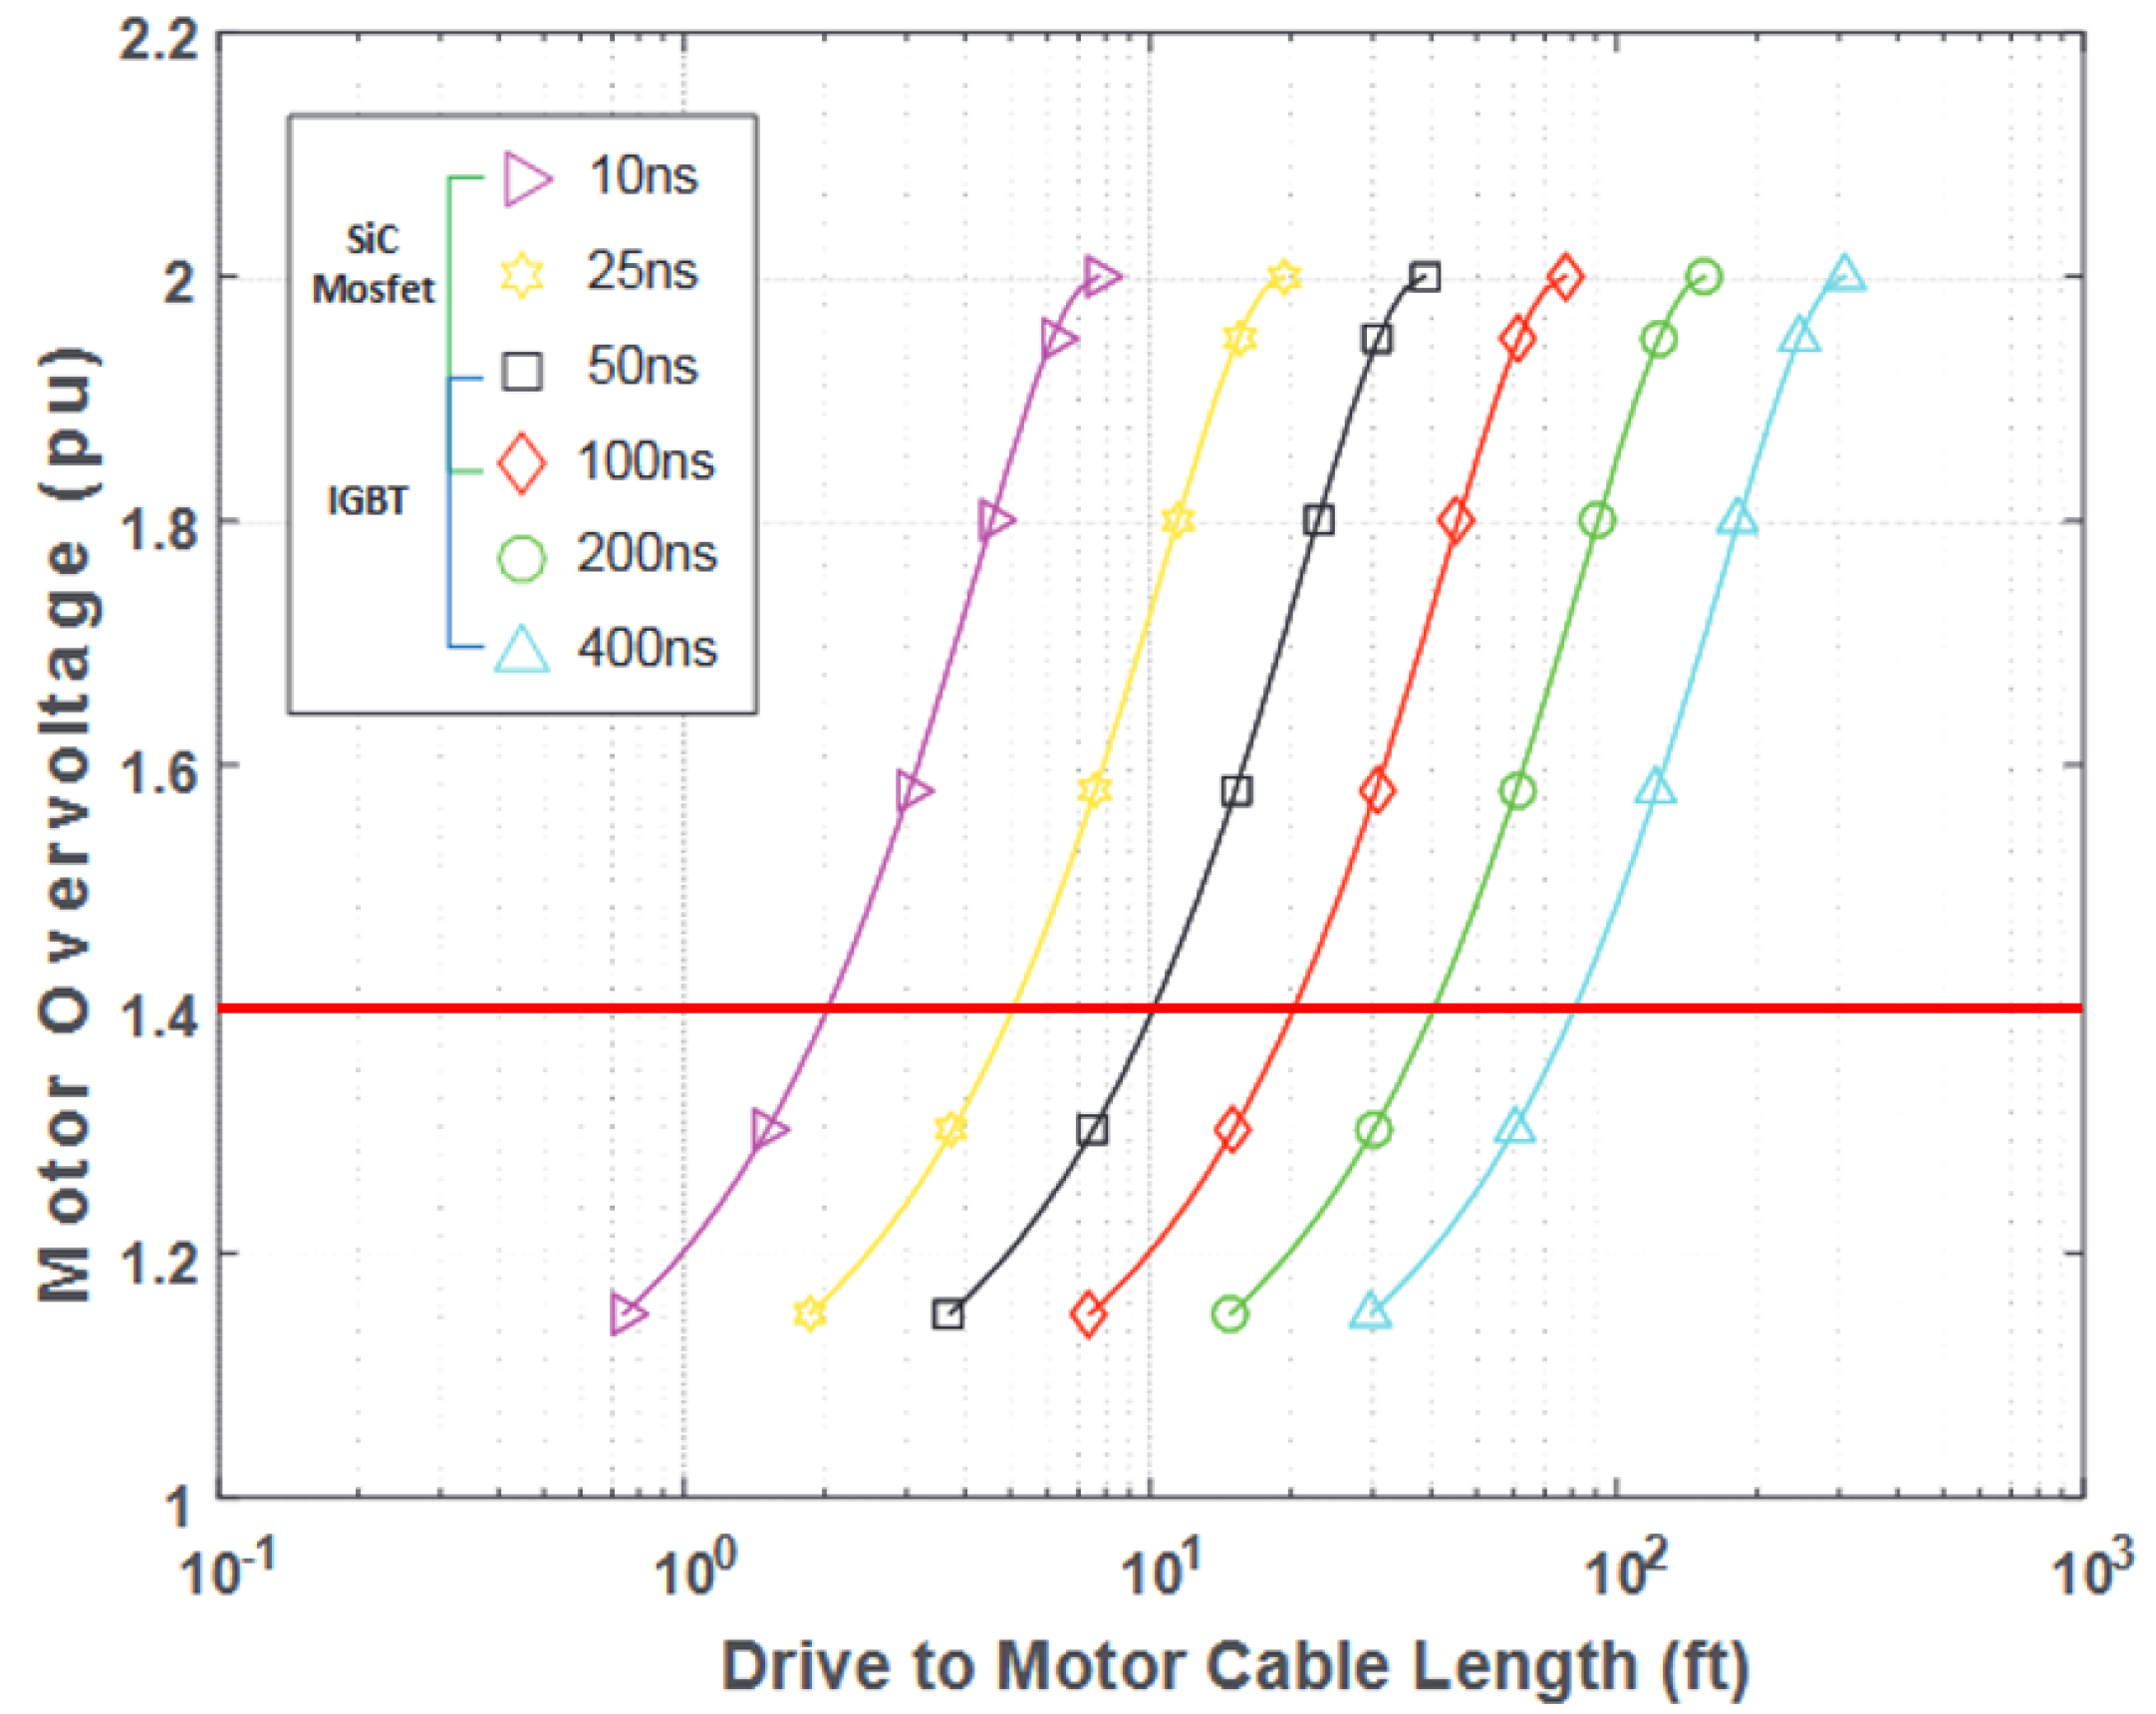
2. Motor Overvoltage and Reflected Wave Phenomenon

A typical pulse-width modulated (PWM) motor drive consists of the inverter on one end (sending), connected through a cable to the motor on the other end (receiving). The pulses generated by the inverter travel like waves via the cable, from the inverter to the motor terminal. If the cable length is finite (as in any practical situation) and is not terminated with its characteristic impedance (Z₀), reflection of the wave occurs, resulting in an overvoltage at the terminals of the motor. This phenomenon is referred to as the “Reflected Wave” or “Transmission Line Effect”. The coefficient of reflection, Γ can be expressed in terms of the cable characteristic impedance Z0 and the load surge impedance Zload as in (1):
Γ = Z l o a d Z 0 Z l o a d + Z 0
Hence if the load impedance and the cable impedance are matched, Z0 = Zload and Γ = 0. The cable characteristic impedance can be expressed in terms of its inductance and capacitance and, depending on wire gauge, is reported to be between 80Ω and 180Ω [26]. The load impedance, in this case the motor, is more complex due to stray winding capacitances and inductances and their high frequency effects. Thus, a more comprehensive model is required to determine Zload. The subsequent sections describe the modeling of the coils, determination of the parasitic capacitances and inductances and the modeling of the high frequency dependence of these parameters.
The rise time determines the critical cable length needed to minimize reflected wave phenomena. SiC devices have much shorter rise times than Si devices; thus, reflected wave phenomena occurs with shorter cables. As shown in Figure 1, to limit overvoltage to 1.4 p.u., a 10ns SiC switch allows only a 2 ft cable, whereas a 200ns Si device permits a 40 ft cable. Given this strong rise time effect, accurately modeling high-frequency behavior is crucial for optimizing SiC motor drives.

3. FEA Modeling of Motor Coil System

This section outlines the insulation model creation process. As shown in Figure 2, it begins with developing an FEA model in the frequency domain to extract system parameters. These parameters are fitted using the vector fitting algorithm to derive the equivalent circuit, based on a multi-conductor transmission line (MCTL) model. The circuit is then used to analyze system behavior, including impedance and voltage responses. Internal coil voltages under switching conditions are applied to a time-domain FEA model to assess their impact on insulation lifespan. Each step is detailed further below.

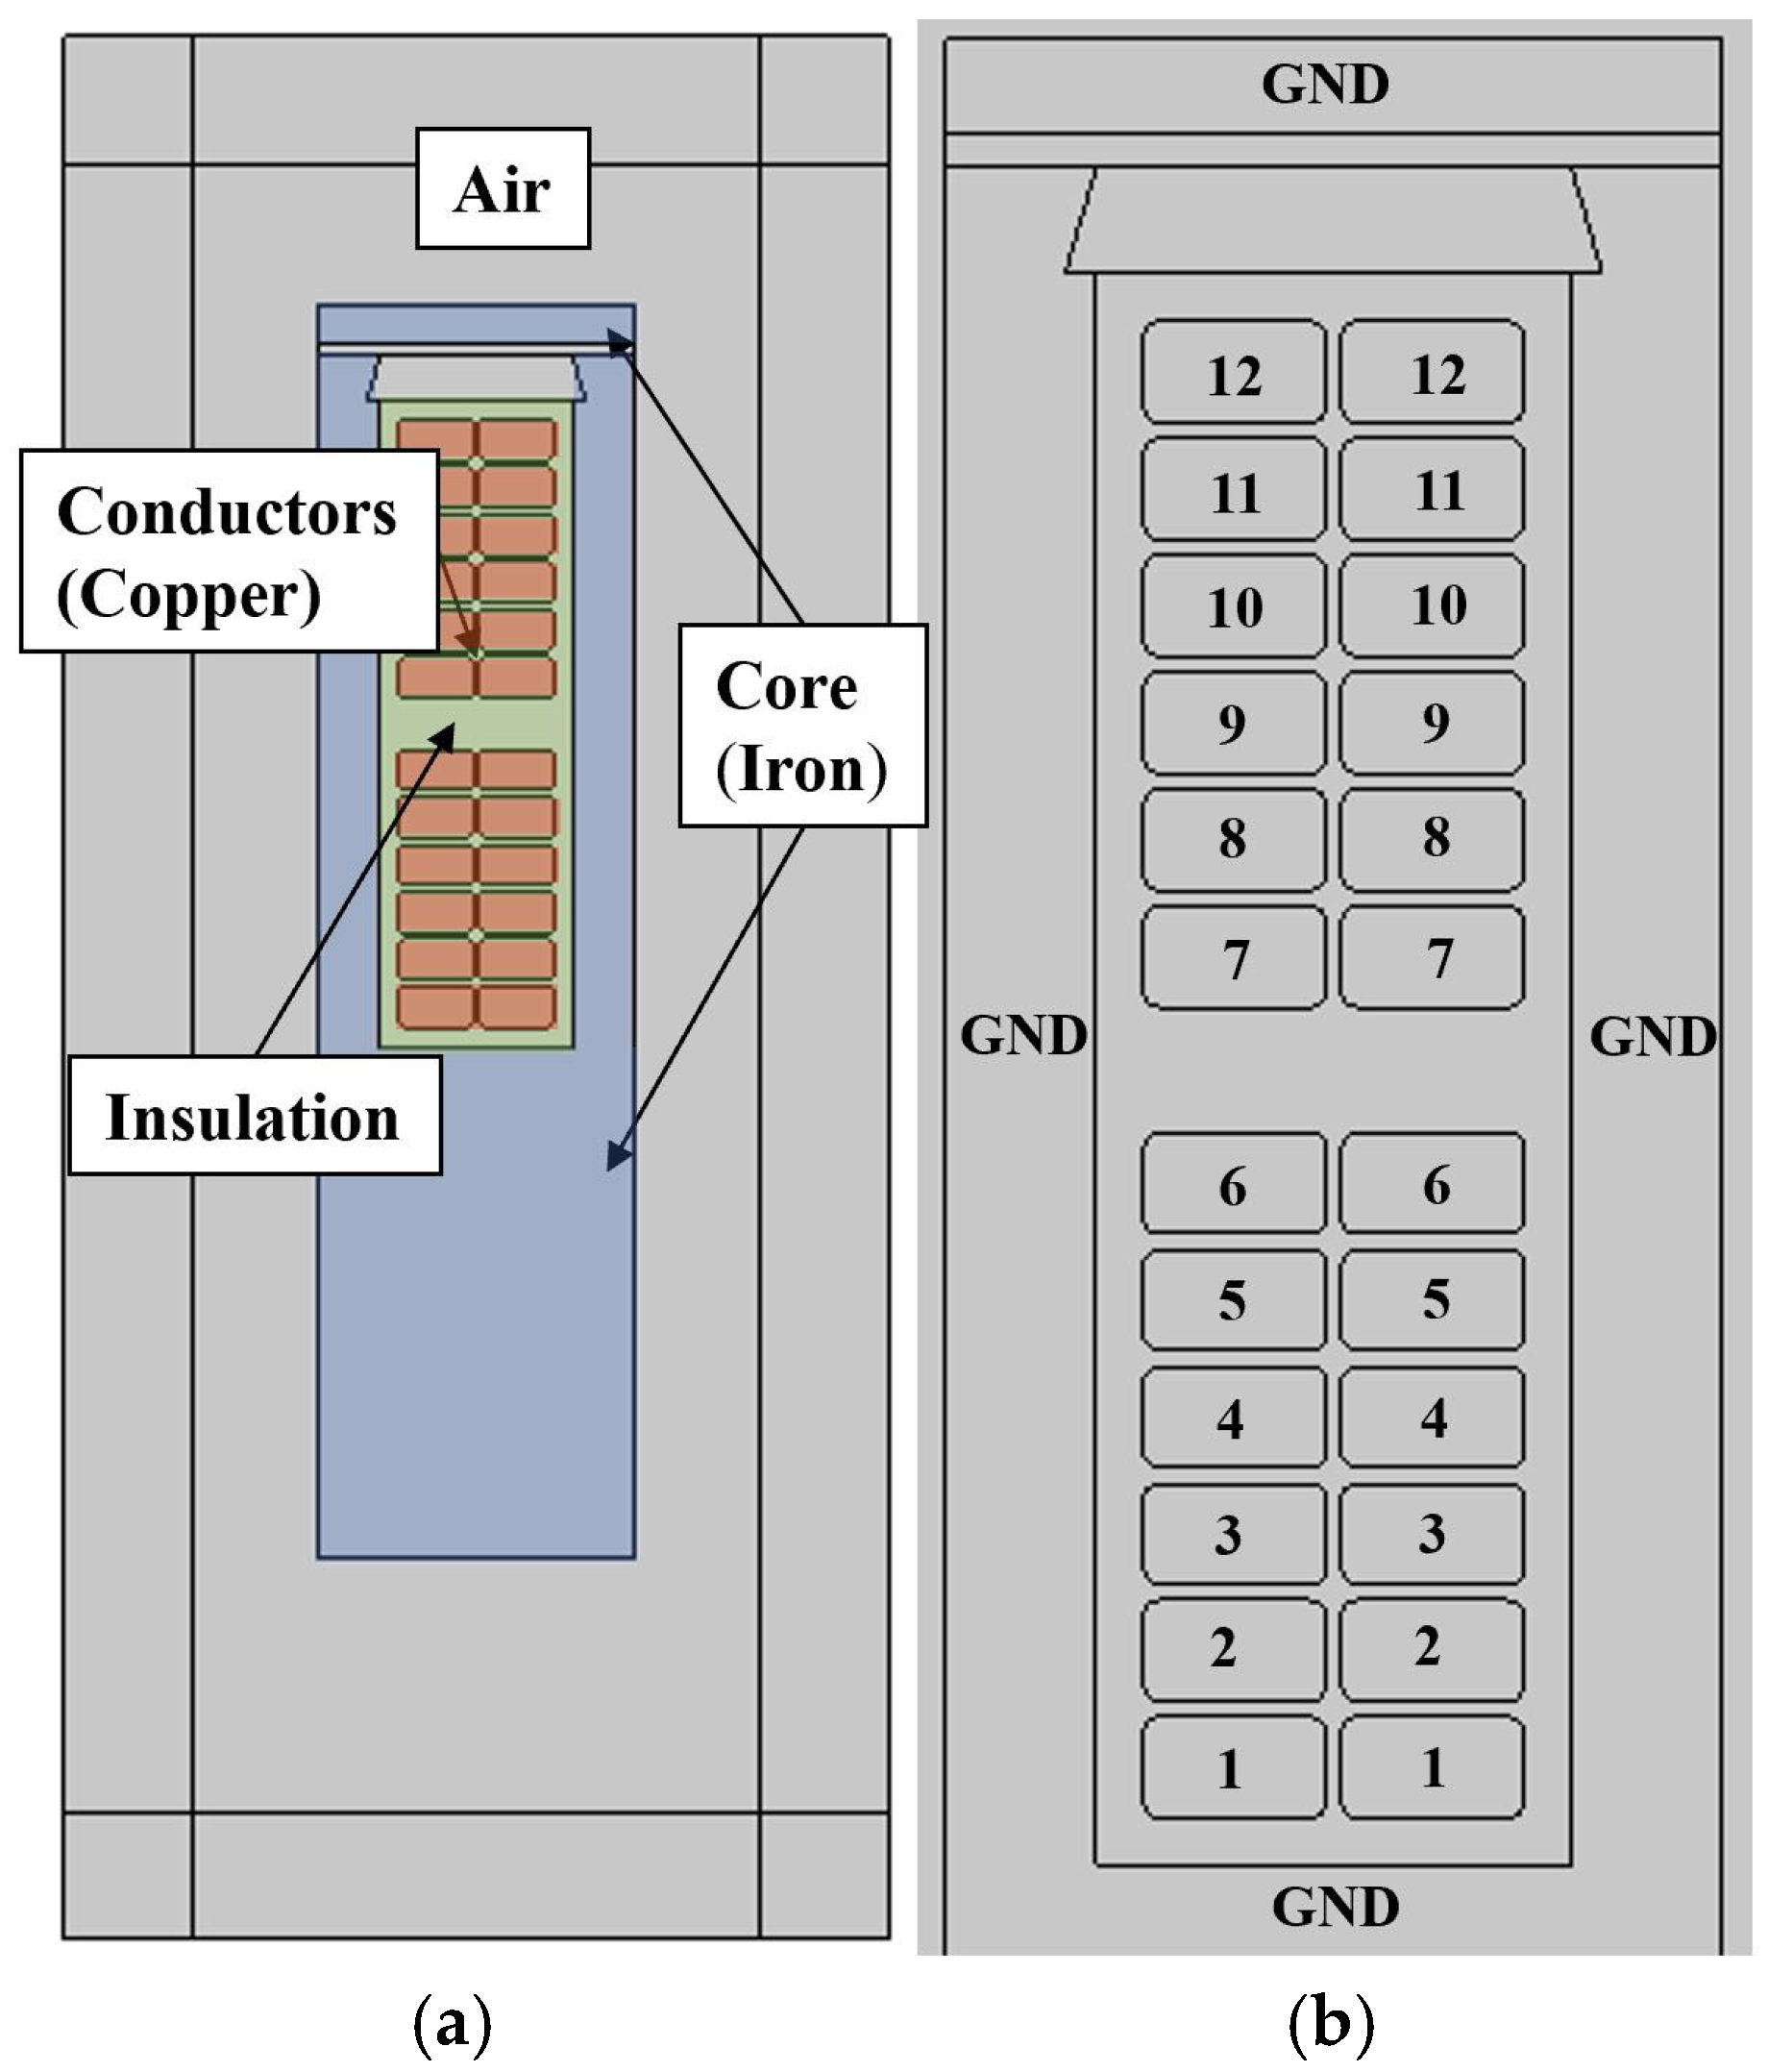
3.1. Geometric Setup of FEA

This work models a linear motorette designed to emulate a 4.16 kV machine. The motorette mirrors the thermal mass, mechanical structure and electrical and magnetic circuits of a machine while being easier to operate for experimental testing. To represent the rotor, plates are placed along the top of the motorette. A single slot model of the motorette was created in COMSOL consisting of the core, coil windings, top plate, and surrounding air. A single slot was used as initial studies found all major electrical and magnetic effects were localized within the slot.
The internal geometry of the motor coil was found by removing a cross-section from a test. Each coil consists of six turns of a parallel pair of conductors. Material properties were assigned as follows: M-22 steel for the motorette and top plate, polyimide for insulation, and pure copper and air for conductors and surrounding space. Figure 3 shows the material and electrical boundaries. The model is bounded by an infinite air domain. For all tests, initial conditions are set to 0 as it is assumed they start at a neutral steady-state. The mesh used for all simulations was automatically created and refined as a Physics Controlled Mesh with the “Extremely Fine” mesh option selected within COMSOL. The finalized mesh consisted of 81,692 elements.
A convergence test of “Fine”, “Extra Fine”, and “Extremely Fine” meshes was conducted by comparing the capacitance matrix. The variation of the derived capacitance values is shown in Table 1. As can be seen, all meshes are consistent to the femto-farad, thus it was determined that the use of an “Extremely Fine” mesh was sufficient while still completing all simulations in a reasonable time (i.e., computational times less than 5 min).

3.2. Selection of Model Depth

The voltage pulses were generated by inverter switching propagate through the machine windings as waves, meaning that different sections of the stator will experience different electric fields. This can lead to voltage unbalances between coil turns that, through the parasitic linkings of the coil, will affect the rest of the voltage distributions of the system.
Rather than treating the coil impedance as a single lumped impedance it must instead be modeled as multiple smaller per-unit impedance cells. By convention there should be a minimum of 10 cells per wavelength [15] of the smallest wave found as in (2):
λ m i n = v f m a x
where λmin is the smallest wavelength, v is the velocity of the pulse’s propagation and fmax is the highest frequency component the model will represent. For motor winding systems, a propagation velocity of approximately ¼ the speed of light or about 7.5 × 10⁷ m/s can be assumed [15]. For ease of implementation, it was decided to model each cell as half the core length (110 mm). If the convention of 10 cells per wavelength is assumed, this will result in an upper frequency limit of approximately 68 MHz. This is more than suitable for examining the behavior of interest; however, any model wishing to explore behavior above this frequency would need to use smaller cells.

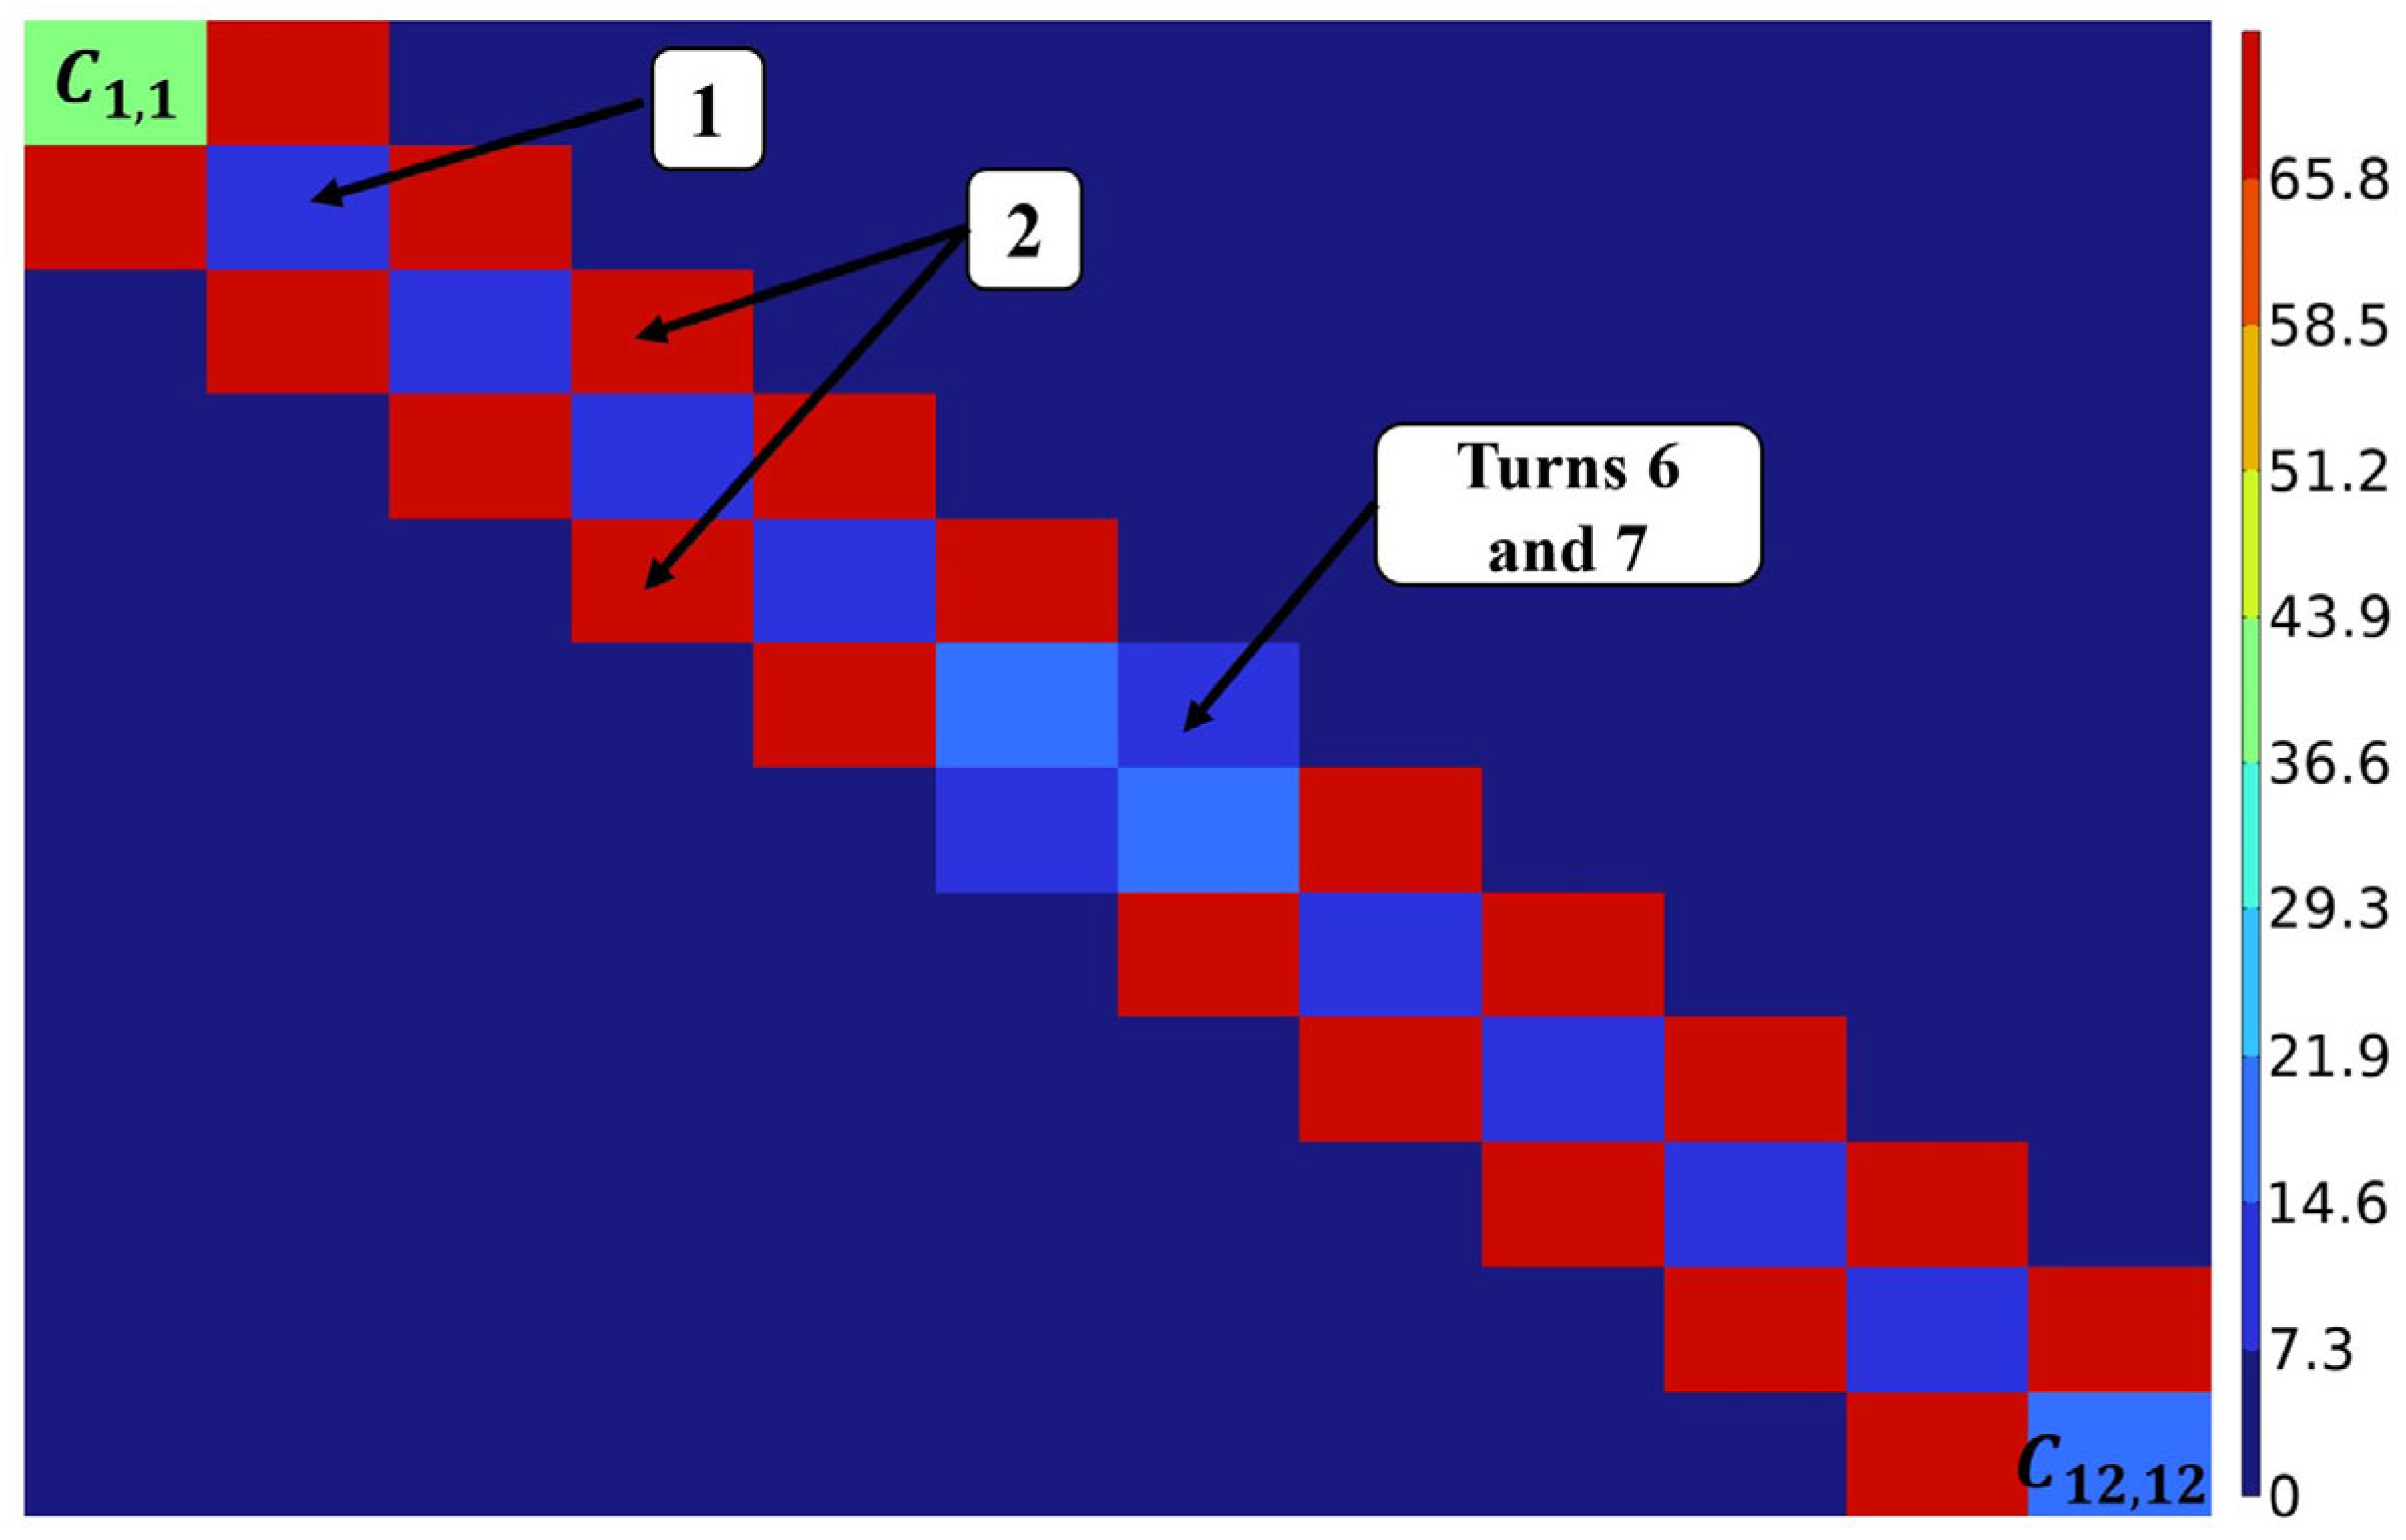
3.3. Calculation of Capacitances

To find the mutual capacitances linking each of the conductors to each other and the grounded motorette, COMSOL’s electrostatics solver was employed. Each copper pair is defined as a separate electrical terminal. A single pair is excited with a 1 V potential while all the remaining pairs are held at 0 V potential while the boundaries of the core are specified as the ground reference. The FEM software then solves the electric field of the model using Gauss’ law [27]. By repeating the process of exciting each pair in turn while grounding all others, the mutual capacitance matrix can be formed following the form as in (3):
C m u t u a l = c 1,1 c 1 , n c m , 1 c m , n
The main diagonal (when m = n) represents the self-capacitance of the conductor pair and all off diagonal elements represent the mutual capacitance between pairs m and n. Within COMSOL this process can be done manually, using a parametric sweep of the conductor pair voltages, or using the Stationary Source Sweep Study option.
Figure 4 shows the mutual capacitance of the motorette system. Only the self-capacitance, the diagonal marked “1”, and the capacitance between vertically adjacent conductors, marked “2”, contain capacitances of significant magnitude. To confirm the negligible impact of mutual capacitance between non-adjacent conductors, a reduced SPICE model of turns 1–4 was created using 1st, 2nd and 3rd order capacitance matrixes. The peak percent differences of the impedance response of the 1st and 2nd order models to the 3rd order were computed for frequencies less than 100 MHz were found as 0.0356% and 2 × 10⁻⁵%, respectively. For this reason, only the capacitance between adjacent conductors was modeled. Conductors 6 and 7 deviate from the pattern presented due to the increased distance between them.
As the conductor pairs are physically interconnected it is difficult to experimentally validate these results. Instead, the results of the mutual capacitance matrix are validated by preforming analytical calculations by representing them as ideal parallel plates. A selection of the analytical capacitances and FEA capacitances are shown in Table 2. The analytical calculations differ slightly from the results of the FEA model, but this can be accounted for by the simplifying assumptions made in setting up the analytical model.

3.4. Calculation of Frequency Dependent Resistance and Inductance

The self and mutual resistances and inductances of the model were found using COMSOL’s magnetic field solver. Each parallel conductor pair was defined as independent coil features. One of the pairs is then excited with a 1A sinusoidal current whose frequency matches the frequency of the extracted RL parameters. As will be discussed later, the frequencies of the RL components found at this step can limit model accuracy; thus, a comprehensive sweep is advisable. The self-inductance is automatically calculated and the mutual inductance between the energized conductor, m, and another conductor, n,
L m , n = V n i ω I m
is found as a function of the induced voltage of the secondary conductor Vn, the input current Im, and the angular frequency as in (4). The imaginary component of the resulting mutual inductance is created by the eddy currents from the skin effect of the conductors. After this has been done for all frequencies of interest for one conductor pair, the process should be repeated for all other conductor pairs [28]. To better capture the magnetic behavior of the iron core an effective B-H curve, found using the effective nonlinear magnetic curves calculator app within COMSOL, was used to reflect the permeability of the core and top plates. All other materials in the model are assumed to remain in the unsaturated regions of their magnetization curves, thus relative permeability is sufficient.

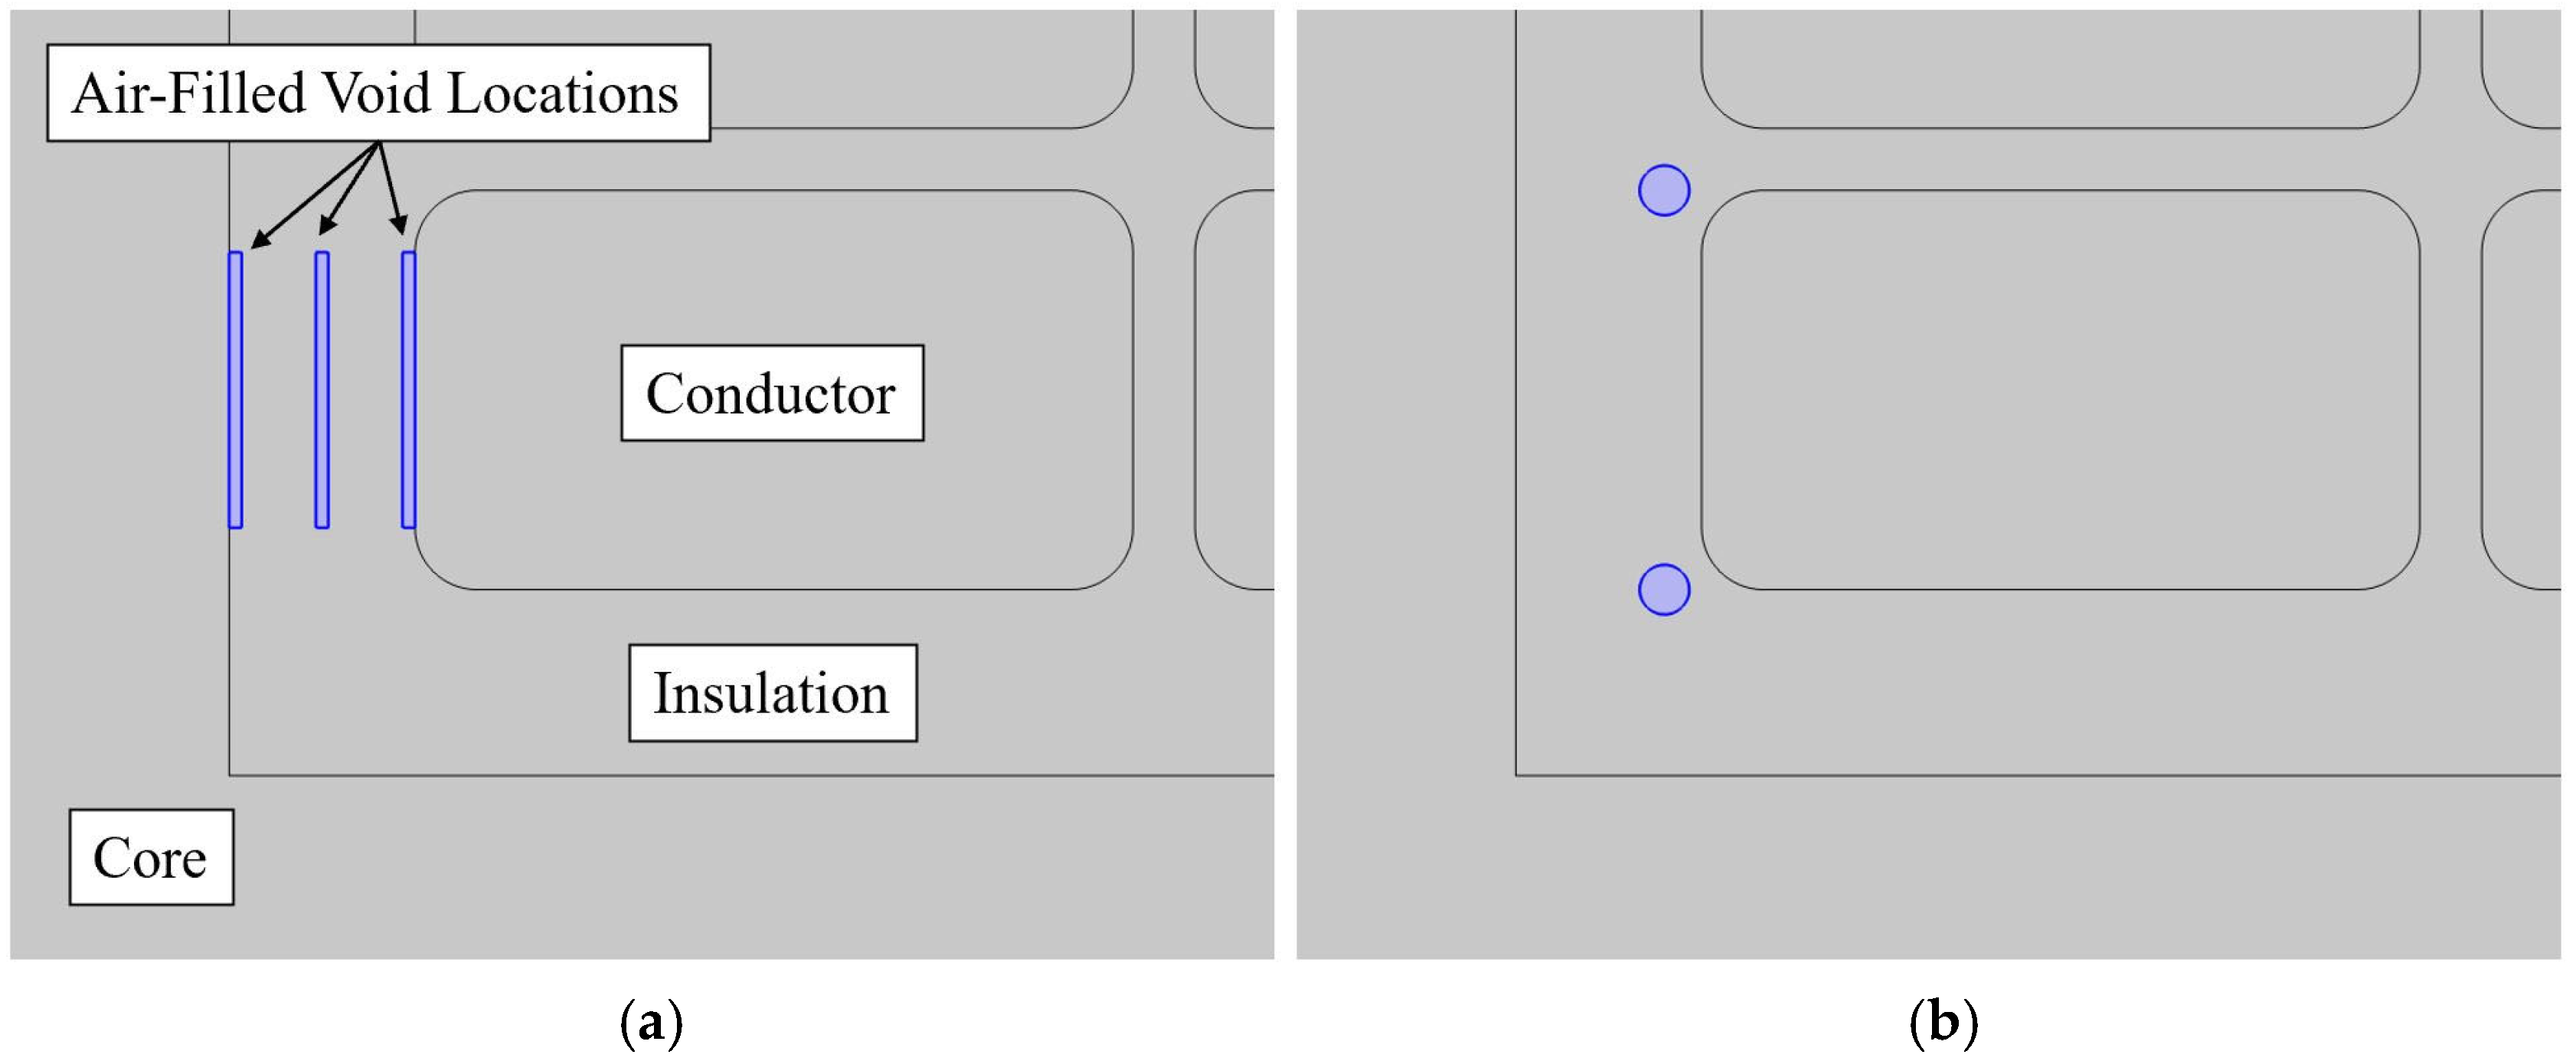
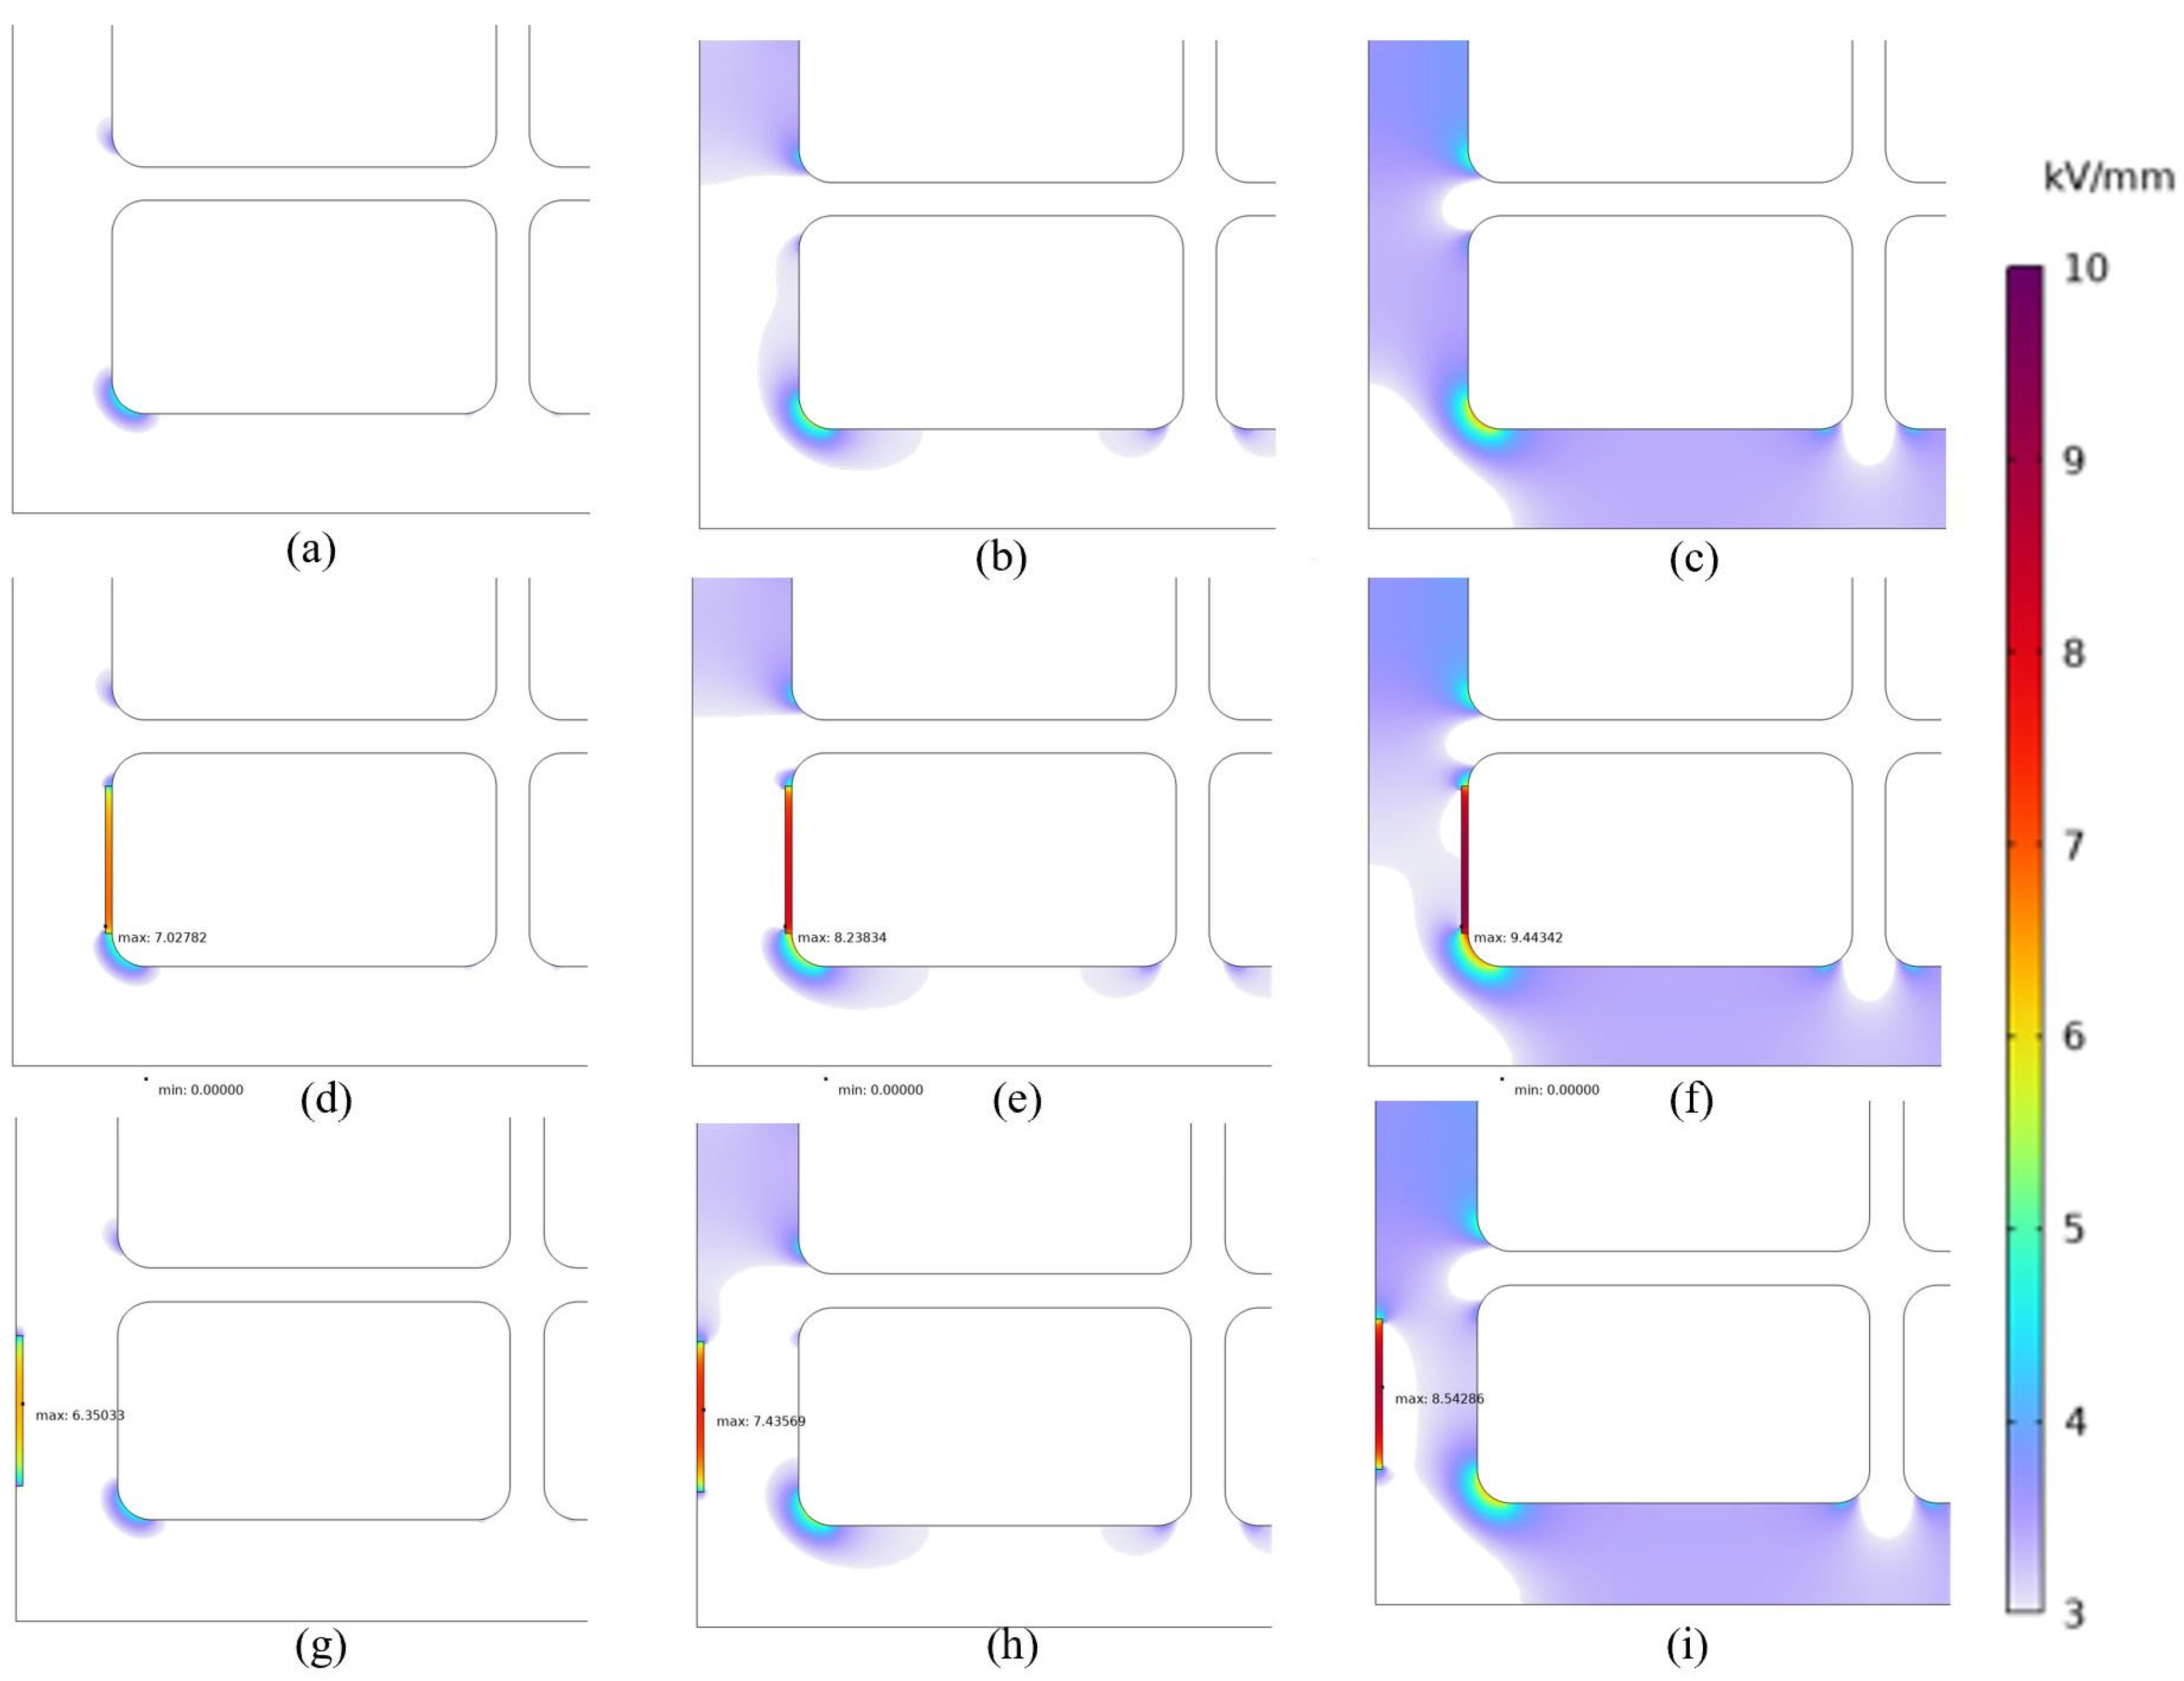
3.5. Modeling of Voids and Delaminations

Damage to the coil insulation was modeled by adding air filled voids and delamination within the insulation at different locations [29,30]. Rectangular delaminations with an area of 0.2 mm2 adjacent to the conductors, at the midpoint between the conductor and GW and adjacent to the GW, were investigated. Circular voids with a radius of 0.2 mm were also investigated in the same regions as the delamination in addition to the areas around the corners of the conductors [31]. Figure 5 shows the region around turn 1 of the model to highlight the location of several of the damage cases investigated.
Investigation of the impact of voids and delamination was focused on damage to the regions surrounding turns 1 and 7. For additional clarity of void impact, a parametric sweep of void size, shape, and location could be done, but these turns were selected as they are the input and output of the coil, respectively, and are thus expected to have the highest difference in behavior. The same procedure for the creation and operation of the FEA and MCTL models was performed for both models with and without damage to the insulation. Doing so, it was found that there were minimal changes to the resistance and impedances, but significant changes to the mutual capacitance matrix of the model.

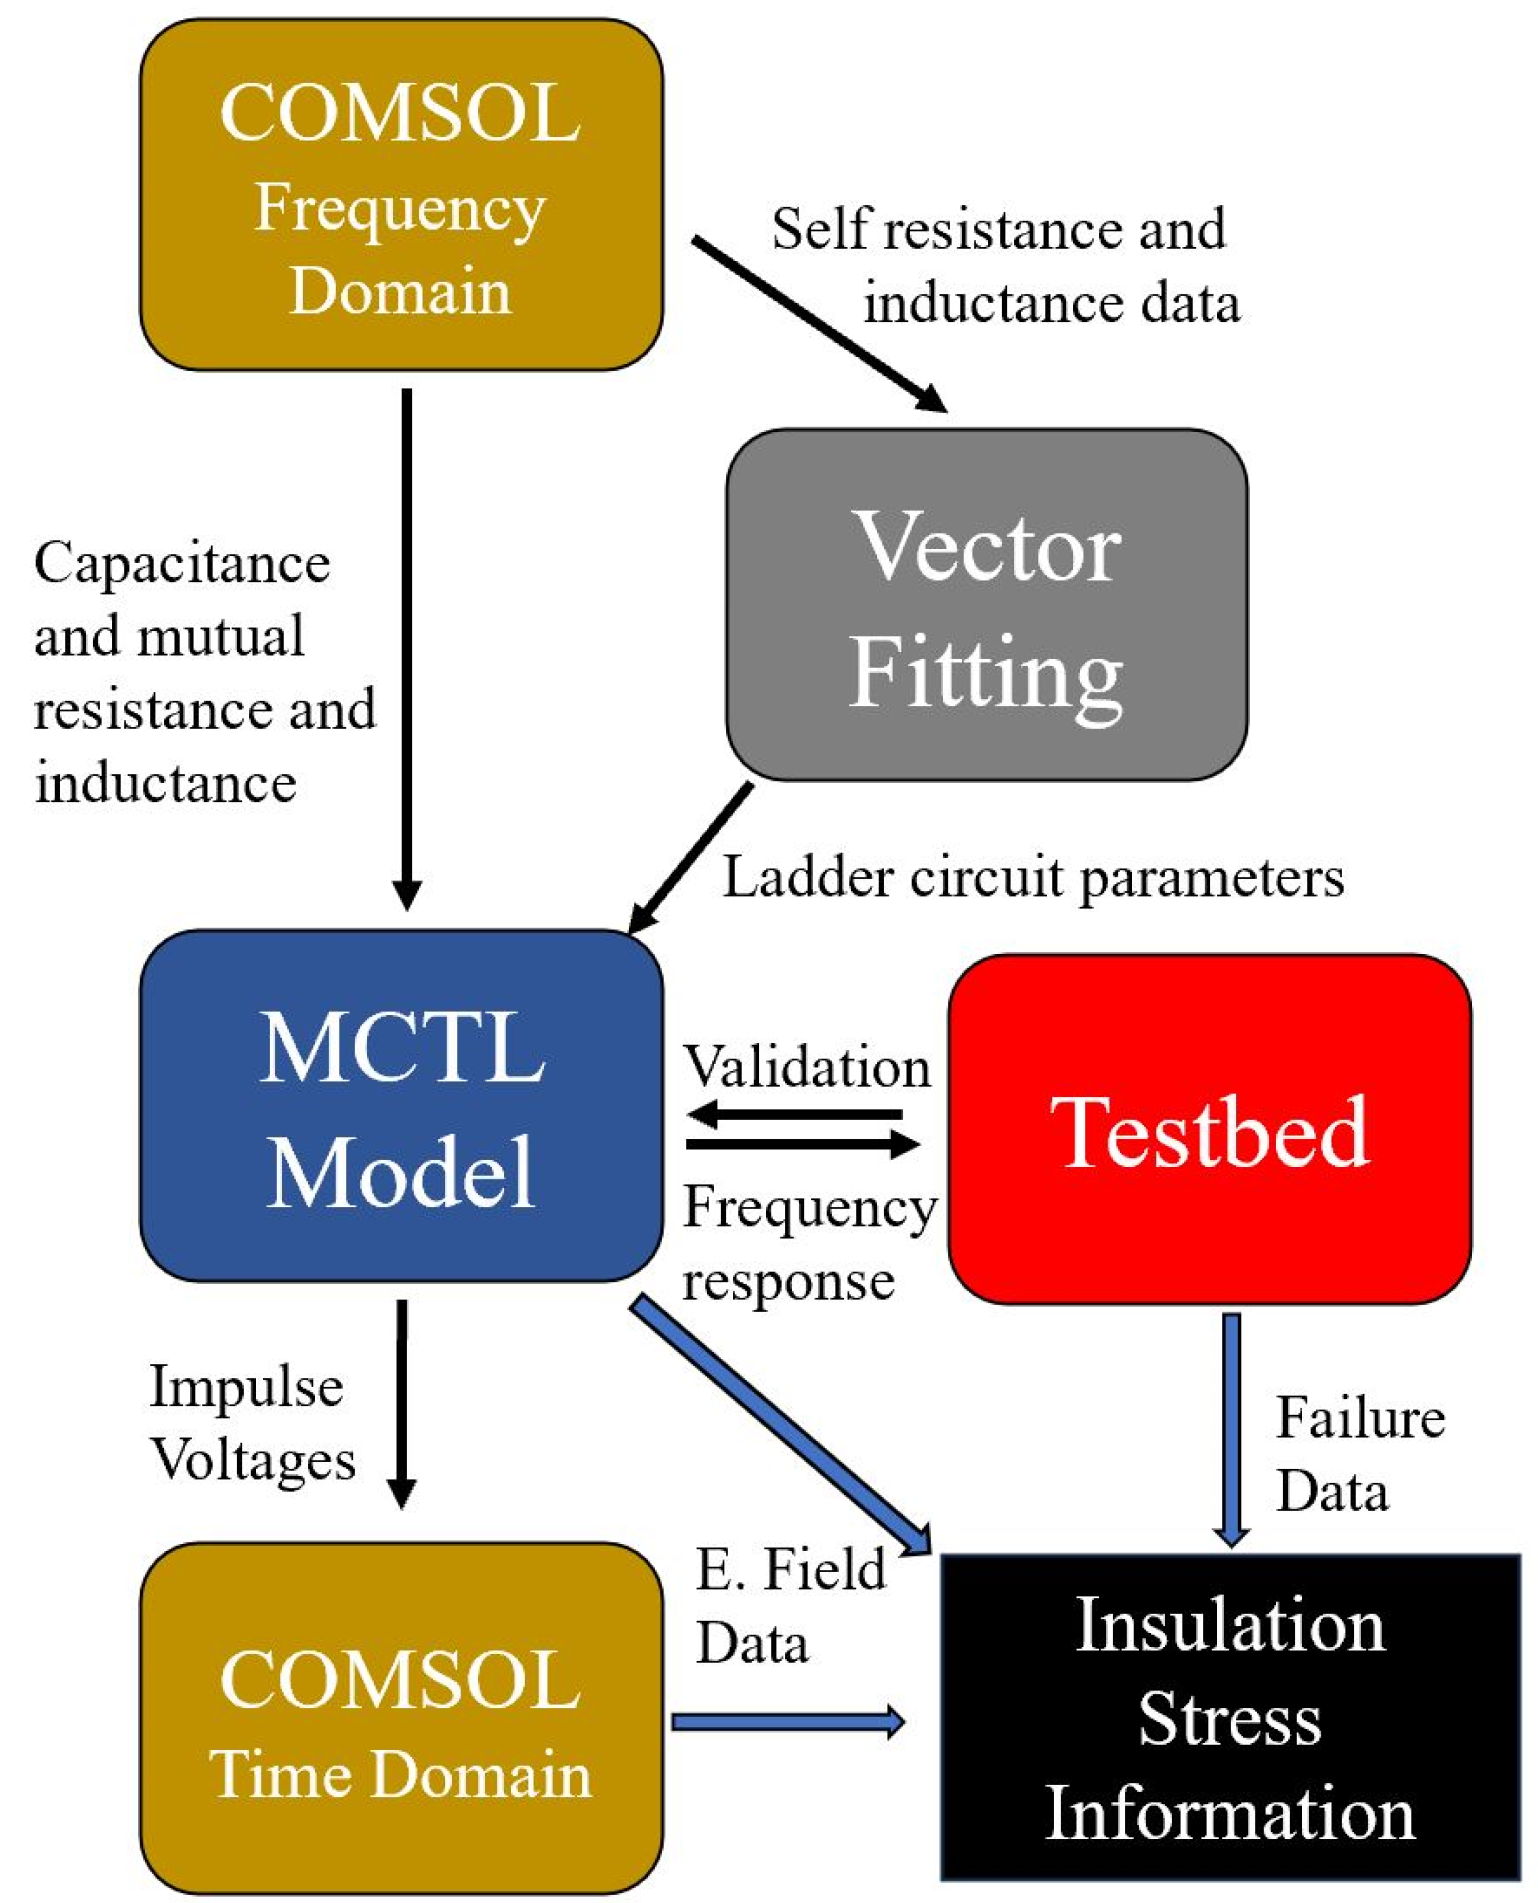
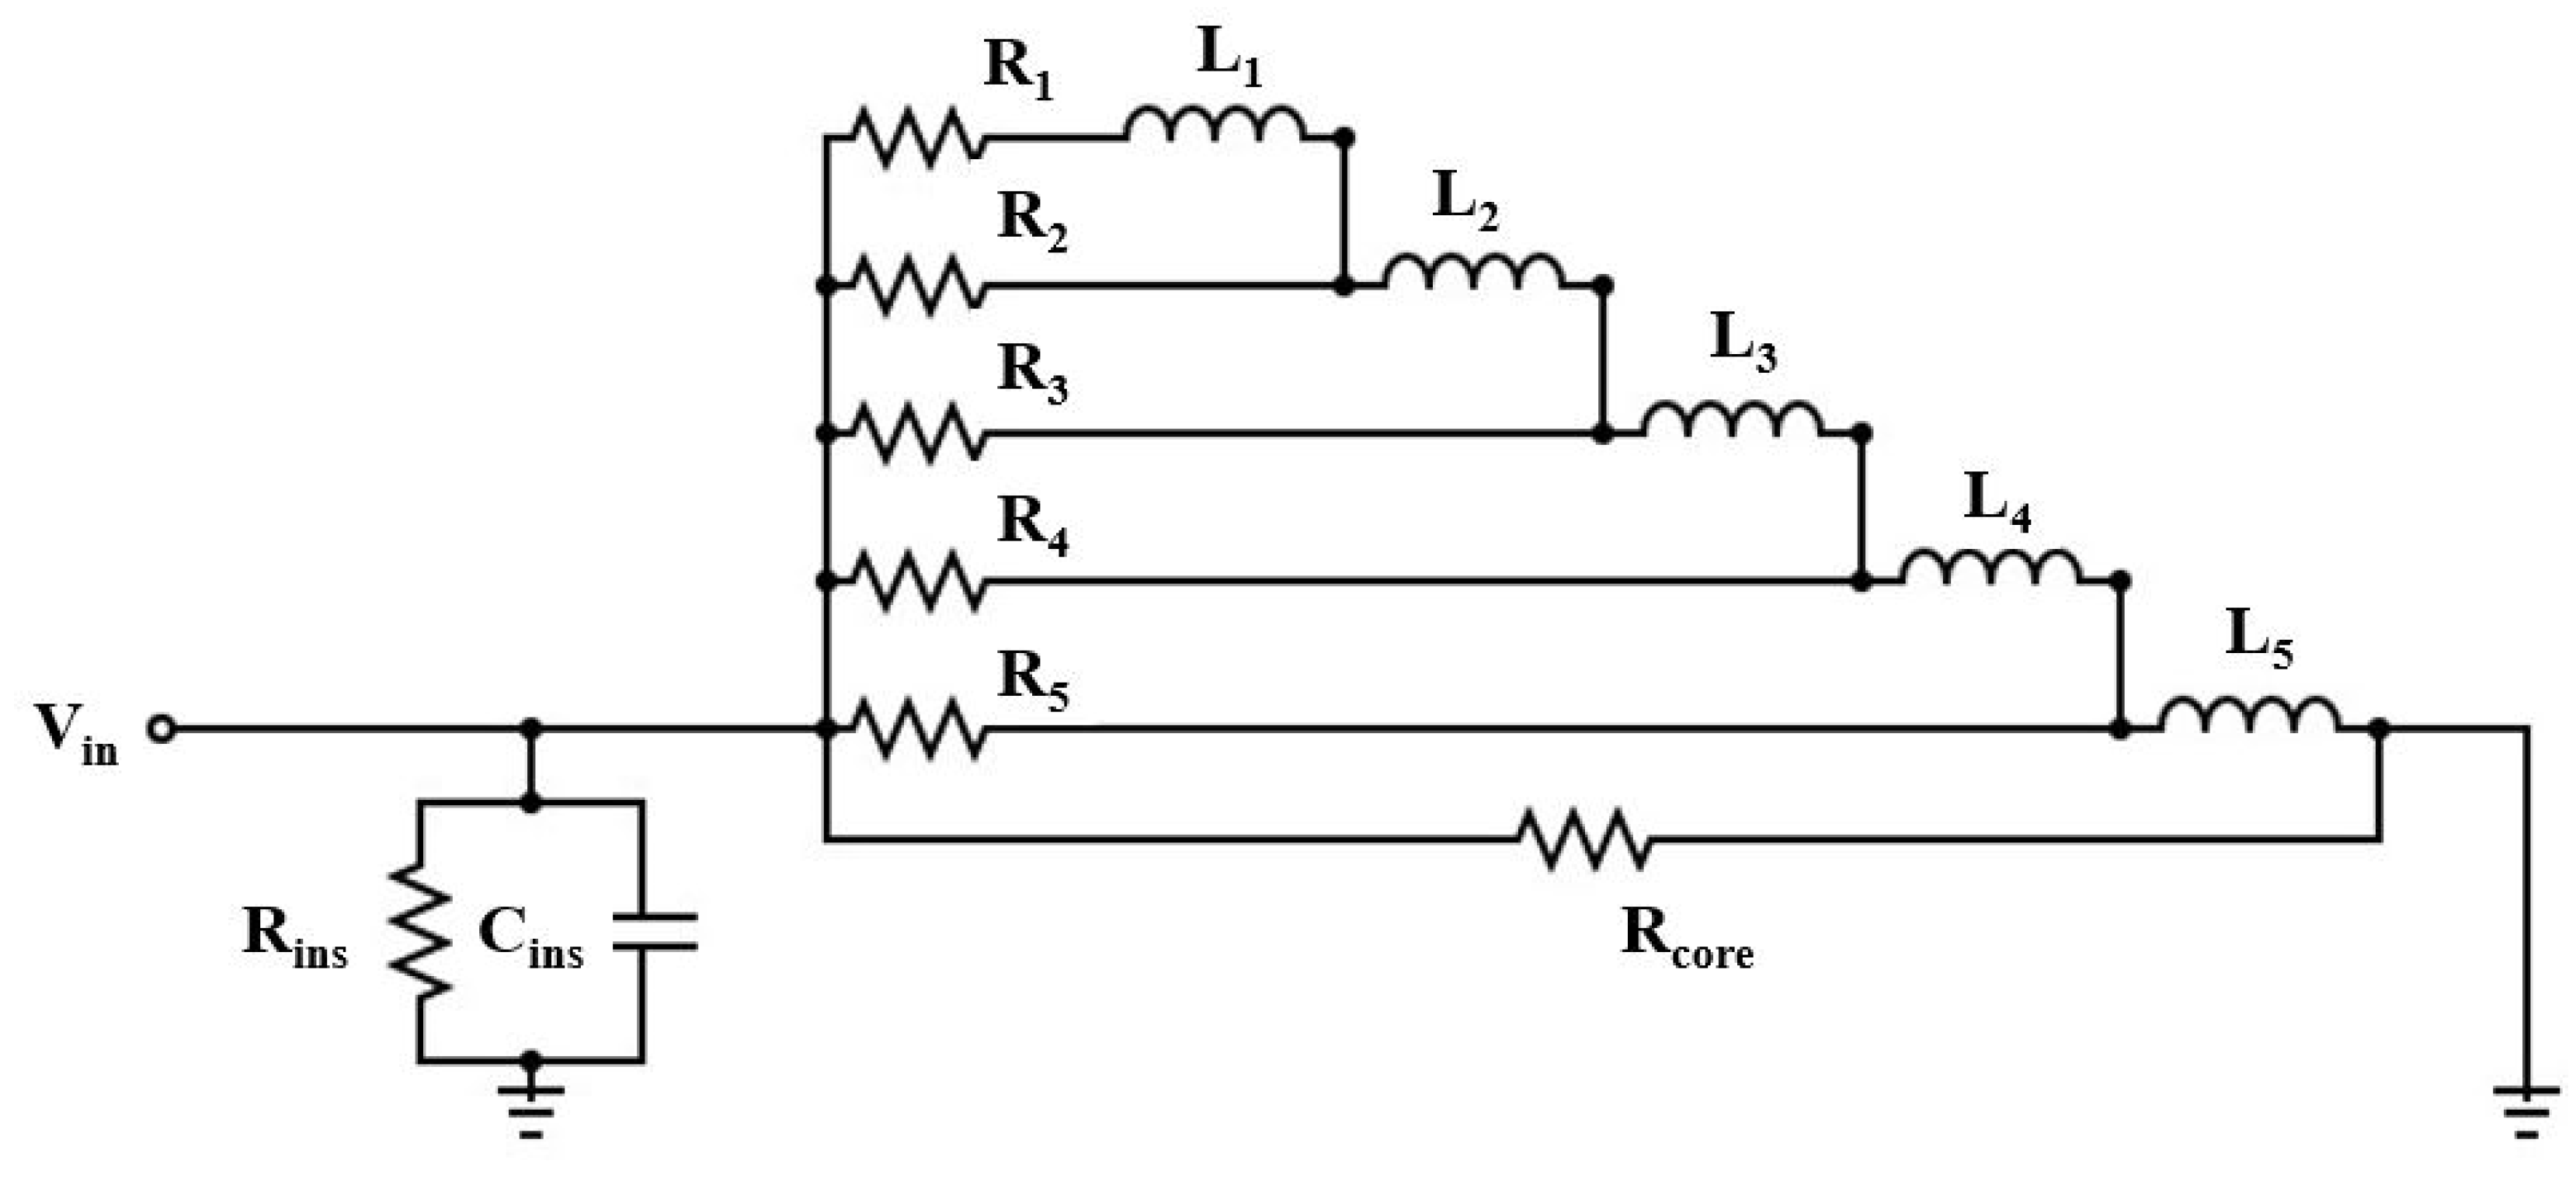
4. MCTL Model of Coil Electrical Behavior

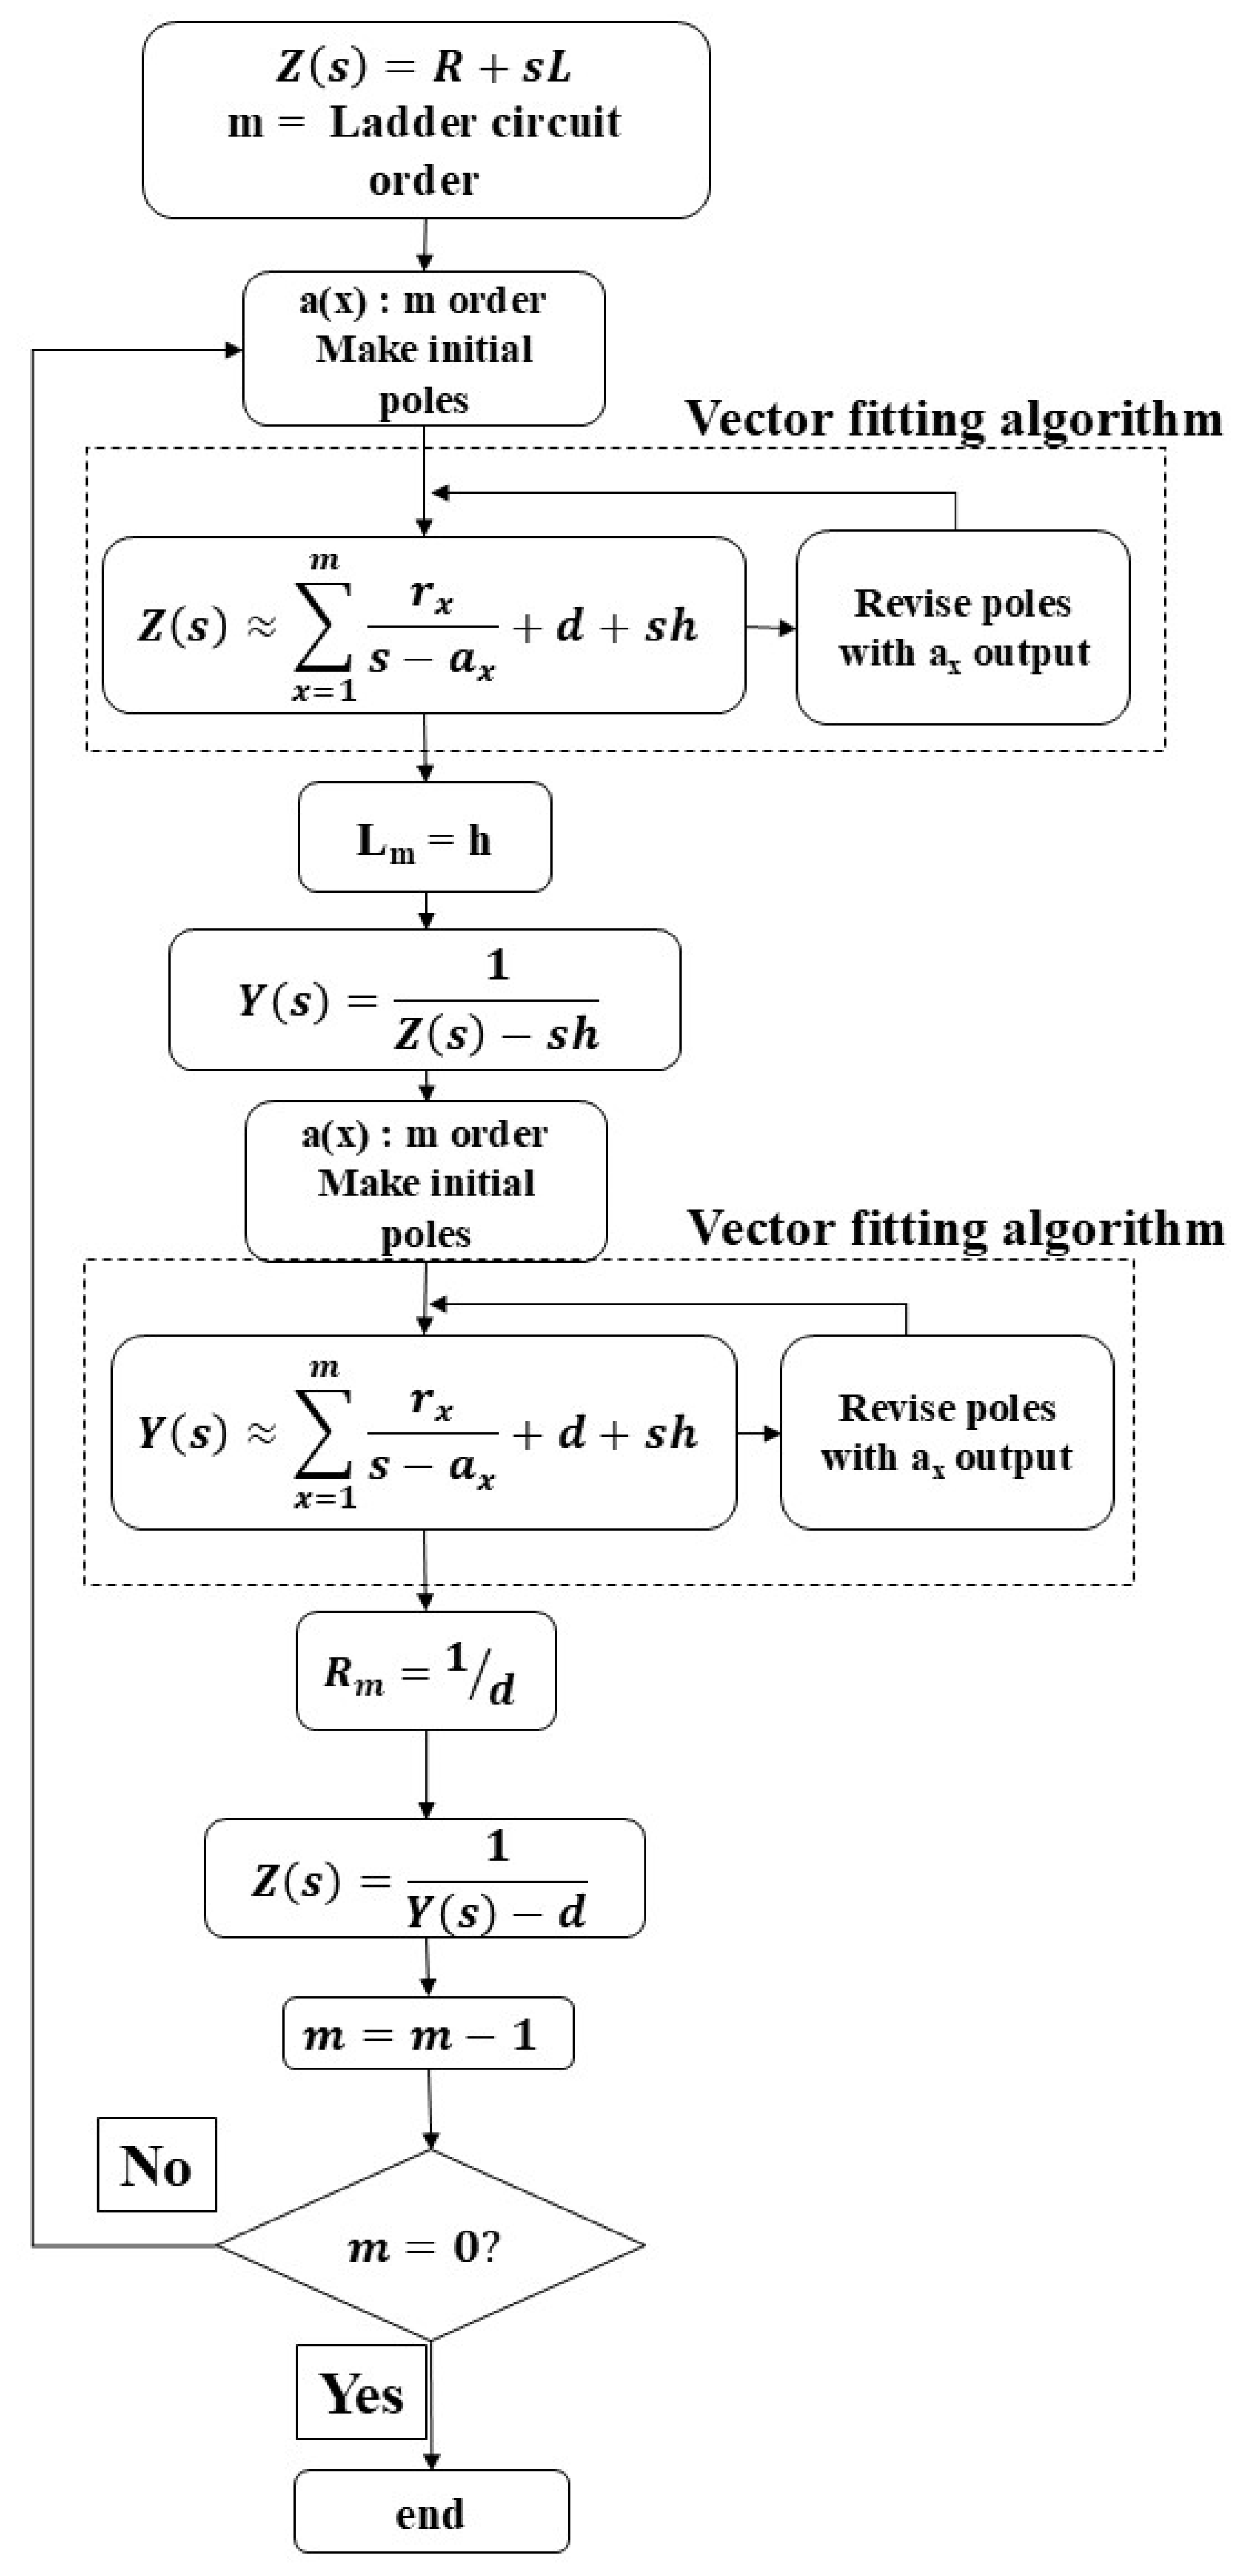
4.1. The Use of Ladder Circuits for Representing the Frequency Dependent Coil Behaviors

Numerous circuit topologies have been proposed for modeling the behavior of motor windings including those based on MCTL theory [9]. One such approach is the use of ladder circuits whereby the RL components of a traditional transmission line model are replaced with a more complicated form to better represent the nonlinear changes to the resistance and impedance at different frequencies [15,32]. Figure 6 shows the generalized form of an nth order ladder circuit. Due to their robustness and ease of refinement, ladder circuits are used in this work to represent the nonlinear RL components of the motor coil.

4.2. Calculations of Ladder Circuit Parameters

Ladder circuits allow for adjustable accuracy by modifying the model order, balancing impedance accuracy with circuit complexity and computational overhead. To determine the order used by this study the accuracy of a 3rd, 4th, and 5th order representation of a single conductor pair was evaluated and compared to the COMSOL outputs in Figure 7. From this it can be seen that increasing the ladder circuit’s order improves the accuracy of the model especially at higher frequencies and that a 5th order model closely fits the COMSOL results for the frequency domain of interest. However, to improve the model accuracy for frequencies above 1 MHz, additional ladder circuit levels may be needed. The ladder circuit parameters are found using the process shown in Figure 8 by iteratively approximating the impedance and admittance of the system using vector fitting, a pole relocation method proposed by Gustavsen, whose work covers the process in great detail [33]. Vector fitting approximates an s-domain function, F(s), with the following form:
F s x = 1 m r x s a x + d + s h
where ax are the poles of the function, rx are the residues of the function, d and h are constants and m is the order of the approximation in (5). The frequency dependent inductances and resistances from the COMSOL model are used to compile an impedance vector whose length, n, is the number of frequencies swept in the RL computation. Following this the order of the ladder circuit, m, is selected such that m < n. Because the order of the approximation is limited by the number of frequencies swept in the RL approximation, the COMSOL model can become a limiting factor on model accuracy.
A set of preliminary poles are generated as complex conjugate pairs evenly distributed across the model bandwidth. For instances with an odd number of poles, one of the complex conjugate pairs is replaced by a singular pole placed at the zero of the imaginary axes. For improved results regardless of the initial pole conditioning, the poles found by the vector fitting algorithm are re-applied to the algorithm to allow for it to iteratively improve its fit. This is done until no further improvement is found; for this work it was determined that five iterations were sufficient.
After an approximation for the impedance has been found, the mth order inductance of the ladder circuit is extracted as the imaginary constant, h, from the approximation. This constant is removed from the impedance approximation and the admittance vector, Y(s), is formed. The process for finding the impedance approximation is repeated with the admittance from which the mth order resistance is extracted. A new impedance vector is formed from the adjusted admittance vector, the order of the approximation is reduced, and the process is repeated until the resistance and inductance values for all orders of the ladder circuit are found.

4.3. Ladder Circuit Implementation

Allegro Design Entry CIS was used to implement the electrical model of the form wound coil system. The mutual capacitances between adjacent conductor pairs were doubled to reflect the mutual capacitances occurring in the end turn regions of the coil. To better model the single coil system, wherein only one coil is energized within the motorette, the linking effects between the bottom coil, the 1st–6th turns, and the top coil, 7th–12th turns, are not considered as on the testbed only the top coil or bottom coil of a given slot will be energized. However, in a full motor or multi-coil model these linking factors would need to be implemented to properly realize the behavior of the system. As the cell length of the model is ½ the depth of the motorette, the Lend inductance parameter is only included for the first cell of each turn.
The process for calculating the impact of the mutual inductances and resistances of other coils is implemented in a separate subsystem which uses an array of current controlled current sources and voltage sources to implement (6), as follows:
V m u t u a l a = x , x a y R a x + L a x i x
where the impact from mutual inductance and resistance from coils x through y on coil a are found as a sum of voltages across the RL mutuals components between all other turns. To further improve the accuracy of the model the RL components of the mutuals could also be implemented as ladder circuits, but this would considerably increase the computational burden, thus it was decided to only use the RL 1 MHz.
Methods for finding an approximation of Lend and Rcore have been presented by Sundeep [17,18] and Barzkar [15], but there is no widely accepted method for finding their values and no proposed methods applicable to a linear motorette [15,17]. Due to this, it was decided to perform an optimization sweep of both Lend and Rcore to find the best fit of the model impedance response to experimental results. Following the optimization sweep a core loss resistance of 300 mΩ and an end turn inductance of 880 nH per cell was selected.

4.4. FEA Modeling of Voltage Distributions in Time

After the equivalent circuit for the MCTL model is implemented in the SPICE solver, different test conditions for the coil can be simulated to find the expected voltage distributions of the conductors within the coil. These voltage distributions are representative of the geometric location of their corresponding cells. As the model discussed in this work consists of two cells per turn, the conductor voltages at the slot entrance and slot center for each turn can be found.
The voltages at each of these locations can then be extracted and used as an input voltage to the terminal features representing the conductors within the COMSOL electrostatics solver. Following this, time domain simulations can be conducted in COMSOL where the voltages of each conductor pair change in time to represent the voltages predicted by the MCTL SPICE model. This method allows for the full switching cycle including the overvoltage and the ringing effect to be represented within the COMSOL model. While similar methods for modeling changes in the electric fields of COMSOL models have been proposed, they have been limited to ideal voltage excitations, assuming sinusoidal voltages or neglecting overvoltage effects, or not considering the entire switching cycle [29]. This approach allows for the electric field information of the coil insulation to be found in a manner that accurately represents the localized voltage differences between different turns of the same coil. This methodology also allows for additional flexibility in modeling as changes to the voltage level, rise time, and the location of potential voids can all be modeled using this process.

4.5. Analytical Modeling of Ladder Circuit Impedance

To analyze impedance variations in ladder circuit models due to changes in insulation and winding properties, an analytical model of a single ladder circuit section with a corresponding GW insulation equivalent circuit was developed. The modeled circuit, shown in Figure 9, consists of a fifth-order ladder circuit, incorporating core loss resistance and a parallel RC branch to represent GW insulation.
While a fifth-order circuit was used, the impedance is presented in a generalized form, allowing for easy adaptation to different ladder circuit orders. For analytical modeling, end-turn impedance was neglected since it is not present in all ladder circuit cells. The system of equations for determining the impedance of an arbitrary-order ladder circuit is provided below.
Z n = L n + 1 R n 1 + Z n 1 1   f o r   n > 2
Z 1 = L 1 + R 1
where the impedance for level n is found as a function of the resistance and inductance of the nth level and the impedance of the prior level. This mathematical model was implemented in MATLAB 2021a using arbitrary values for all parameters and was used to investigate the expected changes to the impedance response as the system parameters were changed.
It was found that changes to the GW insulation parameters, Cins and Rins, and the core loss resistance Rcore resulted in the largest changes to the impedance response of the circuit. By contrast, changes to the ladder circuit parameters only minimally impacted the impedance response. The impact of changes to the insulation capacitance and core loss resistance is shown in Figure 10; the impact of the insulation resistance was nearly identical to that of the core loss resistance. For each plot the parameter under investigation was changed by an order of magnitude between each step from low to medium, and medium to high, to better illustrate the impact on the impedance response. As the structure of the analytical model has all the components effectively placed in parallel to ground the results are in line with expectations. The insights gained from this analytical modeling can be used to better understand the internal changes occurring within the coil as the impedance of the system changes with aging.

5. Experimental Setup

5.1. Testbed

A linear motorette designed to represent the stator of a 4160 V machine was selected as the basis of the experimental testbed. The motorette was placed on HV insulators and a single wire was affixed using silver epoxy connecting the motorette to the ground of the system. The installation of a grounding wire to the isolated motorette allows for the ground leakage current of the coils under test to be tracked.
The power electronic circuit used to energize the coils under test consist of a MV DC power supply, smoothing capacitors, the coil under test, current limiting resistors, and a SiC power module. To control the DC voltage of the system, a Glassman EQ power supply was used: it is rated for voltages up to 10 kV and continuous output currents of 120 mA. A 2μF capacitor is installed across the terminals of the DC supply to smooth the DC bus voltage when switching is enabled. To limit the current draw of the system, two 32 kΩ power resistors are installed in series with the test coil. The coil under test is connected to the DC bus and the current limiting resistors with a 2 m wire.
The motorette testbed can also be encased in a thermally insulated encloser with integrated heating elements and thermal sensors. This allows for the thermal stress placed on the motorette to be controlled in addition to the electrical stresses created by the power electronics. The testbed is shown in Figure 11.
Two different 10 kV SiC power modules were used during testing: an XHV-6 SiC half bridge and an XHV-9 single power module. Initial testing was conducted using the XHV-6 SiC half bridge while later tests transitioned to using the XHV-9 due to stability issues with the XHV-6. The test circuits used for both the XHV-6 and XHV-9 based testbeds are shown in Figure 12. For testing with the XHV-6, two additional capacitors with corresponding balancing resistors were placed in parallel with the DC bus. This was done to create a neutral point, node B. By changing the connection point of the load output, node A, to either the negative DC bus plane, node C, or the neutral connection point, the voltage pulses experienced by the load could be modulated as either unipolar or bipolar, respectively. By contrast, the XHV-9 consisted of a single power module, and thus could only provide unipolar impulses to the load.
In addition to the SiC modules, a DEI Si 10 kV power module was used for comparison to Si results. Data collection was performed using Tektronix oscilloscopes connected to differential and standard voltage probes and current sensors. The scope used has a maximum sampling frequency of 100 MHz. Because the frequency range of interest for this model is less than 50 MHz, a sampling frequency of 100 MHz is sufficient for satisfying the Nyquist sampling requirement.

5.2. ETFE Method

For the purposes of finding the frequency dependent impedance of the coil under test and the coil’s GW impedance, the empirical transfer function estimation (ETFE) method was employed. The ETFE is the ratio of the input and output Fourier transform of a system after it experiences a perturbation. This can be used to solve for the impedance of an electrical system by using the voltage and current spectra as input and output whereby the impedance of a system can be found at any frequency ω such that there is sufficient voltage and current data at that frequency.
Traditional methods for finding the impedance response of a system will apply a sinusoidal perturbation at a singular frequency to find the impedance response at that frequency before repeating the process at additional frequencies until the test is complete. However, if the impedance system is considered a linear time invariant system, due to the additive properties of linearity, a single perturbation with multiple frequency components can be used to find the system behavior at each of the represented frequencies. According to harmonic theory, any step function can be used to extract impedance information from a range of frequencies. The impedance response found in this manner will have different resolutions at different frequencies depending on the duration of the impulse to the system with longer pulses naturally having a higher resolution of the system’s low frequency behavior and shorter pulses providing higher accuracy of the system’s high frequency behavior. This method of finding the impedance response of a system is already employed in cases where the use of an impedance analyzer, or other application of the traditional method, is impractical, such as for long transmission lines and large machines [34,35].

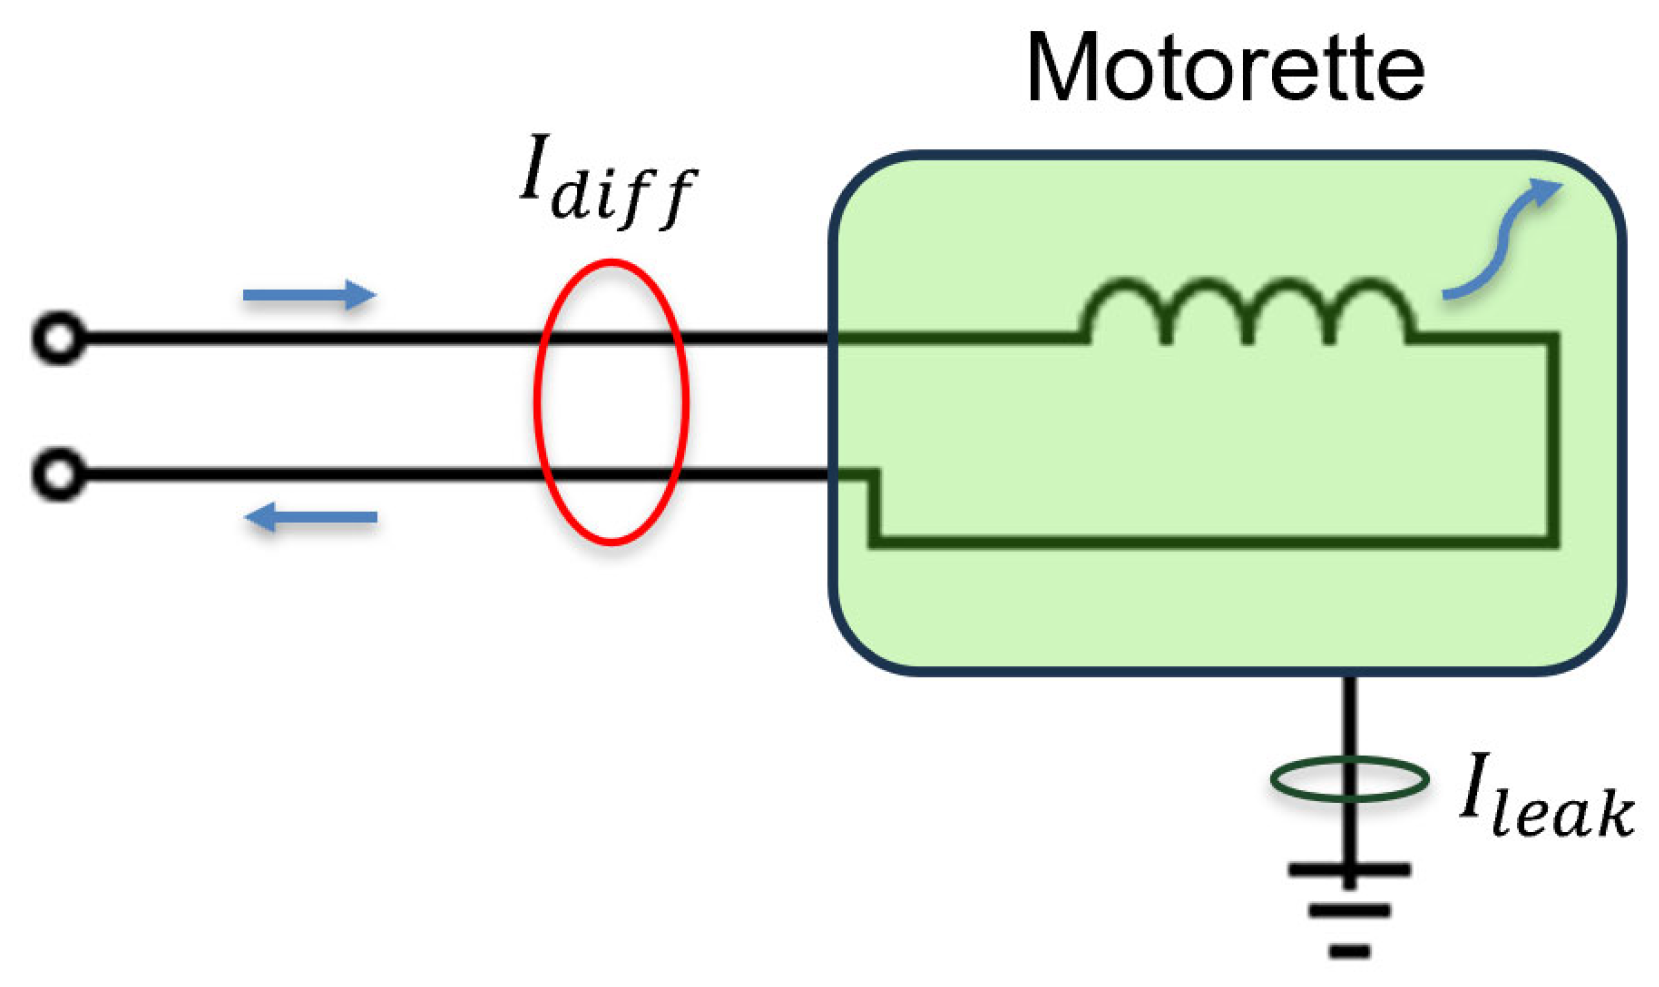
5.3. SOH Monitoring Techniques

Measures for finding the current state of health (SoH) of motor winding insulation have been largely established for several years with tan delta, power factor, insulation resistance, and dissipation factor testing being longstanding methods for finding and tracking the changes of insulation behavior and health [36,37]. Recently there has been a shift towards online SoH tracking that seeks to monitor changes to the insulation without the need for specialized equipment or downtime [38,39,40,41], which can be especially valuable for traction motors [42]. The most widely accepted of these methods is the online measurement of the dissipation factor and insulation capacitance, which are both found from the GW leakage current and excitation voltage of the coil [23,43,44,45,46]. The GW leakage current can be found in one of two ways: by either tracking the current flowing from the motorette to the system ground through a grounding wire, or by taking the differential current of the coil. Both topologies for measuring the leakage current are shown in Figure 13.
While either method is viable for finding the insulation leakage current, for this work it was decided to directly measure the leakage current with a grounding wire connected to the motorette core. This method was selected due to the simplicity of setup and its improved resistance to system noise. This method, however, is not practical for all applications as the core must be isolated from the ground allowing for the installation of a grounding wire, and in a multiphase system a ground wire current measurement would capture the sum of the leakage current for all phases. After the leakage current is found, it can be broken into resistive and capacitive components, as shown in Figure 14, and then used to solve for the GW capacitance as a function of capacitive current, Ic, excitation voltage, Vex and frequency as in (9).
C e q ω = I C ω · V e x
Another proposed method for analyzing the SoH of the insulation is the high frequency transient oscillations of the coil system after a transient perturbation [47,48,49]. As the HF current behavior of the coil is a factor of the parasitic linking between the winding-to-winding and winding-to-ground, its behavior will change as the parasitic linking changes. This means the HF behavior can be trended to track the deterioration of the insulation lifetime with use. Furthermore, as the HF coil behavior includes the coil-to-coil parasitic linking, this method allows for the turn-to-turn (TT) insulation SoH to also be monitored. This method can utilize either the current input to the system or the coil leakage current, both of which will be explored later.
The process proposed by Nussbaumer [42] consists of tracking the current immediately after a switching transient occurs. If the coil input current is used, the mean derivative of the current is removed to isolate the HF behavior of the system. For tracking the changes in the insulation behavior over time it has been proposed to employ the root mean square deviation (RMSD) to reduce the frequency trends to a singular SoH parameter that can be more readily trended over time that is referred to as an insulation state indicator (ISI) [42].

5.4. Experimental Design

To experimentally represent deterioration of the coil insulation, two aging tests were used. The first method was designed to represent delamination and air-filled voids in the insulation and was used to validate the modeling approach proposed earlier. To accomplish this, the exterior insulation along the bottom of turn 1 was milled down by 0.5 mm, as shown in Figure 15. A depth of 0.5 mm was selected to create a significant enough change to the impedance of the coil that it would be easily detected by both the experimental testbed and the corresponding model. While it is unrealistic for a coil to develop damage similar to this in the course of standard operation, incorrect installation of the coil could lead to a similar airgap as what is created by the removed section of the insulation.
The second experimental method was designed to test the SoH monitoring methods by subjecting coils to accelerated electrical and thermal aging. To do so, a new coil with the same geometry but only rated for 2400 V was energized with 10 kHz square waves with a DC bus of 4 kV, while the coil and motorette were heated to a controlled temperature. Two tests were conducted with a coil heated to 60 °C and 120 °C, respectively. For each test, the coil was aged for 200 h with the system de-energized and cooled every 50 h for supplemental data collection.

6. Results

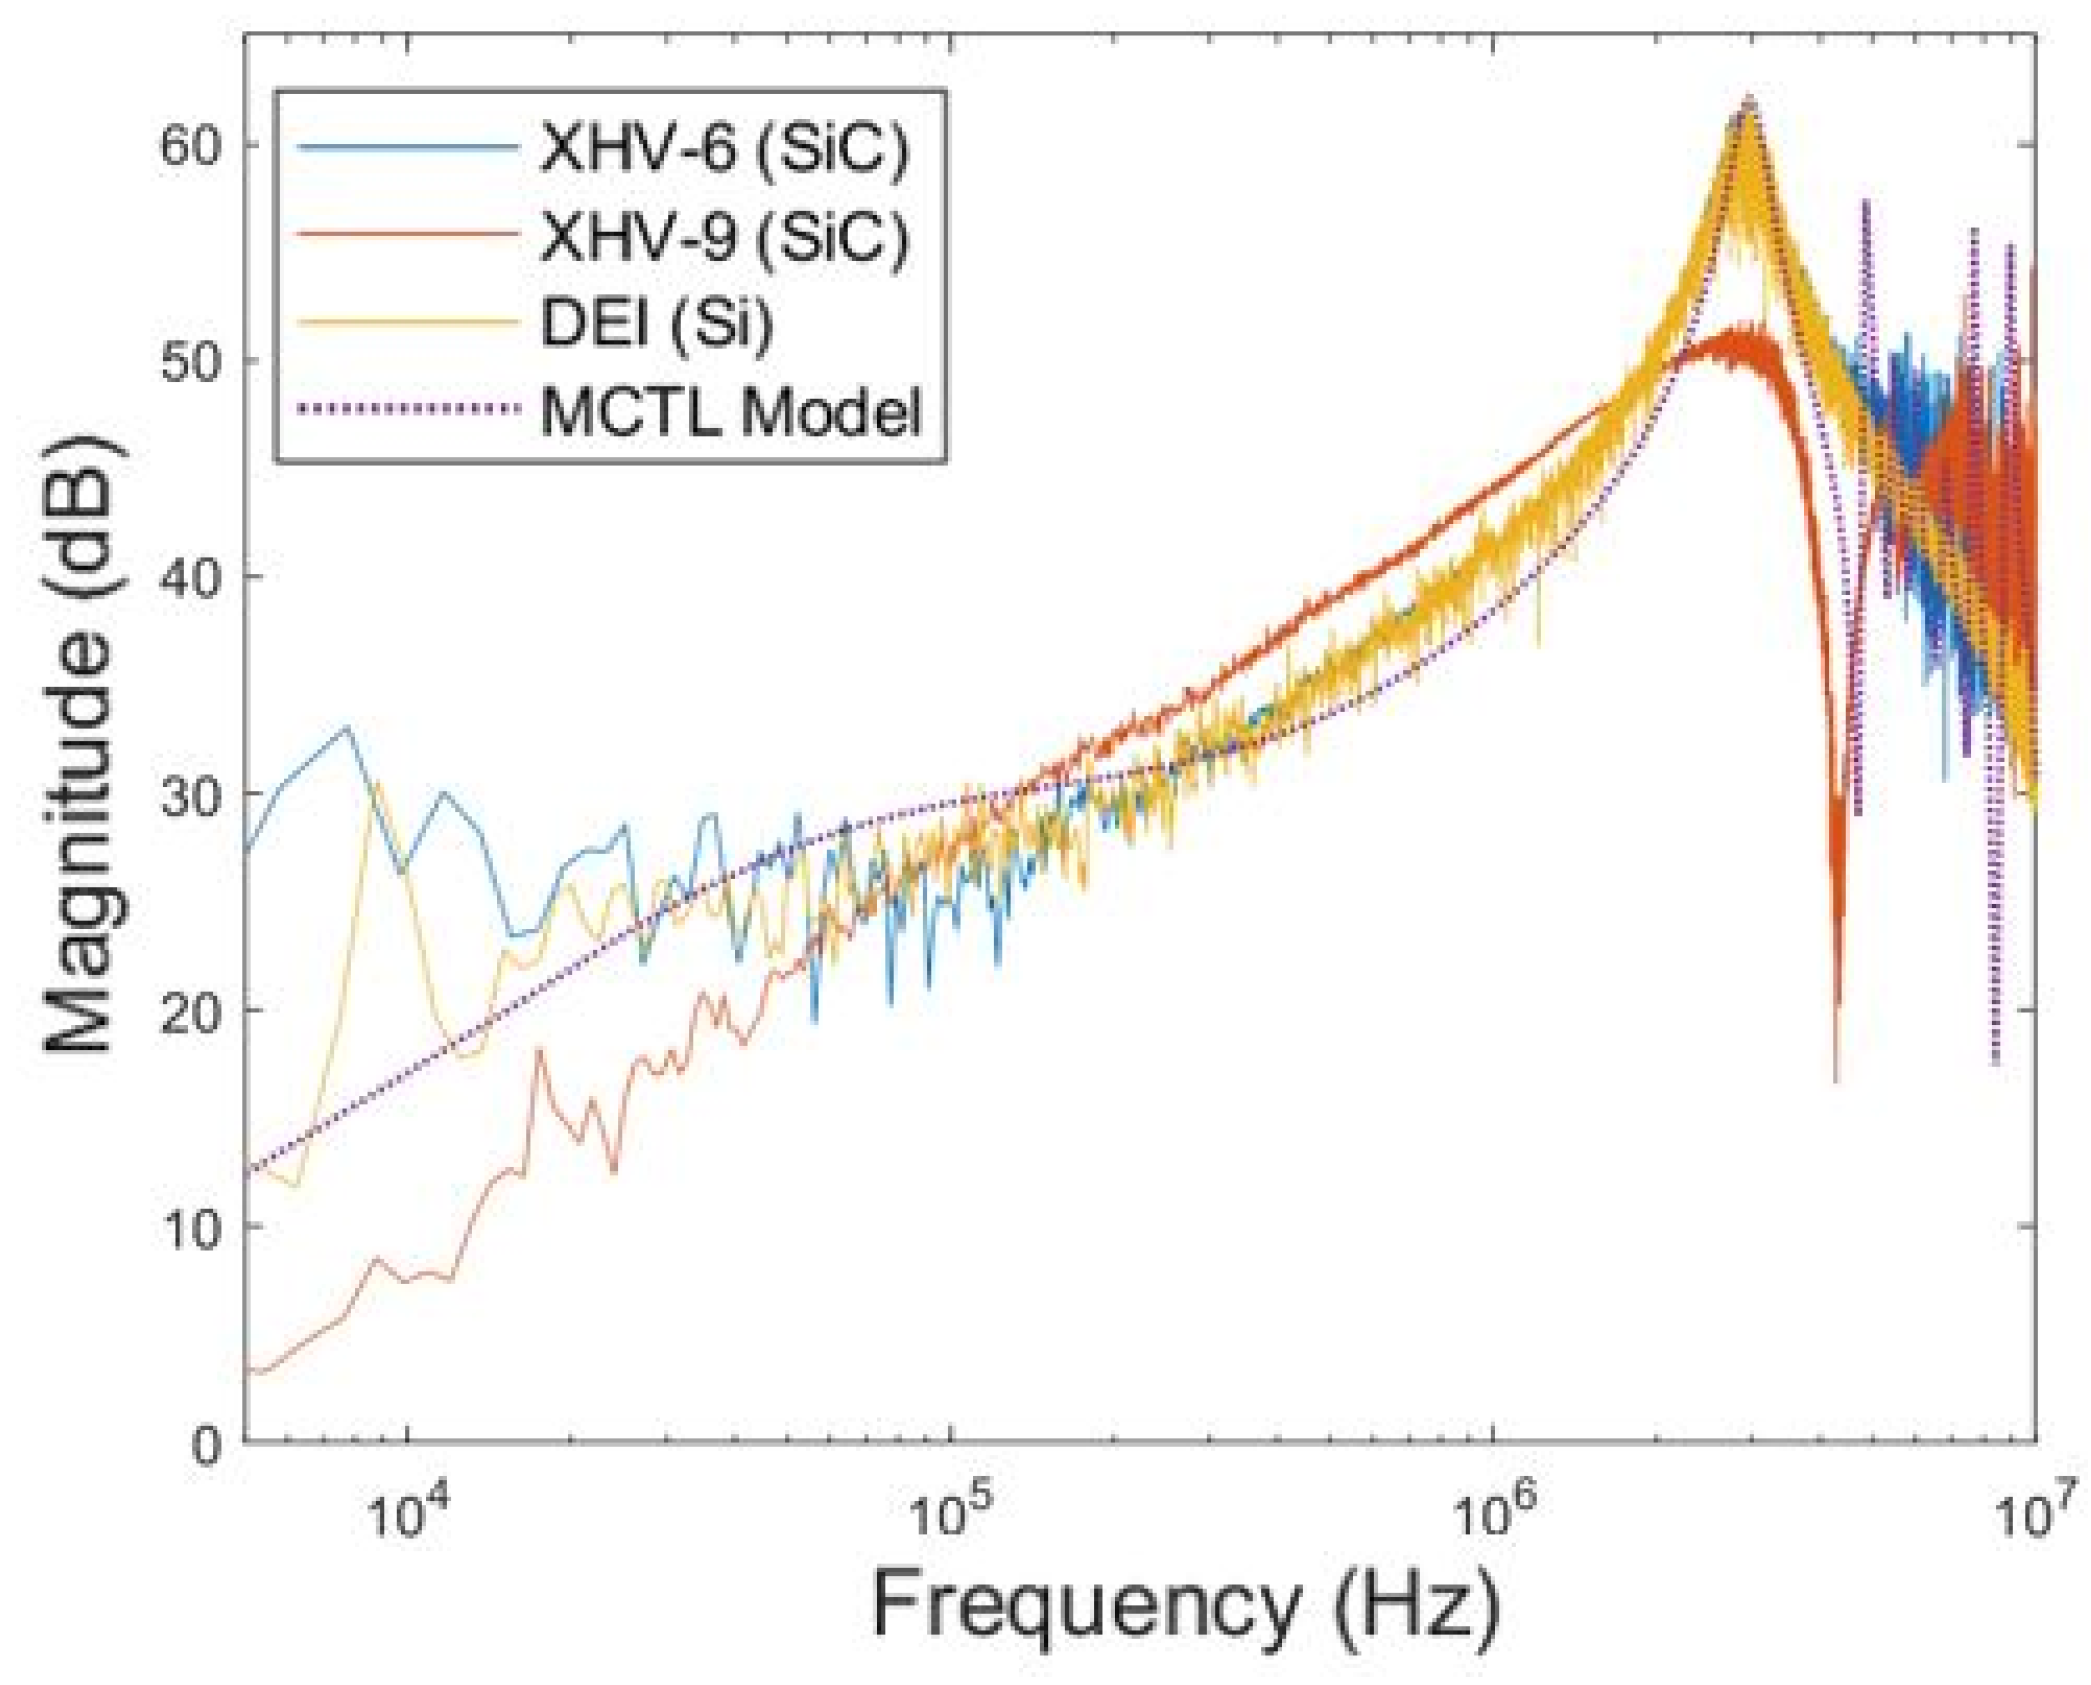
6.1. Model Validation Using Impedance Response

For the purpose of validating the model created of the motorette testbed, the impedance responses of the model and testbed were compared. The testbed impedance response was found by supplying the coil under test with a range of square wave impulses between 5 ms and 500 µs by changing the output frequency and duty cycle from the power module and is shown in Figure 16. Due to hardware limitations of the system level controller, pulses exceeding 5 ms and shorter than 500 µs were not tested. This process was conducted with pulse amplitudes of 480 V, 1 kV, and 4 kV, but no change was found in the impedance response. A handheld BK Precision 880 LCR meter was also used to measure the impedance at select frequencies.
As can be seen in Figure 16, there is close alignment between the impedance response of the model and the testbed results. The differences at lower frequencies are likely due to the upper limit on the pulse durations of 5 ms for the ETFE analysis as this limits the resolution of the lower frequency response data. Additionally, as the model only implements the 1 MHz mutual inductance and resistance it is expected that the model would have a more accurate representation at frequencies around 1 MHz. However, at frequencies above 5 MHz the model predictions become unstable due to simplifications in the modeling process, such as the simplification of skin effects and limits to the ladder circuit order. Additionally, for frequencies above 5 MHz, the noise level of the testbed produces distortion and uncertainty. Also of note is the diminished peak impedance of the testbed results of the XHV-9 in comparison to the XHV-6 and DEI results; this is due to the changes in the circuit topology discussed earlier that were done to increase stability of the power circuit.
After the general modeling process for a healthy coil was validated, the method for modeling the impact of air-filled voids and insulation delamination was validated using the milled coil discussed earlier. The changes to the impedance of the MCTL model with and without delamination are compared to the testbed results of the coil before and after the turn 1 insulation was milled down in Figure 17. As the XHV-9 testbed was used for testing, the peak impedance is diminished; thus, a direct comparison of the undamaged and 0.5 mm milled impedances cannot be made. Nonetheless it can still be observed that both the MCTL model and the testbed results experienced equivalent peak shifts with the resonant frequency changing from approximately 2.97 MHz to 3.06 MHz with a gain increase of about 0.6 dB. As can be understood from the analytical impedance model of a ladder circuit, both the MCTL model and the testbed experienced a reduction of the GW capacitance of the same amount; this is in line with expectations based on dielectric theory, thus validating the modeling approach for insulation abnormalities.

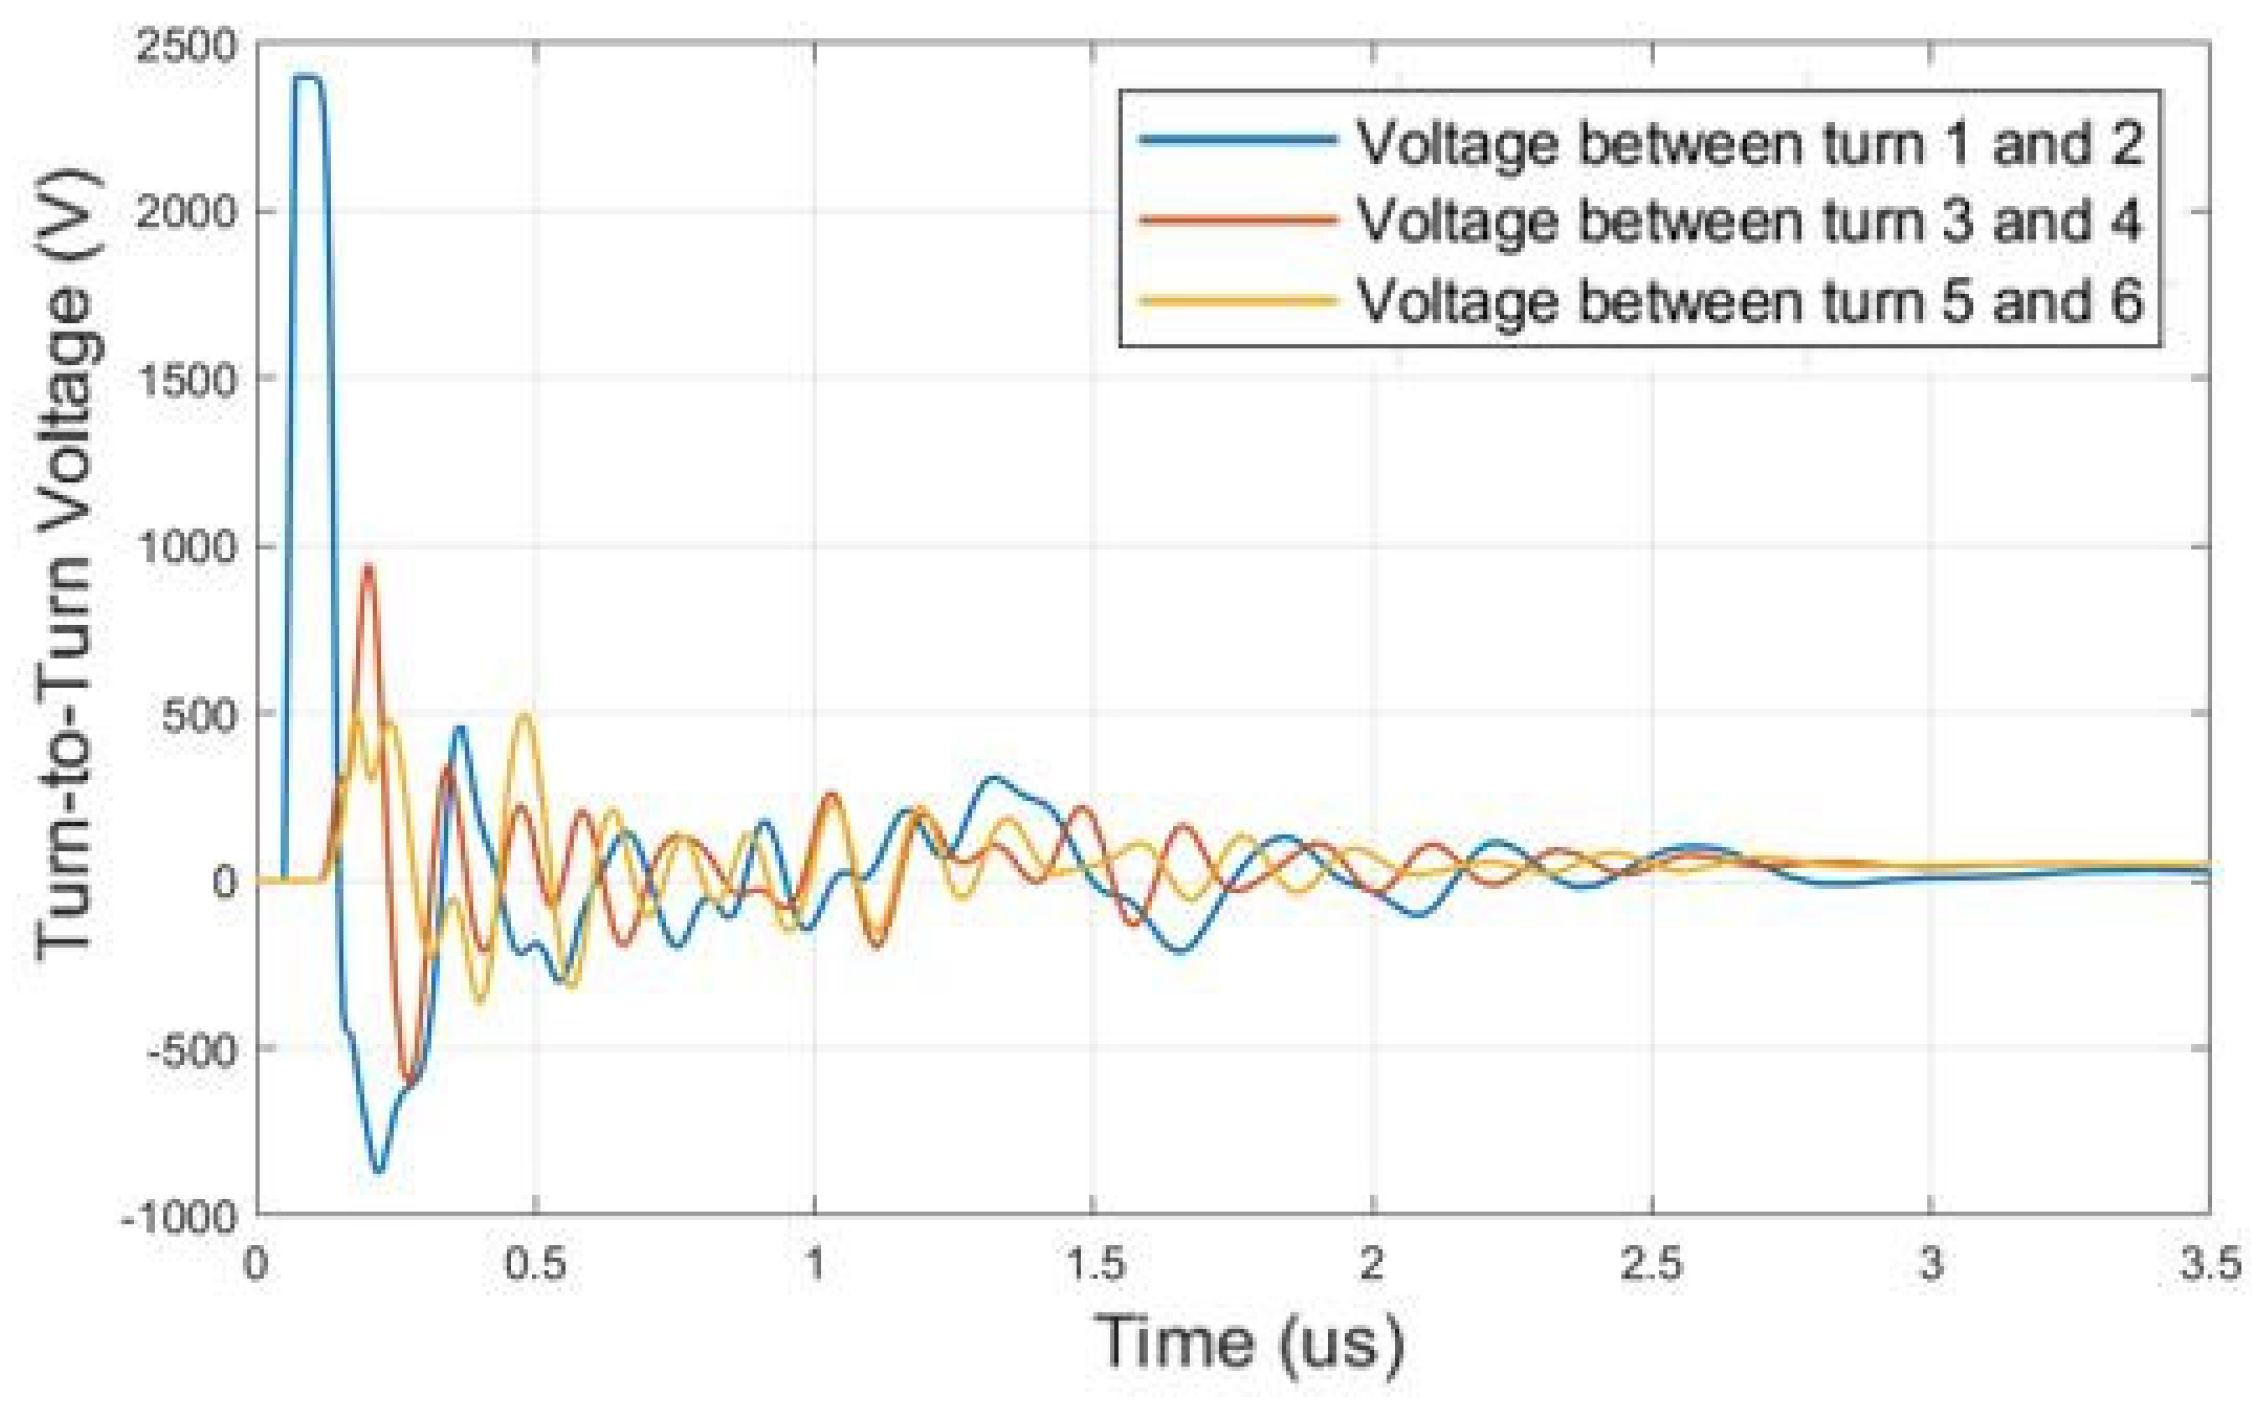
6.2. Simulation of the Overvoltage Phenominom and Voltage Distribution of the Coils

With the impedance response of the MCTL model validated through comparison to testbed results it is possible to use the proposed single coil model to simulate the response of a full phase of a stator winding. To do so, a simulation model was created that consists of eight coils placed in series. The coils are connected to a pulse generator with a 2 m lossy transmission line whose p.u. impedance was modeled to reflect the cable used on the testbed. Additionally, it is assumed that the neutral point of the machine is grounded, thus the output of the last coil model is also grounded. The impulse response of the simulation model when excited with a 100 kHz impulse with an amplitude of 2400 V and a rise time of 20 ns is shown in Figure 18. It can be clearly seen that the voltage of the first coil experiences the highest overshoot and a higher frequency oscillation than the other coils; this is expected for a setup with a grounded nutral point. Because this simulation is designed to reflect a more real world application instead of a worst case scenario (i.e., long cables with a high impedance mismatch), the voltage overshoot at coil 1 is only 22.88%. However, when the simulation was repeated with a 100 ns rise time to represent operation by a Si inverter, the overshoot was limited to 7.5%, meaning the SiC operation represented a three times increase in the percent overvoltage.
As discussed above, another key area of concern for modeling the electrical stress placed in stator insulation is the voltage difference between adjacent conductors. The voltage differences between turns 1 and 2, 3 and 4, and 5 and 6 for the first coil using the same simulation setup as described above are shown in Figure 19. Due to the fixed nature of the turn positions within a form wound coil, the potential issue of the first and last turns becoming adjacent is never an issue; nonetheless, the TT insulation can still experience high voltage potentials especially near the machine terminals. Figure 19 illustrates that for a brief period of every cycle, the TT insulation between turns 1 and 2 experiences the full electric potential of the DC bus voltage. To further investigate this, the proposed method of using the turn voltages from the MCTL model as an impetus for the FEM model can be employed as is discussed below.

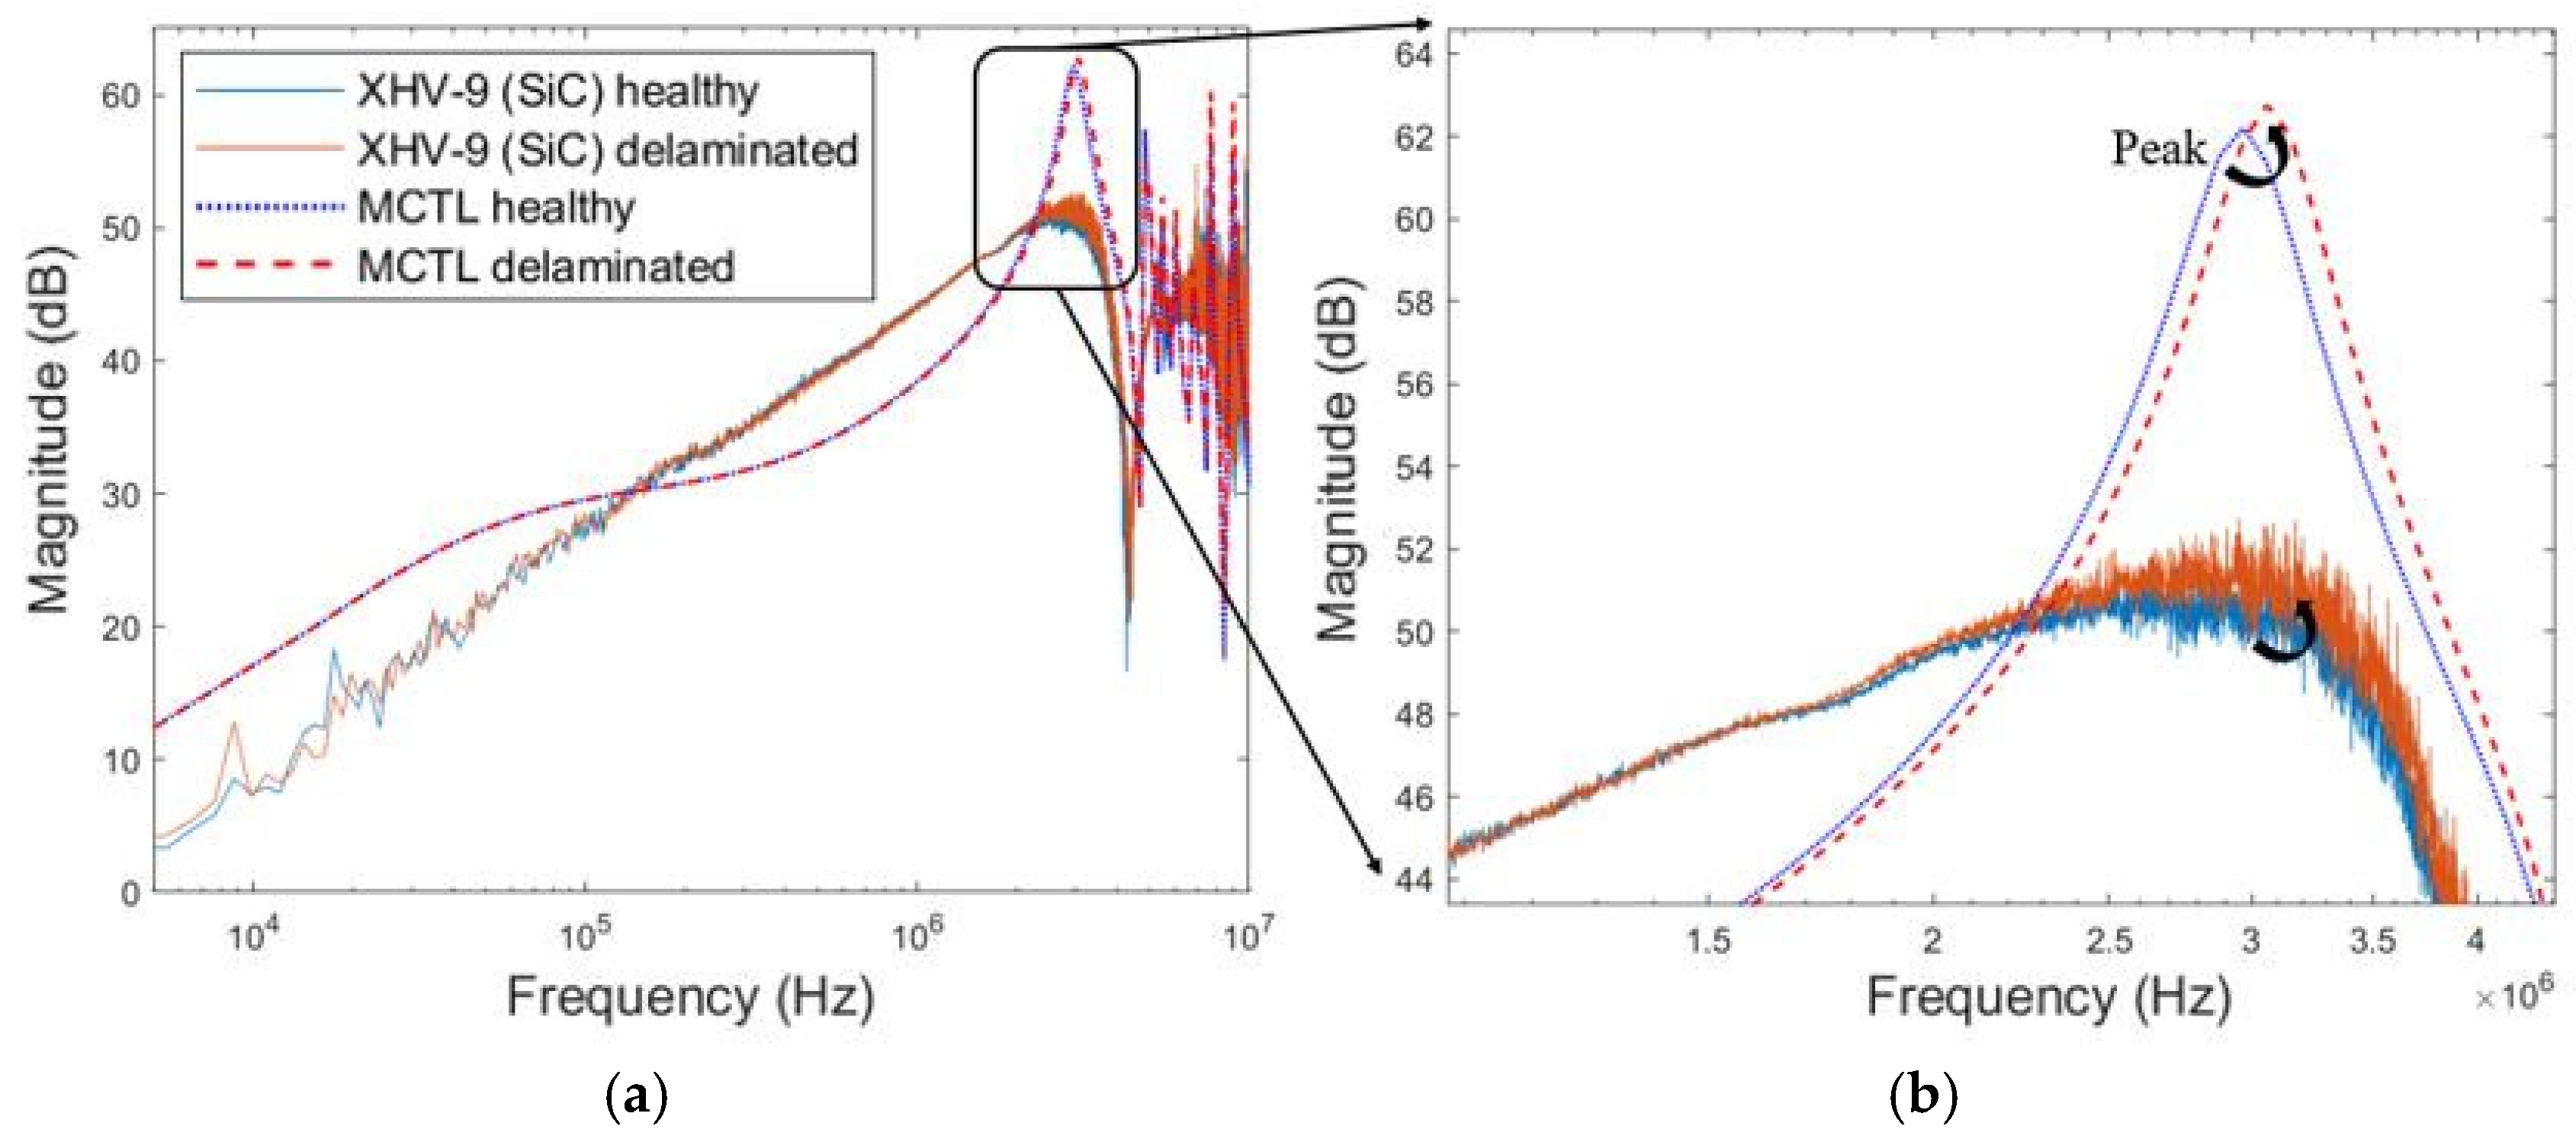
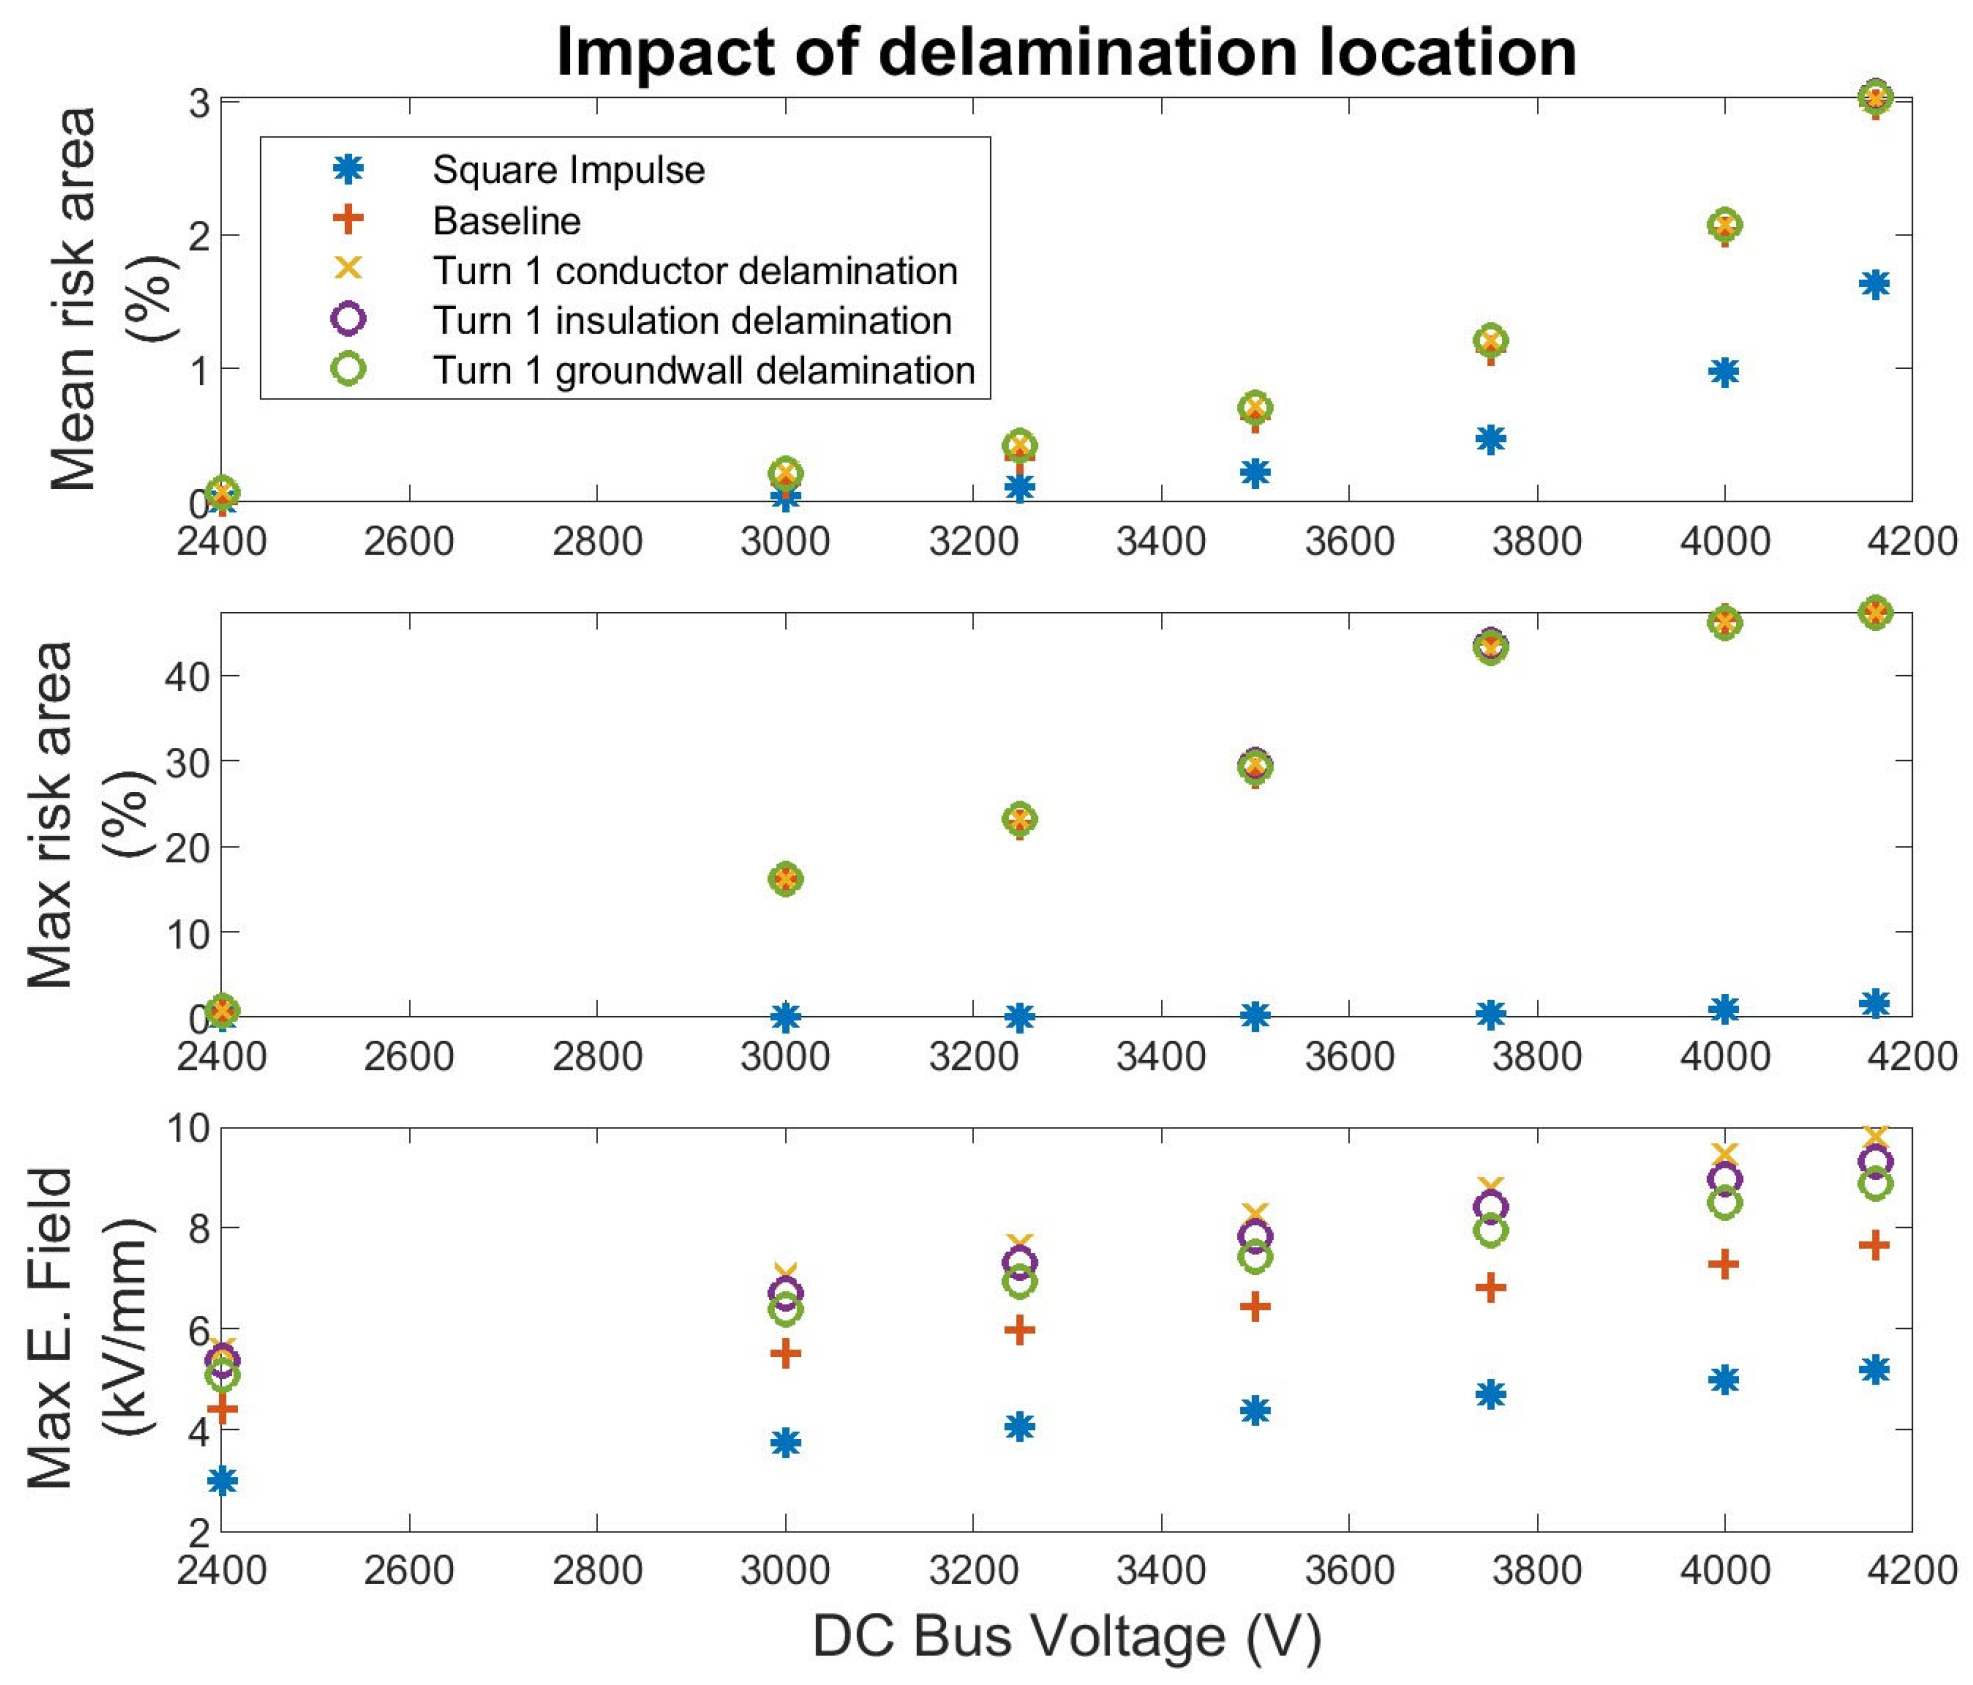
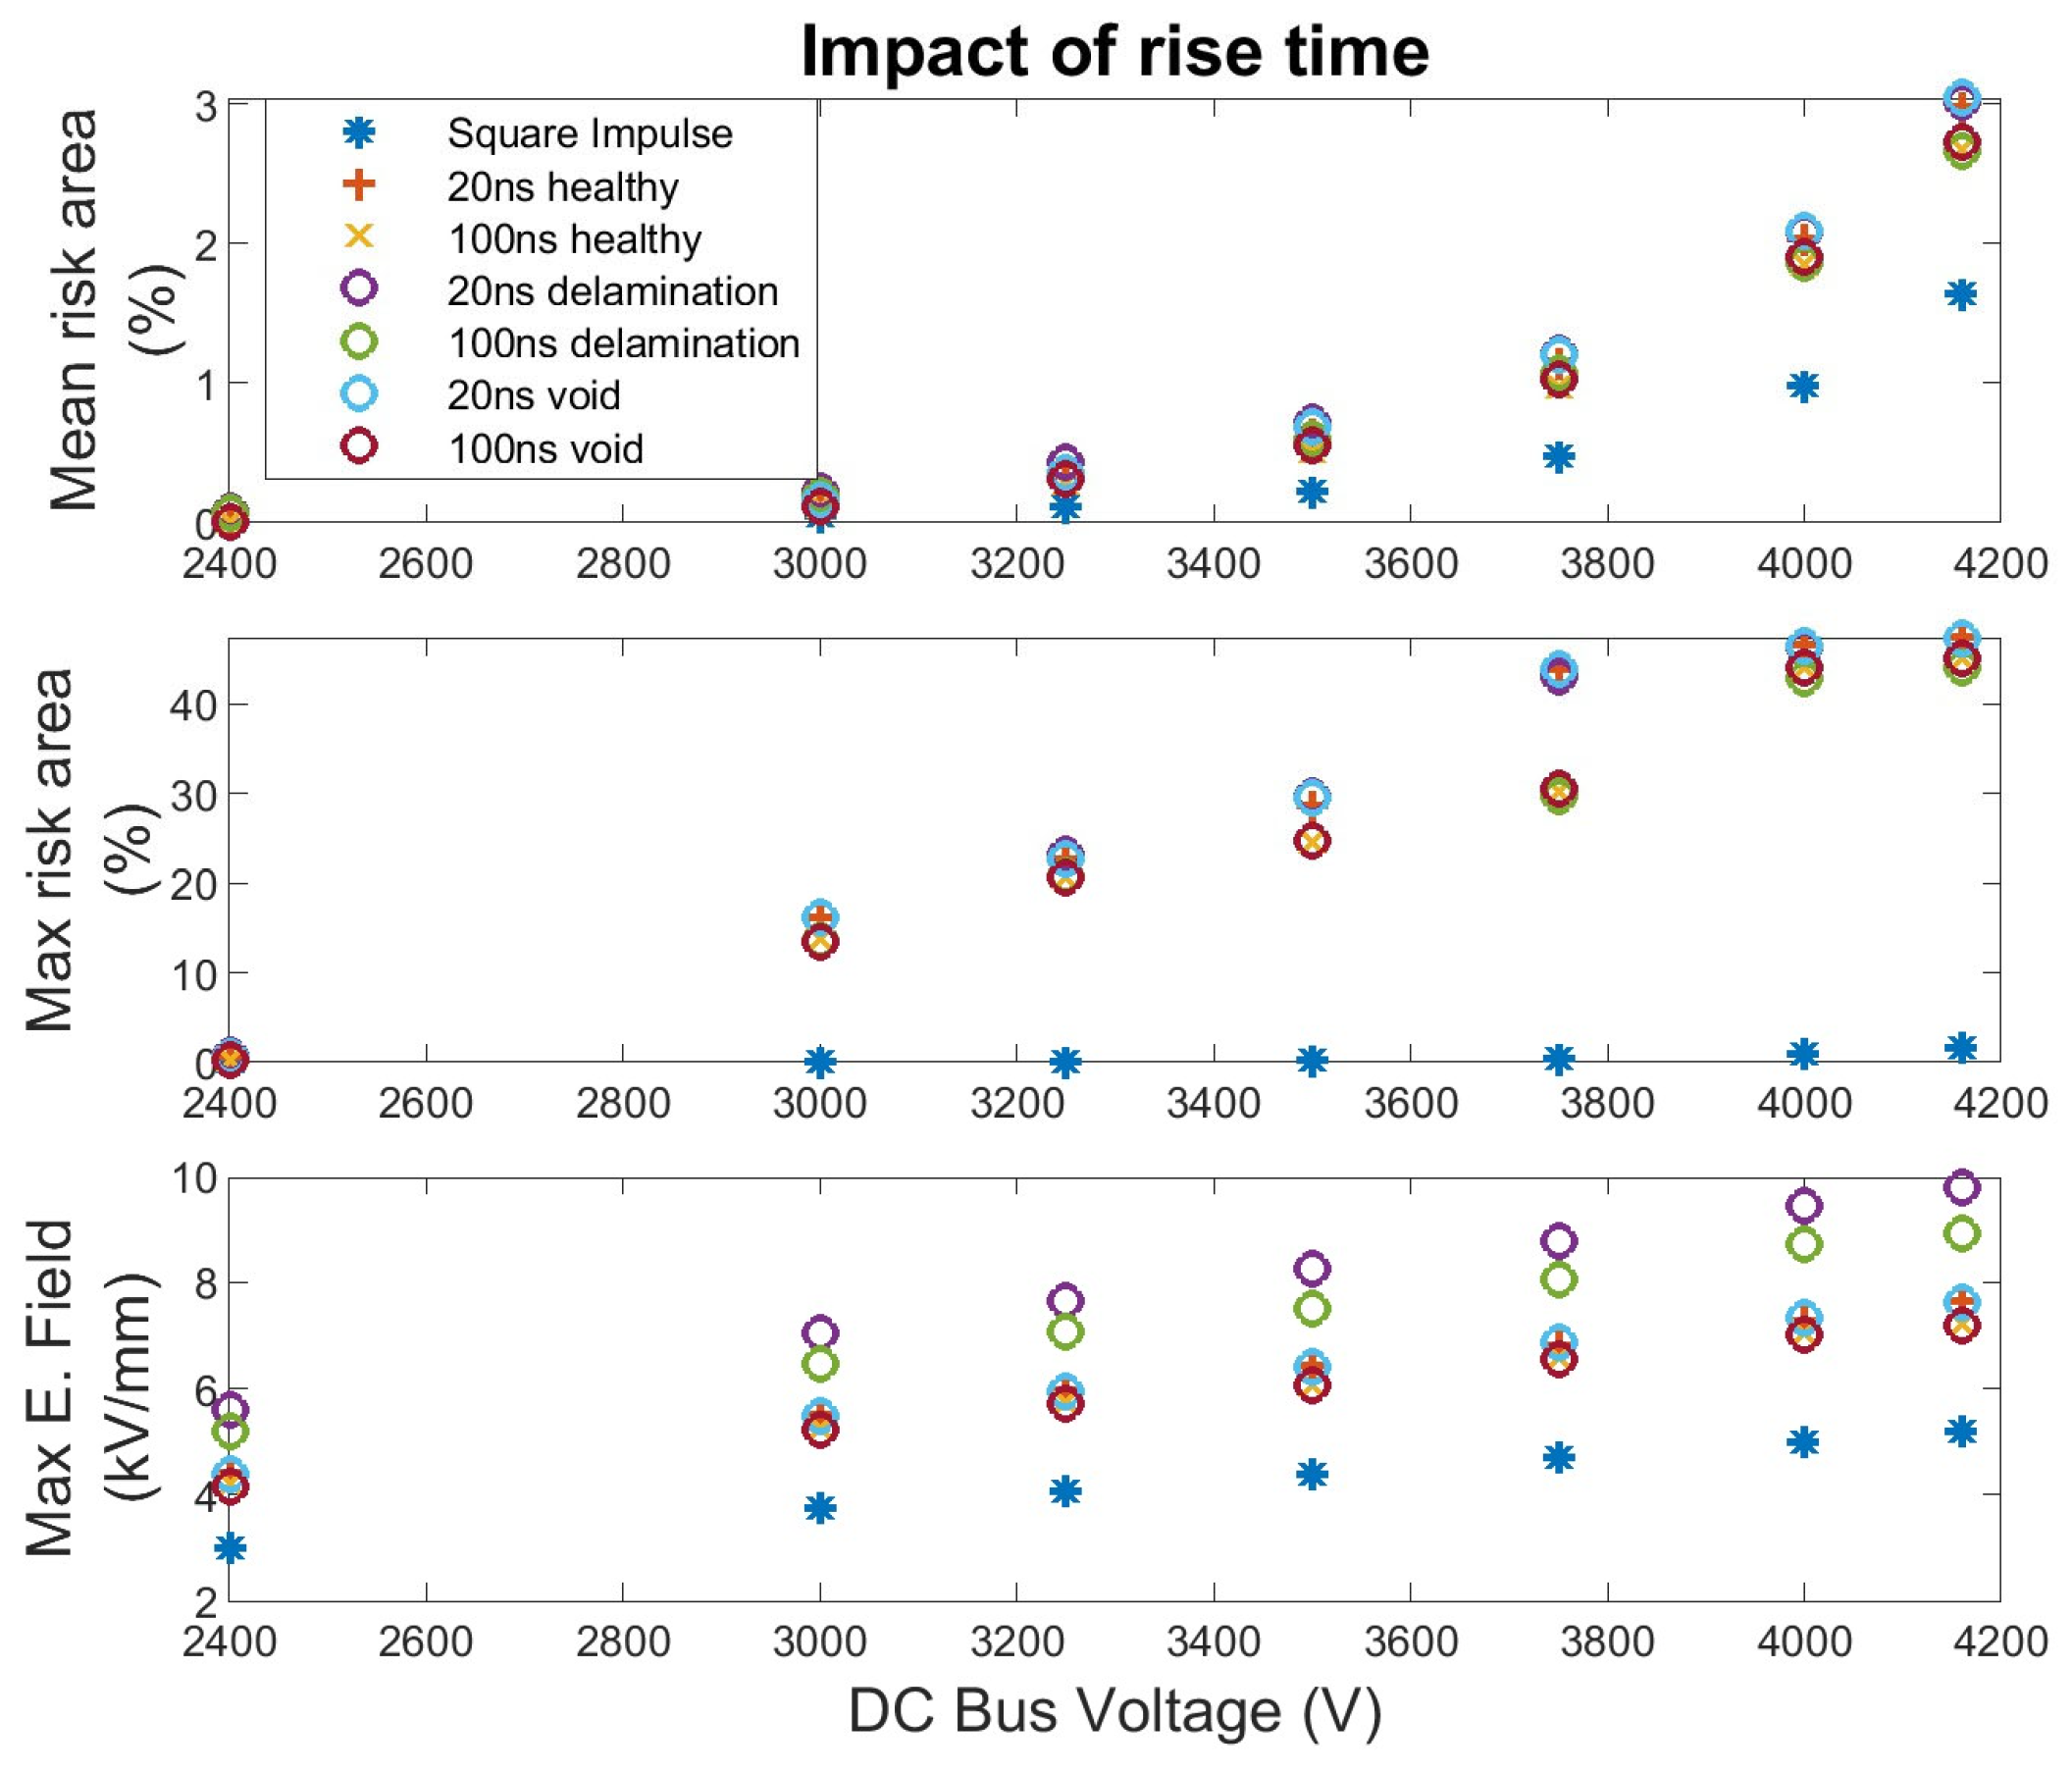
6.3. Modeling the Impact of Delaminations on Electrical Stress

After the modeling process is validated both for a healthy system and a system with air-filled voids within the insulation, the modeling process can be expanded to investigate additional testcases and the resulting electrical stress on the insulation in greater detail by importing the conductor voltages into the COMSOL model as described earlier. For this work, the primary area of interest of the COMSOL voltage distribution model is the areas of the insulation experiencing electric field densities exceeding 3 kV/mm. This threshold for electrical stress was selected because prior studies have found that insulation experiences accelerated aging and partial discharge behavior at this level, thus an electric field density of 3 kV/mm or more is considered high stress [50]. For these tests the baseline is a coil without damage to the insulation that experiences a 20 kHz excitation wave with a rise time of 20 ns. These results were also compared to the electric stress estimations if it is assumed that the coil is energized with an ideal voltage square wave with no overvoltage; this was done to illustrate the importance of modeling the actual coil voltages. The simulations conducted that do not consider the overvoltage phenomenon are marked as Square Impulse. Additionally, simulations were run with rise times of 100 ns to represent the electric stress on the insulation that would be created if the coil was operated by a Si inverter. The tests discussed are focused on impulses with a DC bus ranging from 2400 V to 4160 V as it was found that coils with voltages in this region experienced the most transient behavior.
The first simulation was to investigate the impact of the location of a delamination on the insulation stress. A delamination was modeled adjacent to the turn 1 conductor, at the midpoint between the conductor and the GW, and adjacent to the GW; the results of this simulation are shown in Figure 20. The figure shows the mean percent of the insulation that exceeded the 3 kV/mm threshold over the course of a full impulse, the maximum instantaneous area of the insulation above the damage threshold, and the maximum electric field present in the insulation over the impulse cycle. As can be seen across all stress factors considered, the modeling approach proposed by this work predicts higher insulation stress than a model which neglects the transmission line behavior of the coil. This disparity is increasingly prevalent as the excitation voltage of the system increases.
The presence of a delamination in the insulation increases the maximum electric field experienced by the insulation with the maximum field increasing proportionally to the proximity of the delamination to the conductor. This relationship was also consistent for the mean percent of the insulation area exceeding 3 kV/mm. The presence of a delamination increased the mean area under high stress with this area further increased as the delamination is moved closer to the conductor. However, these changes were not as impactful as those to the maximum electric field that had an increase in the electric field maximum of about 23%, while the percent difference of the mean stressed area between the healthy model and a delaminated model was ~5%.
This is expected as the maximum electric field within the insulation is heavily dependent on the overvoltage oscillations and local electric fields within only a small part of the insulation, the immediate area surrounding the maxima; thus, even a small change to the insulation can have a profound impact. By contrast the maximum and mean areas of the insulation experiencing high stress both consider the entire insulation area, making them more desensitized to small changes, such as a void or delamination.
The trend of an increase in severity of the stress metric for delamination closer to the conductor that was observed, with both the maximum electric field and mean area of insulation exceeding 3 kV/mm, was also true for the maximum instantaneous percent of the insulation that exceeded the damage threshold for voltages less than 3500 V. However, as the excitation voltage increases from 3500 V to voltages up to 4000 V the behavior shifts such that proximity of a delamination to the conductor slightly reduces the maximum percent of the insulation area to experience fields above 3 kV/mm. This phenomenon was further investigated with Figure 21 illustrating why this behavior is occurring.
The figures show the electric field of the region around the left conductor of turn 1 when the model is excited with 3 kV, 3.5 kV, and 4 kV pulses when the insulation is both healthy and when there are delaminations present. The instant of the maximum electric field in this region is shown. Only those parts of the insulation experiencing electric fields of 3 kV/mm or more are shown for the sake of clearly illustrating the behavior.
The presence of the delamination concentrates the electric field density in the air-filled region. At lower voltages this region would not normally exceed 3 kV/mm (a); thus, the concentration created by the delamination increases that area to above the 3 kV/mm threshold when it would not normally. At voltages above 4 kV, the electric field saturation of the insulation is sufficiently high that even the reduction created by the field concentration inside the airgap does not lower the overall field bellow the 3 kV/mm threshold as seen in Figure 21c,f,i. However, for voltages between 3500 V and 4000 V, there is an area of the insulation that would normally exceed 3 kV/mm, but due to the field concentration is lowered to below the threshold. As this phenomenon is dependent on the electric field distribution within the insulation, position and size of the damage and voltage level of the surrounding conductors, the voltage level of occurrence and impact is expected to change for each application. This behavior should not be taken out of context by insinuating that a delamination can reduce the stress on the insulation as this is only a marginal change to one of the stress metrics tracked by this study; both of the other stress metrics show a sizable increase in severity with the presence of a delamination, most notably the maximum electric field within the insulation which has been studied at length in regards to its role in partial discharge activity.
Following this, simulations examining the impact of rise time on the insulation stress were performed. The model was simulated with a rise time of 20 ns to represent a SiC device and 100 ns to represent a Si device. Both were simulated with healthy insulation and with delamination and voids. A selection of results is shown in Figure 22. As is expected, based on overvoltage theory, tests with a 20 ns rise time experience noticeably increased stress across all test points when compared to equivalent tests with a 100 ns rise time. This clearly illustrates the increased stress placed on insulation by SiC operation when compared to Si operation for all test cases, thus necessitating the adaptation of stress prediction methods to account for a change from Si to SiC.
The impact of voids was also investigated and compared to the impact of delamination on the insulation. As detailed above, small circular air-filled voids were added to the southwest corner of the insulation near turns 1 and 7; the delamination condition considered for this test is a midpoint delamination. The results of these tests are shown in Figure 23. The presence of voids resulted in a slight increase in all three-stress metrics in comparison to the baseline non-damaged insulation model, but they did not have the same magnitude of impact as a delamination. This is expected because the overall area of insulation altered by a delamination is significantly larger than that of a void. The reduced area of voids also means that the phenomenon where the maximum area to exceed 3 kV/mm is decreased in the presence of a delamination for voltages between 3500 V and 4000 V is not as prevalent.

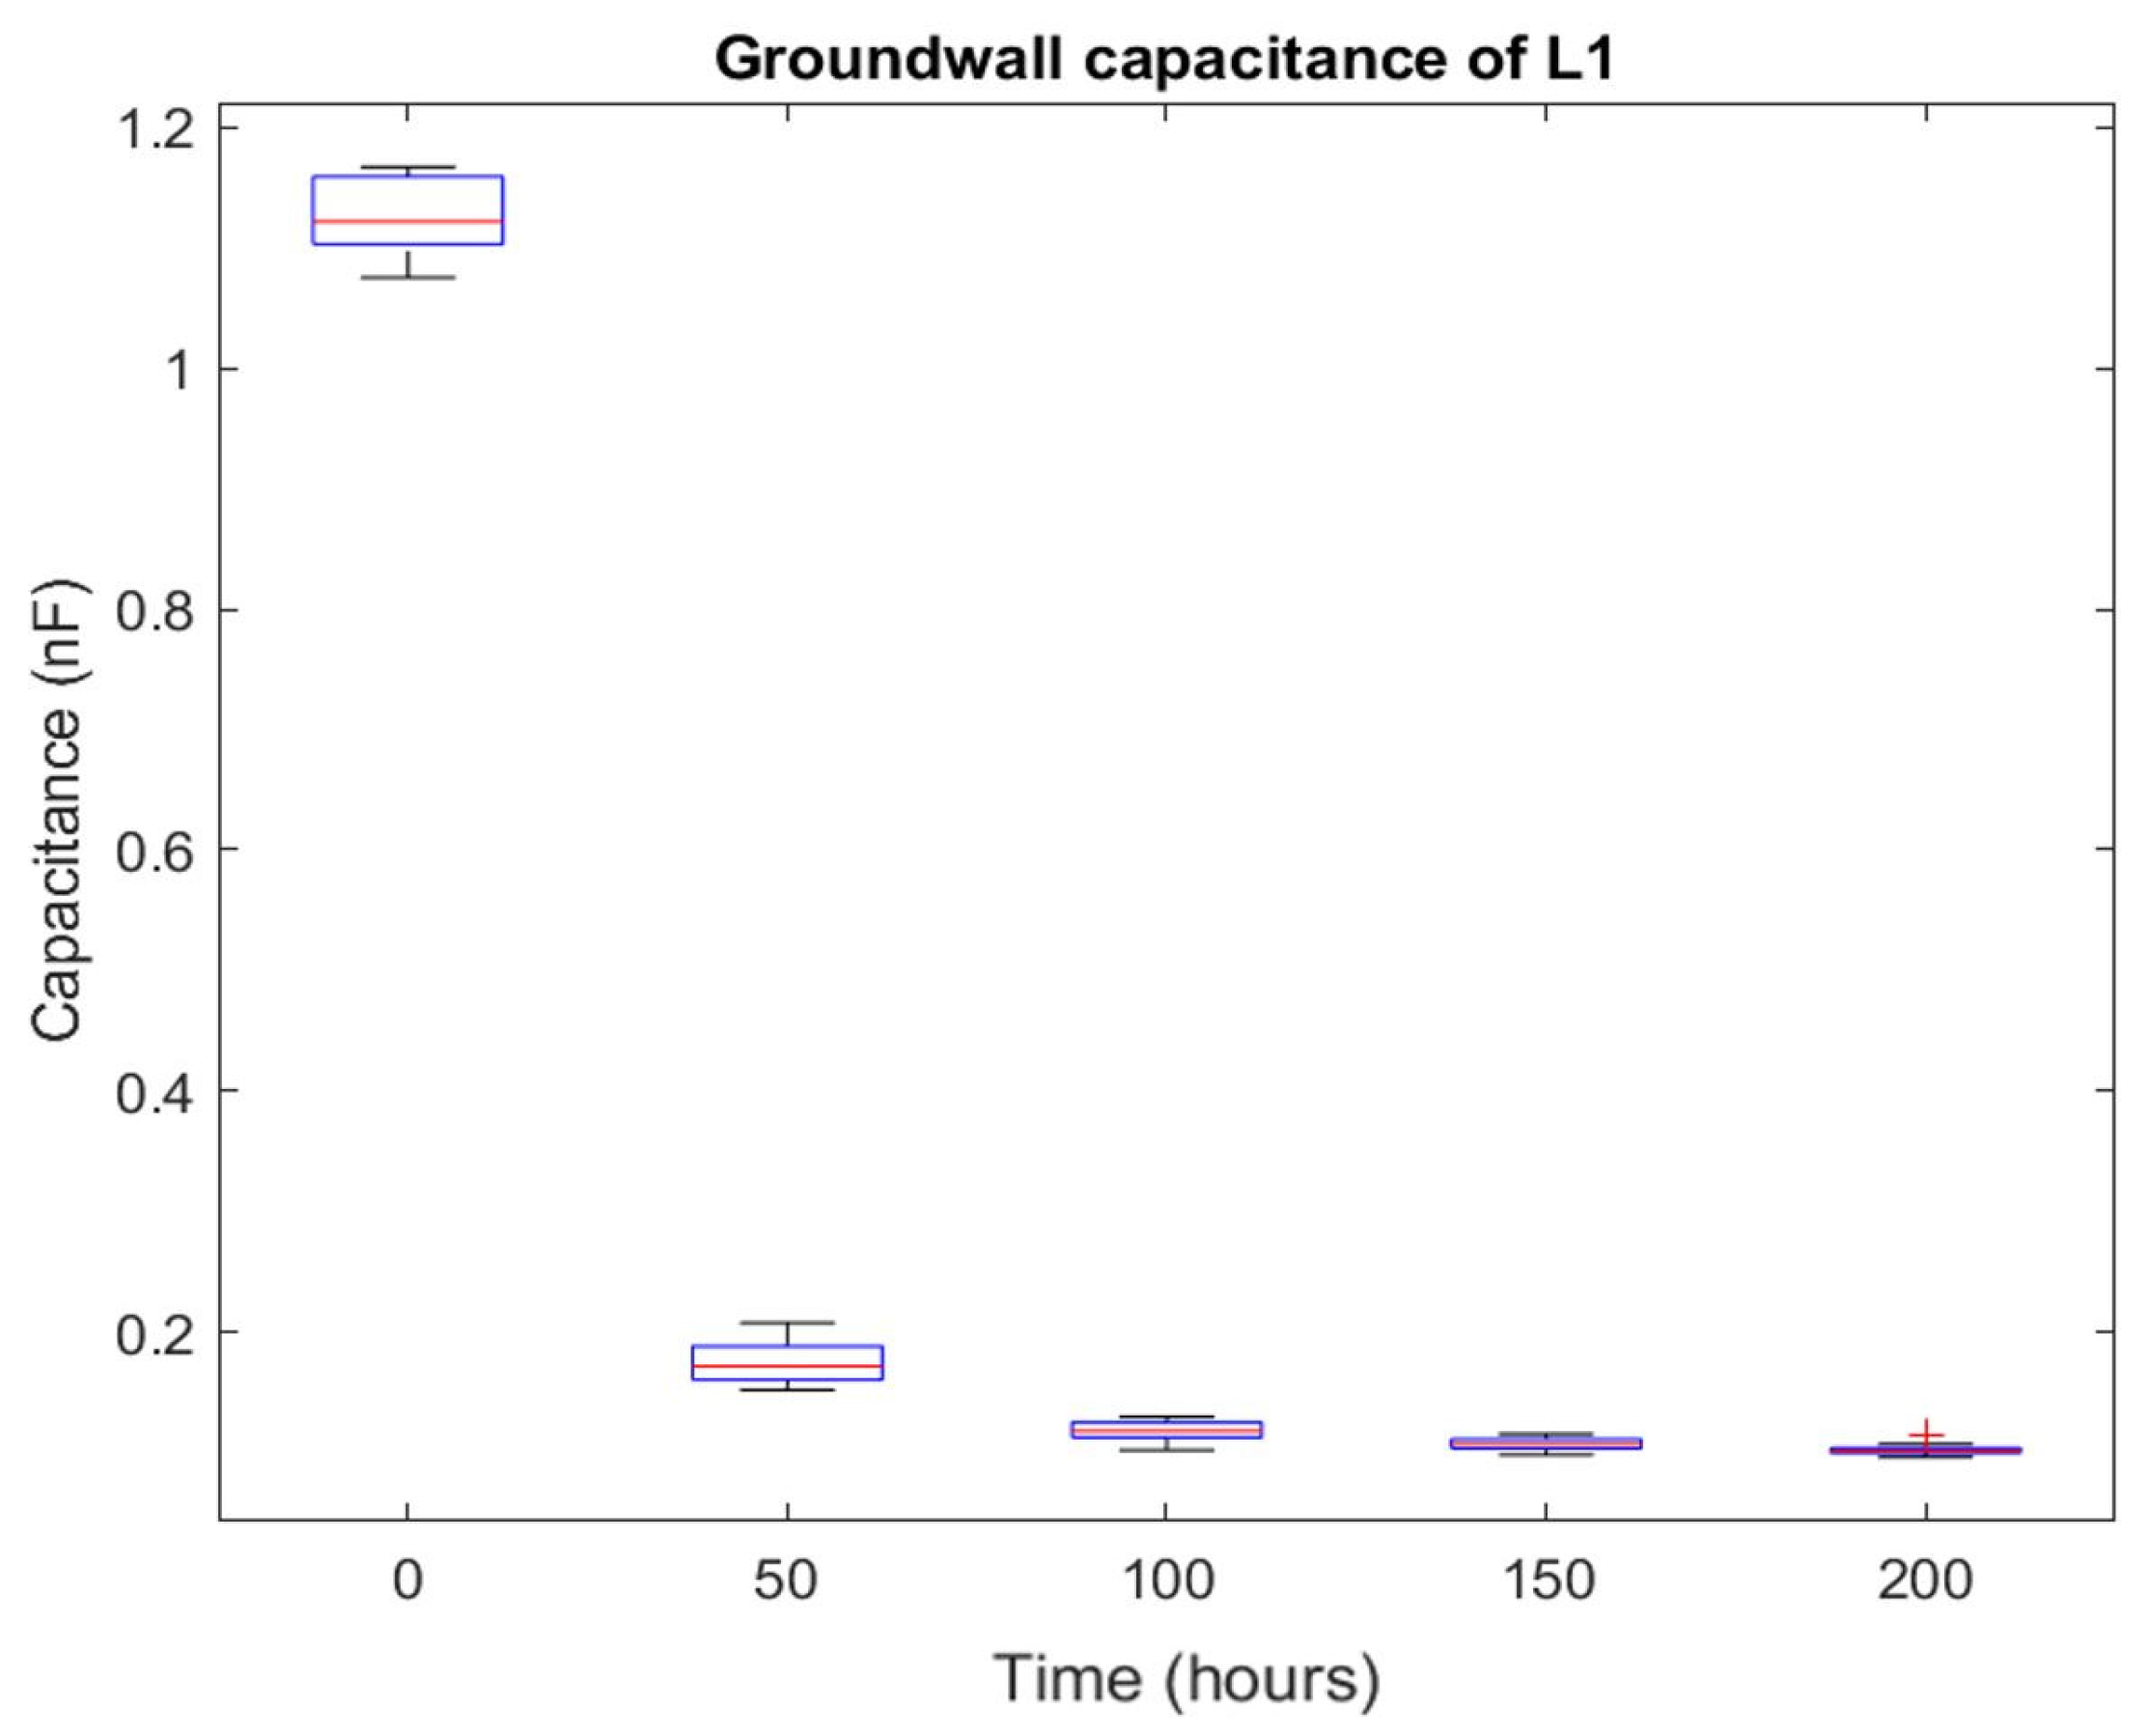
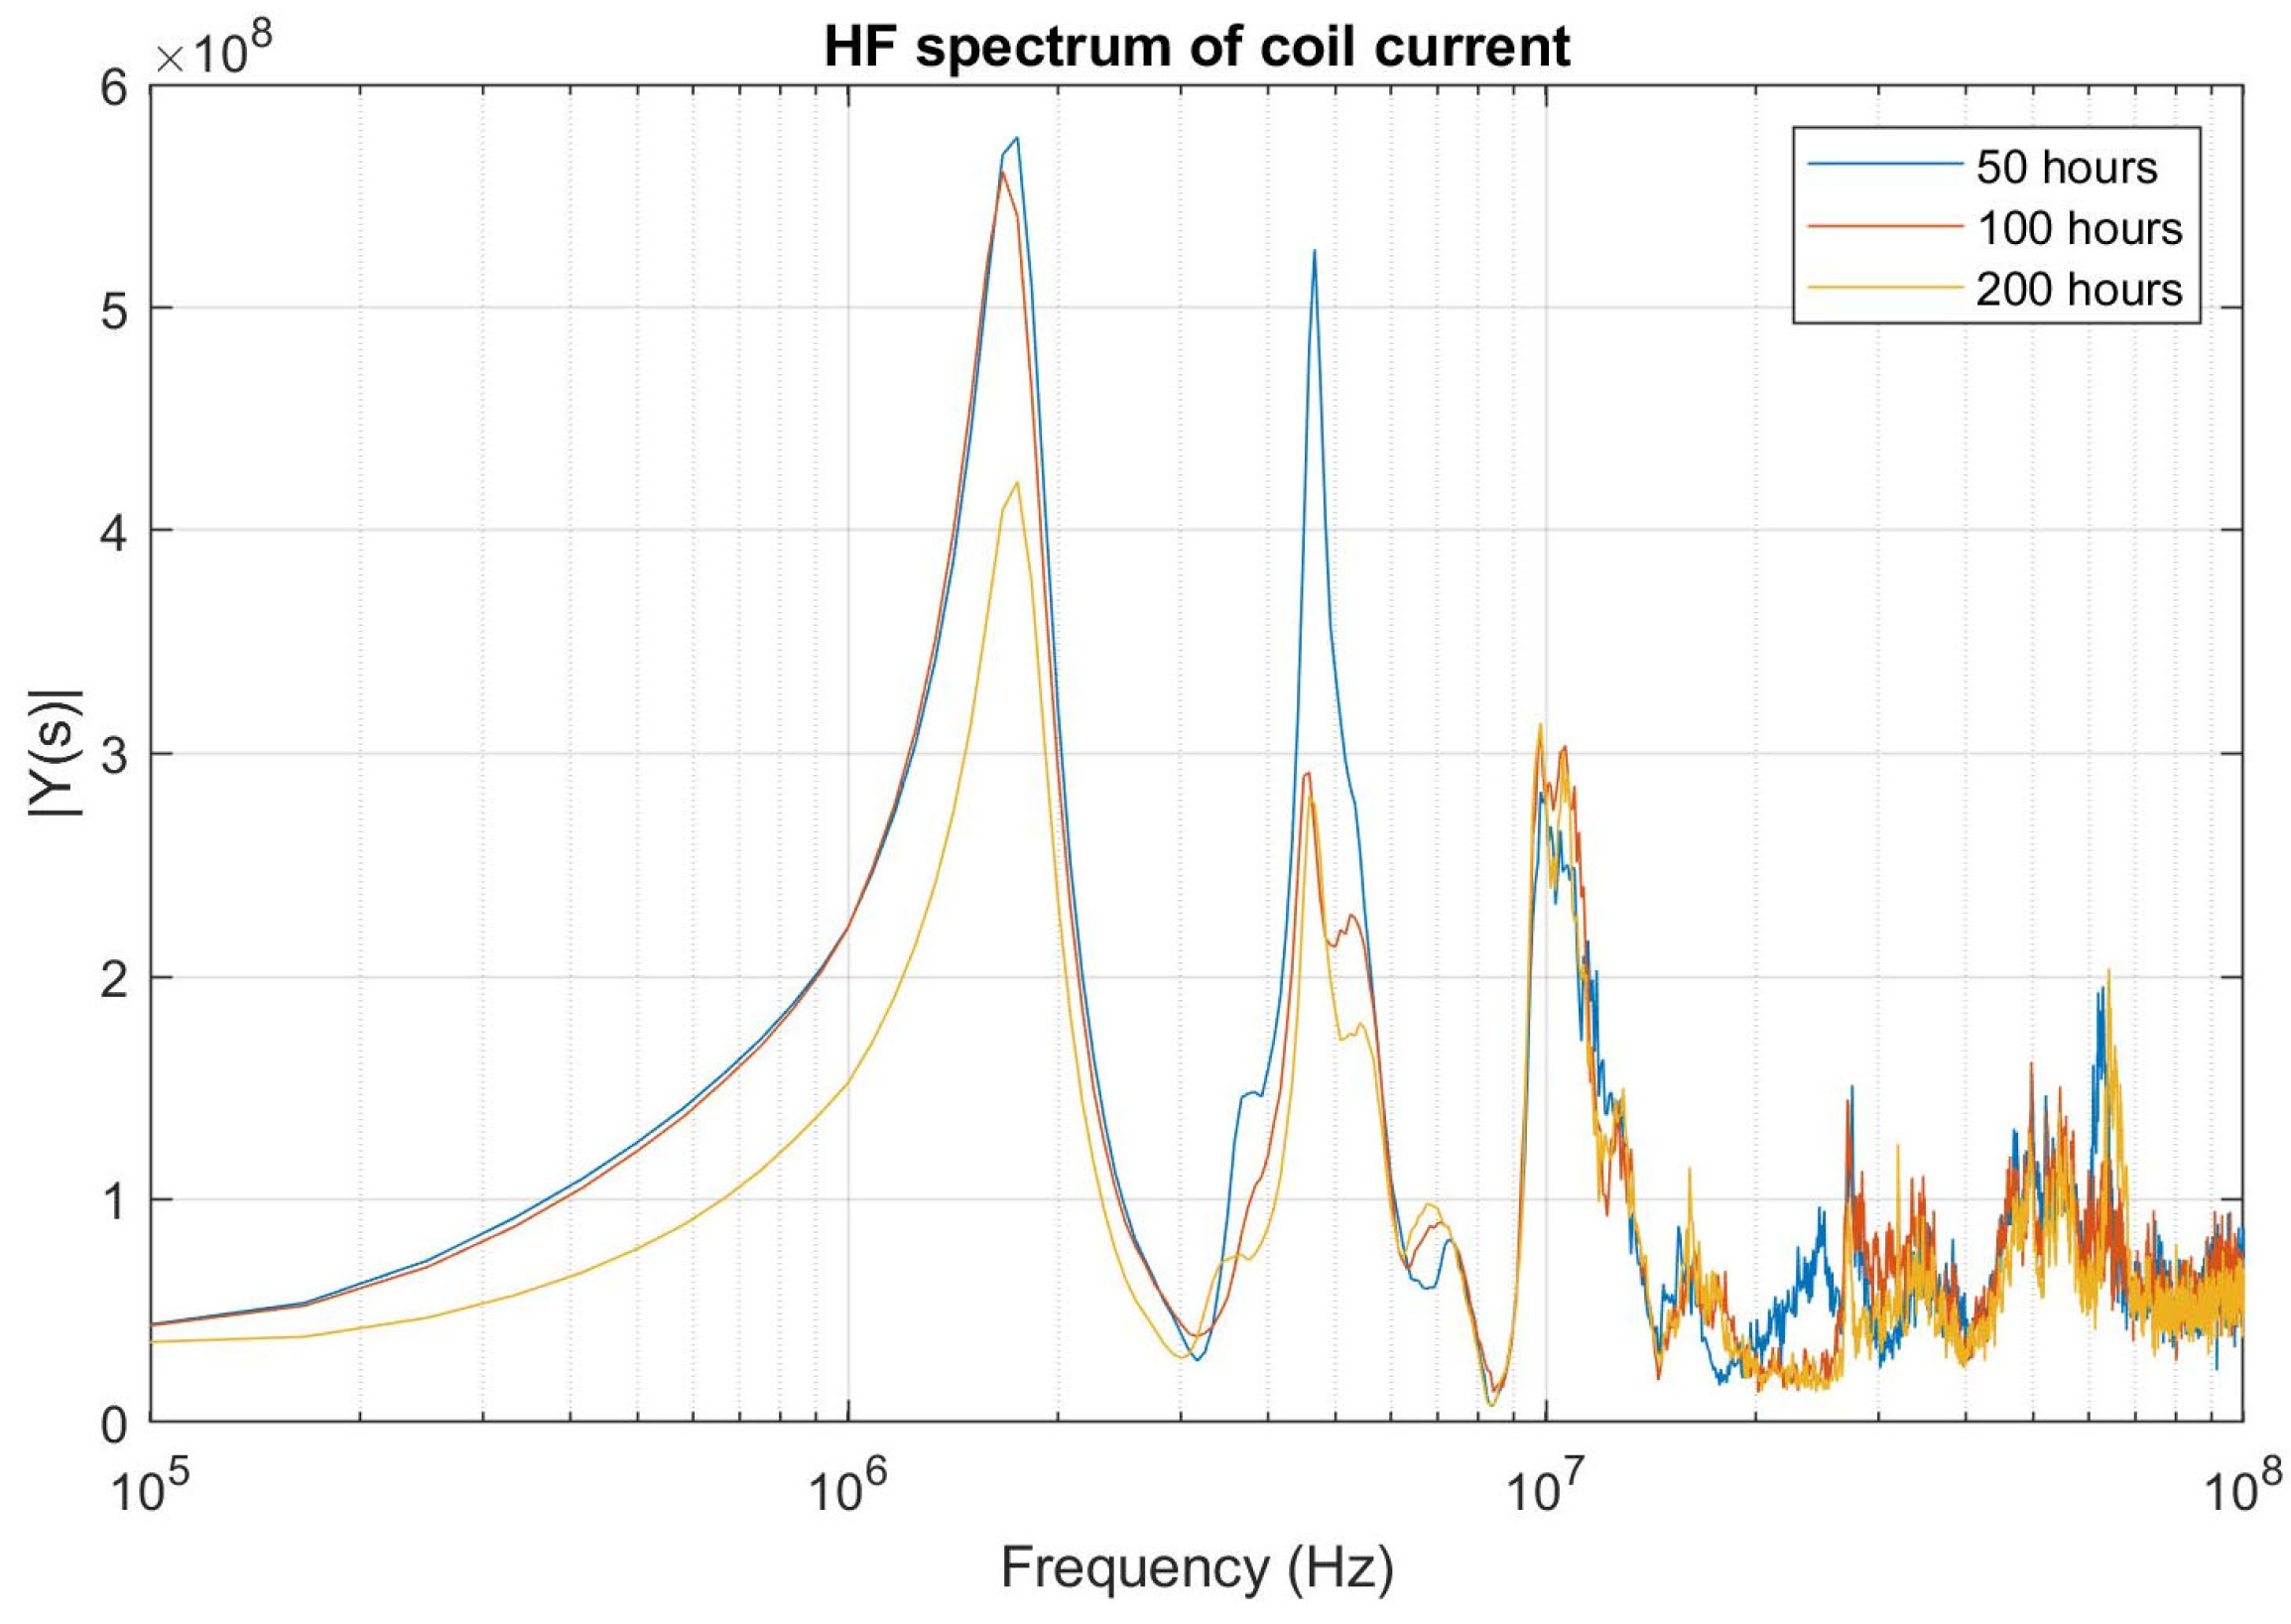
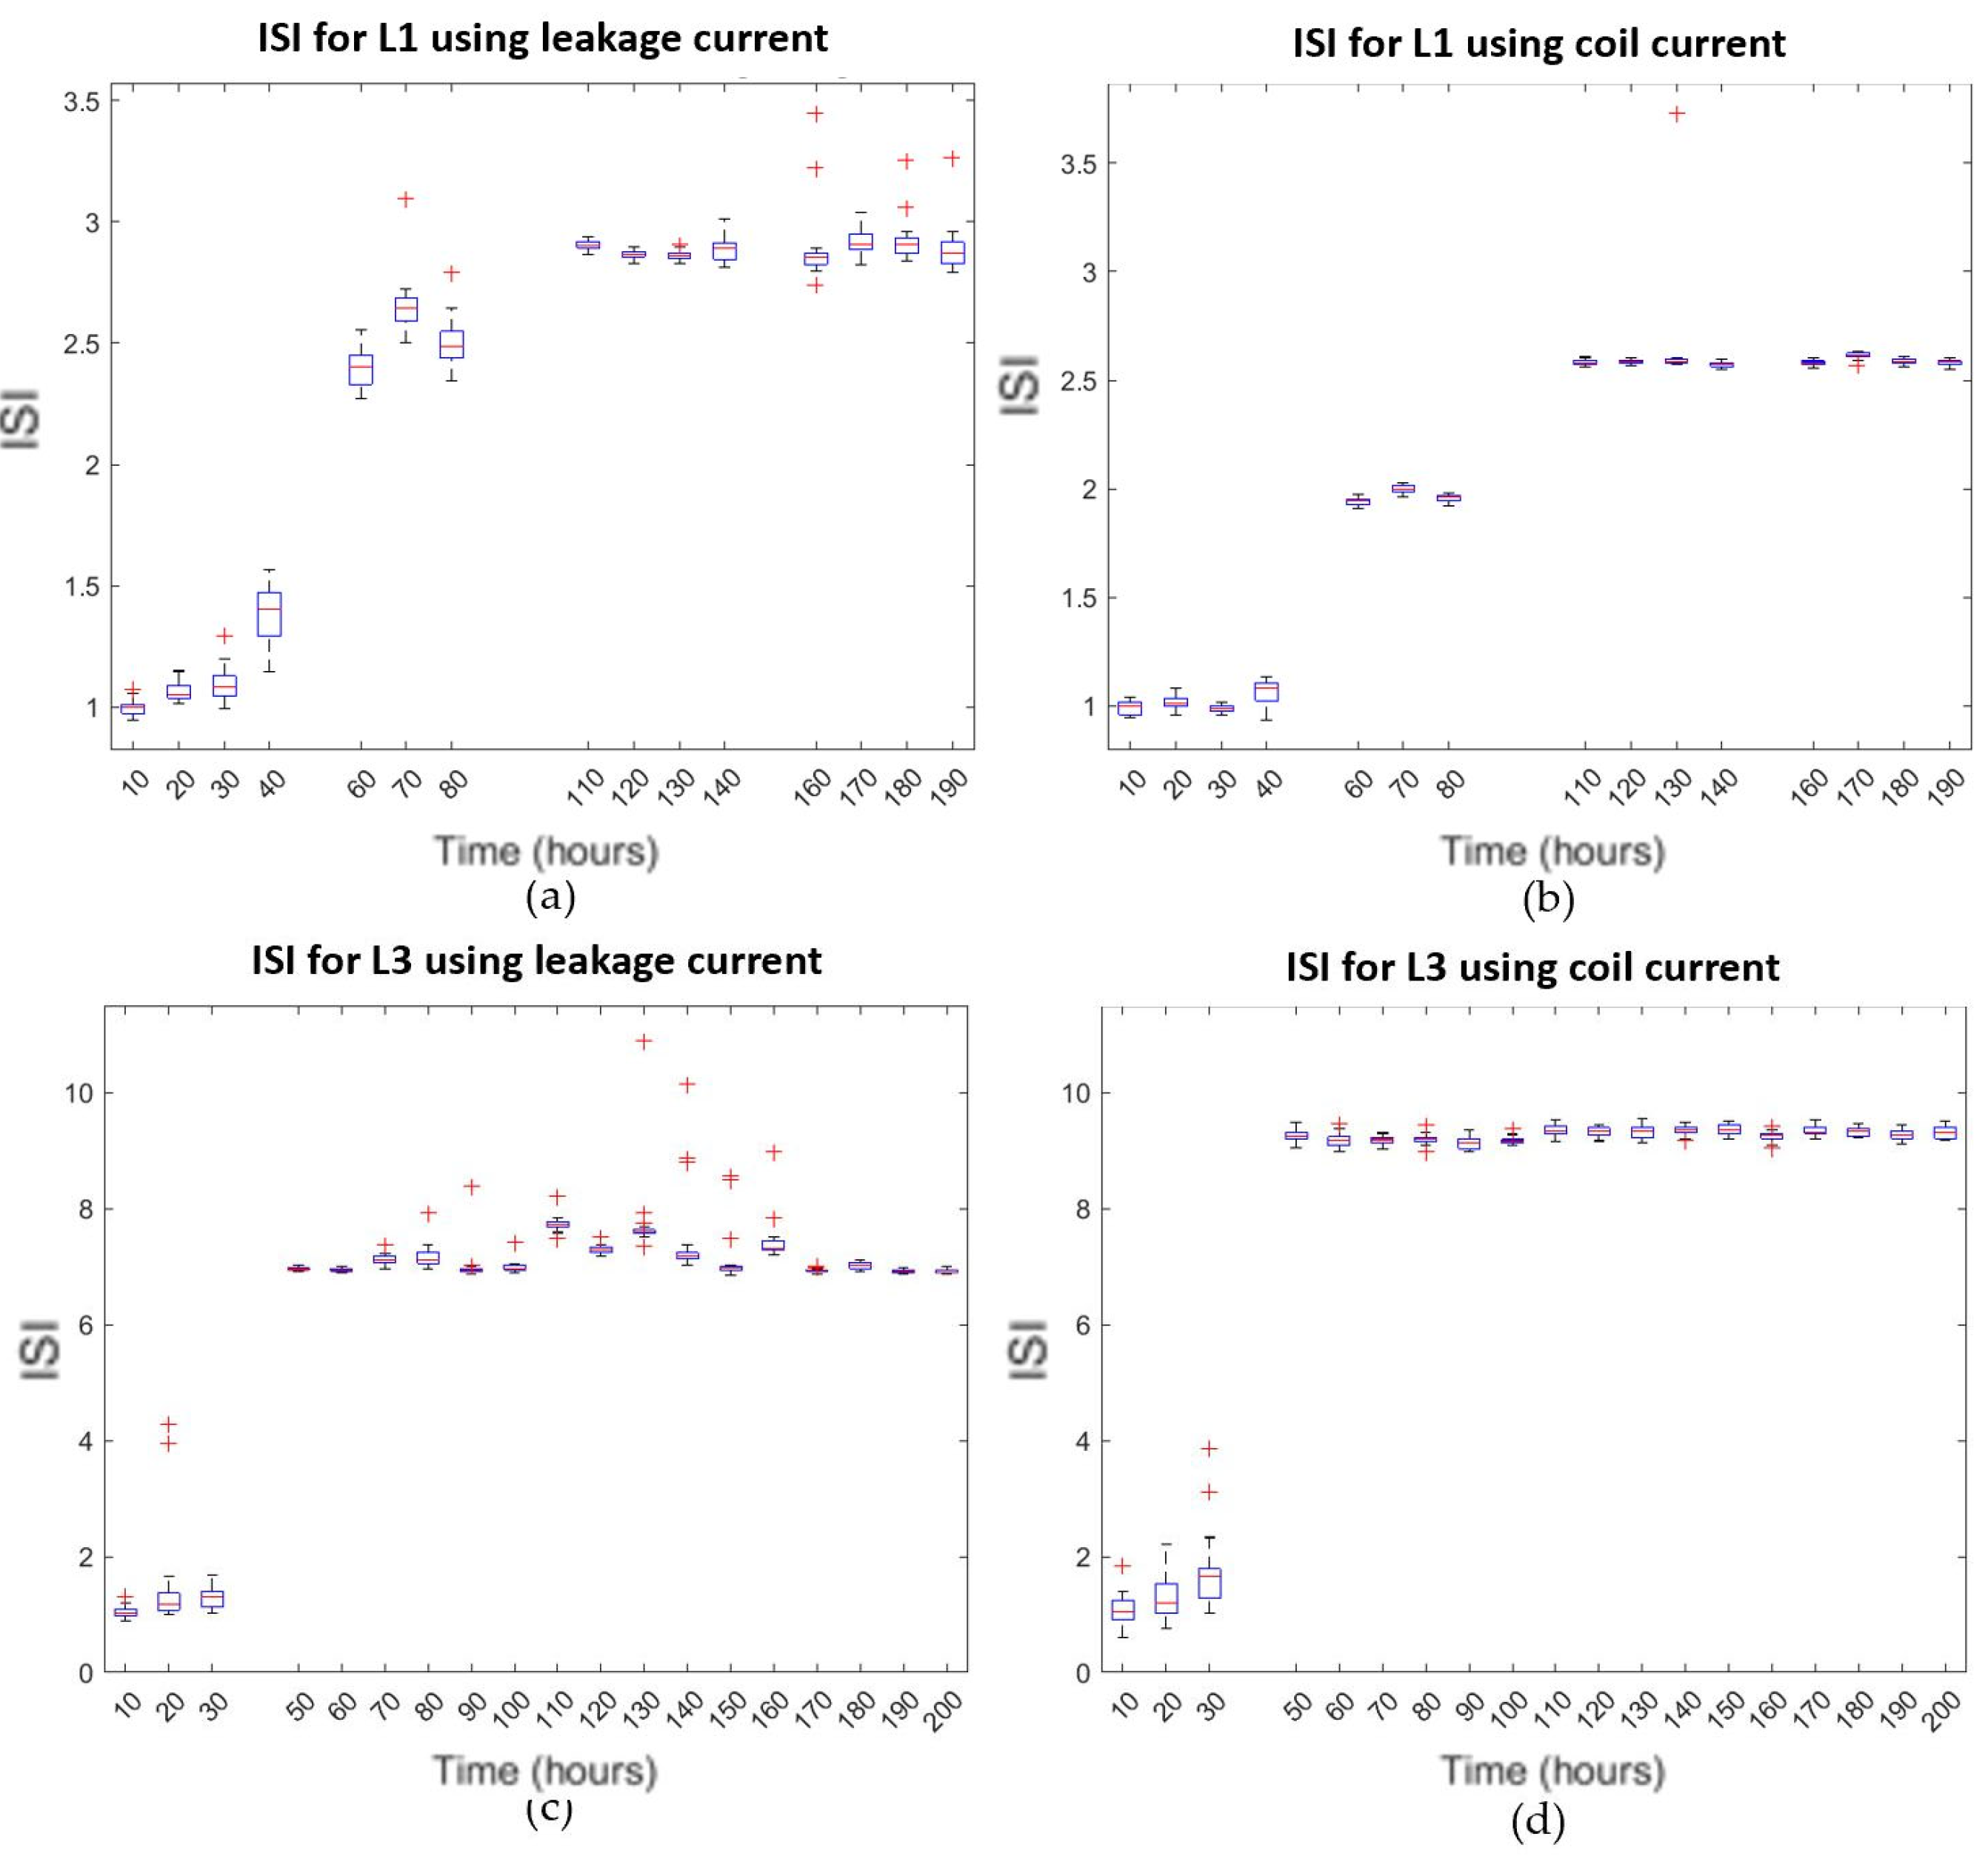
6.4. Results of SoH Tracking with Aged Coils

To showcase the ability to trend data collected during online operation of a motor coil additional accelerated aging tests were performed. Following the method presented by Tsykhla [41], a single capacitance value was extracted from each of the frequency dependent capacitances found at each time instance. The changes in the capacitance of the 2400 V coil tested at 4 kV and 60 °C are shown in Figure 24 where 20 samples were collected at each aging time. As can be seen, there is a clear decrease in the insulation equivalent capacitance as the coil undergoes accelerated aging.
The other method investigated for tracking the SoH of the coil insulation was the examination of changes to the coil inrush current oscillations. A similar process to that used for the GW equivalent circuit tracking was employed whereby the current oscillations of several impulses were collected for each of the SoH test conditions for both the coil inrush current and the coil GW leakage current. The current spectrum amplitudes for a selection of the test conditions using the input current are shown in Figure 25. As this metric is focused on the high frequency behavior of the coil current, the readings are more susceptible to noise. Nonetheless, it is evident that there are shifts in the maxima of the current spectrum as the coil is aged, most specifically the 1st, 2nd, and 3rd maxima.
In 10 h intervals during the accelerated aging test, 20 samples of the HF current spectrum were collected for both the input current and the GW leakage current. The ISI, as discussed by Nussbaumer [42], of the coil was calculated for the coil current and leakage current and is shown in Figure 26 for coils aged at 60 °C, Figure 26a and Figure 26b, and 120 °C, Figure 26c and Figure 26d, respectively [47].
The results of the ISI calculation using both the HF component of the coil current and the GW leakage current mirror each other in tracking the changes to the current spectrum. In both cases, the ISI values found during the same 50-h cycle (i.e., 10–40 h) remain relatively constant; however, there are sharp changes in the ISI between the 40- and 60-h measurements. This indicates that the most predominant change in the insulation health occurred between the cycles and was most likely caused by the heating and cooling of the coil between the 50 h test cycle. While both the coil current and the GW current were able to track the deterioration of the coil, the use of the GW current has a lower computational burden, thus it is preferred over the coil current.

7. Conclusions

This paper presented a comprehensive process for modeling and monitoring the state of health of the insulation for form wound medium voltage coils driven with a SiC inverter. The modeling approach was demonstrated with a linear motorette testbed which was modeled using COMSOL Multiphysics.
The process for the creation and usage of the model was discussed in detail and validation of the model was performed by a comparison of the impedance response to testbed results. The proposed model can represent both healthy and damaged insulation and uses a novel method of analyzing the coil voltages to include overvoltage, switching oscillation, and steady state magnitude in its analysis of insulation stress. The model has additional flexibility in representing a range of voltage levels and rise times. This was shown through simulations of various operational settings and insulation states.
This paper also presented a testbed for experimental model validation using 10 kV SiC power modules to drive the power test circuit. Several methods for online tracking of changes to the coil insulation’s state of health are also discussed and employed to identify changes to the coil insulation with experimental results from healthy and aged form wound coils. It was shown that all methods can identify changes to the state of the insulation. This work outlines a process for the creation and use of a model for the evaluation of electrical stress on form- wound coil insulation that is applicable to both laboratory and industrial applications including machines already in use.

Author Contributions

Conceptualization, E.A. and B.S.; Formal analysis, B.S.; Funding acquisition, E.A.; Investigation, B.S.; Methodology, B.S. and E.A.; Project administration, E.A.; Resources, E.A., A.v.J. and A.Y.; Software, B.S.; Supervision, E.A. and A.v.J.; Writing—original draft, B.S.; Writing—review & editing, B.S., E.A., A.v.J. and A.Y. All authors have read and agreed to the published version of the manuscript.

Funding

This work was supported by the Office of Naval Research (ONR) Award Number N00014-23-1-2424.

Data Availability Statement

Dataset available on request from the authors.

Conflicts of Interest

The authors declare no conflict of interest.

References

  1. Petri, T.; Keller, M.; Parspour, N. The Insulation Resilience of Inverter-Fed Low Voltage Traction Machines: Review, Challenges, and Opportunities. IEEE Access 2022, 10, 104023–104049. [Google Scholar] [CrossRef]
  2. Lee, W.; Li, S.; Han, D.; Sarlioglu, B.; Minav, T.; Pietola, M. A Review of Integrated Motor Drive and Wide-Bandgap Power Electronics for High-Performance Electro-Hydrostatic Actuators. IEEE Trans. Transp. Electrif. 2018, 4, 684–693. [Google Scholar] [CrossRef]
  3. Zoeller, C.; Vogelsberger, M.; Fasching, R.; Grubelnik, W.; Wolbank, T. Evaluation and Current-Response-Based Identification of Insulation Degradation for High Utilized Electrical Machines in Railway Application. IEEE Trans. Ind. Appl. 2017, 53, 2679–2689. [Google Scholar] [CrossRef]
  4. Ding, R.; Dou, Z.; Qi, Y.; Mei, W.; Liu, G. Analysis on characteristic of 3.3-kV full SiC device and railway traction converter design. IET Power Electron. 2022, 15, 978–988. [Google Scholar] [CrossRef]
  5. Pietrini, G.; Barater, D.; Franceschini, G.; Mancinelli, P.; Cavallin, A. An open problem for More Electrical Aircraft (MEA): How insulation systems of actuators can be qualified? In Proceedings of the 2016 IEEE Energy Conversion Congress and Exposition (ECCE), Milwaukee, WI, USA, 18–22 September 2016. [Google Scholar]
  6. Khan, Q.; Refaat, S.; Abu-Rub, H.; Toliyat, H. Partial Discharge Modeling of Internal Discharge in Electrical Machine Stator Winding. In Proceedings of the 2020 IEEE Kansas Power and Energy Conference (KPEC), Manhattan, KS, USA, 13–14 July 2020. [Google Scholar]
  7. Kaufhold, M.; Auinger, H.; Berth, M.; Speck, J.; Eberhardt, M. Electrical stress and failure mechanism of the winding insulation in PWM-inverter-fed low-voltage induction motors. IEEE Trans. Ind. Electron. 2000, 47, 396–402. [Google Scholar] [CrossRef]
  8. Xiong, H.; Liu, R.; Hu, B.; You, H.; Wei, Z.; Zhang, J.; Wang, J. The Ohio State University Partial Discharge Detection Platform for Electric Machine Windings Driven by PWM Voltage Excitation. In Proceedings of the 2019 IEEE Electrical Insulation Conference (EIC), Calgary, AB, Canada, 16–19 June 2019; pp. 517–520. [Google Scholar]
  9. D’Amato, D.; Loncarski, J.; Monopoli, V.; Cupertino, F.; Di Noia, L.; Del Pizzo, A. Impact of PWM Voltage Waveforms in High-Speed Drives: A Survey on High-Frequency Motor Models and Partial Discharge Phenomenon. Energies 2022, 15, 1406. [Google Scholar] [CrossRef]
  10. Liu, P.; Liu, X.; Zhang, Y.; Bo, H.; Liang, Z. Comparison of Different Simulating Calculation Methods for Electric Fields Along the Stator End-winding of HV Rotating Machine. In Proceedings of the 2020 IEEE Electrical Insulation Conference (EIC), Knoxville, TN, USA, 22 June–3 July 2020; pp. 448–451. [Google Scholar]
  11. Liu, P.; Liu, X.; Zhang, Y.; Hu, B.; Liang, Z. Electric Field Analysis of Stress Grading System Delamination in the Stator End-winding of High Voltage Rotating Machine. In Proceedings of the 2021 IEEE Electrical Insulation Conference (EIC), Denver, CO, USA, 7–28 June 2021; pp. 420–423. [Google Scholar]
  12. Ma, Z.; Zhou, C.; Hepburn, D.; Cowan, K. FEM Simulation of Electrical Stresses Within Motor Stator Windings for Online PD Localization. In Proceedings of the 2015 IEEE 11th International Conference on the Properties and Applications of Dielectric Materials, Sydney, NSW, Australia, 19–22 July 2015; pp. 668–671. [Google Scholar]
  13. Pauli, F.; Kilper, M.; Driendl, N.; Hameyer, K. Modeling of the Partial Discharge Process Between the Winding and the Stator of Low Voltage Machines for Traction Applications. IEEE Trans. Energy Convers. 2021, 36, 2310–2318. [Google Scholar] [CrossRef]
  14. Zhou, X.; Giangrande, P.; Ji, Y.; Zhao, W.; Ijaz, S.; Galea, M. Insulation for Rotating Low-Voltage Electrical Machines: Degradation, Lifetime Modeling, and Accelerated Aging Tests. Energies 2024, 17, 1987. [Google Scholar] [CrossRef]
  15. Barzkar, A.; Ghassemi, M. Precise Evaluation of Repetitive Transient Overvoltages in Motor Windings in Wide-Bandgap Drive Systems. Vehicles 2022, 4, 697–726. [Google Scholar] [CrossRef]
  16. Kilper, M.; Naumoski, H.; Hameyer, K. About the Modelling of Effects caused by Fast Switching Semiconductors operating Low Voltage Electrical Machines. In Proceedings of the 2021 IEEE Workshop on Electrical Machines Design, Control and Diagnosis (WEMDCD), Modena, Italy, 8–9 April 2021; pp. 219–224. [Google Scholar]
  17. Sundeep, S.; Wang, J.; Griffo, A. Holistic Modeling of High-Frequency Behavior of Inverter-Fed Machine Winding, Considering Mutual Couplings in Time Domain. IEEE Trans. Ind. Appl. 2021, 57, 6044–6057. [Google Scholar] [CrossRef]
  18. Sundeep, S.; Wang, J.; Griffo, A.; Alvarez-Gonzalez, F. Antiresonance Phenomenon and Peak Voltage Stress Within PWM Inverter Fed Stator Winding. IEEE Trans. Ind. Electron. 2021, 68, 11826–11836. [Google Scholar] [CrossRef]
  19. Kelly, B.; Zhang, J.; Chen, L. Bar-Wound Machine Voltage Stress: A Method for 2D FE Modeling and Testing. In Proceedings of the 2021 Thirty-Sixth Annual IEEE Applied Power Electronics Conference AND Exposition (APEC 2021), Phoenix, AZ, USA, 14–17 June 2021; pp. 1688–1693. [Google Scholar]
  20. Xiong, H.; Louie, A.; Liu, R.; Zhang, J.; von Jouanne, A. Finite Element Analysis Modeling and Experimental Verification of Reflected Wave Phenomena in Variable Speed Machine Drive Cables. In Proceedings of the 2017 IEEE International Electric Machines And Drives Conference (IEMDC), Miami, FL, USA, 21–24 May 2017. [Google Scholar]
  21. Perisse, F.; Werynski, P.; Roger, D. A new method for ac machine turn insulation diagnostic based on high frequency resonances. IEEE Trans. Dielectr. Electr. Insul. 2007, 14, 1308–1315. [Google Scholar] [CrossRef]
  22. Xie, Y.; Zhang, J.; Leonardi, F.; Munoz, A.; Degner, M. Investigation of Surge Voltage Propagation in Inverter-Driven Electric Machine Windings. IEEE Trans. Ind. Electron. 2023, 70, 9811–9822. [Google Scholar] [CrossRef]
  23. Zhang, J.; Xu, W.; Gao, C.; Wang, S.; Qiu, J.; Zhu, J.; Guo, Y. Analysis of Inter-Turn Insulation of High Voltage Electrical Machine by Using Multi-Conductor Transmission Line Model. IEEE Trans. Magn. 2013, 49, 1905–1908. [Google Scholar] [CrossRef]
  24. Krings, A.; Paulsson, G.; Sahlén, F.; Holmgren, B. Experimental Investigation of the Voltage Distribution in Form Wound Windings of Large AC Machines due to Fast Transients. In Proceedings of the 2016 XXII International Conference on Electrical Machines (ICEM), Lausanne, Switzerland, 4–7 September 2016; pp. 1700–1706. [Google Scholar]
  25. Melfi, M.; Sung, J.; Bell, S.; Skibinski, G. Effect of surge voltage risetime on the insulation of low voltage machines fed by PWM converters. In Proceedings of the IAS ‘97—Conference Record of the 1997 Ieee Industry Applications Conference/Thirty-Second IAS Annual Meeting, VOLS 1–3, New Orleans, LA, USA, 5–9 October 1997; pp. 239–246. [Google Scholar]
  26. Yi, P.; Murthy, P.; Wei, L. Performance Evaluation of SiC MOSFETs with Long Power Cable and Induction Motor. In Proceedings of the 2016 IEEE Energy Conversion Congress and Exposition (ECCE), Milwaukee, WI, USA, 18–22 September 2016. [Google Scholar]
  27. Friedel, S. How to Calculate a Capacitance Matrix in COMSOL Multiphysics. COMSOL: COMSOL Blog, 2017. Available online: https://www.comsol.com/blogs/how-to-calculate-a-capacitance-matrix-in-comsol-multiphysics (accessed on 1 May 2024).
  28. COMSOL. Self-Inductance and Mutual Inductance Between Single Conductors. In Application Gallery; COMSOL: Göttingen, Germany; Available online: https://www.comsol.com/model/self-inductance-and-mutual-inductance-between-single-conductors-12653 (accessed on 1 May 2024).
  29. Borghei, M.; Ghassemi, M.; Kordi, B.; Gill, P.; Oliver, D. A Finite Element Analysis Model for Internal Partial Discharges in an Air-Filled, Cylindrical Cavity inside Solid Dielectric. In Proceedings of the 2021 IEEE Electrical Insulation Conference (EIC), Denver, CO, USA, 7–28 June 2021; pp. 260–263. [Google Scholar]
  30. Hornak, J.; Trnka, P. Defects of Electrical Insulation Systems with Focus on FEM Modeling. In Proceedings of the 2017 6th International Youth Conference On Energy (IYCE), Budapest, Hungary, 21–24 June 2017. [Google Scholar]
  31. Otake, Y.; Umemoto, T.; Suga, K.; Yoshimura, M.; Tsurimoto, T.; Hasegawa, H.; Isoya, H.; Ebato, T.; Inoue, N.; Yano, T. Influence of Defect Size on Insulation Deterioration of Epoxy Resins with Voids. IEEE Trans. Dielectr. Electr. Insul. 2021, 28, 52–57. [Google Scholar] [CrossRef]
  32. Magdun, O.; Blatt, S.; Binder, A. Calculation of Stator Winding Parameters to Predict the Voltage Distributions in Inverter Fed AC Machines. In Proceedings of the 2013 9th IEEE International Symposium on Diagnostics FOR Electric Machines, Power Electronics and Drives (SDEMPED), Valencia, Spain, 27–30 August 2013; pp. 447–453. [Google Scholar]
  33. Gustavsen, B.; Semlyen, A. Rational approximation of frequency domain responses by vector fitting. IEEE Trans. Power Deliv. 1999, 14, 1052–1061. [Google Scholar] [CrossRef]
  34. Mota, D.D.S. Estimating the Frequency Response of an Excitation System and Synchronous Generator: Sinusoidal Disturbances Versus Empirical Transfer Function Estimate. Power Energy Technol. Syst. 2018, 5, 27–34. [Google Scholar] [CrossRef]
  35. Saathoff, E.; Shaw, S.; Leeb, S. Line Impedance Estimation. IEEE Trans. Instrum. Meas. 2021, 70, 6501810. [Google Scholar] [CrossRef]
  36. Babel, A.; Strangas, E. Condition-Based Monitoring and Prognostic Health Management of Electric Machine Stator Winding Insulation. In Proceedings of the 2014 International Conference on Electrical Machines (ICEM), Berlin, Germany, 2–5 September 2014; pp. 1855–1861. [Google Scholar]
  37. Torkaman, H.; Karimi, F. Measurement variations of insulation resistance/polarization index during utilizing time in HV electrical machines—A survey. Measurement 2015, 59, 21–29. [Google Scholar] [CrossRef]
  38. Gandhi, A.; Corrigan, T.; Parsa, L. Recent Advances in Modeling and Online Detection of Stator Interturn Faults in Electrical Motors. IEEE Trans. Ind. Electron. 2011, 58, 1564–1575. [Google Scholar] [CrossRef]
  39. Patel, A.; Lai, C.; Iyer, K. A Novel Approach towards Detection and Classification of Electric Machines’ Stator Winding Insulation Degradation using Wavelet Decomposition. In Proceedings of the 2023 IEEE International Electric Machines & Drives Conference, IEMDC, San Francisco, CA, USA, 15–18 May 2023. [Google Scholar]
  40. Yang, J.; Cho, J.; Lee, S.; Yoo, J.; Kim, H. An advanced stator winding insulation quality assessment technique for inverter-fed machines. IEEE Trans. Ind. Appl. 2008, 44, 555–564. [Google Scholar] [CrossRef]
  41. Zheng, D.; Lu, G.; Qu, J.; Zhang, Y.; Zhang, P. Comparative Study of Neutral-Voltage-Based and Leakage-Current-Based Online Condition Monitoring Methods for Stator Insulation of Inverter-Fed Machines. IEEE Trans. Ind. Electron. 2024, 71, 16664–16674. [Google Scholar] [CrossRef]
  42. Montero, E.; Vogelsberger, M.; Wolbank, T. Tracking Insulation Degradation of Railway Traction Induction Motors using High-Frequency Differential Current. In Proceedings of the 2024 IEEE Energy Conversion Congress and Exposition ECCE, Phoenix, AZ, USA, 20–24 October 2024. [Google Scholar]
  43. Younsi, K.; Neti, P.; Shah, M.; Zhou, J.; Krahn, J.; Weeber, K.; Whitefield, C. On-line Capacitance and Dissipation Factor Monitoring of AC Stator Insulation. IEEE Trans. Dielectr. Electr. Insul. 2010, 17, 1441–1452. [Google Scholar] [CrossRef]
  44. Zhang, P.; Younsi, K.; Neti, P. A Novel Online Stator Ground-Wall Insulation Monitoring Scheme for Inverter-Fed AC Motors. IEEE Trans. Ind. Appl. 2015, 51, 2201–2207. [Google Scholar] [CrossRef]
  45. Tsyokhla, I.; Griffo, A.; Wang, J. On-Line Monitoring of Winding Insulation Health using High Frequency Common Mode Voltage from PWM. In Proceedings of the 2015 IEEE INTERNATIONAL ELECTRIC MACHINES & DRIVES CONFERENCE (IEMDC), Coeur d’Alene, ID, USA, 10–13 May 2015; pp. 1433–1439. [Google Scholar]
  46. Zhang, P.; Neti, P.; Younsi, K. Online Monitoring of Capacitance and Dissipation Factor of Motor Stator Winding Insulation during Accelerated Life Testing. In Proceedings of the 2018 Ieee Energy Conversion Congress And Exposition (ECCE), Portland, OR, USA, 23–27 September 2018; pp. 3267–3271. [Google Scholar]
  47. Nussbaumer, P.; Vogelsberger, M.; Wolbank, T. Exploitation of Induction Machine’s High-Frequency Behavior for Online Insulation Monitoring. In Proceedings of the 2013 9th IEEE International Symposium on Diagnostics for Electric Machines, Power Electronics and Drives (SDEMPED), Valencia, Spain, 27–30 August 2013; pp. 579–585. [Google Scholar]
  48. Saeed, M.; Fernández, D.; Guerrero, J.; Díaz, I.; Briz, F. Insulation Condition Assessment in Inverter-Fed Motors Using the High-Frequency Common Mode Current: A Case Study. Energies 2024, 17, 470. [Google Scholar] [CrossRef]
  49. Tsyokhla, I.; Griffo, A.; Wang, J. Online Condition Monitoring for Diagnosis and Prognosis of Insulation Degradation of Inverter-Fed Machines. IEEE Trans. Ind. Electron. 2019, 66, 8126–8135. [Google Scholar] [CrossRef]
  50. Mentlík, V.; Trnka, P.; Svoboda, M.; Hornak, J.; Totzauer, P.; Harvánek, L. Aging Phenomena of Paper-Oil Insulating System under Different Voltage Stress. In Proceedings of the 2015 IEEE 11th International Conference on the Properties and Applications of Dielectric Materials, Sydney, NSW, Australia, 19–22 July 2015; pp. 548–551. [Google Scholar]
Figure 1. Motor overvoltage at different cable lengths [26].
Energies 18 01262 g001
Figure 2. Outline of the proposed modeling process.
Energies 18 01262 g002
Figure 3. COMSOL model geometry (a) with labeled materials and (b) electrical boundaries.
Energies 18 01262 g003
Figure 4. Mutual capacitance matrix with the diagonals representing the turn to ground capacitance (1), and mutual capacitance between adjacent conductors (2) in pF.
Energies 18 01262 g004
Figure 5. Position and geometry of turn 1 with different delamination location (a), and void locations (b) with highlighted air-filled voids.
Energies 18 01262 g005
Figure 6. The generalized form of n level ladder circuit with end turn inductance core loss resistance and mutual inductance and resistance effects.
Energies 18 01262 g006
Figure 7. Frequency dependent resistance and inductance of a single turn of a conductor when modeled with COMSOL and 3rd, 4th, and 5th order ladder circuits.
Energies 18 01262 g007
Figure 8. Flowchart outlining the process used to calculate the ladder circuit parameters.
Energies 18 01262 g008
Figure 9. Equivalent circuit used for the analytical modeling of a ladder circuit’s impedance.
Energies 18 01262 g009
Figure 10. The impact of changes to the groundwall capacitance (a) and core loss resistance (b) on the impedance response of an arbitrary ladder circuit.
Energies 18 01262 g010
Figure 11. 10 kV SiC insulation testbed used for model validation and accelerated aging.
Energies 18 01262 g011
Figure 12. Test circuit for use with the XHV-9 10 kV SiC power module (a) and the XHV-6 SiC power module (b).
Energies 18 01262 g012
Figure 13. Circuit representation of probe locations for the measurement of the insulation leakage current.
Energies 18 01262 g013
Figure 14. Equivalent circuit of the groundwall insulation.
Energies 18 01262 g014
Figure 15. Test coil with 0.5 mm removed from groundwall insulation to represent delamination.
Energies 18 01262 g015
Figure 16. Impedance response model and the testbed when driven with SiC and Si power modules.
Energies 18 01262 g016
Figure 17. Change in impedance response of coil model and testbed results after the introduction of a 0.5 mm delamination across the full frequency range (a) and near the resonant frequency with the peak shift marked (b).
Energies 18 01262 g017
Figure 18. Coil to ground voltages of an 8-coil simulated stator when excited by a 2400 V square wave with a 20 ns rise time.
Energies 18 01262 g018
Figure 19. Turn-to-turn voltage difference between adjacent turns in the first coil of a simulated stator when excited by a 2400 V square wave with a 20 ns rise time.
Energies 18 01262 g019
Figure 20. Impact of insulation delamination in the region of turn 1.
Energies 18 01262 g020
Figure 21. Peak electric field density for insulation with no delamination at 3 kV (a), 3.5 kV (b), and 4 kV (c), and insulation with a delamination adjacent to turn 1 at 3 kV (d), 3.5 kV (e), 4 kV (f), and insulation with a delamination adjacent to the groundwall of turn 1 at 3 kV (g), 3.5 kV (h), and 4 kV (i).
Energies 18 01262 g021
Figure 22. Impact of rise time and insulation delamination on insulation stress factors.
Energies 18 01262 g022
Figure 23. Impact of voids and delamination in the region of turns 1 and 7 on insulation stress factors.
Energies 18 01262 g023
Figure 24. Groundwall insulation equivalent capacitance for 2400 V coil undergoing accelerated aging.
Energies 18 01262 g024
Figure 25. HF current spectrum of coil groundwall leakage current for 2400 V coil after different periods of aging.
Energies 18 01262 g025
Figure 26. The ISI of a coil aged at 60 °C found with the leakage current (a) and coil current (b), and a coil aged at 120 °C found with the leakage current (c) and coil current (d).
Energies 18 01262 g026
Table 1. Comparison of capacitances calculated with different COMSOL meshes.
Mesh SettingMesh ElementsTurn 2 Self Capacitance (pF)Turn 1 to Turn 2 Mutual Capacitance (pF)
Fine29,05614.08765968.322529
Extra Fine37,49814.08764268.322302
Extremely Fine81,69214.08761068.321973
Table 2. Comparison of capacitances calculated with COMSOL and analytical model.
Capacitive PairFEA Capacitance (pF)Analytical Capacitance (pF)
Turn 1–268.367.7
Turn 2-Gnd14.112.5
Turn 2–40.00080.0008
Disclaimer/Publisher’s Note: The statements, opinions and data contained in all publications are solely those of the individual author(s) and contributor(s) and not of MDPI and/or the editor(s). MDPI and/or the editor(s) disclaim responsibility for any injury to people or property resulting from any ideas, methods, instructions or products referred to in the content.

