Abstract
A numerical study was conducted on winglet designs with multiple sweep angles for improving the performance of horizontal axis wind turbine (HAWT) blades, and their effect on reducing the wing tip vortex was investigated by CFD analysis. The effects of sweep angles were examined through NREL Phase VI turbine blades considering a wind speed range of 7 to 25 m/s. Numerical simulations were performed using RANS equations and the SST k–ω turbulence model. The interaction of the blade rotation and wind flow was modeled using a moving reference frame method. The numerical results were found to be in good agreement with the inferences drawn from the experiments for a baseline blade without a winglet, thereby validating the computational method. The investigations revealed that multi-swept winglets predicted a 14.6% torque increment, providing higher power output than single-swept winglets compared to the baseline blade at a wind speed of 15 m/s. Implementing multiple sweep angles in winglet design can improve the blade performance effectively without further increments in winglet length.
1. Introduction
In recent years, in an effort to reduce the emission of CO2 into the atmosphere, the demand for renewable energy resources has increased significantly [1]. Wind is considered the most reliable renewable energy source since it is readily available across the globe [2], and researchers have accordingly developed wind turbine systems to harvest energy from this resource. HAWTs constitute the most commonly used turbine due to their efficiency. Therefore, various strategies have been developed to enhance the performance of wind turbines, for example, by reducing energy losses due to blade tip vortices [3] and implementing well-designed winglets [4]. In the design and aerodynamics analysis of the blade, the blade element theory [5] and the vortex method [6] are used widely. However, these methods have limitations in handling three-dimensional (3D) flows and require empirical data on lift and drag for various flow conditions. Computational fluid dynamics (CFD) methods are free of such limitations. The CFD method provides detailed flow analyses with elements such as velocity vectors, pressure contours, streamlines, flow separation and wakes, vortex shedding, wall shear stresses, and lift and drag that affect blade performance, and can also handle the effects of turbulence and rotational motion. Furthermore, it can provide solutions for complex multiphase flows [7,8] and various type of geometries [9,10,11,12]. Although the CFD method has several advantages compared to other methods, the accuracy of the simulation is greatly affected by the computational settings such as the computational domain and boundary conditions [13], grid generation, and turbulence model [12].
Extensive research has been conducted regarding the parameters of winglet design and their effect on the performance of wind turbine blades, as summarized in the literature [9,10]. According to the reports, blade tips with winglet extensions having an intermediate cant angle show a weaker tip swirling motion when compared to tips with a straight extension [11]. Winglets with a certain cant angle tend to produce more power output when they possess a higher winglet height, since it results in a better blade pressure distribution [10,12]. A curved bent for a winglet is preferable to increase torque compared to a sharp bent [14]. Utilizing a tapered shape with a higher root-to-tip ratio results in weaker tip vortices than in winglets with a lower ratio [15]. A relatively high pitch angle enables the reduction of thrust loads and the acceleration of the wake recovery of the blade [16]. The fabrication of double winglets facing both upstream and downstream can effectively improve the pressure distribution on both surfaces [17]. Meanwhile, swept blade tips are also effective in reducing tip vortices, with swept tips toward the trailing edge producing more torque than swept tips toward the leading edge [18]. A combination of curved and twisted blade tips is effective in improving the blade performance because curved tips can displace the tip vortices from the blades, and twisted tips reduce the blade load [19]. Sweep angles also contribute to both increasing or decreasing the blade power depending on the blade tip speed ratio [9]. The optimal characteristics to obtain high winglet performance are large span length, curvature radius, and tip chord values, and low or moderate sweep angle, angle of attack, and root chord values. Winglets may be fabricated based on one of several designs. However, the objective underlying the development of each design is similar: to reduce the influence of tip vortices by having them form on the winglet tip. This is expected to improve the pressure distribution on the blade surfaces and produce greater power output. The studies surveyed above suggest that winglet designs can be enhanced further by using a suitable combination of winglet parameters, rather than a single parameter. The incorporation of inappropriate parameter values can introduce various limitations, such as safety issues if the winglet is too long, and limiting the optimum range of the cant, sweep, toe, and twist angles. There are many combinations of winglet parameters to improve the blade performance; however, many of their aspects are still unclear, and winglet parameters for optimal design have not yet been derived.
The goal of this study is to design a winglet that can achieve higher power output without increasing the winglet length, and to clarify the effect of winglet configurations on the aerodynamic characteristics of the HAWT blade. Therefore, in this study, to optimize the design of the winglet, we investigate the design parameters of winglets with single and multiple sweep angles in addition to their effect on reducing the wing tip vortex by CFD analysis. For this purpose, first, we design several winglets with multiple sweep angles and different single cant angles while maintaining equal winglet lengths. Subsequently, the aerodynamic performances of the winglets are investigated through CFD analysis and compared with those of the baseline blade. Quantitative and qualitative blade data such as torque, thrust, power output, efficiency, streamlines, and vortex strength are used to measure the performance of the winglet configurations. Consequently, this study demonstrates that multi-swept winglets exhibit better performance in increasing the blade power output.
2. Materials and Methods
2.1. Turbine Blade and Winglet Geometry
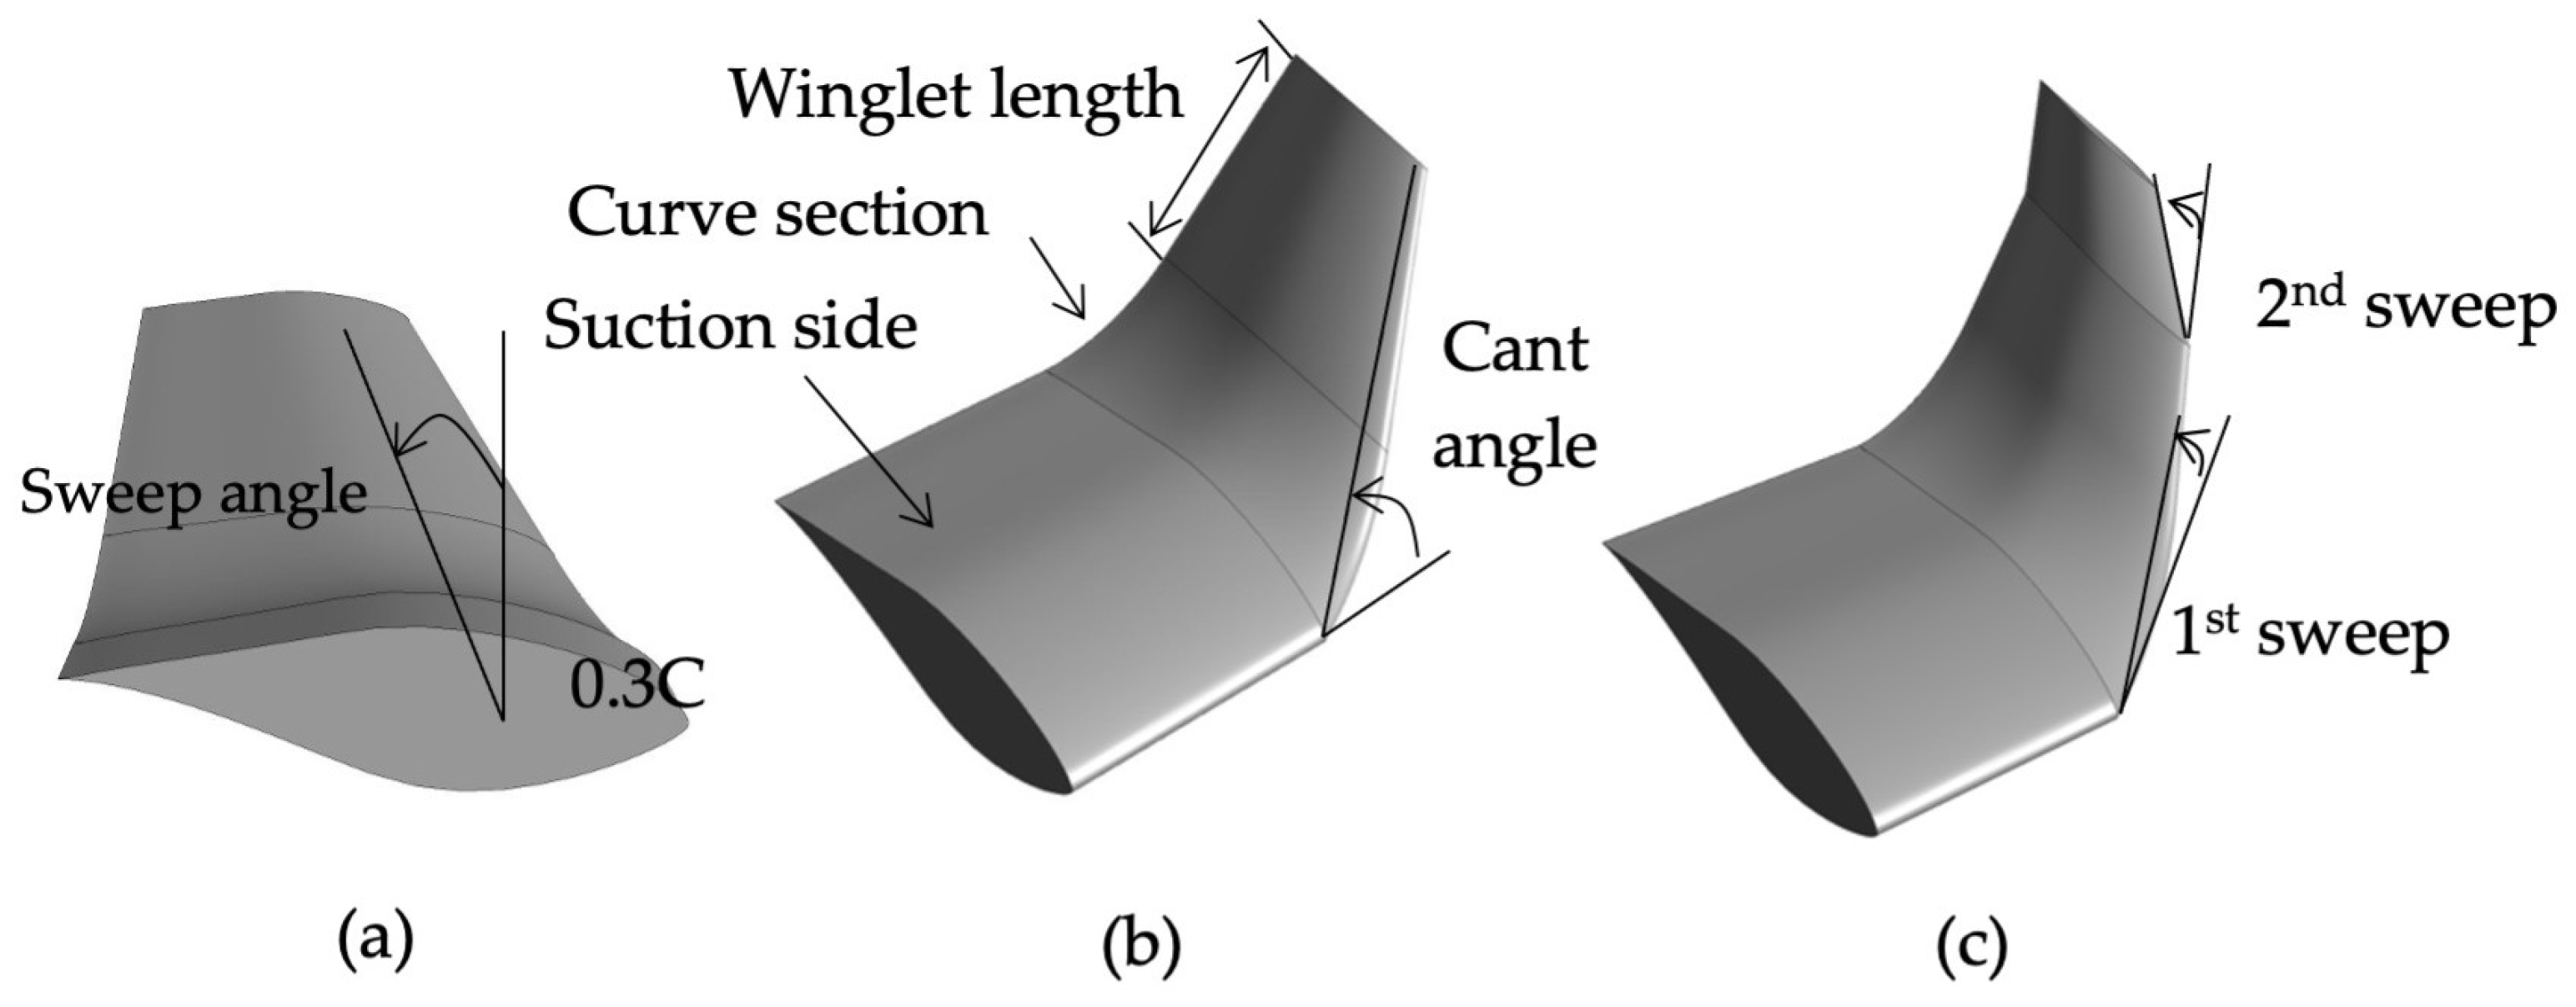
In this study, the NREL Phase VI wind turbine blade [20] with a radius of R = 5 m is used. The winglet is blended on the blade tip, has the S809 airfoil [21], and has a length of l = 0.03R. It is tapered from the root to tip with a ratio of 0.42, untwisted, facing the suction side with the cant angles, while all configurations have a similar span curvature radius of 0.02R. The sweep angle is measured between the location of chord C = 0.3 of the blade tip and winglet tip, as illustrated in Figure 1.

Figure 1.
Winglet configuration: (a) sweep angle, (b) single-swept winglet, and (c) multi-swept winglet.
Two groups of winglets, named single-swept and multi-swept, were designed based on the number of sweeps. For the single-swept group, the winglets were swept once and in two different directions with varied cant angles, as listed in Table 1. Furthermore, the single-swept winglets were also designed with varied sweep angles while maintaining a same cant angle of 30°, as listed in Table 2.

Table 1.
Single-swept winglet with different cant angles.
Table 2.
Single-swept winglet with different sweep angles.
Meanwhile, in the multi-swept group, as listed in Table 3, the winglets were swept more than once with different sweep angles. In a multi-swept winglet, the tip of the winglet moves away from its original position as the winglet sweeps, but the offset distance of the tip is kept equal to 0.062R, as illustrated in Figure 2. This treatment was carried out to remove the effect of the different offset of the tip and emphasize the effect of the multi-swept design on the aerodynamic characteristics. The offset distance is the horizontal distance between the leading edge of the winglet root and the leading edge of the winglet tip. To make a fairer comparison of the performance of the multi-swept winglets, a single-sweep winglet (S-50), whose tip offset distance was equal to those of the multi-swept winglets, was added to Table 3 for comparison. Table 4 lists the operating conditions applied in this study, which are the same as the experimental conditions of the NREL Phase VI wind turbine [20] developed for a wide range of wind speeds, and were used to correctly evaluate the present computational method.
Table 3.
Multi-swept winglet and parameters.
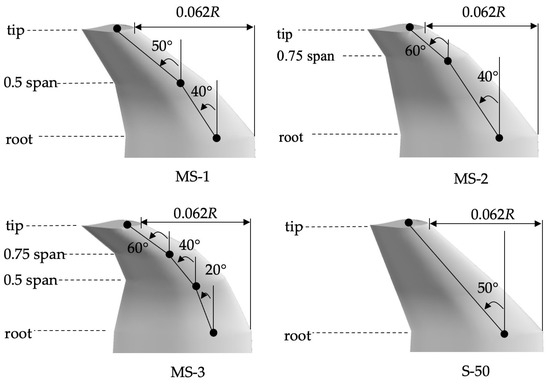
Figure 2.
Multi-swept winglet configurations.
Table 4.
Blade operating conditions.
2.2. Computational Methods
- Fundamental equations
The 3D Reynolds-averaged Navier–Stokes (RANS) equations were used to calculate flows around the wind turbine blade as follows [10]:
where represents the Reynolds stress to estimate turbulent flows, while ρ,u, p, and μ are the density, flow velocities, pressure, and viscosity. The SST k–ω turbulence model [22] was applied to calculate the Reynolds stress. This model is a RANS eddy viscosity model that combines the advantages of the standard k–ω [23] and k–ε [24] turbulence model formulations to provide more accurate turbulent flow computations. That is, the SST k–ω model can better handle the near-wall flow as well as the far-field free stream that fits the flow conditions in this study, and is widely used for simulating turbulent flows over airfoils including rotating blades [13,14,15,25]. This model implements 2 transport equations of k and ω as [26]:
where k is the turbulent kinetic energy and denotes specific dissipation rate. , and represent the generation, effective diffusivity, and dissipation for and , respectively. and are the user-defined input terms. is a cross-diffusion term [26] to blend the k- and k-ε models. The fundamental equations were solved using the SIMPLE method in tandem with the CFD software FLUENT 14.0 [26]. A steady simulation approach was employed considering computing time, since this study focuses on aerodynamic characteristics such as lift, drag, and blade performance, rather than investigating the detailed turbulent flow behavior. This approach is suitable for RANS solvers with time-averaged turbulent models and is widely used for blade aerodynamic problems [12,13,15,17,25]. In this computation, the initial values of and were set to 1, and the other constants were given their default values in FLUENT. The simulation was considered converged when the residuals of the mass and momentum equations were smaller than 10−4.
- 2.
- Computational domain, mesh, and boundary condition
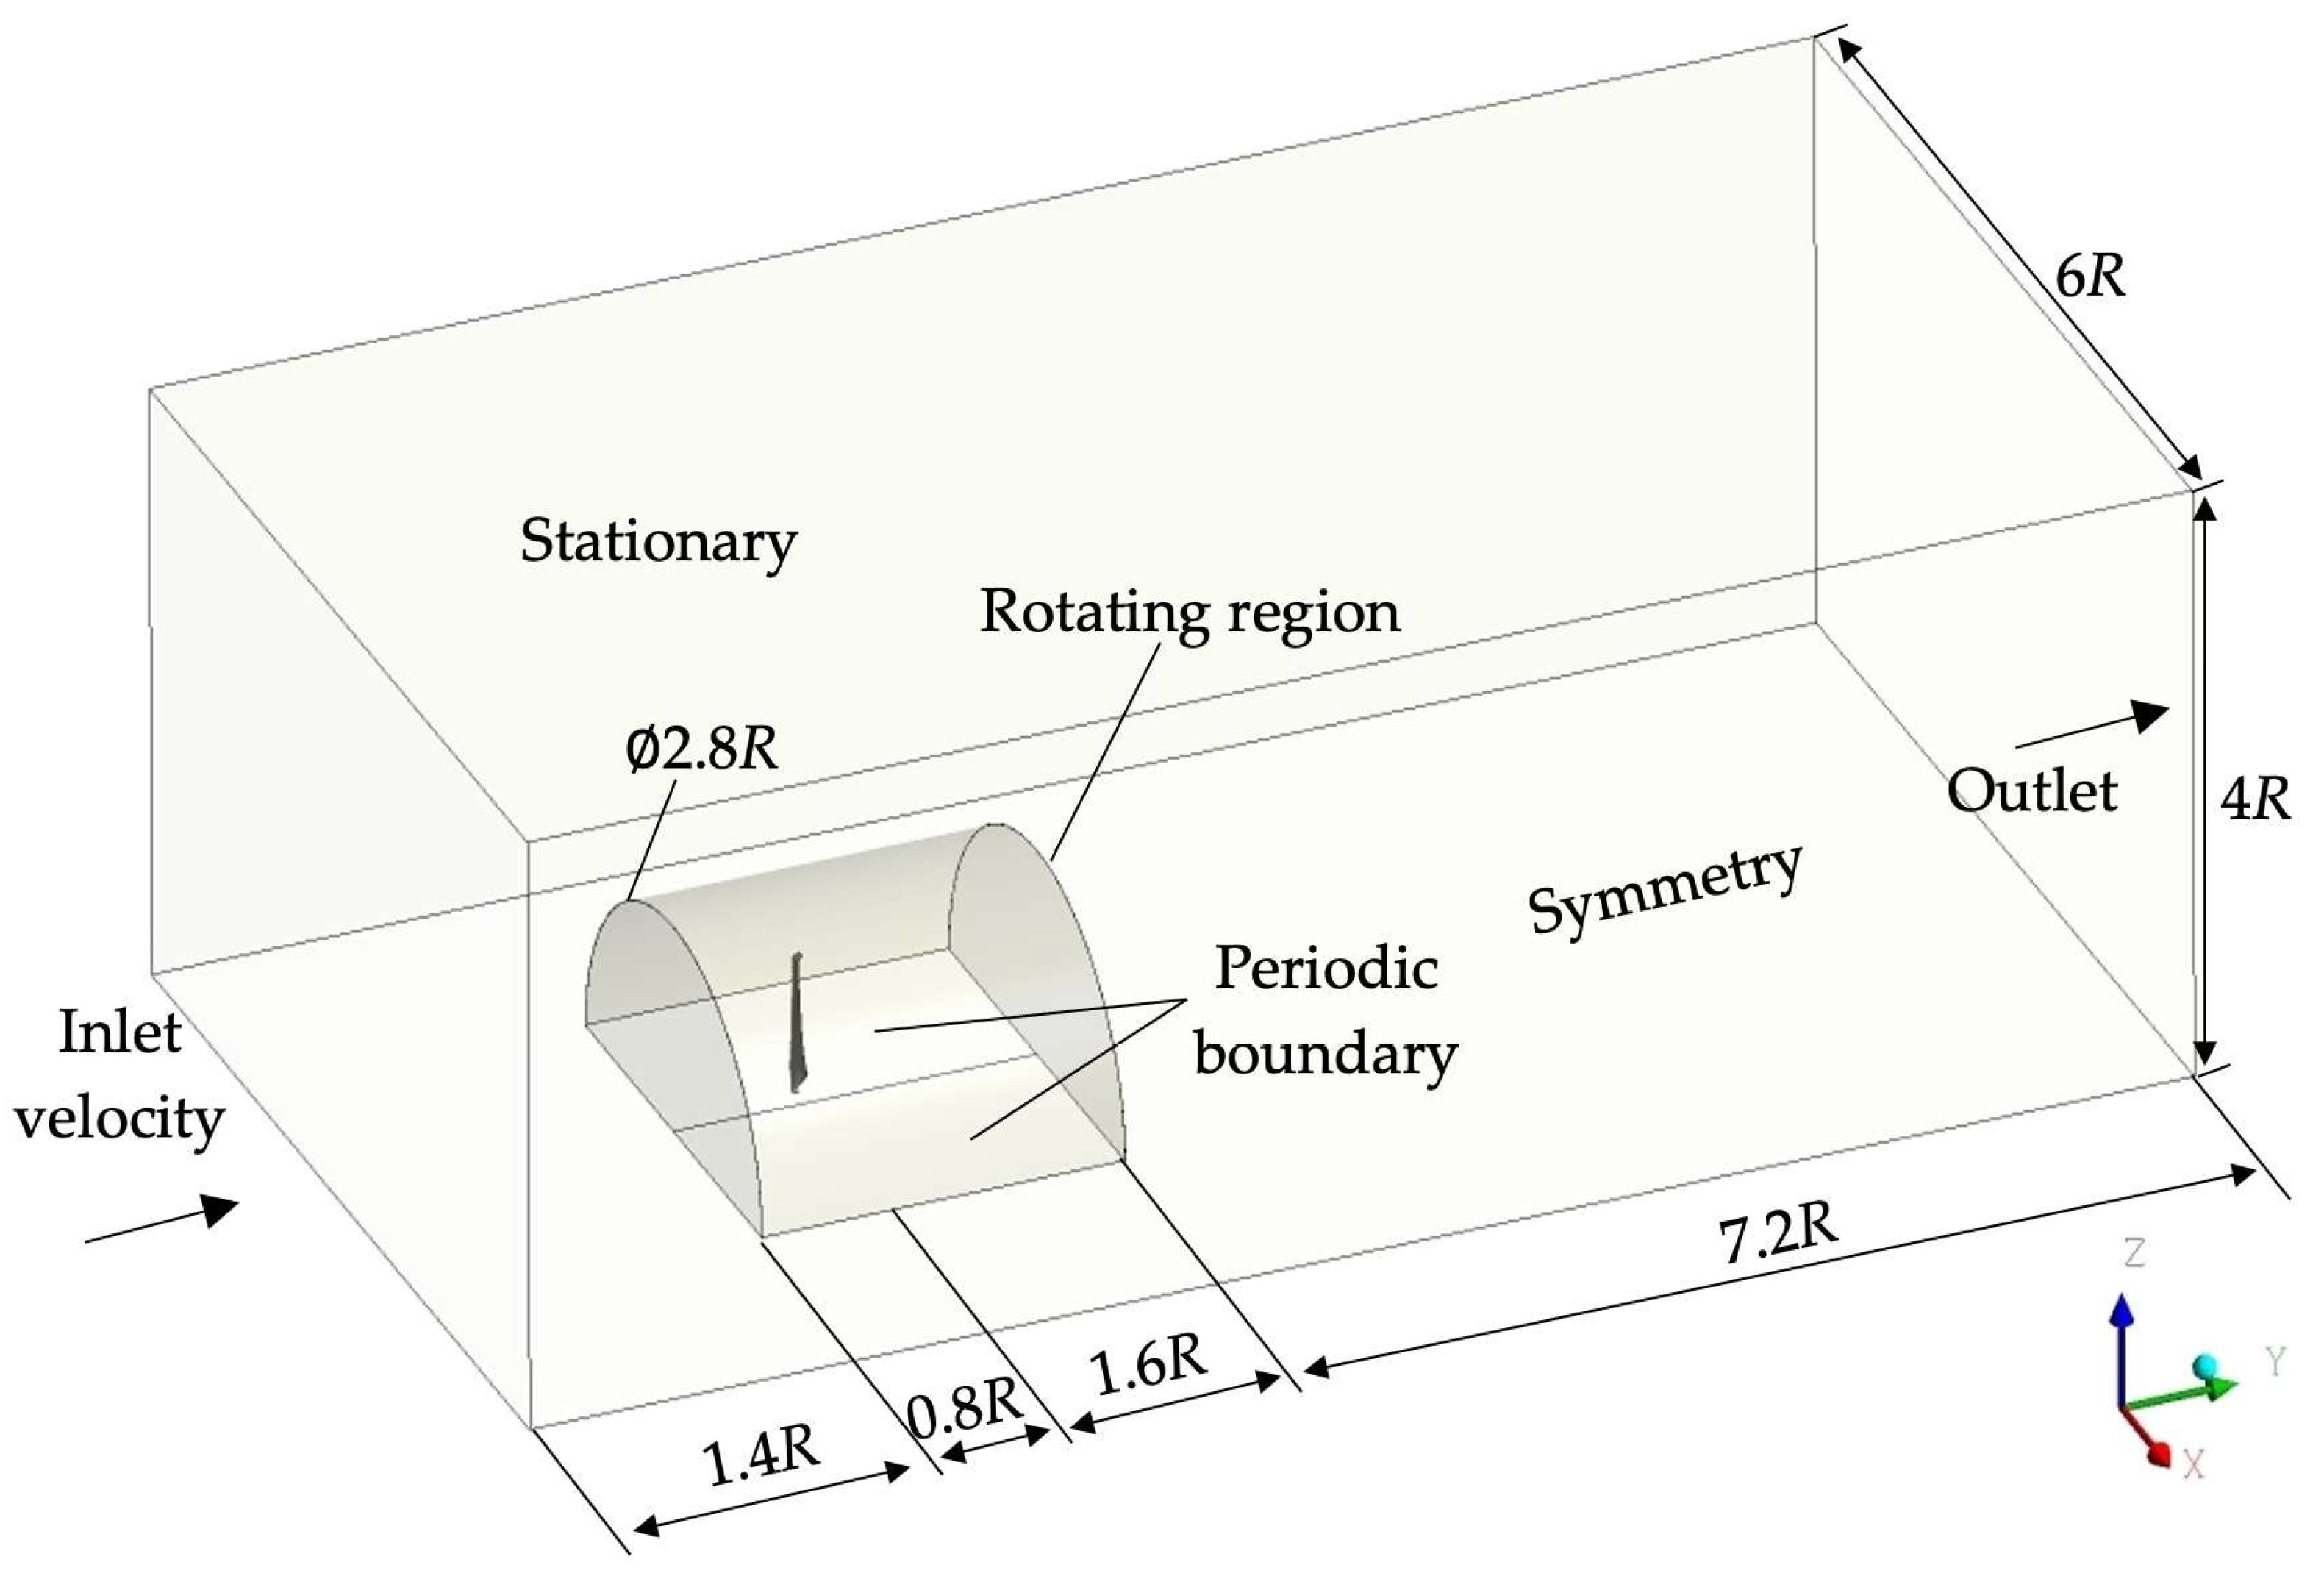
Figure 3 depicts the computational domain featuring the inlet and the outlet boundaries, located at a distance of 2.2R and 8.8R, respectively, from the blade. The NREL Phase VI wind turbine originally had two blades [20], but in this study, only a single blade was modeled because the focus is on the effect of the winglet configuration on the blade performance, rather than on detailed unsteady flow phenomena including blade-to-blade interactions. Such modeling has also been employed in many studies [13,14,15,17,19,25,27] and has shown acceptable results. The domain is a rectangular hexahedron and consists of two regions: rotating and stationary [12,28]. To model the interaction between the two regions, the moving reference frame (MRF) approach was selected for its compatibility with the RANS solver. This approach is a steady-state approximation model that is stabilized by introducing an additional acceleration term in the moving frame and allows us to specify different rotational and translational speeds for the rotating and stationary regions [26]. Therefore, the MRF approach is more suitable for predicting the aerodynamic characteristics around rotating blades than the sliding mesh approach [26,29,30], which is suitable for unsteady calculations, and is widely used in calculations for rotating machines [12,13,15,17,18,25]. A symmetry boundary condition was imposed on the blade counterpart. The rotating region was defined as a MRF to model the rotating motion of the blade. More detailed boundary conditions are shown in Table 5.
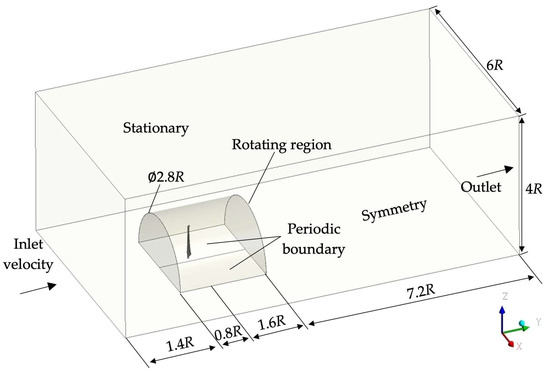
Figure 3.
Computational domain.
Table 5.
Boundary conditions and their value.
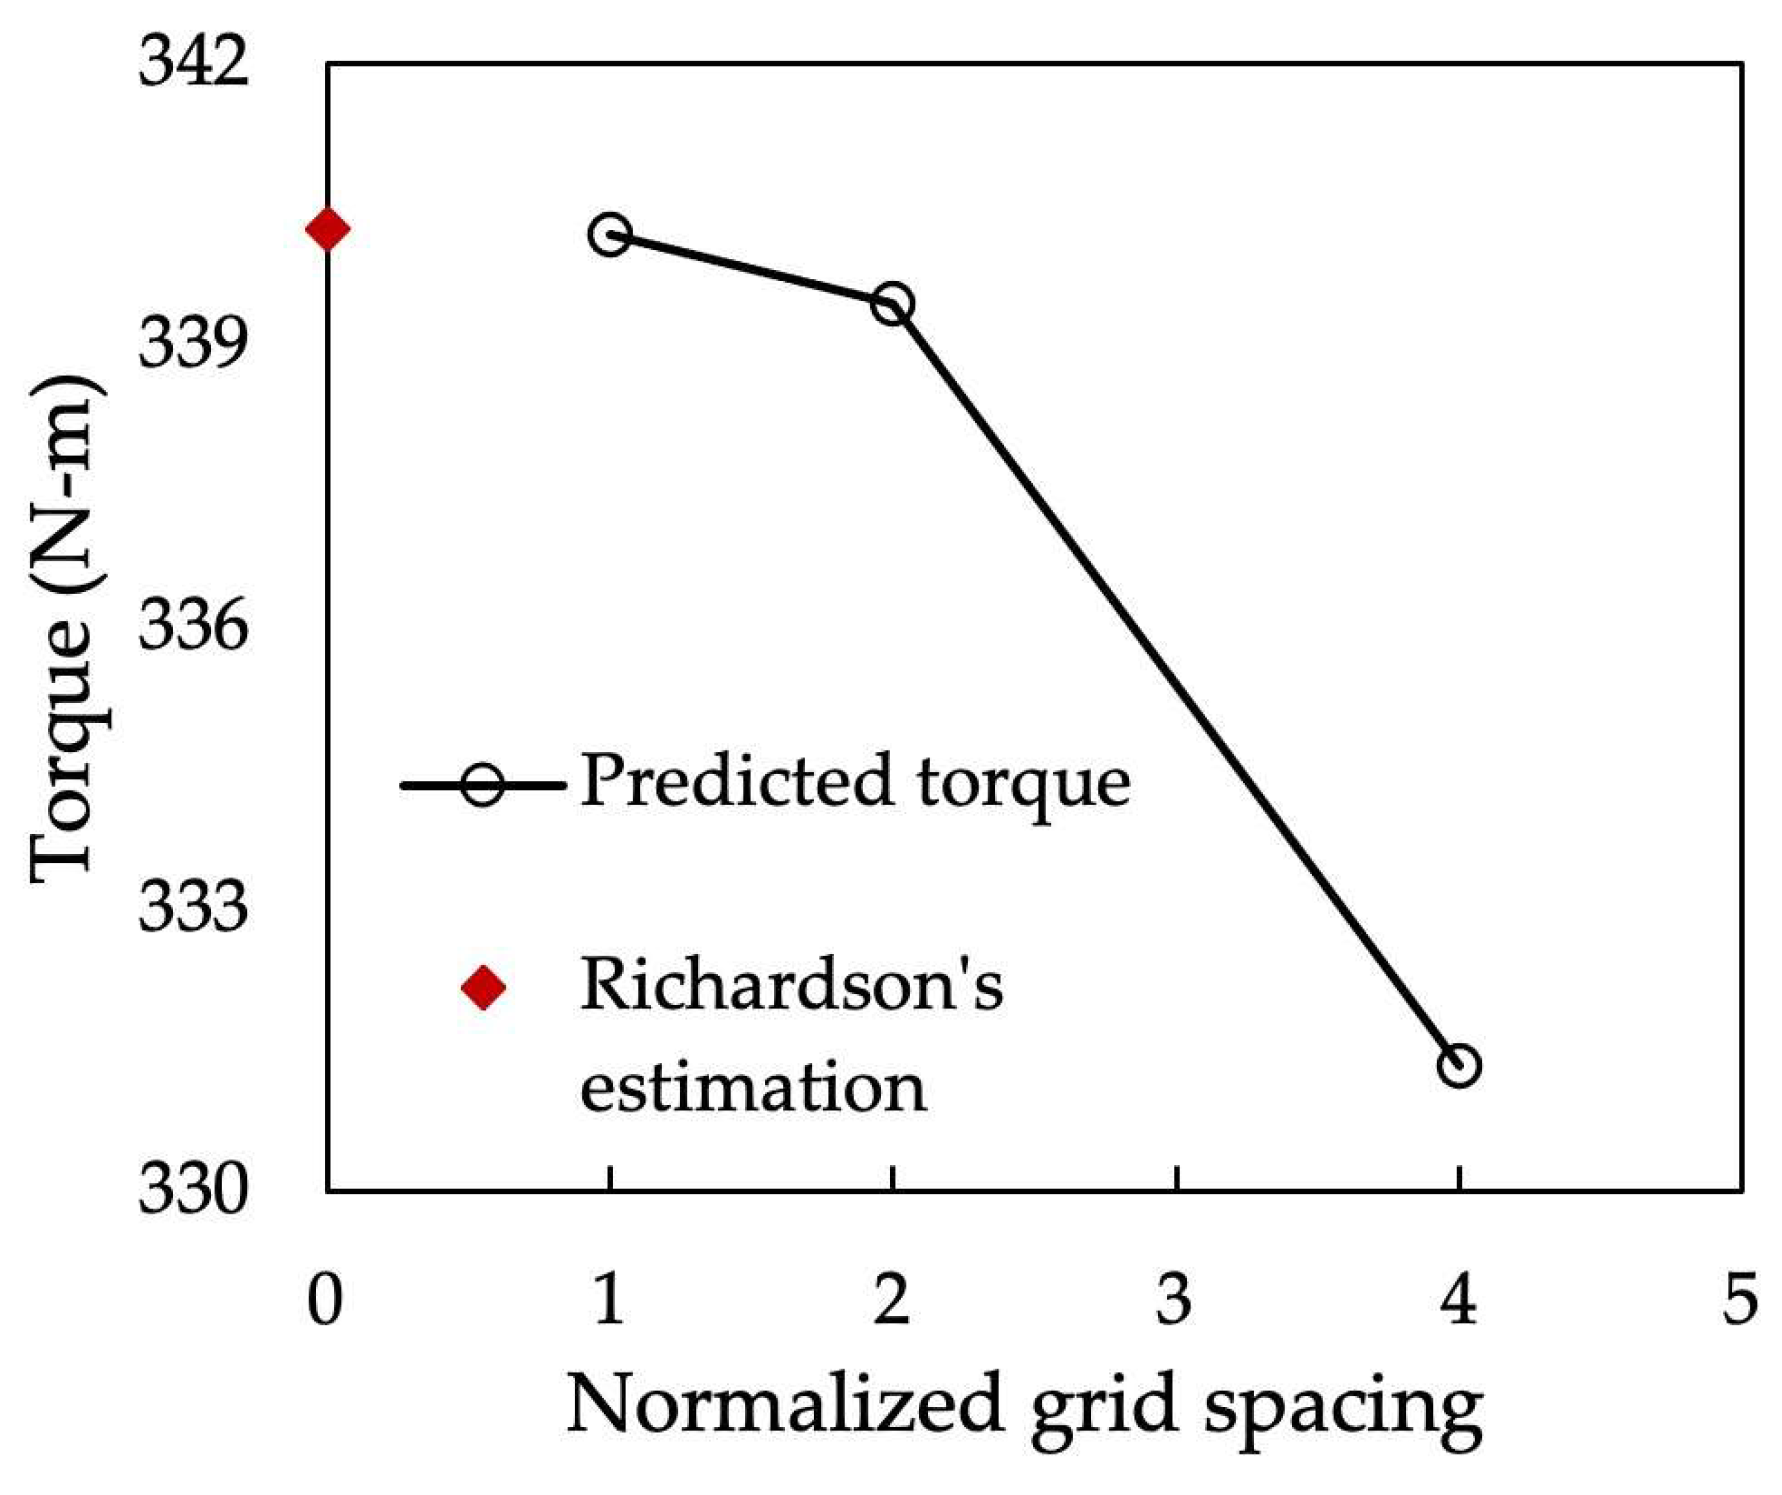
An unstructured tetrahedral mesh was generated to analyze the flow field, as shown in Figure 4, by using the built-in mesh generator in FLUENT [26]. A structured prism mesh consisting of 10 inflation layers was provided on the near-wall of the blade to increase the accuracy of the solutions. The height of the first cells of the inflation layer was kept close to the y+ value of 1. The effective size of the mesh was determined by observing the torque outputs at a wind speed of 7 m/s. As listed in Table 6, three different meshes were generated using a mesh refinement ratio of 2, and the torque was calculated with these meshes. The first refinement resulted in a significant difference in torque values between the coarse and medium meshes, while the second refinement yielded almost identical values between the medium and fine meshes. The grid independence test was performed on these three meshes, and the asymptotic range of convergence obtained from the grid convergence index (GCI) [31] of the torques was 0.98. This value is approximately one, indicating that the solutions are well within the asymptotic range of convergence. Figure 5 shows the predicted torque with varying mesh spacings. The abscissa indicates the mesh spacing normalized by the spacing of the fine mesh. As the mesh spacing decreases, the torque approaches an asymptotic zero-mesh spacing value of 340.2 obtained from the Richardson extrapolation [31], and both the fine and medium meshes predict almost grid independent solutions. Therefore, in this study, the medium-size mesh of 2,751,754 cells was selected for all simulations to reduce the computing time.
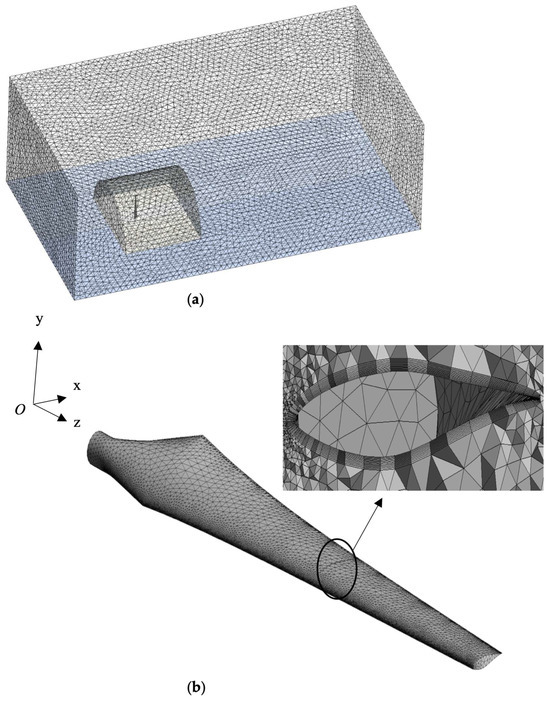
Figure 4.
Computational grid for (a) full domain and (b) blade surface and inflation layers around the blade.
Table 6.
Mesh size and torque values.
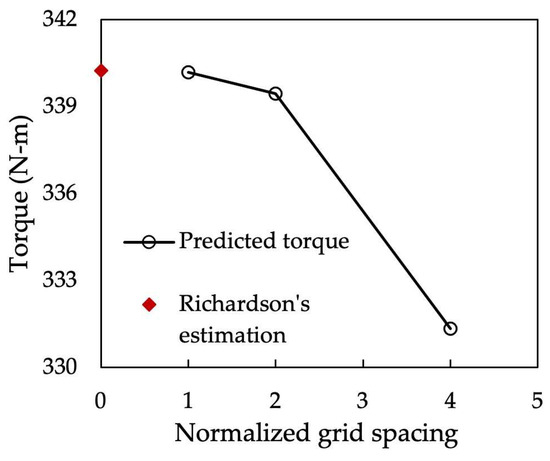
Figure 5.
Comparison between the predicted torque and the Richardson’s estimation.
3. Results
3.1. Validation of Computational Method
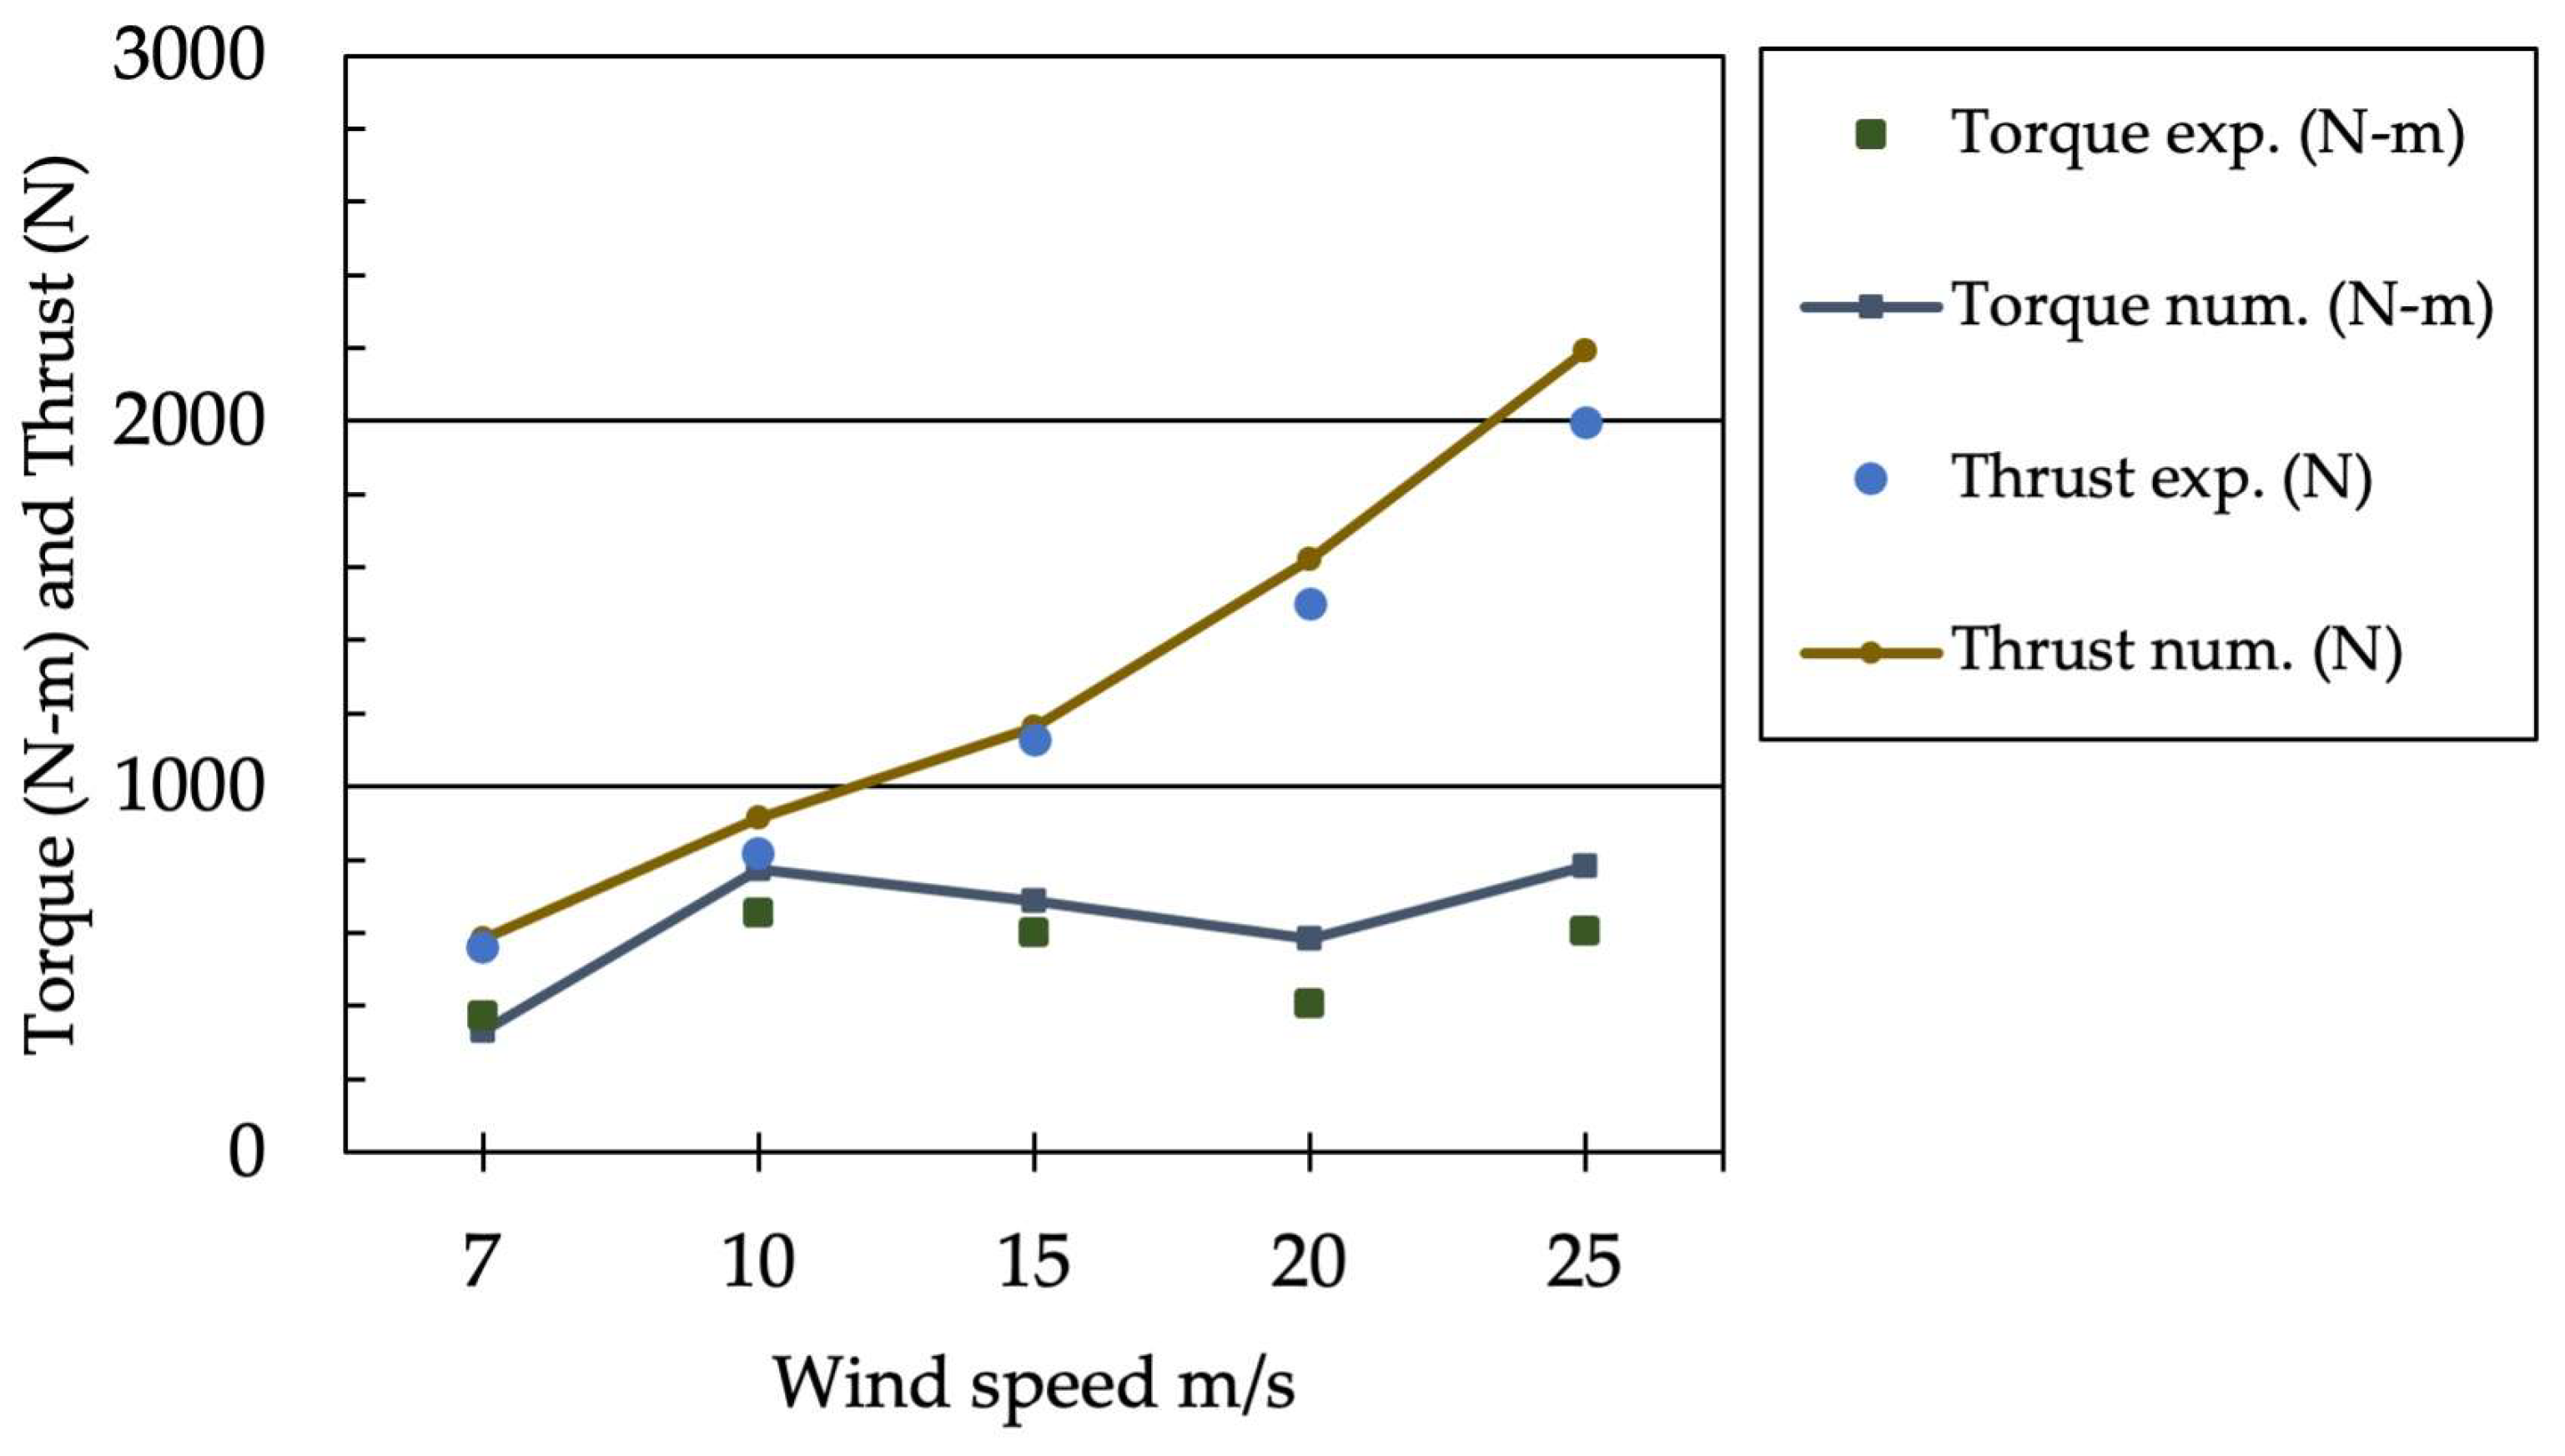
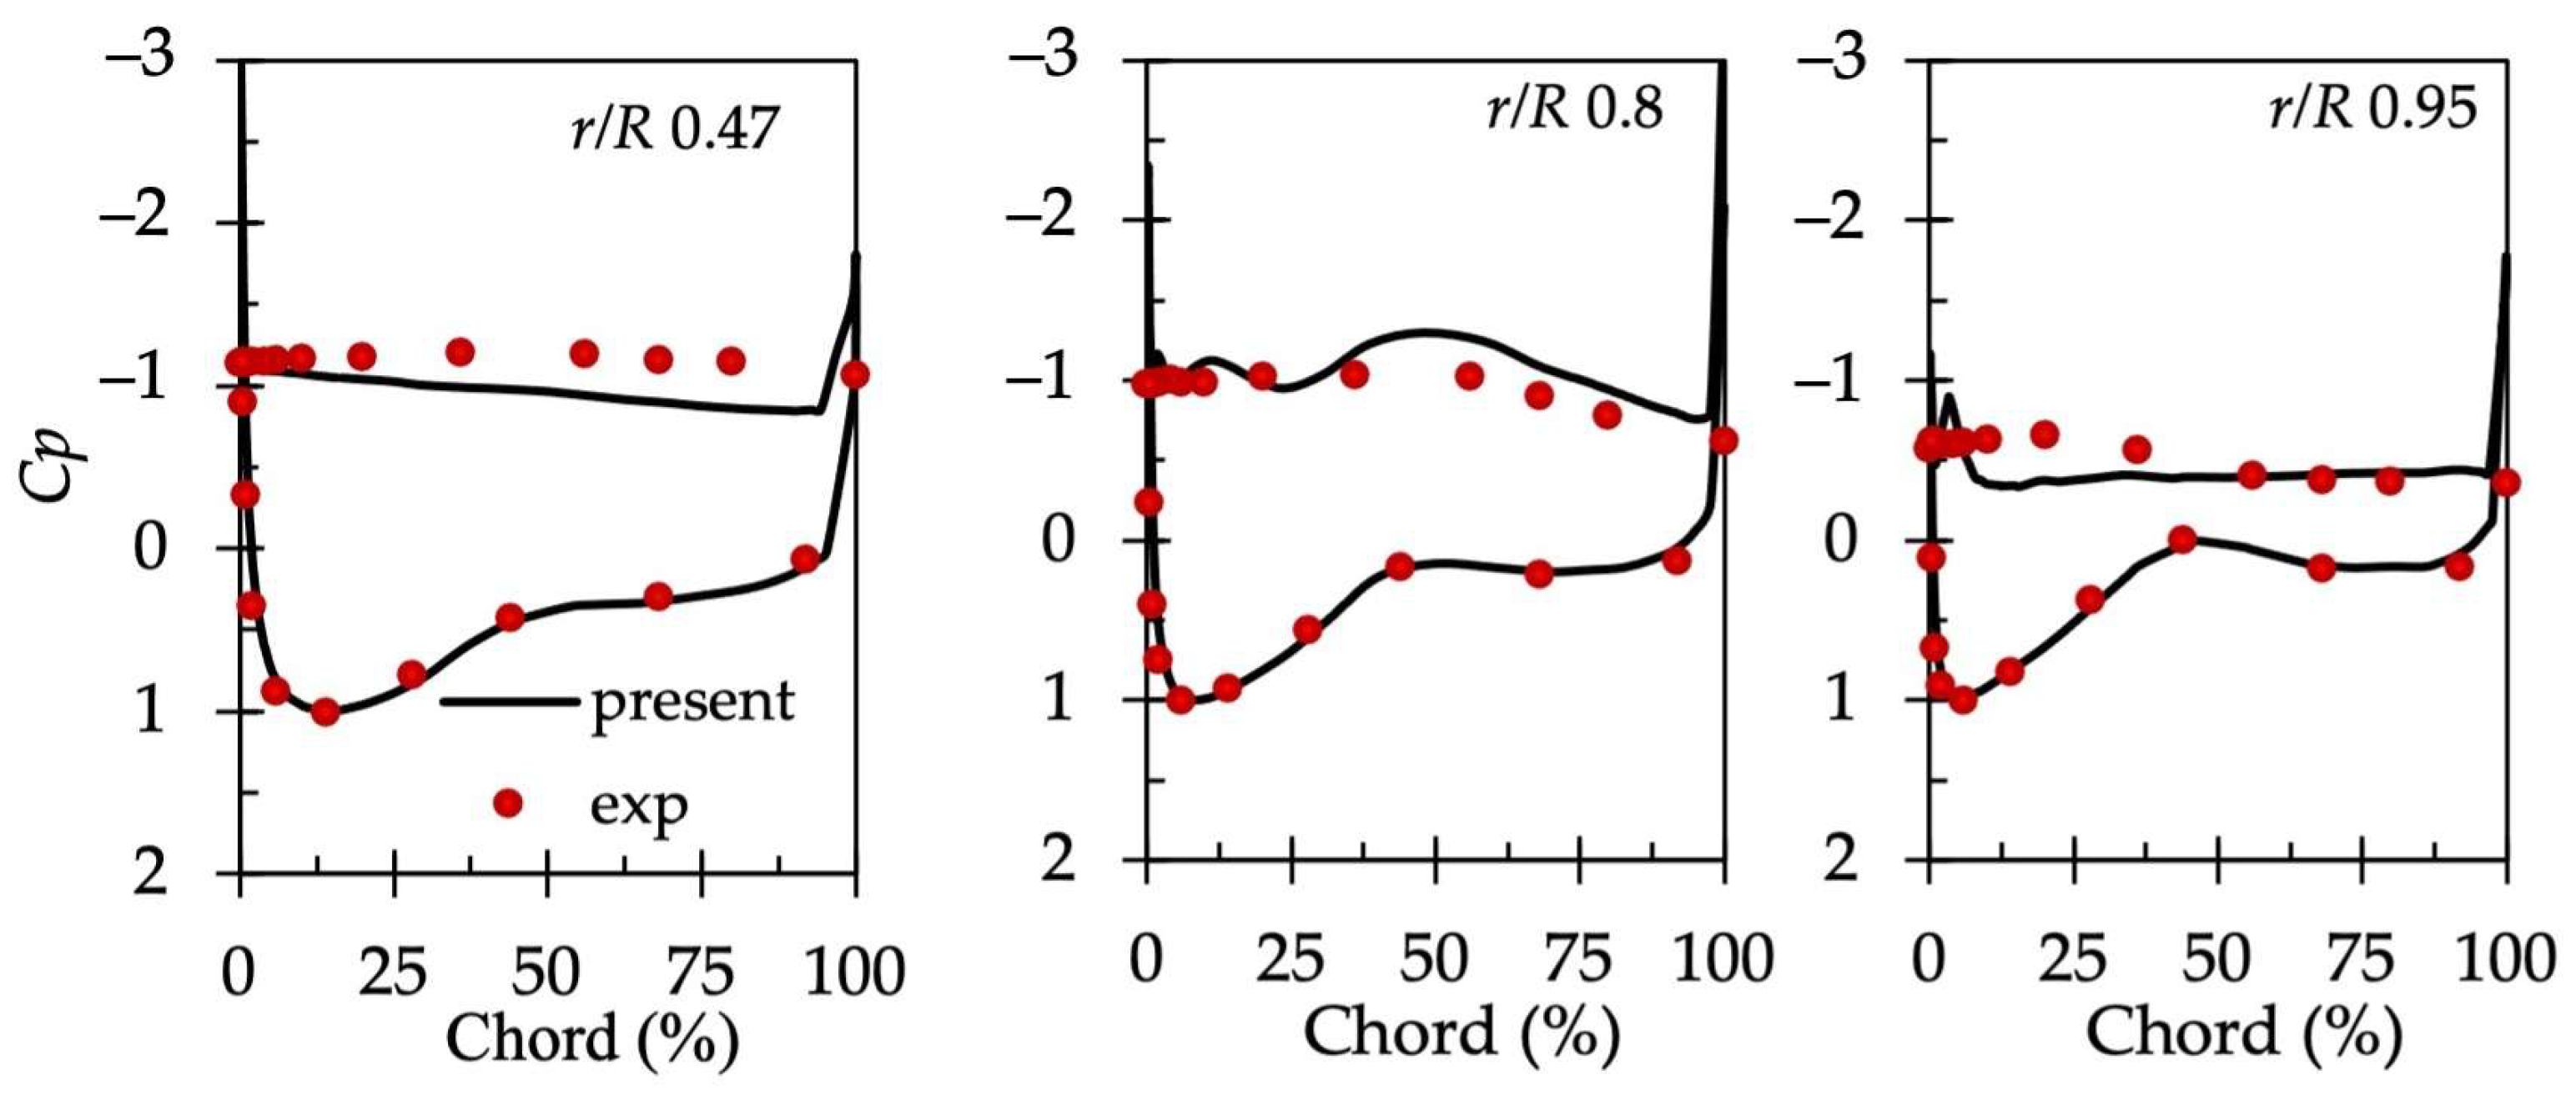
The numerical solutions were validated with the experimental data from the NREL Phase VI [20] wind turbine before the investigation of the winglets. The torque and thrust per blade from the experiments were compared with the present numerical results at wind speeds of 7, 10, 15, 20, and 25 m/s, as illustrated in Figure 6. At low-to-medium wind speeds (7, 10, and 15 m/s), the results indicate considerably accurate predictions. However, when the wind speed increases to 20 and 25 m/s, the results show a discrepancy [13,14,15,32]; this is assumed to be because when the flow becomes significantly separated and stalls, as reported in the literature [13,32,33], the turbulence model may not be able to capture such flows adequately. For this issue, further consideration is needed regarding the adoption of turbulence models that can effectively predict high-speed flows including the separation and stall. Another reason for the discrepancy is thought to be a mismatch between the geometrical models used in the computations and experiments [20,34]. As explained in the previous section, although the model was reasonably simplified with a single blade model to match the focus of this study, it cannot accurately capture unsteady flow phenomena such as interactions between the tower, nacelle, and blades that may occur dominantly in high-speed flow experiments, and their effects on fluid forces. Overall, however, the present results are in good agreement with the findings from the experiments.

Figure 6.
Comparison of torque and thrust from the present results with the experimental data.
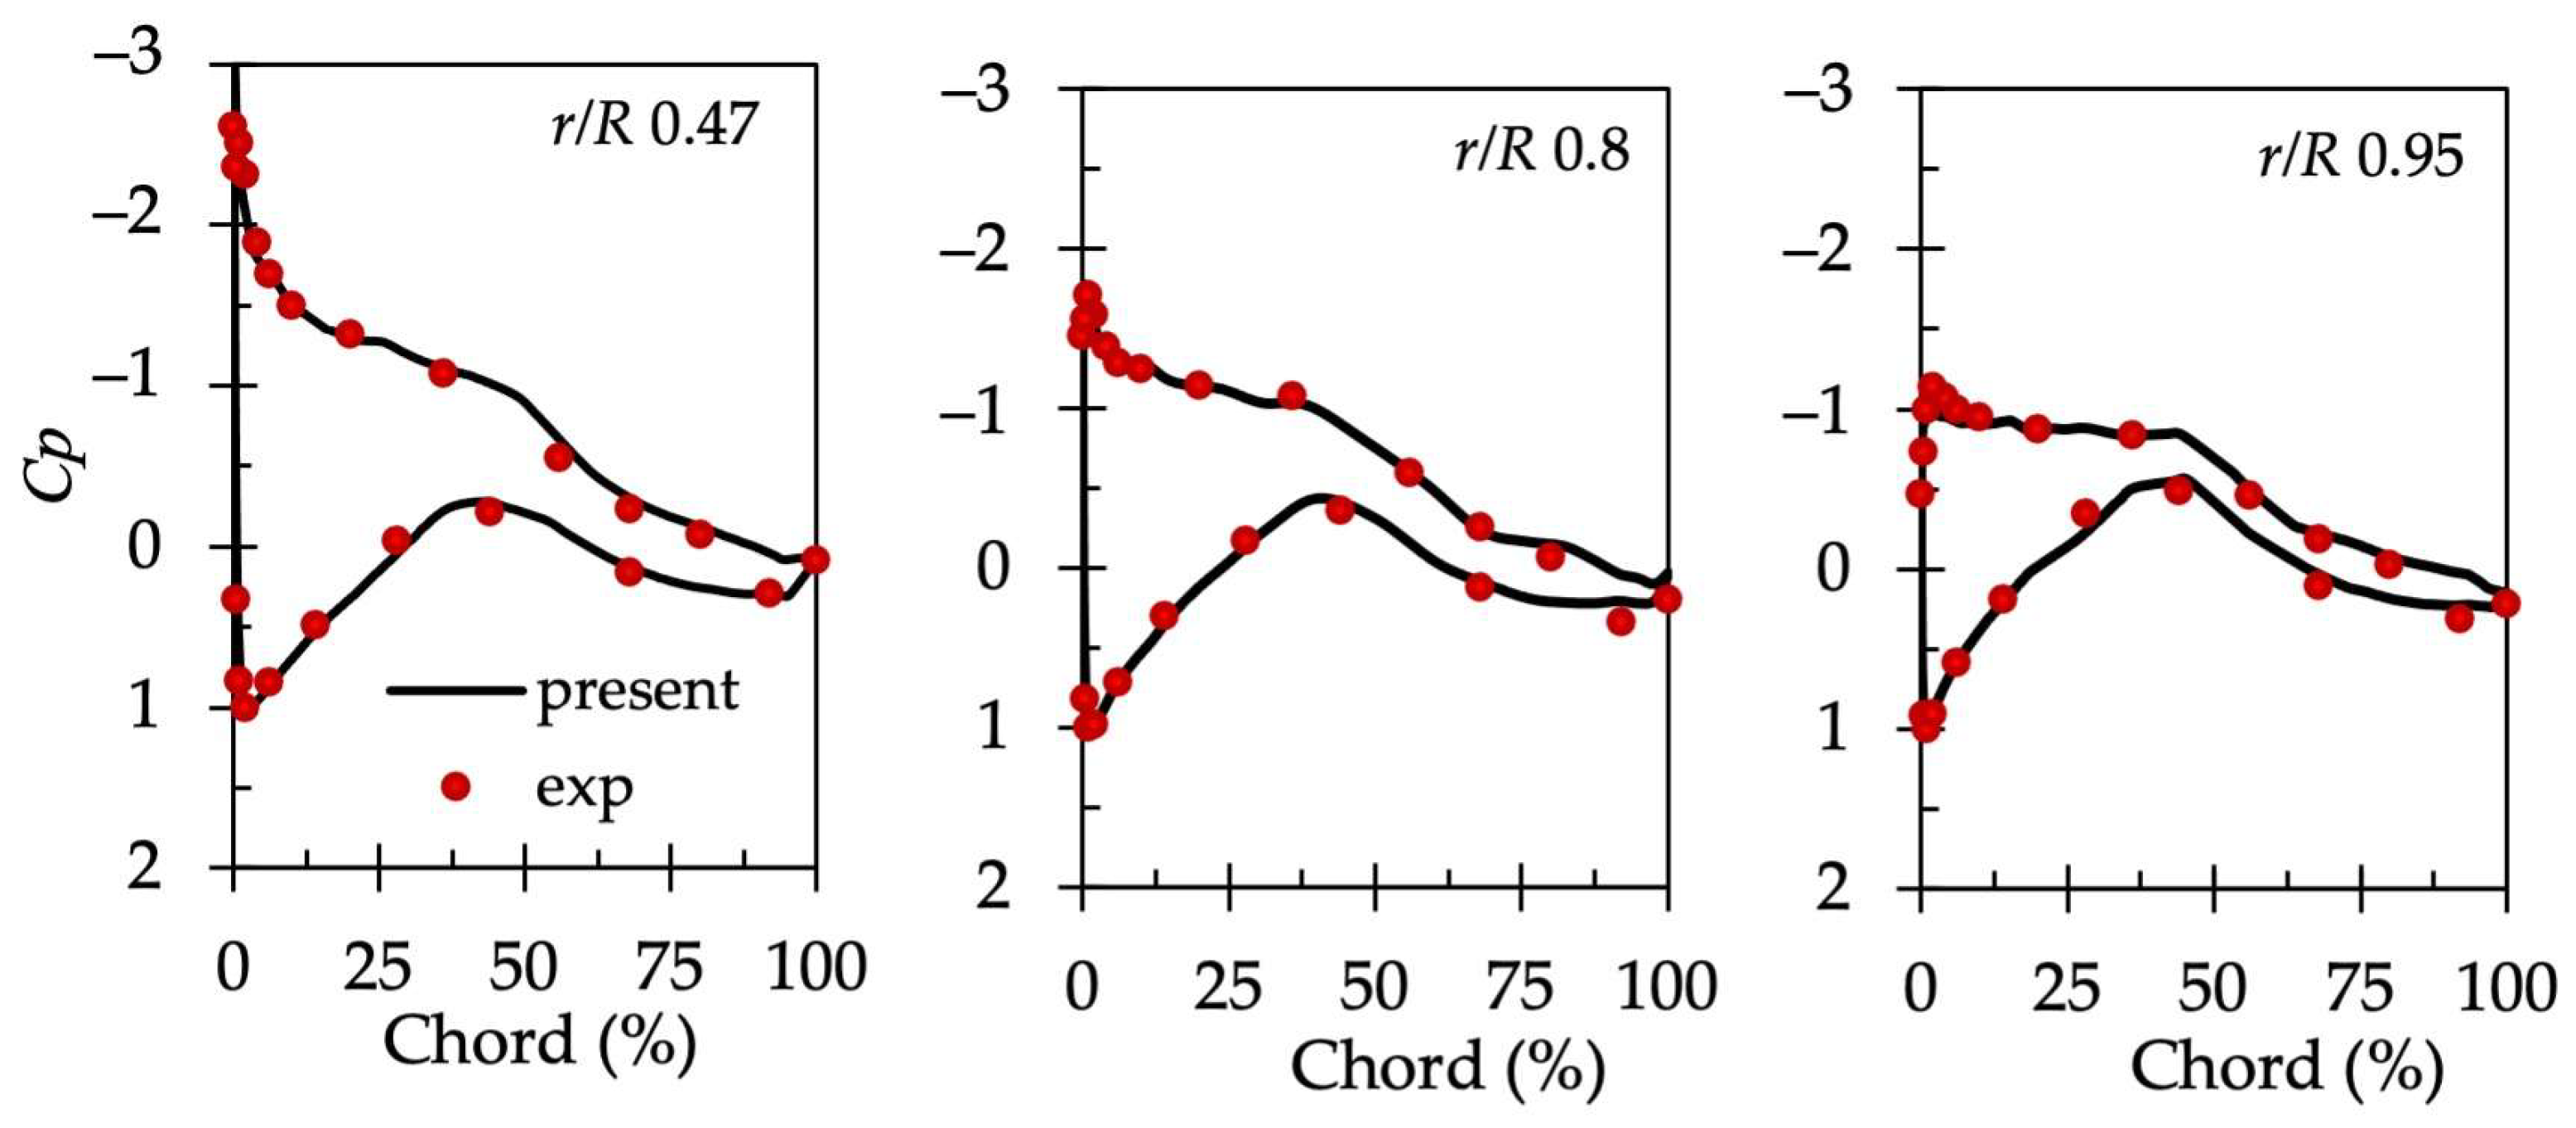
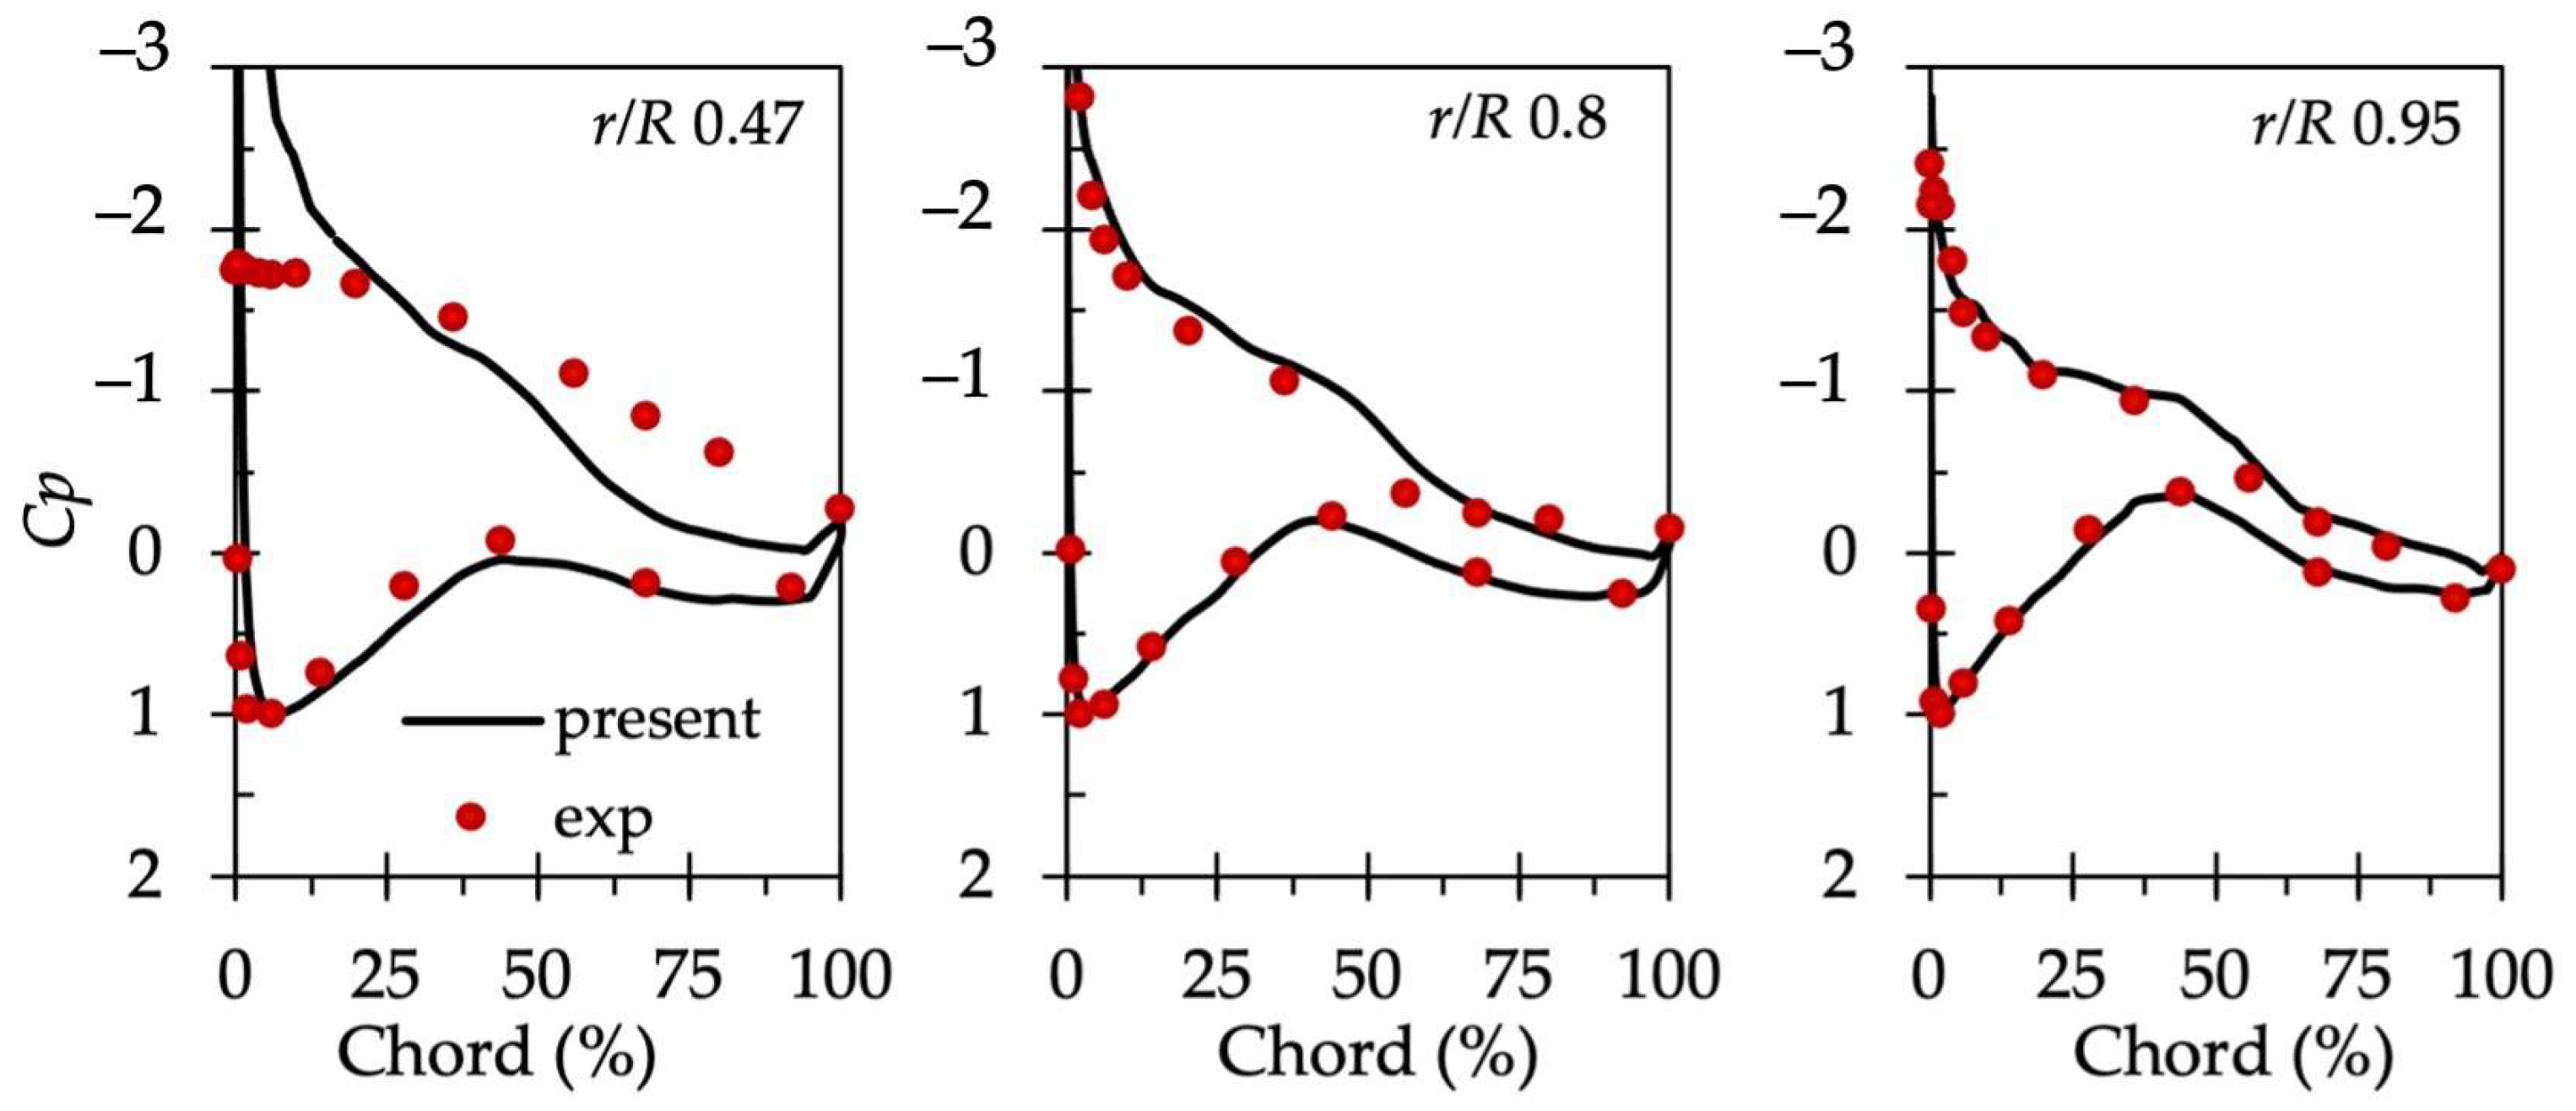
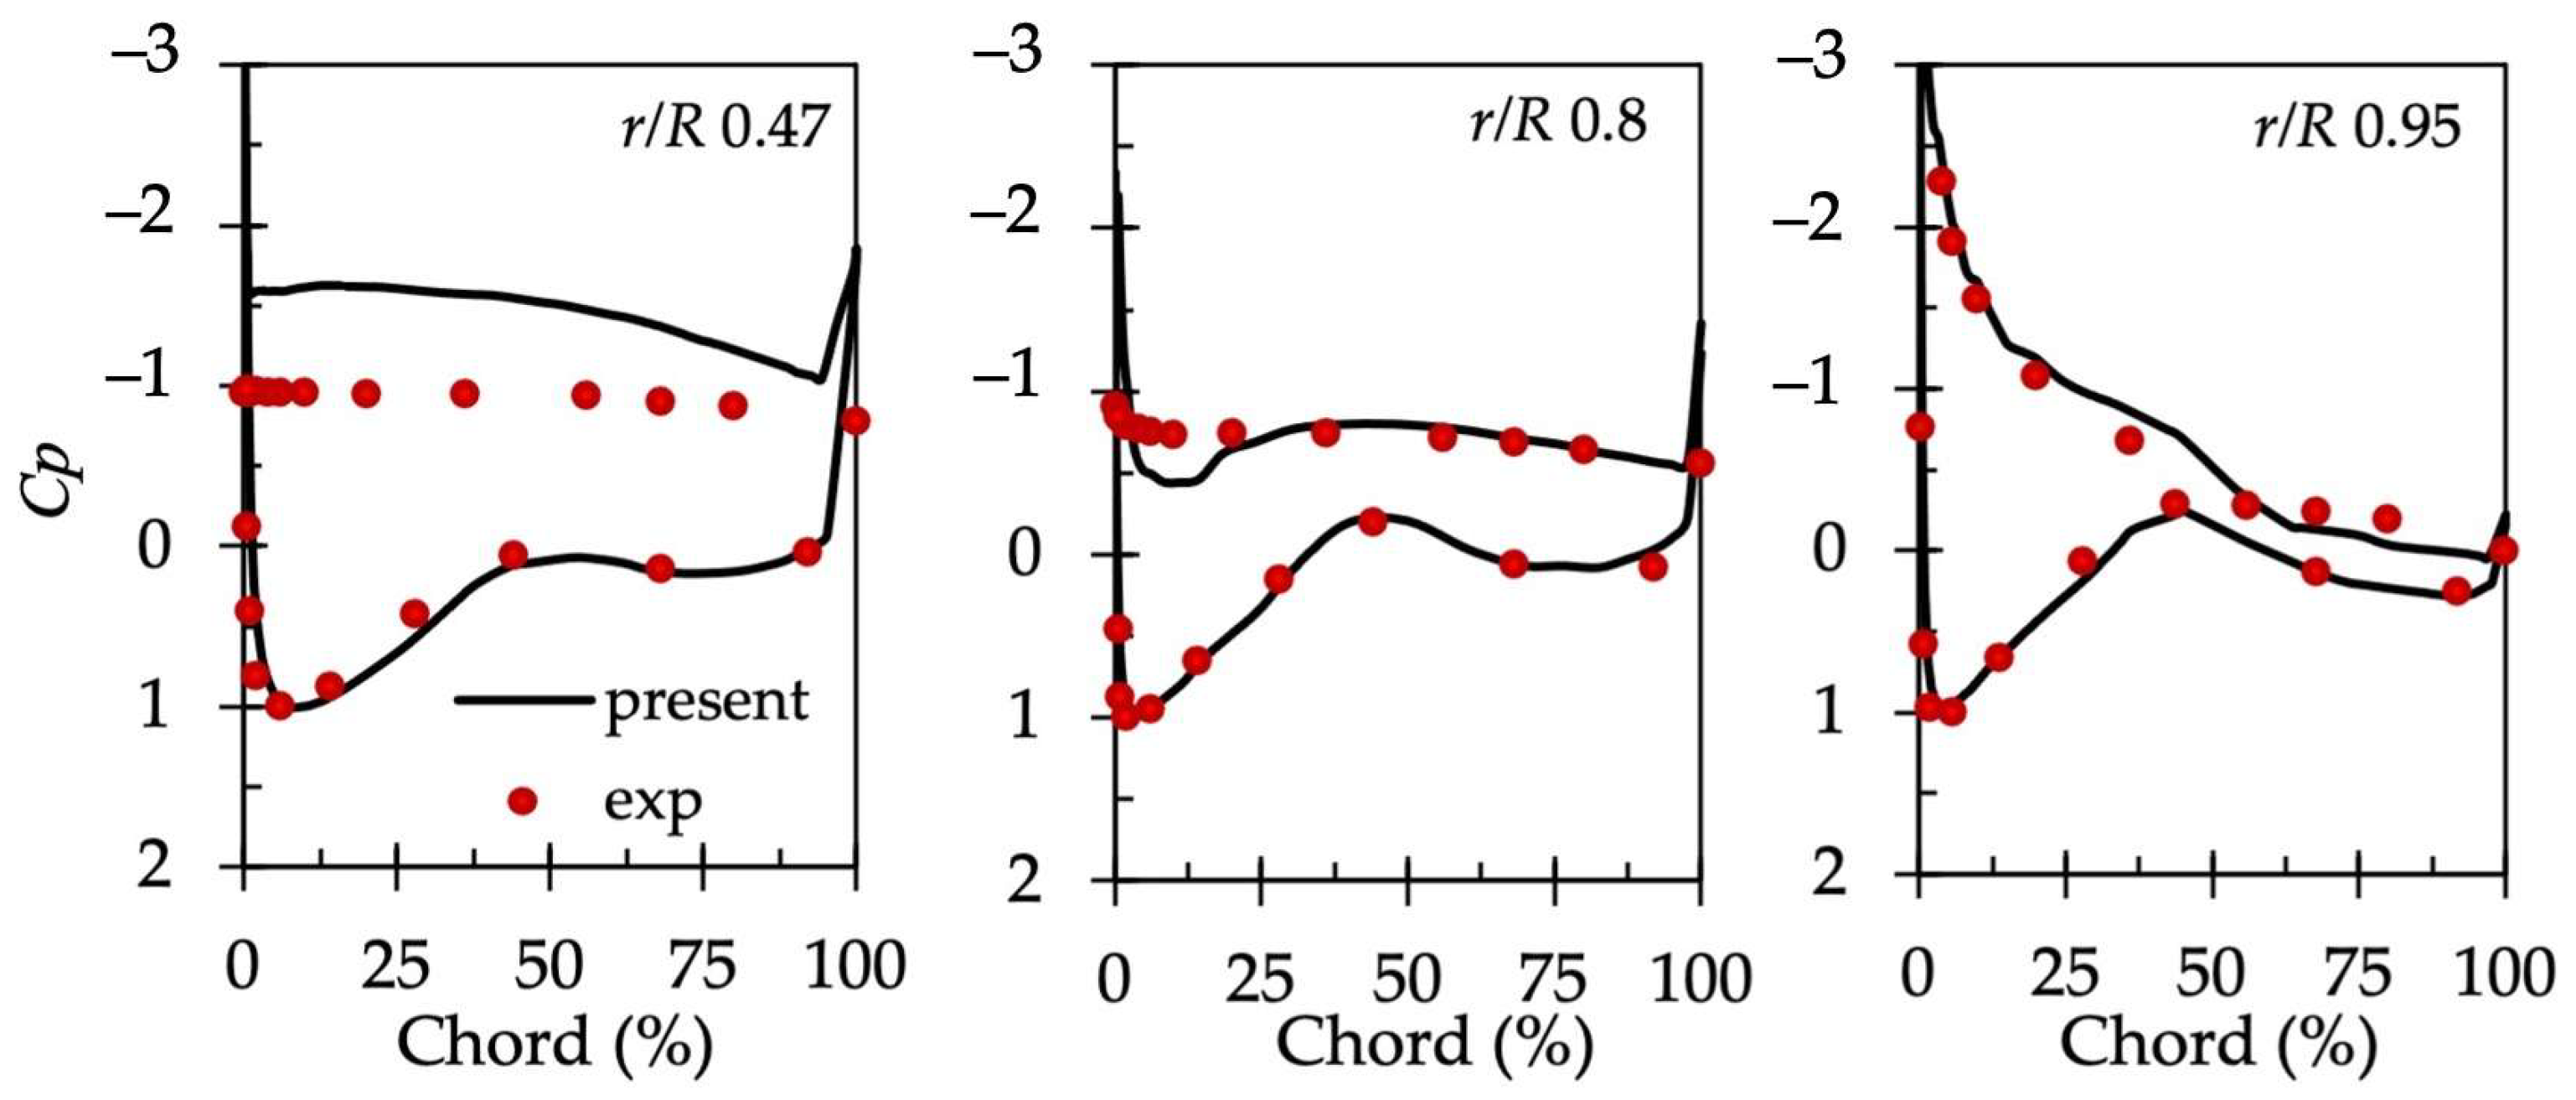
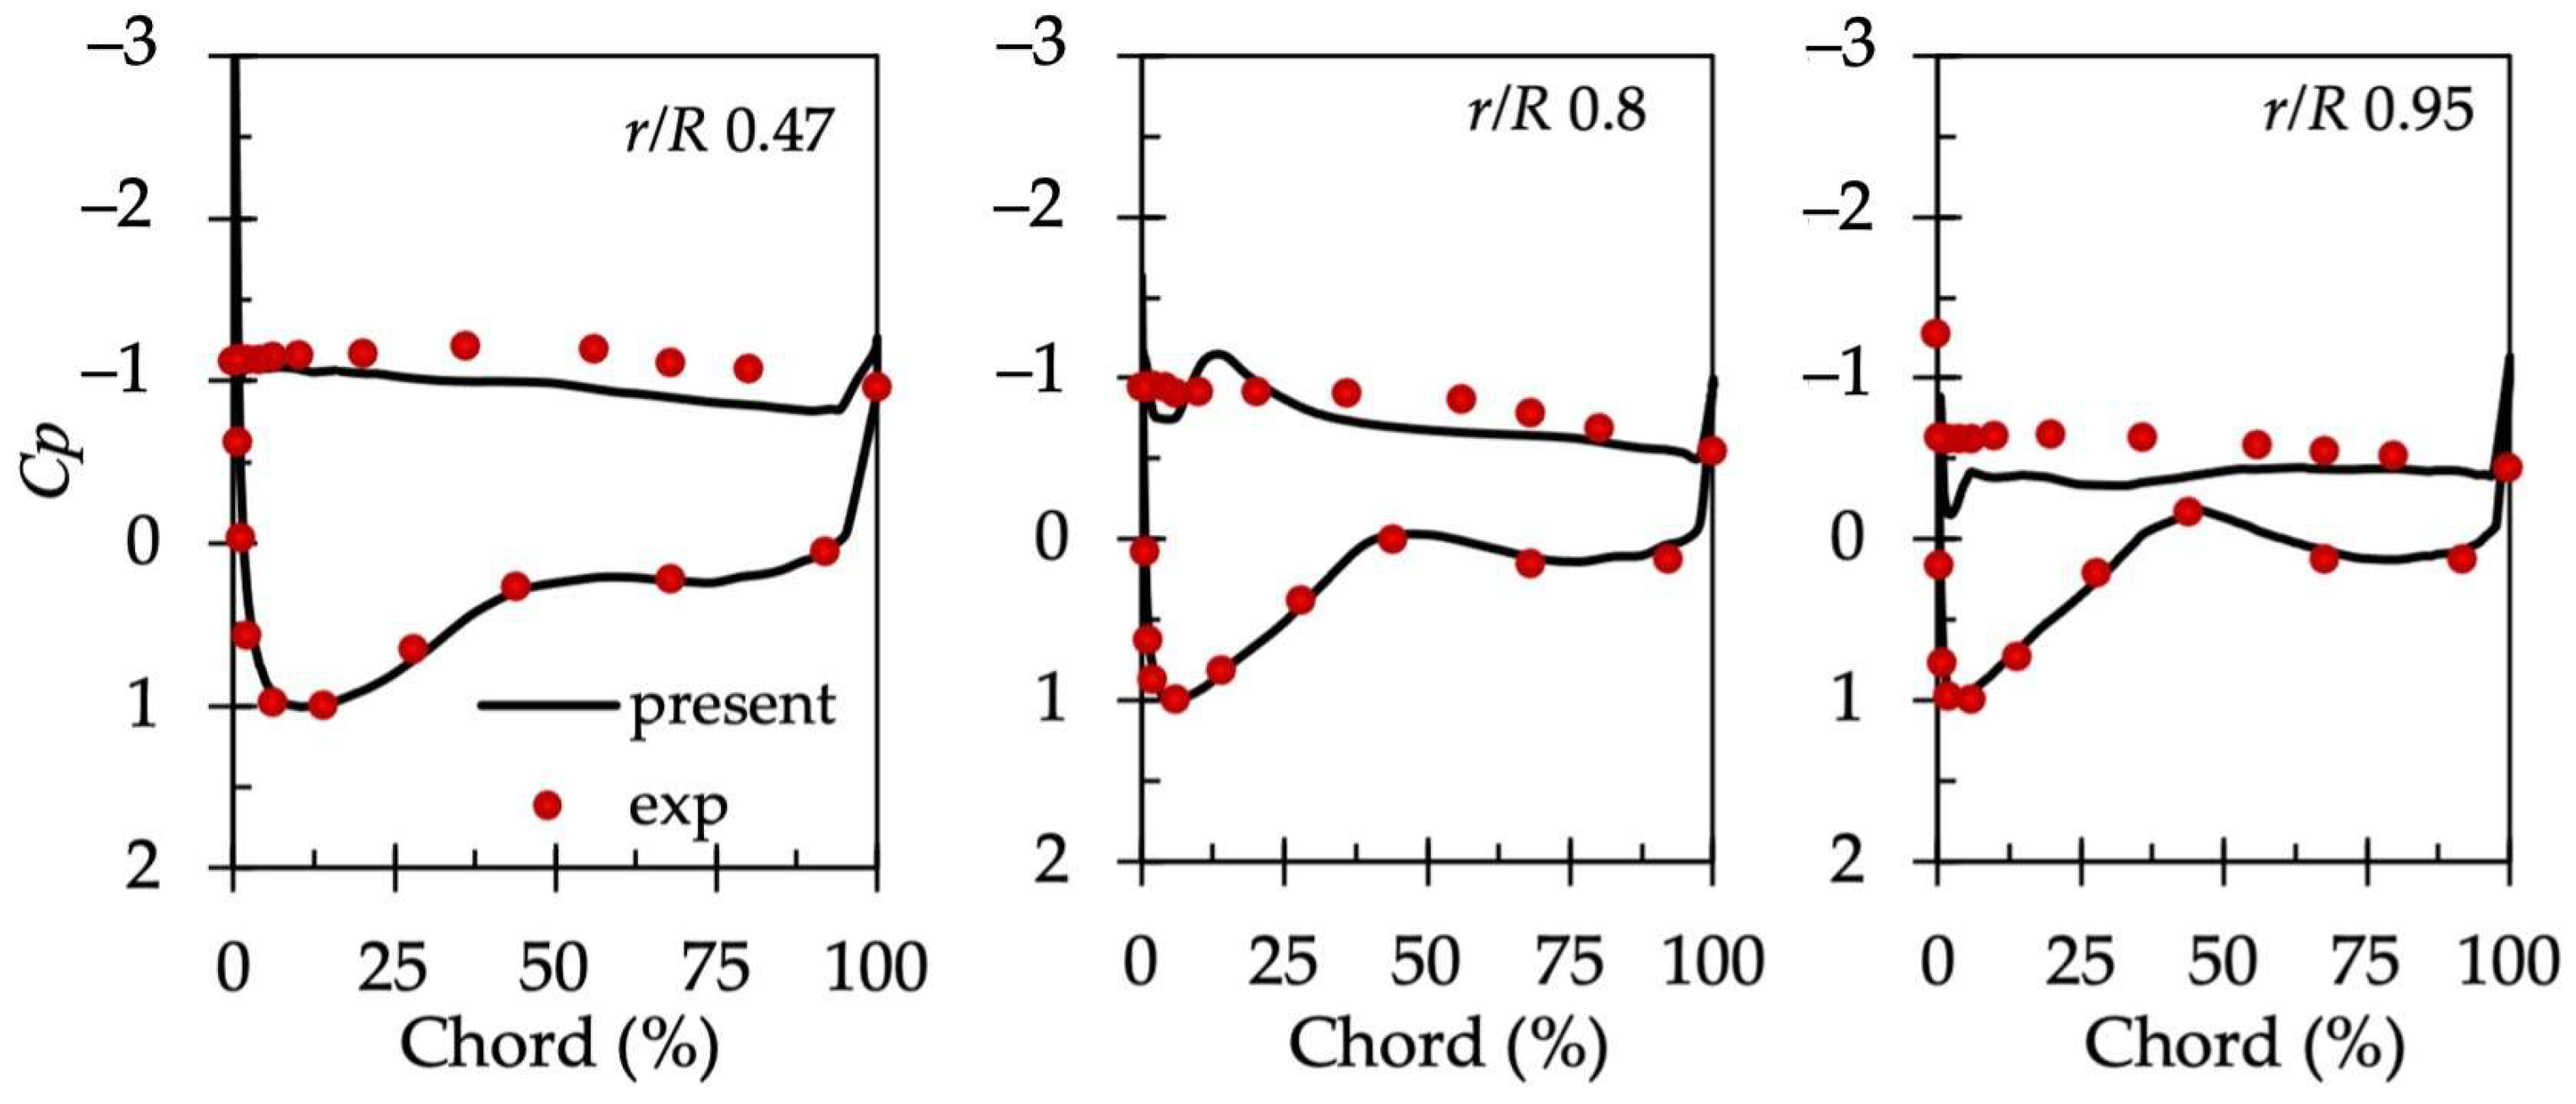
For further validation, the pressure coefficient Cp was investigated and compared with the experiments at several blade span locations. The Cp was calculated as with , where U and are the wind speed and freestream pressure, and and r are the blade angular velocity and blade span locations [10].
Figure 7, Figure 8, Figure 9, Figure 10 and Figure 11 show comparisons of Cp distributions at blade spans of r/R = 0.47, 0.8, and 0.95. At a low wind speed of 7 m/s, the Cp shows a considerably good agreement with the experimental findings. When flow separation begins to appear from the blade root to the midspan at a wind speed of 10 m/s, discrepancies arise between the predictions and experimental data, since a partially separated flow becomes more difficult to predict [32]. However, these discrepancies become smaller toward the blade tip.

Figure 7.
Comparison of Cp distribution at a wind speed of 7 m/s.

Figure 8.
Comparison of Cp distribution at a wind speed of 10 m/s.
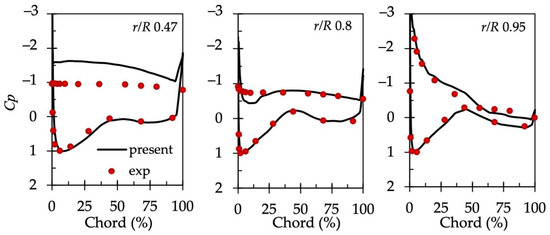
Figure 9.
Comparison of Cp distribution at a wind speed of 15 m/s.
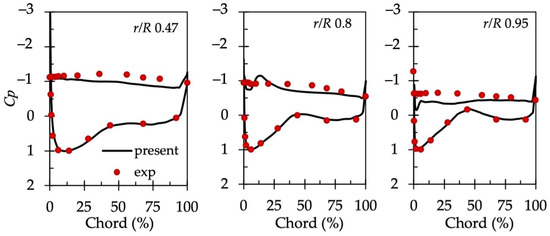
Figure 10.
Comparison of Cp distribution at a wind speed of 20 m/s.
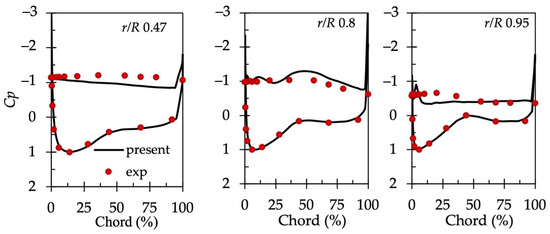
Figure 11.
Comparison of Cp distribution at a wind speed of 25 m/s.
3.2. Single-Swept Configuration
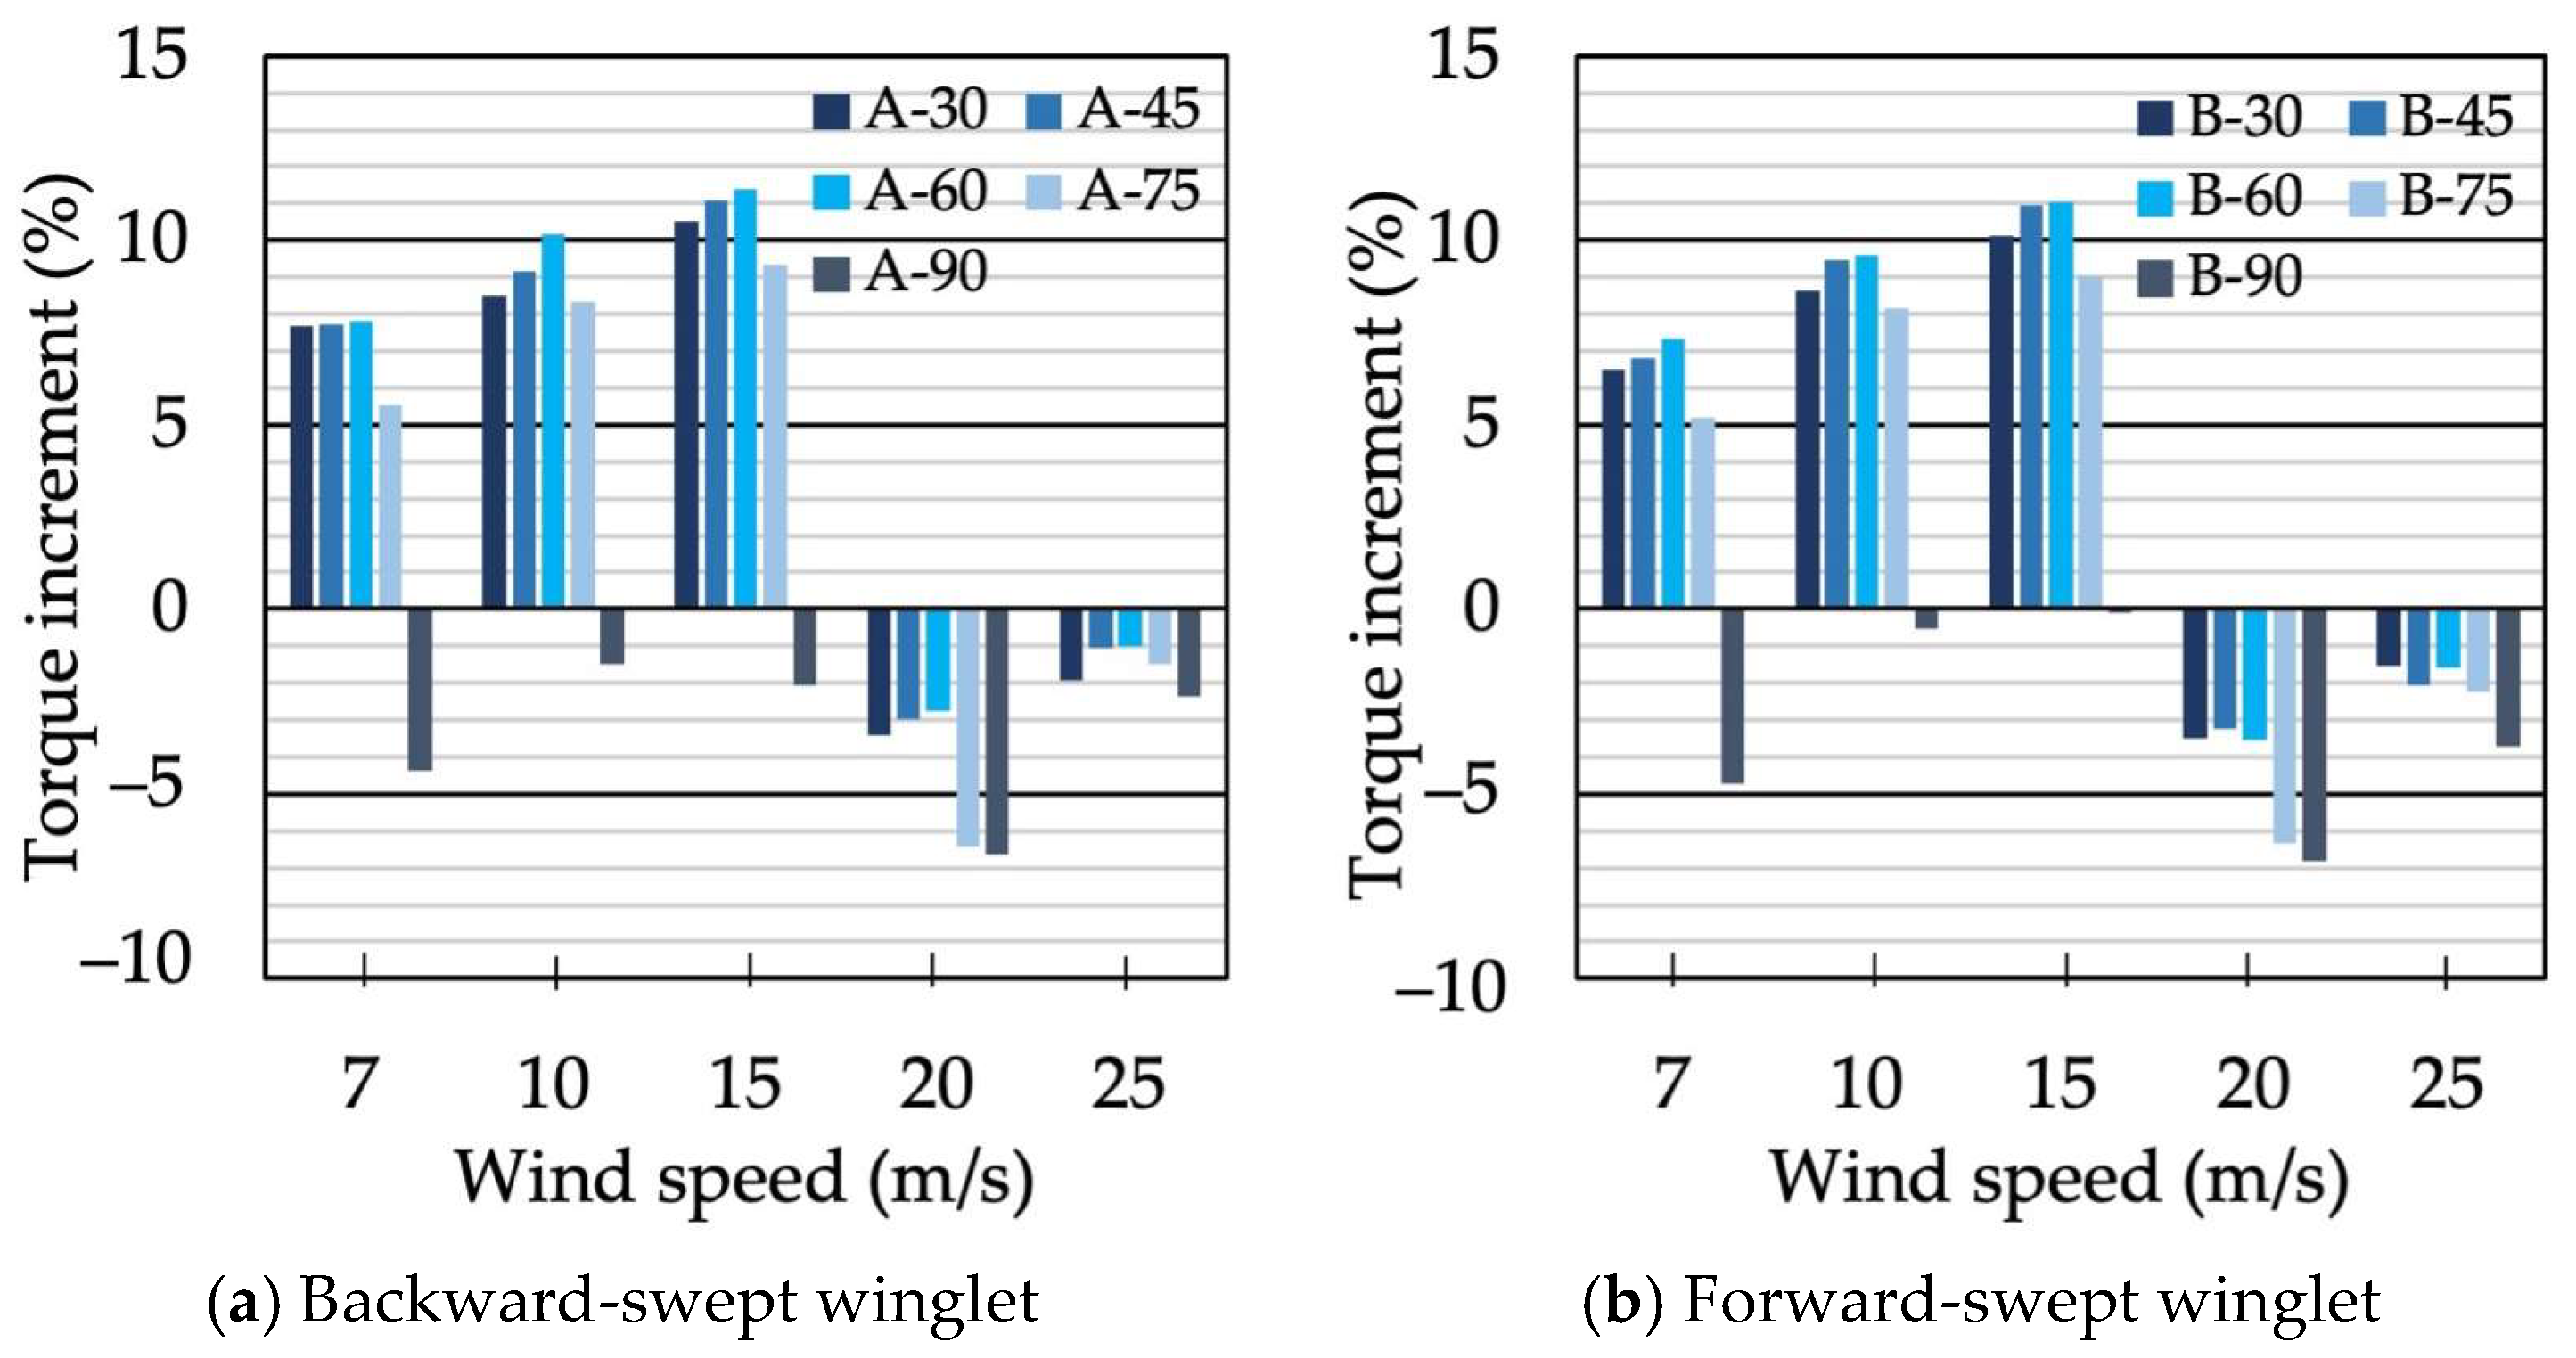
The torque increment induced by each winglet configuration relative to the baseline blade is shown in Figure 12. Figure 12a, b show the numerical results for backward-swept (positive sweep angle) and forward-swept (negative sweep angle) winglets with the winglet parameters given in Table 1. In both cases, torque increases with wind speeds up to 15 m/s, except for A-90 (cant angle 90°), and then decreases [12]. At a wind speed of 20 m/s, torque was the most reduced, and was lower than the baseline. Regarding the effect of cant angles, torque increased as the cant angle increased to 60°, but presented a tendency to decrease when the angle exceeded 75°. In particular, when the cant angle was 90°, torque decreased regardless of the wind speed in the range of 7 to 25 m/s. Furthermore, backward-swept winglets showed a better winglet effect than forward-swept winglets, although the difference was relatively small [18].
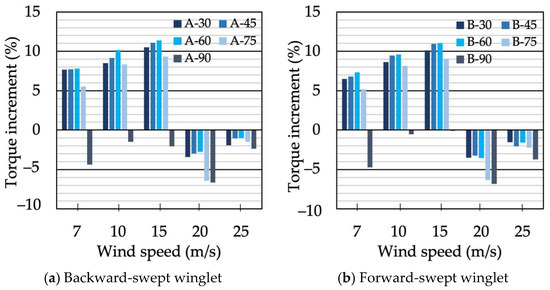
Figure 12.
Comparison of torque increment of winglet configurations with different cant angles.
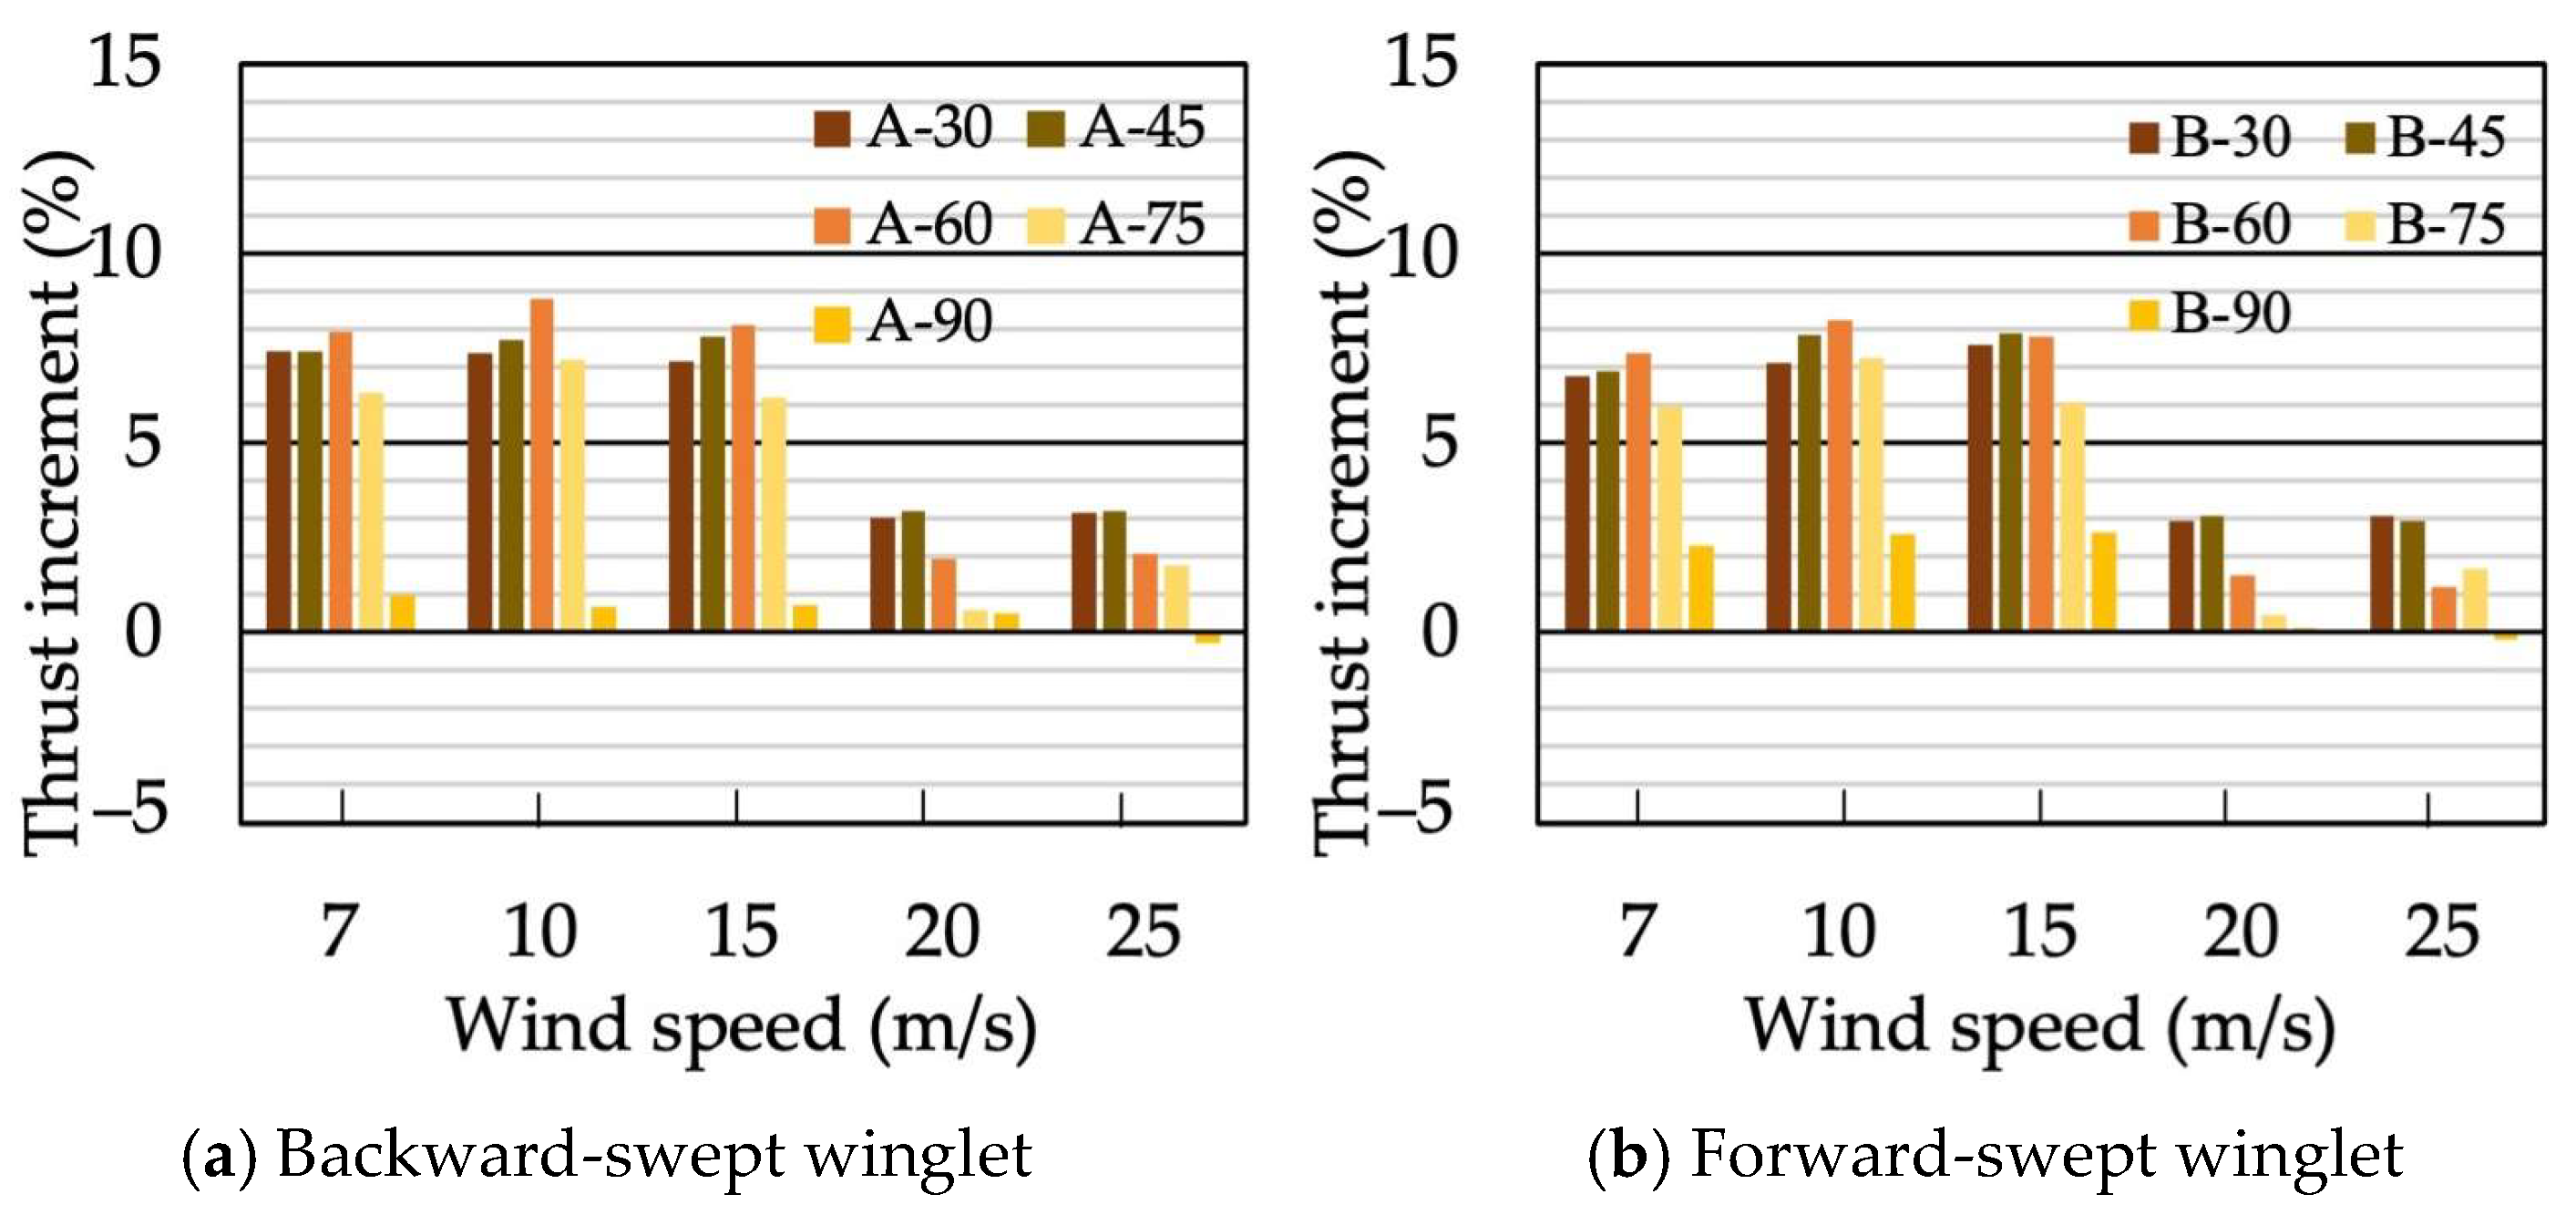
Figure 13 shows comparisons of the increments in thrust. Similar to the effect of winglets on torque in Figure 12, we can see that thrust increases as torque increases by the improvement of lift due to the scale of the tip vortices and their influence, as illustrated in Figure 14. Thrust increment also decreases rapidly when the wind speed exceeds 20 m/s.
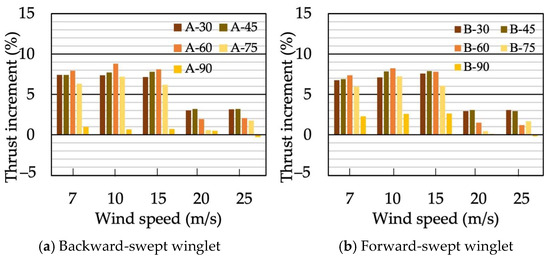
Figure 13.
Comparison of thrust increment of winglet configurations with different cant angles.
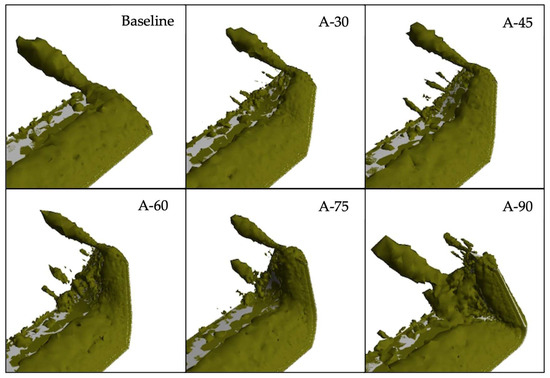
Figure 14.
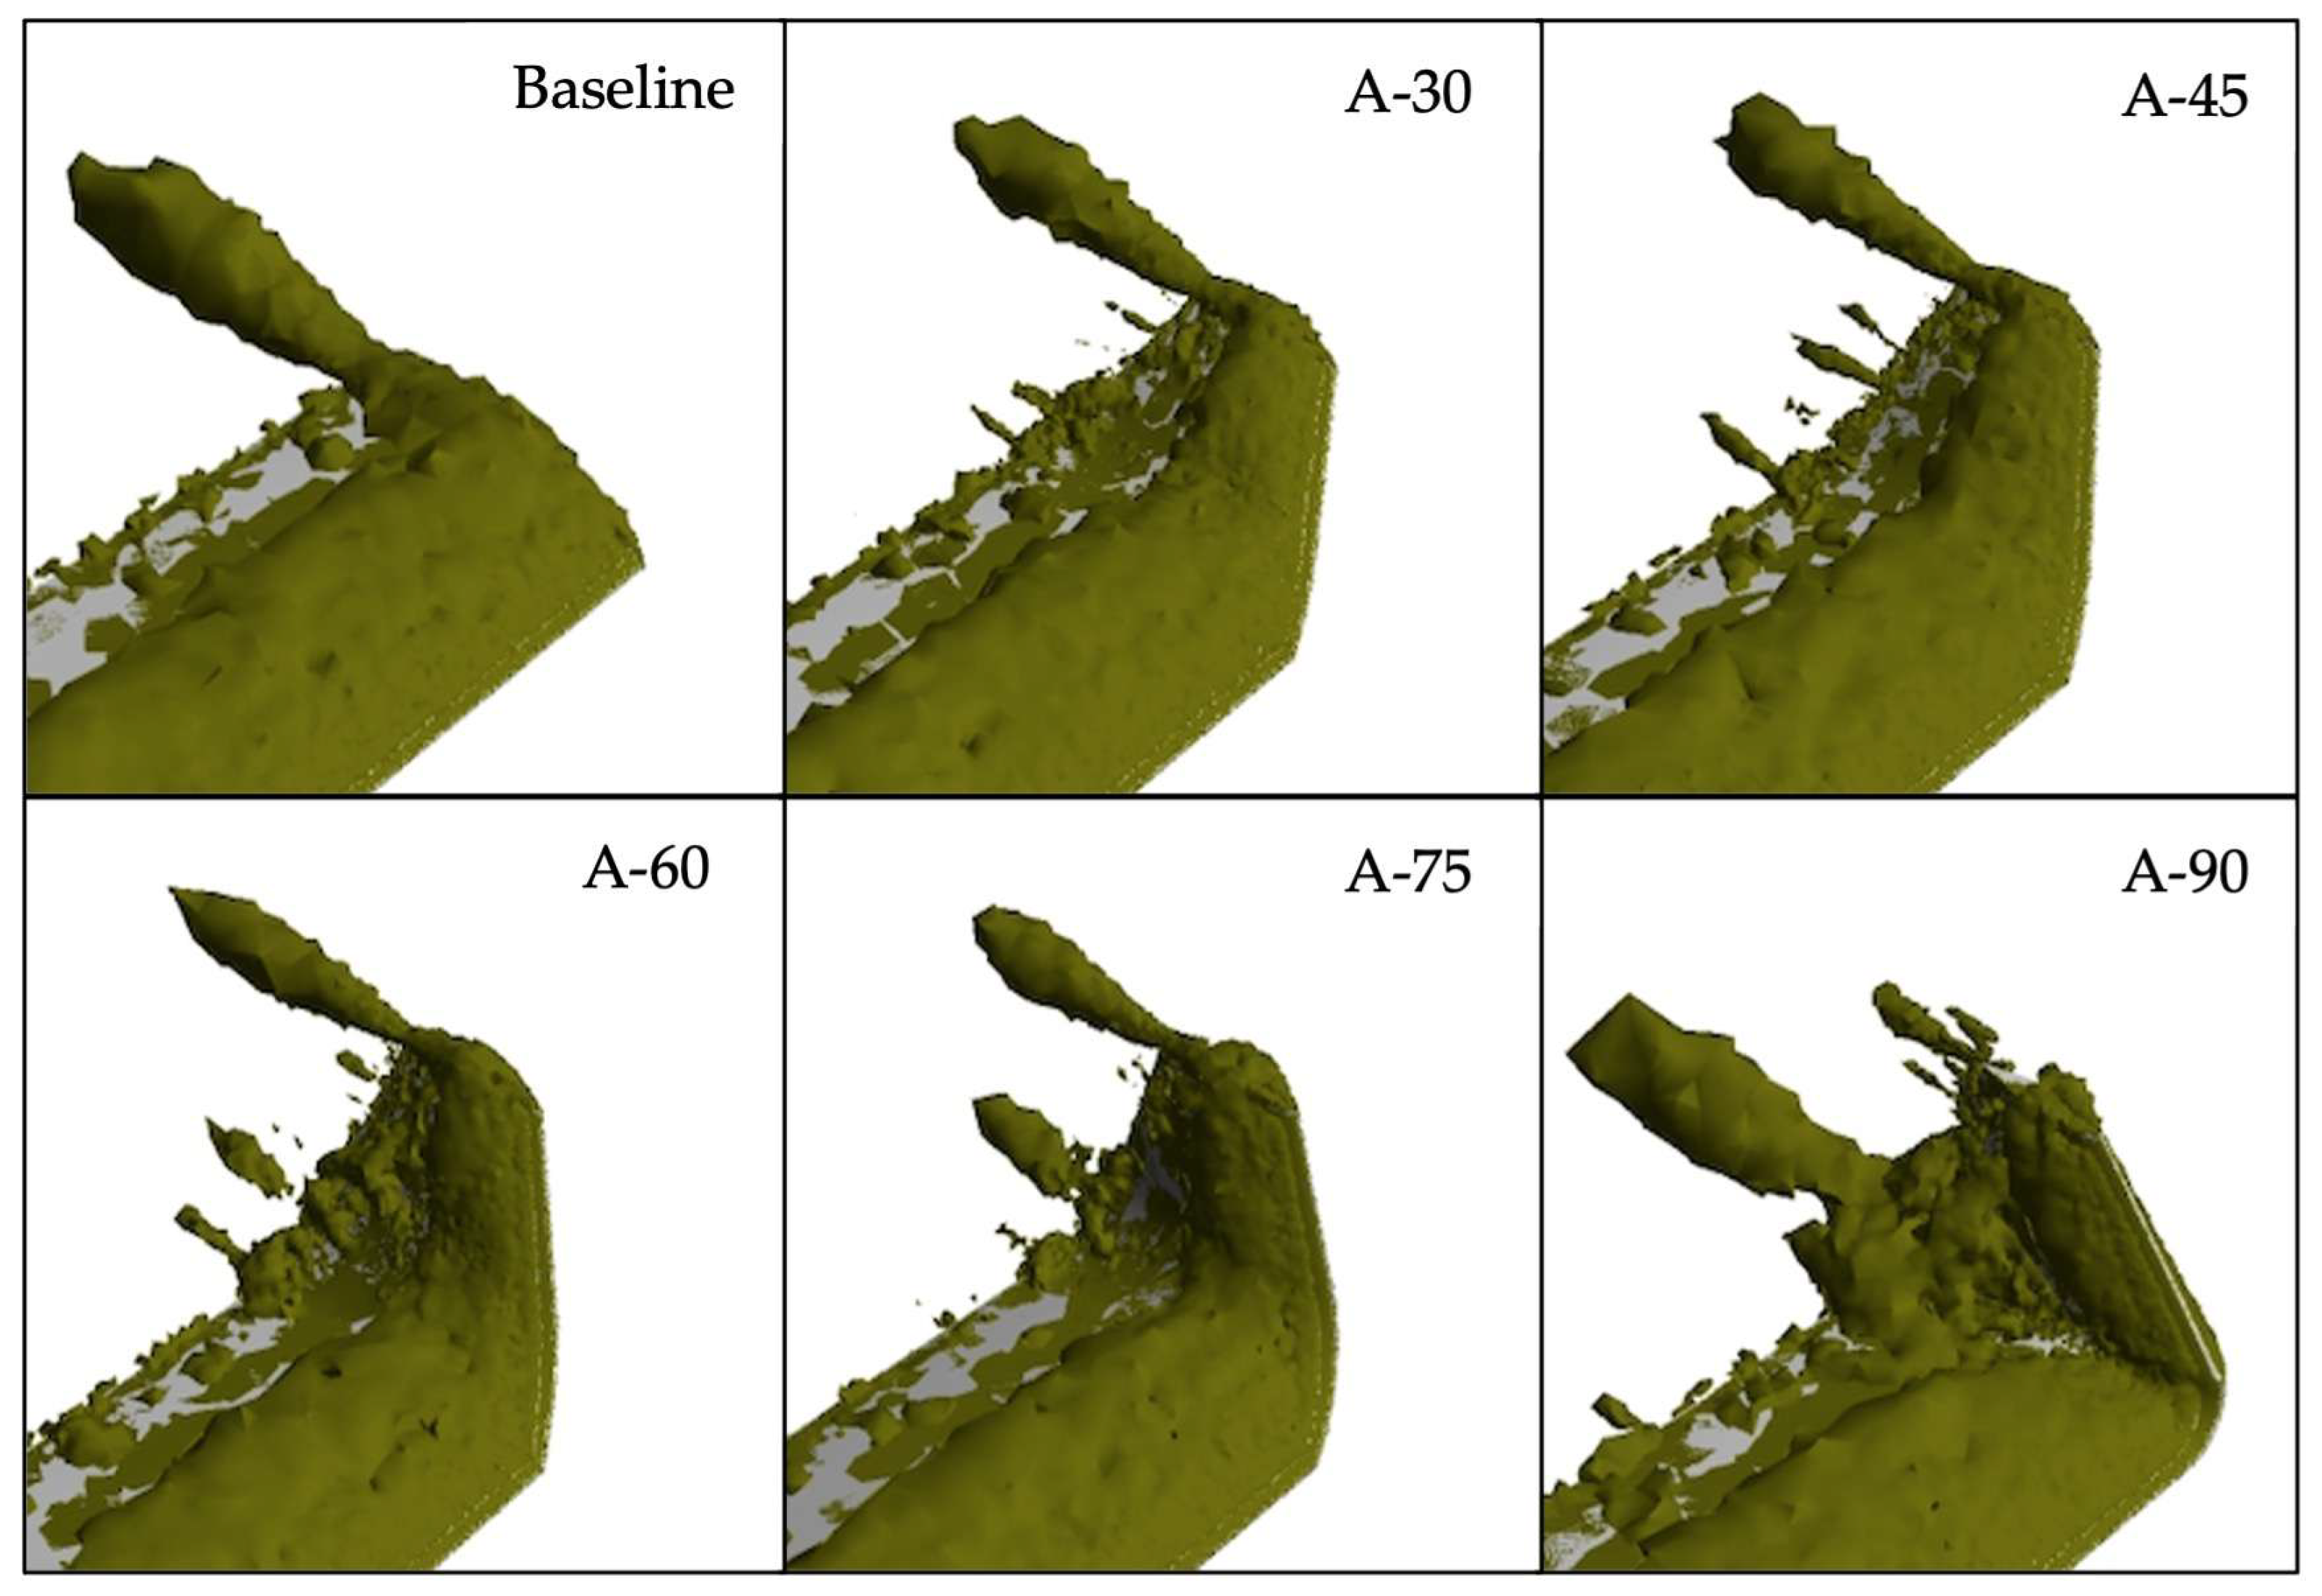
Comparison of tip vortices formed near blade tip at a wind speed of 7 m/s.
In the case of backward-swept winglets, to investigate the effect of winglet configurations with different cant angles on the generation of the tip vortex, Figure 14 shows a comparison of vorticity contours formed near the blade tip depicted using the Lambda 2-Criterion method [26] at a wind speed of 7 m/s. As illustrated in the figure, the tip vortex formed was the weakest at the cant angle of 60° (configuration A-60) and strongest at 90° (configuration A-90). The strength of these tip vortices affects the pressure field on the blade, resulting in changes in lift and, eventually, torque and thrust, as shown in Figure 12 and Figure 13.
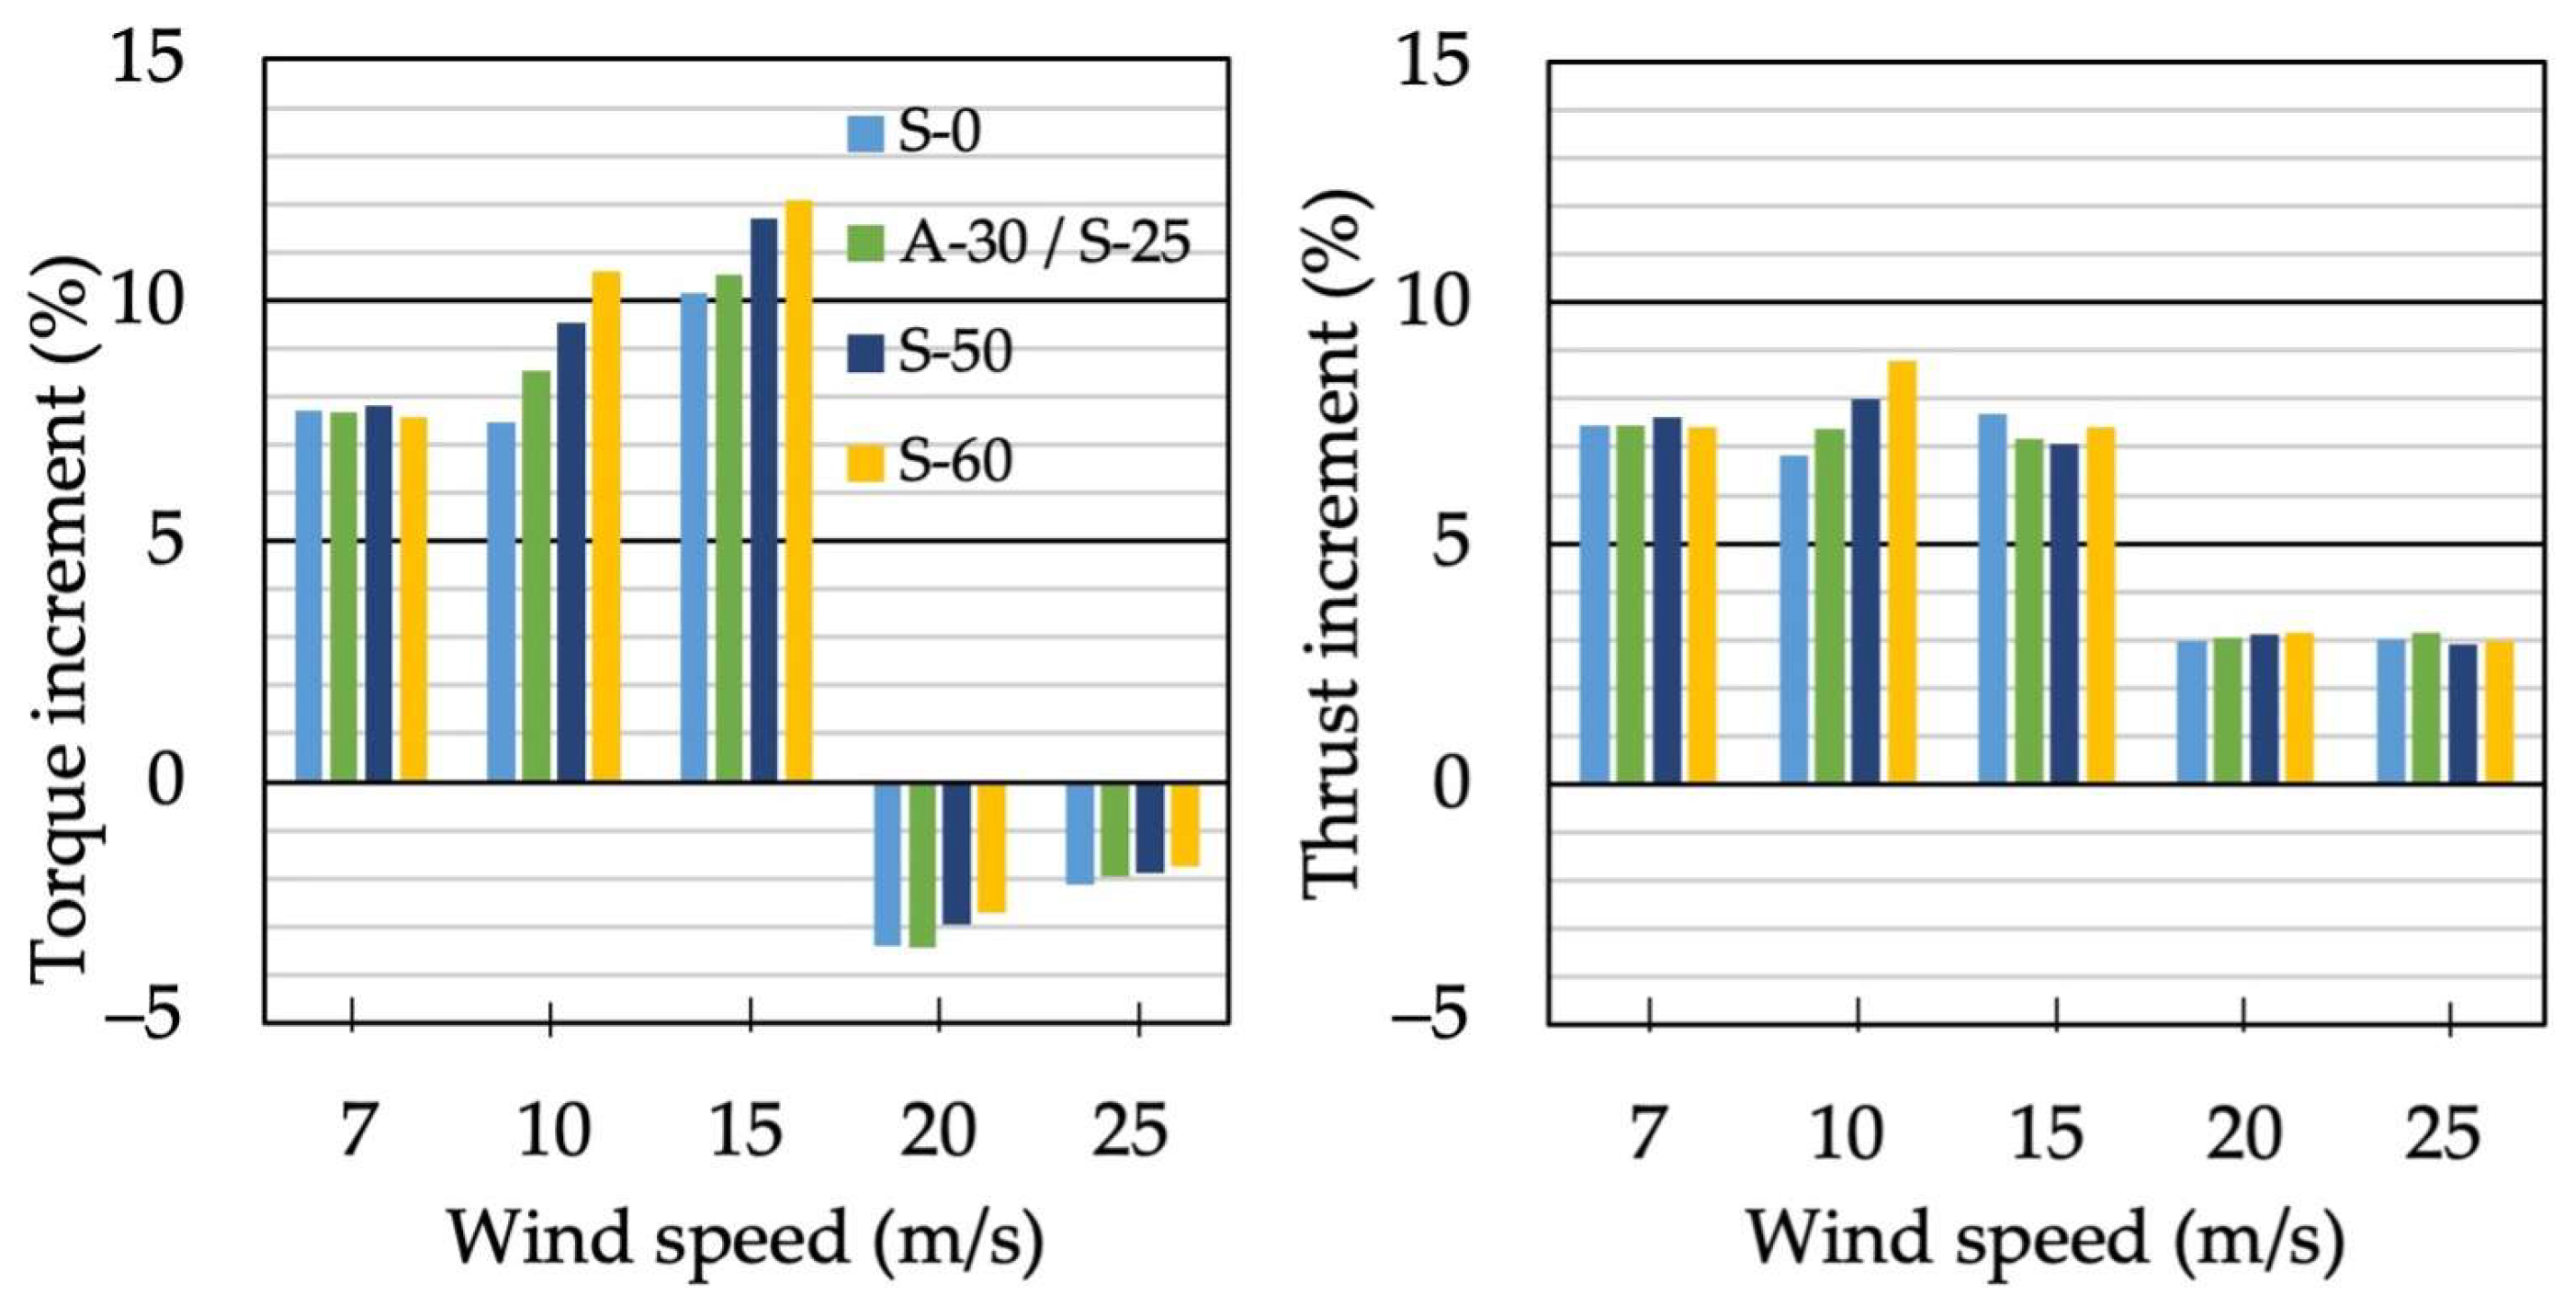
Figure 15 shows the increment in torque and thrust as the sweep angle is varied while keeping the cant angle fixed at 30°. At a wind speed of 7 m/s, the torque and thrust increases with the variation in sweep angle were almost the same. Meanwhile, for wind speeds of 10 and 15 m/s, the torque increment increased with increasing sweep angle, but the thrust did not change significantly. However, at wind speeds of 20 m/s and 25 m/s, similar to Figure 12a, the increment in torque and thrust decreased sharply, and torque in particular showed a negative rate of increase compared to the baseline blade.
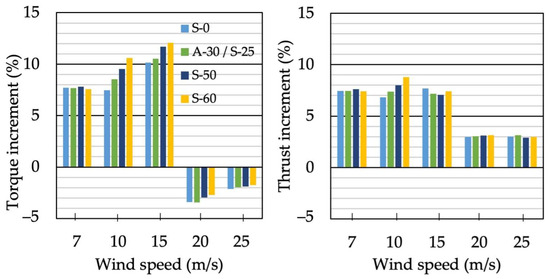
Figure 15.
Comparison of torque and thrust increment with different winglet sweep angles.
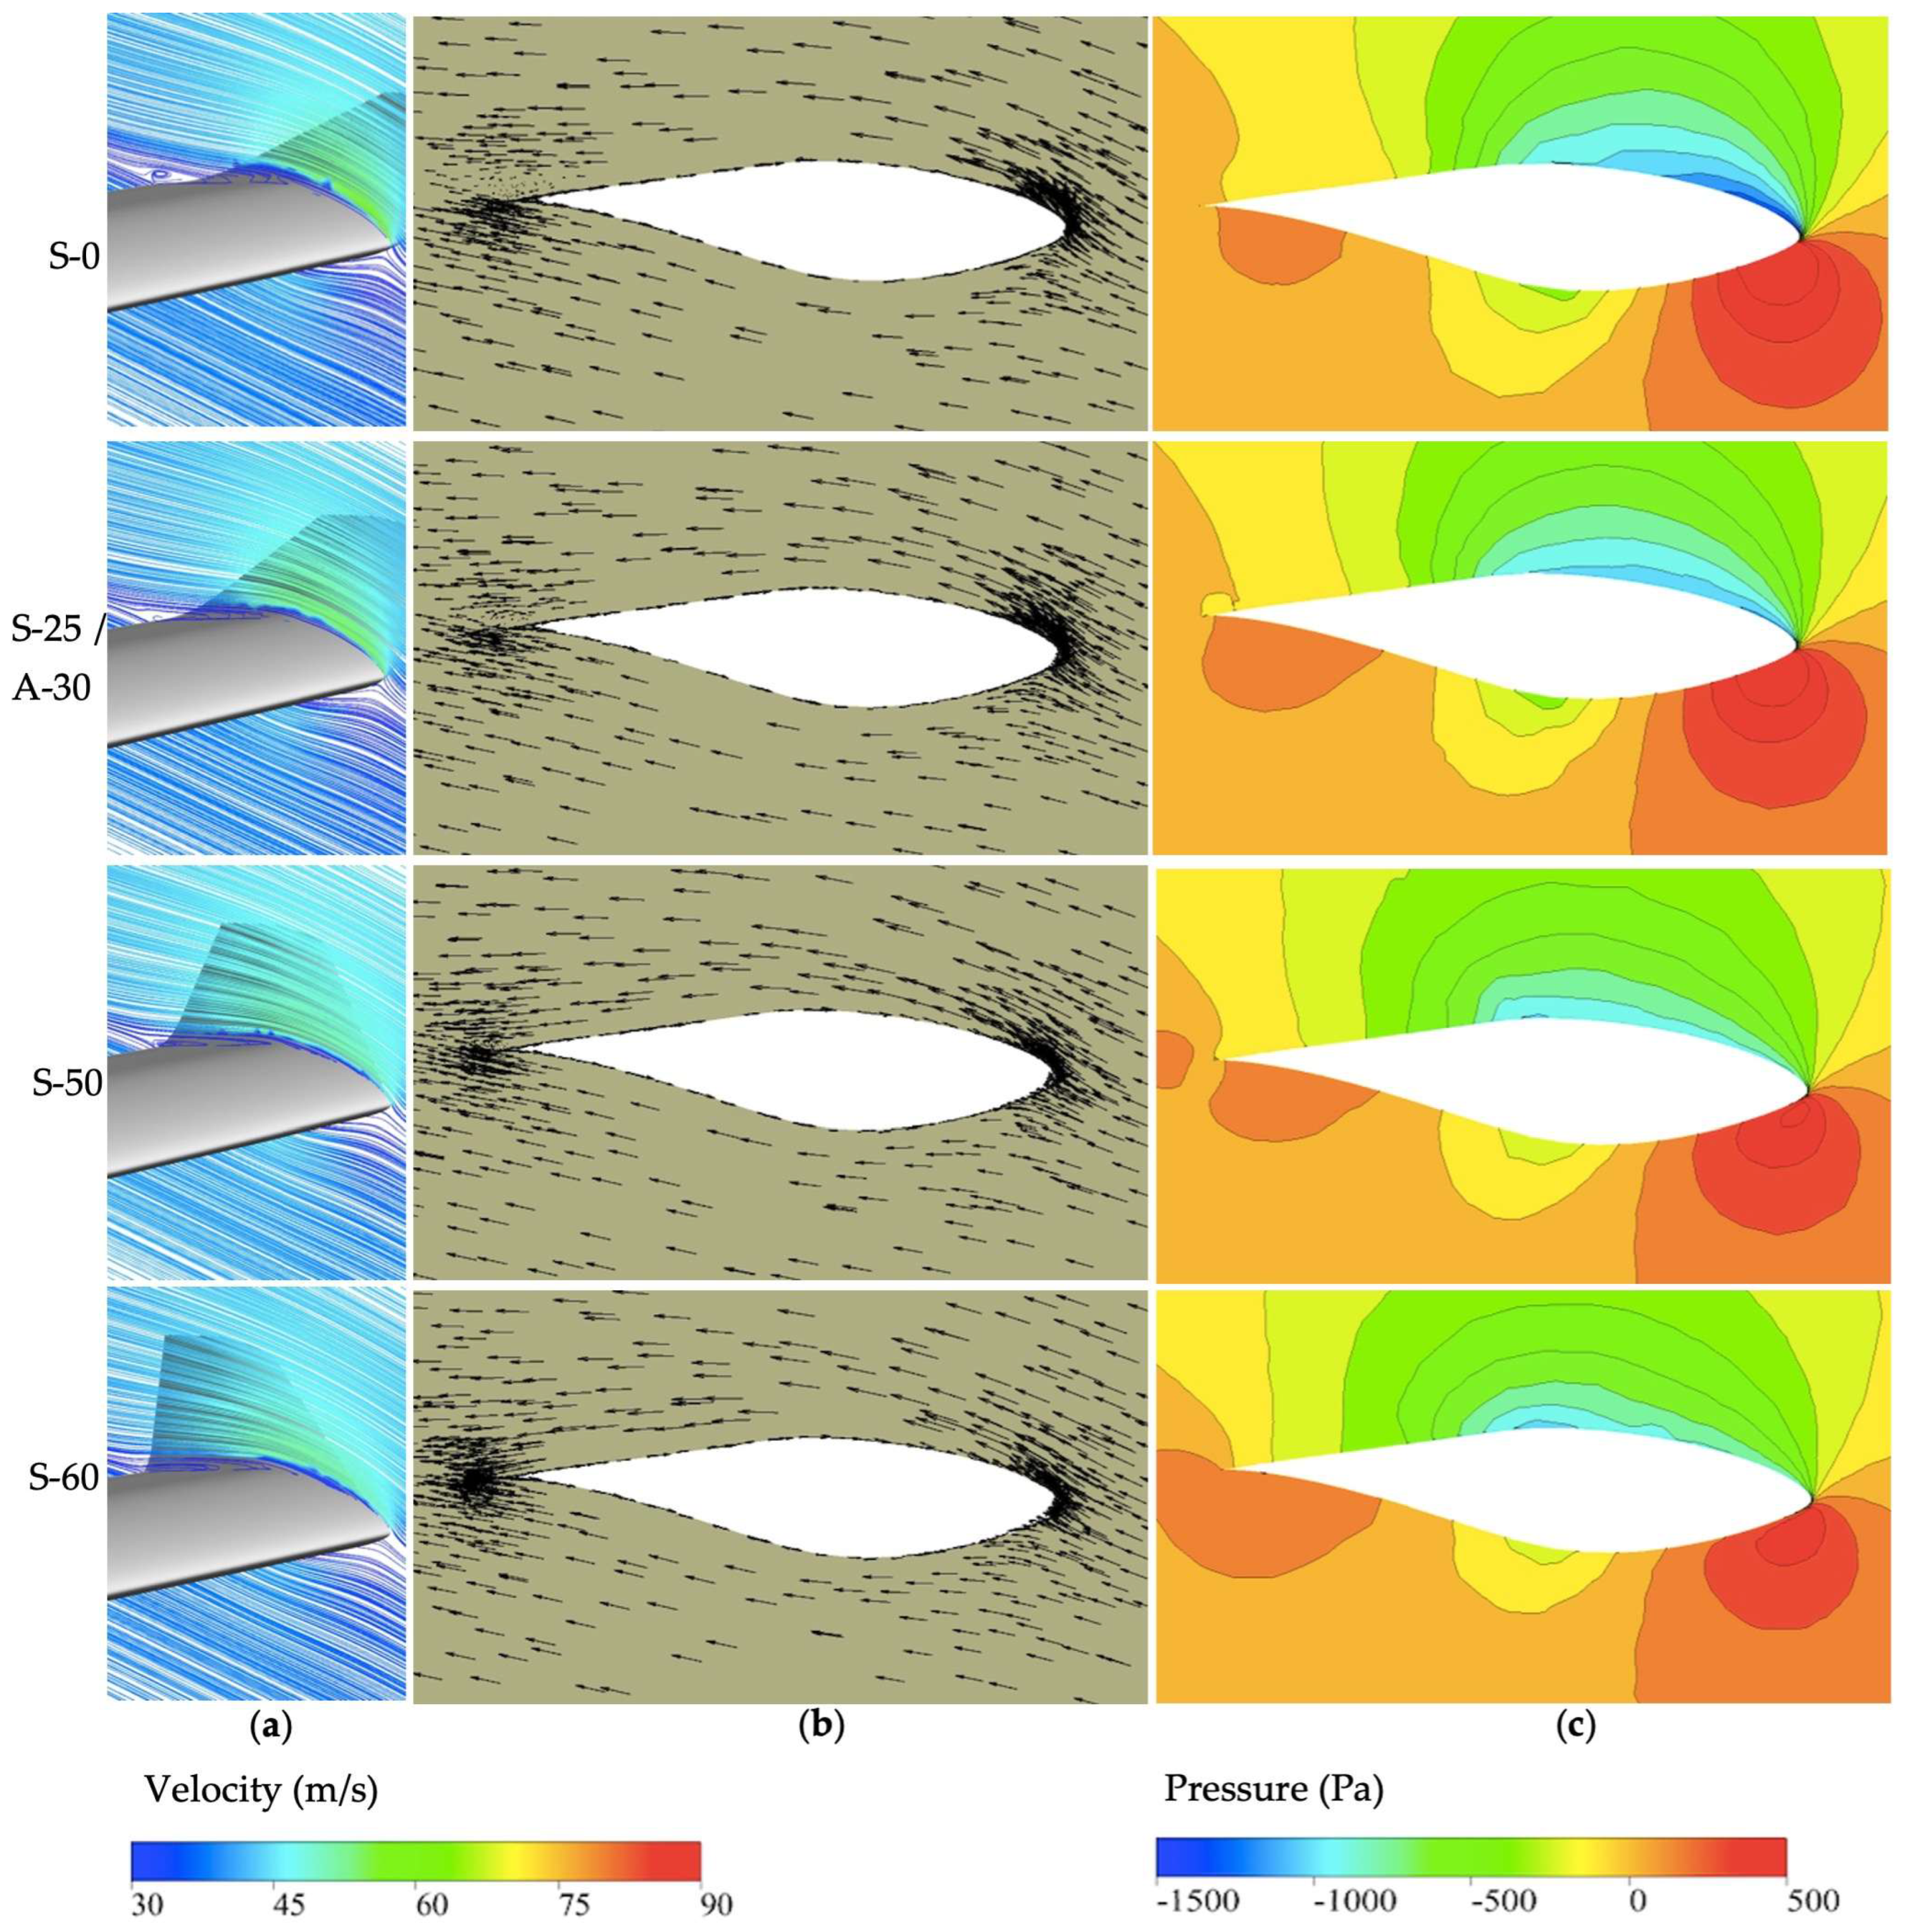
Figure 16 shows the streamlines, velocity vectors, and pressure distribution near the blade tip at z ≈ 0.99R. As shown in Figure 16a,b, the larger the sweep angle, the less flow separation occurs on the suction surface, and the S-60 configuration had the smallest separation area near the trailing edge. Figure 16c also shows that the larger the sweep angle, the larger the low pressure area on the suction side of the blade. These flow separations and pressure distributions lead to changes in lift and drag, and ultimately affect the blade performance, as shown in Figure 15. Therefore, to design a high performance blade with single-swept winglets with a fixed cant angle, it is advantageous to design with a large sweep angle.

Figure 16.
Comparison of (a) streamlines, (b) velocity vectors, and (c) pressure distributions near blade tip at a wind speed of 10 m/s.
3.3. Multi-Swept Configuration
- 1.
- Flow near winglet and tip vortices
Figure 17 shows streamlines around the winglet tip, with multiple sweep angles presented in Table 3 at a wind speed of 15 m/s. Comparing the MS-1 and MS-2 winglets with two sweep angles, the MS-2 with a larger second sweep angle had a smaller swirling flow near the winglet tip. Meanwhile, comparing MS-2 and MS-3 winglets, MS-3 with three smoothly varying sweep angles showed a smoother flow pattern on the winglet surface but showed a stronger swirling flow at the winglet tip. However, compared with multi-swept winglets, the single-swept winglet S-50, which has a similar sweep angle to the multi-swept winglets, exhibited a very disturbed swirling flow pattern.
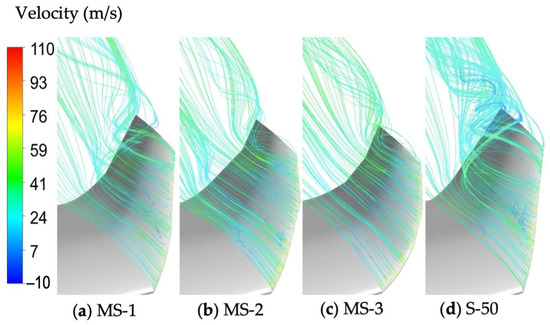
Figure 17.
Comparison of streamlines around winglet tip.
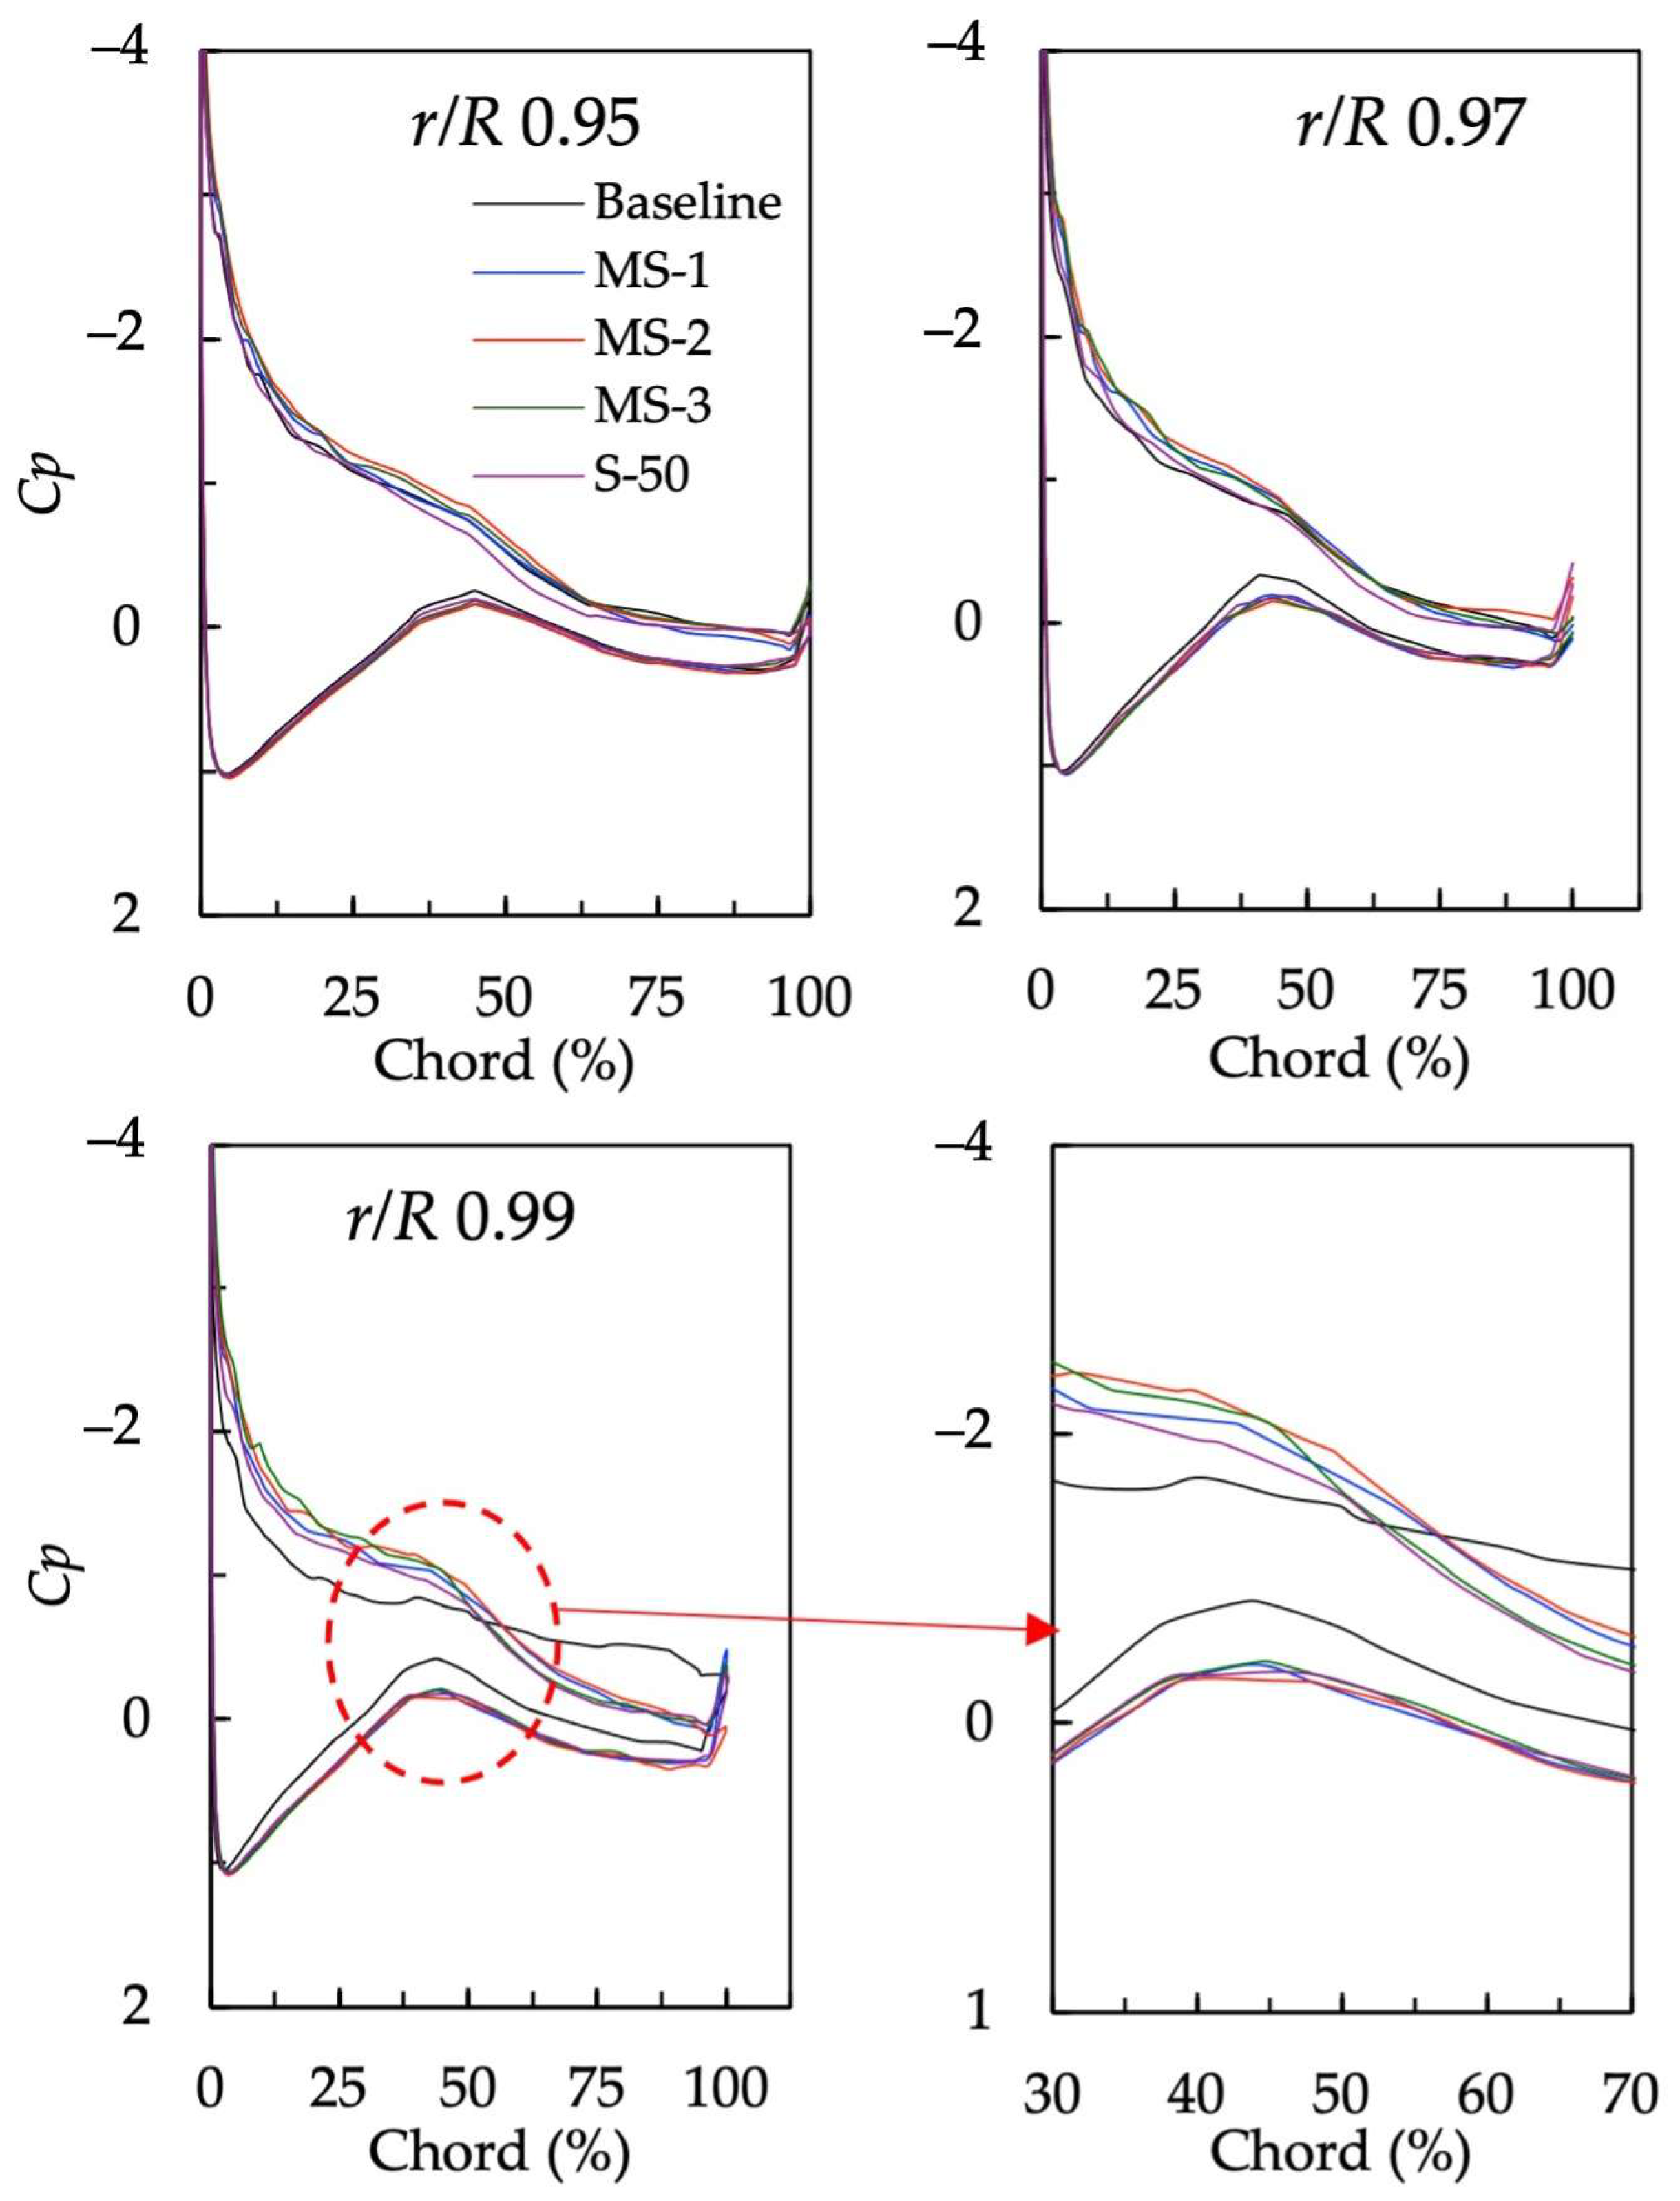
Figure 18 shows the winglet tip vortex strength and size along with the velocity vectors, captured at the downstream section of the winglet tip at x/R = 0.112. The winglet with the MS-2 configuration has a relatively weaker vortex strength at the center of the vortex compared to the other configurations, which is expected to reduce the effect of the winglet tip vortex on the blade power output. For the vortex size, the MS-3 configuration displayed the smallest vortex diameter, indicating that winglets configured with multiple sweep angles changing smoothly effectively reduce the size of vortices. The velocity vectors confirm the above and also reveal the direction of rotation of the vortex. Pressure distributions on the blade were analyzed to investigate the effect of such flow patterns on the blade. Figure 19 shows comparisons of surface pressure distributions for three different blade spans: r/R = 0.95, 0.97, and 0.99. As expected, blades with the winglet show better pressure distribution compared with the baseline, especially on the suction side, indicating that the tip vortex has a weaker influence on the blade. The effect of winglets becomes more pronounced towards the blade tip, and configuration MS-2 shows the best pressure improvement compared to the others.
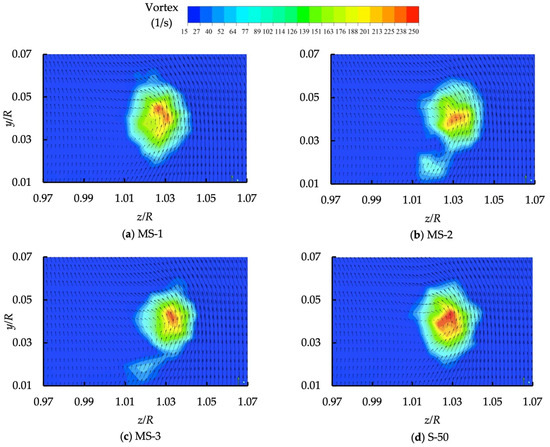
Figure 18.
Comparison of velocity vectors and the vortex strength at x/R = 0.112 downstream of the winglet tip.

Figure 19.
Comparison of surface pressure distribution at a wind speed of 15 m/s.
- 2.
- Tangential and normal forces
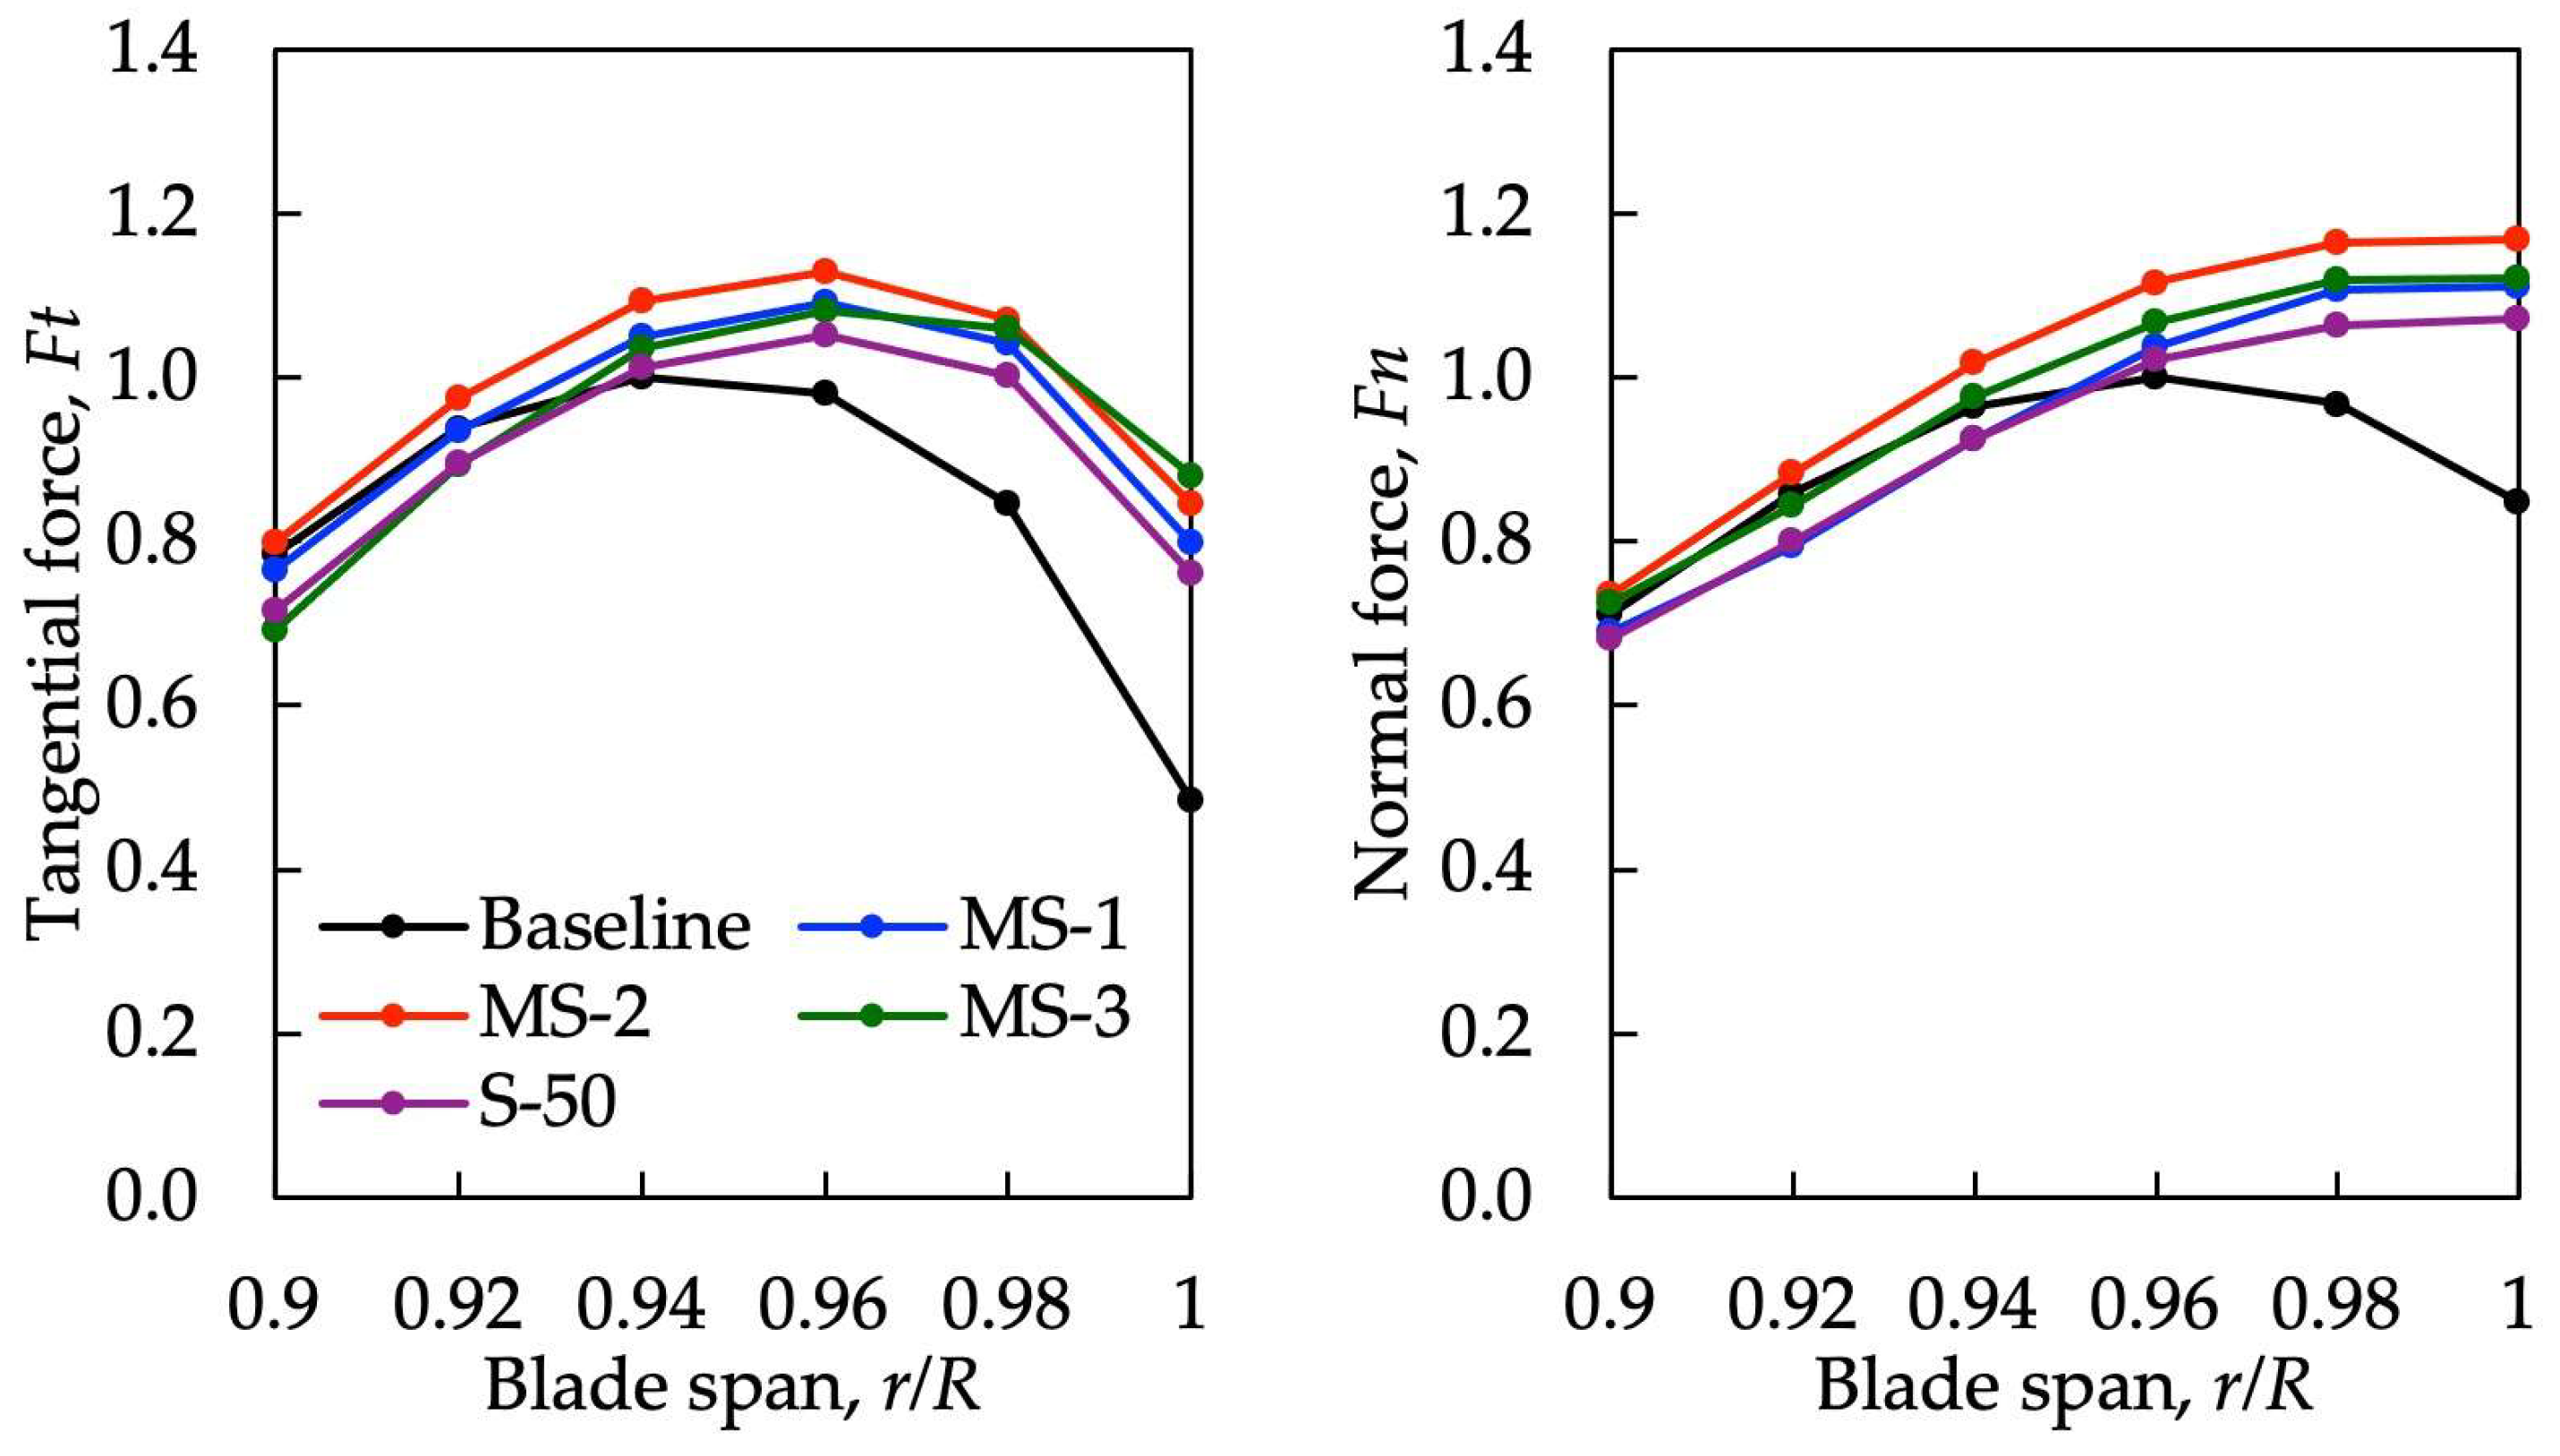
Figure 20 displays the comparison of the blade’s tangential force, Ft, and normal force, Fn, normalized by the maximum Ft and Fn of the baseline blade at a wind speed of 15 m/s. The improved surface pressure distribution exhibited by the winglets increases lift, thereby increasing the tangential and normal forces. Therefore, the blades with winglets show a significant improvement in these forces compared to the baseline, especially near the blade tip, above r/R = 0.95. Again, configuration MS-2 predicted the largest increment in the forces. S-50 with a single sweep angle observed the lowest increment, and even showed a lower increment than the baseline at blade spans below around 93%.
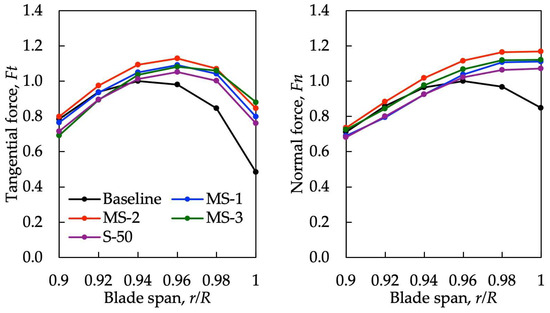
Figure 20.
Comparison of force distribution: tangential and thrust forces.
- 3.
- Torque and thrust increment
Figure 21 illustrates a comparison of the increments in torque and thrust due to the aerodynamic forces relative to the baseline. Similar to the single-swept winglet in Figure 12a and Figure 13a, the torque and thrust for multi-swept winglets increased with wind speed up to 15 m/s, and then decreased rapidly. The MS-2 configuration predicted a 14.6% torque increment and displayed the best blade performance compared to the other configurations. However, at wind speeds exceeding 20 m/s, the torque was lower than the baseline, and no benefit was observed from the implementation of winglets. The increments in thrust are relatively low compared to the increments in torque.
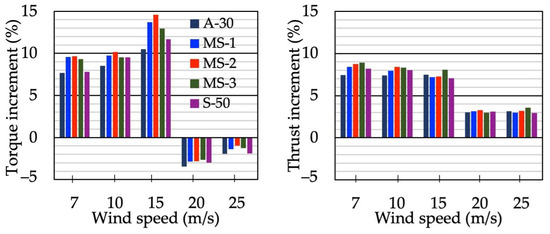
Figure 21.
Comparison of torque and thrust increment relative to the baseline blade.
Comparing A-30 and S-50, which have the same single-swept winglet, the torque increment of blades is greater with a larger sweep angle, and multi-swept winglets have a greater torque increment than single-swept winglets. Furthermore, for winglets with two sweep angles, a larger second sweep angle tended to improve torque; for winglets with multiple sweep angles MS-1 to MS-3, a larger average sweep angle produced better torque. These suggest that for high performance winglet designs, configurations with multiple sweep angles are more advantageous than a single sweep angle, and those with multiple sweep angles, configurations with a large average sweep angle is more favorable.
- 4.
- Power and power coefficient
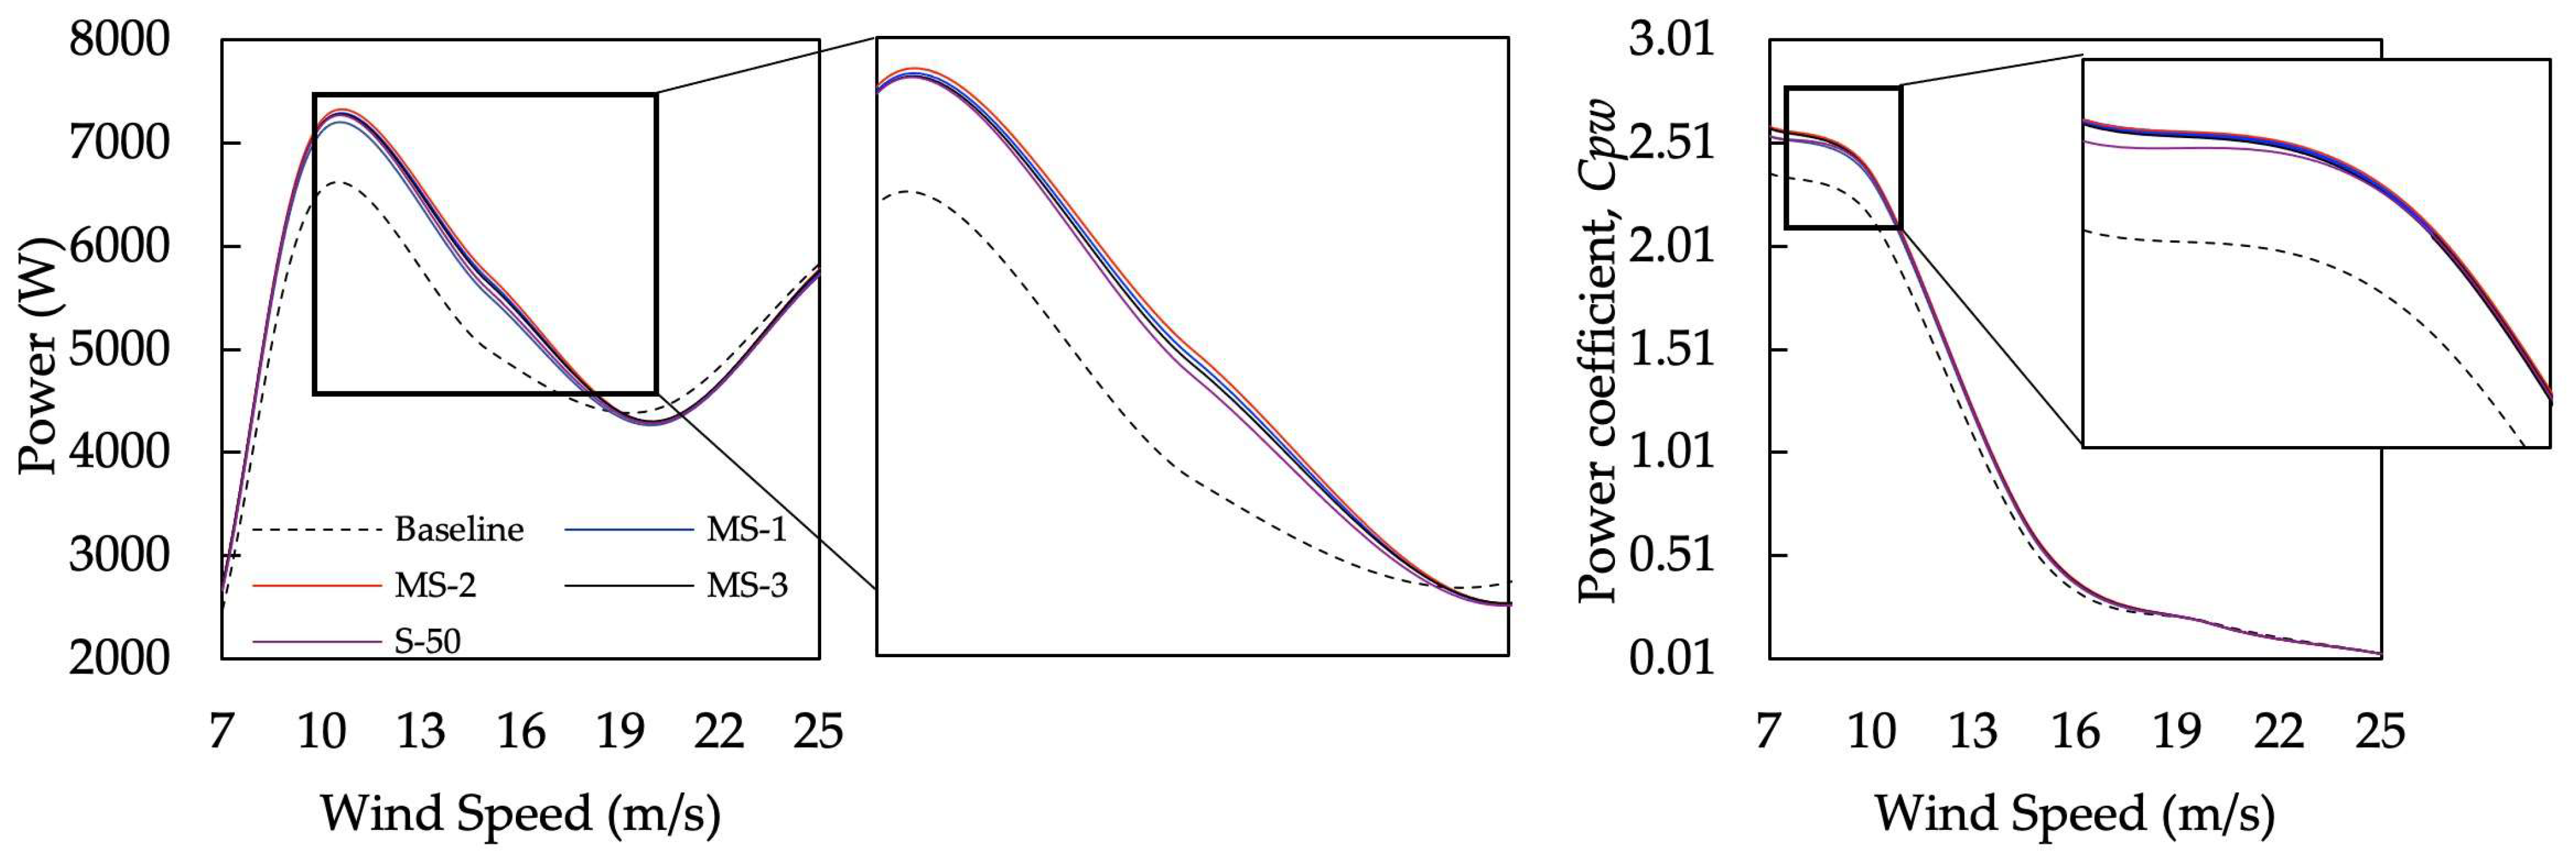
Figure 22 displays a comparison of the power output and its efficiency between the baseline and blades with winglet configurations to investigate the effect of winglet configuration on the overall performance of the turbine blade. This turbine blade produces its maximum power at a wind speed of around 10 m/s [12,32]. As observed in Figure 21, the MS-2 configuration exhibits the highest power output compared to the other configurations, and the order of power improvement is MS-1, MS-3, and S-50. However, at wind speeds above 20 m/s, the implementation of winglets was found to be ineffective. Power efficiency, as a power coefficient of , indicates that the maximum efficiency of the blade occurs at relatively low wind speeds, and as the wind speed increases, the coefficient decreases.
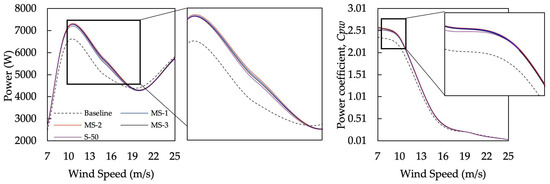
Figure 22.
Comparisons of power and power coefficient.
4. Conclusions
A numerical study was conducted to investigate the effect of sweep angles on the blade performance in the design of wind turbine blades. RANS equations were solved coupled with the SST k–ω turbulence model. Several winglets with equal winglet lengths, single and multiple sweep angles, and different single cant angles were designed, and their performances were examined. The comparisons demonstrated that the numerical solutions were in good agreement with the findings of experiments on a baseline blade, confirming the validity of the computational method. The investigation of the performance of blades with winglets showed that backward-swept winglets showed a better winglet effect than forward-swept winglets in the range of wind speeds below 15 m/s. Furthermore, with respect to the variation in the cant angle, torque increased as the cant angle increased up to 60°, but decreased when the angle exceeded 75°. Regarding the sweep angle, winglets with multiple sweep angles had a greater torque increment than single-swept winglets, and a larger average sweep angle improved the tip vortex effect of the winglets and increased the torque. Consequently, the MS-2 configuration had a 14.6% increment in torque compared to the baseline and the best blade performance compared to the other configurations considered. Therefore, to produce high-performance winglet designs without changing the winglet length, it is recommended to adopt a multiple sweep angle configuration rather than a single one, and furthermore, in the multiple sweep angle configuration, it is suggested to configure a large average sweep angle of about 60°. In particular, the proposed winglet configuration with multiple sweep angles is effective for HAWT blade designs where space is limited. To further investigate the applicability and effectiveness of the multi-swept configuration, we plan to examine it using different winglet shapes and different types of wind turbines such as variable speed wind turbines and variable-pitch and yaw wind turbines. In addition, to clarify the mechanism by which multi-swept winglets affect the flow field and blade performance, the adaptation of turbulence models and simulations using a full wind turbine model needs to be considered.
Author Contributions
Conceptualization, B.S.; Data curation, B.K.W.; Formal analysis, Investigation, Methodology, Validation, B.K.W. and B.S.; Project administration, Supervision, B.S.; Visualization, B.K.W.; Writing—original draft, B.K.W. and B.S.; Writing—review & editing, B.K.W. and B.S. All authors have read and agreed to the published version of the manuscript.
Funding
This research received no external funding.
Data Availability Statement
Some of the data in the manuscript will be made available through request to the corresponding author.
Acknowledgments
This work was partly supported by JSPS KAKENHI Grant Number JP23K03662.
Conflicts of Interest
The authors declare that they have no conflicts of interest.
References
- Ahmad, T.; Zhang, D. A critical review of comparative global historical energy consumption and future demand: The story told so far. Energy Rep. 2020, 6, 1973–1991. [Google Scholar] [CrossRef]
- Gielen, D.; Boshell, F.; Saygin, D.; Bazilian, M.D.; Wagner, N.; Gorini, R. The role of renewable energy in the global energy transformation. Energy Strategy Rev. 2019, 24, 38–50. [Google Scholar] [CrossRef]
- Micallef, D.; Akay, B.; Ferreira, C.S.; Sant, T.; Bussel, G.V. The origins of a wind turbine tip vortex. J. Phys. Conf. Ser. 2014, 555, 012074. [Google Scholar] [CrossRef]
- Arumugam, P.; Ramalingam, V.; Bhaganagar, K. A pathway towards sustainable development of small capacity horizontal axis wind turbines—Identification of influencing design parameters & their role on performance analysis. Susain. Energy Technol. Assess. 2021, 44, 101019. [Google Scholar]
- Sun, Z.; Chen, J.; Shen, W.Z.; Zhu, W.J. Improved blade element momentum theory for wind turbine aerodynamic computations. Renew. Energy 2016, 96, 824–831. [Google Scholar] [CrossRef]
- Chattot, J.-J. Effects of blade tip modifications on wind turbine performance using vortex model. Comput. Fluids. 2009, 38, 1405–1410. [Google Scholar] [CrossRef]
- Zhao, T.; Shin, B. An application of upwind difference scheme with preconditioned numerical fluxes to gas-liquid two-phase flows. Fluids 2025, 10, 38. [Google Scholar] [CrossRef]
- Zheng, G.; Xu, P.; Wang, T.; Yan, Q. Study on the bubble collapse characteristics and heat transfer mechanism of the microchannel reactor. Processes 2025, 13, 281. [Google Scholar] [CrossRef]
- Madsen, M.H.; Zahle, F.; Horcas, S.G.; Barlas, T.K.; Sørensen, N.N. CFD-based curved tip shape design for wind turbine blades. Wind Energy Sci. 2022, 7, 1471–1501. [Google Scholar] [CrossRef]
- Wardhana, B.K.; Shin, B. Numerical Investigation of the Effect of Winglet Configurations with Multiple Cant Angles on the Aerodynamic Performance of Wind Turbine Blade. Int. J. Sustain. Energy 2024, 43, 2403486. [Google Scholar] [CrossRef]
- Sy, M.S.; Abuan, B.E.; Danao, L.A.M. Aerodynamic investigation of a horizontal axis wind turbine with split winglet using computational fluid dynamics. Energies 2020, 13, 4983. [Google Scholar] [CrossRef]
- Farhan, A.; Hassanpour, A.; Burns, A. Numerical study of effect of winglet planform and airfoil on a horizontal axis wind turbine performance. Renew. Energy 2019, 131, 1255–1273. [Google Scholar] [CrossRef]
- Jiang, R.; Zhao, Z.; Liu, H.; Wang, T.; Chen, M.; Feng, J.; Wang, D. Numerical study on the influence of vortex generators on wind turbine aerodynamic performance considering rotational effect. Renew. Energy 2022, 186, 730–741. [Google Scholar] [CrossRef]
- Dejene, G.; Ramayya, V.; Bekele, A. Investigation of NREL Phase VI wind turbine blade with different winglet configuration for performance augmentation. Int. J. Sustain. Energy 2024, 43, 2321622. [Google Scholar] [CrossRef]
- Garcia-Ribeiro, D.; Flores-Mezarina, J.A.; Bravo-Mosquera, P.D. Parametric CFD analysis of the taper ratio effects of a winglet on the performance of a Horizontal Axis Wind Turbine. Sustain. Energy Technol. Assess. 2021, 47, 101489. [Google Scholar] [CrossRef]
- Aju, E.J.; Suresh, D.B.; Jin, Y. The influence of winglet pitching on the performance of a model wind turbine: Aerodynamic loads, rotating speed, and wake statistics. Energies 2020, 13, 5199. [Google Scholar] [CrossRef]
- Zhu, B.; Sun, X.; Wang, Y. Performance characteristics of a horizontal axis turbine with fusion winglet. Energy 2017, 120, 431–440. [Google Scholar] [CrossRef]
- Ferrer, E.; Munduate, X. Wind turbine blade tip comparison using CFD. J. Phys. Conf. Ser. 2007, 75, 012005. [Google Scholar] [CrossRef]
- Hansen, T.H.; Mühle, F. Winglet optimization for a model-scale wind turbine. Wind Energy 2018, 21, 634–649. [Google Scholar] [CrossRef]
- Hand, M.M.; Simms, D.A.; Fingersh, L.J. Unsteady Aerodynamics Experiment Phase VI: Wind Tunnel Test Configurations and Available Data Campaigns; National Renewable Energy Laboratory: Golden, CO, USA, 2001. [Google Scholar]
- Butterfield, C.P.; Musial, W.P.; Simms, D.A. Combined Experiment Phase I: Final Report; National Renewable Energy Laboratory: Golden, CO, USA, 1992. [Google Scholar]
- Menter, F.R. Two-equations eddy-viscocity turbulence models for engineering applications. AIAA J. 1994, 32, 1598–1605. [Google Scholar] [CrossRef]
- Wilcox, D.C. Reassesment of the scale-determining equation for advanced turbulence models. AIAA J. 1988, 26, 1299–1310. [Google Scholar] [CrossRef]
- Jones, W.P.; Launder, B.E. The calculation of low-Reynolds-number-phenomena with a two-equation model of turbulence. Int. J. Heat Mass Trans. 1973, 16, 1119–1130. [Google Scholar] [CrossRef]
- Sedighi, H.; Akbarzadeh, P.; Salavatipour, A. Aerodynamic performance enhancement of horizontal axis wind turbines by dimples on blades: Numerical investigation. Energy 2020, 195, 117056. [Google Scholar] [CrossRef]
- ANSYS. ANSYS Fluent 14.0 User’s Guide; ANSYS: Canonsburg, PA, USA, 2010. [Google Scholar]
- Moshfeghi, M.; Shams, S.; Hur, N. Aerodynamic performance enhancement analysis of horizontal axis wind turbines using a passive flow control method via split blade. J. Wind Eng. Ind. Aerodyn. 2017, 167, 148–159. [Google Scholar] [CrossRef]
- Zhang, Z.; Kuang, L.; Han, Z.; Zhou, D.; Zhao, Y.; Bao, Y.; Duan, L.; Tu, J.; Chen, Y.; Chen, M. Comparative analysis of bent and basic winglets on performance improvement of horizontal axis wind turbines. Energy 2023, 281, 128252. [Google Scholar] [CrossRef]
- Amiri, M.M.; Shadman, M.; Estefen, S.F. URANS simulations of horizontal axis wind turbine under stall condition using Reynolds stress turbulence models. Energy 2020, 213, 118766. [Google Scholar] [CrossRef]
- Tran, T.T.; Kim, D.H. A CFD study into the influence of unsteady aerodynamic interference on wind turbine surge motion. Renew. Energy 2016, 90, 204–228. [Google Scholar] [CrossRef]
- Roache, P.J. Perspective: A Method for Uniform Reporting of Grid Refinement Studies. J. Fluids Eng. 1994, 116, 405–413. [Google Scholar] [CrossRef]
- Elfarra, M.A.; Sezer-Uzol, N.; Akmandor, I.S. NREL VI rotor blade: Numerical investigation and winglet design and optimization using CFD. Wind Energy 2014, 17, 605–626. [Google Scholar] [CrossRef]
- Huang, S.; Qiu, H.; Wang, Y. Aerodynamic performance of horizontal axis wind turbine with application of dolphin head-shape and lever movement of skeleton bionic airfoils. Energy Convers. Manag. 2022, 267, 115803. [Google Scholar] [CrossRef]
- Bazilevs, Y.; Hsu, M.; Kiendl, J.; Benson, D. A computational procedure for prebending of wind turbine blades. Int. J. Numer. Methods Eng. 2012, 89, 323–336. [Google Scholar] [CrossRef]


Disclaimer/Publisher’s Note: The statements, opinions and data contained in all publications are solely those of the individual author(s) and contributor(s) and not of MDPI and/or the editor(s). MDPI and/or the editor(s) disclaim responsibility for any injury to people or property resulting from any ideas, methods, instructions or products referred to in the content. |
© 2025 by the authors. Licensee MDPI, Basel, Switzerland. This article is an open access article distributed under the terms and conditions of the Creative Commons Attribution (CC BY) license (https://creativecommons.org/licenses/by/4.0/).