Abstract
Solar thermal concentrating solar power (CSP) plants have attracted growing interest in the field of renewable energy generation due to their capability for large-scale electricity generation, high photoelectric conversion efficiency, and enhanced reliability and flexibility. Meanwhile, driven by the rapid advancement of power electronics technology, extensive wind farms (WFs) and large-scale battery energy storage systems (BESSs) are being increasingly integrated into the power grid. From these points of view, grid-connected CSP–BESS–wind hybrid energy systems are expected to emerge in the future. Currently, most studies focus solely on the stability of renewable energy generation systems connected to the grid via power converters. In fact, within CSP–BESS–wind hybrid energy systems, interactions between the CSP, collection grid, and the converter controllers can also arise, potentially triggering system oscillations. To fill this gap, this paper investigated the interaction mechanism and oscillation characteristics of a grid-connected CSP–BESS–wind hybrid energy system. Firstly, by considering the dynamics of CSP, BESSs, and wind turbines, a comprehensive model of a grid-connected CSP–BESS–wind hybrid energy system was developed. With this model, the Nyquist stability criterion was utilized to analyze the potential interaction mechanism within the hybrid system. Subsequently, the oscillation characteristics were examined in detail, providing insights to inform the design of the damping controller. Finally, the analytical results were validated through MATLAB/Simulink simulations.
1. Introduction
In recent years, the utilization of renewable energy has gradually increased, and the dependence of power systems on fossil fuels has gradually decreased. The transition of traditional units to renewable energy generation has become an inevitable trend. Among various forms of renewable energy generation, wind power has the advantages of abundant resources and sustainable use [1]. Solar thermal concentrating solar power (CSP) has the advantages of stable output and low output power fluctuations, which enhance the flexibility and adjustability of the system [2,3]. By the end of 2023, China’s installed capacity of wind power was about 440 million kilowatts, and CSP’s installed capacity was about 6 million kilowatts, with vast development potential in the future.
CSP units are composed of three main subsystems: concentrated solar heating, thermal storage and heat exchange, and the power generation system. The power generation system is similar to that of traditional thermal power units, so their dynamic characteristics are also similar [4]. However, CSP units typically have smaller installed capacities and are often connected to the grid in parallel, which may introduce oscillation threats to the grid. In wind power systems, large-scale power electronic converters can contribute negative damping effects [5,6]. When coupled with CSP systems, this may weaken grid stability and exacerbate electromagnetic oscillations [7,8]. Additionally, new wind farms are required to integrate electrochemical energy storage systems. With the continuous increase in the installed capacity of wind and CSP generation, it is inevitable that CSP stations and wind farms with electrochemical energy storage systems will be connected to the grid at the same or nearby points, forming a CSP–BESS–wind hybrid energy system. This creates significant challenges for system stability, highlighting the urgent need for research into modeling and analyzing the stability of such hybrid systems.
In previous studies, references [9,10] provided detailed mathematical models of wind power generation systems, including wind turbine blades, synchronous generators, and back-to-back converters. References [11,12] presented detailed mathematical models of CSP units, including a concentrated solar heating, thermal storage, and power generation subsystem. Detailed mathematical models can comprehensively reflect the dynamic characteristics of a system, but when not focused on electromechanical oscillations or ultra-low-frequency oscillations, these models increase the system’s dimensions and coupling between variables, making the analysis more difficult. Therefore, it is necessary to reduce the order of the model without affecting the analysis results to facilitate stability analysis.
The current methods for studying oscillations include complex torque analysis, impedance analysis, modal analysis, frequency-domain analysis based on Bode plots, and time-domain simulation analysis. Complex torque analysis reveals the mechanism of sub-synchronous oscillation instability from the perspective of negative damping, with clear physical significance [13,14,15]. However, their criteria are based on sufficient but not necessary conditions for system stability, so the determination of oscillation modes may not be comprehensive. Impedance analysis can be used to study the stability of interactive systems, but for large systems with many devices, modeling and analysis can be complex [16,17,18]. Modal analysis can directly derive the oscillation frequency of a system and identify the cause and mechanism of oscillations through participation factors [19,20]. However, for more complex systems, modeling and analysis become challenging due to the complexity of the calculations. Frequency-domain analysis based on Bode plots [21,22] can visually show the changes in the system gain and phase with frequency, making it especially suitable for studying the effects of parameter variations on the oscillation frequency and amplitude. Time-domain simulation analysis can clearly reflect the system’s operational state and be used to verify the correctness of other analytical methods.
Inspired by these perspectives, this paper conducts a comprehensive study on the oscillation occurring in a CSP–BESS–wind hybrid energy system. To this end, a small-signal model of the hybrid system is first derived in Section 2, including wind power generation units, CSP units, and energy storage components. Then, in Section 3, the Nyquist stability criterion is introduced to study the system stability and reveal the sub-synchronous oscillation mechanism. In Section 4, the impacts of different factors on sub-synchronous oscillations in the hybrid system are investigated. Based on this, a damping controller for the CSP unit is designed. Both frequency-domain analysis and time-domain simulations show that the damping controller effectively suppresses sub-synchronous oscillations and enhances system stability. Finally, the conclusions are drawn in Section 5.
2. System Description and Small-Signal Modeling
2.1. System Description
According to the “Technical Guidelines for the Planning of New Energy Base Transmission and New Energy Storage Configuration” released by China in 2023, energy storage systems are typically deployed near renewable energy power plants to mitigate the fluctuations caused by large-scale renewable energy integration into the grid, promote the balance between generation and load in power system operation, and improve the safety, economy, and flexibility of grid operation. Therefore, an energy storage component is considered in the system model in this paper.
Figure 1 illustrates the schematic diagram of the studied hybrid energy system, which consists of a CSP plant, a BESS, and a wind farm. These units are interconnected and synchronized at the point of common coupling (PCC) and subsequently transmitted to the utility grid. Herein, U1, U2, and U3 are the grid-side voltages corresponding to the wind farm, BESS, and CSP, respectively. δ1, δ2, and δ3 are their corresponding phase angles, while X1, X2, and X3 are the corresponding line impedances. P1, P2, and P3 are the output powers of the wind farm, BESS, and CSP plant, respectively. UPCC and δPCC are the voltage and phase angles of the PCC. Xg is the line impedance between the PCC and the utility grid. Ug is the utility grid voltage.
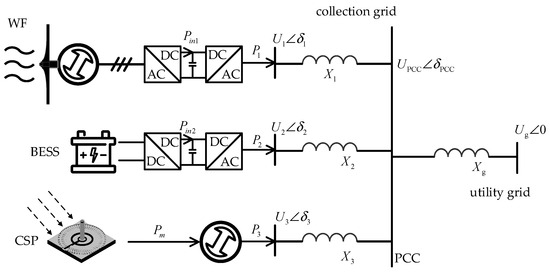
Figure 1.
Schematic diagram of grid-connected CSP–BESS–wind hybrid energy system.
Since the system shown in Figure 1 is in a stable state without disturbances, and the nonlinear parts of the system can be approximated as linear within the disturbance range, we chose to use a small-signal model to describe the system’s dynamic response.
2.2. Collection Grid Coupling Model
In this subsection, the collection grid is modeled to reveal the coupling relationships between the different units (i.e., the CSP plant, BESS, wind farm, and utility grid). The modeling approach in this subsection is derived from [9]. For clarity and ease of understanding, the detailed derivation is also provided here. The circuit of the collection grid in the CSP–BESS–wind hybrid energy system is shown in Figure 2, where we can see it is a Y-shaped circuit, where the generation nodes (i.e., node 1, node 2, and node 3) and the grid node (i.e., node g) are interconnected at the PCC. In the modeling of the collection grid, the focus is placed on the relationship between the generation nodes and the grid node, rather than the PCC. Therefore, the Y circuit in Figure 2 is equivalent to the Δ circuit in Figure 3. The expression of the equivalent impedance in Figure 3 can be found in Appendix A.
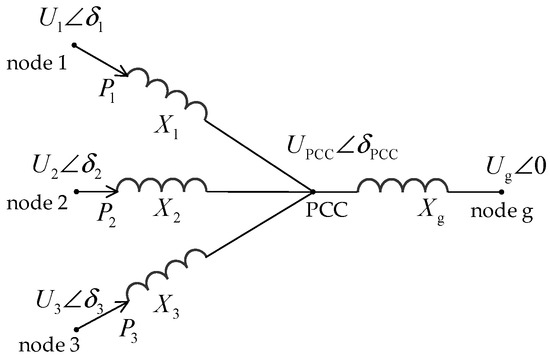
Figure 2.
Y circuit of collection grid in CSP–BESS–wind hybrid energy system.
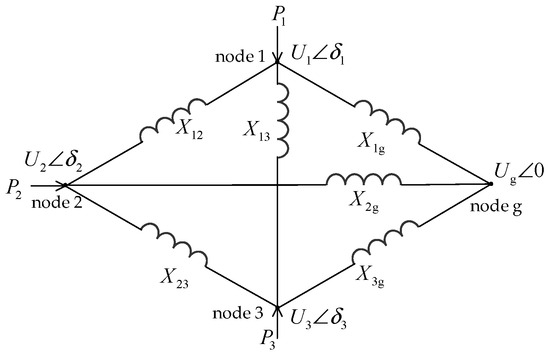
Figure 3.
Equivalent Δ circuit of the collection grid in CSP–BESS–wind hybrid energy system.
With Figure 3, the relationship between the nodes’ output power and the nodes’ voltage can be calculated as [23]
Equation (1) can be further linearized at the equilibrium point to obtain the small-signal model, which is
In the CSP–BESS–wind hybrid energy system, due to the uncertainty of wind and solar energy, the output powers of the CSP plant and wind farm fluctuate. In contrast, the BESS relies on its own energy storage, and its output is relatively constant. Therefore, it is assumed that the output power fluctuation of the energy storage system is 0, i.e., ΔP2 = 0. With this assumption and (2), we can obtain
where K1 and K2 are shown in Appendix B.
By substituting (3) into the first and third equations of (2), we can obtain
where K3, K4, K5, and K6 are shown in Appendix B.
Up to now, we have obtained the coupling model between the CSP unit, BESS, and wind farm. To derive the small-signal model for the entire system, we also need to establish the individual small-signal models for the CSP unit and wind farm.
2.3. Small-Signal Model of Wind Farm
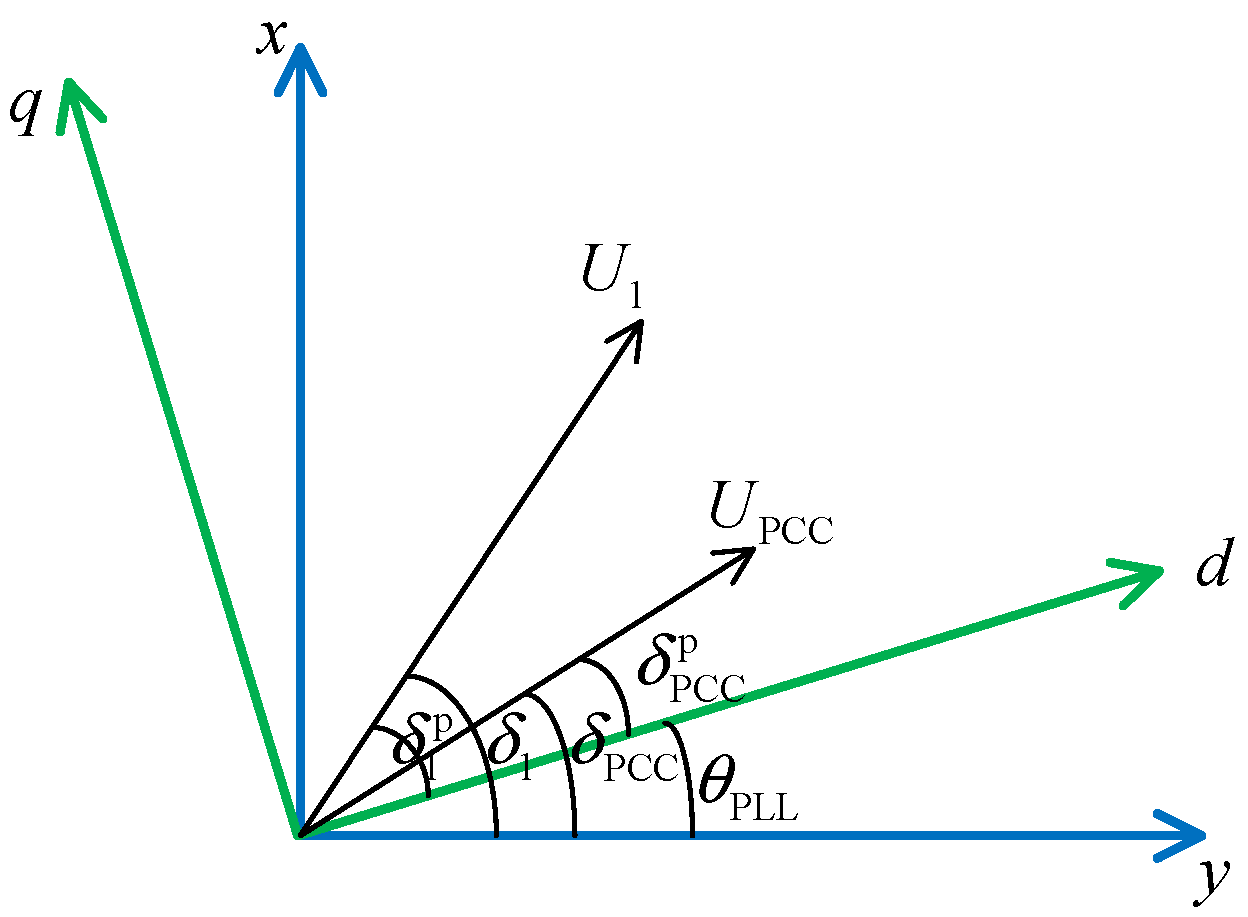
The wind farm is connected to the point of common coupling (PCC) through a phase-locked loop (PLL). For the studied wind farm, there are two reference frames, i.e., the xy-frame and the dq-frame, as shown in Figure 4. The xy-frame coincides with the Ug, while the dq-frame is defined by the PLL. When a disturbance occurs in the system, under the action of the PLL, an angle difference, θPLL, is generated between the two coordinate systems. The superscript ‘p’ indicates variables in the dq coordinate system.
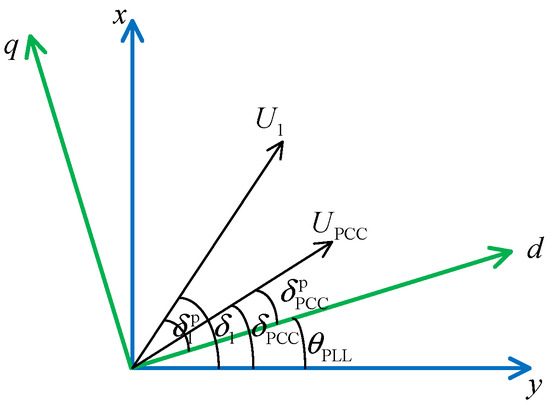
Figure 4.
Relationship between electrical quantities within wind farm.
Linearizing the angular relationships in Figure 4 yields
Linearizing the steady-state line flow equations from the wind farm to the PCC yields the relationships between ΔδPCC, ΔP1, and Δδ1, as follows:
where K7 = 1, and K8 = −X1/(U1Ugcos(δ10-δPCC0)).
The dynamic process of the phase-locked loop (PLL) is second-order, which can be described as [24]
Here, kpPLL and kiPLL are the proportional and integral gain parameters of the PLL’s PI controller.
In the wind farm, the grid-side converter (GSC) controller is the key component, whose dynamics can be described as follows:
Here, C is the dc-link capacitor, Udc0 is the initial value of the dc-link voltage, and ω0 = 2πf0.
The GSC is assumed to use a dual-loop control. Due to the hierarchical control of the GSC, the bandwidth of the DC voltage control is designed to be much lower than that of the inner-current control loop [25]. Therefore, for the dynamic analysis of the time scale of DC voltage control, it can be assumed that the AC current instantaneously tracks its reference values, i.e., the inner-current loop can be approximated as a unit gain. Thus, the dynamics of the current controller are neglected here, and the relationship between the d-axis current and the DC voltage is obtained:
where Kdc(s) represents the outer-loop DC voltage PI controller.
Using Kirchhoff’s voltage law (KVL), the voltage relationship between bus 1 and the PCC in the dq-axis is established as
By equating the real and imaginary parts of Equation (11), we can obtain
Because and are sufficiently small, we have , , and , . Based on this, the second equation of (12) can be rewritten as
Up to now, we have obtained the internal control relationships of the wind farm based on the phase-locked loop (PLL) and constructed its small-signal model.
2.4. Small-Signal Model of CSP
The mathematical model of the CSP plant used in this paper is based on the voltage equations and magnetic flux equations in the dq coordinate system under Park transformation [26]. It includes the models for both the synchronous generator subsystem and the excitation subsystem. The voltage equation for the excitation winding of the synchronous generator in the dq coordinate system is
where Ψf, Uf, If, and Rf are the magnetic flux, voltage, current, and equivalent resistance of the excitation winding in the dq coordinate axis, respectively.
By multiplying both sides of the equation by Xad/Rf and linearizing (14), we can obtain (15), where Xad is the mutual reactance between the d-axis windings.
Here, E′fd is the transient electromotive force (EMF) of the synchronous generator in the quadrature axis, and Eq is the no-load EMF.
The rotor motion equation of the synchronous generator can be described as [27]
where ω3 is the rotor speed of the synchronous generator, M is the rotor inertia constant, D is the damping coefficient, and Pm is the mechanical power of the synchronous generator.
The excitation voltage Efd of the excitation subsystem is divided into two parts [28]: one part is the constant excitation voltage Efd0; the other part is the output voltage of the automatic voltage regulator E′fd. The small-signal model of the excitation subsystem in the time domain can be described as
where KA is the gain of the automatic voltage regulator, and TA is the time constant of the automatic voltage regulator.
Based on the circuit relationship, the equations for the active power, no-load electromotive force, and terminal voltage of the synchronous generator can be obtained as
Here, X′dΣ = Xt + X′d, XqΣ = Xt + Xq, and XdΣ = Xt + Xd. Xt represents the reactance values of the transmission line between the CSP unit and the ideal voltage source. X′d, Xq, and Xd are the direct-axis transient reactance, the reactance of the q-axis winding, and the reactance of the d-axis winding, respectively.
Up to now, we have constructed a fourth-order small-signal model for the CSP unit, which includes a third-order model of the synchronous generator and a first-order model of the excitation system.
The comprehensive model of the grid-connected CSP–BESS–wind hybrid energy system is shown in Figure 5.
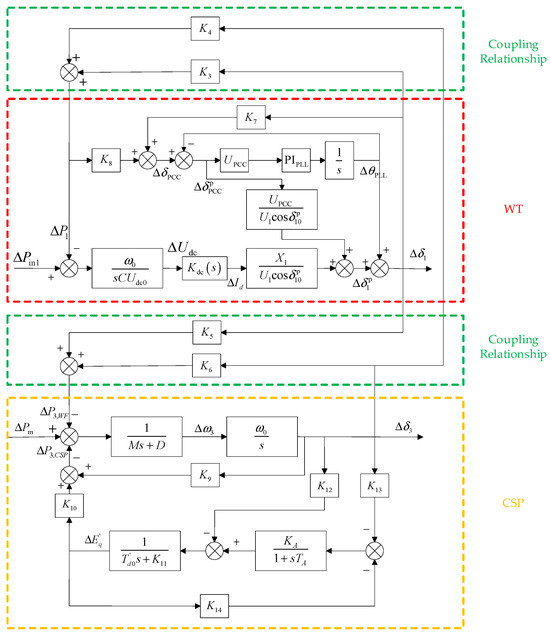
Figure 5.
Comprehensive model of CSP–BESS–wind hybrid energy system.
3. Sub-Synchronous Oscillation in Hybrid Energy System
3.1. Instability Analysis
In Figure 5, the interactions between the CSP plant, BESS, wind farm, and collection grid can be further analyzed by using the Nyquist stability criterion. Herein, the orange box represents the CSP plant, the red box represents the wind farm, and the green box represents the coupling relationship between the CSP plant and the wind farm by considering the collection grid and BESS. To facilitate the stability analysis, Figure 5 is equivalent to Figure 6.
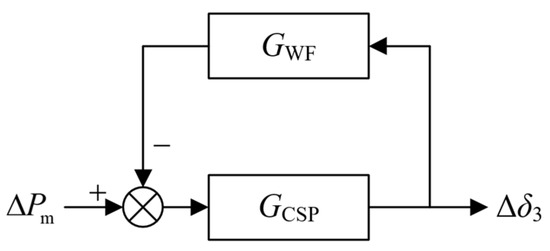
Figure 6.
Equivalent model of CSP–BESS–wind hybrid energy system.
Here, GCSP can be derived from the orange box and green box in Figure 5. GWF can be derived from the red box in Figure 5. That is,
where
As shown in the above figure, the hybrid system can be equivalently represented as a single-input, single-output (SISO) closed-loop system. Therefore, its stability can be analyzed using the Nyquist stability criterion. The Nyquist stability criterion is a frequency-domain method used to assess the stability of linear systems, particularly for open-loop systems. This criterion relies on the frequency response of the open-loop transfer function and provides a way to determine the stability of a closed-loop system by examining its Nyquist plot. Specifically, Figure 6 can be derived into two parts: 1/GCSP and GWF. According to the Nyquist stability criterion, the system is stable if the phase difference between 1/GCSP and GWF is less than 180 degrees at the gain crossover frequency, where their magnitude intersects in the Bode plot.
3.2. Time-Domain Simulation Verification
We have already obtained the linearized model of the system in Section 2, which satisfies the conditions for using the Nyquist criterion. However, the Nyquist criterion can only provide the frequency characteristics of system oscillations and cannot give information about the oscillation amplitude. Therefore, we also use time-domain simulation analysis to supplement the Nyquist criterion. As a result, in this subsection, the Nyquist stability criterion is first used to analyze the stability of the CSP–BESS–wind hybrid energy system with their specific parameters. After that, a time-domain simulation is conducted to verify the above findings. The structure of the studied system is shown in Figure 1. The output powers of the wind farm, BESS, and CSP plant are 100 MW, 30 MW, and 40 MW, respectively. The parameters of the wind farm, CSP plant, and collection grid are listed in Table 1, Table 2, and Table 3, respectively.

Table 1.
Internal parameters of the wind turbine.
Table 2.
Internal parameters of the solar thermal power generator.
Table 3.
Transmission line and grid connection point parameters.
This paper mainly focuses on the sub-synchronous oscillation issues caused by the CSP–BESS–wind hybrid energy system, with oscillation frequencies ranging from a few Hz to 50 Hz. Since the time scale is typically at the millisecond level, we set the simulation duration to 2.5 s.
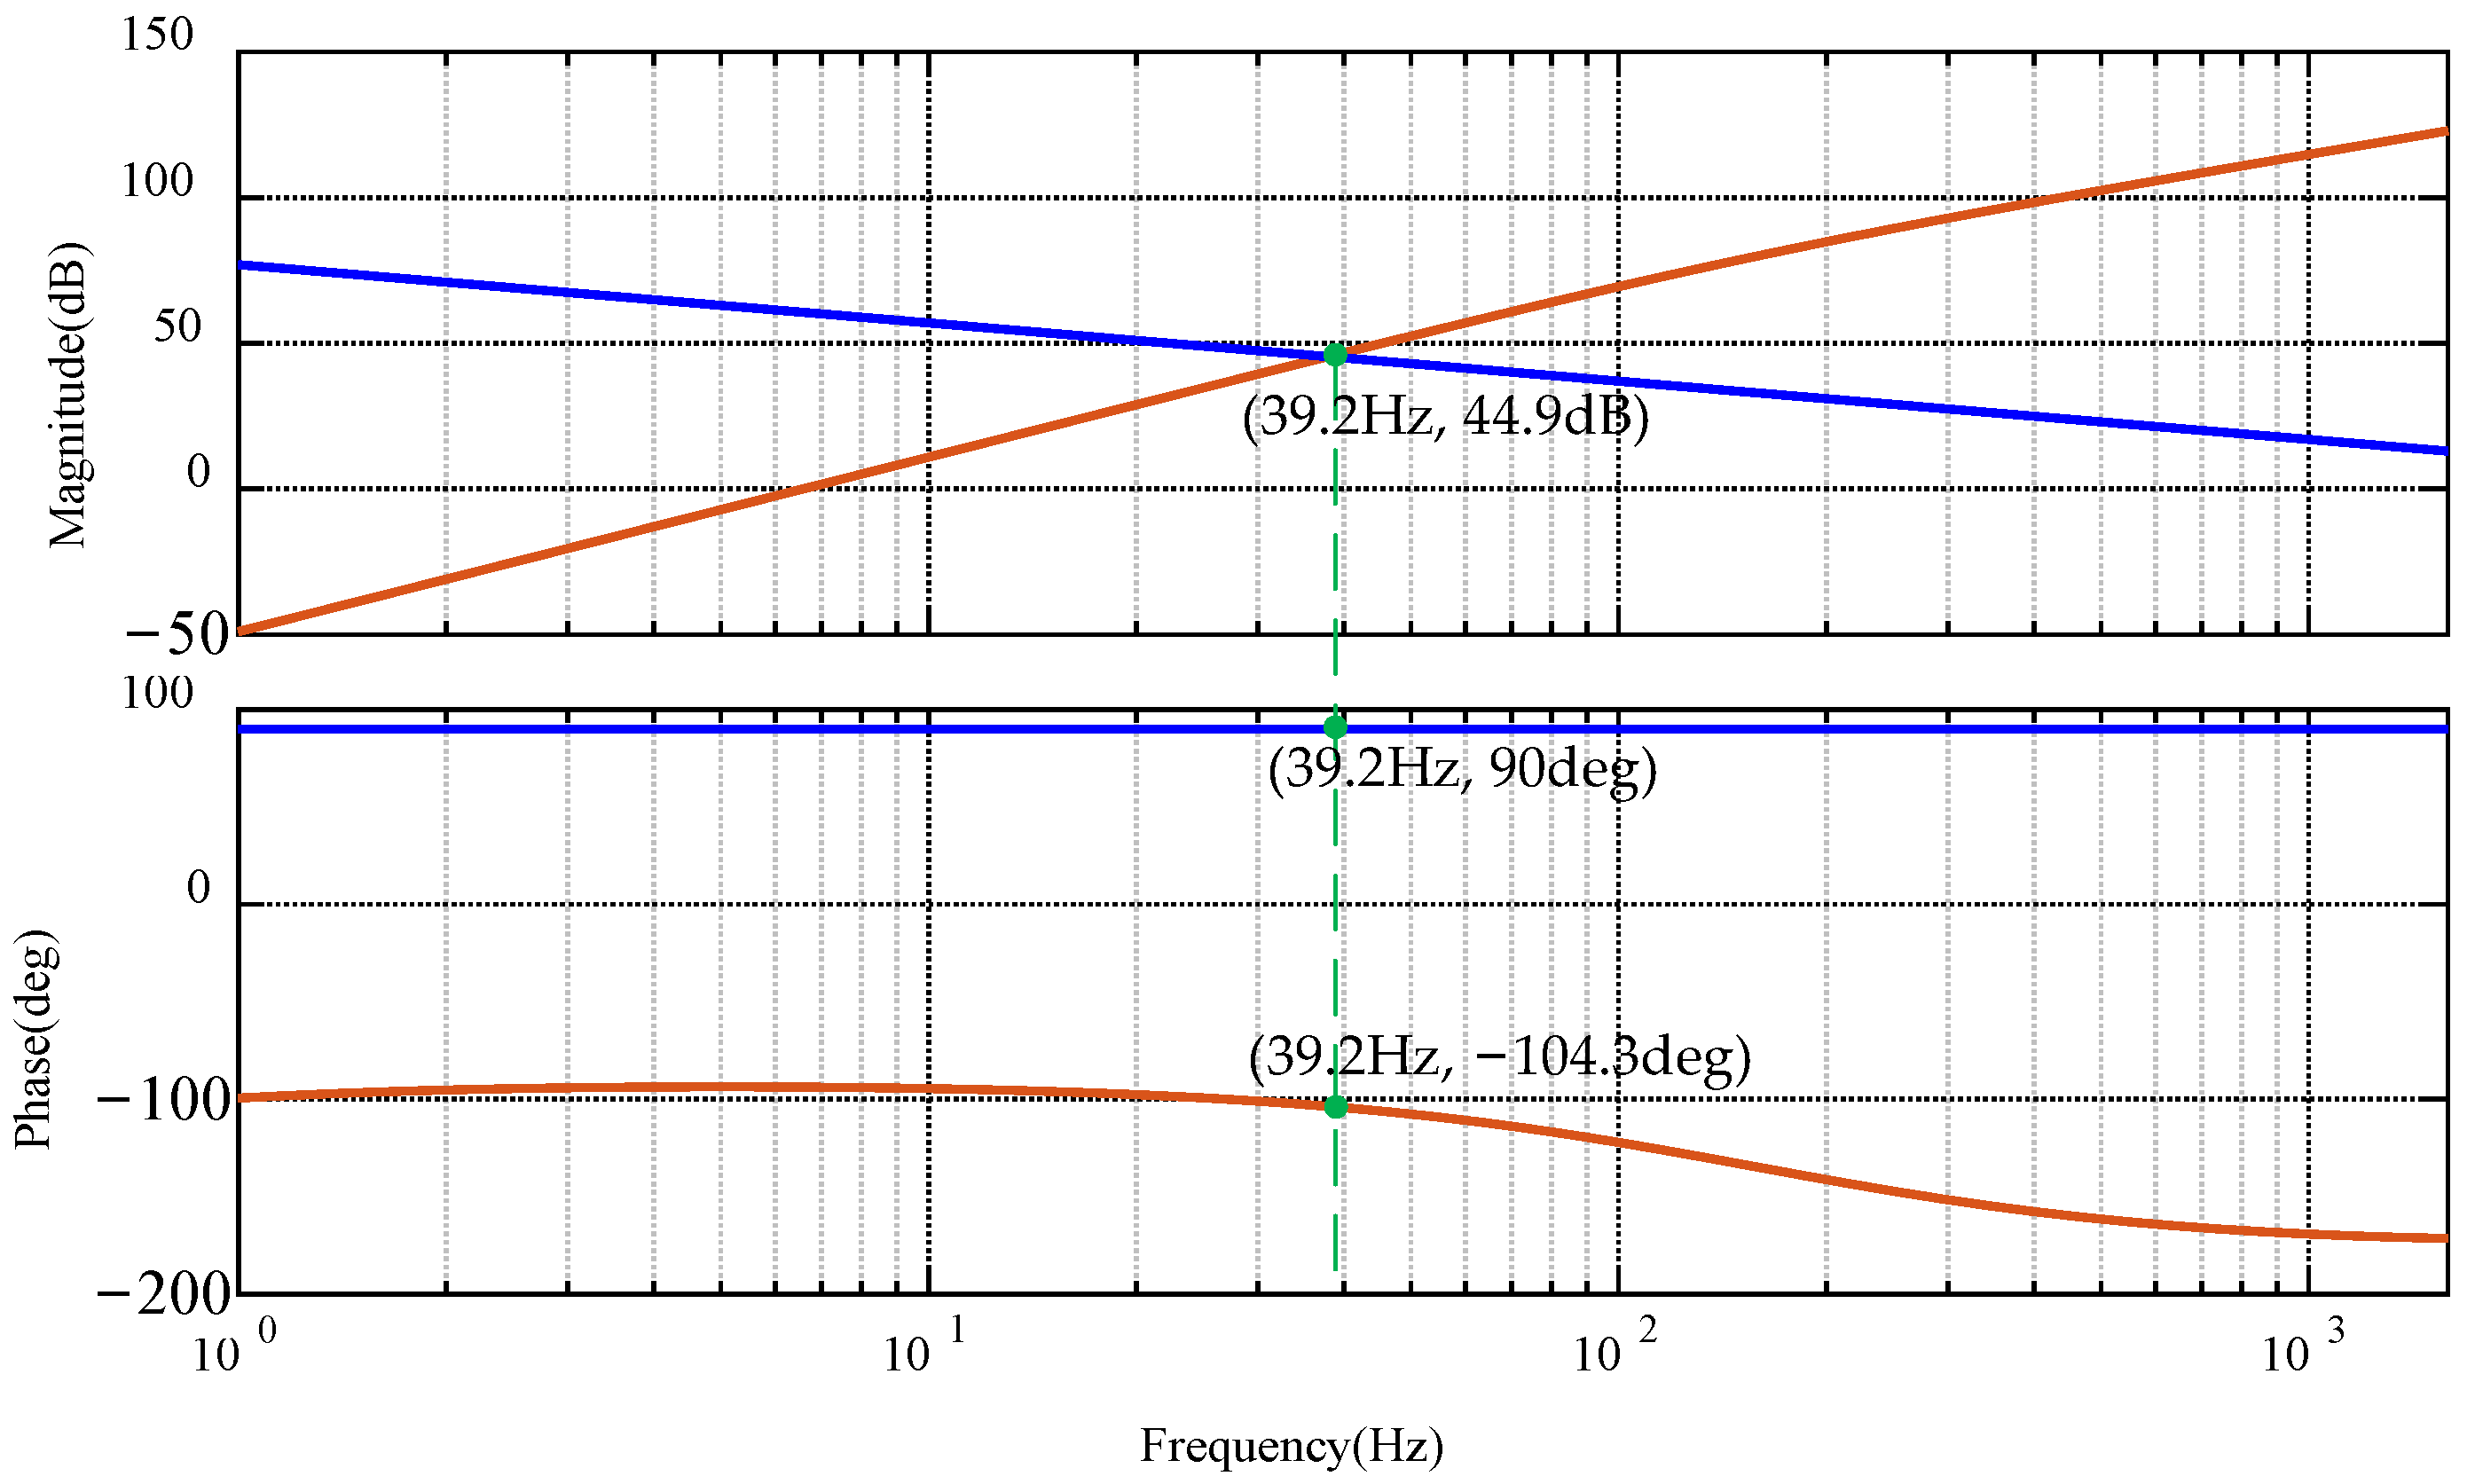
With (20)–(22) and Table 1, Table 2 and Table 3, Figure 7 can be plotted. Herein, the orange line represents 1/GCSP, and the blue line denotes GWF. From this figure, we can see that at a frequency of 39.2 Hz, the magnitude–frequency curves of 1/GCSP and GWF intersect. Meanwhile, the phase difference between the phase–frequency curves of 1/GCSP and GWF exceeds 180 degrees, indicating a risk of sub-synchronous oscillation in this hybrid system.

Figure 7.
Bode plot of the hybrid system. (The orange line represents 1/GCSP, and the blue line denotes GWF.)
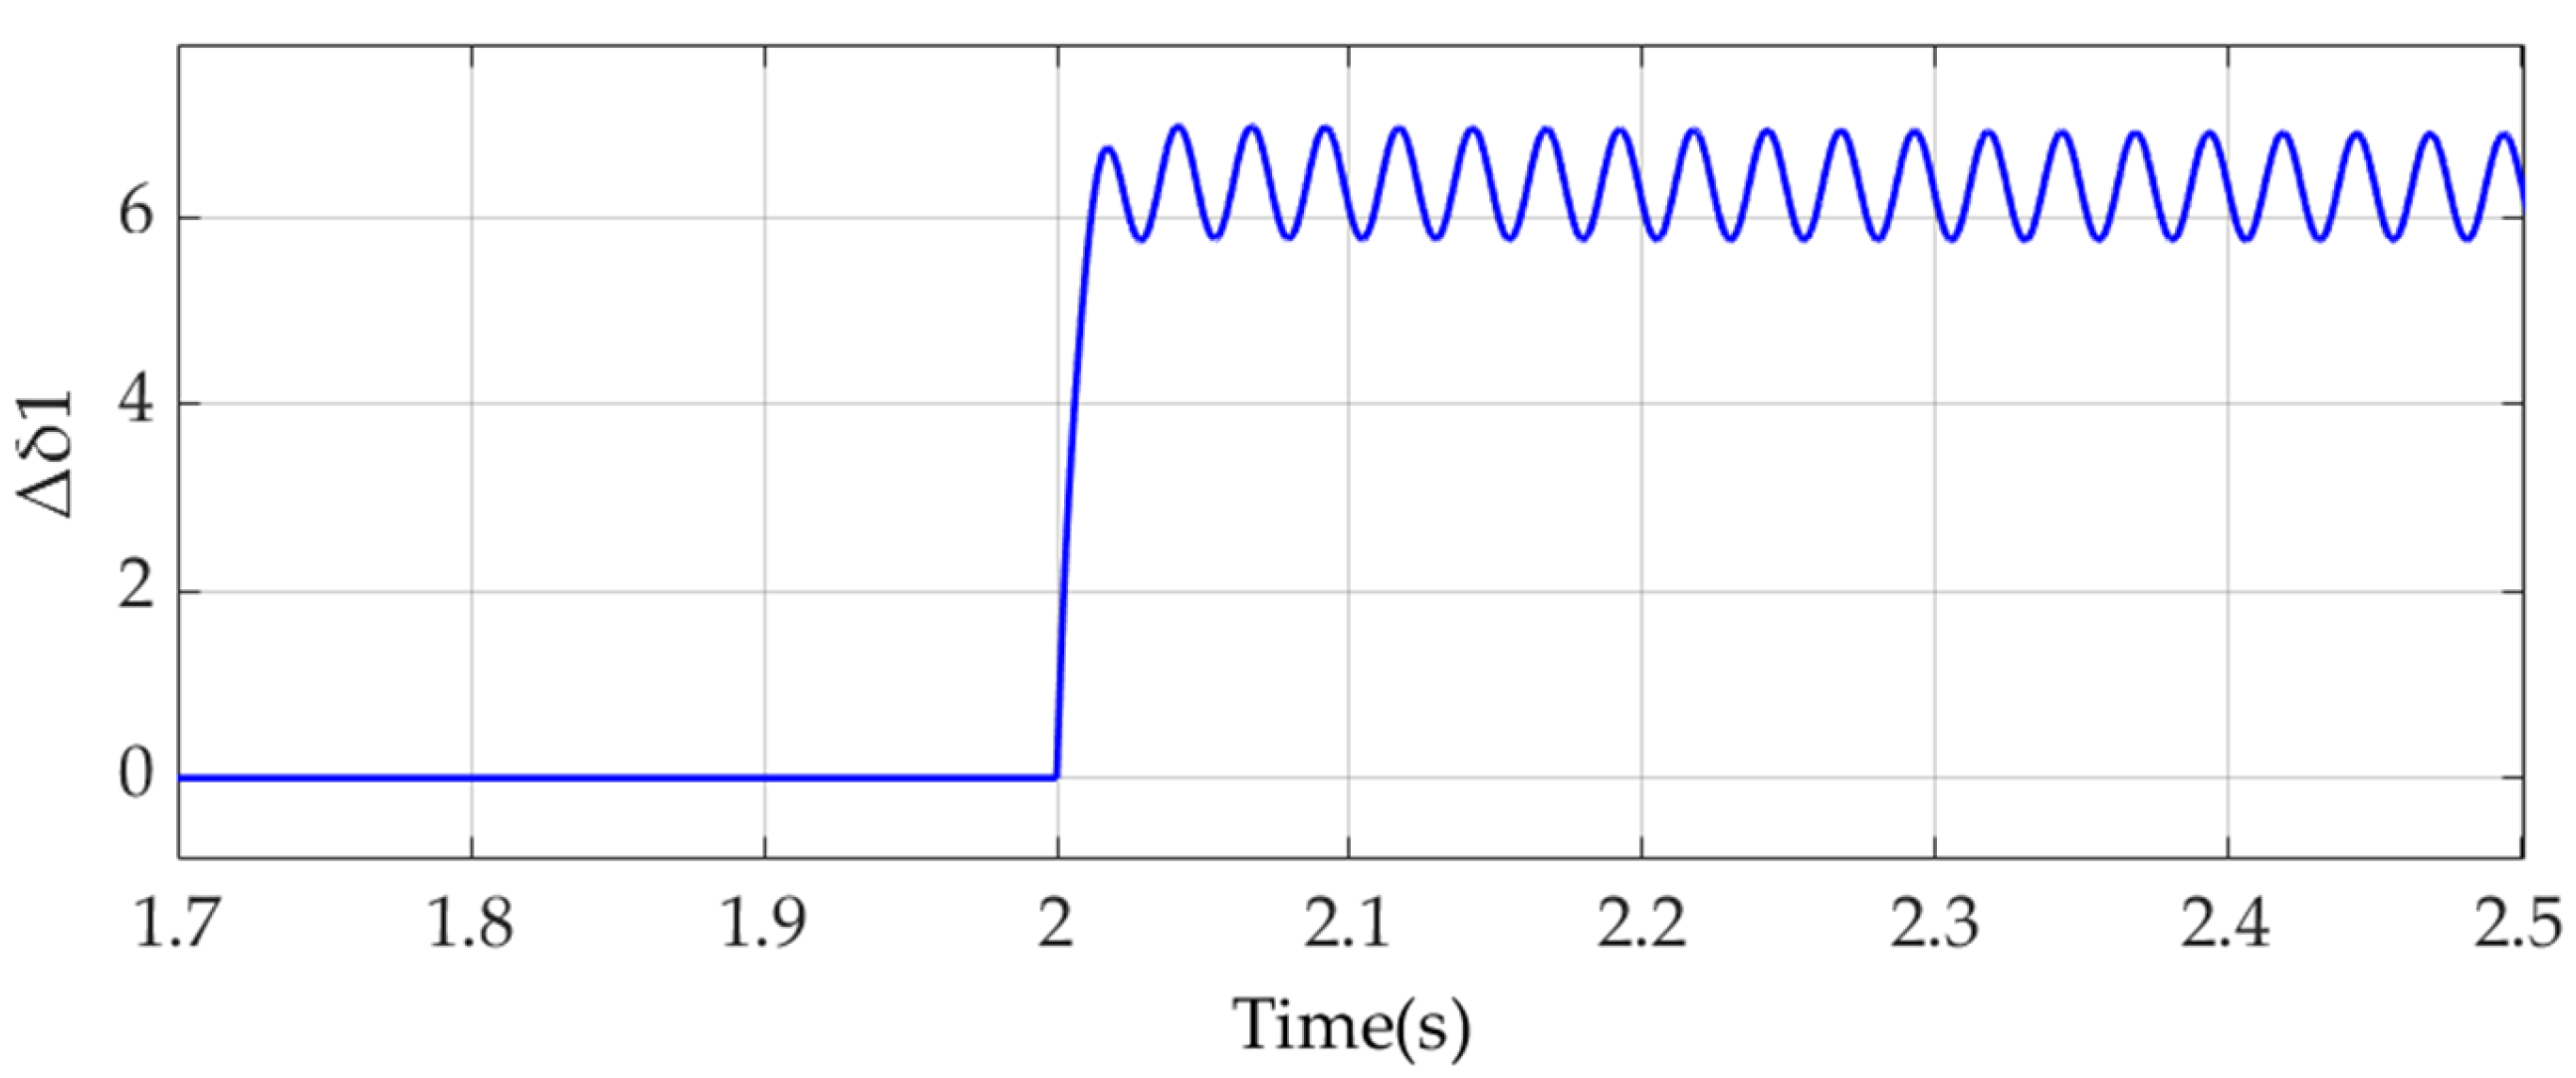
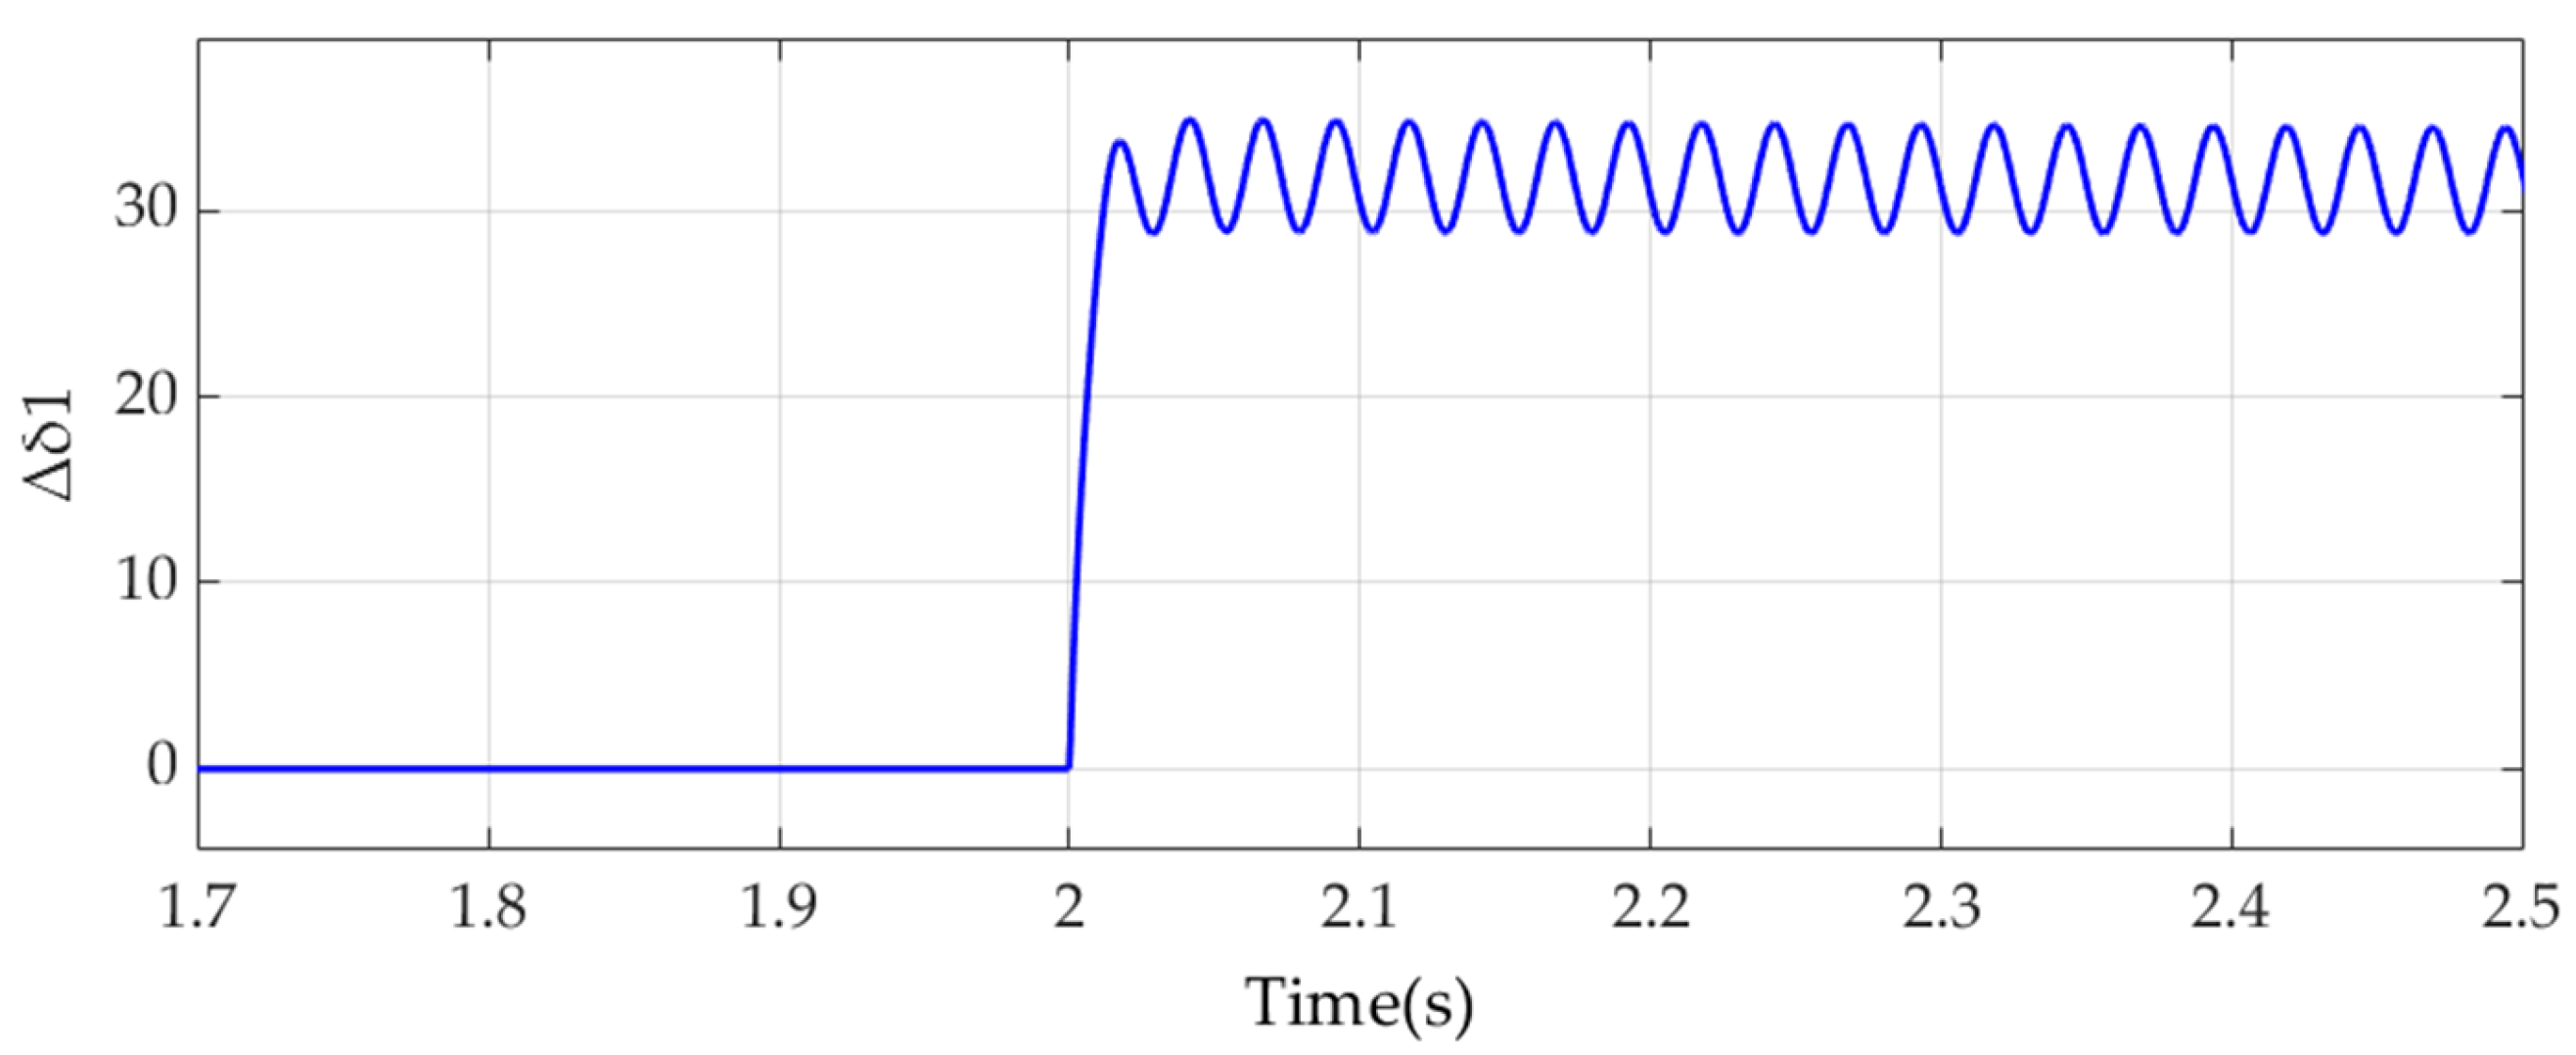
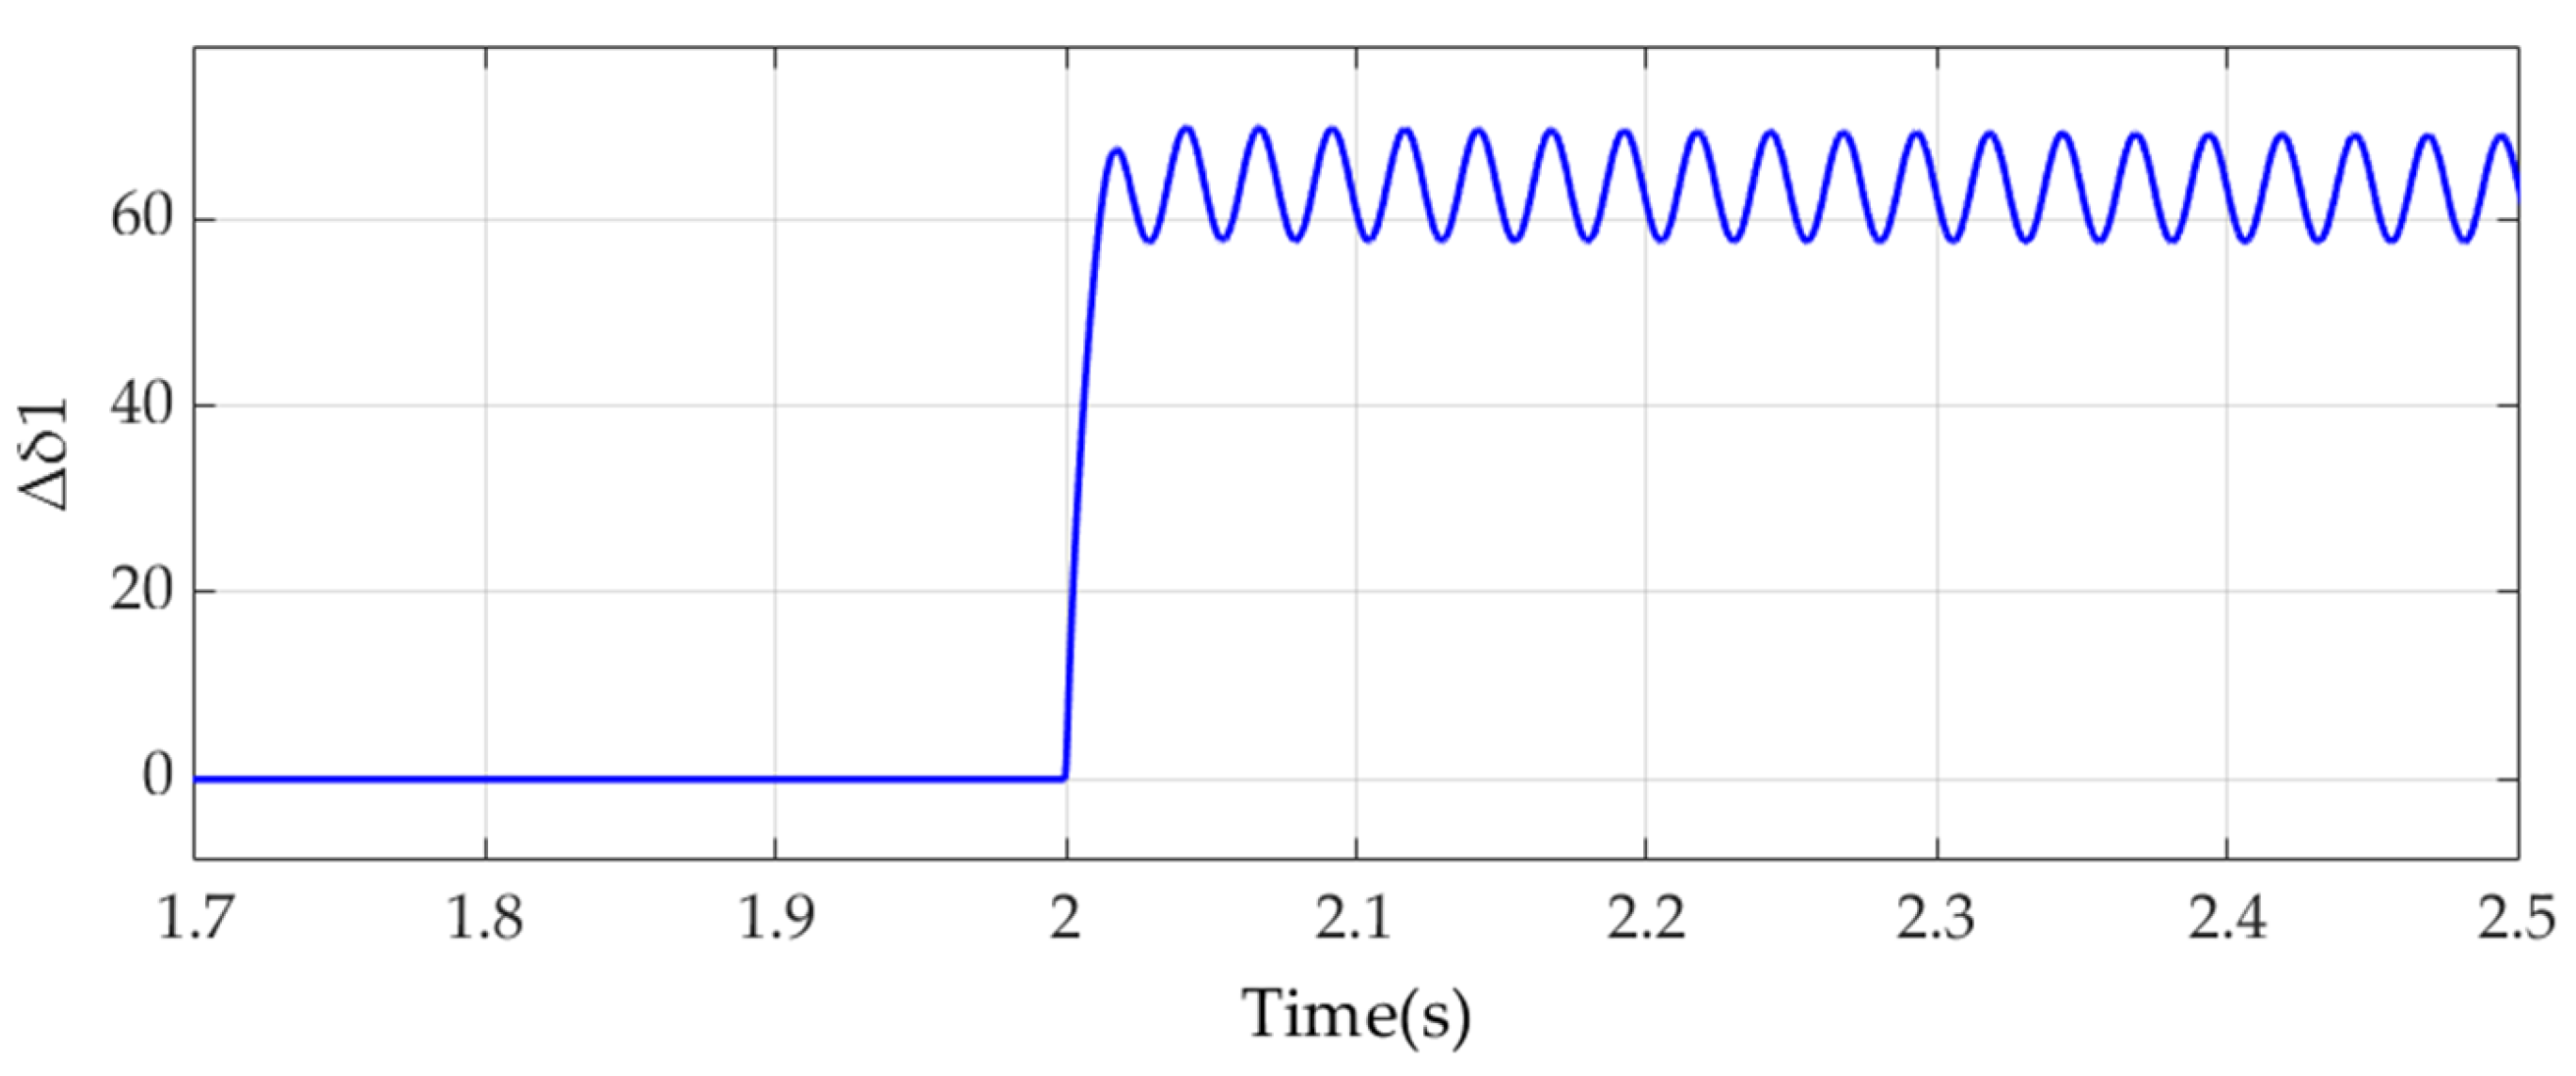
To further validate the above findings, we conducted a time-domain simulation in Matlab/Simulink (Version R2022b). At 2 s, the sudden increase in the output power of the wind turbine was set to 1%, 5%, and 10%, and the time-domain simulation results are shown in Figure 8, Figure 9 and Figure 10, respectively. It can be observed that the magnitudes of the power angle oscillations for the wind turbine are 1.227°, 6.135°, and 12.27°, with an oscillation frequency of 39.7 Hz in all cases, indicating sub-synchronous oscillations.
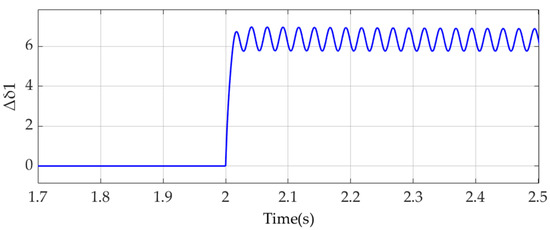
Figure 8.
Phase angle of the wind farm output voltage angle when the power increase is set to 1%.
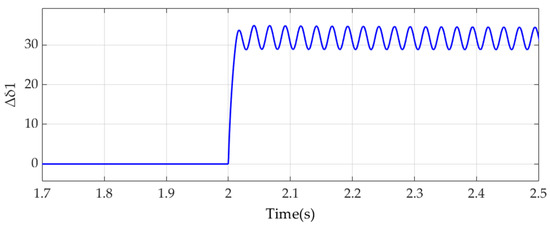
Figure 9.
Phase angle of the wind farm output voltage angle when the power increase is set to 5%.
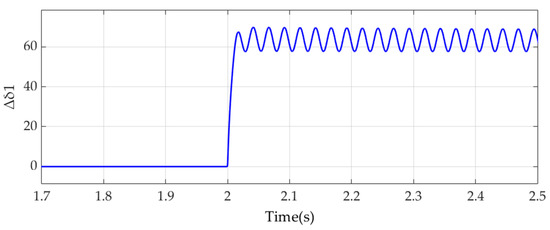
Figure 10.
Phase angle of the wind farm output voltage angle when the power increase is set to 10%.
From the above results, we can conclude that when the CSP plant, BESS, and wind farm are connected to the same collection grid, and there is a risk of sub-synchronous oscillation, posing a potential threat to the safe operation of the equipment.
4. Method for Enhancing Stability of Hybrid Energy System
4.1. Impact of System Parameters on Sub-Synchronous Oscillation
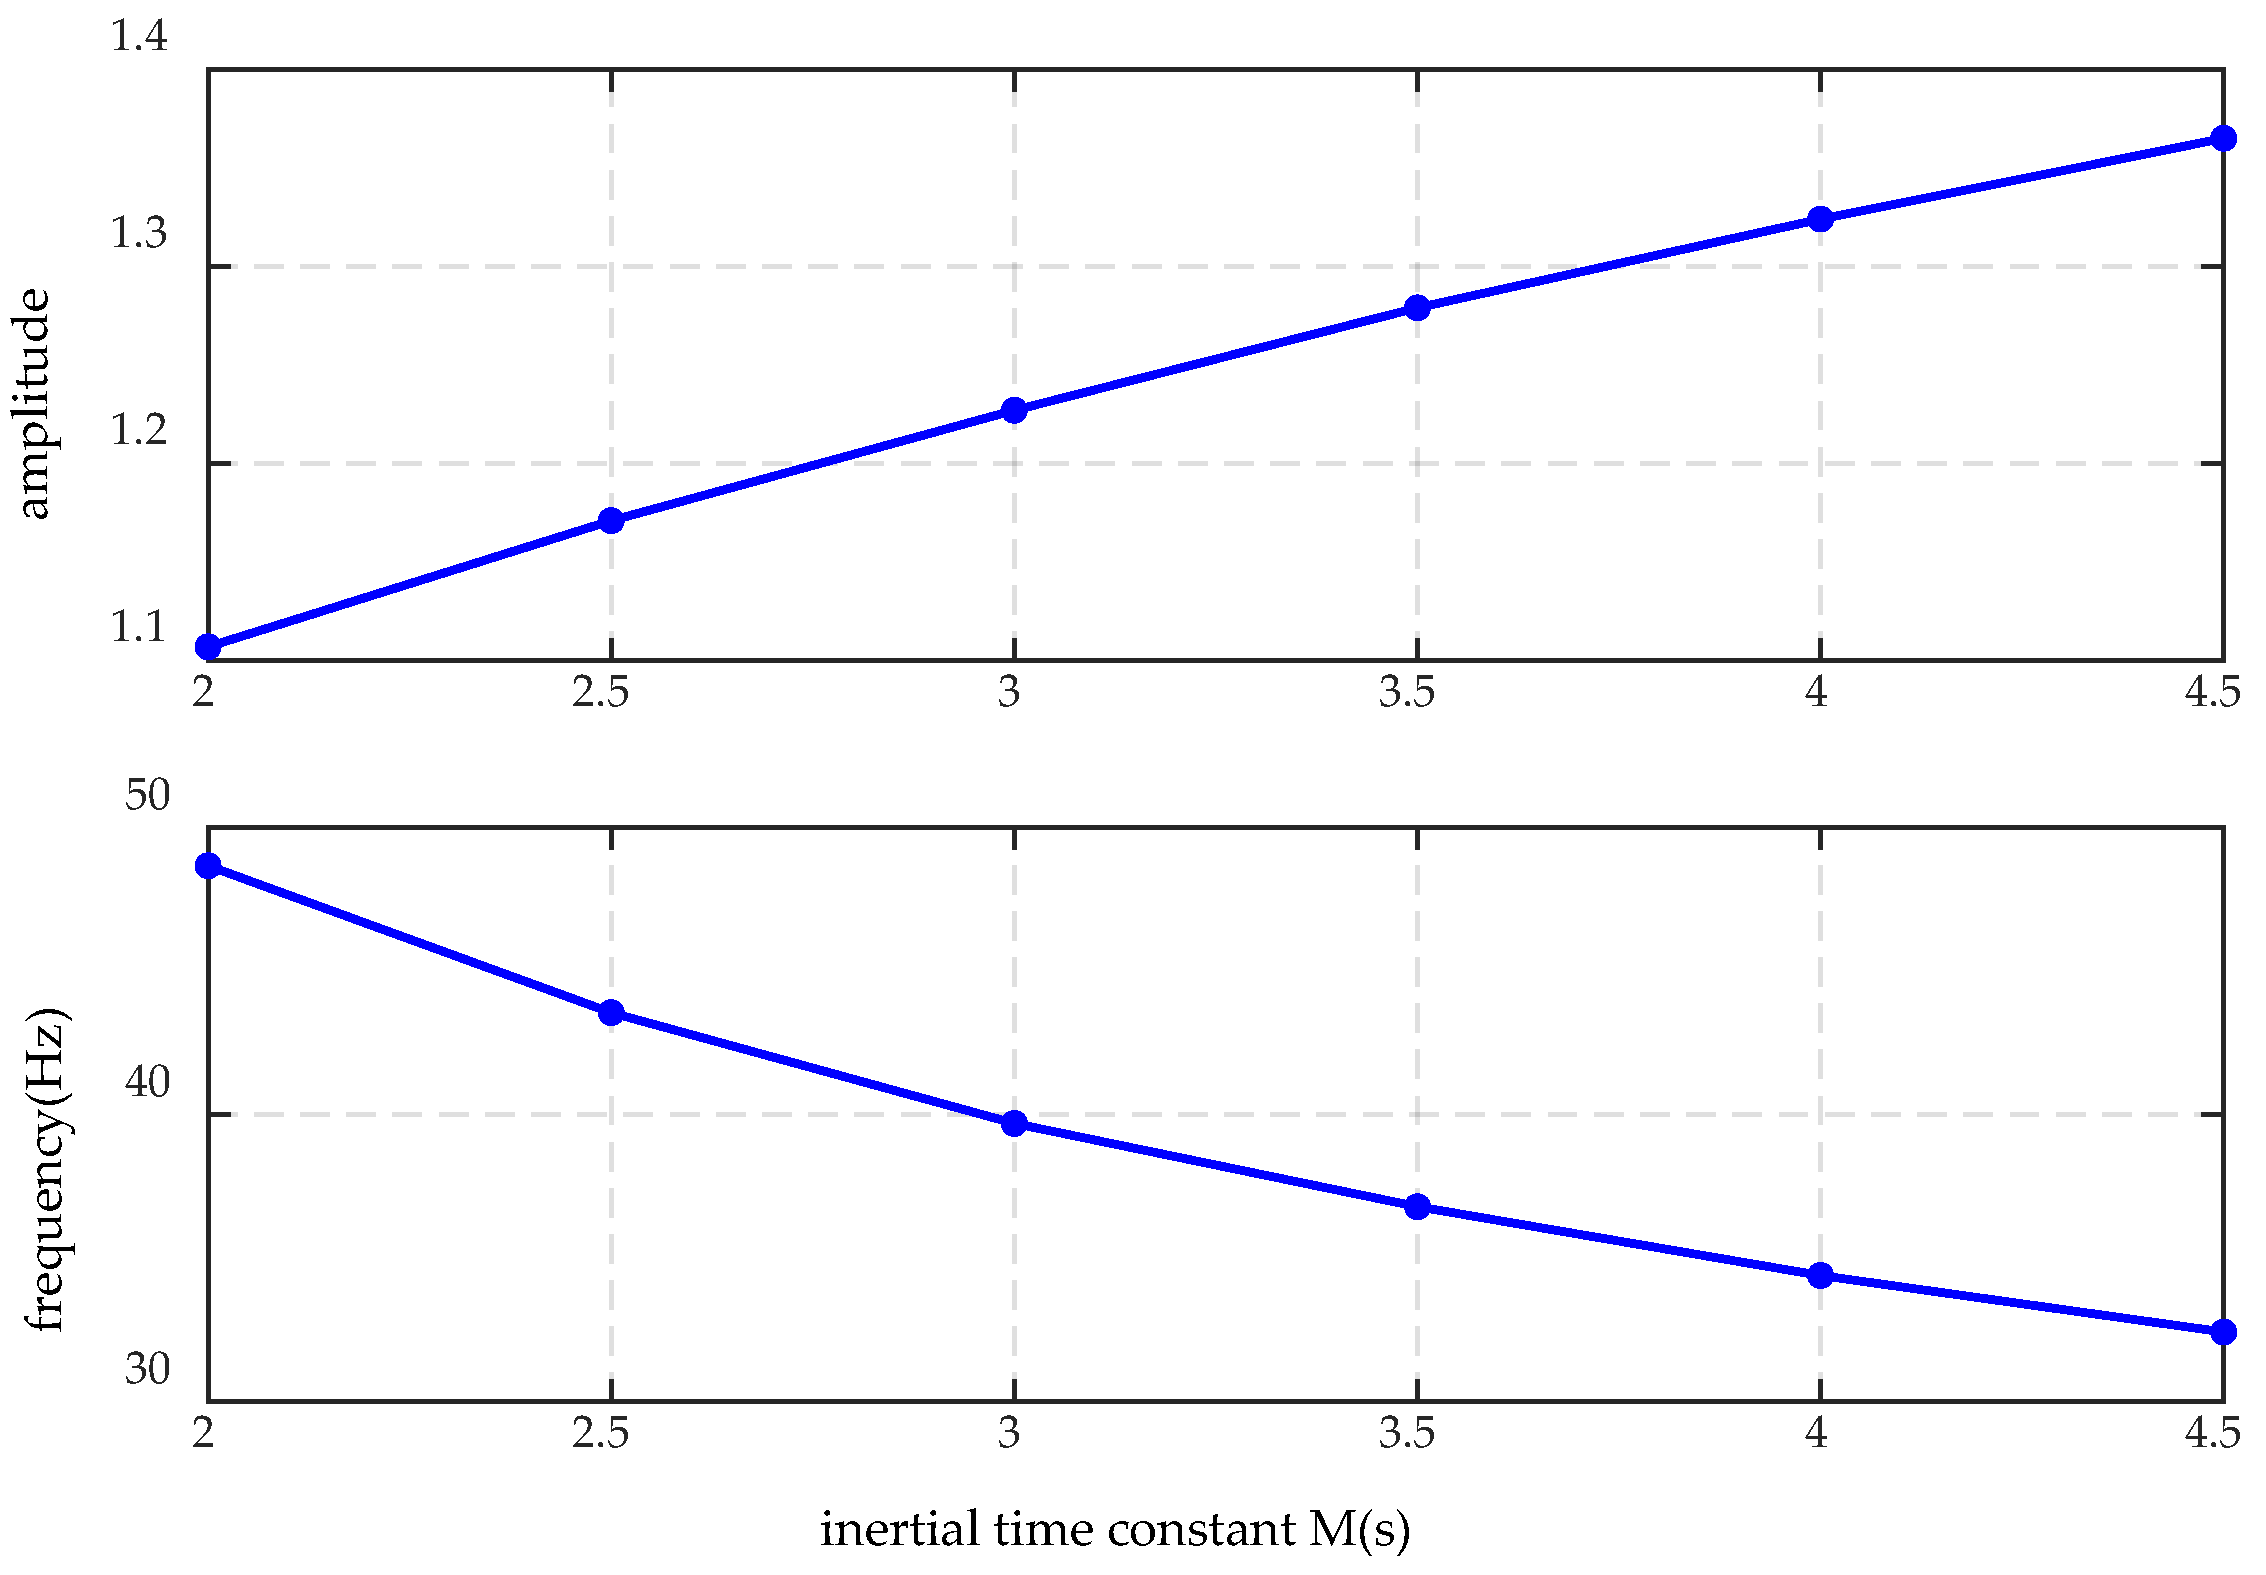
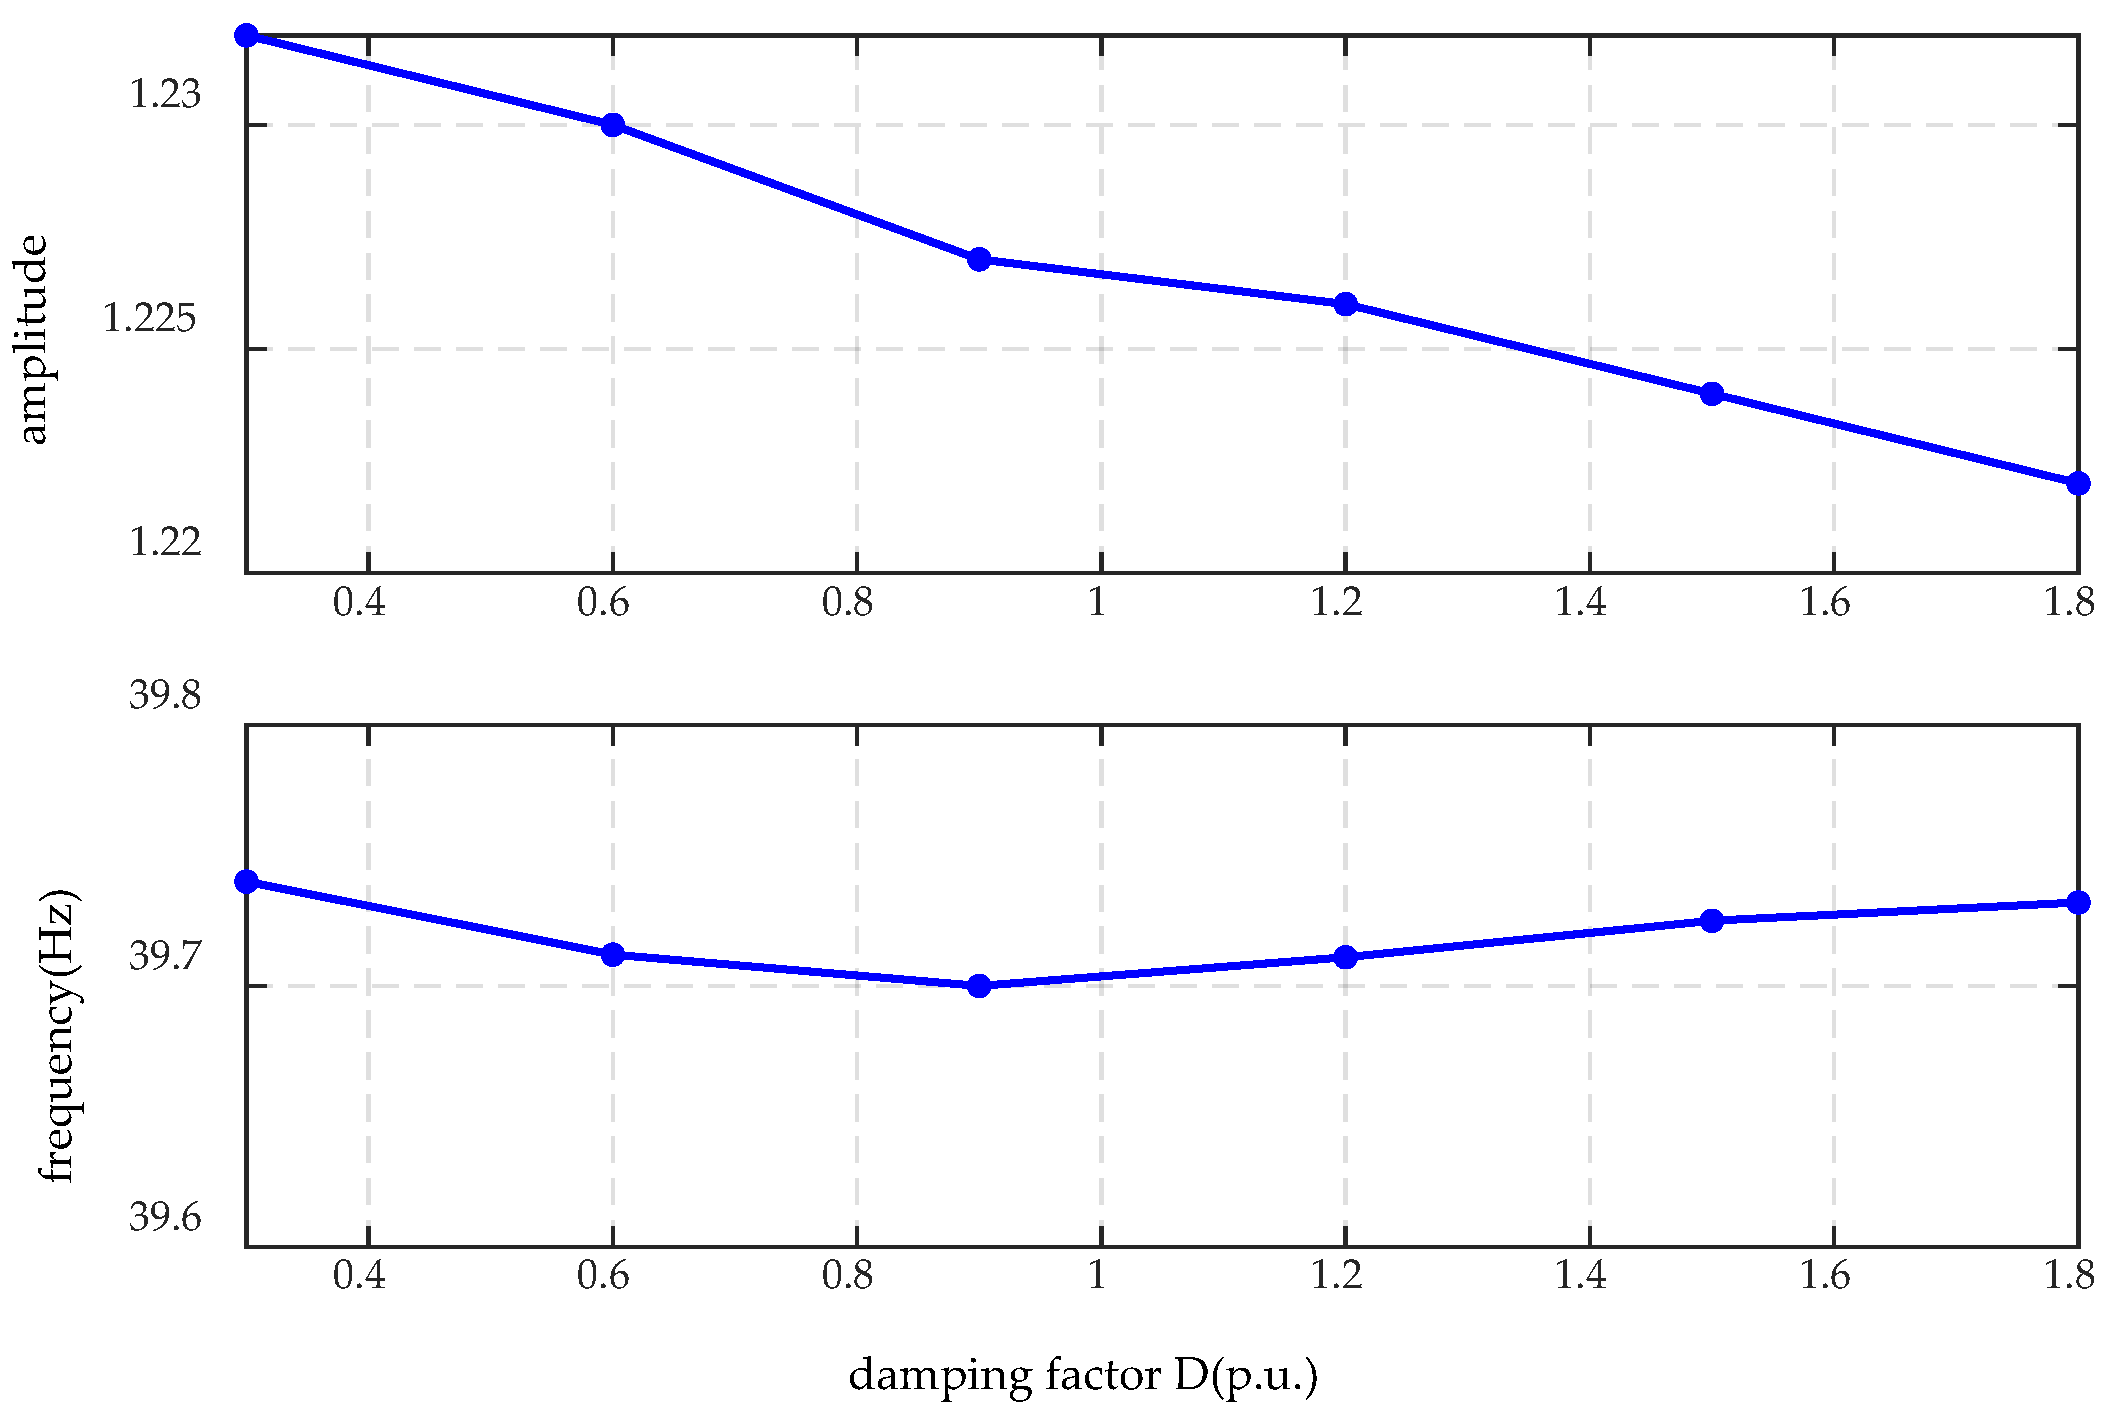
To effectively suppress the sub-synchronous oscillation in the hybrid system, it is necessary to first study the impacts of various parameters of the CSP plant and wind farm on the oscillation amplitude and frequency. Figure 11 and Figure 12 illustrate the effects of the rotor inertia constant M and damping coefficient D of the CSP generator on the sub-synchronous oscillation. It can be observed that as the rotor inertia constant M increases, the oscillation amplitude becomes larger, and the oscillation frequency decreases. Moreover, when the damping coefficient D increases, the oscillation amplitude slightly decreases, but the impact on the oscillation frequency is negligible.
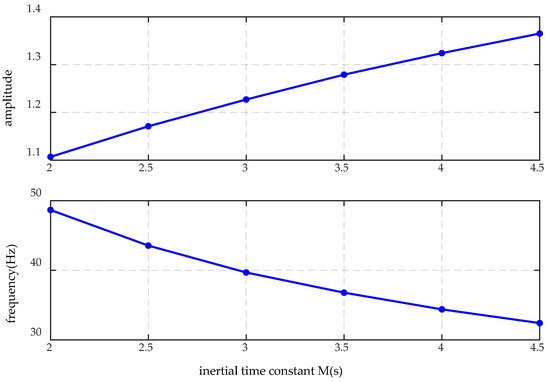
Figure 11.
The effect of the rotor inertia constant M of the CSP on oscillation.

Figure 12.
The effect of the damping coefficient D of the CSP on oscillation.
This is because the rotor inertia constant M is a physical parameter that describes the mass and rotational inertia of the generator rotor. It determines the system’s response speed to load disturbances and the system’s inertial balance. A higher rotor inertia can slow down the generator’s response to load disturbances, helping to maintain system stability and preventing the system from frequently entering oscillation states. As a result, the system’s stability is enhanced, and the oscillation amplitude becomes smaller. The damping coefficient D describes the rate of energy dissipation within the system. It reflects how the system converts oscillatory energy into heat or other forms of energy to reduce oscillations. A higher damping coefficient effectively reduces both the amplitude and duration of oscillations, allowing the system to recover stability more quickly.
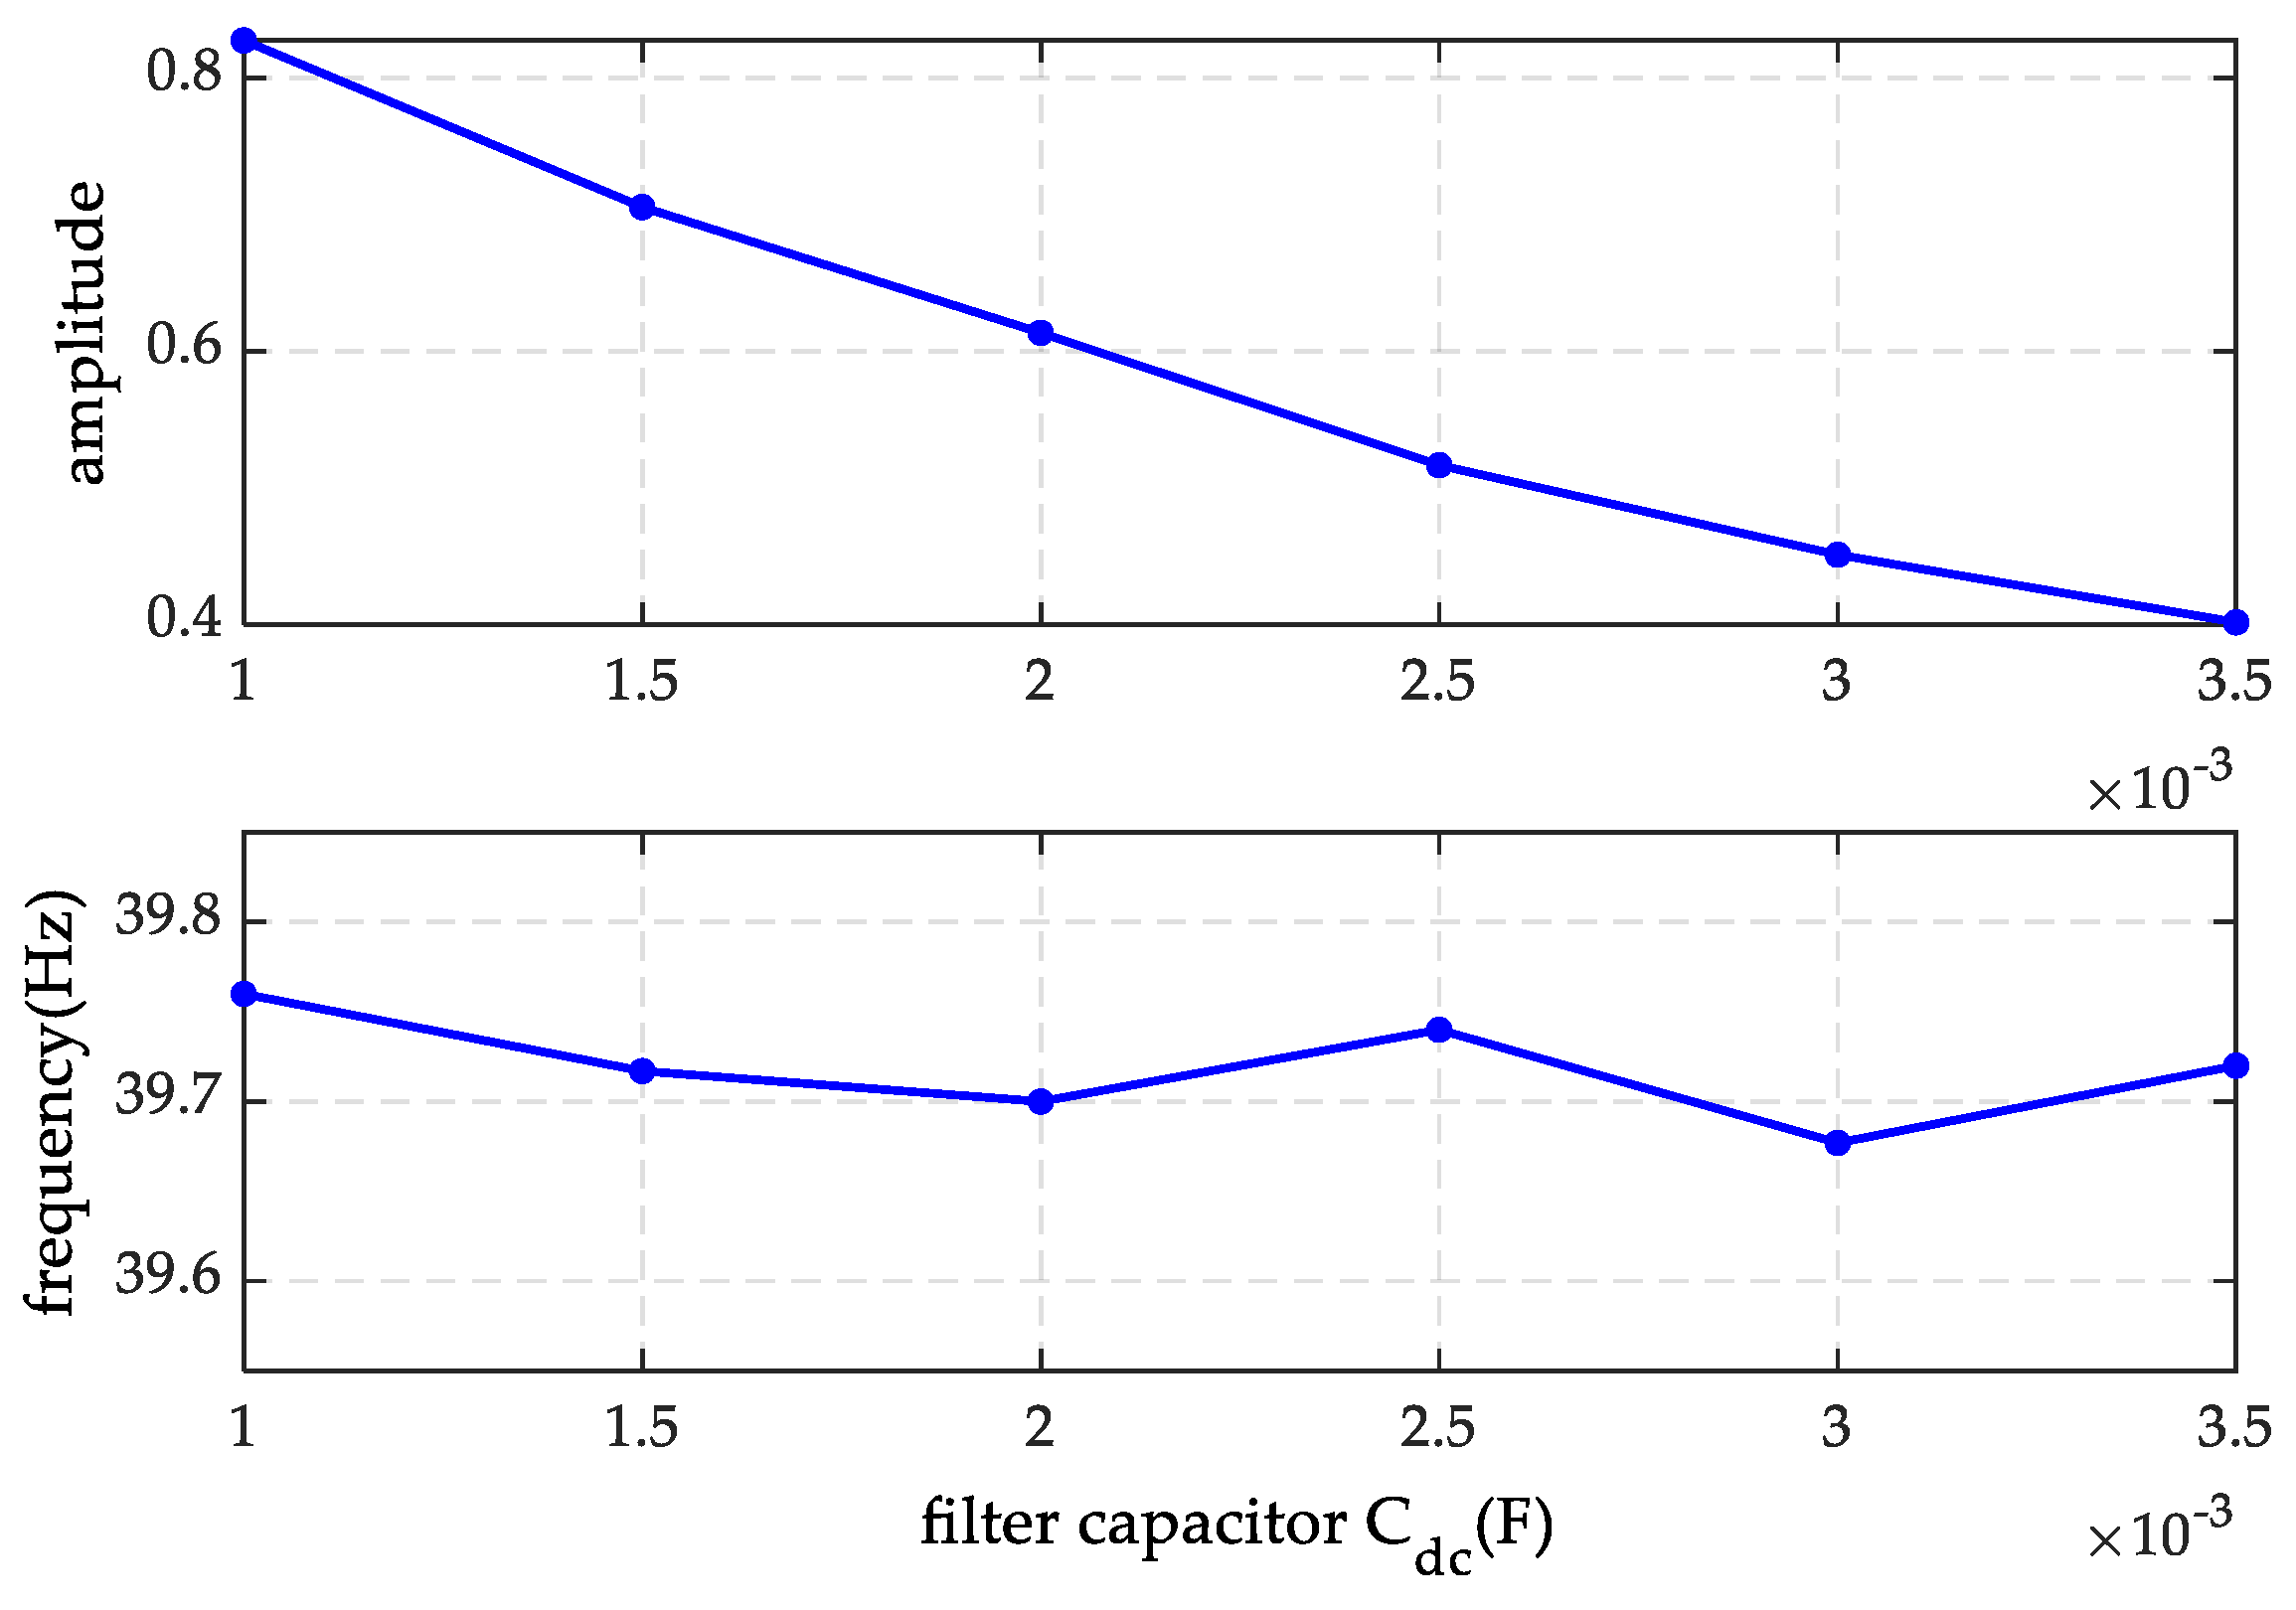
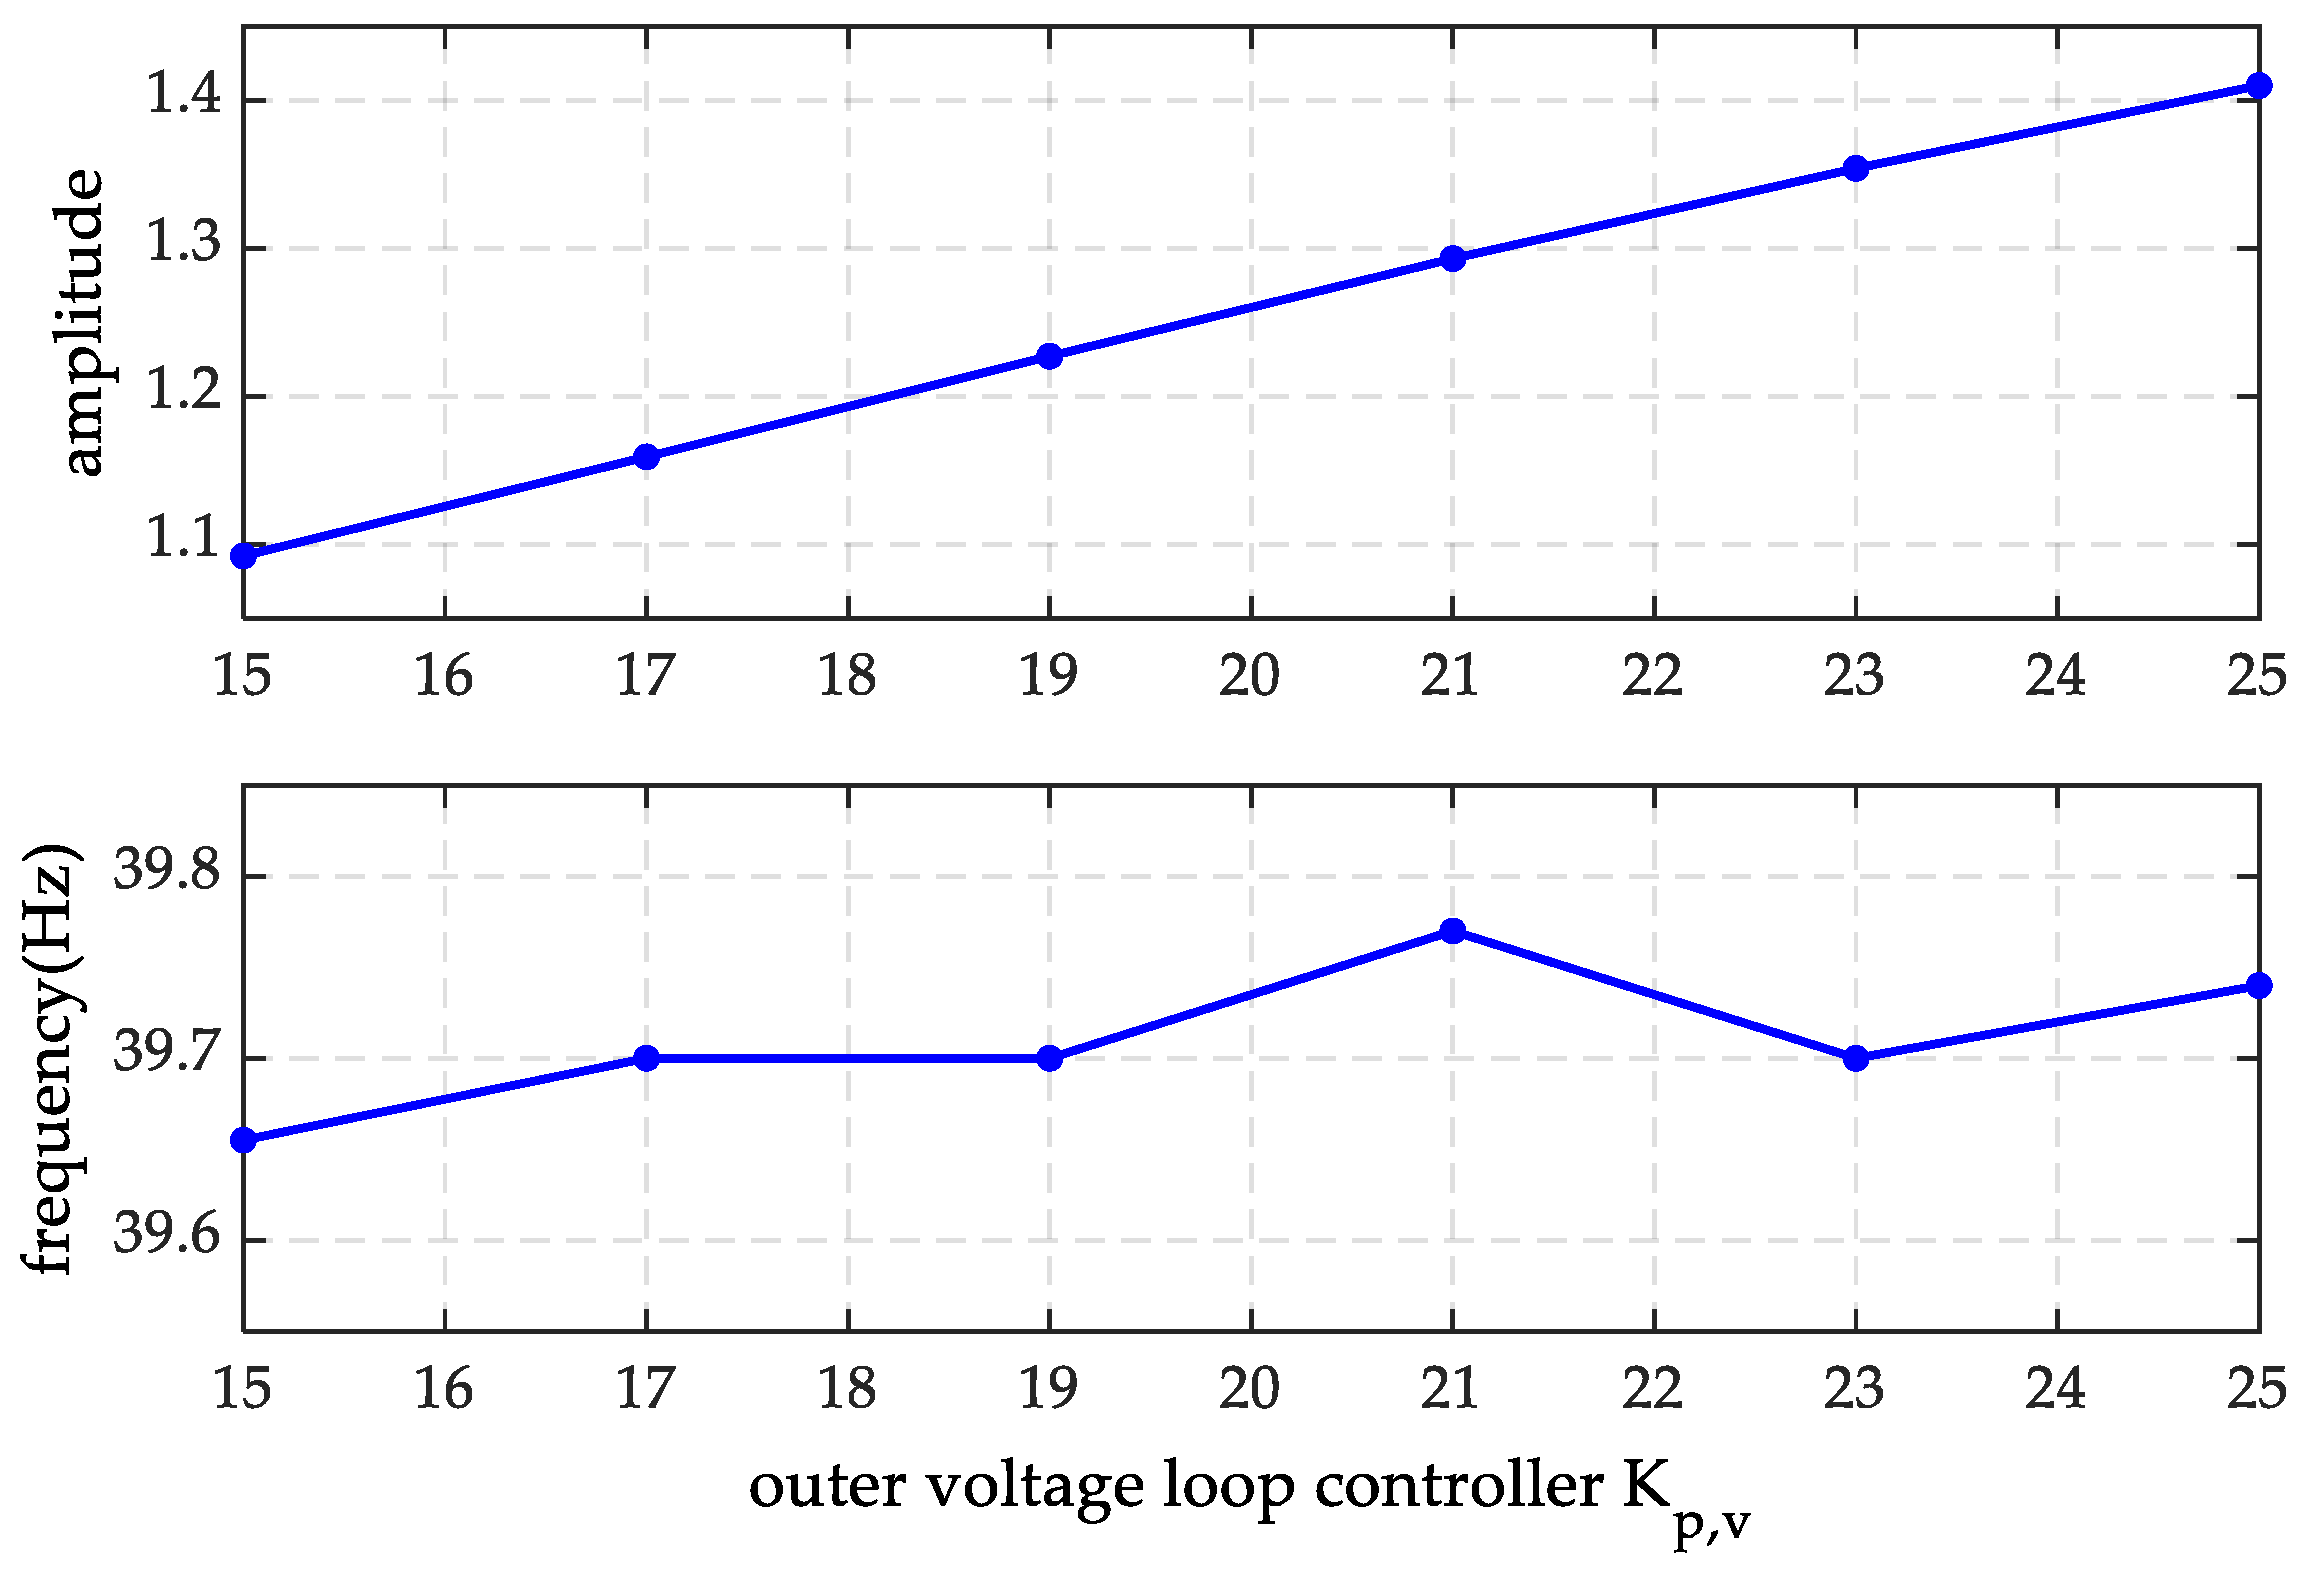
Figure 13, Figure 14 and Figure 15 show the effects of the DC-link capacitance Cdc, voltage loop controller parameter Kp,v, and initial DC-link voltage Udc0 of the wind turbine generator on the oscillations, respectively. It can be observed that as Cdc and Udc0 increase, the oscillation amplitude decreases, while an increase in Kp,v leads to a rise in the oscillation amplitude. However, these parameters have minimal influence on the oscillation frequency.
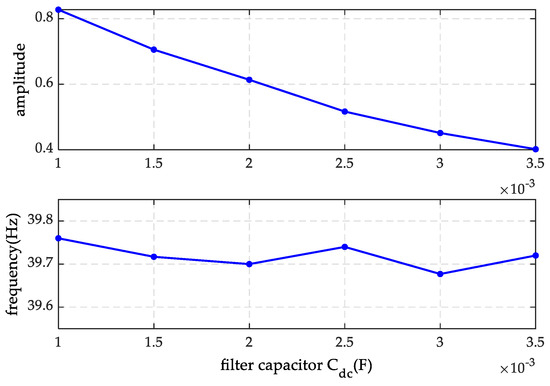
Figure 13.
The effect of the DC-link capacitance Cdc of the wind farm on oscillation.

Figure 14.
The effect of the voltage outer-loop controller parameter Kp,v of the wind farm on oscillation.
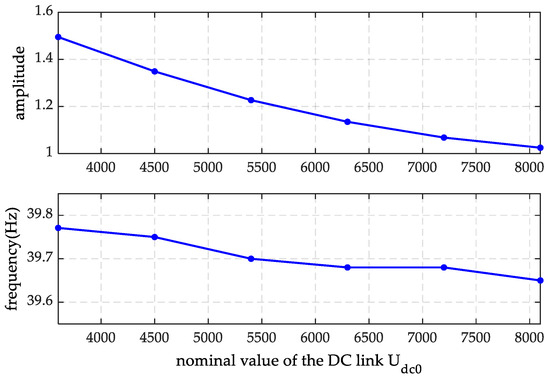
Figure 15.
The effect of the initial DC-link voltage Udc0 of the wind farm on oscillation.
4.2. Design of Damping Controller and Its Performance
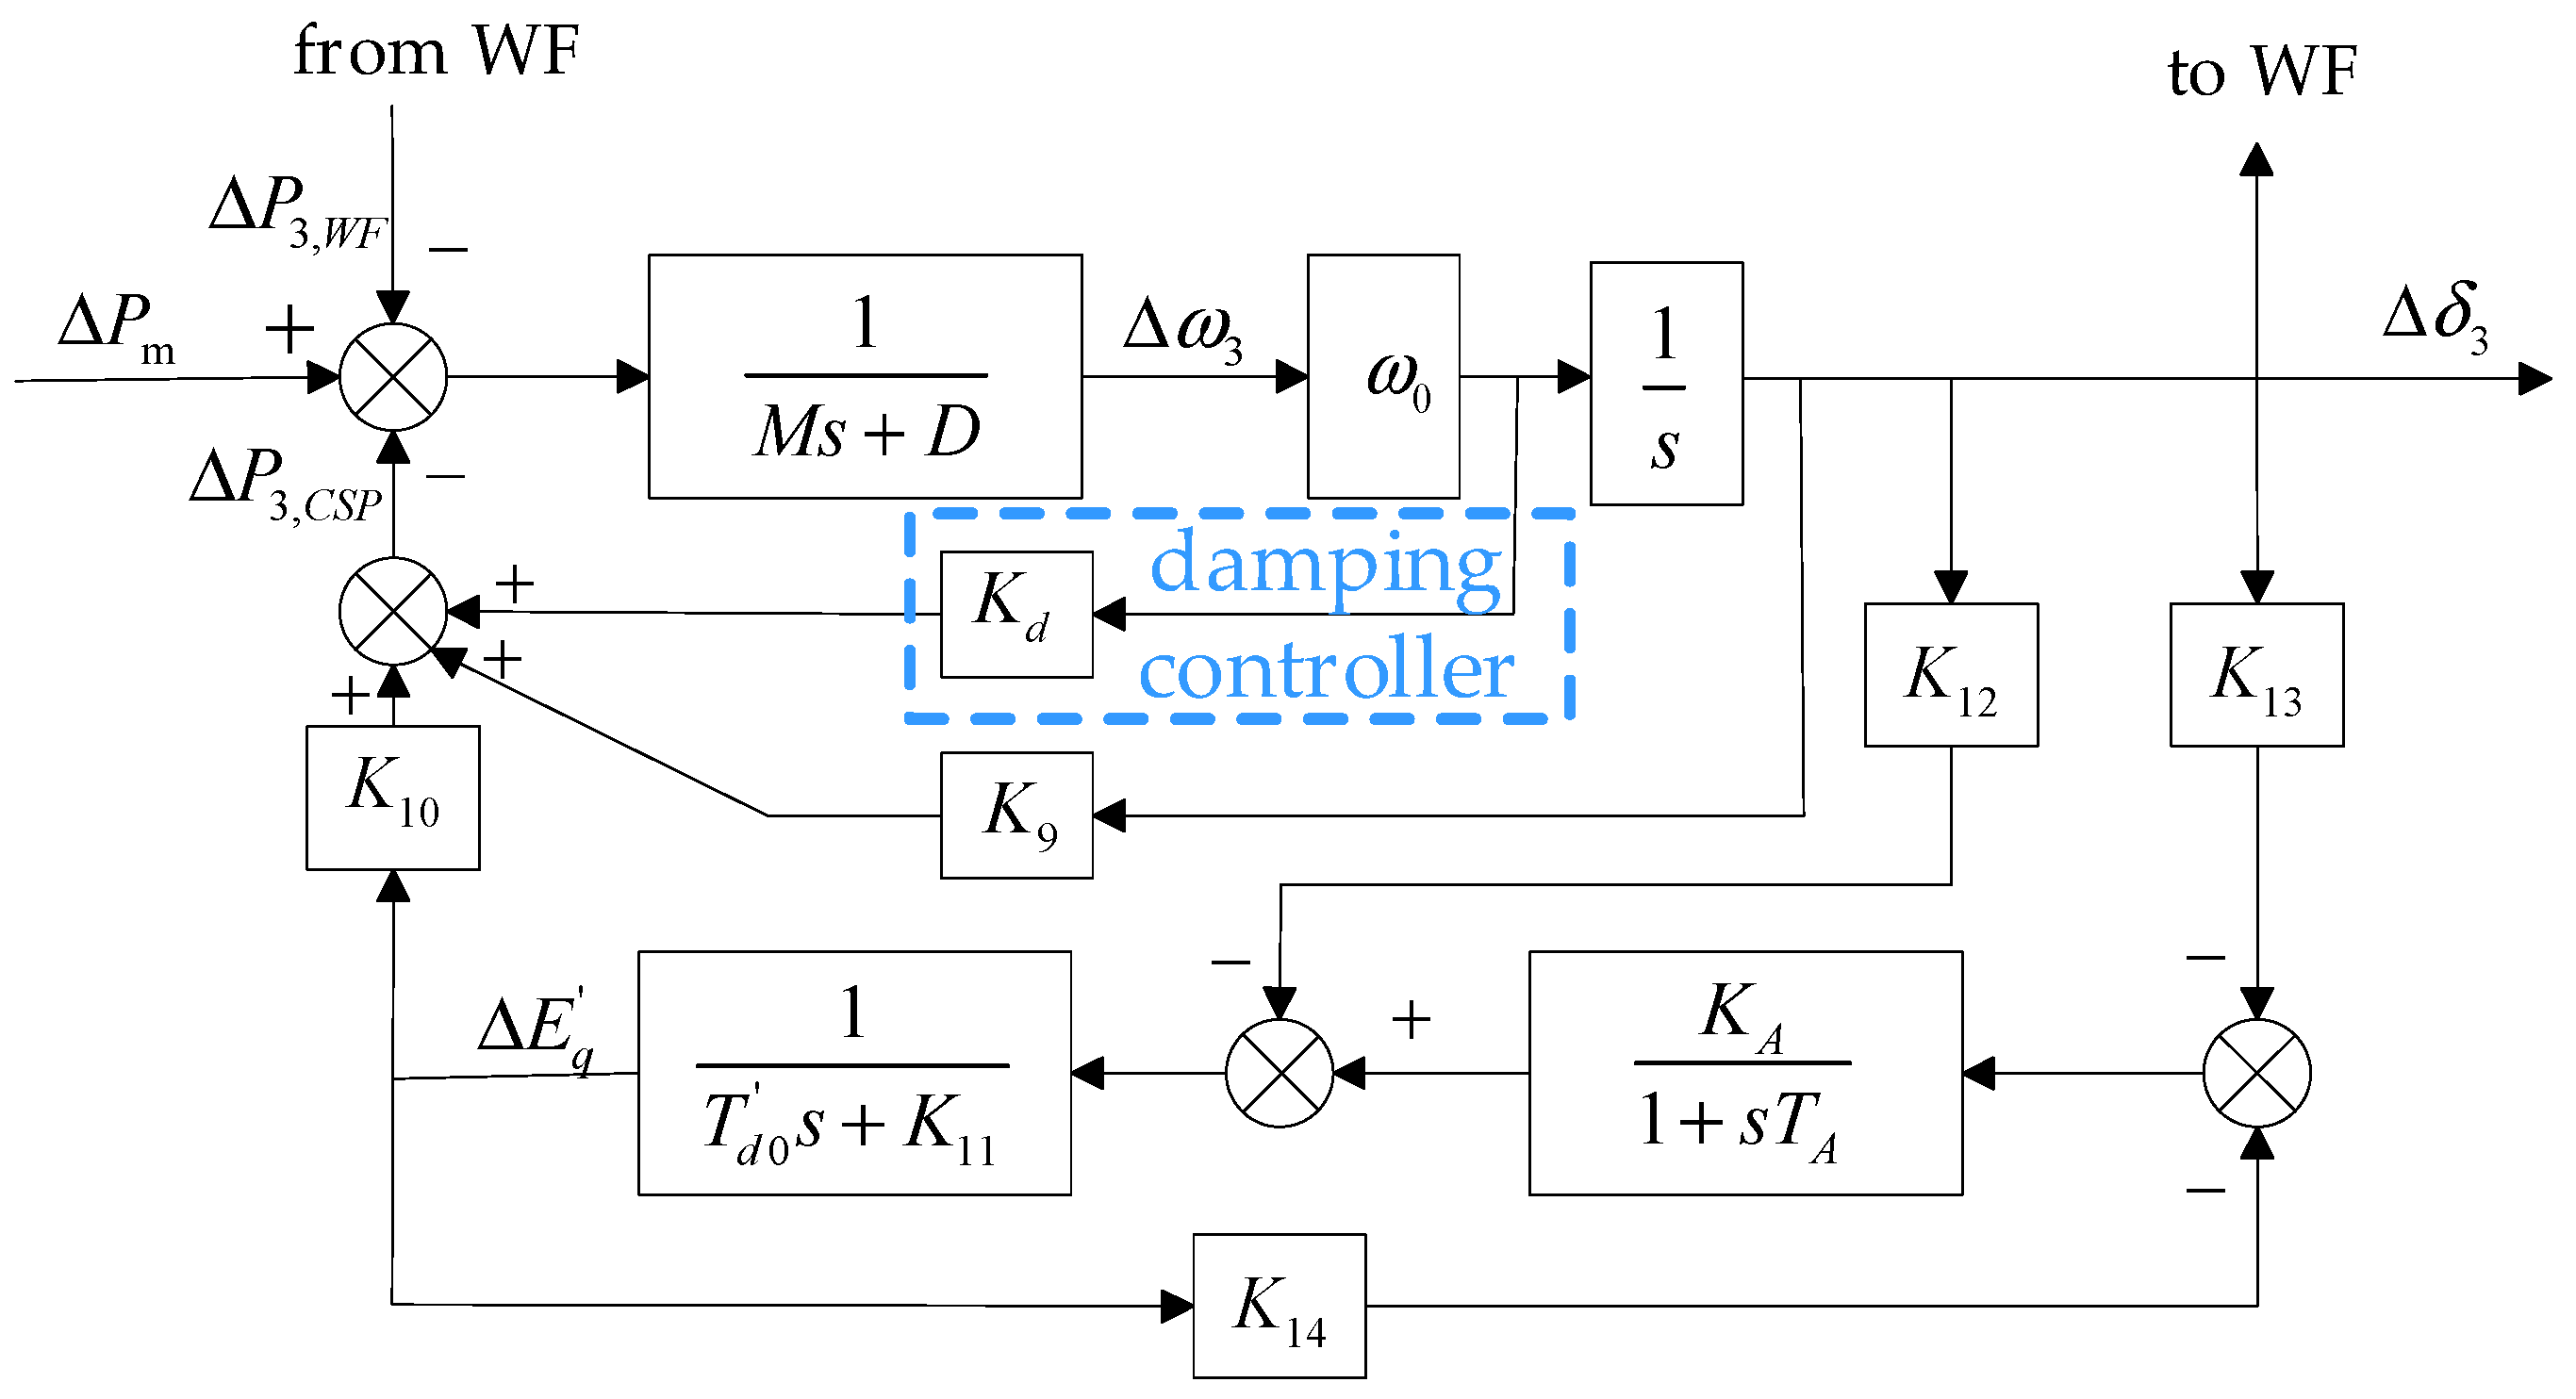
From the above analysis, increasing the damping coefficient D of the CSP plant can mitigate the sub-synchronous oscillation. Therefore, to enhance the stability of the hybrid system, the most effective method is to increase the damping coefficient D of the CSP plant. However, for an already established CSP plant, its damping coefficient D is fixed, so it is necessary to introduce a damping controller to increase the equivalent damping of the CSP. To do so, a damping controller, as shown in Figure 16, is designed. Its input is the rotor speed, i.e., ω3, of the CSP generator, and its output is the additional damping reference power, which is used to guide the prime mover output power in the CSP plant.
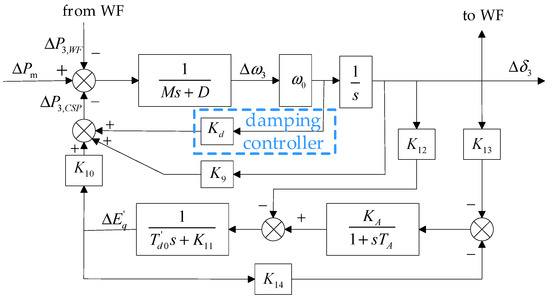
Figure 16.
CSP plant model with damping controller.
From Figure 16, it can be derived that after the introduction of the damping controller, the system’s equivalent damping coefficient De becomes
Here, Kd is the damping controller coefficient.
As can be seen in (23), when the damping controller coefficient Kd is increased, the system’s equivalent damping De also increases. This indicates a better suppression of oscillations, which is beneficial for enhancing the system’s stability.
To verify the above finding, the Bode plot of the CSP–BESS–wind hybrid energy system with the damping controller is plotted in Figure 17. Herein, the orange line represents 1/GCSP, and the blue line denotes GWF. In this figure, we can see that after the damping controller is introduced, the magnitude–frequency curve and phase–frequency curve of 1/GCSP are reshaped. Specifically, at a frequency of 34.2 Hz, the magnitude–frequency curves of 1/GCSP and GWF intersect. Meanwhile, the phase difference between the phase–frequency curves of 1/GCSP and GWF is less than 180 degrees. According to the Nyquist stability criterion, the hybrid system is stable.
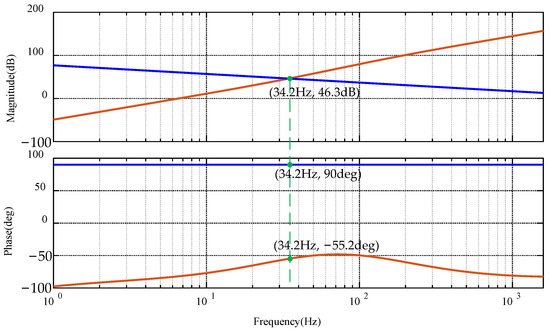
Figure 17.
Bode plot of the hybrid system after adding the damping controller. (The orange line represents 1/GCSP, and the blue line denotes GWF.)
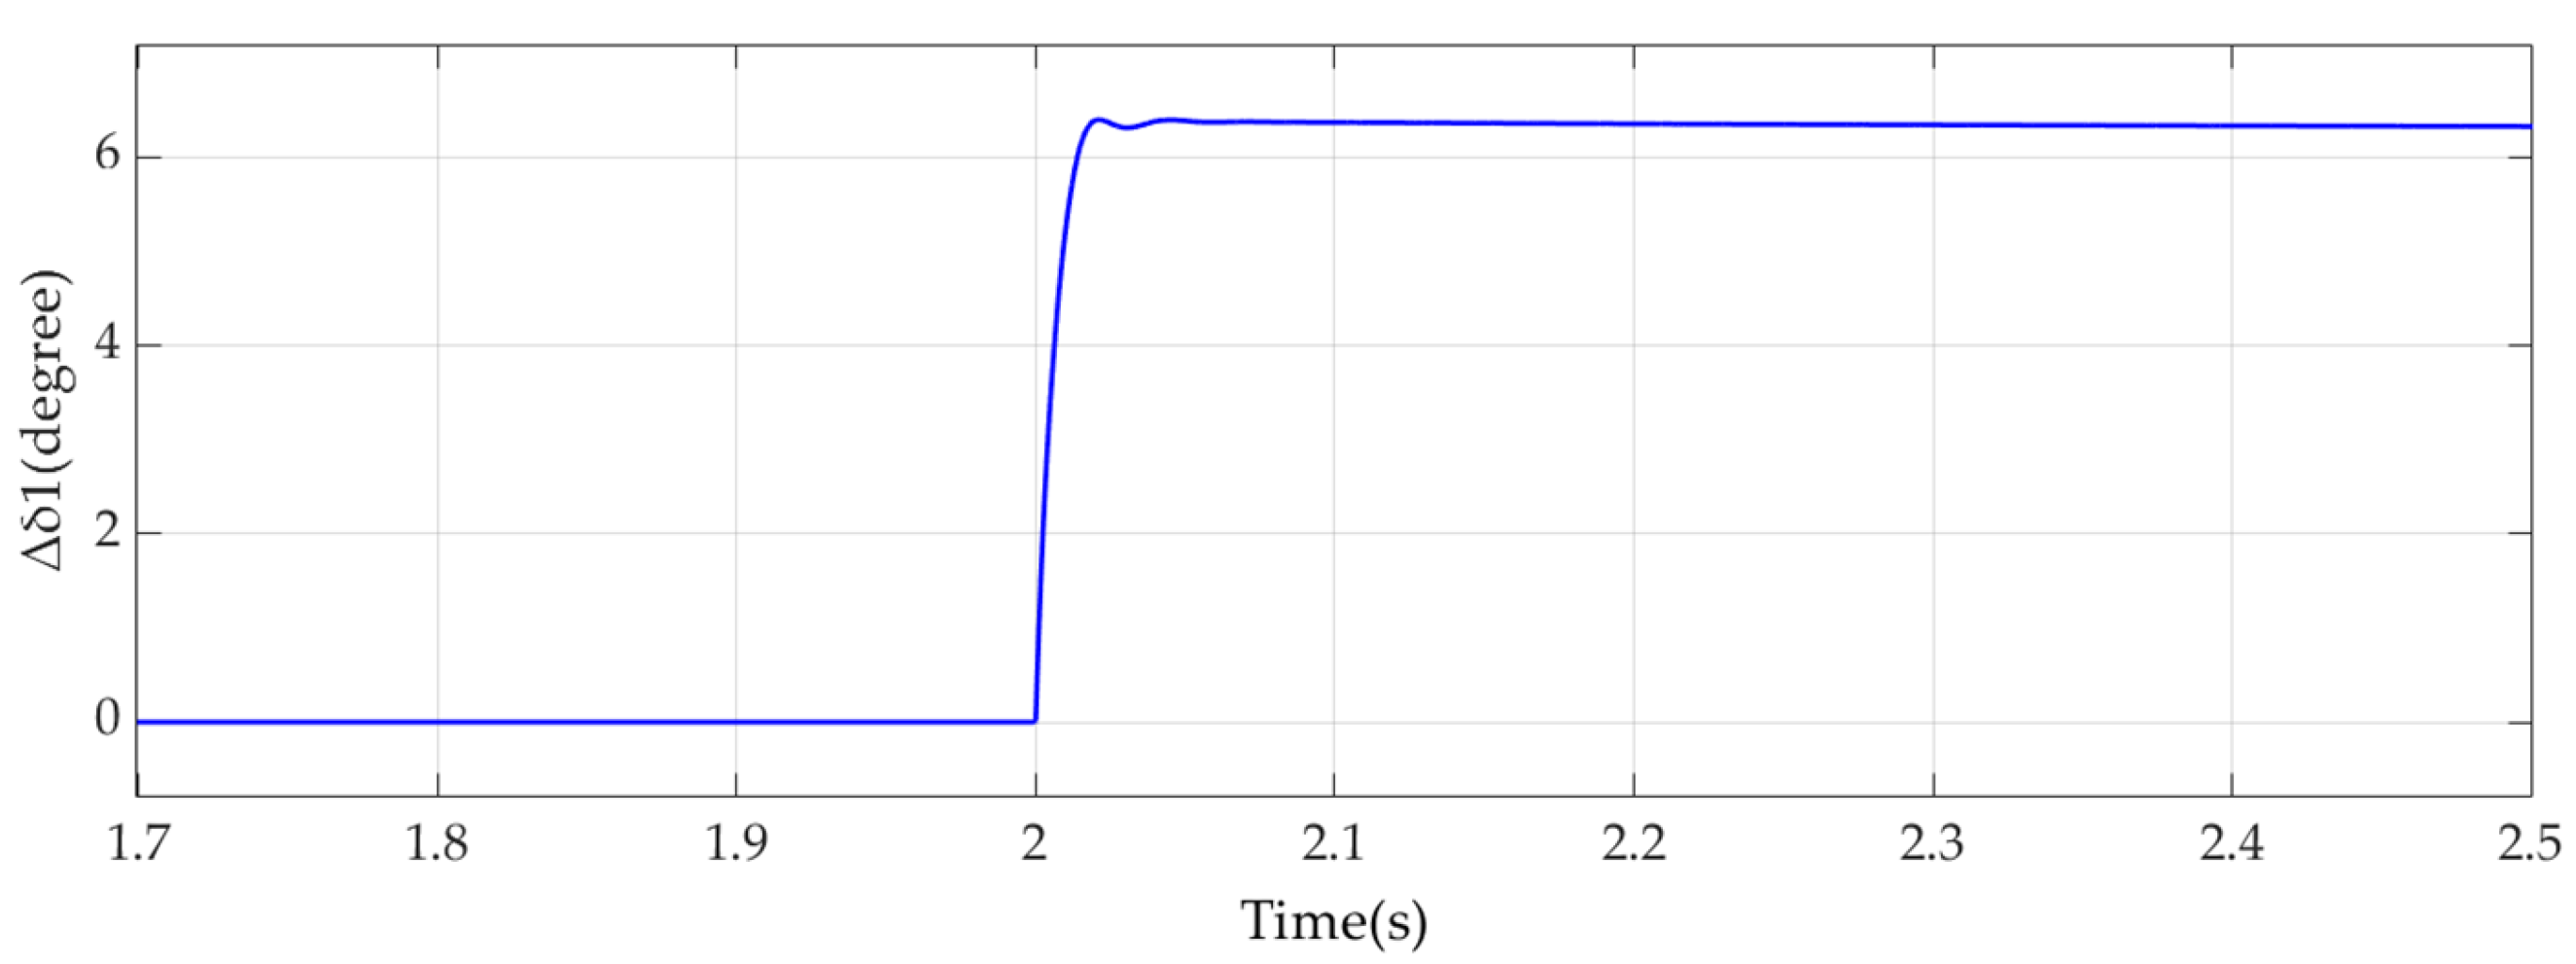
The above results were further validated using time-domain simulations. After adding the damping controller, the output power of the wind farm is still suddenly increased by 1% at 2 s. The phase angle of the wind farm output voltage is shown in Figure 18. It can be observed that the system oscillations disappear, indicating that the additional damping controller successfully suppresses the oscillations.
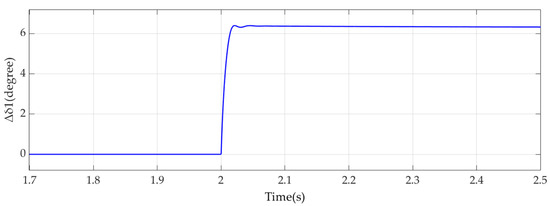
Figure 18.
Phase angle of the wind farm output voltage after adding the damping controller.
5. Conclusions
This paper investigated the stability of a grid-connected CSP–BESS–wind hybrid energy system. To this end, a small-signal model of the hybrid system was first derived. This model considered the dynamics of the CSP plant, BESS, wind farm, and collection grid lines. Based on this model, the system stability was further analyzed using the Nyquist stability criterion, revealing the interaction between the wind farm and CSP plant in the hybrid system, which triggered sub-synchronous oscillation. In addition, the factors influencing the frequency and amplitude of the sub-synchronous oscillation were studied. The results show that the relevant parameters of the CSP plant and wind farm also affected the amplitude and frequency of the sub-synchronous oscillation. Among these, the damping coefficient D of the CSP generator had the most significant impact on the oscillation. Based on this, a corresponding damping controller was designed for the control of the already established CSP. The Nyquist stability analysis and time-domain simulation results show that the introduction of the damping controller significantly improved the system stability.
In this paper, we modeled the external grid as an ideal power source with an impedance. To make the design of the damping controller more reasonable, in our future work, we will incorporate the dynamics of the external grid, thereby enhancing the system model.
Author Contributions
Conceptualization, S.C., G.F. and Z.X.; methodology, S.C., X.W. and G.L.; software, G.F., X.W. and G.L.; validation, S.C., R.S., H.S. and Y.X.; formal analysis, G.F., R.S. and Z.X.; investigation, S.C.; resources, S.C., G.F., X.W., G.L., R.S. and H.S.; data curation, S.C. and Z.X.; writing—original draft preparation, S.C.; writing—review and editing, P.K.; visualization, Y.X.; supervision, G.F.; project administration, S.C.; funding acquisition, S.C. All authors have read and agreed to the published version of the manuscript.
Funding
This research was funded by the Science and Technology Project of the State Grid Qinghai Electric Power Company (project name: Stability Analysis and Damping Control of CSP in Haixi Region; project number: 52280724000Y).
Data Availability Statement
The data that support the findings of this study are available from the corresponding author upon reasonable request due to trade secrets.
Conflicts of Interest
Author Guoqiang Lu was employed by the company State Grid Qinghai Electric Power Company. The remaining authors declare that the research was conducted in the absence of any commercial or financial relationships that could be construed as a potential conflict of interest.
Appendix A
When performing the Y-Δ transformation for the hybrid system, the impedance transformation expression is as shown in Equation (A1).
Appendix B
The parameters K1 and K2 generated during the derivation of the small-signal model for the system coupling relationship are given by the following Equation (A2).
where .
The parameters K3, K4, K5, and K6 generated during the derivation of the small-signal model for the wind turbine generator are given by the following Equation (A3).
The parameters K9, K10, K11, K12, K13, and K14 generated during the derivation of the small-signal model for the solar thermal power generator are given by the following Equation (A4).
References
- Chen, W.; Wang, P.; Li, K.; Zou, R.; Tian, S.; Yu, H. Forced subsynchronous oscillations of turbine-generators excited by interharmonics from bundled offshore wind farms. IEEE Trans. Power Syst. 2024, 39, 5416–5430. [Google Scholar] [CrossRef]
- Chen, B.; Liu, T.; Liu, X.; He, C.; Nan, L.; Wu, L. Distributionally robust coordinated expansion planning for generation, transmission, and demand side resources considering the benefits of concentrating solar power plants. IEEE Trans. Power Syst. 2023, 38, 1205–1218. [Google Scholar] [CrossRef]
- Du, E.; Zhang, N.; Hodge, B.; Wang, Q.; Kang, C.; Kroposki, B. The role of concentrating solar power toward high renewable energy penetrated power systems. IEEE Trans. Power Syst. 2018, 33, 6630–6641. [Google Scholar] [CrossRef]
- Camm, E.H.; Williams, S.E. Solar Power Plant Design and Interconnection. In Proceedings of the 2011 IEEE Power and Energy Society General Meeting, Detroit, MI, USA, 21 April 2011. [Google Scholar]
- Zhang, Z.; Zhao, X. Coordinated power oscillation damping from a VSC-HVDC grid integrated with offshore wind farms: Using capacitors energy. IEEE Trans. Sustain. Energy 2023, 14, 751–762. [Google Scholar] [CrossRef]
- Zhao, C.; Jiang, Q. New perspectives and systematic approaches for analyzing negative damping-induced sustained oscillation. IEEE Trans. Power Electron. 2024, 39, 361–373. [Google Scholar] [CrossRef]
- Zhang, Z.; Zhao, X.; Fu, L.; Edrah, M. Stability and dynamic analysis of the PMSG-based WECS with torsional oscillation and power oscillation damping capabilities. IEEE Trans. Sustain. Energy 2022, 13, 2196–2210. [Google Scholar] [CrossRef]
- Gurung, N.; Bhattarai, R.; Kamalasadan, S. Optimal oscillation damping controller design for large-scale wind integrated power grid. IEEE Trans. Ind. Appl. 2020, 56, 4225–4235. [Google Scholar] [CrossRef]
- Yan, C.; Yao, W.; Wen, J. Impact of active frequency support control of photovoltaic on PLL-based photovoltaic of wind-photovoltaic-thermal coupling system. IEEE Trans. Power Syst. 2023, 38, 4788–4799. [Google Scholar] [CrossRef]
- Sun, L.; Zhao, X. Modelling and analysis of frequency-responsive wind turbine involved in power system ultra-low frequency oscillation. IEEE Trans. Sustain. Energy 2022, 13, 844–855. [Google Scholar] [CrossRef]
- Luo, Q.; Ariyur, K.B.; Mathur, A.K. Control-oriented concentrated solar power plant model. IEEE Trans. Control. Syst. Technol. 2016, 24, 623–635. [Google Scholar] [CrossRef]
- Yao, L.; Wang, Y.; Xiao, X. Concentrated solar power plant modeling for power system studies. IEEE Trans. Power Syst. 2024, 39, 4252–4263. [Google Scholar] [CrossRef]
- Zhai, W.; Jia, Q.; Yan, G. Analysis of sub synchronous oscillation characteristics from a direct drive wind farm based on the complex torque coefficient method. CSEE J. Power Energy Syst. 2024, 11, 1–10. [Google Scholar]
- Yan, G.; Wang, Z.; Zhao, Y.; Wang, Y.; Peng, J.; Wang, D. Analysis and suppression of sub-synchronous oscillation of photovoltaic power generation based on damping torque method. IEEE Trans. Ind. Appl. 2024, 60, 5074–5083. [Google Scholar] [CrossRef]
- Yang, Y.; Li, J.; Li, Y. Torque Analysis of a Power System Integrated with PMSG-based Wind Farm for Low-Frequency Oscillation Mitigation. In Proceedings of the 2022 IEEE International Conference on Power Systems and Electrical Technology (PSET), Aalborg, Denmark, 13–15 October 2022. [Google Scholar]
- Xue, T.; Lyu, J.; Wang, H.; Cai, X. A complete impedance model of a PMSG-based wind energy conversion system and its effect on the stability analysis of MMC-HVDC connected offshore wind farms. IEEE Trans. Energy Convers. 2021, 36, 3449–3461. [Google Scholar] [CrossRef]
- Wang, J.; Wang, P.; Zhao, H.; Yang, F. Comprehensive impedance analysis of DFIG-based wind farms considering dynamic couplings. IEEE Trans. Power Electron. 2025, 40, 2259–2272. [Google Scholar] [CrossRef]
- Li, L.; Wu, H.; Geng, X. Impedance Modeling and Stability Analysis of Wind Farm through HVDC Transmission System Considering Commutation Overlap Characteristic. In Proceedings of the 2024 7th International Conference on Power and Energy Applications (ICPEA), Taiyuan, China, 18–20 October 2024. [Google Scholar]
- Zhan, Y.; Xie, X.; Liu, H.; Liu, H.; Li, Y. Frequency-domain modal analysis of the oscillatory stability of power systems with high-penetration renewables. IEEE Trans. Sustain. Energy 2019, 10, 1534–1543. [Google Scholar] [CrossRef]
- Han, Y.; Sun, H.; Huang, B.; Qin, S. Discrete-time domain modal analysis of oscillatory stability of renewables integrated power systems. IEEE Trans. Power Deliv. 2022, 37, 4248–4260. [Google Scholar] [CrossRef]
- Xu, Y.; Gu, Z.; Sun, K. Characterization of subsynchronous oscillation with wind farms using describing function and generalized Nyquist criterion. IEEE Trans. Power Syst. 2020, 35, 2783–2793. [Google Scholar] [CrossRef]
- Lin, G.; Liu, J.; Wang, P.; Rehtanz, C.; Li, Y.; Wang, S. Low-frequency oscillation analysis of virtual-inertia-controlled DC microgrids based on multi-timescale impedance model. IEEE Trans. Sustain. Energy 2022, 13, 1536–1552. [Google Scholar] [CrossRef]
- Xia, S.; Luo, X.; Chan, K.W.; Zhou, M.; Li, G. Probabilistic transient stability constrained optimal power flow for power systems with multiple correlated uncertain wind generations. IEEE Trans. Sustain. Energy 2016, 7, 1133–1144. [Google Scholar] [CrossRef]
- Bakhshizadeh, M.K.; Ghosh, S.; Kocewiak, Ł.; Yang, G. Improved reduced-order model for PLL instability investigations. IEEE Access 2023, 11, 72400–72408. [Google Scholar] [CrossRef]
- Pang, B.; Nian, H. Collaborative control and allocation method of RSC and GSC for DFIG system to suppress high-frequency resonance and harmonics. IEEE Trans. Ind. Electron. 2020, 67, 10509–10519. [Google Scholar] [CrossRef]
- Kundur, P.S.; Malik, O.P. Power System Stability and Control; McGraw-Hill Education: New York, NY, USA, 2022. [Google Scholar]
- Zhang, Q.; He, J.; Xu, Y.; Hong, Z.; Chen, Y.; Strunz, K. Average-value modeling of direct-driven PMSG-based wind energy conversion systems. IEEE Trans. Energy Convers. 2022, 37, 264–273. [Google Scholar] [CrossRef]
- Nuzzo, S.; Galea, M.; Gerada, C.; Brown, N. Analysis, modeling, and design considerations for the excitation systems of synchronous generators. IEEE Trans. Ind. Electron. 2018, 65, 2996–3007. [Google Scholar] [CrossRef]


Disclaimer/Publisher’s Note: The statements, opinions and data contained in all publications are solely those of the individual author(s) and contributor(s) and not of MDPI and/or the editor(s). MDPI and/or the editor(s) disclaim responsibility for any injury to people or property resulting from any ideas, methods, instructions or products referred to in the content. |
© 2025 by the authors. Licensee MDPI, Basel, Switzerland. This article is an open access article distributed under the terms and conditions of the Creative Commons Attribution (CC BY) license (https://creativecommons.org/licenses/by/4.0/).