

Carbon Footprint of Power Transformers Evaluated Through Life Cycle Analysis

Abstract
1. Introduction
2. Materials and Methods
2.1. Life Cycle Assessment Analysis
2.1.1. Scope, Functional Unit, System Boundary
2.1.2. Life Cycle Inventory Analysis of Power Transformers
2.1.3. Life Cycle Impact Assessment Method

| Materials | EFCO2-eq [t CO2-eq/t] | References | Selected EFCO2-eq Value [t CO2-eq/t] |
|---|---|---|---|
| Steel | 0.970 ÷ 6.200 | [6,21,22,23,24,25,26,27] | 2.500 |
| Electrical steel | 2.000 ÷ 6.580 | [6,21,22,23,24,25,26] | 3.000 |
| Copper | 1.100 ÷ 8.000 | [6,21,23,24,25,26,27] | 4.738 |
| Cellulose insulation | 0.817 ÷ 1.760 | [23,24] | 0.817 (paper), 1.183 (pressboard) |
| Mineral oil | 1.120 ÷ 3.000 | [6,21,24,26] | 1.210 |
3. Results and Discussion
4. Conclusions
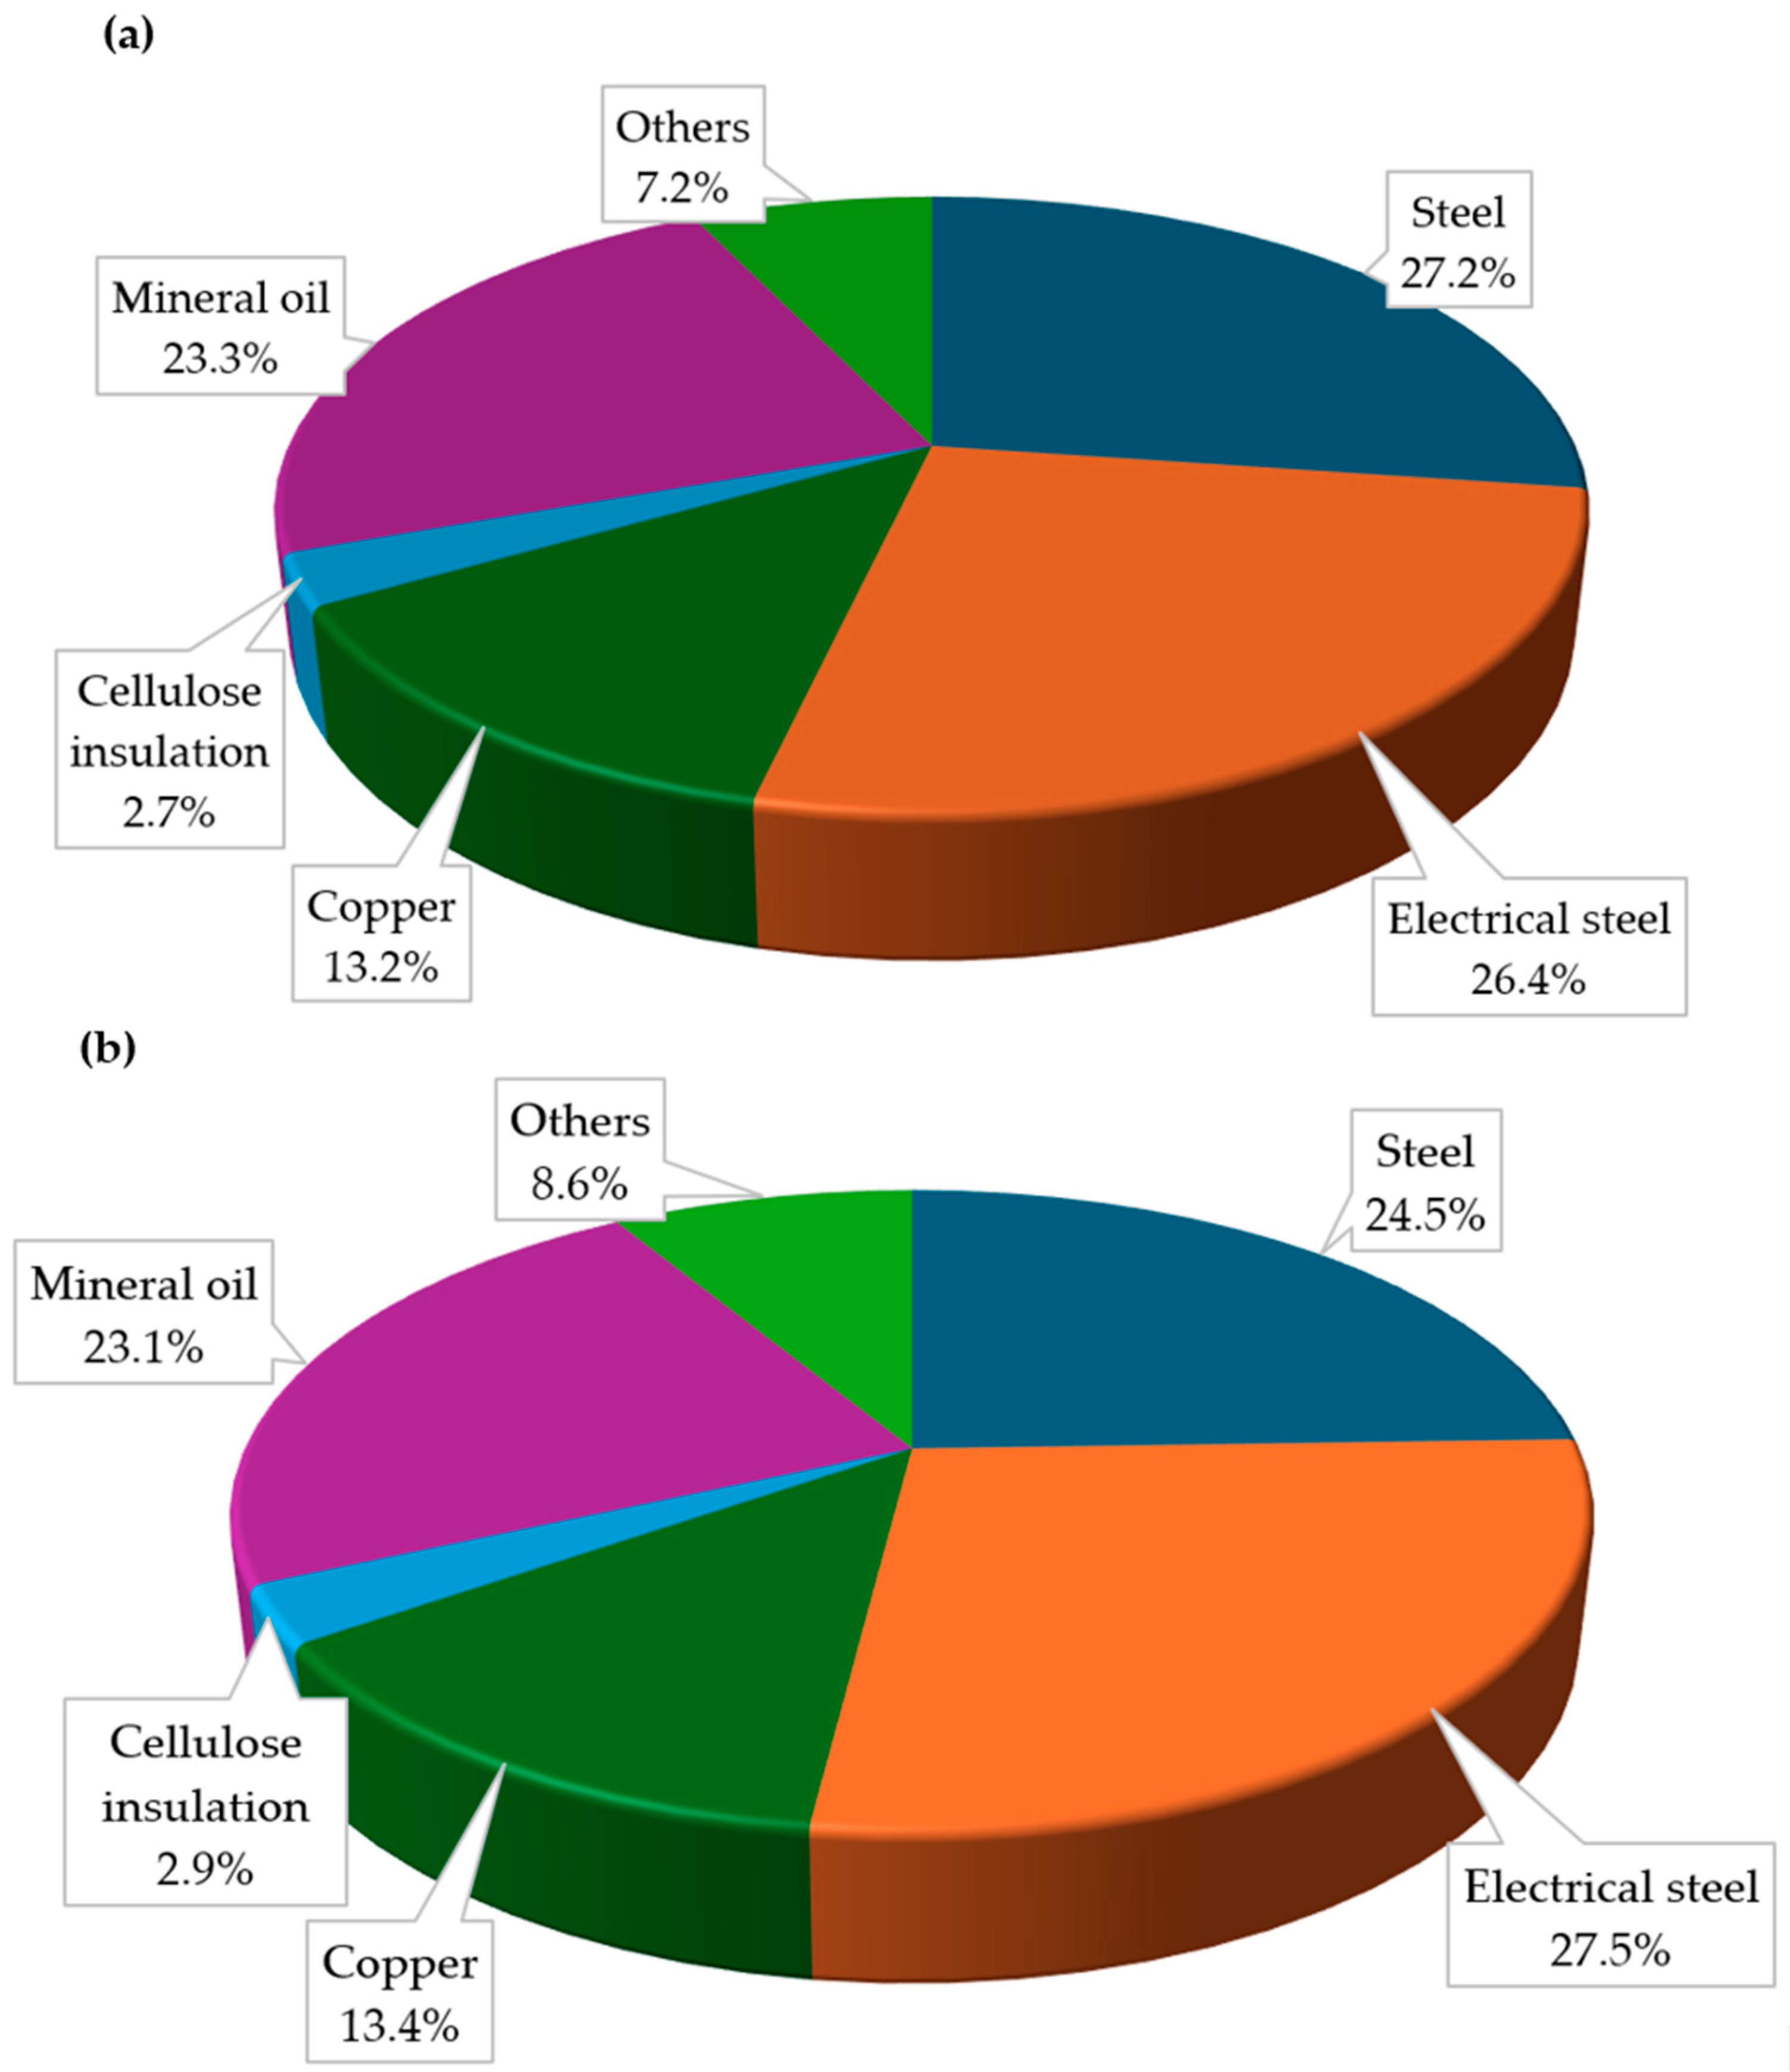
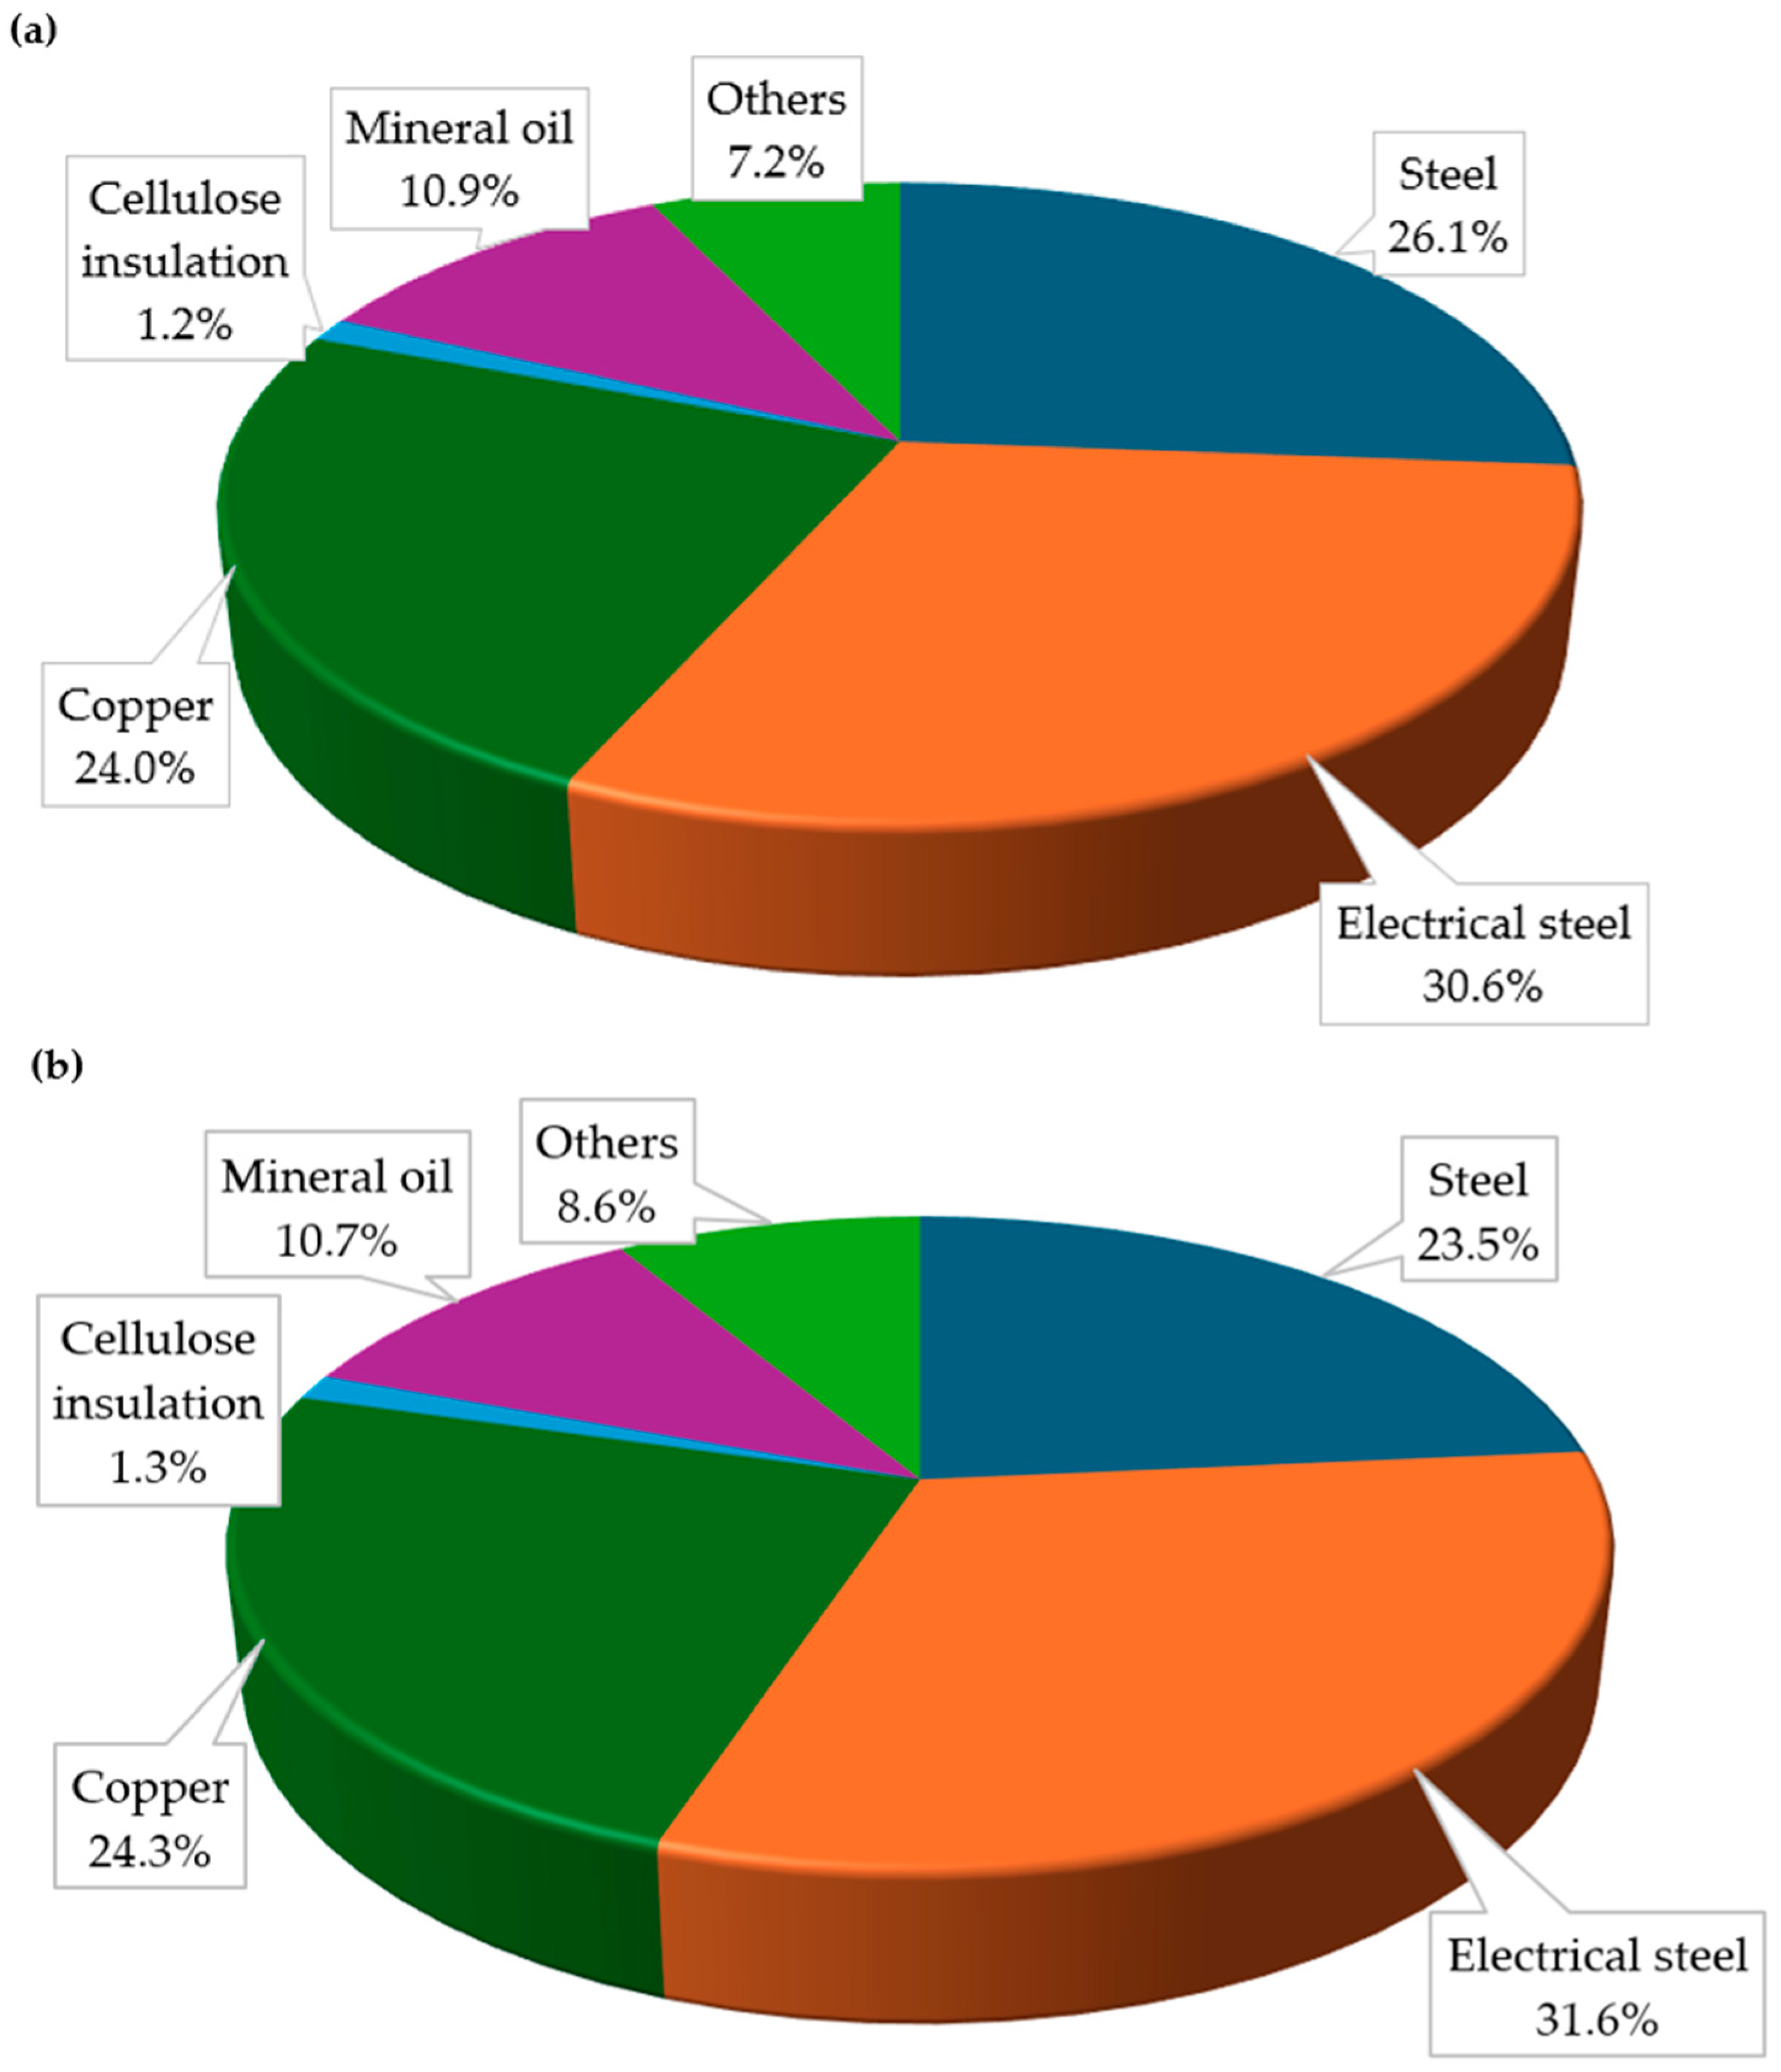
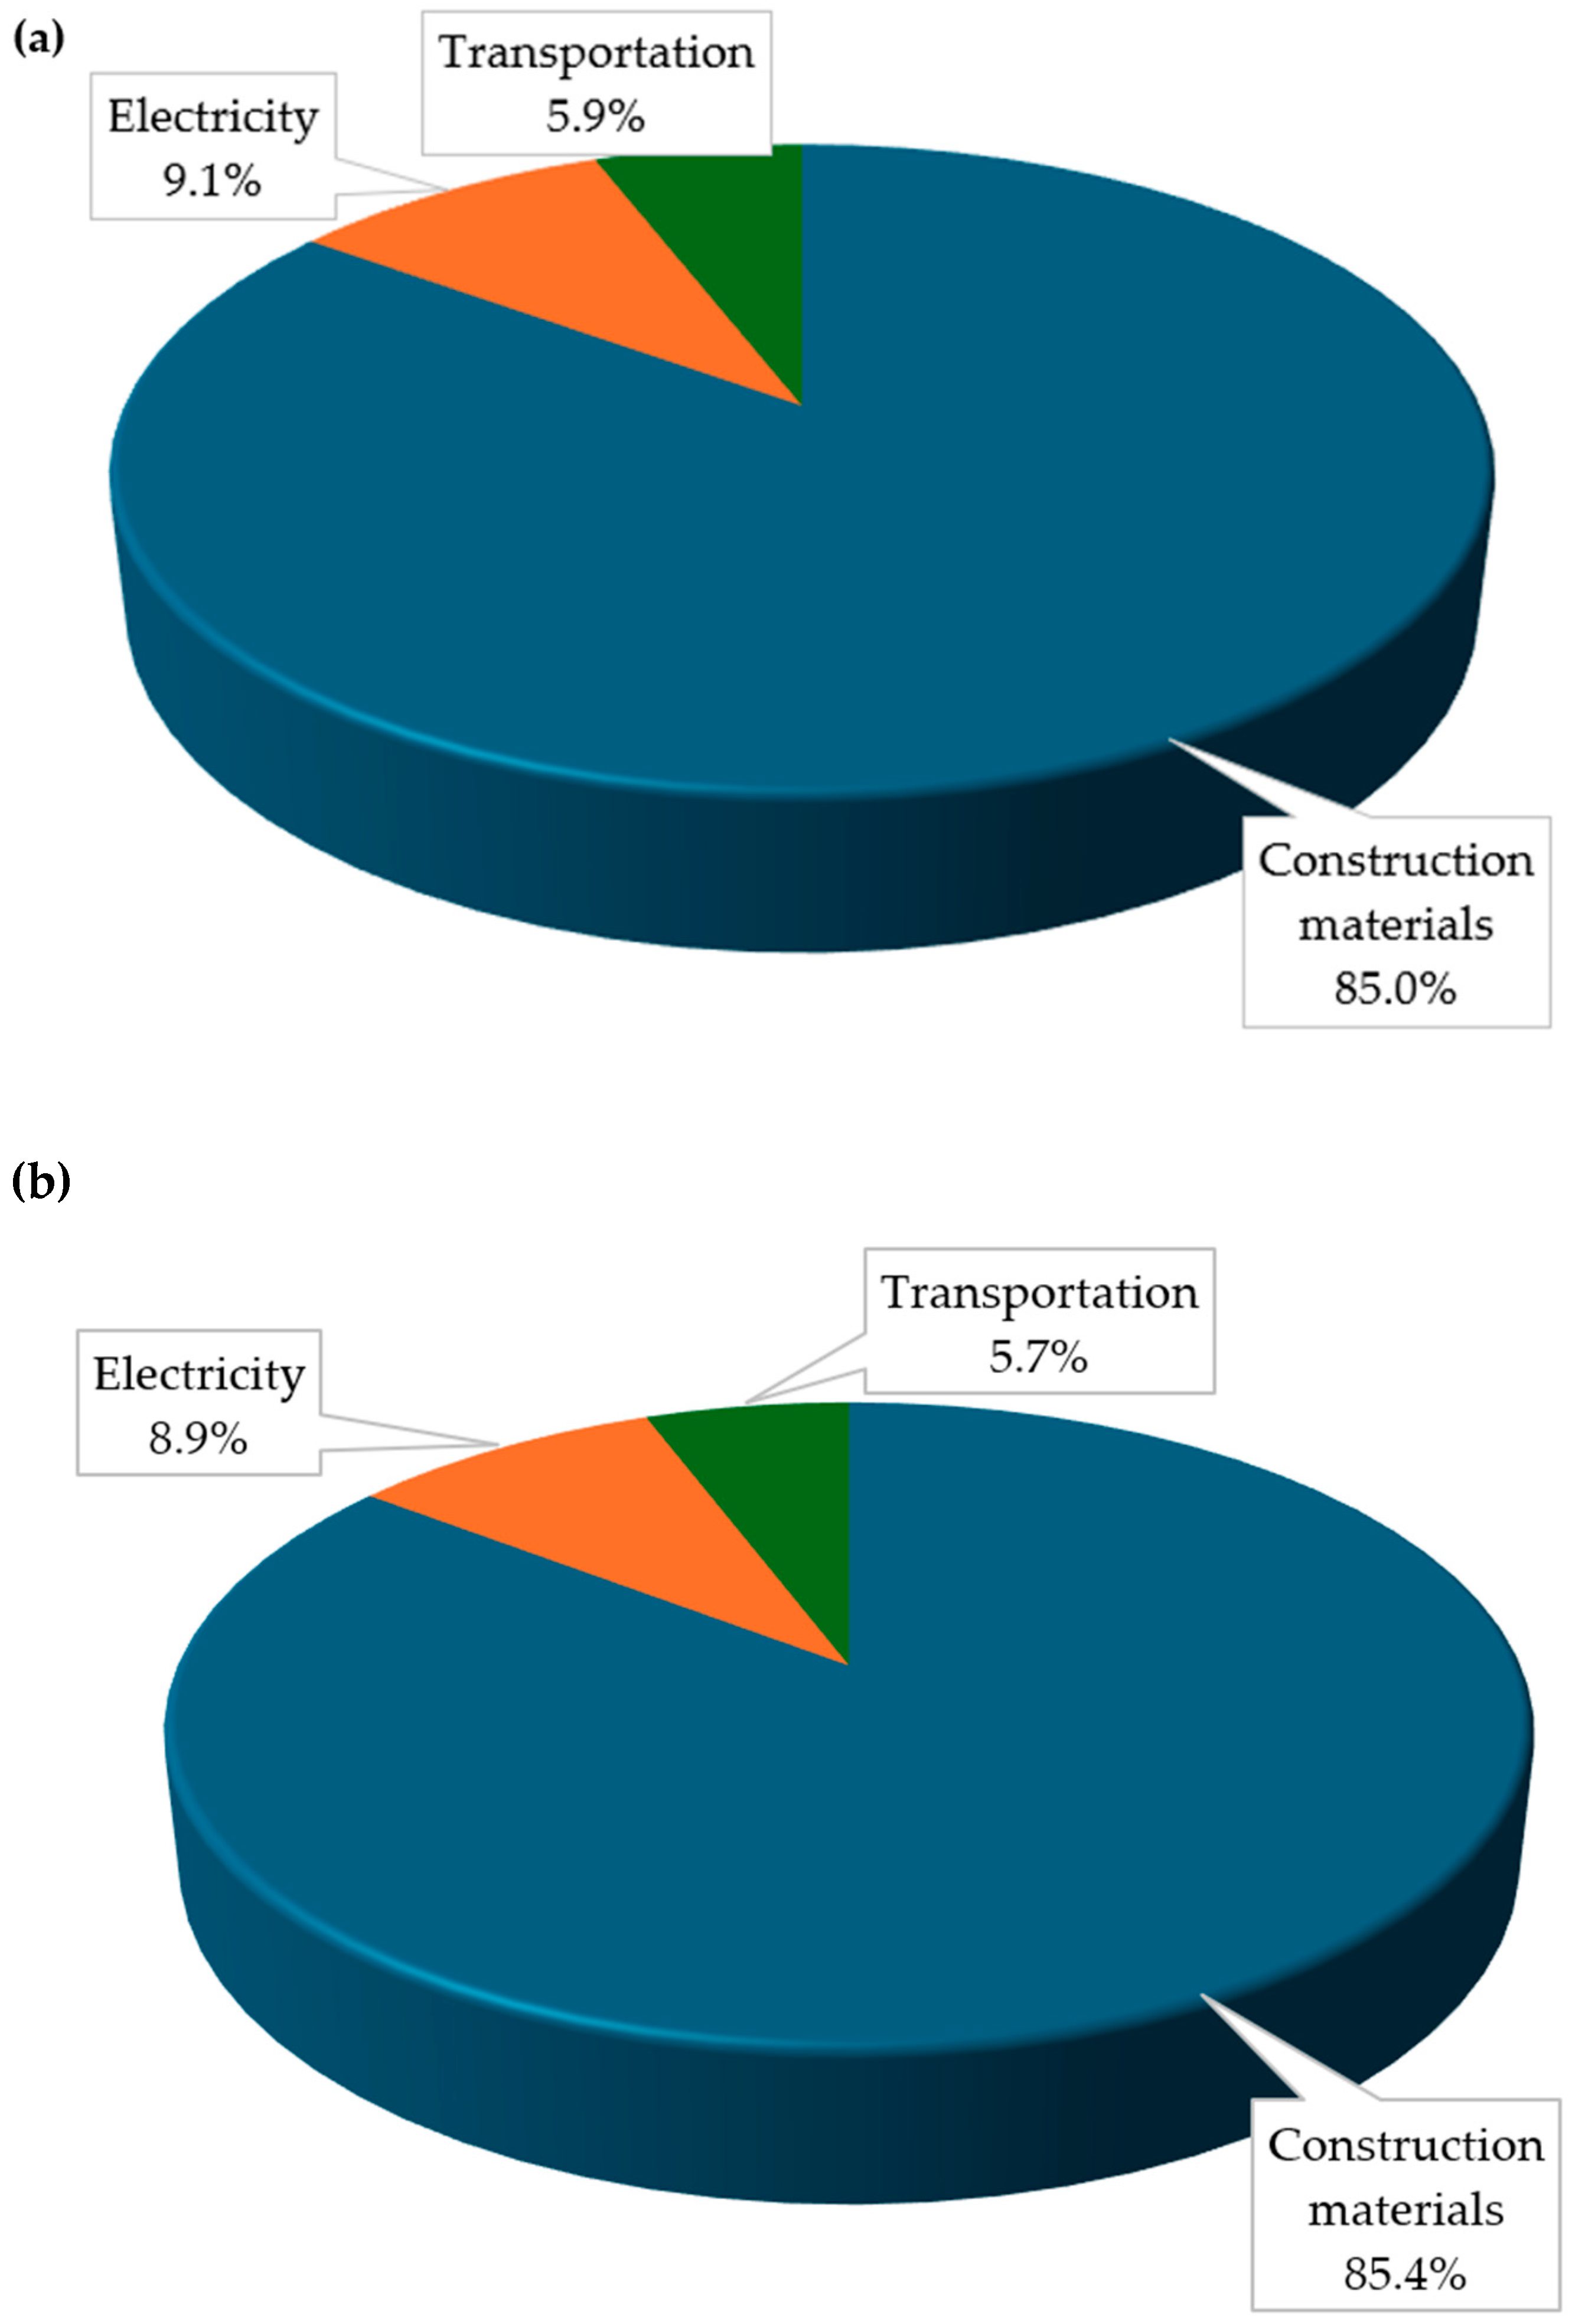
- The highest contribution to CO2-eq emissions at the raw material extraction and manufacturing stages—80.8% for TRF-1 and 79.5% for TRF-2—originates from metal production, particularly electrical steel, structural steel, and copper. This highlights the need for targeted metal management strategies and effective recycling methods. However, the widespread adoption of metal recycling in transformers faces significant technological and economic barriers, including low technological readiness of existing recycling methods, high operational costs, and degraded quality of recovered metals.
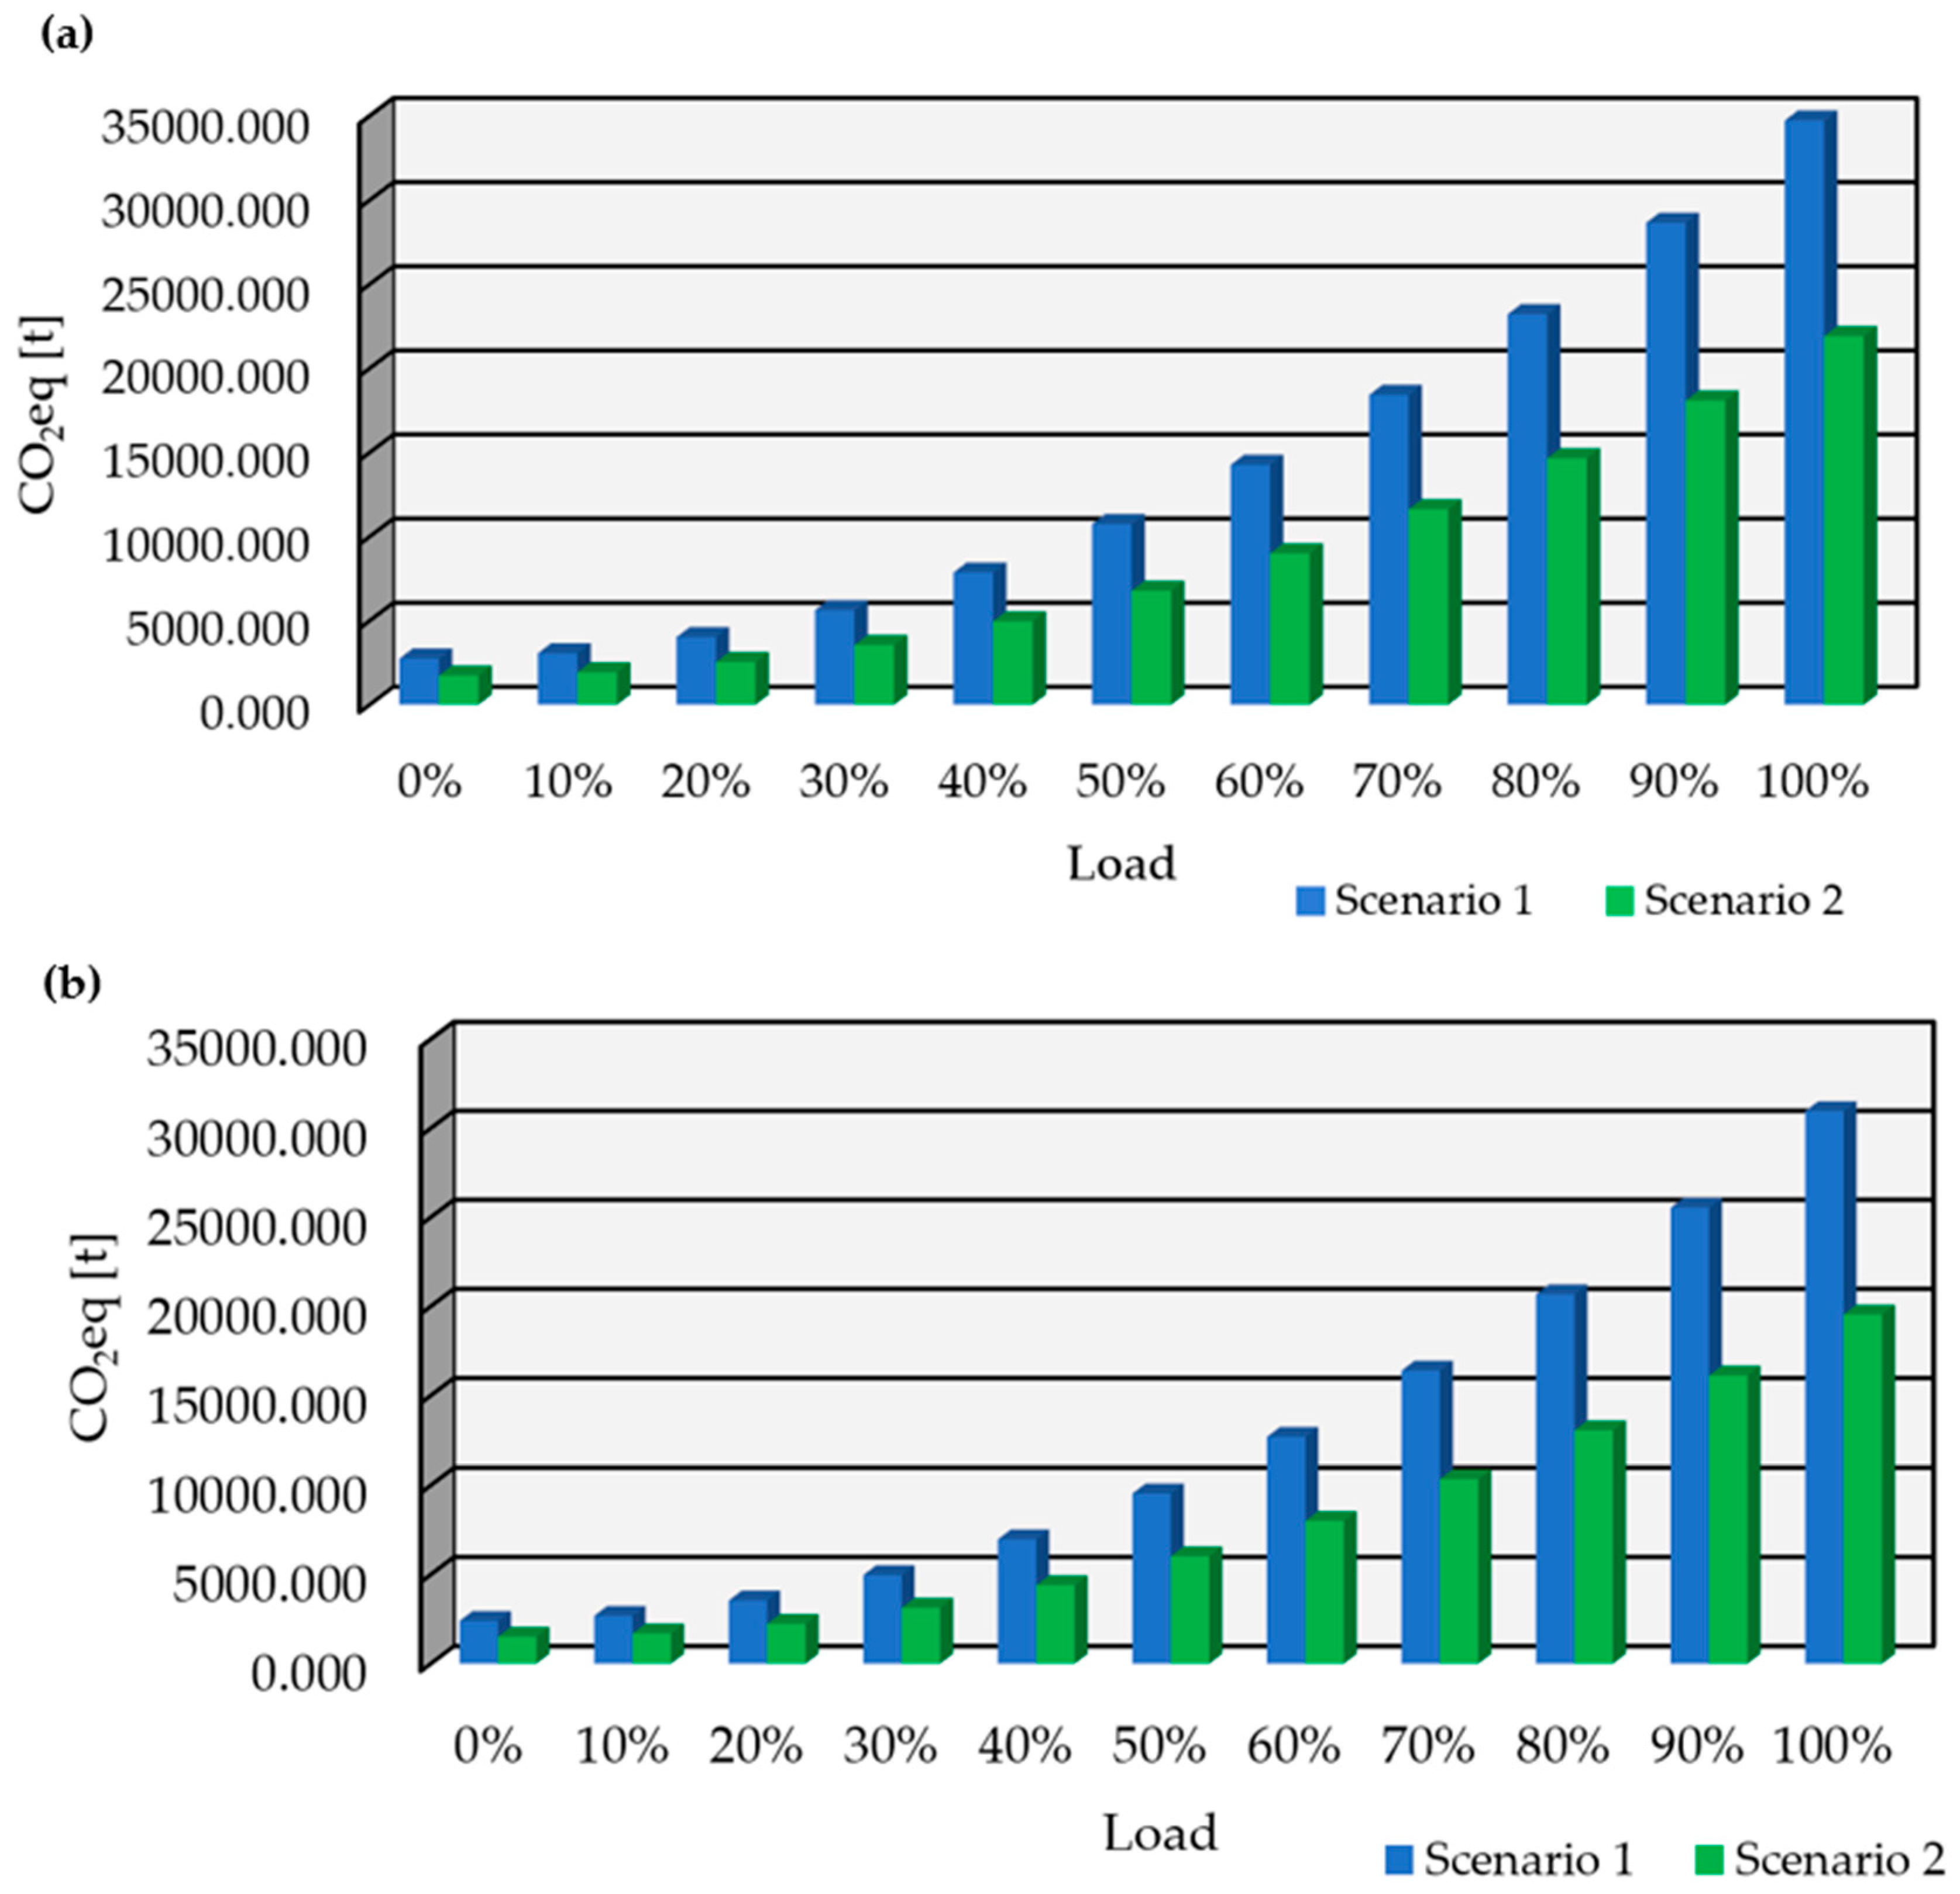
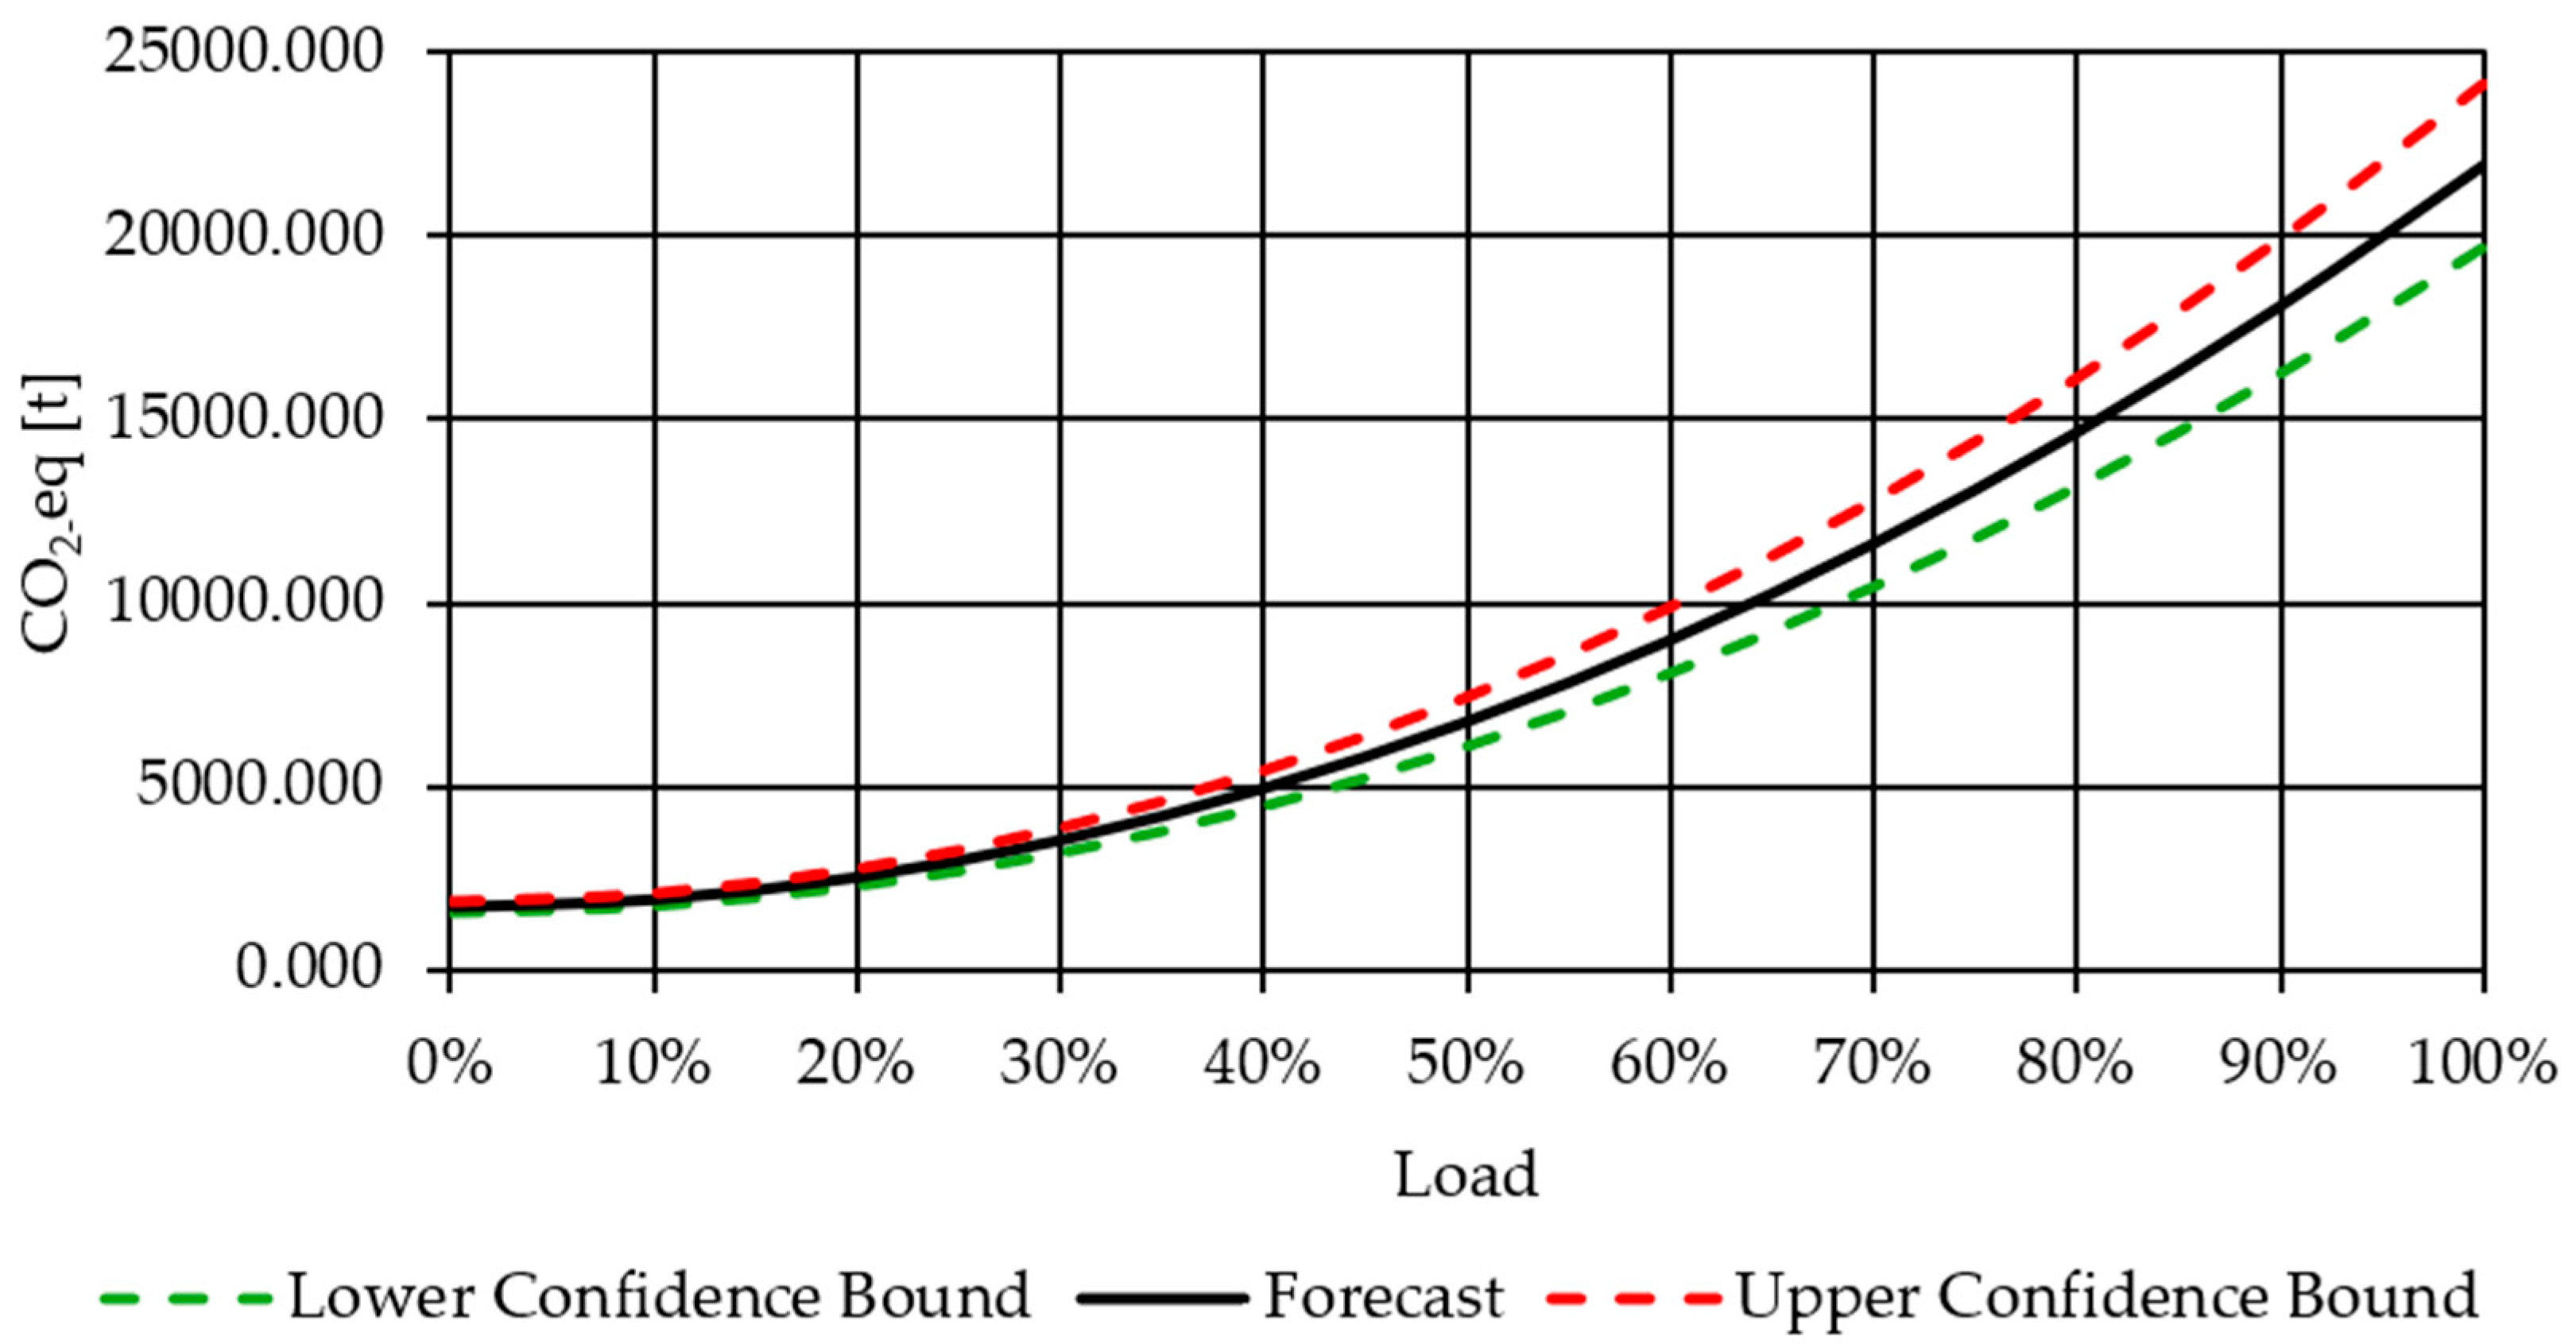
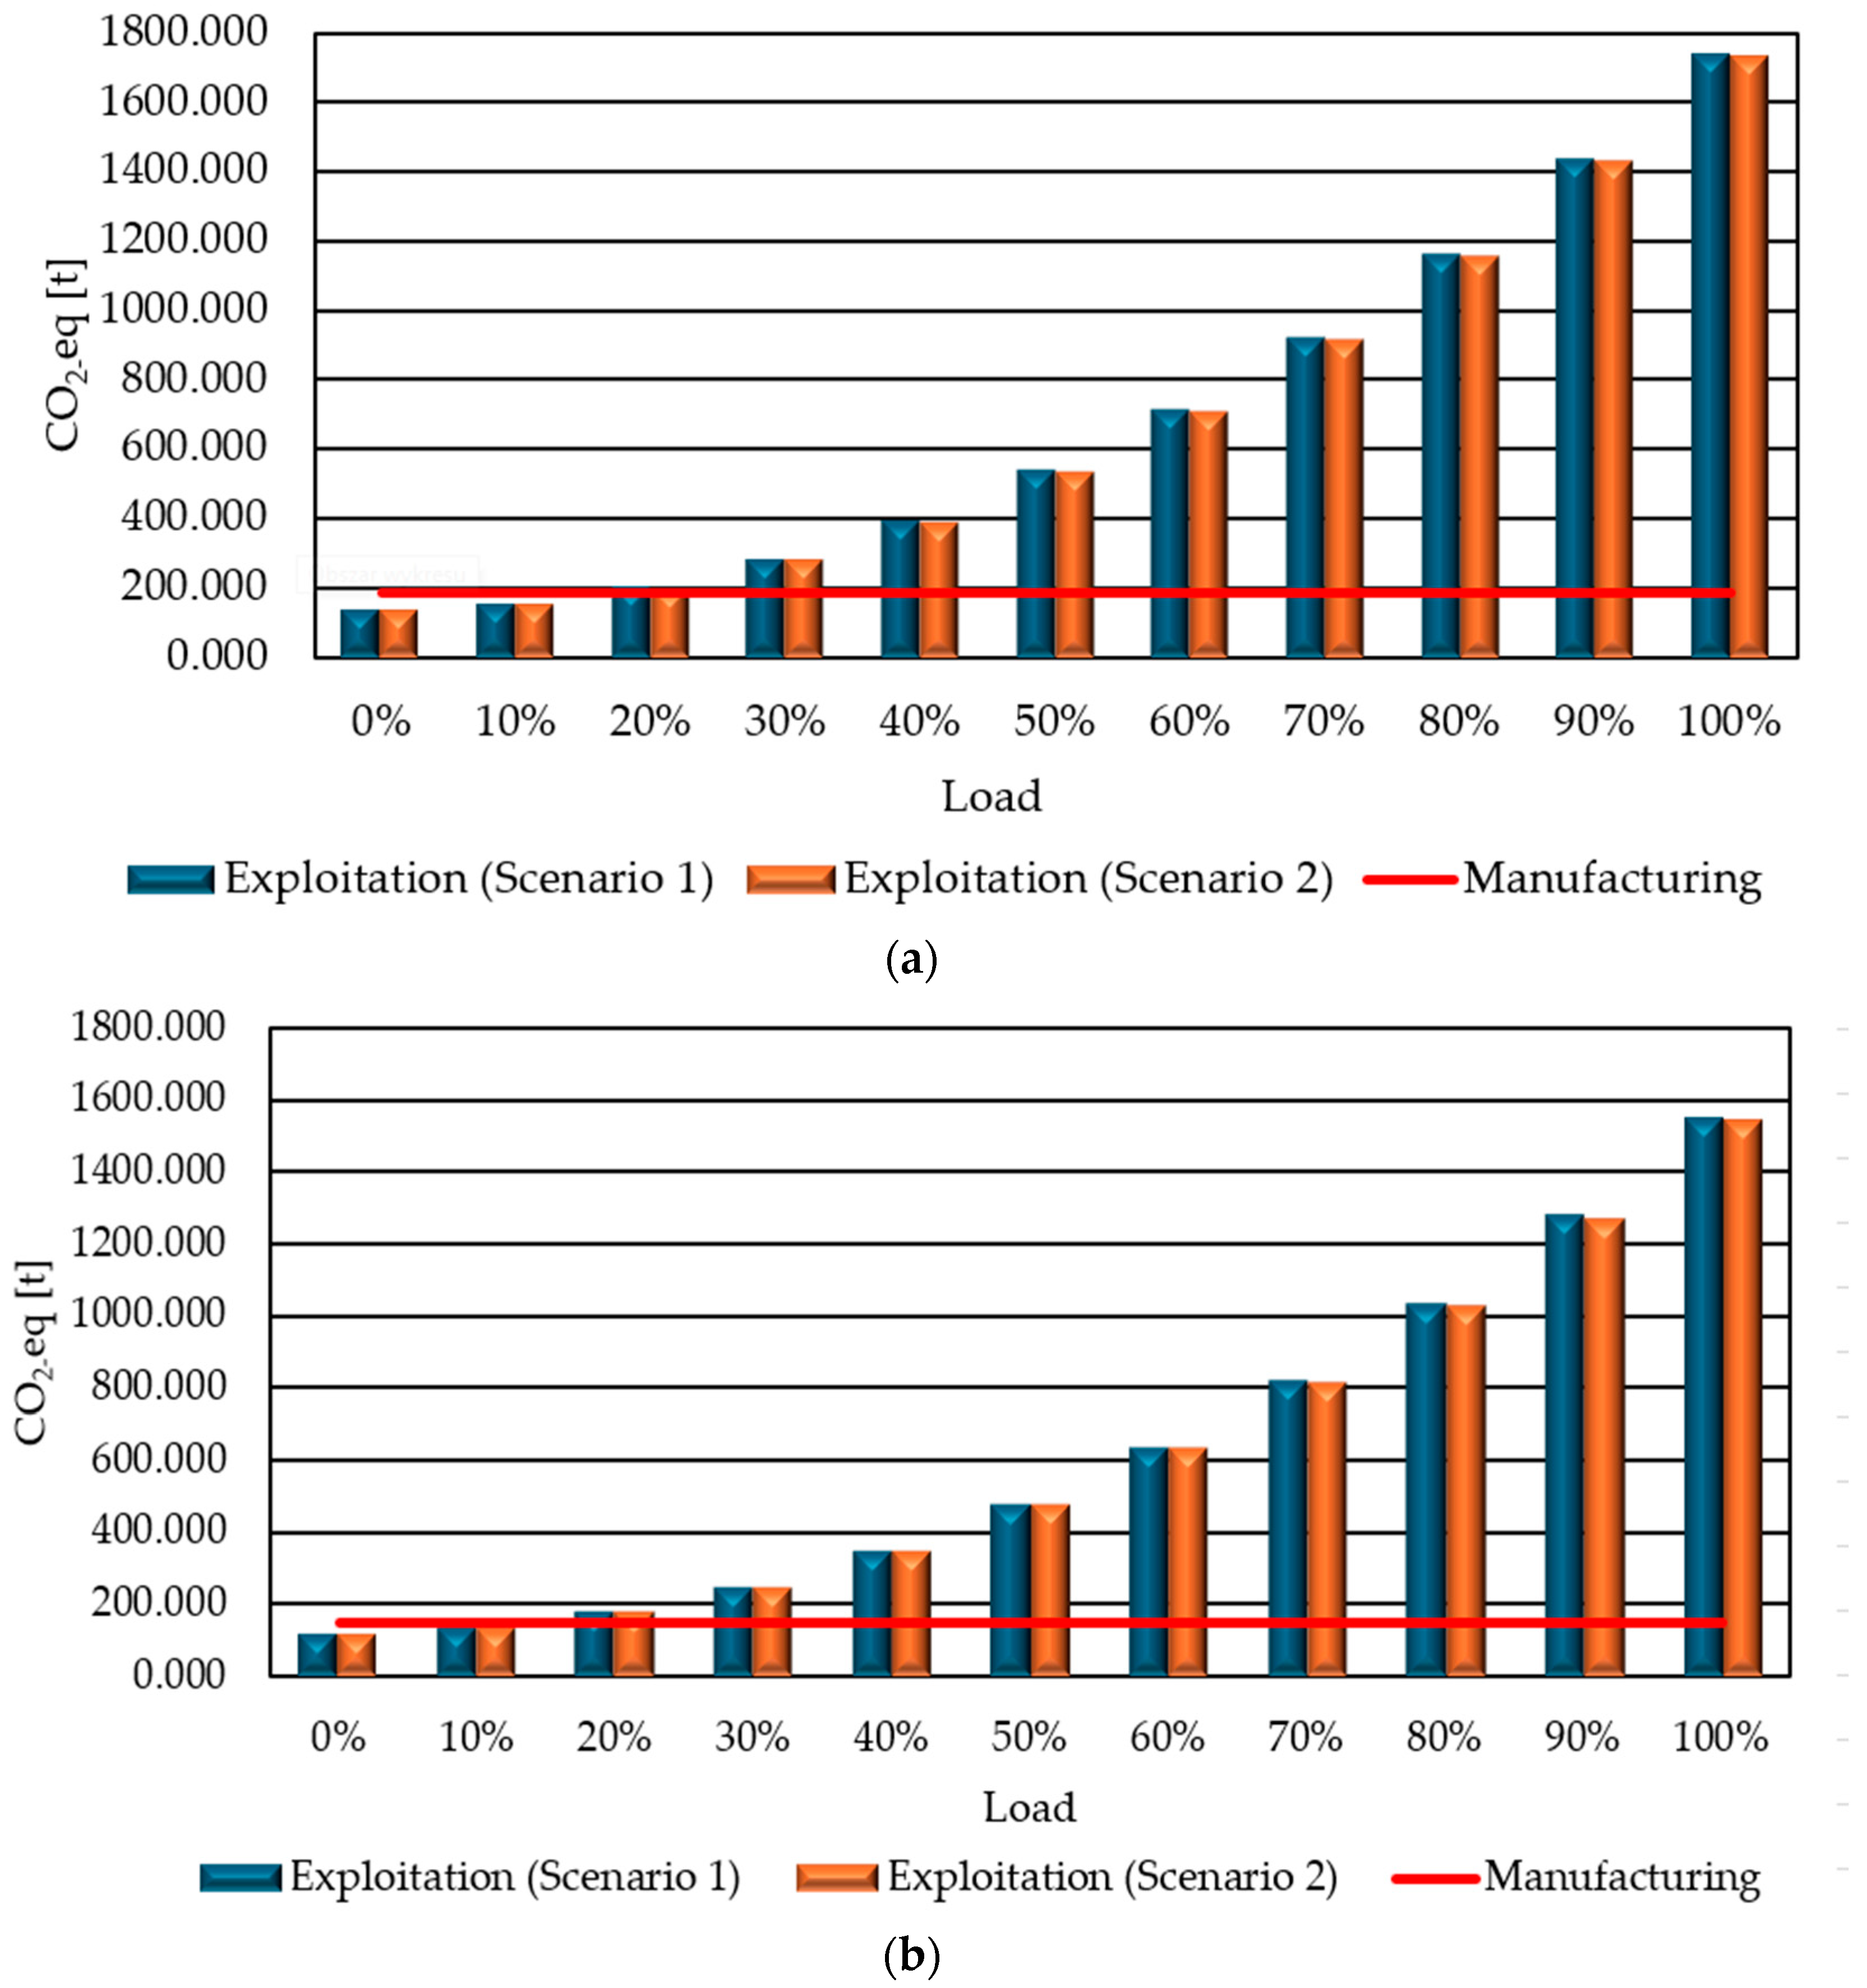
- Power losses during the operational phase account for 94% to 99% of the total environmental impact, depending on the load level. Within just the first few years of operation, even at low loads, CO2-eq emissions associated with energy losses exceed those generated during the entire production process.
- High-quality construction materials and modern design solutions should be applied to minimize no-load and load losses. Recommended materials: for the core, materials with a narrow hysteresis loop (e.g., silicon steel or amorphous steel); for the windings, high-purity copper with low resistivity. Design improvements include the use of a laminated core composed of thin, insulated sheets; magnetic shielding; and toroidal or circular core shapes.
- Electricity generation must be restructured, especially in coal-dependent regions, where the majority of energy is still generated from hard coal and brown coal combustion. Transitioning to cleaner energy sources requires targeted political initiatives, strategic policy decisions, regulatory frameworks, and incentive mechanisms to drive transformation.
Author Contributions
Funding
Data Availability Statement
Conflicts of Interest
Abbreviations
| CO2 | Carbon dioxide |
| CO2-eq | Carbon dioxide equivalent |
| CAGR | Compound annual growth rate |
| ECF | Electricity consumption factor |
| GHG | Greenhouse emission |
| kV | Kilovolt |
| kVA | Kilovolt amperes |
| kW | Kilowatt |
| kWh | Kilowatt hours |
| LCA | Life Cycle Assessment |
| LCI | Life Cycle Inventory |
| LCIA | Life Cycle Impact Assessment |
| MVA | Megavolt amperes |
| ON-AN | Oil natural—air natural |
| tkm | Ton-kilometer |
References
- United Nations Framework Convention on Climate Change (UNFCCC). Paris Agreement. Available online: https://unfccc.int/process-and-meetings/the-paris-agreement/what-is-the-paris-agreement (accessed on 29 January 2025).
- Foster, V.; Bedrosyan, D. Understanding CO2 Emissions from the Global Energy Sector; Live Wire Knowledge Note Series no. 2014/5. World Bank Group: Washington, WA, USA. Available online: https://documents1.worldbank.org/curated/en/873091468155720710/pdf/851260BRI0Live00Box382147B00PUBLIC0.pdf (accessed on 20 January 2025).
- León-Martínez, V.; Andrada-Monrós, C.; Molina-Cañamero, L.; Cano-Martínez, J.; Peñalvo-López, E. Decarbonization of Distribution Transformers Based on Current Reduction: Economic and Environmental Impacts. Energies 2021, 14, 7207. [Google Scholar] [CrossRef]
- Grand View Research. Power Transformer Market Size, Share & Trends Analysis Report By Core (Closed, Shell, Berry), By Insulation, By Phase, By Rating, By Application, By Region, And Segment Forecasts, 2023–2030. Available online: https://www.grandviewresearch.com/horizon/outlook/power-transformer-market-size/global (accessed on 20 January 2025).
- Polish Society for Transmission and Distribution of Electricity. Numerical Data on the Electricity Transmission and Distribution Subsector in 2023. Available online: http://www.ptpiree.pl/energetyka-w-polsce/energetyka-w-liczbach/dane-liczbowe (accessed on 20 January 2025).
- Krishnan, R.; Nair, K.R.M. Carbon Footprint of Transformer and the Potential for Reduction of CO₂ Emissions. In Proceedings of the International Conference on Technology, Informatics, Management, Engineering & Environment (TIME-E), Bali, Indonesia, 13–15 November 2019. [Google Scholar]
- Das, B.P.; Patel, S. Ester-Filled Distribution Transformers: The Sustainable Model to Strengthen the Low Voltage Grid. Transform. Mag. 2022, 9, 70–82. [Google Scholar]
- Cai, S.; Ying, S.; Wang, X.; Wei, Z.; Niu, Y.; Zhang, Q.; Gong, Y. Calculation and Analysis of Life Cycle Carbon Emissions of Distribution Transformers. In Proceedings of the IEEE International Conference on High Voltage Engineering and Applications (ICHVE), Chongqing, China, 25–29 September 2022. [Google Scholar] [CrossRef]
- Jorge, R.S.; Hawkins, T.R.; Hertwich, E.G. Life Cycle Assessment of Electricity Transmission and Distribution—Part 2: Transformers and Substation Equipment. Int. J. Life Cycle Assess. 2012, 17, 184–191. [Google Scholar] [CrossRef]
- Šerkinić, V.; Majić Renjo, M.; Ucović, V. CO₂ Footprint for Distribution Oil Immersed Transformers According to ISO 14067:2018. J. Energy 2020, 69, 3–9. [Google Scholar] [CrossRef]
- Güldürek, M.; Esenboğa, B. Assessment of Corporate Carbon Footprint and Energy Analysis of Transformer Industry. Sustainability 2024, 16, 5800. [Google Scholar] [CrossRef]
- Wang, Y.; Zhang, H.; Zhou, E.; Xie, L.; Li, J. Carbon Footprint Analysis of Distribution Network Transformers Based on Life Cycle Assessment. Energies 2025, 18, 600. [Google Scholar] [CrossRef]
- Available online: https://www.nowtricity.com/country/poland (accessed on 20 January 2025).
- Wiedmann, T.; Minx, J. A definition of "carbon footprint". In Ecological Economics Research Trends; Pertsova, C.C., Ed.; Nova Science Publishers: Hauppauge, NY, USA, 2008; pp. 1–11. [Google Scholar]
- Dowbysz, A.; Kukfisz, B.; Samsonowicz, M.; Markowska, D.; Jankowski, P. Life Cycle Assessment of Glass/Polyester Laminates Used in the Shipbuilding Industry and Its Fire Behavior. Econ. Environ. 2023, 85, 236–254. [Google Scholar] [CrossRef]
- Maranda, A.; Wachowski, L.; Kukfisz, B.; Markowska, D.; Paszula, J. Valorization of Energetic Materials from Obsolete Military Ammunition Through Life Cycle Assessment (LCA): A Circular Economy Approach to Environmental Impact Reduction. Sustainability 2025, 17, 346. [Google Scholar] [CrossRef]
- ISO 14040:2006; Environmental Management—Life Cycle Assessment—Principles and Framework. ISO: Geneva, Switzerland, 2006.
- ISO 14044:2006; Environmental Management—Life Cycle Assessment—Requirements and Guidelines. ISO: Geneva, Switzerland, 2006.
- Tiwari, R.; Agrawal, P.S.; Belkhode, P.N.; Ruatpuia, J.V.L.; Rokhum, S.L. Hazardous effects of waste transformer oil and its prevention: A review. Next Sustain. 2024, 3, 100026. [Google Scholar] [CrossRef]
- Pascale, A.; Urmee, T.; Moore, A. Life cycle assessment of a community hydroelectric power system in rural Thailand. Renew. Energy 2011, 36, 2799–2808. [Google Scholar] [CrossRef]
- Das, B.P.; Milledge, R. Investigating the Impact of Transformer Specification on the Life Cycle Carbon Emissions: A Case Study for Middle East Countries. Transform. Mag. 2022, 9, 64–74. [Google Scholar]
- Das, B.P.; Kablouti, G. Investigating Material and Energy Efficiency of Power Transformers with Conventional and Semi-hybrid Insulation Operating in Low-Carbon Electricity Grids. Transform. Mag. Spec. Ed. Sustain. 2023, 10, 76–90. [Google Scholar]
- Guo, H.; Gao, Y.; Li, J. The Greenhouse Gas Emissions of Power Transformers Based on Life Cycle Analysis. Energy Rep. 2022, 8, 413–419. [Google Scholar] [CrossRef]
- Kulasek, K.; Jul, M.; Lindgren, E.; Flood, J.; Johansson, E.; Oliva, M. Towards Net Zero Emissions—The Role of Circularity in Transformers. Transform. Mag. 2020, 7, 51–58. [Google Scholar]
- Zhang, X.; Gerada, D.; Xu, Z.; Zhang, F.; Gerada, C. A Review of Carbon Emissions from Electrical Machine Materials. Electronics 2024, 13, 1714. [Google Scholar] [CrossRef]
- Qiu, Y.; Zhou, S.; Fan, Y.; Zhang, Q.; Li, Y. Calculation of Life Cycle Carbon Emissions for 110 kV Transformer Station and Carbon Reduction Measures: Taking Guxi Station as an Example. In Proceedings of the 2nd International Conference on Advanced Electronics, Electrical and Green Energy (AEEGE), Singapore, 26–28 May 2023. [Google Scholar]
- Ecoinvent Centre. Ecoinvent 3.11; Ecoinvent Centre: St. Gallen, Switzerland, 2024. [Google Scholar]
- STREAM Freight Transport 2020. Emissions of Freight Transport Modes. CE Delft. 2021. Available online: www.cedelft.eu (accessed on 29 January 2025).
- Gialos, A.; Zeimpekis, V.; Madas, M.; Papageorgiou, K. Calculation and Assessment of CO2e Emissions in Road Freight Transportation: A Greek Case Study. Sustainability 2022, 14, 10724. [Google Scholar] [CrossRef]
- Ministry for an Ecological and Solidary Transition. Methodological Guide: GHG Information for Transport Services. Application of Article L. 1431-3 of the French Transport Code. 2019. Available online: www.ecologie.gouv.fr/sites/default/files/documents/Information_GES%20-%202019.pdf (accessed on 29 January 2025).
- Nowtricity. Real-Time Live Emissions from Energy Production by Country. Available online: www.nowtricity.com/country/poland/ (accessed on 7 January 2025).
- Bosnjak, B. Carbon Footprint Reduction of Distribution Transformers. In Proceedings of the XIII Scientific and Technical Conference Power and Special Transformers, Kazimierz Dolny, Poland, 21–23 May 2023. [Google Scholar]
- Das, B.; Pajaro, G. Investigating the Environmental Benefits of Oil Reclamation—A Case Study. Transform. Mag. 2024, 11, 14–24. [Google Scholar]
- Rozga, P.; Rao, U.M.; Fofana, I.; Beroual, A.; Calcara, L.; Pompili, M.; Wang, F.; Casserly, E.; Martin, R.; Malde, J. Next-Generation Ester Dielectric Liquids: Some Key Findings and Perspectives. IEEE Electr. Insul. Mag. 2024, 40, 23–35. [Google Scholar] [CrossRef]

| Parameters | Unit | TRF-1 | TRF-2 |
|---|---|---|---|
| Nominal Capacity | MVA | 31.5 | 25 |
| Nominal Voltage | kV | 115/16.5 | 115/16.5 |
| No-load losses | kW | 12 | 10.5 |
| Load losses | kW | 140 | 125 |
| Cooling system | - | ON-AN | ON-AN |
| Type of transformer oil | - | mineral | mineral |
| Total mass | t | 60 | 49 |
| On-load tap changer | - | Yes | Yes |
| Lifespan | year | 40 | 40 |
| Materials | Unit | TRF-1 | TRF-2 |
|---|---|---|---|
| Steel | t | 16.319 | 12.039 |
| Electrical steel | t | 15.864 | 13.454 |
| Copper | t | 7.903 | 6.566 |
| Cellulose insulation: | |||
| -Paper | t | 0.271 | 0.211 |
| -Pressboard | t | 1.349 | 1.214 |
| Mineral oil | t | 14.000 | 11.300 |
| Other materials | t | 4.294 | 4.216 |
| Geography | Type of Transport | Distance [km] | TRF-1 Mass [t] | TRF-2 Mass [t] |
|---|---|---|---|---|
| Poland | Semi-trailer trucks | 250 | 7.955 | 6.633 |
| Germany | Semi-trailer trucks | 480 | 0.460 | 0.324 |
| Czech Republic | Semi-trailer trucks | 500 | 0.558 | - |
| Turkey | Semi-trailer trucks | 2100 | 15.864 | 13.454 |
| Slovakia | Semi-trailer trucks | 530 | 2.654 | 2.196 |
| Sweden | Semi-trailer trucks | 360 | 14.231 | 11.540 |
| Cargo ship | 690 | 14.231 | 11.540 | |
| Estonia | Semi-trailer trucks | 1100 | 5.148 | 4.237 |
| India | Semi-trailer trucks | 360 | 8.324 | 5.827 |
| Cargo ship | 15,130 | 8.324 | 5.827 | |
| Europe | Semi-trailer trucks | 1200 | 4.806 | 4.789 |
| Transportation | EFCO2-eq [t CO2-eq/tkm] | References | Selected EFCO2-eq Value [tCO2-eq/tkm] |
|---|---|---|---|
| Road transport | 0.000085 ÷ 0.000260 | [26,27,28,29] | 0.000130 |
| Sea transport | 0.000003 ÷ 0.000050 | [26,27,28,29] | 0.000025 |
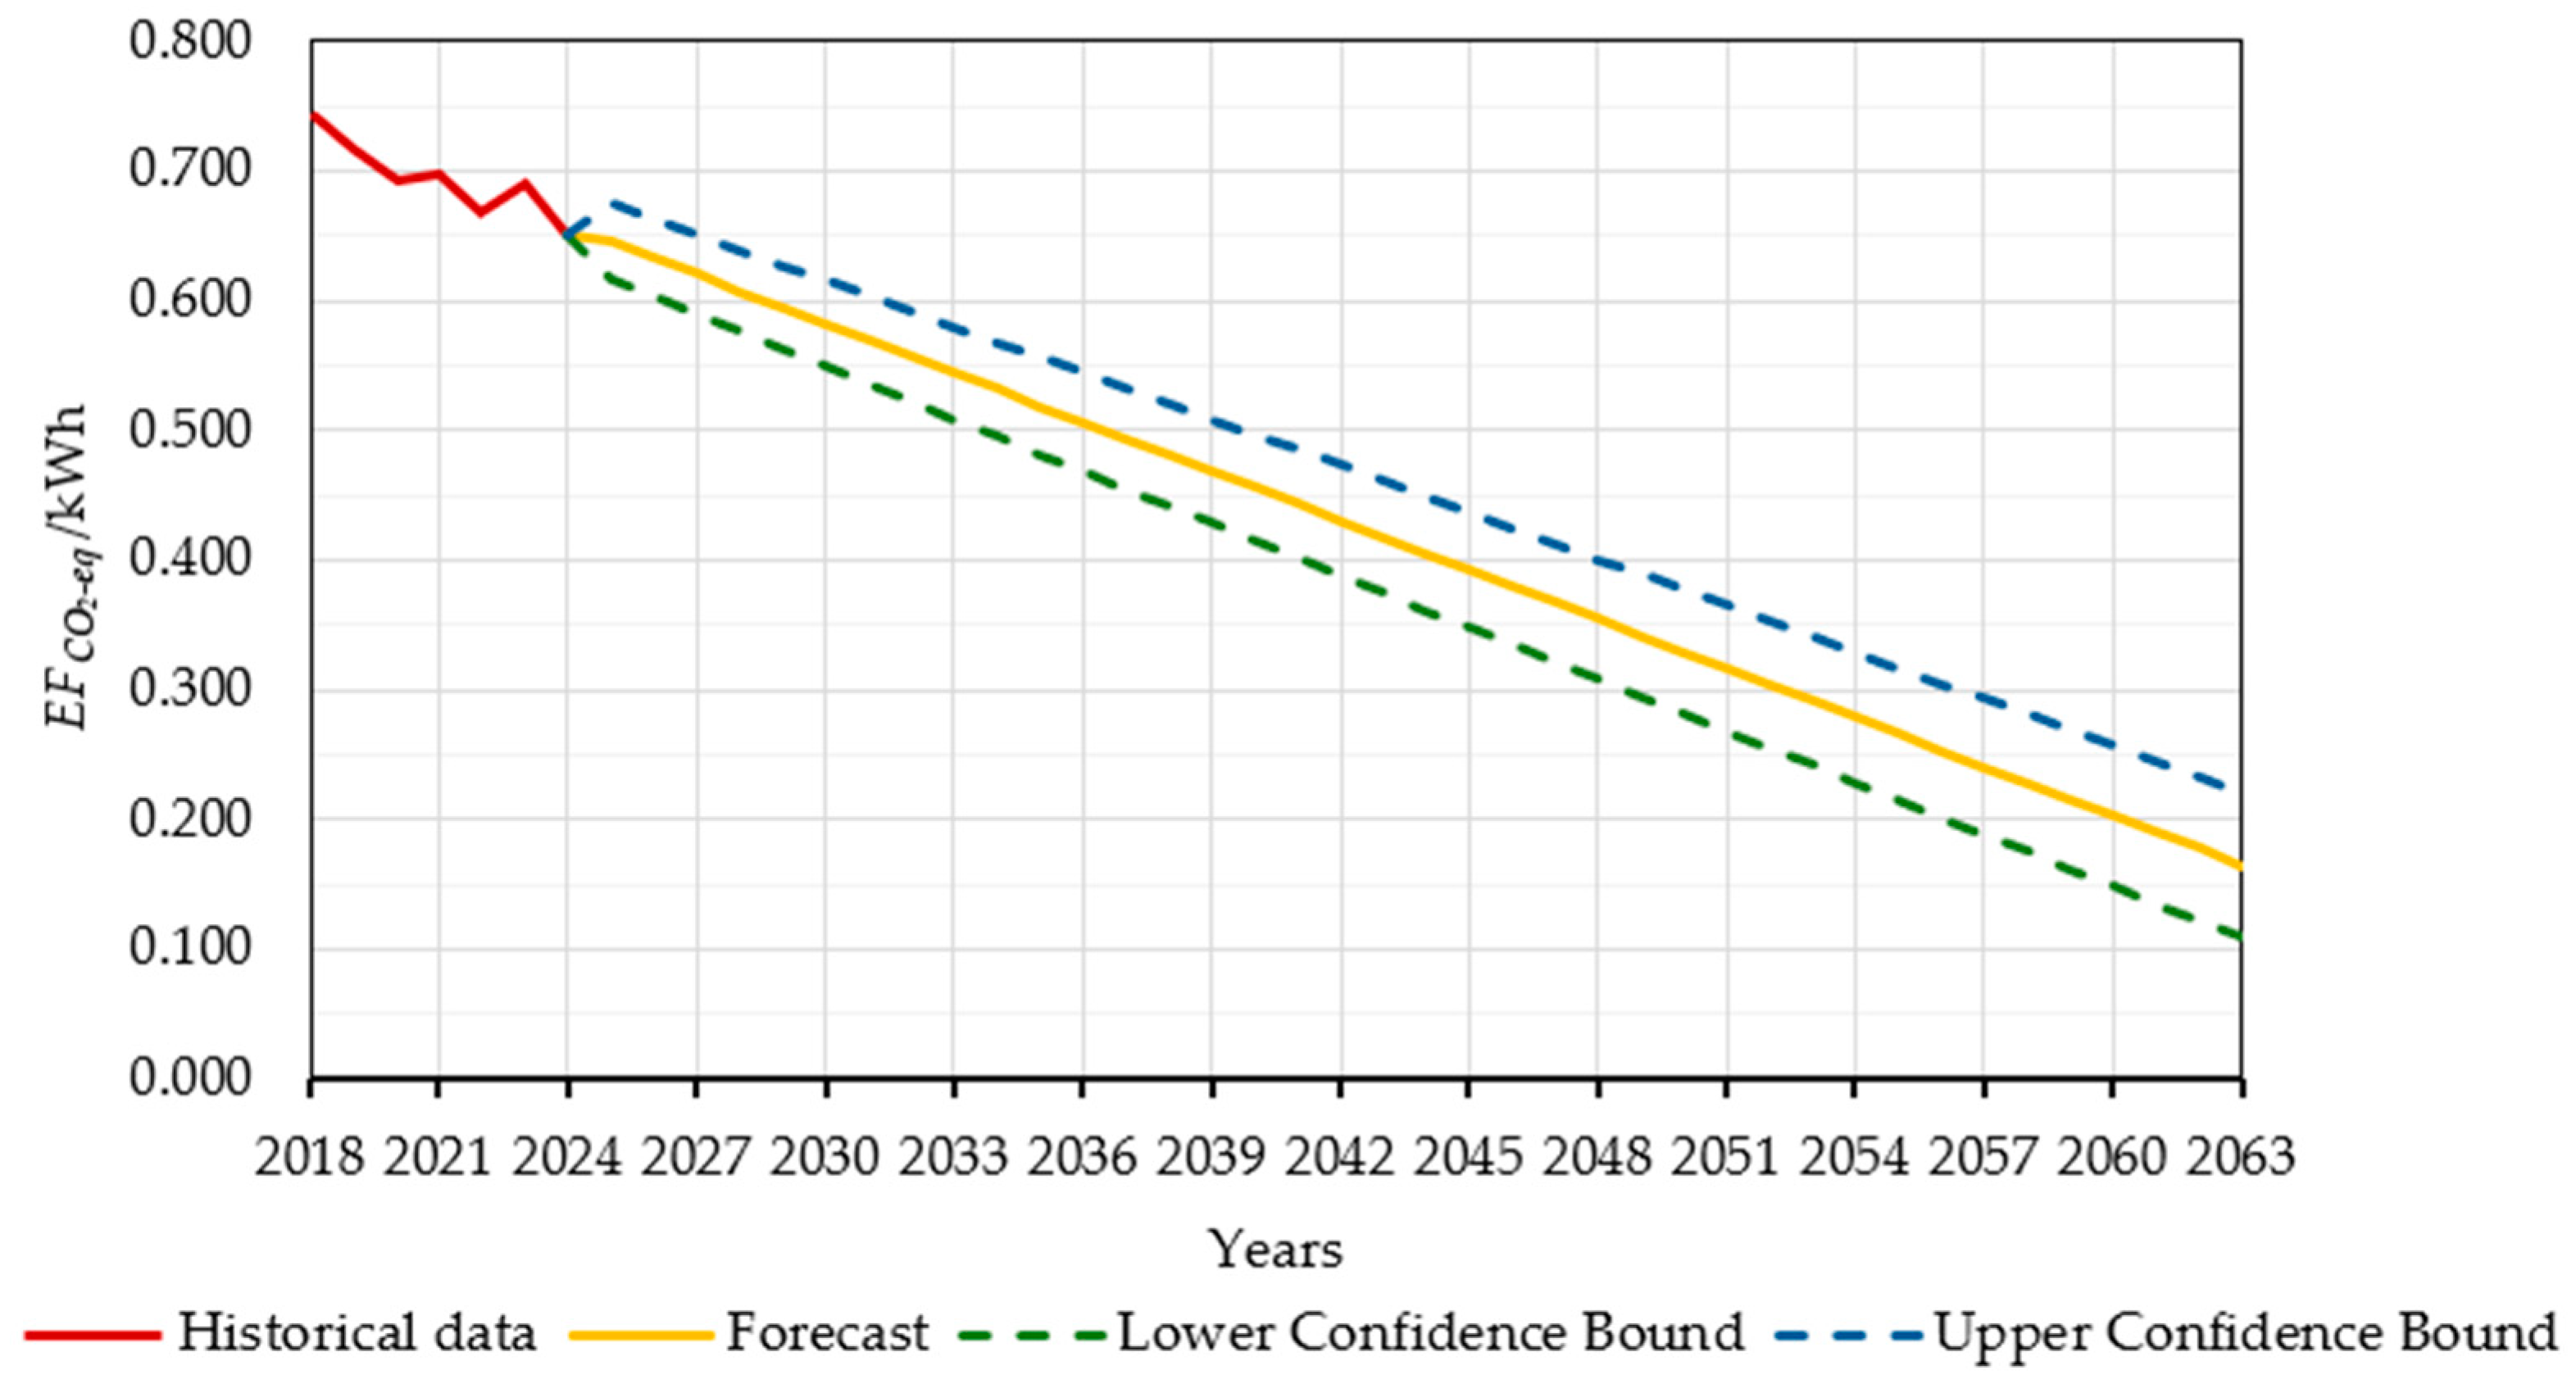
| Year | EFCO2-eq Value [t CO2-eq/kWh] [30] |
|---|---|
| 2018 | 0.000743 |
| 2019 | 0.000717 |
| 2020 | 0.000693 |
| 2021 | 0.000698 |
| 2022 | 0.000667 |
| 2023 | 0.000690 |
| 2024 | 0.000652 |
| TRF-1 (31.5 MVA) [t CO2-eq] | TRF-2 (25 MVA) [t CO2-eq] | |
|---|---|---|
| Steel | 40.798 | 30.098 |
| Electrical steel | 47.592 | 40.362 |
| Copper | 37.444 | 31.043 |
| Cellulose insulation | 1.817 | 1.609 |
| Mineral oil | 16.940 | 13.673 |
| Other materials | 11.164 | 10.998 |
| Total | 155.755 | 127.783 |
| TRF-1 [t CO2-eq] | TRF-2 [t CO2-eq] | |
|---|---|---|
| Road transport | 7.379 | 6.226 |
| Sea transport | 3.394 | 2.403 |
| Total | 10.773 | 8.629 |
| TRF-1 [t CO2-eq] | TRF-2 [t CO2-eq] | |
|---|---|---|
| Electricity consumption | 16.692 | 13.248 |
| TRF-1 [t CO2-eq] | TRF-2 [t CO2-eq] | |
|---|---|---|
| Road transport | 2.535 | 2.389 |
| TRF-1 [t CO2-eq] | TRF-2 [t CO2-eq] | |||
|---|---|---|---|---|
| Scenario 1 | Scenario 2 | Scenario 1 | Scenario 2 | |
| Electricity consumption (assuming an average load of 50% over a 40-year period) | 10,737.658 | 6963.973 | 9538.238 | 6172.232 |
| TRF-1 [t CO2-eq] | TRF-2 [t CO2-eq] | |||
|---|---|---|---|---|
| Lifecycle Stage | Scenario 1 | Scenario 2 | Scenario 1 | Scenario 2 |
| Raw materials extraction | 155.755 | 155.755 | 127.783 | 127.783 |
| Transportation of materials to the factory | 10.773 | 10.773 | 8.629 | 8.629 |
| Manufacturing | 16.692 | 16.692 | 13.248 | 13.248 |
| Transportation to the operational site | 2.535 | 2.535 | 2.389 | 2.389 |
| Usage (40 years, 50% load) | 10,737.658 | 6963.973 | 9538.238 | 6172.232 |
| Total CO2-eq emissions (40 years, 50% load) | 10,923.413 | 7149.728 | 9690.287 | 6324.281 |
Disclaimer/Publisher’s Note: The statements, opinions and data contained in all publications are solely those of the individual author(s) and contributor(s) and not of MDPI and/or the editor(s). MDPI and/or the editor(s) disclaim responsibility for any injury to people or property resulting from any ideas, methods, instructions or products referred to in the content. |
© 2025 by the authors. Licensee MDPI, Basel, Switzerland. This article is an open access article distributed under the terms and conditions of the Creative Commons Attribution (CC BY) license (https://creativecommons.org/licenses/by/4.0/).
Share and Cite
Piotrowski, T.; Markowska, D. Carbon Footprint of Power Transformers Evaluated Through Life Cycle Analysis. Energies 2025, 18, 1373. https://doi.org/10.3390/en18061373
Piotrowski T, Markowska D. Carbon Footprint of Power Transformers Evaluated Through Life Cycle Analysis. Energies. 2025; 18(6):1373. https://doi.org/10.3390/en18061373
Chicago/Turabian StylePiotrowski, Tomasz, and Dorota Markowska. 2025. "Carbon Footprint of Power Transformers Evaluated Through Life Cycle Analysis" Energies 18, no. 6: 1373. https://doi.org/10.3390/en18061373
APA StylePiotrowski, T., & Markowska, D. (2025). Carbon Footprint of Power Transformers Evaluated Through Life Cycle Analysis. Energies, 18(6), 1373. https://doi.org/10.3390/en18061373