Article

Impact of Cooling Strategies and Cell Housing Materials on Lithium-Ion Battery Thermal Management Performance

by
Sevgi Aydın
1,2,*,
Umut Ege Samancıoğlu
3,
İsmail Hakkı Savcı
2,
Kadri Süleyman Yiğit
1 and
Erdal Çetkin
3
1
Department of Mechanical Engineering, Kocaeli University, 41001 Izmit, Turkey
2
Ford Otosan İstanbul Plants, 34885 Istanbul, Turkey
3
Department of Mechanical Engineering, Izmir Institute of Technology, 35433 Urla, Turkey
*
Author to whom correspondence should be addressed.
Energies 2025, 18(6), 1379; https://doi.org/10.3390/en18061379
Submission received: 12 February 2025 / Revised: 7 March 2025 / Accepted: 10 March 2025 / Published: 11 March 2025

Abstract

:
The transition to renewable energy sources from fossil fuels requires that the harvested energy be stored because of the intermittent nature of renewable sources. Thus, lithium-ion batteries have become a widely utilized power source in both daily life and industrial applications due to their high power output and long lifetime. In order to ensure the safe operation of these batteries at their desired power and capacities, it is crucial to implement a thermal management system (TMS) that effectively controls battery temperature. In this study, the thermal performance of a 1S14P lithium-ion battery module composed of cylindrical 18650 cells was compared for distinct cases of natural convection (no cooling), forced air convection, and phase change material (PCM) cooling. During the tests, the greatest temperatures were reached at a 2C discharge rate; the maximum module temperature reached was 55.4 °C under the natural convection condition, whereas forced air convection and PCM cooling reduced the maximum module temperature to 46.1 °C and 52.3 °C, respectively. In addition, contacting the battery module with an aluminum mass without using an active cooling element reduced the temperature to 53.4 °C. The polyamide battery housing (holder) used in the module limited the cooling performance. Thus, simulations on alternative materials document how the cooling efficiency can be increased.

1. Introduction

Advancements in science and technology, along with the rapid increase in the global population, have led to a significant rise in global energy consumption [1]. Due to the depletion risk of traditional fossil fuels used to meet energy demands [2] and their significant environmental impact conflicting with sustainability policies, interest in alternative renewable energy sources has been increasing [3,4,5,6,7]. However, renewable energy sources do not supply constant power due to their intermittent nature [8]. Therefore, storing energy when it is generated more than the demand and supplying it when the generation rate decreases are required to resolve the mass adaptation of renewable energy sources. One option to store energy generated from renewable sources is electrochemical batteries, such as lithium-ion batteries.
Lithium-ion batteries have garnered significant attention in both academia and industry due to their stable voltage, high power density, long cycle life, and low self-discharge rate [6,9,10]. These batteries are widely used as a power source in many devices, such as smartphones, laptops, portable tools, and smart robots [2,11].
Although lithium-ion batteries can operate within a wide temperature range of −30 °C to +55 °C, their capacity is adversely affected at temperatures above 40 °C or below −10 °C [2,12]. These batteries generate heat due to reversible and irreversible electrochemical processes and ohmic resistance during charging and discharging [13,14]. The generated heat, which increases the battery’s temperature, has negative effects on battery performance, safety, and lifetime [15]. The increase in battery temperature accelerates chemical deterioration in the battery and increases the risk of triggering the process known as “thermal runaway”. Thermal runaway occurs when the battery temperature exceeds a certain threshold, leading to a series of exothermic chemical reactions within the battery chemistry. This process brings serious safety risks, such as fires or explosions [14,16,17].
The optimal operating temperature range for lithium-ion batteries accepted for safe operation is between 15 and 40 °C, with a maximum temperature difference of 5 °C between cells [12,14]. Non-uniform temperature distribution within battery cells can adversely affect its safety, performance, and lifetime [6,18]. Therefore, it is necessary to use battery thermal management systems (BTMSs) that ensure a uniform temperature distribution and maintain the battery temperature within the optimal range [19].
BTMSs can be classified into two main categories: active and passive systems. Active systems are based on dissipating waste heat from the battery through forced convection, via fans/pumps, to force fluid (gas/liquid, respectively) to flow over the heat exchange surface [6]. While active systems are effective in thermal control, they require additional energy sources and are more complex compared to passive systems. On the other hand, passive systems manage thermal control by absorbing the heat generated by the batteries without any external energy requirement for fluid to flow, such as natural convection, phase change material (PCM), and heat pipes [20]. The advantages and disadvantages of different types of BTMSs vary depending on the application. For instance, a BTMS with air cooling is preferred for small- and medium-scale applications due to its low cost and simple structure, as the thermal capacitance of the working fluid is good enough to maintain the temperature in the desired range. However, a BTMS with liquid cooling is more effective for large-scale applications due to the air thermal capacitance not being enough to hold the temperature in the desired range, whereas liquids have greater thermal capacitance. A BTMS with PCM is suitable for small-scale applications with constant temperature loads [21]. However, that is true if the PCM is selected carefully according to the operational and ambient temperatures. Therefore, the selection of a BTMS appropriate to the application is critical [22].
Air cooling holds a significant place in BTMS applications due to its low cost, simple structure, and compact design [23,24]. However, the low thermal conductivity and heat capacity of air are among the limiting factors of this system [21,25]. Kalkan et al. [26] investigated the thermal behavior of a 20 Ah lithium-ion battery under natural convection using both experimental and numerical methods. Their study revealed that natural convection, one of the passive BTMS methods, failed to maintain battery operation within the safe temperature limit of 40 °C during discharge rates of 3–5C and was insufficient for thermal safety at these discharge rates. Similarly, Yu et al. [27] observed that natural convection could be adequate for a battery thermal management (BTM) at low discharge rates such as 0.5C. However, they emphasized that forced air convection should be preferred for higher discharge rates.
Yang et al. [28] examined the effects of the distance among battery cells and the air flow rate on thermal management. They demonstrated that increasing the air flow rate reduced both the maximum temperature of the battery and the temperature difference. Li et al. [29] reported that optimizing the position and number of fans to increase the effective heat transfer area significantly enhanced thermal management performance. Şahin et al. [23] demonstrated effective temperature control at high C-rate values through the utilization of flow mixing fins with various geometric configurations, whereas Göçmen et al. [30] achieved similar results using module designs incorporating manifold structures aimed at regulating airflow characteristics.
Passive thermal management systems have been the subject of extensive research due to their ability to provide improved temperature uniformity, stable chemical properties, and low-cost advantages in low- and medium-load applications [31]. In these systems, phase change materials (PCMs) play a crucial role by providing thermal control through heat storage and release without requiring additional energy consumption, thanks to their high specific heat capacity [32,33]. Wang and Leong [34] achieved a 55% reduction in battery temperature compared to Air BTMS using PCM BTMS. Similarly, Gu et al. [33] achieved approximately 4 °C lower temperatures by immersing the battery in a nano-encapsulated PCM mixed with insulating oil compared to a system using plain insulating oil.
Yan et al. [29] compared the cooling performance of natural convection and PCM BTMSs. Hwang et al. [21] evaluated the advantages and disadvantages of air, liquid, phase change material, and thermoelectric system BTMSs. Akula et al. [30] developed PCM cooling systems with pin-fin structures to mitigate the performance loss caused by the low thermal conductivity of a PCM BTMS. Kalkan et al. [19] proposed a hybrid BTMS combined with PCM, highlighting the advantages of such systems. Huynh et al. [35] compared forced air, PCM, and hybrid forced air-PCM BTMSs. They reported that composite PCM embedded in aluminum metal foam provided significantly better thermal control performance than air-based BTMS.
Quan et al. [16] emphasized the importance of using appropriate and effective insulation materials within the battery to prevent thermal runaway, which poses a risk to battery safety, and to halt its progression if it occurs. El-Haddad et al. [36] employed finite element design and neural network methodology to determine the thermal state and heat flux distribution of the battery. Zhang et al. [37] used neural networks instead of finite element analysis, which is computationally expensive and challenging for optimization studies, to improve and optimize battery thermal management performance.
Studies in the current literature have not considered the use of battery cell holders and housing materials, nor have they included these in their analyses. In the current literature on battery simulation and thermal analysis studies, the battery has been assumed to be in free space, while battery holders and enclosure materials have been overlooked. This study focuses on the effect of the battery holder housing material on pack design, unlike the current literature, and compared PCM, natural convection (non-active cooling) and forced air convection cooling both experimentally and numerically. The thermal management effectiveness of polyamide, aerogel, flame-resistant graphite composite, epoxy-filled carbon fiber composite, rubber, mica, polypropylene, polystyrene, PVC, ceramic, ceramic fiber, and Teflon as cell housing are documented. Among these housing materials, the one providing the best performance for thermal control has been determined.

2. Materials and Methods

2.1. Battery Pack Description

Tests were conducted on the battery of a Bluepath Robotics U800 autonomous mobile robot (Bluepath Robotics, Gölcük, Turkey). The mobile robot’s battery consists of 28 1S14P modules connected in series. Each module was made up of cylindrical INR18650A28 cells with a nominal voltage of 3.7 V and an energy capacity of 2800 mAh, giving a total capacity of 40 Ah. The battery characteristics are provided in Table 1. The cells inside the battery were secured using a polyamide cell holder housing. A schematic representation of the battery pack is shown in Figure 1a.

2.2. Experimental Setup

The real-life application areas of AGVs are transportation within factory and warehouses. Since AGVs operate indoors and under stable environmental conditions, the tests were performed under room conditions. During the tests, the battery was charged at 18 A current up to a maximum charging voltage of 4.2 V and discharged to a cut-off voltage of 2.4 V. The effects of discharge at 1C and 2C rates on cell temperatures were tested under non-cooled and forced air convection cooled conditions. Before proceeding to the next charge–discharge cycle, the battery was allowed to cool to room temperature. Each test was repeated 3 times.
For charging, a GOODWILL INSTEK PSH-2018A DC power supply (GW Instek, New Taipei City, Taiwan) was used, while discharging was performed using a BK Precision 8614 DC electronic load (BK Precision, Yorba Linda, CA, USA). Real-time temperature measurements of the battery module were recorded using a Hioki LR8431-20 memory logger (Hioki, Nagano, Japan) with thermocouple connections and a Testo 885 thermal camera (Testo, Titisee-Neustadt, Germany). Forced air convection was provided by a Bi-Sonic 4C-230 HS 120 × 120 × 38 mm fan (Bi-Sonic, New Taipei City, Taiwan), delivering an airflow rate of 2.83 m3/min. Figure 1 illustrates the devices used and the schematic of the experimental setup. Figure 1a,c shows the schematic of the module with thermocouple placements for thermal data acquisition. The module consists of module cells, the cell holder housing material (a polyamide material with holes for placing the cells), and a copper busbar. The cell holder housing material is used to fix the cells, provide thermal and electrical insulation between them, and protect them from mechanical impacts.

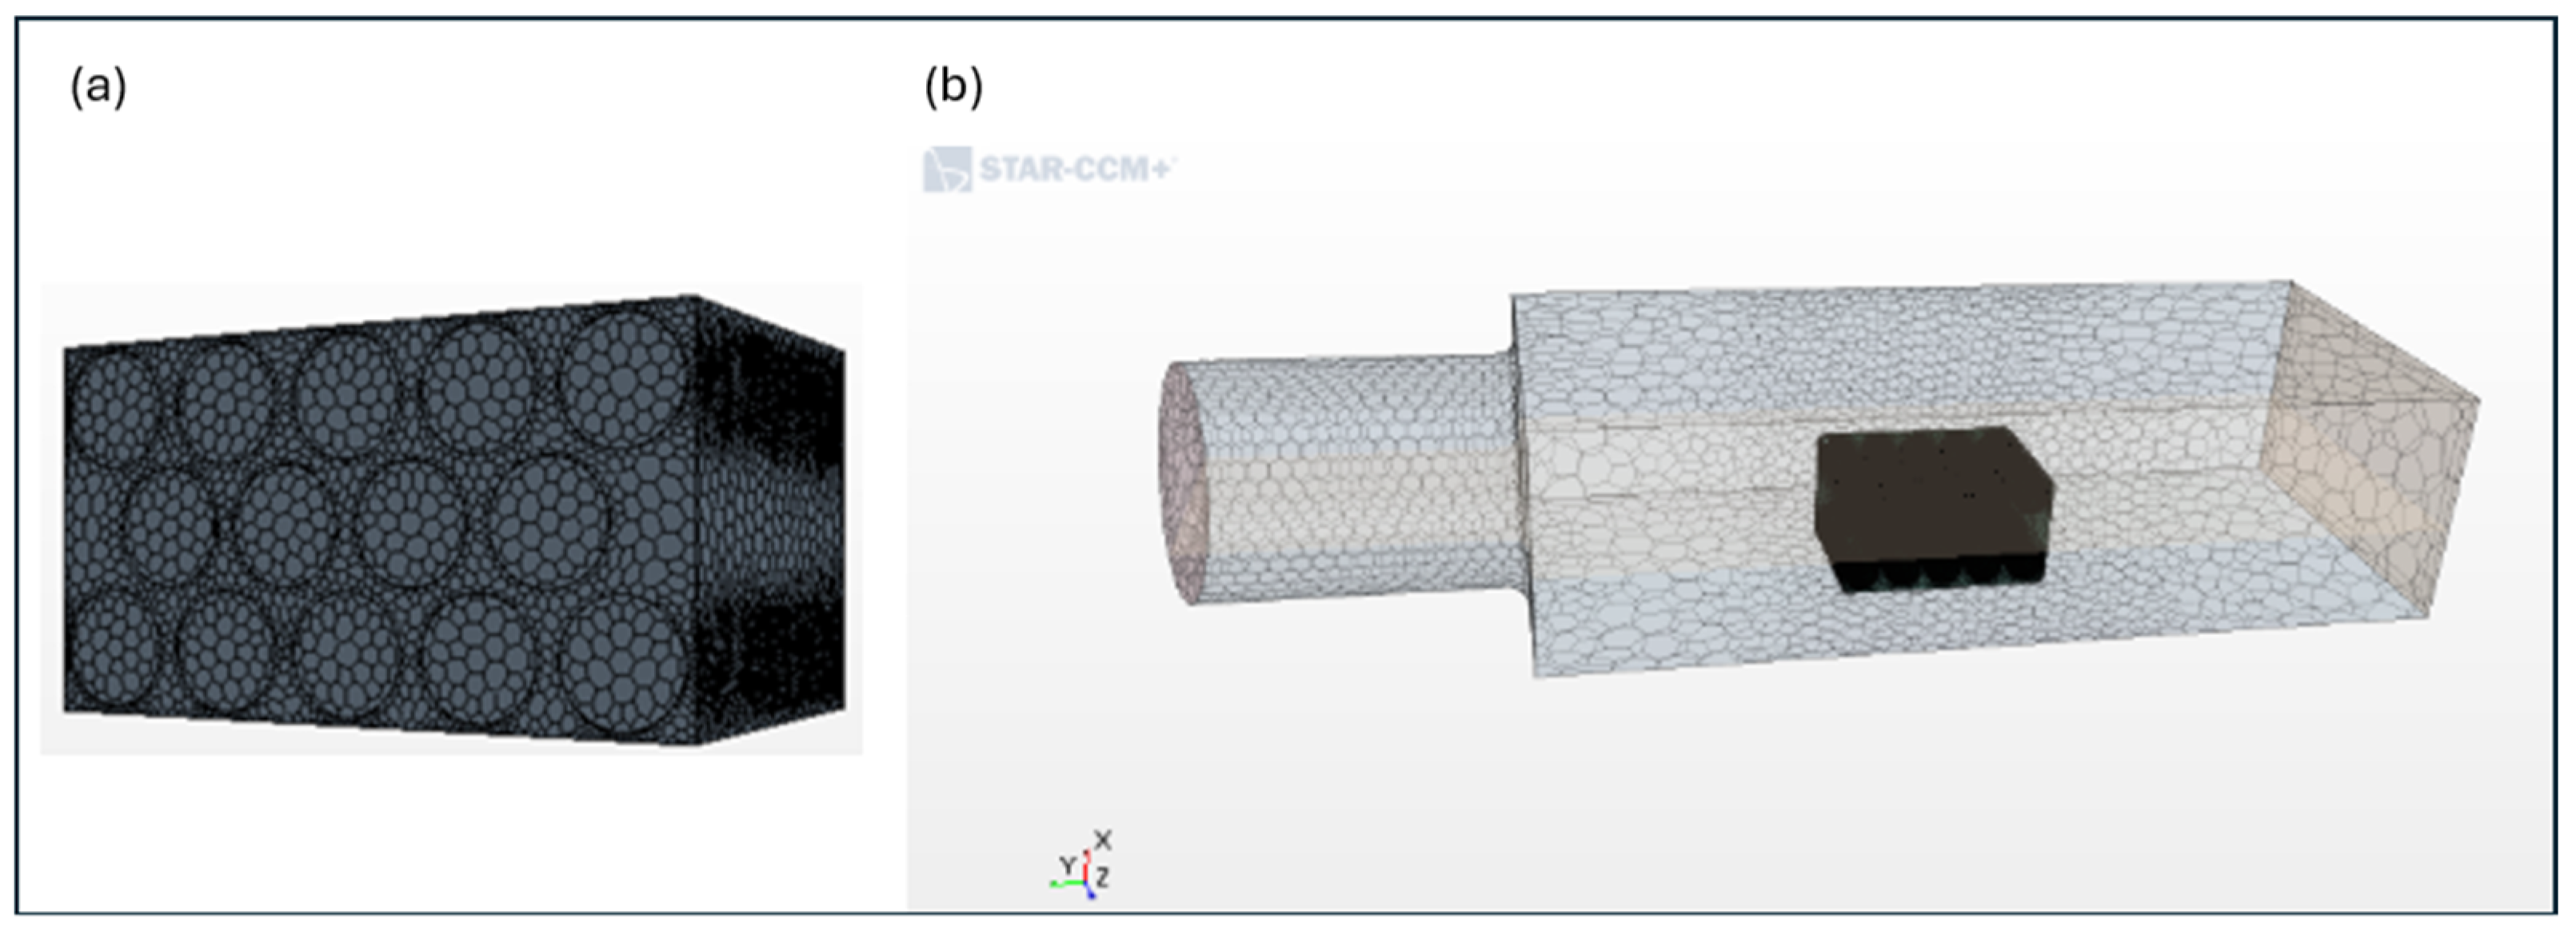
2.3. Numerical Method

Numerical simulations were conducted using the 3D computational tool Star CCM+ (version 12.02). The effects of various cooling airflow rates and cell housing materials on the thermal performance of the battery were analyzed.
The cooling air was assumed to be incompressible, with constant thermal conductivity and specific heat properties. The cells were modeled with constant and homogeneous specific heat, density, and thermal conductivity. Battery heat generation was assumed to remain constant at a given discharge rate.
The heat generation values corresponding to different discharge rates were determined through experimental tests. After connecting thermocouples at three distinct points on the cell surface (top, middle, and bottom), the surface was insulated with 20 mm thick polyethylene foam to minimize heat loss. The addition of polyethylene foam as an insulation material created high thermal resistance on the outer surface of the battery, thereby providing insulation on the battery surface (thermal resistance is calculated using Equation (1)). Under these conditions, the temperature data of the battery, isolated from the external environment, during discharge were recorded using a data logger.
The thermal resistance of the insulation was calculated using the following equation:
R = ln r 2 r 1 2 π k L  
The heat generation of the cell was calculated using the following equations.
Cell calorific value:
Q = m . c p . T
Power generation during discharge:
P = Q / t
where m represents the battery mass, c p is the specific heat capacity, T is the temperature change due to discharge, and t is the discharge time.
In tests conducted at 1C and 2C discharge rates, the temperature measurement points, the changes in average surface temperatures, and the corresponding heat generation values are shown in Figure 2 and Table 2. The average heat generation power of the cell discharged at the 1C rate was 0.2116 W, and at the 2C discharge rate, the average heat generation power was found to be 0.834 W. The results demonstrate that heat generation increases proportionally with the current value, leading to higher heat production at elevated discharge rates.
The simulation model and boundary conditions are listed in Table 3. Since the Reynolds number (Re = ( ρ .u.D)/μ) for the forced air convection condition exceeded 4000, the flow was modeled as turbulent. The k-ω turbulence model was employed. For the natural air convection condition, the flow was modeled as laminar.
The conservation equations of mass, momentum, and energy used in numerical analysis studies are given below.
Mass and momentum transport equation:
ρ t + ρ v ¯ v g = 0  
t ρ v ¯ + ρ v ¯ ( v ¯ v g = . p ¯ I + T ˙ + T t ˙ + f b ,
where ρ is density; v ¯ and p ¯ are the mean velocity and pressure, respectively; v g is the reference frame velocity relative to the laboratory frame; I is the identity tensor; T ˙ is the viscous stress tensor; and f b is the resultant of the body forces.
Energy equations:
For fluid:
t V ρ E d V + A ρ H v . d a = A k T . d a + A T ˙ . v d a + V f b . v d V + V S u d V  
For solid:
t V ρ C p T d V + A ρ C p v s . d a = A k T . d a +   V S u d V   for   solid
where E   is the total energy, H is the total enthalpy, k is thermal conductivity factor of the material, S u is the energy source term, C p is the specific heat, T is the temperature, and A T ˙ . v d a is the viscous dissipation.
k-ω turbulence model transport equation:
t ρ ω + ρ ω v ¯ = . μ + σ ω μ t ω + P ω ρ β f β ω 2 + ω 0 2 + S ω ,
where μ is the dynamic viscosity, σ ω is a model coefficient, P ω is the production term, f β is the vortex-stretching modification factor, S ω is the user-specified source term, and ω is the specific dissipation rate.

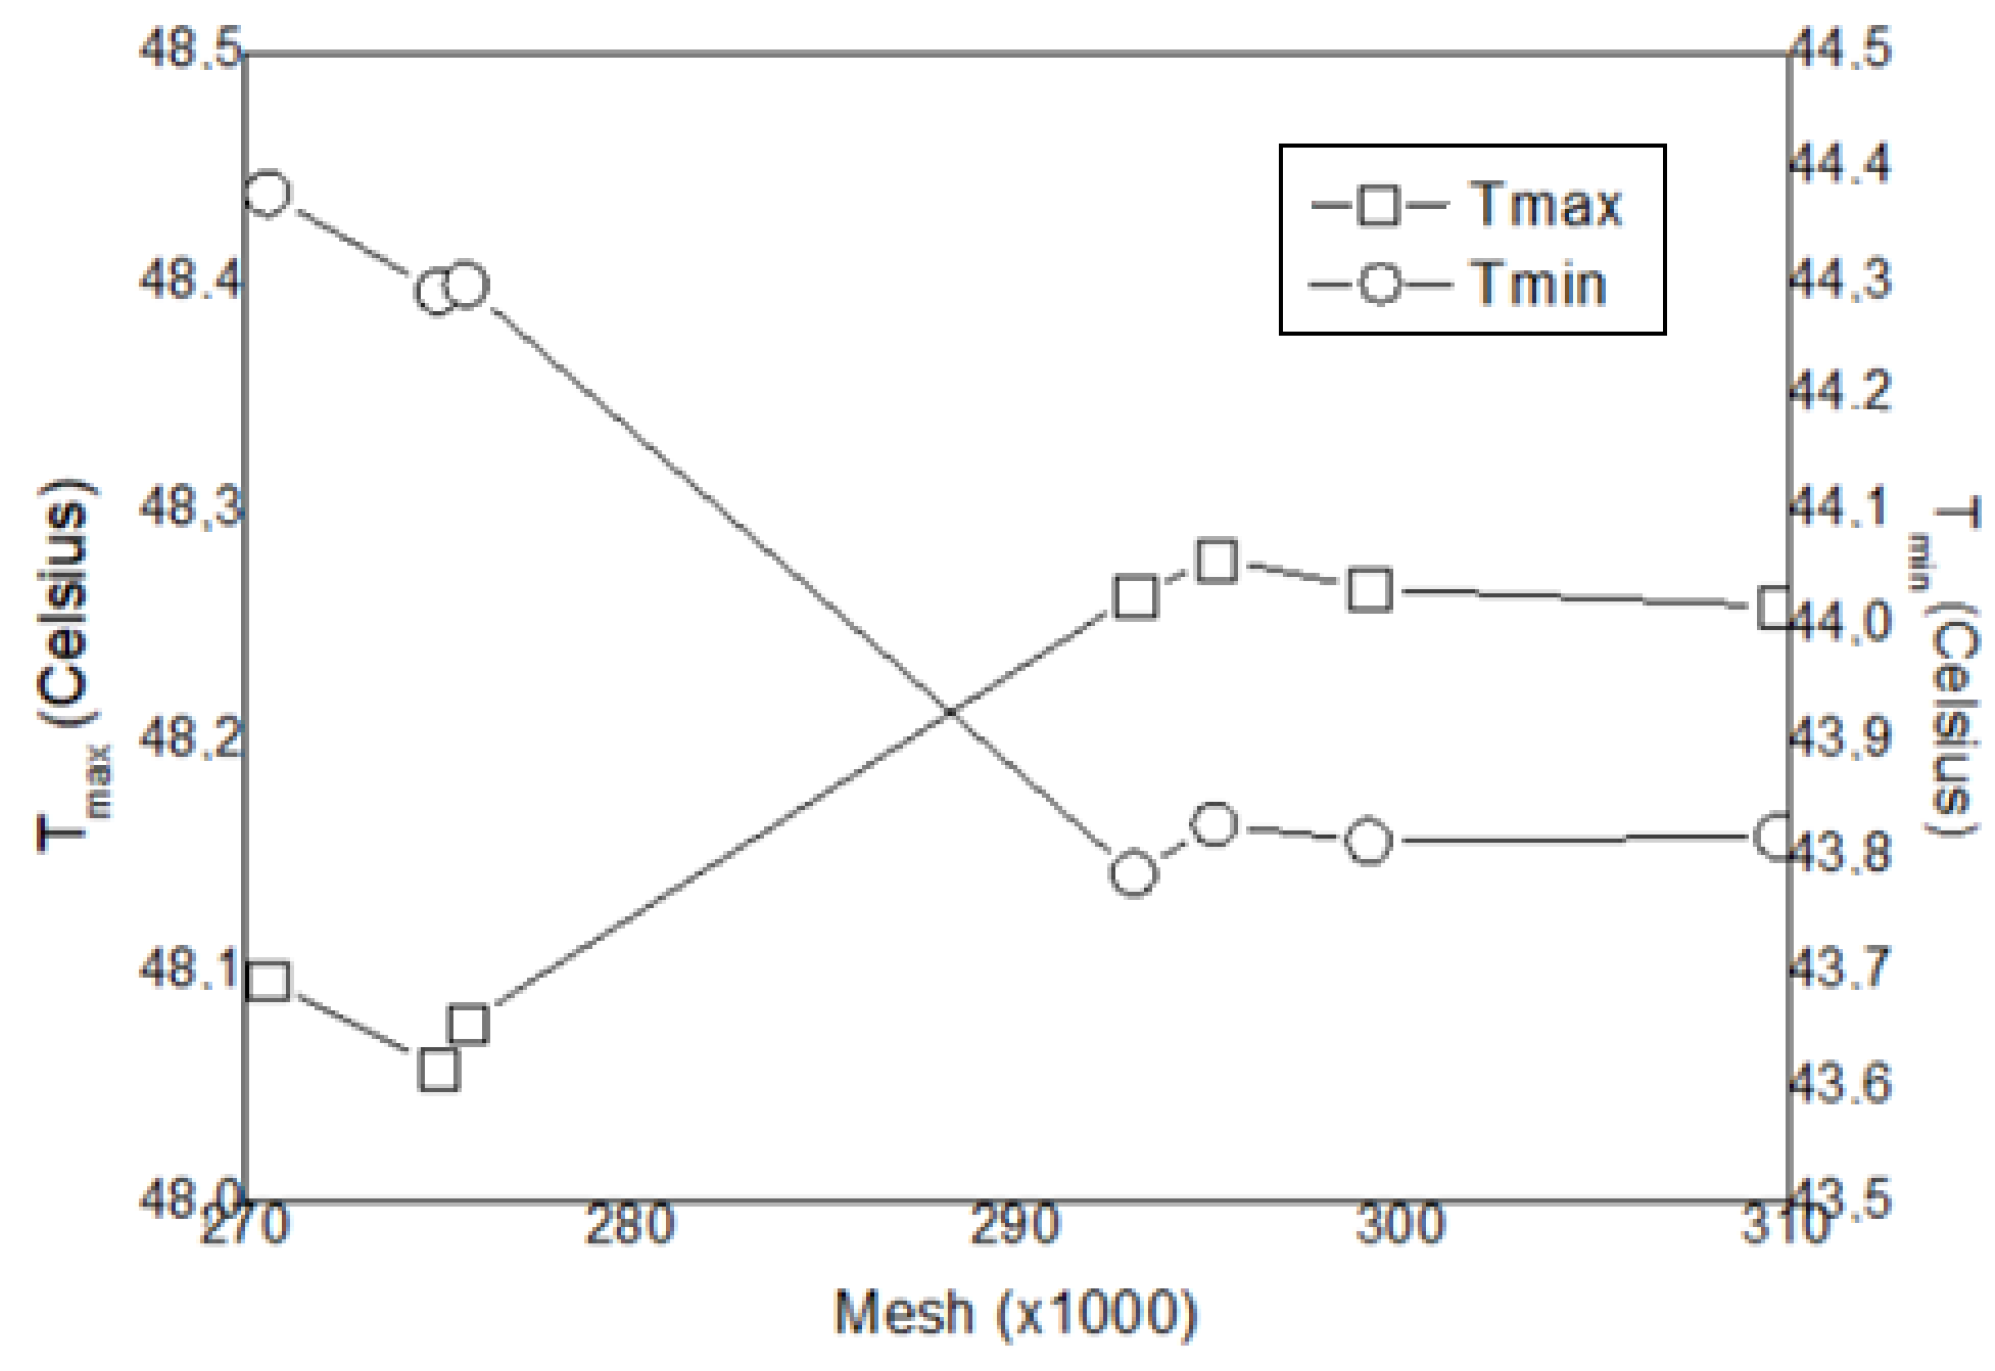
2.4. Mesh Validity Analysis

For the numerical solution of the geometry imported into the 3D simulation tool, the mesh was created using a polyhedral and prismatic layer meshing method. The mesh validity analysis was conducted under a 2C discharge rate and an air flow rate of 2.83 m3/s.
In these analyses, the effect of the number of mesh elements on Tmax and Tmin are shown graphically in Figure 3. When the number of mesh exceeds 290,000, Tmax and Tmin become stable. Therefore, 295,120 cells were used in the subsequent analyses. The visual representation of the generated mesh is presented in Figure 4.

3. Results

The thermal camera image of the battery discharged at 1 and 2C discharge rates without cooling (natural air convection) at the end of discharge is given in Figure 5. As is shown, while the battery operates within the safe operating range at the 1C discharge rate, it reaches temperatures of up to 55.4 °C at the 2C discharge rate, and the temperature exceeds the safe operating range. As stated in the studies by Kalkan et al. [26] and Yu et al. [27], natural convection is sufficient to ensure thermal safety for low discharge rates in medium- and small-scale applications. In Figure 6, the maximum temperature variation of the battery at the 2C discharge rate is shown during the discharge process under various cooling methods. The test results show that, among the compared methods, forced air convection provides the best cooling for battery thermal safety. While the maximum temperature of the module reaches 55.4 °C with natural convection, it decreases to 46.1 °C with forced convection. The use of phase change material (PCM) reduces the temperature to 52.3 °C, and using an Al plate under the module reduces the temperature to 53.4 °C. For the 1C discharge rate, the maximum temperatures of the batteries are 39.9 °C, 32.9 °C, and 38.8 °C for the natural air convection, forced air convection, and PCM cooling methods, respectively.
At the 1C discharge rate, forced air convection keeps the battery within its optimal operating range (15–40 °C). Although fan air convection leads to power loss due to system energy consumption, it is a reliable choice for small- and medium-scale applications. The use of phase change material increases initial costs but ensures safe operation without affecting system power output. Mounting the module onto an aluminum plate with proper insulation measures emerges as a positive alternative for thermal safety. Considering this positive impact, the use of the Al battery casing will enhance the cooling efficiency of the battery.
The experimental and analysis maximum temperature results of the without cooling (natural convection) and forced convection cases are given in Table 4 and Figure 7. The percentage error calculated by the test and numerical analysis is around 3–5% using the following equation (Equation (9)):
Absolute Relative error   ( % ) = 100 A n a l y s i s   r e s u l t E x p e r i m e n t a l   r e s u l t E x p e r i m e n t a l   r e s u l t ,
During charging and discharging processes, heat is generated as a result of chemical reactions in batteries. The removal of heat is directly related to the thermophysical properties of the cell housing material surrounding the battery cells. The transfer of the heat to the cooling air, Al plate, or PCM varies depending on the cooling efficiency of the cell housing material. The effects of using various alternative engineering materials with electrical and thermal insulation properties, such as polyamide, epoxy-filled carbon fiber, rubber, mica, polypropylene, polystyrene, PVC, ceramic fiber, and Teflon, on the thermal condition of the module were evaluated. Figure 8 presents the module cell temperature distribution images obtained from 2C discharge simulations performed with various alternative cell housing materials for natural air convection, where the air sweeps the outer surface of the module in which the cells are surrounded by the cell housing material. The results reveal notable findings, particularly with ceramic fiber, flame-resistant graphite composite, mica, and ceramic materials. The module with a cell housing made of easily formable polyamide material, which has low electrical and thermal conductivity due to its bond structure, reaches a maximum temperature of 52.3 °C and a maximum temperature difference of 1.9 °C at the end of a 2C discharge. The ceramic fiber cell housing provides significant insulation among module cells, raising the maximum module temperature to 56.6 °C and the temperature difference to 3.1 °C. Similarly, the aerogel material also provides effective insulation, and the maximum temperature is determined as 55.1 °C and the maximum temperature difference as 2.1 °C. Both materials cause excessive heating of the cells due to their relatively low thermal conductivities. The electrical insulation of the structural components of batteries is extremely important for preventing the risk of short circuits. Although the ceramic fiber and aerogel cell housing materials make the battery system safe against short circuit risk thanks to their superior electrical insulation properties, the superior thermal insulation provided by their highly porous structure causes the battery to reach higher temperatures at the end of discharge. The lowest maximum and minimum temperatures are obtained with the mica and ceramic materials: the maximum temperatures are 50 °C and 50 °C, and minimum temperatures are 48.2 °C and 49.1 °C, respectively. The thermal conductive properties of these electrically insulating materials contribute to the reduction of module temperatures at the end of discharge. However, the brittle and rigid nature of the ceramic material, which carries the risk of easily being damaged by mechanical impacts, is a significant disadvantage. The graphite composite material achieves the most uniform temperature distribution, with a maximum module temperature difference of 0.2 °C. However, the high electrical conductivity of the graphite material raises safety concerns due to the potential risk of short circuits. As a result, the material selection significantly affects the thermal management performance of the battery cells. When considering criteria such as flame resistance, short circuit protection, maximum temperature difference, and temperature uniformity among cells, the ceramic material emerges as a promising alternative for battery thermal management. Nonetheless, the effect of cell housing thermal conductivity on cell temperature must also be carefully considered.
Forced convection provides sufficient cooling performance for battery thermal management. The maximum temperature analysis data for the polyamide housing, based on forced air flow velocity, are presented in Figure 9. Without applying any cooling method, the maximum temperature of the battery discharged at the 2C rate is measured as 51.30 °C. When forced air convection is applied with 1 m/s flow velocity, the maximum temperature of the battery decreases to 49.63 °C, achieving 3.25% lower temperature compared to the no-cooling condition. When forced air convection at 1 m/s flow velocity is added to the system, the battery maximum temperature difference increases from 2.16 °C to 3.62 °C. This indicates that while forced air convection increases the battery maximum temperature difference, it also effectively lowers the battery maximum temperature. This also indicates that the thermal resistance inside the cell housing is a major contributor. When the cooling air velocity is increased to 5 m/s, the battery maximum temperature decreases to 48.27 °C, and the maximum temperature difference increases to 4.45 °C. However, increasing the air flow velocity above 15 m/s does not create a significant improvement in cooling efficiency. At a 15 m/s air flow velocity, the battery maximum temperature decreases to 47.10 °C, and when the air flow velocity is increased to 45 m/s, the battery maximum temperature only decreases to 46.70 °C. Therefore, it is evident that increasing the cooling air velocity beyond 15 m/s, at the expense of fan power consumption, does not result in a significant improvement in thermal control.
Due to the thermal limits of the cell housing material, increasing the cooling air flow velocity does not further reduce the module’s maximum temperature beyond a certain value. The reason for this is the thermophysical limits of the cell housing material, which first receives the generated heat from the cells. The thermal conditions obtained from the cooling analysis with a 4.97 m/s cooling air flow velocity are summarized in Table 5 and Figure 10. With alternative materials, the module’s maximum and minimum temperatures can be reduced. The lowest maximum temperature, along with the highest thermal homogeneity inside the battery, is achieved with the flame-resistant graphite composite material, followed by the ceramic material. The lowest minimum temperature is achieved with mica, followed by the ceramic material. The ceramic and flame-resistant graphite composite materials, with their ability to achieve low maximum and minimum temperatures and high thermal homogeneity, provide significant alternatives for cell housing materials. The ceramic material, with its high flame resistance and electrical insulating properties, is also a noteworthy alternative. However, considering the high electrical conductivity of the graphite material and the high brittleness of the ceramic material, the ceramic material becomes a more prominent alternative. Additionally, the high flame resistance provided by the ceramic material offers an important advantage by preventing the spread of flame throughout the battery system in the event of thermal runaway.
When forced air convection at 2.83 m3/min is applied to the polyamide cell housing battery discharged at a 2C discharge rate, the battery maximum temperature decreases from 52.3 °C (without cooling) to 48.421 °C. However, forced air convection increases the temperature difference within the module, rising from 1.9 °C to 3.508 °C. Although higher battery maximum temperatures are observed with natural air convection compared to forced air convection, passive natural air convection provides a more uniform temperature distribution within the module than forced air convection. However, it should be noted that the modules were in a relatively big room where the room temperature did not change from the dissipated heat from the module. If the module is inserted in an relatively small enclosure, then the maximum temperature is expected to increase in the natural convection case. In the case of a module with ceramic cell housing, forced air convection reduces the battery maximum temperature to 46.19 °C and the maximum temperature difference to 1.673 °C. The temperature distributions of ceramic and polyamide cell housing batteries in the natural air convection and forced air convection cases are presented in Figure 11.
The battery temperature simulation data, depending on the cooling air flow velocity, for a battery using polyamide, ceramic, and flame-resistant graphite composite cell holders under the 2C discharge rate are presented in Figure 12. The maximum module temperatures reached are 48.84 °C with 3 m/s air flow velocity in the polyamide cell housing battery, 46.37 °C in the ceramic cell housing battery, and 45.87 °C in the flame-resistant graphite composite housing battery. The maximum module temperature differences for the three cell housing materials are measured as 4.28 °C, 2.18 °C, and 0.72 °C, respectively. Using ceramic or flame-resistant graphite composite instead of polyamide for the cell housing reduces the maximum battery temperature and increases the temperature homogeneity. Flame-resistant graphite composite offers superior thermal management efficiency and temperature uniformity. Likewise with the polyamide material, as the cooling air flow rate increases, the maximum battery temperature decreases, while the temperature homogeneity decreases.

4. Discussion

Numerical and experimental studies were carried out on natural convection, forced air convection, and PCM cooling BTMSs for a 1S14P battery consisting of a cylindrical 18650 cell. The effects of using various thermal insulation materials instead of the polyamide material as the battery cell housing and the impact of the cooling air flow rate were evaluated. The main results obtained can be summarized as follows:
1.
Effect of Discharge Rate:
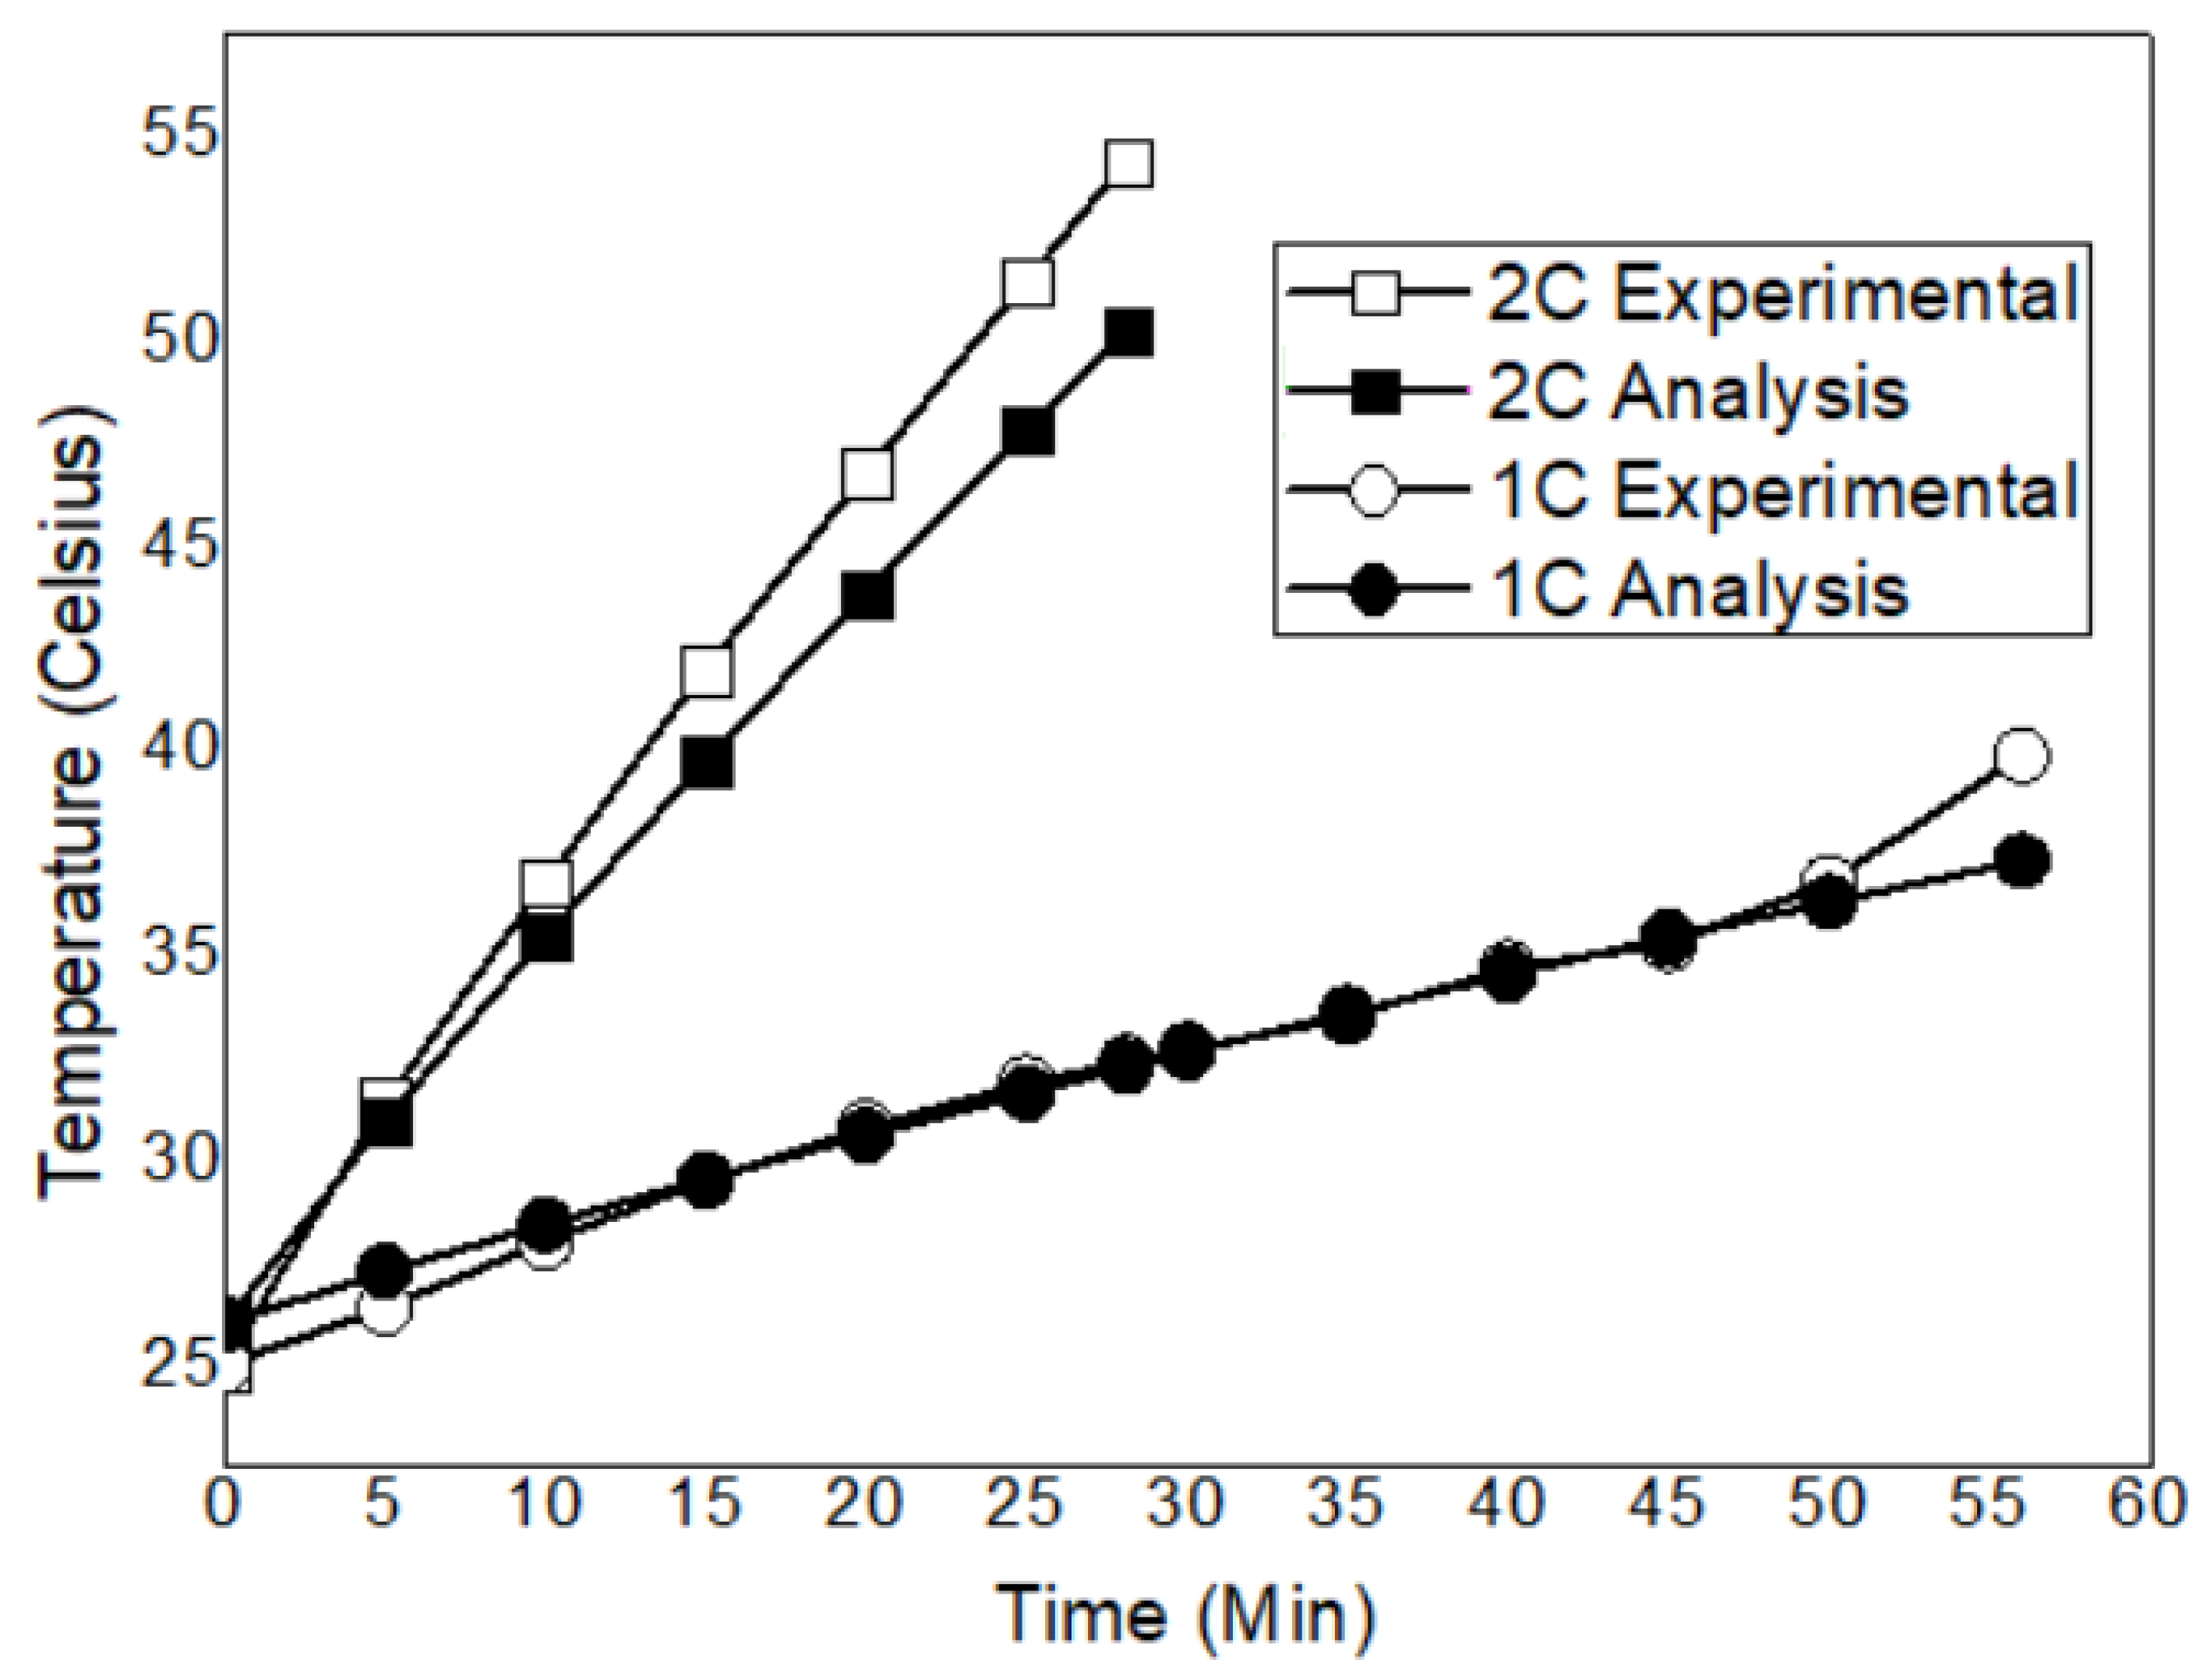
In tests conducted at room temperature with 1C and 2C discharge rates, the average heat generation powers of the battery were calculated as 0.2116 W and 0.834 W, respectively.
The increased current values due to the higher discharge rates increases the heat generation, which leads to higher maximum temperatures in the battery.
2.
Effect of Cooling Methods:
Forced air convection is the most effective method for maintaining the lowest battery temperature and achieving the highest thermal control efficiency. At a 1C discharge rate, it reduces the battery maximum temperature to 32.9 °C, keeping the battery within the optimal operating range. By contrast, the maximum temperatures with natural air convection and PCM cooling were measured as 39.9 °C and 38.8 °C, respectively.
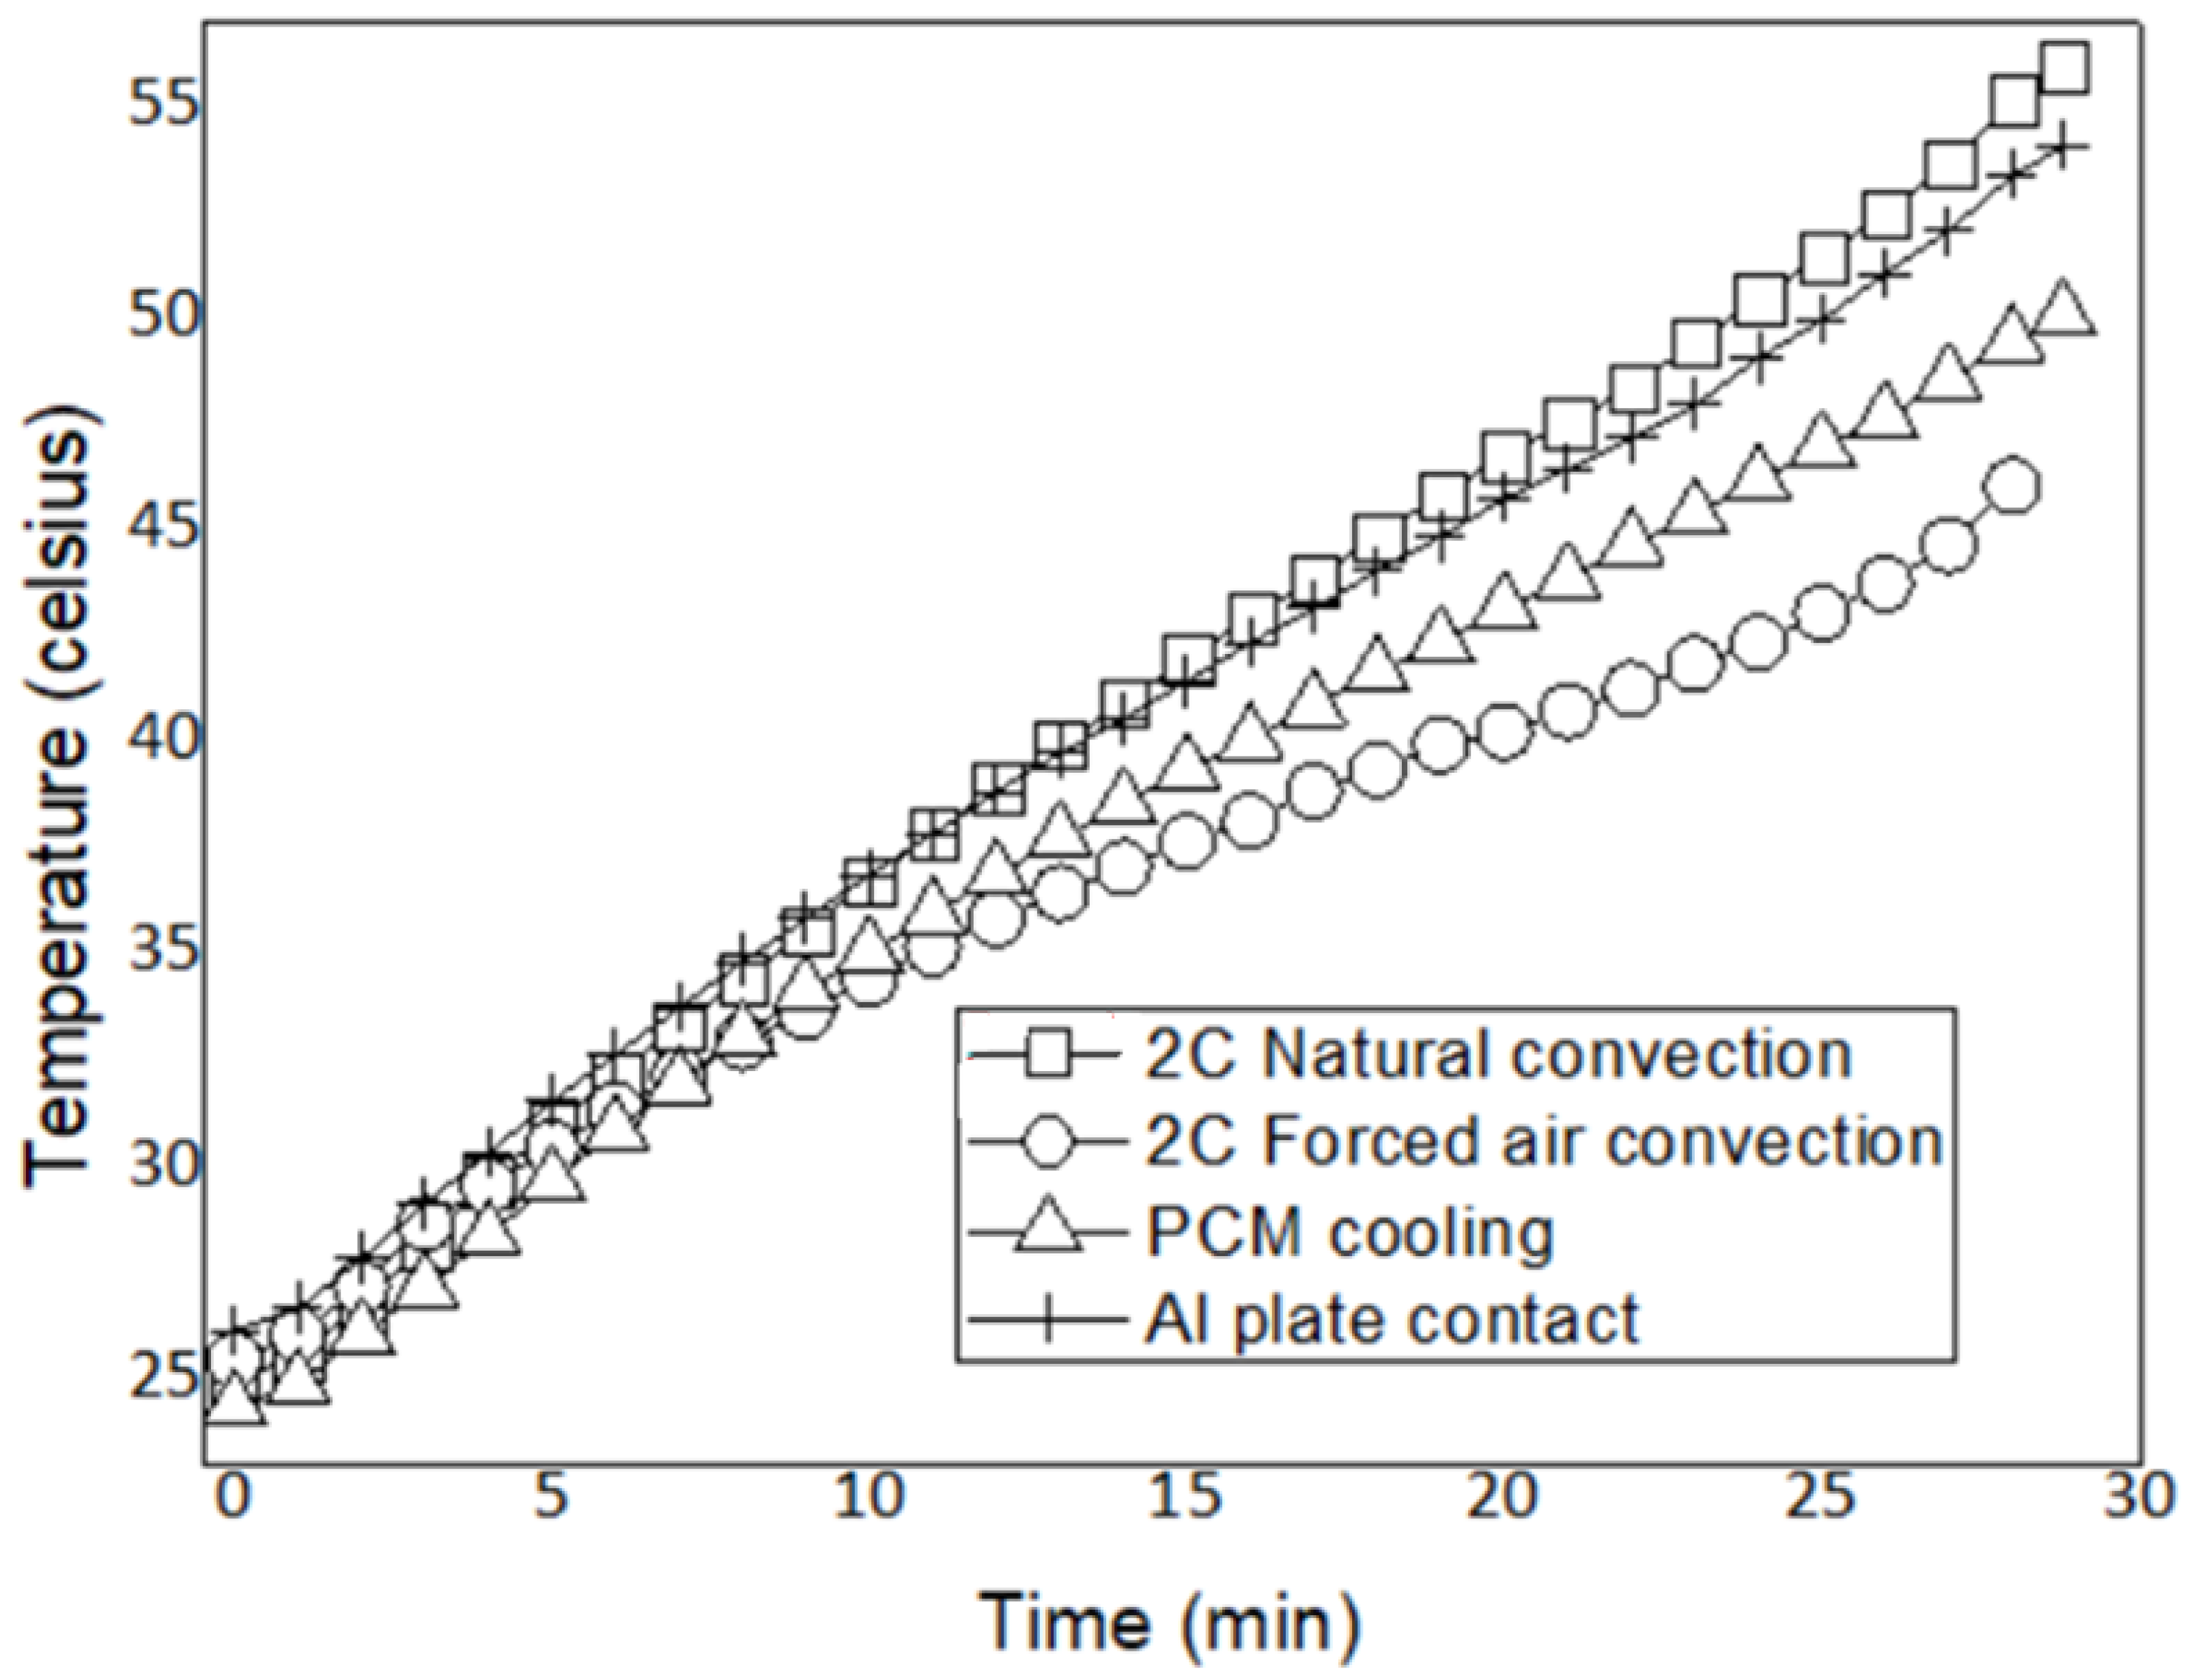
At a 2C discharge rate, the increased heat generation leads to increased battery maximum temperatures. The maximum temperatures were recorded as 55.4 °C for natural air convection, 46.1 °C for forced air convection, and 53.4 °C for PCM cooling. While natural convection ensures the safe operating temperature range at both discharge rates, it exceeds the optimal operating range. PCM cooling slightly reduces the maximum temperature compared to natural convection and could be considered a suitable BTMS alternative, particularly at low discharge rates.
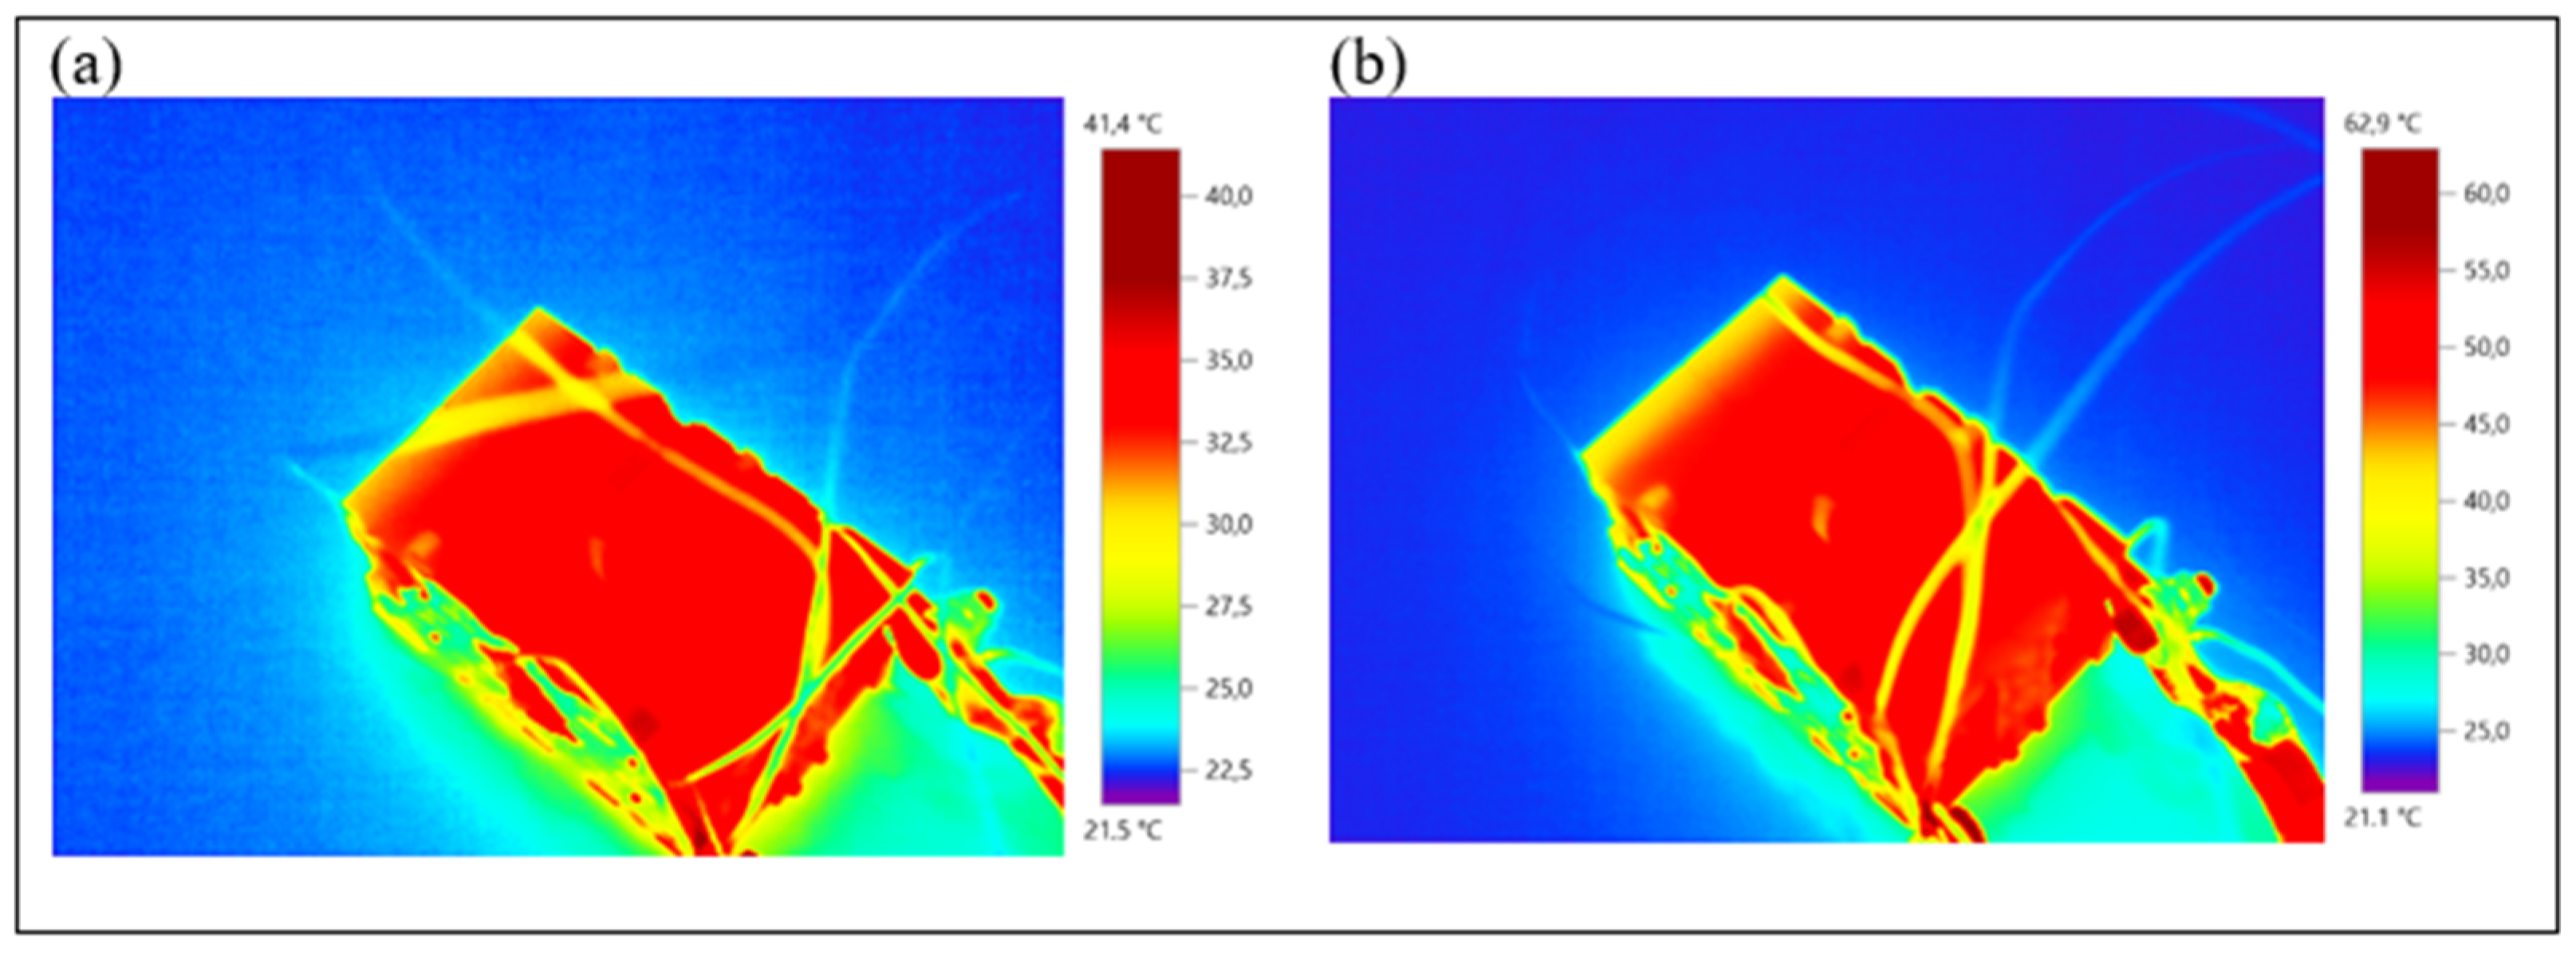
Passive BTMSs (natural air convection and PCM cooling) ensure more homogeneous temperature distribution within the battery module.
Depending on the thermal limits of the air and cell holder material, as the air flow rate increases up to a certain threshold value, the maximum temperature inside the battery and thermal homogeneity decrease. After exceeding the threshold, the maximum temperature and thermal homogeneity inside the battery remain constant.
In the battery with a polyamide cell holder, the maximum and minimum temperatures inside the battery were reduced up to flow velocity of 15 m/s. However, at air flow velocity above 15 m/s, the maximum temperature and temperature difference inside the battery remained approximately constant. The maximum temperature inside the battery, which was 51.30 °C without cooling, decreased by 3.24% to 49.5 °C at 1 m/s. At 15 m/s, the maximum temperature decreased by 8.17% to 47.1 °C, and at 45 m/s, it decreased by 8.96% to 46.7 °C. The maximum temperature differences inside the battery at 1, 15, and 45 m/s were 3.6 °C, 4.3 °C, and 4.3 °C, respectively. Considering operational costs and noise, since there was no significant increase in cooling efficiency, an air flow velocity above 15 m/s is not recommended.
3.
Effect of Cell Housing Materials:
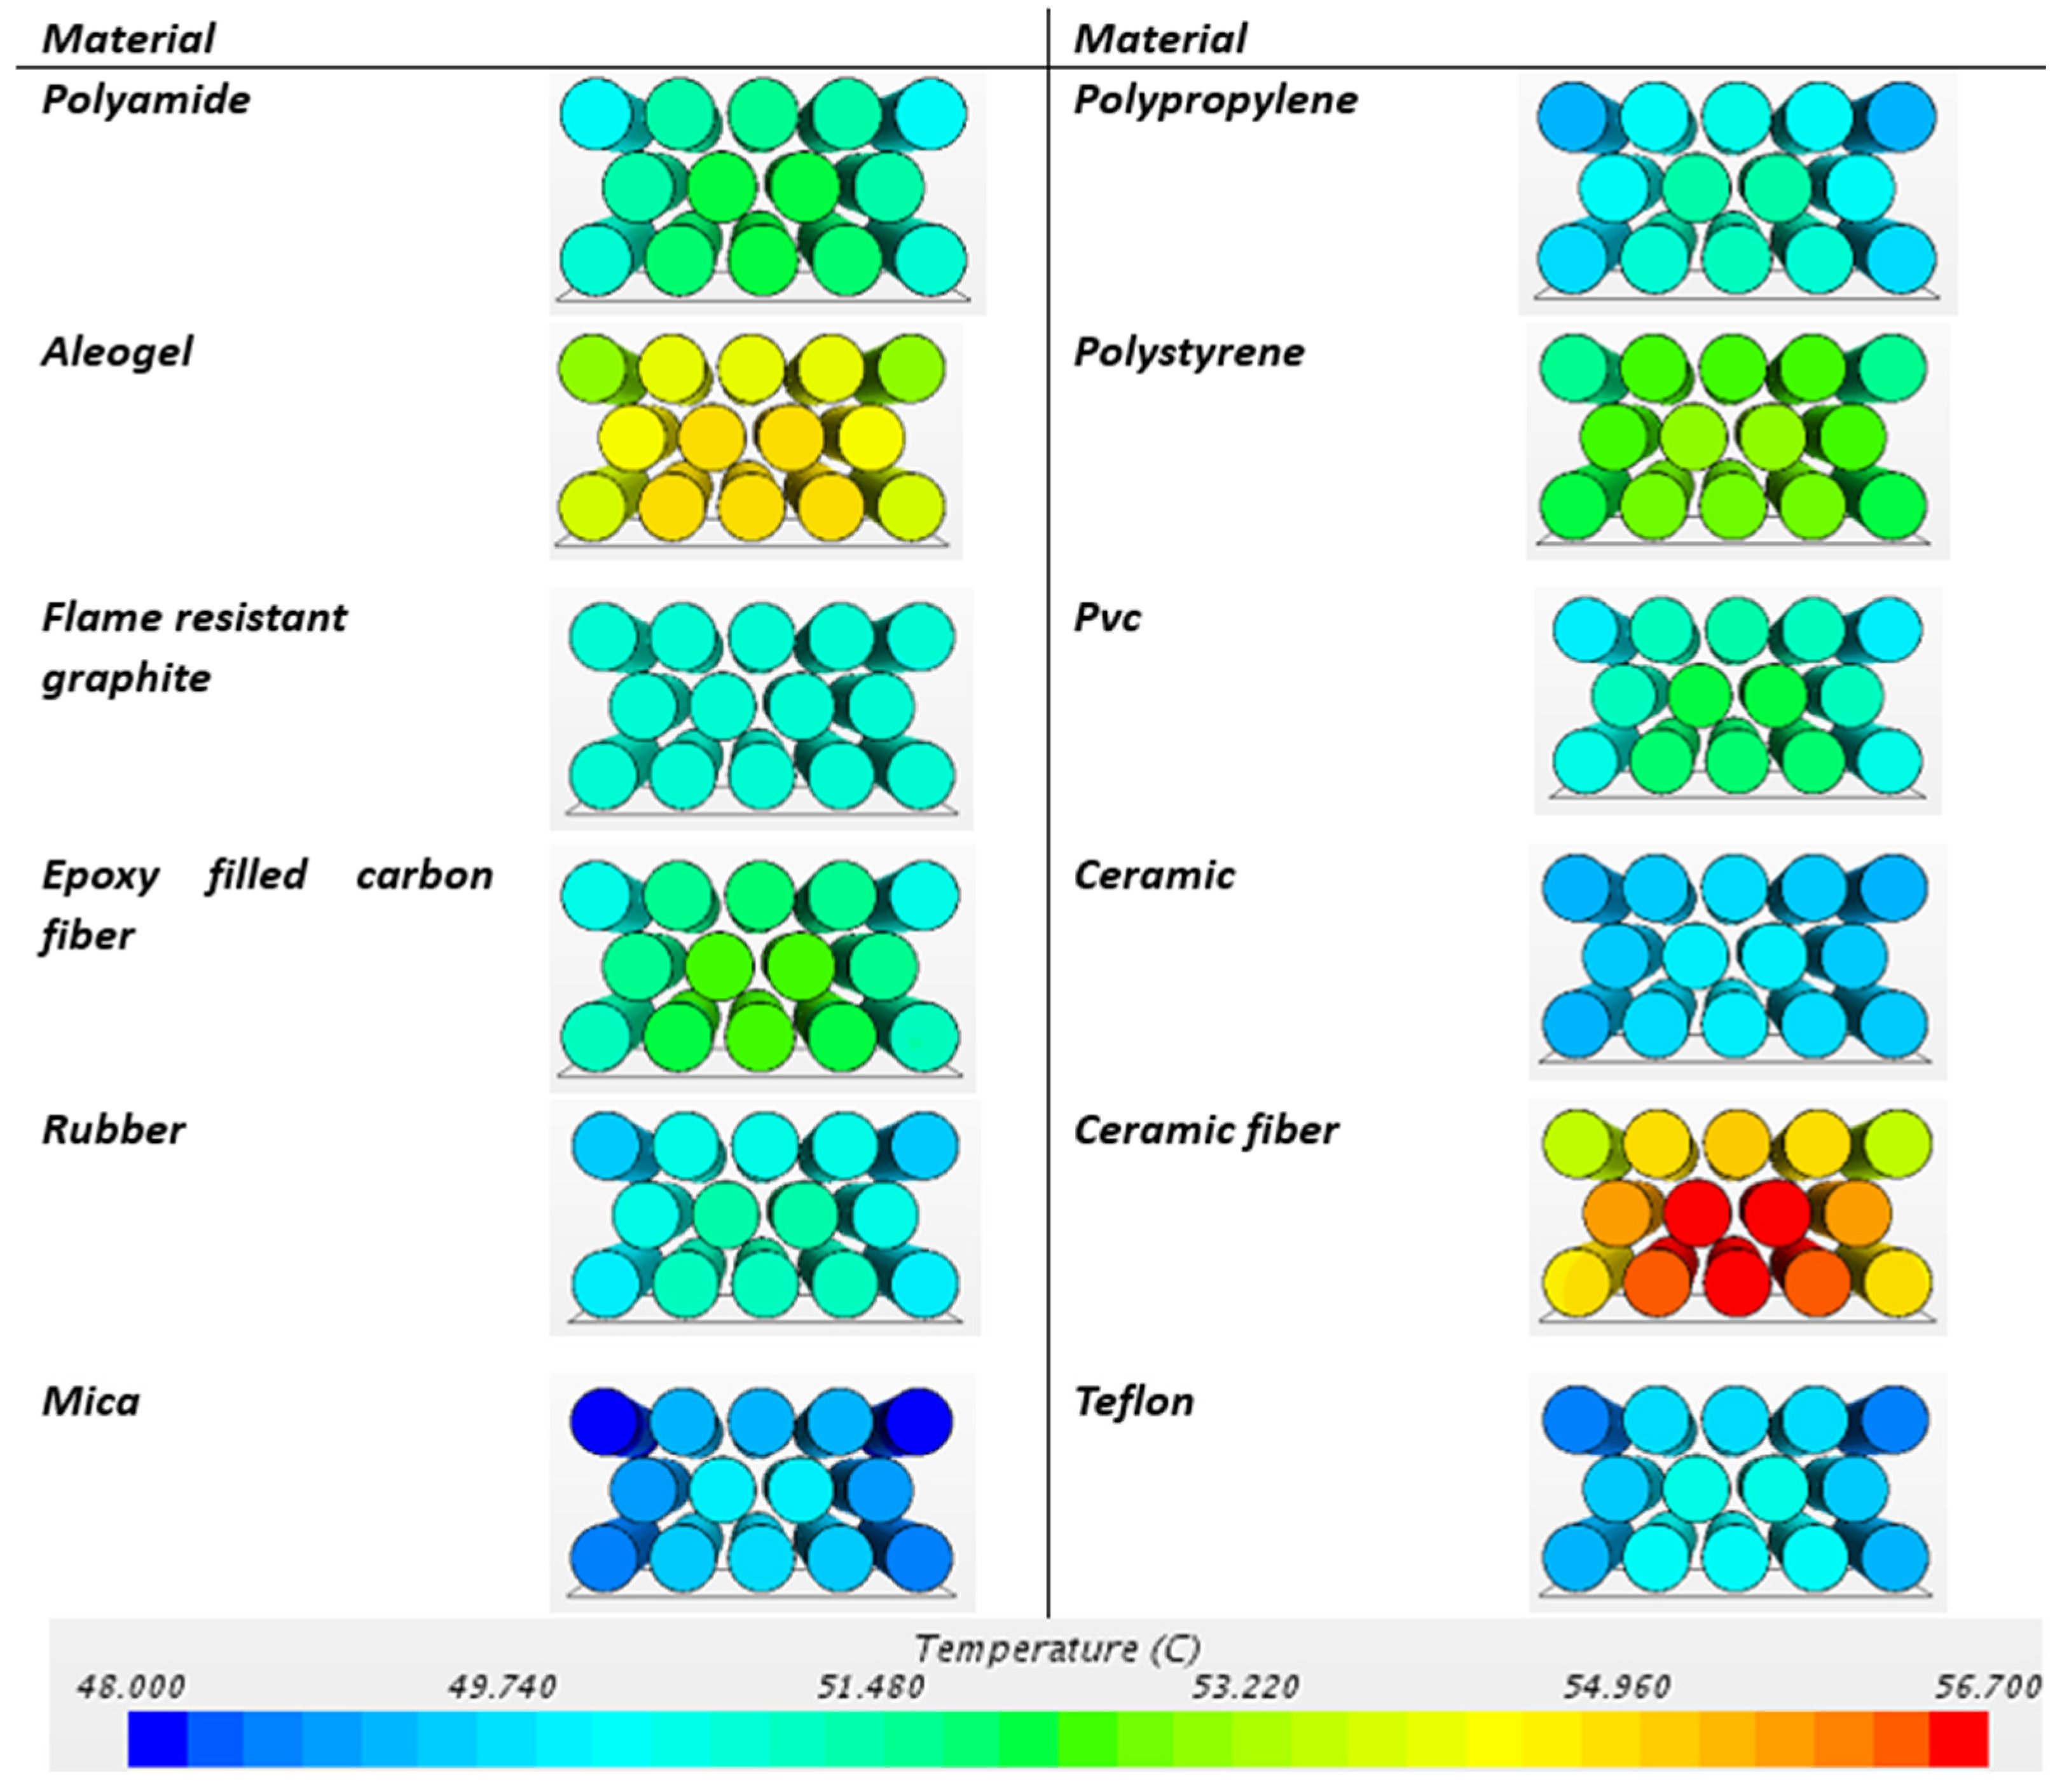
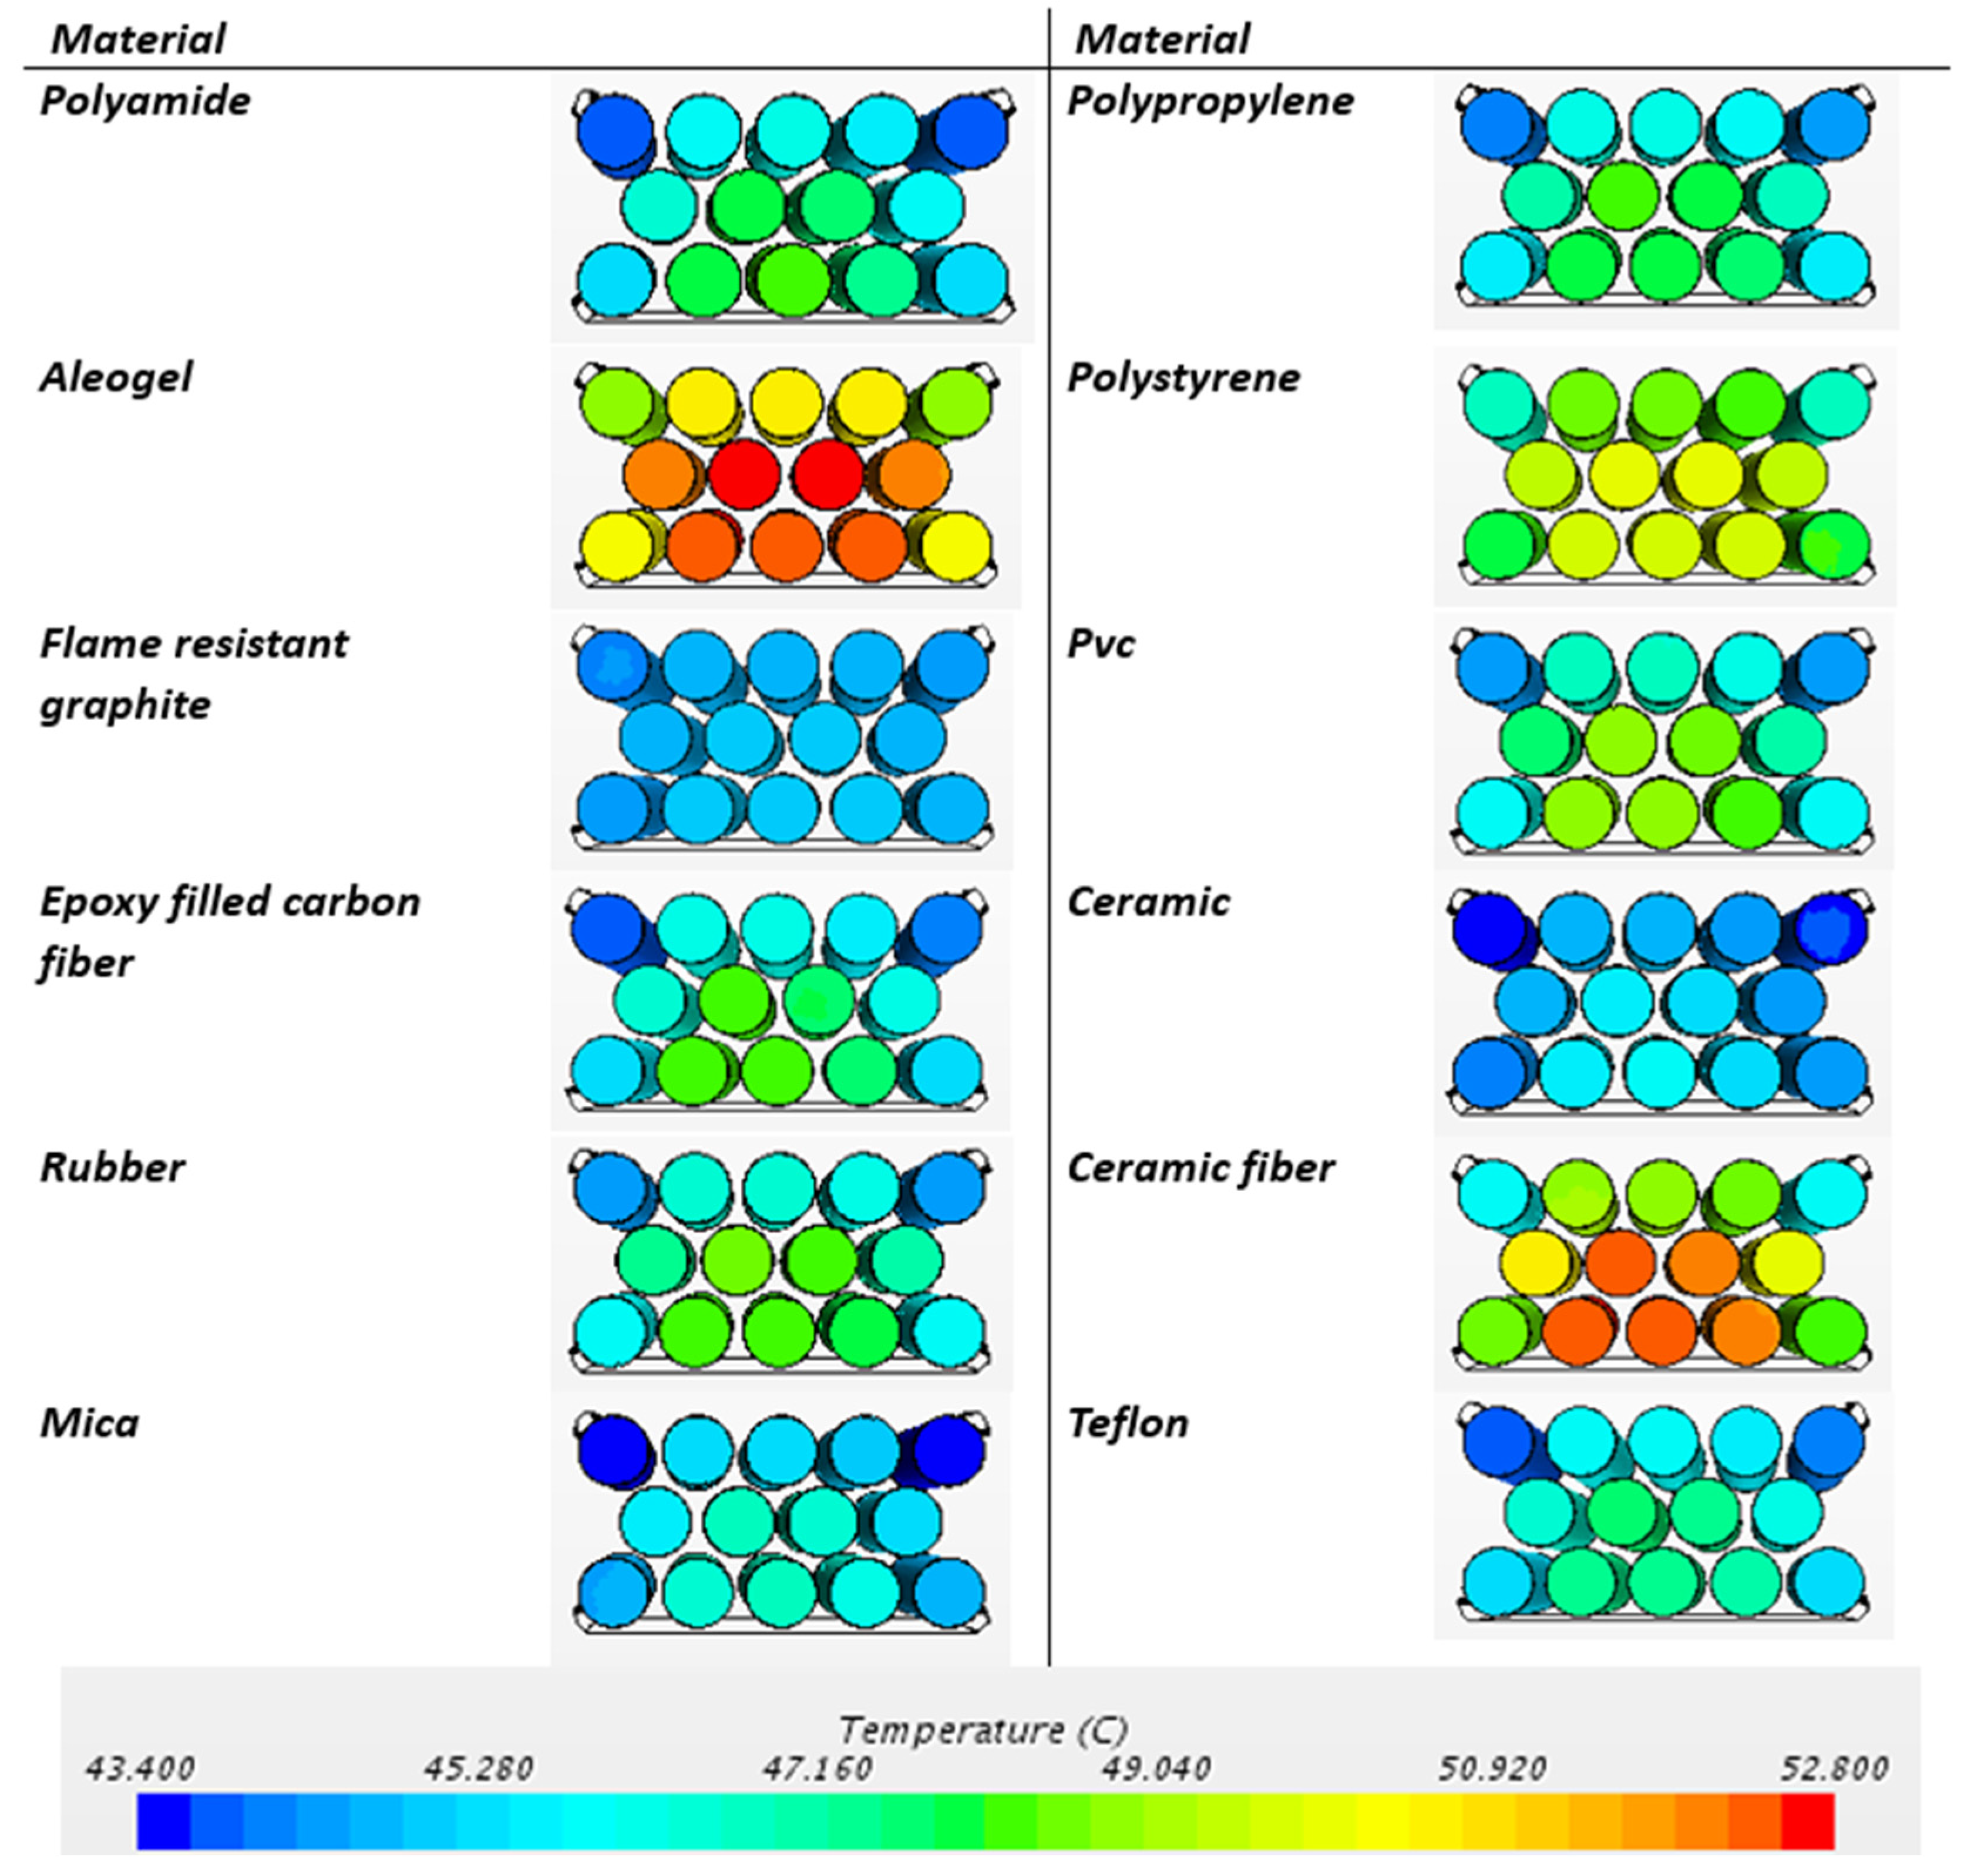
The thermophysical limits of the cell housing material play an important role in transferring the heat from the battery first to the cell housing and then to the cooling air. The effect of thermal resistance in the housing limits the cooling performance.
The use of alternative materials could yield and alternative solutions to overcome these limitations.
Among cell housings such as polyamide, aerogel, graphite composite, epoxy-filled carbon fiber, rubber, mica, polypropylene, polystyrene, PVC, ceramic, ceramic fiber, and Teflon, the ceramic and flame-resistant graphite composite materials increased the temperature homogeneity inside the battery and significantly reduced the temperature differences within the battery. When considering concerns about short circuit and thermal runaway safety, the electrically insulating and flame-resistant ceramic material is the most suitable module cell housing material in terms of battery safety and thermal management.
In conclusion, the cooling air flow velocity and the selection of the correct cell housing material are important factors that can effectively improve temperature control in battery thermal management. This study highlights the critical importance of the materials and cooling strategies used in battery design for the efficient and safe operation of batteries. Future research can focus on the development of more effective heat management strategies and next-generation insulating materials.

Author Contributions

Conceptualization, S.A., İ.H.S., U.E.S. and E.Ç.; Methodology, S.A. and U.E.S.; Software, S.A.; Validation, S.A., İ.H.S., K.S.Y. and U.E.S.; Formal analysis, S.A. and E.Ç.; Investigation, S.A. and U.E.S.; Resources, S.A.; Data curation, S.A.; Writing—original draft preparation, S.A.; Writing—review and editing, S.A., İ.H.S., K.S.Y. and E.Ç.; Visualization, S.A.; Supervision, İ.H.S., K.S.Y. and E.Ç.; Project administration, K.S.Y.; Funding acquisition, K.S.Y. and İ.H.S. All authors have read and agreed to the published version of the manuscript.

Funding

This work was supported by the 2244-Industry PhD Program, Project No. 118C121. The project was conducted in collaboration with Ford Otosan, focusing on thermal management and the safety of lithium-ion batteries.

Data Availability Statement

The raw data supporting the conclusions of this article will be made available by the authors upon request.

Acknowledgments

The authors would like to acknowledge the support of the 2244-TÜBİTAK Industrial PhD Program and Ford Otosan for funding this research. Special thanks are extended to Anko Energy for their valuable contributions and resources provided during the course of this study.

Conflicts of Interest

S.A. and İ.H.S. were employed by Ford Otosan İstanbul Plants. The remaining authors declare that the research was conducted in the absence of any commercial or financial relationships that could be construed as a potential conflict of interest.

Abbreviations

The following abbreviations are used in this manuscript:
TMSThermal management system
BTMSBattery thermal management system
PCMPhase change material

References

  1. Ghazal, M.; Akmal, M.; Iyanna, S.; Ghoudi, K. Smart plugs: Perceived usefulness and satisfaction: Evidence from United Arab Emirates. Renew. Sustain. Energy Rev. 2016, 55, 1248–1259. [Google Scholar] [CrossRef]
  2. Li, K.; Sun, C.; Zhang, M.; Wang, S.; Wei, B.; Cheng, Y.; Ju, X.; Xu, C. A Study of the Thermal Management and Discharge Strategies of Lithium-Ion Batteries in a Wide Temperature Range. Energies 2024, 17, 2319. [Google Scholar] [CrossRef]
  3. Worighi, I.; Maach, A.; Hafid, A.; Hegazy, O.; Mierlo, J.V. Integrating renewable energy in smart grid system: Architecture, virtualization and analysis. Sustain. Energy Grids Netw. 2019, 18, 100226. [Google Scholar] [CrossRef]
  4. Baroutaji, A.; Arjunan, A.; Ramadan, M.; Robinson, J.; Alaswad, A.; Abdelkareem, M.A.; Olabi, A.-G. Advancements and prospects of thermal management and waste heat recovery of PEMFC. Int. J. Thermofluids 2021, 9, 100064. [Google Scholar] [CrossRef]
  5. Allella, F.; Chiodo, E.; Giannuzzi, G.M.; Lauria, D.; Mottola, F. On-Line Estimation Assessment of Power Systems Inertia with High Penetration of Renewable Generatio. IEEE Access 2017, 8, 62689–62697. [Google Scholar] [CrossRef]
  6. Wang, J.; Lv, D.; Sha, H.; Lai, C.; Zeng, J.; Gao, T.; Yang, H.; Wu, H.; Jiang, Y. Numerical Investigation on the Thermal Performance of a Battery Pack by Adding Ribs in Cooling Channels. Energies 2024, 17, 4451. [Google Scholar] [CrossRef]
  7. Conte, F.; Giallongo, M.; Kaza, D.; Natrella, G.; Tachibana, R.; Tsuji, S.; Silvestro, F.; Vichi, G. Experimental Validation of Electrothermal and Aging Parameter Identification for Lithium-Ion Batteries. Energies 2024, 17, 2269. [Google Scholar] [CrossRef]
  8. Yang, H.; Yang, Z.; Gong, M.; Tang, K.; Shen, Y.; Zhang, D. Commercial operation mode of shared energy storage system considering power transaction satisfaction of renewable energy power plants. J. Energy Storage 2025, 105, 114738. [Google Scholar] [CrossRef]
  9. Khaboshan, H.N.; Jaliliantabar, F.; Abdullah, A.A.; Panchal, S. Improving the cooling performance of cylindrical lithium-ion battery using three passive methods in a battery thermal management system. Appl. Therm. Eng. 2023, 227, 120320. [Google Scholar] [CrossRef]
  10. Shahid, S.; Munib, M.; Uzair, M.; Alkhedher, M. Numerical Simulation of Lithium-ion battery aging mechanisms and charging-discharging cycle. In Proceedings of the 2021 12th International Renewable Engineering Conference (IREC), Amman, Jordan, 14–15 April 2021. [Google Scholar]
  11. Jaguemont, J.; Boulon, L.; Dubé, Y. A comprehensive review of lithium-ion batteries used in hybrid and electric vehicles at cold temperatures. Appl. Energy 2016, 164, 99–114. [Google Scholar] [CrossRef]
  12. Väyrynen, A.; Salminen, J. Lithium ion battery production. J. Chem. Thermodyn. 2012, 46, 80–85. [Google Scholar] [CrossRef]
  13. Ghalkhani, M.; Bahiraei, F.; Nazri, G.-A.; Saif, M. Electrochemical–Thermal Model of Pouch-Type Lithium-Ion Batteries. Electrochim. Acta 2017, 247, 569–587. [Google Scholar] [CrossRef]
  14. Xu, L.; Wang, S.; Xi, L.; Li, Y.; Gao, J. A Review of Thermal Management and Heat Transfer of Lithium-Ion Batteries. Energies 2024, 17, 3873. [Google Scholar] [CrossRef]
  15. Feng, H.; Song, D. A health indicator extraction based on surface temperature for lithium-ion batteries remaining useful life prediction. J. Energy Storage 2021, 34, 102118. [Google Scholar] [CrossRef]
  16. Quan, T.; Xia, Q.; Wei, X.; Zhu, Y. Recent Development of Thermal Insulating Materials for Li-Ion Batteries. Energies 2024, 17, 4412. [Google Scholar] [CrossRef]
  17. Mahmood, A.; Cockerill, T.; Boer, G.; Voss, J.; Thompson, H. Heat Transfer Modeling and Optimal Thermal Management of Electric Vehicle Battery Systems. Energies 2024, 17, 4575. [Google Scholar] [CrossRef]
  18. Hosseinzadeh, E.; Genieser, R.; Worwood, D.; Barai, A.; Marco, J.; Jennings, P. A systematic approach for electrochemical-thermal modelling of a large format lithium-ion battery for electric vehicle application. J. Power Sources 2018, 382, 77–94. [Google Scholar] [CrossRef]
  19. Khan, M.; Alkhedher, M.; Ramadan, M.; Ghaza, M. Hybrid PCM-based thermal management for lithium-ion batteries: Trends and challenges. J. Energy Storage 2023, 73, 108775. [Google Scholar] [CrossRef]
  20. Isfahani, M.S.; Gharehghani, A.; Saeedipour, S.; Rabiei, M. PCM/metal foam and microchannels hybrid thermal management system for cooling of Li-ion battery. J. Energy Storage 2023, 72, 108789. [Google Scholar] [CrossRef]
  21. Hwang, F.; Confrey, T.; Reidy, C.; Picovici, D.; Callaghan, D.; Culliton, D.; Nolan, C. Review of battery thermal management systems in electric vehicles. Renew. Sustain. Energy Rev 2024, 192, 114171. [Google Scholar] [CrossRef]
  22. Wu, W.; Wang, S.; Wu, W.; Chen, K.; Hong, S.; Lai, Y. A critical review of battery thermal performance and liquid based battery thermal management. Energy Convers. Manag. 2019, 182, 262–281. [Google Scholar] [CrossRef]
  23. Sahin, R.C.; Gocmen, S.; Çetkin, E. Thermal management system for air-cooled battery packs with flow-disturbing structures. J. Power Sources 2022, 551, 232214. [Google Scholar] [CrossRef]
  24. Aydin, S.; Yiğit, K.S.; Savci, İ.H. Survey of air battery thermal management on the autonomous mobile robots. Therm. Sci. 2023, 27, 3561–3577. [Google Scholar] [CrossRef]
  25. Jeon, H.; Hong, S.; Yun, J.; Han, J. Cooling Strategy Optimization of Cylindrical Lithium-Ion Battery Pack via Multi-Counter Cooling Channels. Energies 2023, 16, 7860. [Google Scholar] [CrossRef]
  26. Kalkan, O.; Celen, A.; Bakırcı, K. Experimental and numerical investigation of the LiFePO4 battery cooling by natural convection. J. Energy Storage 2021, 40, 102796. [Google Scholar] [CrossRef]
  27. Yu, X.; Lu, Z.; Wei, L.; Zhang, L.; Cui, X.; Jin, L. Experimental Study on Transient Thermal Characteristics of Stagger-Arranged Lithium-Ion. Int. J. Heat Mass Transf. 2019, 143, 118576. [Google Scholar] [CrossRef]
  28. Yang, T.; Yang, N.; Zhang, X.; Li, G. Investigation of the thermal performance of axial-flow air cooling for the lithium-ion battery pack. Int. J. Therm. Sci. 2016, 108, 132–144. [Google Scholar] [CrossRef]
  29. Li, X.; He, F.; Zhang, G.; Huang, Q.; Zhou, D. Experiment and Simulation for Pouch Battery with Silica Cooling Plates and Copper Mesh based air cooling thermal management system. Appl. Therm. Eng. 2019, 146, 866–880. [Google Scholar] [CrossRef]
  30. Gocmen, S.; Cetkin, E. Emergence of elevated battery positioning in air cooled battery packs for temperature uniformity in ultra-fast dis/charging applications. J. Energy Storage 2022, 45, 103516. [Google Scholar] [CrossRef]
  31. Akula, R.; Minnikanti, A.; Balaji, C. Pin fin-PCM composite heat sink solution for thermal management of cylindrical Li-ion battery. Appl. Therm. Eng. 2024, 248 Pt A, 123146. [Google Scholar] [CrossRef]
  32. Yan, J.; Li, K.; Chen, H.; Wang, Q.; Sun, J. Experimental study on the application of phase change material in the dynamic cycling of battery pack system. Energy Convers. Manag. 2016, 128, 12–19. [Google Scholar] [CrossRef]
  33. Gu, J.; Du, J.; Li, Y.; Li, J.; Chen, L.; Chai, Y.; Li, Y. Preparation and Characterization of n-Octadecane@SiO2/GO and n-Octadecane@SiO2/Ag Nanoencapsulated Phase Change Material for Immersion Cooling of Li-Ion Battery. Energies 2023, 16, 1498. [Google Scholar] [CrossRef]
  34. Wang, C.L.; Leong, J.C. Analysis of Thermal Management Strategies for 21700 Lithium-Ion Batteries Incorporating Phase Change Materials and Porous Copper Foam with Different Battery Orientations. Energies 2024, 17, 1553. [Google Scholar] [CrossRef]
  35. Huynh, V.T.; Chang, K.; Lee, S.W. Numerical Investigation of the Thermal Performance of a Hybrid Phase Change Material and Forced Air Cooling System for a Three-Cell Lithium-Ion Battery Module. Energies 2023, 16, 7967. [Google Scholar] [CrossRef]
  36. El-Haddad, L.A.; İbrahim, L.; El-Sessy, A.; Jaber, A.A.; El-Haddad, S.A.; Hüsrozadeh, R. Thermal heat flux distribution prediction in an electrical vehicle battery cell using finite element analysis and neural network. Green Energy Intell. Transp. 2024, 3, 100155. [Google Scholar] [CrossRef]
  37. Zhong, Q.; Gao, L.; Li, W.; Garg, A. Transfer learning based topology optimization of battery cooling channels design for improved thermal performance. Appl. Therm. Eng. 2025, 263, 125400. [Google Scholar] [CrossRef]
  38. ASPİLSAN INR18650A28. Available online: https://www.aspilsan.com/cozumler/uretimini-yaptigimiz-sarj-edilebilir-lityum-iyon-pil/inr18650a28/ (accessed on 1 February 2025).
Figure 1. Experimental setup; (a) Schematic representation of the module and thermocouple placement points; (b) Schematic representation of the test setup; (c) Visuals of the battery under different conditions: natural convection, cooling with Al plate contact, PCM cooling, and fan air convection from left to right, respectively; (d) Test equipment data logger, thermal camera, DC power supply and electronic load device from left to right, respectively.
Energies 18 01379 g001
Figure 2. Time-dependent temperature data of lithium-ion battery at 1–2C discharge rates. (a) Temperature measuring points with thermocouple; (b) Instantaneous time-dependent temperature data during discharge.
Energies 18 01379 g002
Figure 3. Fan air convection mesh validity analysis.
Energies 18 01379 g003
Figure 4. Forced air convection analysis geometry: (a) battery geometry, (b) analysis geometry.
Energies 18 01379 g004
Figure 5. Thermal camera images of the natural convection battery at the end of the discharge process: (a) 1C discharge rate, (b) 2C discharge rate.
Energies 18 01379 g005
Figure 6. Experimental test data showing the maximum temperature variation measured during the discharge process of the battery discharged at a 2C rate under different cooling methods.
Energies 18 01379 g006
Figure 7. Experimental and numerical temperature data for the natural air-cooled module at 1–2C discharge rates.
Energies 18 01379 g007
Figure 8. The temperature distribution of the natural air convection battery, discharged at a 2C discharge rate, depending on the cell housing material.
Energies 18 01379 g008
Figure 9. The temperature data of the battery, discharged at a 2C discharge rate, depending on the cooling air flow velocity.
Energies 18 01379 g009
Figure 10. The temperature distribution of the forced air convection battery (2.83 m3/min airflow), discharged at a 2C discharge rate, depending on the cell housing material.
Energies 18 01379 g010
Figure 11. Temperature distributions of batteries using ceramic and polyamide cell housings under natural and forced air convection conditions.
Energies 18 01379 g011
Figure 12. Temperature conditions of batteries using polyamide, ceramic, and flame-resistant graphite composite cell housings, depending on fan flow speed.
Energies 18 01379 g012
Table 1. Dimensional, thermophysical, and performance characteristics of the battery [38].
UnitValue
Cell dimensional properties;
Cell diametermm18 + 0.10/−0.20
Cell lengthmm65 ± 0.2
Cell Weightg44.5 ± 0.7
Cell chemistry;
AnodeGraphite
CathodeNiMnCo (NMC)
Cell thermo-physical specification;
Density k g / m 3 2746
Specific heat j / k g . K 1065.71
Thermal conductivity W / m . K 33
Cell performance specification;
Discharge capacitymA.h2800 (nominal)
mA.h2700 (minimum)
Nominal VoltageV3.65
Charge end voltageV4.2
Charge cut-off currentmA.h140
Discharge end voltageV2.5
Operation temperature °C 0/60 (charge)
−30/60 (discharge)
Table 2. Lithium-ion cell heat generation data.
Discharge RateTime (s)Temperature Rise (°C)Heat Generation (W)
1C3114140.2146
2C180931.60.834
Table 3. Simulation model and boundary conditions.
ParameterValue
Initial temperature24.5 °C
Ambient temperature23 °C
Wall heat fluxnone
Discharge rate1C, 2C
Turbulence modelk-ω turbulence model
Cell and air densityConstant density
Table 4. The experimental and analysis maximum temperature results of the without cooling and forced air convection batteries and percent error for 1–2C discharge rates.
Battery Maximum Cell Temperature
Natural ConvectionForced Air Convection
2C1C2C1C
Analysis52.3 °C38.7 °C48.42 °C34.44 °C
Test55.4 °C 39.9 °C46.1 °C33 °C
Percentage error5.6%3%5%4.4%
Table 5. Thermal condition of the module, discharged at a 2C discharge rate under the fan cooling (2.83 m3/min air flow rate) condition, depending on the cell housing material.
MaterialTmax (°C)Tmin (°C) T (°C)
Polyamide48.2843.8294.451
Aerogel52.72948.7254.004
Flame-resistant graphite45.04744.2680.779
Epoxy-filled carbon fiber48.46143.8864.575
Rubber48.54744.2934.254
Mica46.95143.4013.55
Polypropylene48.36944.1784.191
Polystyrene50.10346.7763.327
PVC49.05144.3424.709
Ceramic45.83843.5062.332
Ceramic fiber52.62845.8126.816
Teflon47.67743.8773.8
Disclaimer/Publisher’s Note: The statements, opinions and data contained in all publications are solely those of the individual author(s) and contributor(s) and not of MDPI and/or the editor(s). MDPI and/or the editor(s) disclaim responsibility for any injury to people or property resulting from any ideas, methods, instructions or products referred to in the content.

