Abstract
Water photoelectrolysis cells based on photoelectrochemical water splitting seem to be an interesting alternative to other traditional green hydrogen generation processes (e.g., water electrolysis). Unfortunately, the practical application of this technology is currently hindered by several difficulties: low solar-to-hydrogen (STH) efficiency, expensive electrode materials, etc. A novel concept, based on a tandem photoelectrolysis cell configuration with an anion-conducting membrane separating the photoanode from the photocathode, has already been proposed in the literature. This approach allows the use of low-cost metal oxide electrodes and nickel-based co-catalysts. In this paper, we conducted a study to evaluate the economic and environmental sustainability of this technology, using the environmental life cycle cost. Preliminary results have revealed two main interesting aspects: the negligible percentage of externalities in the total cost (<0.15%), which means a positive environmental impact, and as evidenced by the net present value (NPV), there are potentially financial conditions that favour future investment. In fact, an NPV higher than 150,000 EUR can be achieved after 15 years.
1. Introduction
The current energy landscape is characterised by a growing recognition of the urgency of transitioning to a more sustainable, low-carbon future. While fossil fuels continue to dominate the field of global energy production, their negative impact on the environment is becoming more and more apparent.
Increased concentrations of carbon dioxide and other greenhouse gases in the atmosphere are exacerbating the effects of climate change. The warmer climate has led to rising sea levels due to the melting of glaciers and polar ice caps. This has also led to more frequent severe heatwaves and changes in precipitation patterns and has changed ecosystems worldwide. Add to this the fact that the finite resource of fossil fuels is being depleted at an alarming rate. With the increasing demand for energy in the 21st century, resource depletion is one of the most critical threats to energy supply and security [1].
In this context, the Paris Agreement, signed by 194 countries and the EU, aims to halt the depletion of natural resources and limit global warming to below 2 °C, while continuing to strive to limit it to 1.5 °C to avoid the catastrophic consequences of climate change. All these concerns have highlighted the need to reduce greenhouse gas emissions and explore alternative energy sources. In this context, hydrogen has emerged as a promising clean and sustainable energy source with the potential to address environmental challenges. Thus, the concept of the hydrogen economy has gained considerable attention as a viable solution.
In its Global Hydrogen Review 2023 [2], the IEA provides some data and insights on production volumes and their distribution across different production systems. The world hydrogen production in 2022 was about 95 million tonnes, including related products such as ammonia and methanol. Nearly 16% of global hydrogen is produced as a by-product of oil refining. About 21% is produced by coal gasification, the most energy and emission-intensive production method. Instead, about 62% is produced from natural gas using methane reforming [2]. Carbon Capture, Utilisation and Storage (CCUS) provides a means of eliminating greenhouse gas emissions from methane reforming. This type of hydrogen, commonly referred to as blue hydrogen, accounts for less than 1 per cent of total production [2]. Green hydrogen is commonly produced by electrolysis, using electricity generated from renewable sources. In 2022, electrolysis accounted for 0.1% of global hydrogen production [2].
In this framework, one of the most promising technologies in green hydrogen production is water photoelectrolysis cells based on photoelectrochemical water splitting. This technology has been identified as an interesting alternative to other traditional green hydrogen production processes (e.g., water electrolysis).
This paper reports the results of an economic–financial–environmental analysis of this innovative technology using an environmental life cycle cost (ELCC) approach [3,4]. The use of this specific life cycle methodology allowed us to assess both the internal costs (i.e., those directly related to the product and its production) and the costs of any externalities, such as the level of carbon footprint over the life cycle of the investigated photoelectrolysis cell [4]. This cell for the production of green hydrogen has been developed within the RdS (Ricerca di Sistema Elettrico Nazionale) project in the framework of the Three-Year Implementation Plan 2022–2024, funded by the Italian Ministry for the Environment and Energy Security. Specifically, the analysis was carried out on a laboratory prototype cell of 10 cm2 and scaled up to a commercial-sized cell of 80 cm2. We assumed that the amount and cost of materials required for the commercial-sized cell can be linearly scaled from those of the laboratory prototype. On the contrary, we directly estimated the energy consumptions (kWh) and other costs (CAPEX, labour, energy) for the 80 cm2 cell.
As concerns the internal costs, both CAPEX (capital investment for the purchase of equipment) and OPEX (operating and maintenance costs) were calculated. In particular, based on an approach already used in the literature [5], the Net Present Value (NPV) was calculated to assess the economic viability of the investment, taking into account discounted costs and revenues. For an economic evaluation of the cost of the externalities, and thus the monetisation of the environmental impacts, we referred to the calculation methods of the Intergovernmental Panel on Climate Change (IPCC) through the “Eco-Cost/Value Ratio” (EVR) [6] and “Environmental Price” (EP) of emissions [7], using the IDEMAT (Industrial Design and Engineering MATerials) 2023 database [8].
The article offers a novel contribution to the field of photoelectrochemical hydrogen production by addressing both economic and environmental aspects, a topic still unexplored in the literature (as confirmed by the survey presented in Section 4). By integrating these two dimensions, it provides a more holistic understanding of the investigated technology. In addition, since the technology is still in its early stage (low TRL), the approach represents an unusual and ambitious effort, in contrast to the typical focus on well-established, large-scale technologies that dominate current research. The authors created a design for a production process that currently does not exist, to estimate production time, energy consumption and equipment required. The results provide valuable information and useful insights for future research aimed at developing this technology.
This work aims to find out the environmental impact and net present value of the investigated technology, currently at a development stage, to assess its feasibility.
The publication is structured as follows. After this introduction, Section 2 describes the key role of hydrogen in energy transition and the perspective of hydrogen economy. Section 3 presents the technology of photoelectrolysis, providing some details on the working principle, structural characteristics, and market prospects. Section 4 present a literature review of photoelectrolysis studies in economic and environmental terms. Section 5 describes the methodology used to calculate the ELCC of this technology. The results of this study, the environmental impacts and the economic returns are discussed in Section 6. Finally, based on the main findings, some conclusions are drawn in Section 7.
2. The Green Hydrogen Economy
Green hydrogen production costs have fallen in recent years due to falling renewable energy costs, increased electrolyser conversion efficiency and reduced electrolyser capital costs. These trends, together with the rising political costs of greenhouse gas emissions, have led some researchers to predict that green hydrogen will be cost-competitive with blue hydrogen in some countries by the end of this decade. Others, however, predict that by 2030 green hydrogen will be cheaper than blue hydrogen everywhere, even in countries with cheap natural gas.
Due to its versatility and cross-sector applicability, hydrogen energy has gained significant importance in recent years, not only for decarbonising the energy system but also for improving energy security. This has brought hydrogen into the political spotlight, particularly following the natural gas supply shock caused by the Russian invasion of Ukraine in 2022 [9,10].
Recognising the benefits associated with the transition to a hydrogen economy, an increasing number of countries have adopted national hydrogen policies, strategies and roadmaps [11]. It is important to note the increasing trend over the last few years. In 2019, only France, Japan and Korea had hydrogen strategies. The figures changed in 2020, when 17 governments published hydrogen strategies, and more than 20 governments publicly announced that they were working on developing strategies [12]. By 2021, the number of strategies had reached 26 [13].
These outline national approaches to the hydrogen economy, including target sectors, research and innovation areas, funding schemes and projections for future market penetration. These strategies take into account the factors that hinder the widespread use of hydrogen. They include the high cost of hydrogen production, the development of hydrogen storage and distribution infrastructure, and the need for advances in fuel cell technology. Overcoming these challenges requires continued research, development, and investment to drive down costs, improve efficiency, and expand the hydrogen infrastructure. All these aspects are taken into account in these documents, to accelerate the process of diffusion and use of hydrogen and its technologies. For example, the plans of the world’s four largest economies (USA, China, the EU, and Japan) show the different types of commitments and targets both in terms of funding and incentives for their production.
The US government has provided funding over the years to support the production and industrialisation of hydrogen. This has led to the production of around ten million tonnes of hydrogen per year. But in the USA, over 95 per cent of hydrogen being produced is using steam methane reforming without carbon capture. To reduce greenhouse gas emissions and support green hydrogen, the Biden administration has launched the “H2Hubs funding programme” [14,15]. This plan provides USD 7 billion to re-launch the green hydrogen economy in the US, to establish regional/local green hydrogen hubs. In 2023, construction began on five different plants designed to produce green hydrogen. Two of them are in Louisiana and one will have a production capacity of 15 tonnes of hydrogen per day [16]. Another one in Illinois, built close to a PV plant, will produce 52 tons of hydrogen annually and will be able to store 400 kg of hydrogen. A real hurdle to the development of the US hydrogen economy, however, is the distribution system, where little investment has been made to build adequate infrastructures. Currently, hydrogen is distributed in the United States through a small number of pipelines, liquefied hydrogen tanks, or high-pressure tanks [16]. To overcome this structural problem, it will therefore be necessary to build pipelines in the vicinity of the larger hydrogen distribution centres [17].
China is the world leader in hydrogen production, reaching around 34 Mt in 2021, 30% of the world’s total [18]. However, this production is currently emission-intensive, as 80.3% is produced from fossil fuels, 18.5% from industrial by-production and 1.2% from electrolysis (of this, less than 0.1% is from electrolysis powered by renewable energy sources). However, China is increasingly exploring the production and consumption of lower-emission hydrogen to help meet energy needs and drive industrial development while addressing climate concerns. In particular, China’s 2020 carbon neutrality commitment is an important policy-driven development that could support a shift in hydrogen production from fossil fuels to renewables, greater deployment of FCVs (Fuel Cell Vehicles) and the use of hydrogen in harder-to-abate sectors. The China Hydrogen Alliance, a government-backed industry group launched in 2018, forecasts that China’s hydrogen demand will reach 35 Mt in 2030 (at least 5 per cent of China’s energy supply) and 60 Mt in 2050 (10 per cent). The same organisation has launched the Renewable Hydrogen 100 initiative [18], which aims to increase the installed capacity of electrolysers to 100 Gigawatts by 2030, resulting in a green hydrogen production capacity of around 7.7 million tonnes per year, to reach 100 Mt of renewable hydrogen production by 2060, accounting for 20 per cent of the country’s final energy consumption.
As far as the European Union is concerned, the war in Ukraine has led to renewable hydrogen taking on a greater importance and role in Europe. As Russia is the second largest producer of natural gas and mainly supplies most hydrogen production plants, the EU has started to focus on renewable hydrogen production. In REPowerEU [19], the EU aims to accelerate the uptake of renewable hydrogen considering it a key element to replace natural gas, coal, and oil in hard-to-decarbonise industries and transport. The plan aims to achieve a production of ten million tonnes of renewable hydrogen by 2030. In addition, a similar amount should be imported to reach the “net zero” target. All this to reduce emissions by 55% compared to 1990 levels. To achieve this target, the EU intends to focus its efforts on developing a hydrogen infrastructure to produce, import, and transport 20 million tonnes of hydrogen by 2030. The total investment needs for the main categories of hydrogen infrastructure are estimated at EUR 28–38 billion for intra-EU pipelines and EUR 6–11 billion for storage. To facilitate the import of up to 10 million tonnes of renewable hydrogen, the European Commission will support the development of three major hydrogen import corridors via the Mediterranean, the North Sea, and, when conditions allow, Ukraine.
Japan has taken a leading position internationally. In 2017, it was one of the first countries to formulate a strategy, the Basic Hydrogen Strategy, to promote the development of hydrogen-related technologies.
According to a report published by the European Patent Office and the International Energy Agency [20], Japan has 24% of the world’s hydrogen-related patent applications from 2011 to 2020, putting it in first place. Japan is, therefore, at the forefront of hydrogen innovation, with a technological edge in the development and application of new technologies. In June 2023, the Japanese government revised its Basic Hydrogen Strategy [21] and identified nine key technologies, including fuel cells and water electrolysers, and decided to invest more than USD 98.8 billion over the next 15 years. It also aims to increase the use of hydrogen to 12 million tonnes per year by 2040. In this context, the Tokyo Metropolitan Government has decided to invest USD 134 million in 2024 to increase hydrogen-related projects. These funds will be used to support the deployment of fuel-cell commercial vehicles, such as trucks and buses, which are seen as the most promising applications for hydrogen. At the same time, it aims to build large-scale hydrogen refuelling stations and establish facilities to produce and supply green hydrogen using renewable energy sources [22].
As we have seen, the plans or roadmaps to the hydrogen economy, of which we have only mentioned some, entail important changes that could radically transform many sectors, such as transport, industry, and energy production, reshaping the way we approach and consume energy. However, some challenges remain to be addressed in the transition to a hydrogen economy. These include developing cost-effective and efficient hydrogen production methods, building an extensive hydrogen storage, transport, and distribution infrastructure, and the need for supportive policies and regulations to encourage market growth and investment in hydrogen technologies.
In relation to these challenges, some researchers have stated that the rapidly improving technology and falling costs of electrolysis [23,24], together with increased government funding, could lead to the rapid overcoming of some barriers.
Regarding the last aspect, IRENA [25] identifies some factors that governments can consider in order to create a hydrogen market. One of these is certification to enable the tracking of renewable hydrogen, to demonstrate to customers the lower emissions from its production, and to differentiate it from other carbon-intensive hydrogen. IRENA points out that all ongoing initiatives aim to develop a certification scheme, but most of these focus on the production step and greenhouse gas emissions, but to make them suitable for hydrogen trading, the (re)conversion process and transport need to be covered as well. Incentives to reduce production costs are also relevant, including direct financial support in the form of grants or loans, tax incentives, or measures to address the high share of electricity costs, such as feed-in tariffs and exemptions from grid fees. It can also be seen that some researchers and experts, considering the diffusion and adoption process of hydrogen technologies, consider the sociological analysis and evaluation of certain aspects related to social acceptance, safety, accessibility and end-user perceptions as a key contribution to the full realisation of a hydrogen economy [26,27].
The authors believe, as already expressed in previous papers [28,29], that all these elements are fundamental, because in parallel with the techno-economic feasibility, it is necessary to understand the socio-technical factors at different scales of the hydrogen economy. Future strategies should therefore take into account the interactions between policy, techno-economic, technical, market and social dimensions in order to accelerate the development and deployment of hydrogen technologies with maximum net benefits for society and the environment.
3. The Photoelectrolysis Technology
The solar splitting of water is an artificial version of natural photosynthesis, which sustains all life on Earth. The idea of directly using solar energy for splitting water into gaseous H2, and O2 has therefore captured the imagination of electrochemists [30], as a biologically inspired means of producing clean-burning and sustainable H2 fuel for powering society. The first studies on photoelectrochemical cells (PECs) for H2 production date from the early 1970s [31], but no commercialisation of this technology has emerged yet, despite continuous research efforts. The main obstacles to commercialisation are low solar-to-hydrogen (STH) efficiency [32], expensive electrode materials [33], use of liquid electrolytes [34], and fast degradation of cells [35], as well as difficulties in separating H2 from H2O vapour in the output stream [36].
The best conversion efficiencies (Solar to Hydrogen Efficiency) reported have reached values of 2–3% [37]. Significant efforts are invested to optimise the band structure, improve charge carrier separation, match band positions with H2O redox couples, and select the most appropriate electrolytes [38]. Alkaline media favour the Oxygen Evolution Reaction whereas the Hydrogen Evolution Reaction is slightly favoured in acidic media where most narrow band gap semiconductors are unstable. Corrosion issues represent a critical problem, and there are no relevant reports dealing with the extensive operation of photoelectrolysis cells [39]. Some reports use neutral (buffered) solutions to mitigate corrosion, which can cause a series of resistance issues in practical devices [40].
Most of the experiments reported in the literature for assessing the electrochemical performances (I-V curves) are carried out in close-to-neutral sulphate and phosphate-buffered solutions [41]. These conditions appear far from practical applications and can provide results of limited interest for photoelectrolysis cells [42]. The (cost-effective) semiconductor materials currently investigated for PEC water splitting are metal oxides [43] and sulphides, such as Fe2O3, TiO2, CuO, CuS, and BiVO4 [44]. Not many efforts are addressed to combine promising materials with appropriate cell design and polymer electrolytes. In the same way, there has been much less investigation on prototyping photoelectrolysis systems and integrating appropriate materials into an advanced and reliable cell concept [45].
A novel concept consists of a tandem photoelectrolysis cell architecture with an anion-conducting membrane separating the photoanode from the photocathode, allowing the use of low-cost metal oxide electrodes (Fe2O3 and CuO) and nickel-based co-catalysts [46].
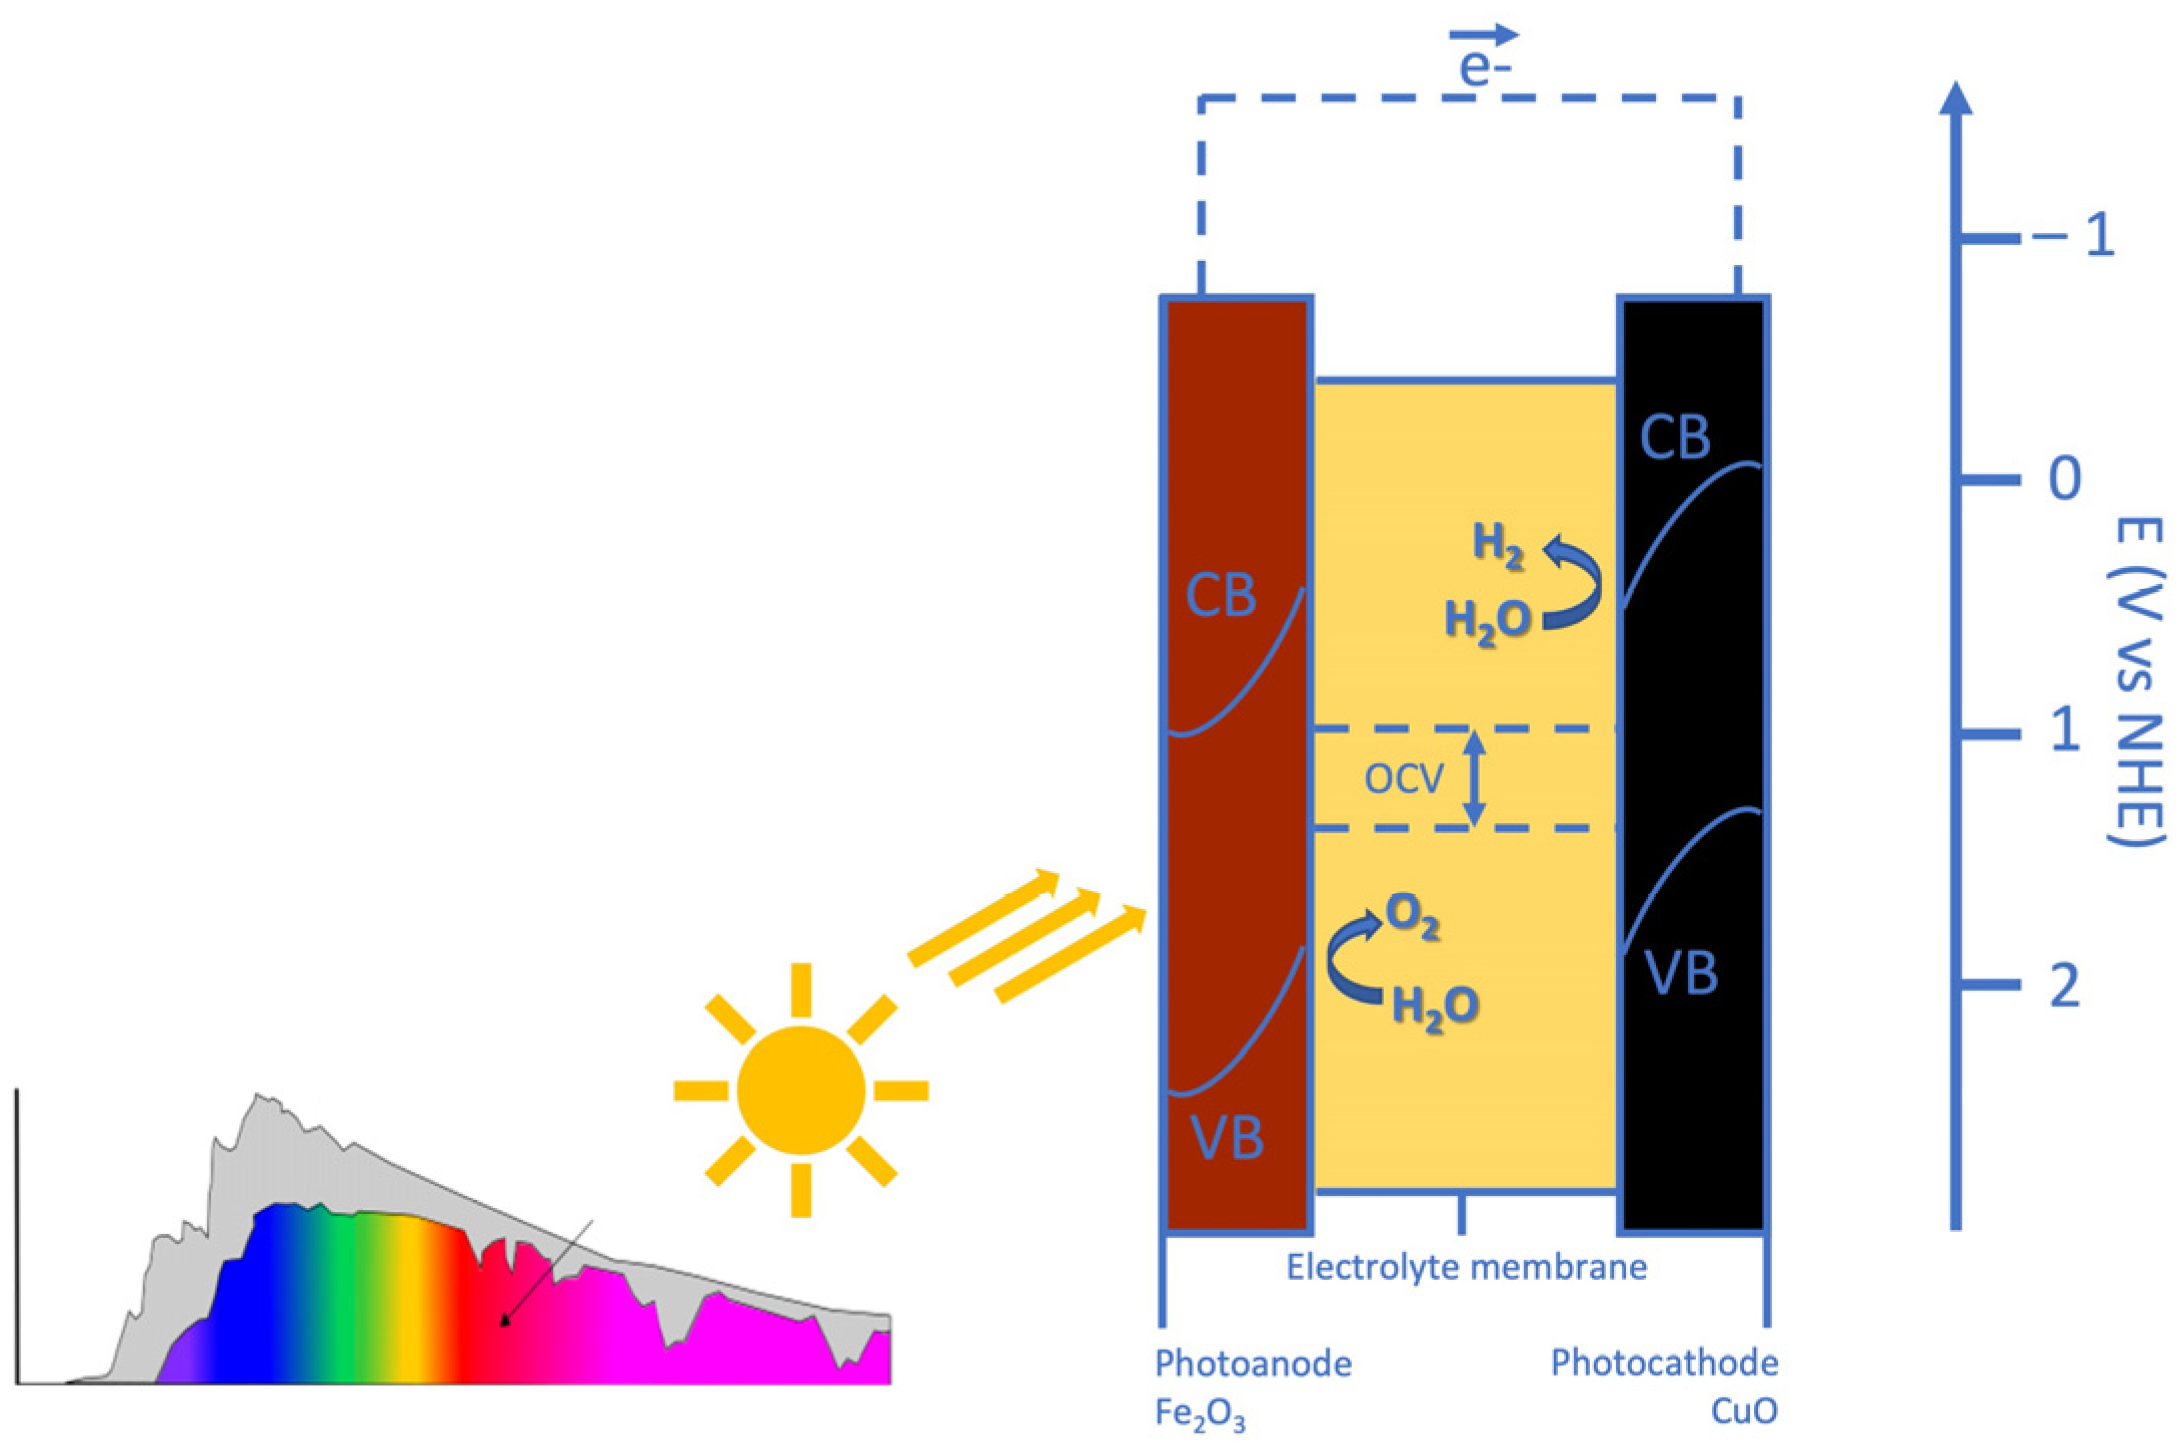
The working principle of PEC is reported in Figure 1. Incoming light generates electron-hole pairs in both the anode and the cathode. In the Fe2O3-based photoanode, band edge bending drives photo-generated holes towards the electrolyte and the edge of its valence band (VB) is at a sufficiently high potential for triggering the evolution of oxygen from water. In the CuO-based photocathode, band edge bending drives photo-generated electrons towards the electrolyte and the edge of its conduction band (CB) is at a sufficiently low potential for the evolution of hydrogen from water. The maximum OCV represents the separation between the photocathode VB edge and the photoanode CB edge. It is designed to fulfil the thermodynamic requirement that the potential corresponding to the VB edge of the photocathode is more positive than that of the photoanode CB edge. The shift in the semiconductor band levels from the reversible potentials represents the reaction overpotentials [47].

Figure 1.
The working principle of the developed photoelectrochemical cell.
In the tandem cell developed architecture, all photons with energy above the narrower band gap, which should have a value close to 1 eV (1.25 eV for CuO) can contribute to the water-splitting process. The wide bandgap oxide should possess a band gap in the range of 1.65 to 2.0 eV [48]. The band gaps of Fe2O3 and CuO are adequate for capturing most of the solar spectrum; in fact, about 75% of the incoming light energy consists of utilisable-over-bandgap photons [49].
A crucial criticality of this technology is the scalability of the materials [50]. Phenomena such as electron–hole recombination can become more significant [51], potentially reducing system efficiency [52].
Given the technical challenges and promising architectural solutions outlined above, it is therefore crucial to evaluate not only the operational efficiency of tandem photoelectrolysis technology based on the Fe2O3/CuO semiconductors (a photoelectrolysis cell with an active area of 80 cm2 achieves a hydrogen production rate of approximately 1.33 cc h−1 cm2) but also its environmental and economic impacts over its entire life cycle, as illustrated in the following sections.
4. Literature Review
We carried out an analysis of photoelectrolysis studies in economic and environmental terms found in the scientific literature. The analysis was conducted in February 2025 using the SCOPUS database. The search was made within the default search field “Article Title, Abstract, Keywords”.
The keywords used for the search were “water photoelectrolysis” in combination with “economic analysis” and/or “environmental analysis”. To capture the maximum number of relevant papers, we also included some possible acronyms, synonyms, and variant of the mentioned terms (i.e., “photoelectrochemical water splitting”; “cost analysis” or “economic evaluation” or “economic assessment” or “economic impact” or “financial analysis” or “life cycle analysis” or “LCC”; “environmental evaluation” or “environmental assessment” or “environmental impact” or “environmental life cycle cost” or “ELCC”). The results obtained were the following:
- No documents when both “economic analysis” and “environmental analysis” were included in the search;
- Six documents when limiting the search to “economic analysis”;
- Fourteen documents when limiting the search to “environmental analysis”.
4.1. Review of the “Economic Analysis” Studies
By examining the six papers resulting from the “economic analysis” search, the following considerations can be made. Liu et al. [53] provided a brief review of photoelectrochemical reaction fundamentals and a reactant–product cost analysis of organic upgrading reactions, without using NPV or ELCC. Obata et al. [54] proposed the in situ use of photoelectrochemically generated H2 for the homogeneous hydrogenation of itaconic acid—a biomass-derived feedstock—to methyl succinic acid. They considered a technology different from the one we propose in this paper. Wenderich et al. [55] analysed a photoelectrochemical water splitting technology with a very high degree of STH efficiency, based on assumptions different from ours. Additionally, the technology produces a different output, namely H2O2. Gaillard and Deangelis [56] conducted economic considerations of large-scale plants with an important premise that differentiates it from our study: “It is important to keep in mind that these techno-economic studies are not cost prediction tools”. Frowijn and Van Sark [57] and Pinaud et al. [58] studied large-scale plants with a daily production of 1 ton of H2. Despite the very low TRL level of the technology, they calculated the levelized cost of hydrogen (LCOH), based on assumptions different from ours. However, the environmental cost calculation was not performed; instead, based on existing literature analyses, the carbon footprint was reported.
4.2. Review of the “Environmental Analysis” Studies
By examining the fourteen papers retrieved from the “environmental analysis” search, the following considerations can be drawn.
It can be confirmed that none of them use the ELCC method.
Mandal et al. [59] and Karaca and Dincer [60] studied a hydrogen production system different from ours. Specifically, they analysed photoelectrochemical systems incorporating PEM (proton exchange membrane) and alkaline electrolysers in terms of efficiency, cost-effectiveness, and durability. Jeje et al. [61] and Percy and Edwin [62] carried out only an environmental analysis of various hydrogen technologies, providing a review to assess the environmental impacts through an LCA study taken from the literature. Abdalla et al. [63] provided just an introduction to the techno-economic analysis and environmental issues of hydrogen production technologies, without carrying out a real environmental analysis. Qureshi and Tahir [64] and Vilanova et al. [65] presented the most comprehensive environmental analyses, including an LCA analysis, but used literature data. They also carried out an economic analysis through LCOH. However, both papers evaluated the technology rather than the production process. The remaining seven papers refer to materials different from those we use. Specifically, Ghosh et al. [66], Khan et al. [67], and Scharnberg et al. [68] considered the use of Bi-based materials. Cogal and Oksuz’s [69] study is based on 2D transition metal dichalcogenide. Akhter et al. [70] analysed only advanced graphene-based materials. Sharma P.K. et al. [71] studied the photoelectrochemical response of materials fabricated through electrochemical anodisation and surface engineering with sub-nanometre Cu clusters to enhance photoelectrochemical performance. Sharma R. et al. [72] examined a novel phosphorus nitrogen-doped carbon material,
4.3. Conclusion on the Literature Review
The literature review indicates that no article performed an economic–environmental analysis using the ELCC method and NPV calculation.
Our study differs from those previously analysed in two key aspects: (i) combined use of economic, environmental, and financial analysis, thanks to the ELCC method and NPV calculation; and (ii) aim of the analysis. The aim of our study is to assess and quantify the economic and environmental impacts and the economic feasibility of the production of a photoelectrolysis cell, considering all its components. The low TRL and low efficiency of the technology would not provide a reliable result in terms of LCOH.
5. Methodology
In this section, we provide the details of the methodology adopted in our study, both for environmental and economic analysis.
5.1. Environmental Analysis
To analyse the internal costs over the life cycle of the photoelectrolysis technology and to verify the environmental costs we used the environmental life cycle cost (ELCC) approach, as already performed in the literature for similar technologies [73,74].
LCC is the economic pillar of a life cycle sustainability assessment that includes the environmental, economic and social dimensions [75]. It can be used in different types of analysis to support decision-making. The main classification is that of the Society of Environmental Toxicology and Chemistry (SETAC), developed by Ciroth et al. [3]. They classified LCC into conventional life cycle cost (CLCC), environmental life cycle cost (ELCC), and social life cycle cost (SLCC). Specifically, ELCC is an extension of CLCC; it includes not only financial costs but also an environmental assessment that accounts for the costs of externalities that can be monetised (e.g., GHG emissions).
Based on Hunkeler et al. [3], ELCC is “an assessment of all costs associated with the life cycle of a product that are directly covered by any one or more of the actors in the product life cycle with complementary inclusion of externalities that are anticipated to be internalised in the decision-relevant future”.
By definition, an externality is a transaction between two economic agents that affects at least one non-participant (i.e., a third party) without any transfer of money [76]. In the environmental context, this term mainly refers to negative externalities, also known as “external costs”, because they represent real costs borne by society, even if they are not reflected in the market price of an economic commodity or service [77].
To quantify the environmental impacts of the raw materials and processes used in the project, it was decided to establish the boundary by analysing the “cradle-to-gate” life cycle, defining the Carbon Footprint and Total Eco-Costs as impact categories over 15 years.
Two different European models were used to estimate the impacts of the externalities in economic terms. The first method is called “EVR—Eco-Costs/Value Ratio” and translates environmental impacts into economic costs by measuring the cost of preventing a given amount of environmental damage [6]. The second method is called “EP—Environmental Prices” and expresses the willingness to pay for less pollution (in euros per kilogram of pollutant). This method was developed by the Dutch research and consultancy CE Delft in 2018 and applies to European countries [7]. The two methods (EVR, EP) are similar, but they are not complementary.
The steps taken to apply the two methods are described below.
- (1)
- The input materials used within the project for the production of a single cell were determined and quantified in g/cm2 (Table 1).
 Table 1. Quantification of input materials (experimental values).
 - (2)
- The materials were searched and transcribed from the IDEMAT 2023 database, as shown in Table 2. In particular, for materials not included in the database, we referred to equivalent materials. For all the materials, the value of the impact, expressed in EUR/kg, has been derived from the database. The value of impact associated with the consumption of electricity is reported in EUR/MJ.
Table 2. Correspondence with input materials reported in the IDEMAT database.
- (3)
- Analogously, for the same materials, the corresponding carbon footprint values expressed in kg CO2-eq./kg (or kg CO2-eq./MJ, for electricity) have been reported.
- (4)
- The material quantities (in kg/cm2) were multiplied by the cell size (e.g., 80 cm2) to obtain the quantity of each material within a single cell (kg).
- (5)
- The amount of material in each cell was multiplied by its environmental impact (EUR/kg) to obtain the total eco-cost (EUR) of the materials used per cell (see Appendix A).
- (6)
- Finally, the value of the “Environmental Cost” in EUR/kg CO2-eq., according to both the EVR and EP methods, was multiplied by the carbon footprint of each element expressed in kg CO2-eq., to obtain the total value in EUR of the environmental cost for producing the cell, according to two different indicators: (a) climate change Eco-costs/Value Ratio, and (b) climate change Environmental Price (see Appendix B).
5.2. Economic Analysis
To determine the total cost and affordability of investing in a semi-craft process, the net present value (NPV) of the system investigated was calculated.
NPV is defined as the discounted value, at a discount rate, of all cash flows (negative and positive) generated over the life of the project. As is well known, the NPV helps to determine the economic profitability of a project/investment. Indeed, a positive NPV indicates that revenues exceed costs, and the investment is expected to pay off.
The following formula was used to calculate the NPV:
where CAPEX is the initial investment cost, TR is the tax rate on profits, REVn is the annual profit generated by the project, OPEXn is the operating cost (fixed and variable) at time n, and r is the discount rate. In particular, note that taxations are levied on profits minus operating expenses. We also assumed that the investment was made by equity funds (no loan to repay).
To determine the CAPEX, a market survey was carried out to analyse and quantify the investment costs of the equipment required for the production cycle of the photoelectrolysis cell (Table 3).
Table 3.
Evaluation of CAPEX (estimated values, after market survey).
It should be remarked that the solar simulator includes a lamp to simulate the solar irradiation. This lamp has a typical lifetime of 1000 h, corresponding to about seven years in our productive process. Therefore, in the 7th and 14th years, a replacement cost of EUR 1000 has been included in the calculation of NPV.
To determine the operating costs (OPEX), after quantifying the input materials required for production, in g/cm2, these values were multiplied by the (specific) cost in EUR/g to obtain the unit cost in EUR/cm2 as the sum of all cell components. This value was multiplied by the size of the cell (cm2) to obtain the cost (in EUR) of the materials used to produce a single cell.
An analysis of the production process, whose steps are shown in Figure 2, was carried out to estimate the time required to derive the quantity for the maximum daily production of cells by one worker: 10 cells/day per person. A number of working days equal to 222 days/y were assumed, from which the number of cells that could be produced in a year was determined (4440 cells/y), taking into account a workforce of two workers. This value was multiplied by the cost of each cell (about EUR 192) to obtain the annual cost of the materials (see Table 4).
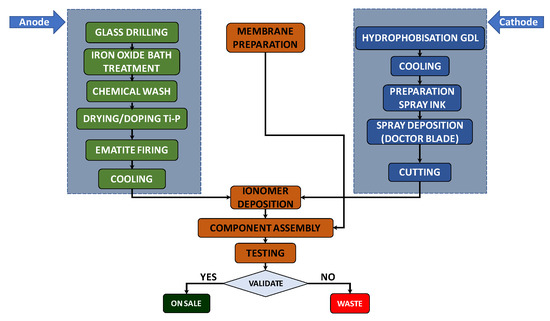
Figure 2.
Photoelectrolytic cell production process.
Table 4.
Evaluation of OPEX (calculated values).
The labour cost of hiring two permanent employees per year has been assumed to be 60,000 EUR/y (30,000 EUR/y per person).
The energy consumption of the instruments and premises used for the production process in question was estimated to be about 169 kWh/day, i.e., 37,617 kWh/y. This value was calculated as the sum of the energy consumptions of the system components, determined by multiplying the power ratings (kW) of the single equipment (derived from a combination of experimental data, industrial standards and theoretical calculations) by the operational times based on the production process depicted in Figure 2. The monetary value of electricity was set at EUR 0.328/kWh, derived from ARERA [78] for Italy and based on Eurostat data processing. This value was referred to as the average electricity cost (total gross price in 2023) for industrial customers with annual consumption between 20 and 500 MWh (second consumption class). Therefore, as reported in Table 4, the cost of electricity consumption was EUR 12,338/y.
A value of EUR 1500/y was assumed for other costs, i.e., the annual cost of various consumables, such as chemical baths and washing tubs, airbrush sets, grids for positioning the cells for the various treatments, various glassware for the treatments, etc.
Table 4 summarises the different values included in the calculation of the operative and maintenance costs (OPEX).
We assumed that a portion (1%) of the cells realised are faulty and calculated the material cost of the cells available for selling (EUR 844,089/y). Thus, the corresponding operating expenses have been estimated (EUR 917,927/y). Therefore, to determine the cash inflow (revenue) a profit margin of 10% on these expenses was assumed. In addition, a percentage of unsold cells per year of 5% was quantified to obtain the “net” revenue, which resulted in being equal to EUR 959,234/y.
Based on the mentioned calculated OPEX, a single cell cost of about EUR 209 and a selling price of EUR 230 have been estimated.
The discount rate was determined by estimating the return on equity and the inflation rate. Firstly, the 15-year BTP yield of 4.15% [79] was used as a reference, where BTP are the Italian government bonds. On this basis, given the medium-high risk level of the investment considered, it seems reasonable to assume that the return on equity is about twice this figure (8%). Inflation in Italy has passed from 1.9% in 2021 to 8.1% in 2022 [80], 5.7% in 2023 [81] and 1.0% in 2024 [82], with an average of 4.2%. But considering that the increase in 2022 was linked to some contingencies (COVID-19 pandemic, Russian–Ukrainian conflict, etc.), as the downward trend also suggests it seems consistent to set inflation at 3%. Finally, the discount rate was estimated at 4.85%.
A depreciation rate of 15% per year was assumed for equipment, to determine taxation. In addition, we considered as taxable base the annual profits (after deduction of operating costs and depreciation) and assumed two income taxes: IRES (Italian corporate tax) of 24% and IRAP (regional tax on productive activities) of 3.9%. Therefore, the tax rate (TR in Equation (1)) was equal to 27.9%.
6. Results and Discussion
In this section, we present and comment on the results of a base case and those obtained through a sensitivity analysis of some key parameters.
6.1. Base Case Results
From the study conducted, in absolute terms, the most polluting materials considering the “Total Eco-Costs” approach were the compounds containing titanium and nickel (Fe2O3+Ti+P and NiCu). However, they were used in minimal quantities in the framework of the project, thus resulting in a very low incidence. The item, relative to the project, that had the greatest weight in terms of “total eco-costs” was electricity, which accounted for 54% of the total. The second material was polyvinyldenfluoride, which accounts for 34% of the total. The lowest one was distilled water, which accounted for a negligible share (0.002%).
Using the Carbon Footprint as an indicator, both with the EP (Environmental Price) method and with the eco-costs method, the value that had a greater incidence on the environmental costs of the project was still electrical energy, with an incidence percentage of around 60% in both cases. The second one was also unchanged, in fact polyvinildenfluoride in both case studies had an incidence of about 25%, while the value that had a lower incidence was NiCu (about 0.001%).
According to a detailed economic analysis, the cost of externalities was determined as shown in Table 5.
Table 5.
External costs calculated by the three methods.
In the present study, the possibility of considering the externalities as costs affecting the net present value (NPV) of the photoelectrolysis cell was examined. The result is almost the same as in the case where environmental costs were not considered. In fact, when considering the “total eco-costs” approach, which is the worst–case scenario from an environmental point of view, the environmental costs turned out to be less than 0.15% of the total costs; while the incidence of CAPEX and OPEX was about 7.9% and 91.9%, respectively.
Table 6 shows the incidence of the different cost items (CAPEX, OPEX, and externalities) determined for the three approaches used. In general, our analysis evidenced that OPEX was the predominant cost. As concerns the environmental externalities, it can be observed that they are not relevant (0.14% for the total eco-cost approach, 0.07% for EVR, and 0.03% for EP). In particular, the differences between EVR and EP are due to the different monetisation used for the CO2 emissions (EUR 0.133/kgCO2-eq. for EVR, and EUR 0.057/kgCO2-eq. for EP; see notes in Table A2).
Table 6.
Incidence of cost items.
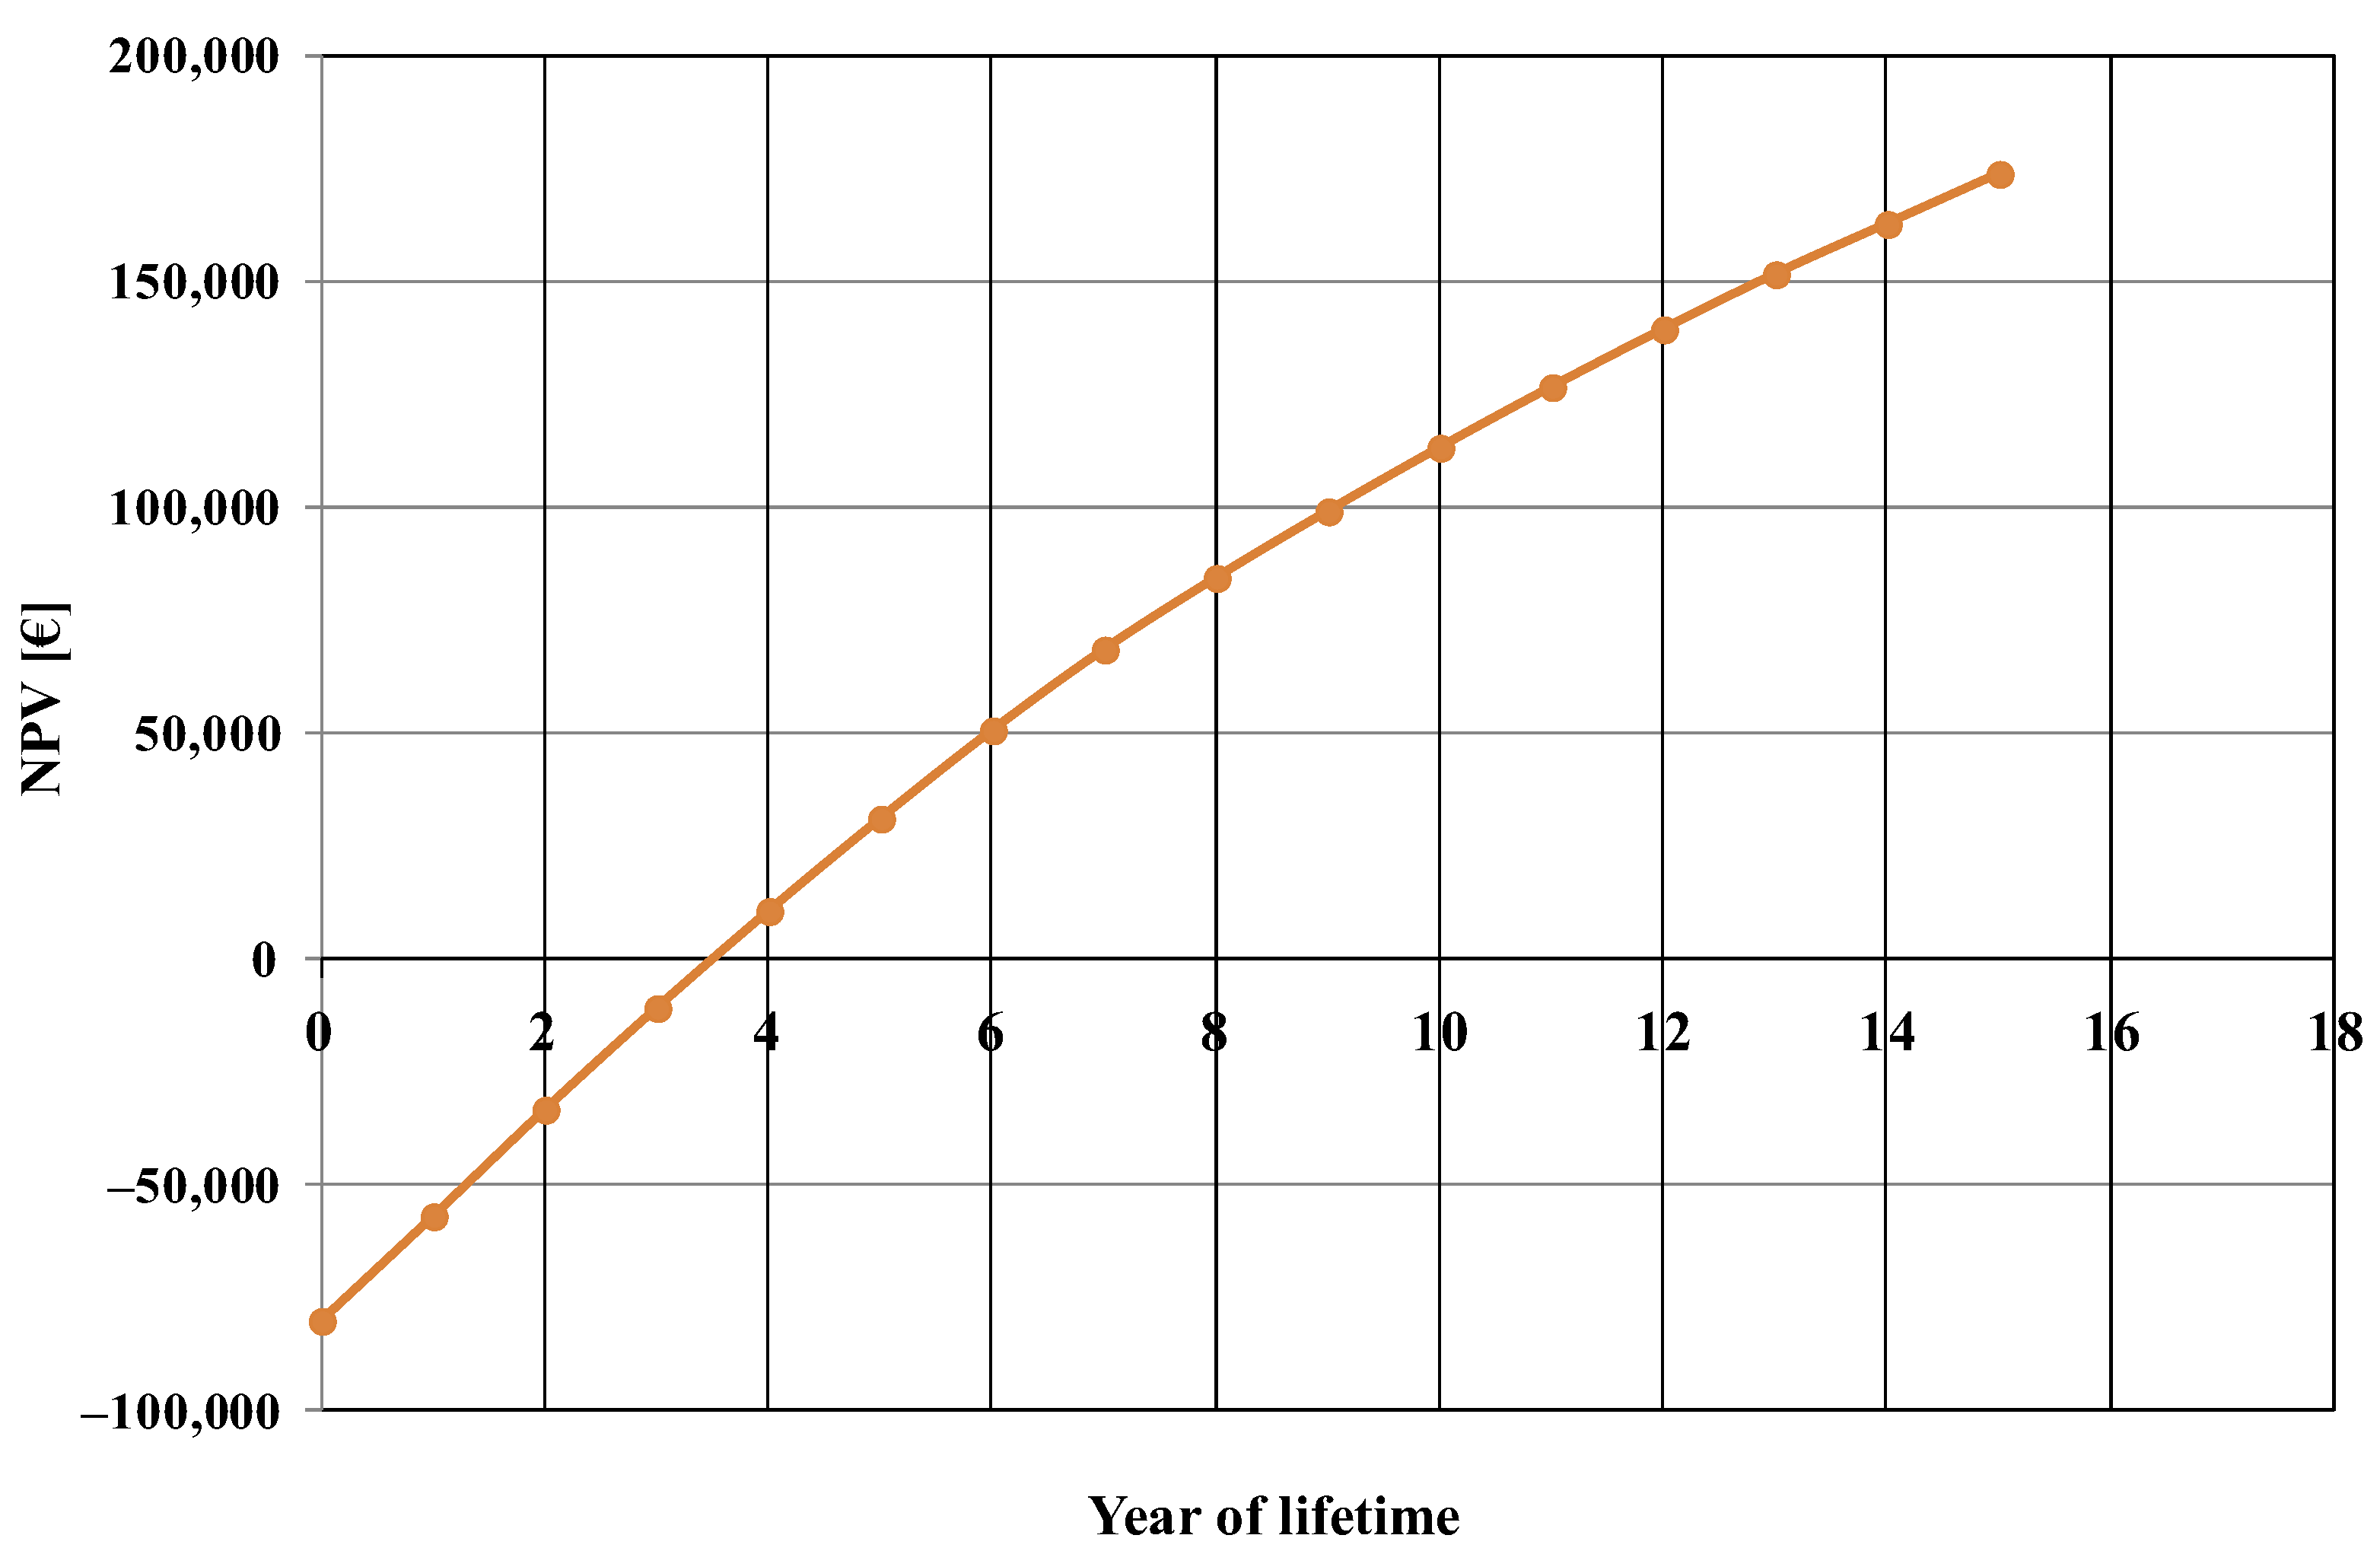
The net present value evolution, calculated for the base case, is shown in Figure 3. From this figure, the estimated payback period of the investment was about 3.5 years.
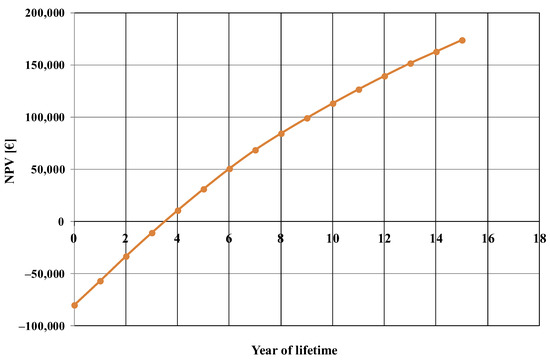
Figure 3.
Net present value (NPV) evolution, calculated for the base case.
6.2. Sensitivity Analysis Results
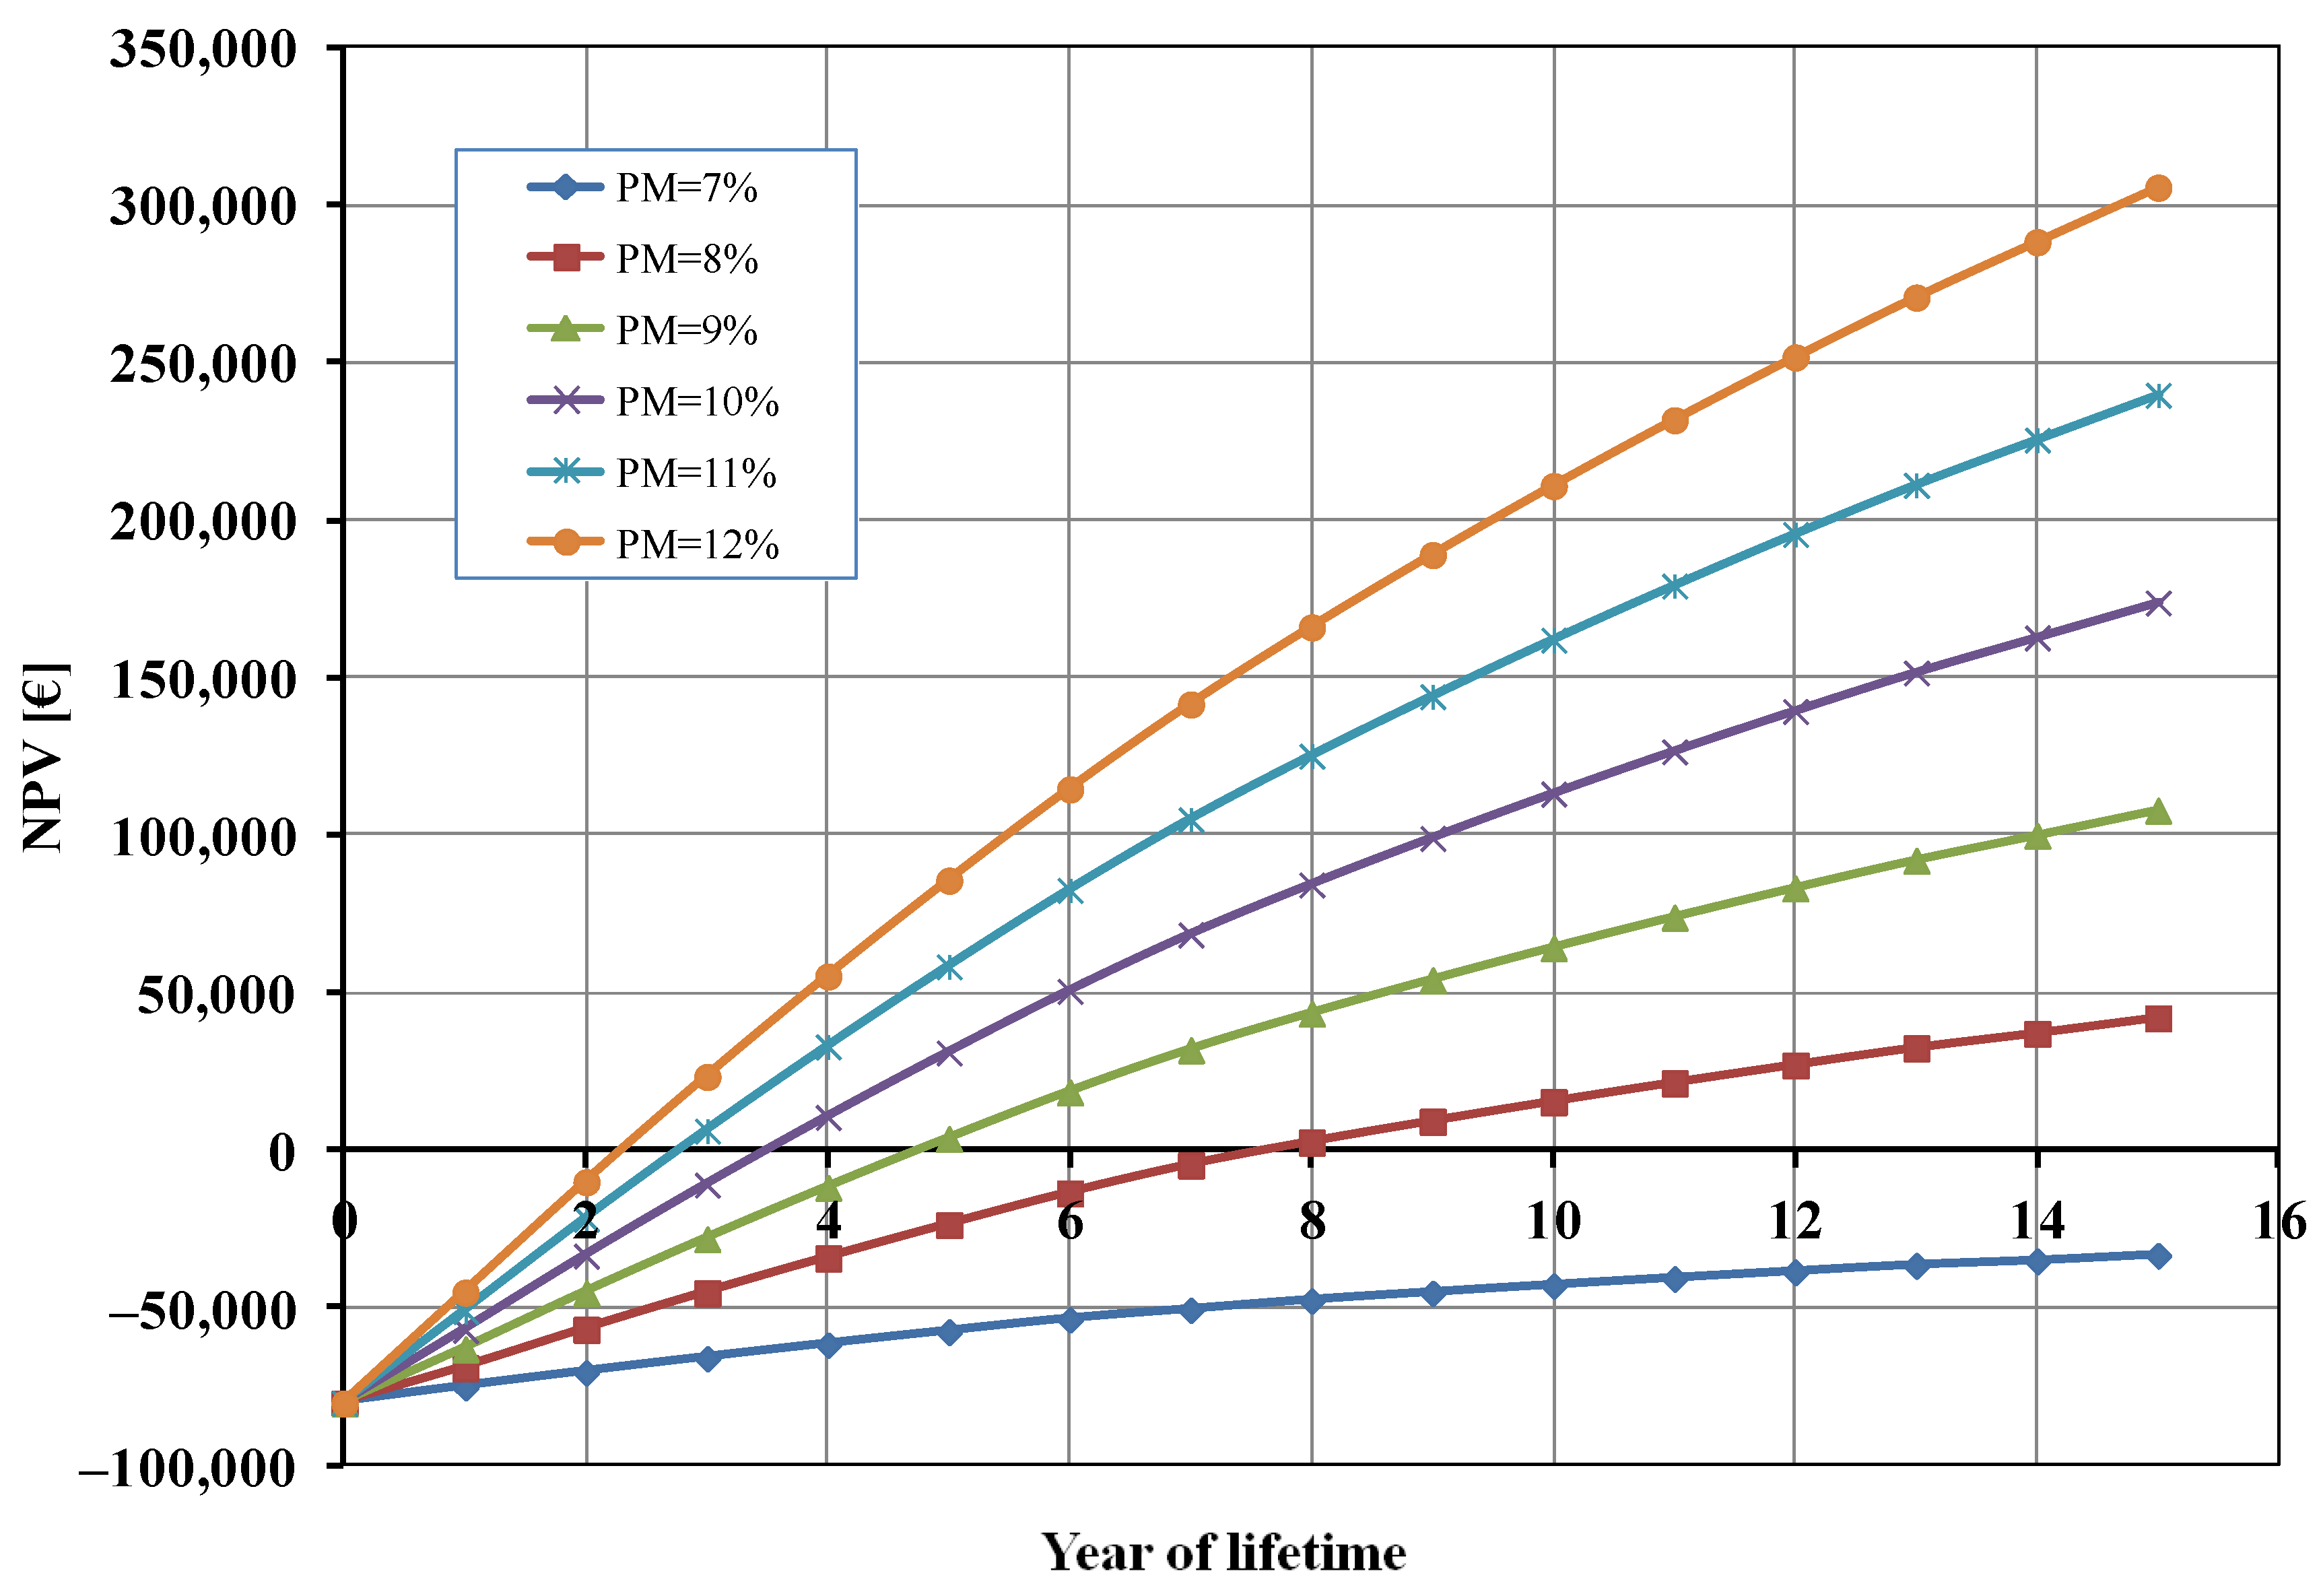
The results reported above refer to a base case. Here, we perform a sensitivity study by varying some key parameters. In particular, we varied the profit margin (PM) from 7% to 12% (10%, in the base case), the percentage of unsold cells (UC) from 2% to 7% (5%, in the base case), the percentage of electrical energy auto-consumption (EEA) from 0% to 100% (0%, in the base case), and the inflation rate (IR) from 2% to 7% (3%, in the base case). We used the base-case as a reference and explored realistic scenarios that are both more optimistic and more pessimistic, generating a range of outcomes centred around the intermediate scenario.
As it can be seen from Figure 4, the profit margin had a significant influence on the calculated NPV. A profit margin (PM) lower than 8% did not allow for the economic profitability of the studied photoelectrolysis system. When the value of PM increased, the break-even point (BEP) of the investment was reached in a shorter time. For instance, when PM = 12% the BEP was approximately half that of the base case (2 years), and the total profit after 15 years was about 300,000 EUR (compared to 174,000 EUR in the base case).
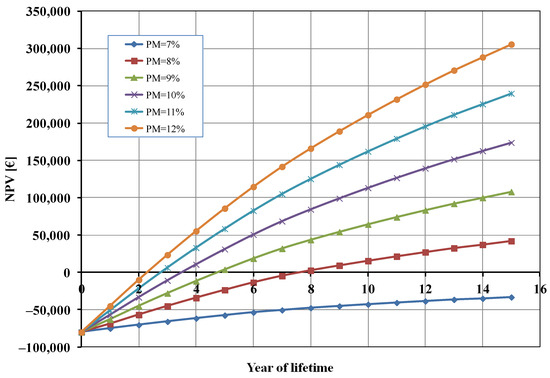
Figure 4.
Net present value (NPV) as a function of profit margin (PM).
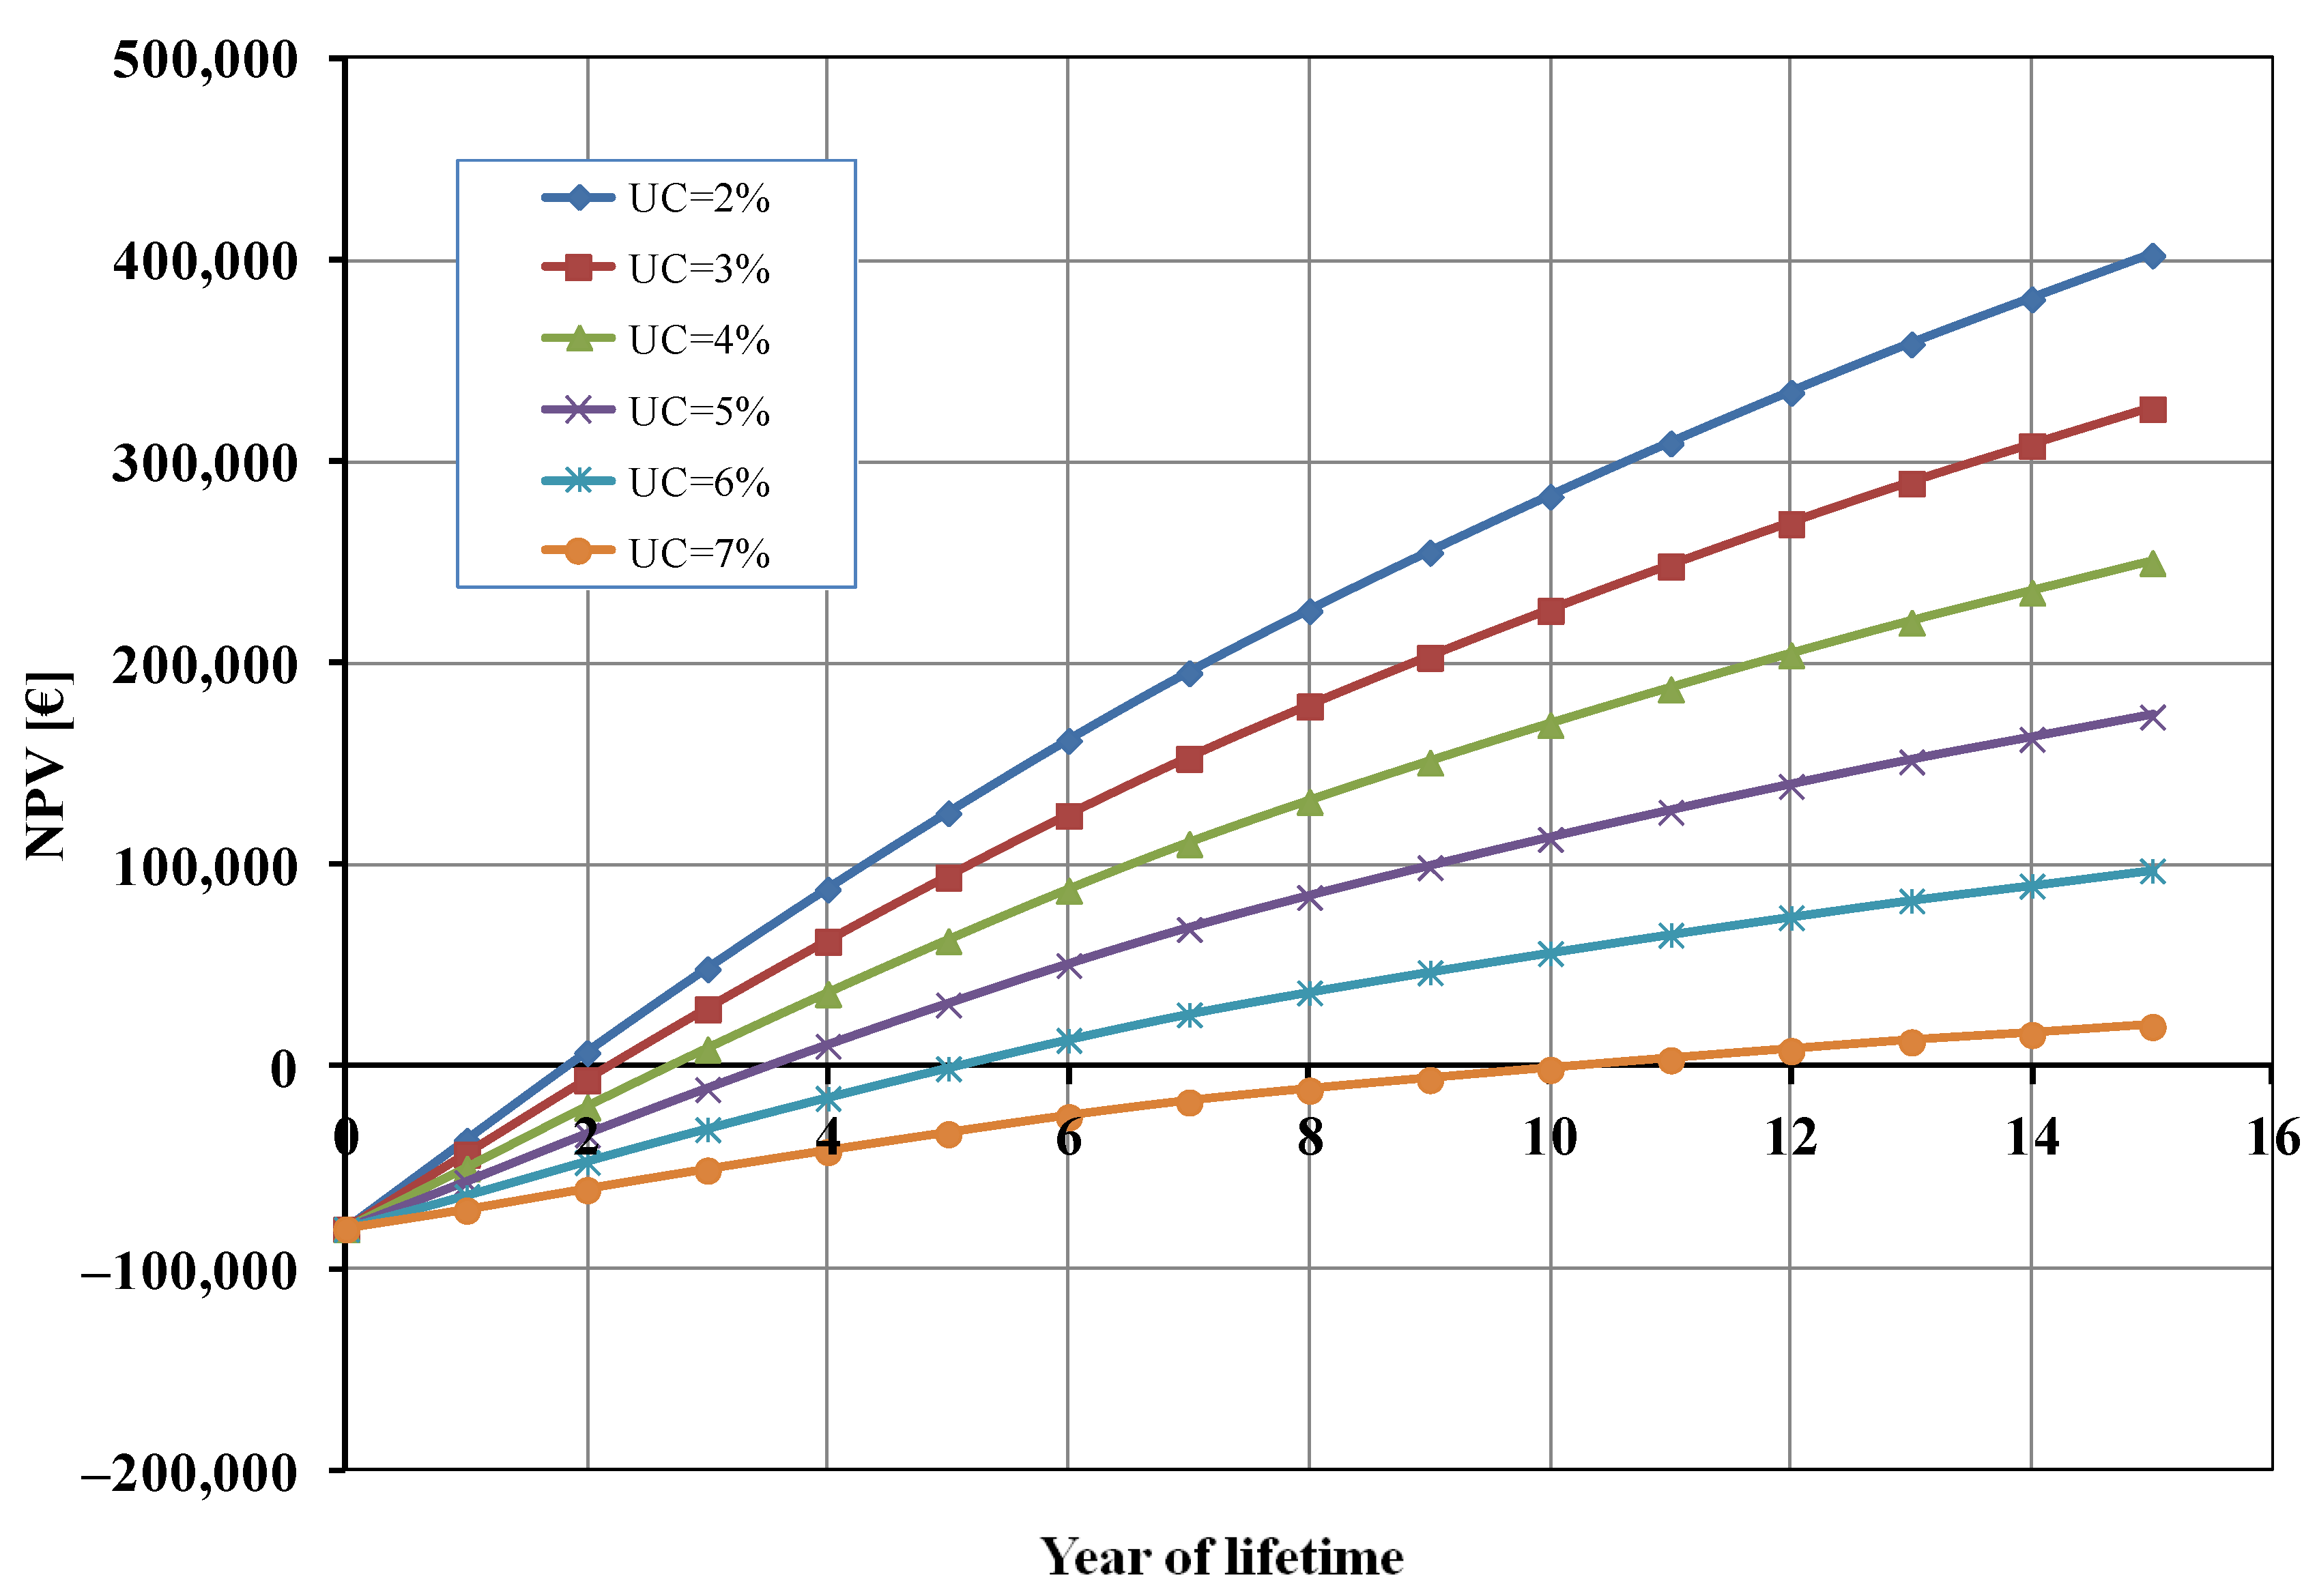
Figure 5 shows the influence of the percentage of unsold cells (UC) on the NPV. When UC is 7% the BEP was higher (about 11 years) and the profit after 15 years was very marginal (about 20,000 EUR). On the other hand, when the value of UC decreased, the final profit for the studied system increased (until about 400,000 EUR when 2% of cells were unsold) and, consequently, the BEP decreased.
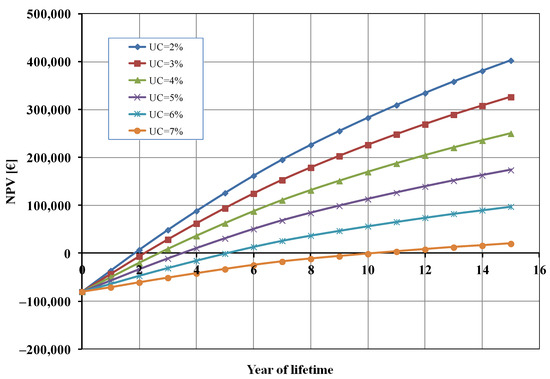
Figure 5.
Net present value (NPV) as a function of unsold cells (UC).
It is evident that PM and UC had an opposite effect on the NPV, and the profit margin should be higher than the percentage of unsold cells to warrant the profitability of the photoelectrolysis cell (e.g., UC = 5% and PM > 7%).
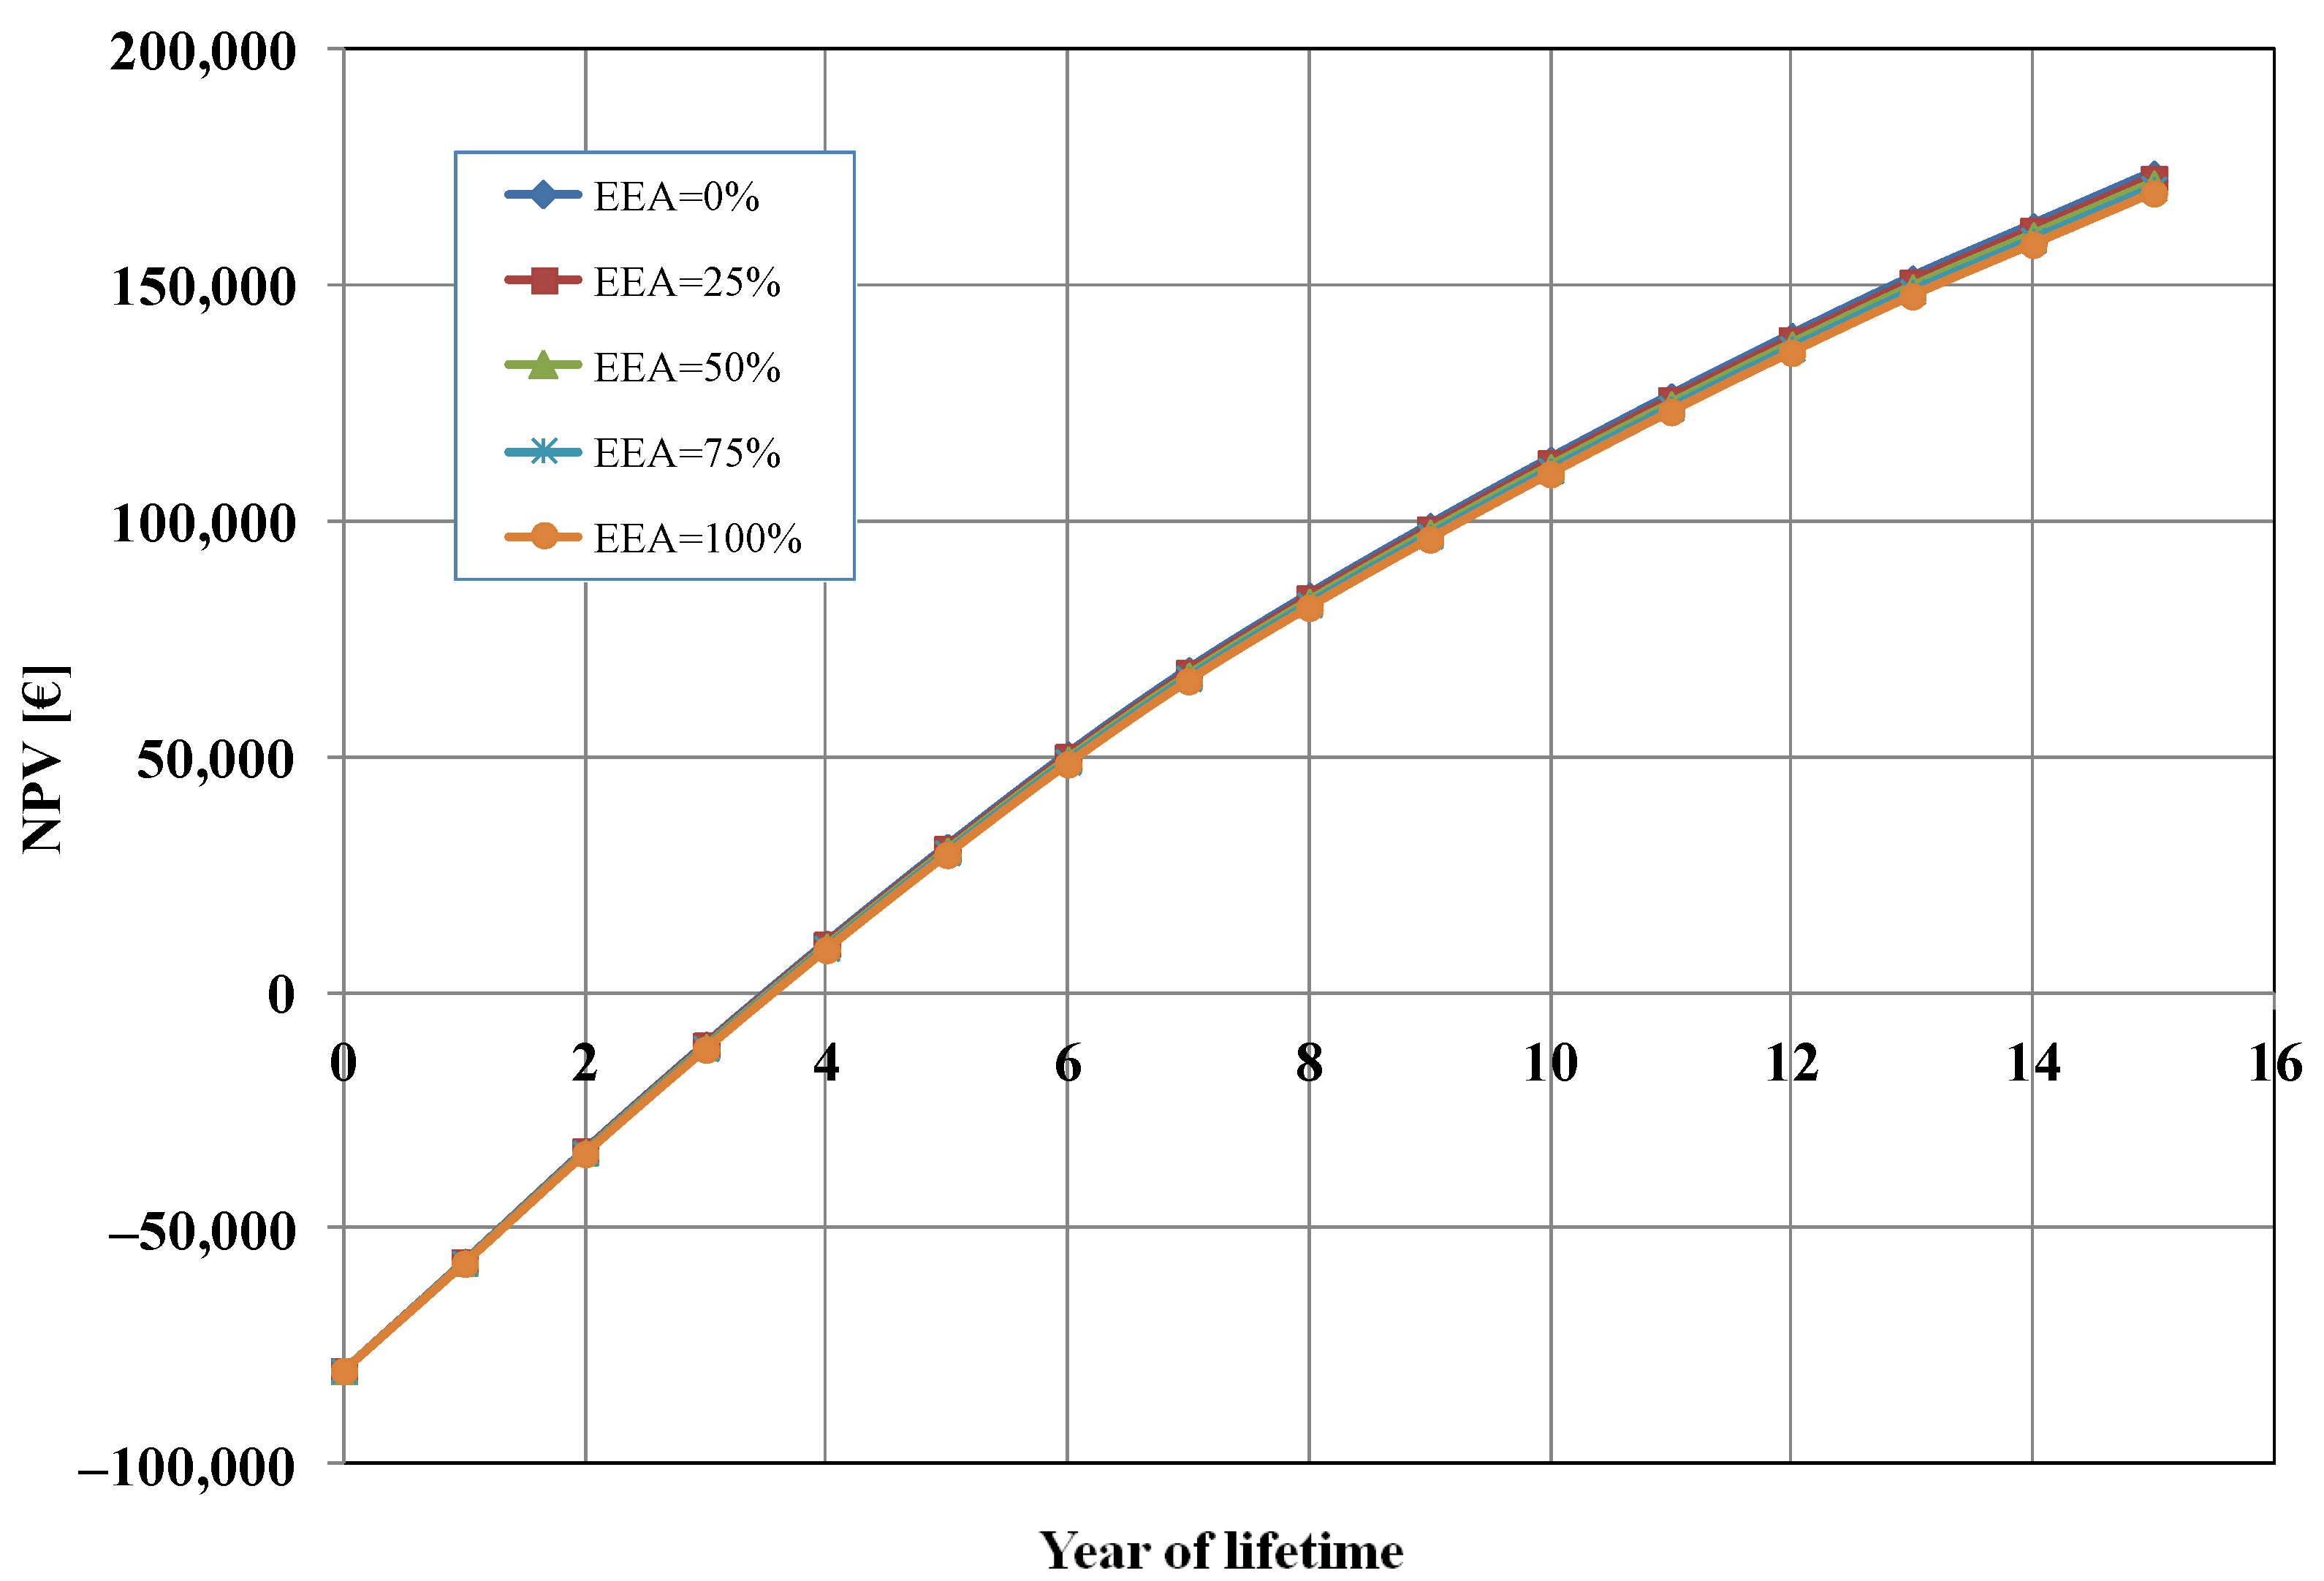
Figure 6 shows the influence of the percentage of electrical energy auto-consumption (EEA) mix between auto-consumption from a proprietary PV plant and consumption from the network grid (EAA = 0%, i.e., 100% from the grid in the base case). We analysed five cases: (a) EEA = 0%, i.e., 100% consumption from the grid; (b) EAA = 25%, i.e., 75% consumption from the grid and 25% auto-consumption from PV; (c) EAA = 50%, i.e., 50% consumption from the grid and 50% auto-consumption from PV; (d) EAA = 75%, i.e., 25% consumption from the grid and 75% auto-consumption from PV; (e) EAA = 100%, i.e., 100% auto-consumption from PV. As it can be seen from Figure 6, the energy consumption mix did not have a significant impact on the calculated NPV. The variations in the results were minimal, and this is because the cost of electrical energy (EUR 12,338/y, in the base case) was only 1.3% of the total OPEX costs.
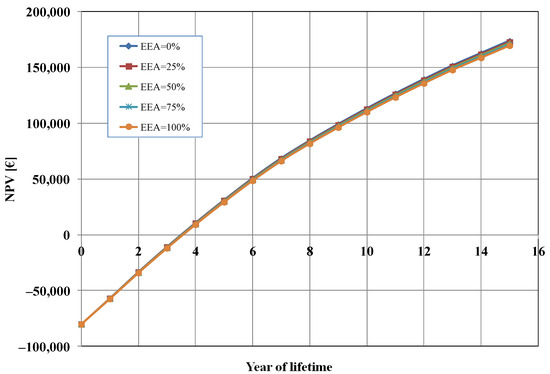
Figure 6.
Net present value (NPV) as a function of electrical energy auto-consumption (EEA).
It should be remarked that when the EAA increases, since we assumed a constant profit margin (10%), this resulted in a decrease in the OPEX costs, and then a reduction in the selling price of the cell (from EUR 230 with EEA = 0% to about EUR 227 with EEA = 100%). Thus, the effect was a lower total profit after 15 years (about EUR 4200 less). In practice, based on our assumption, energy auto-consumption allows us to have better competitiveness in the market.
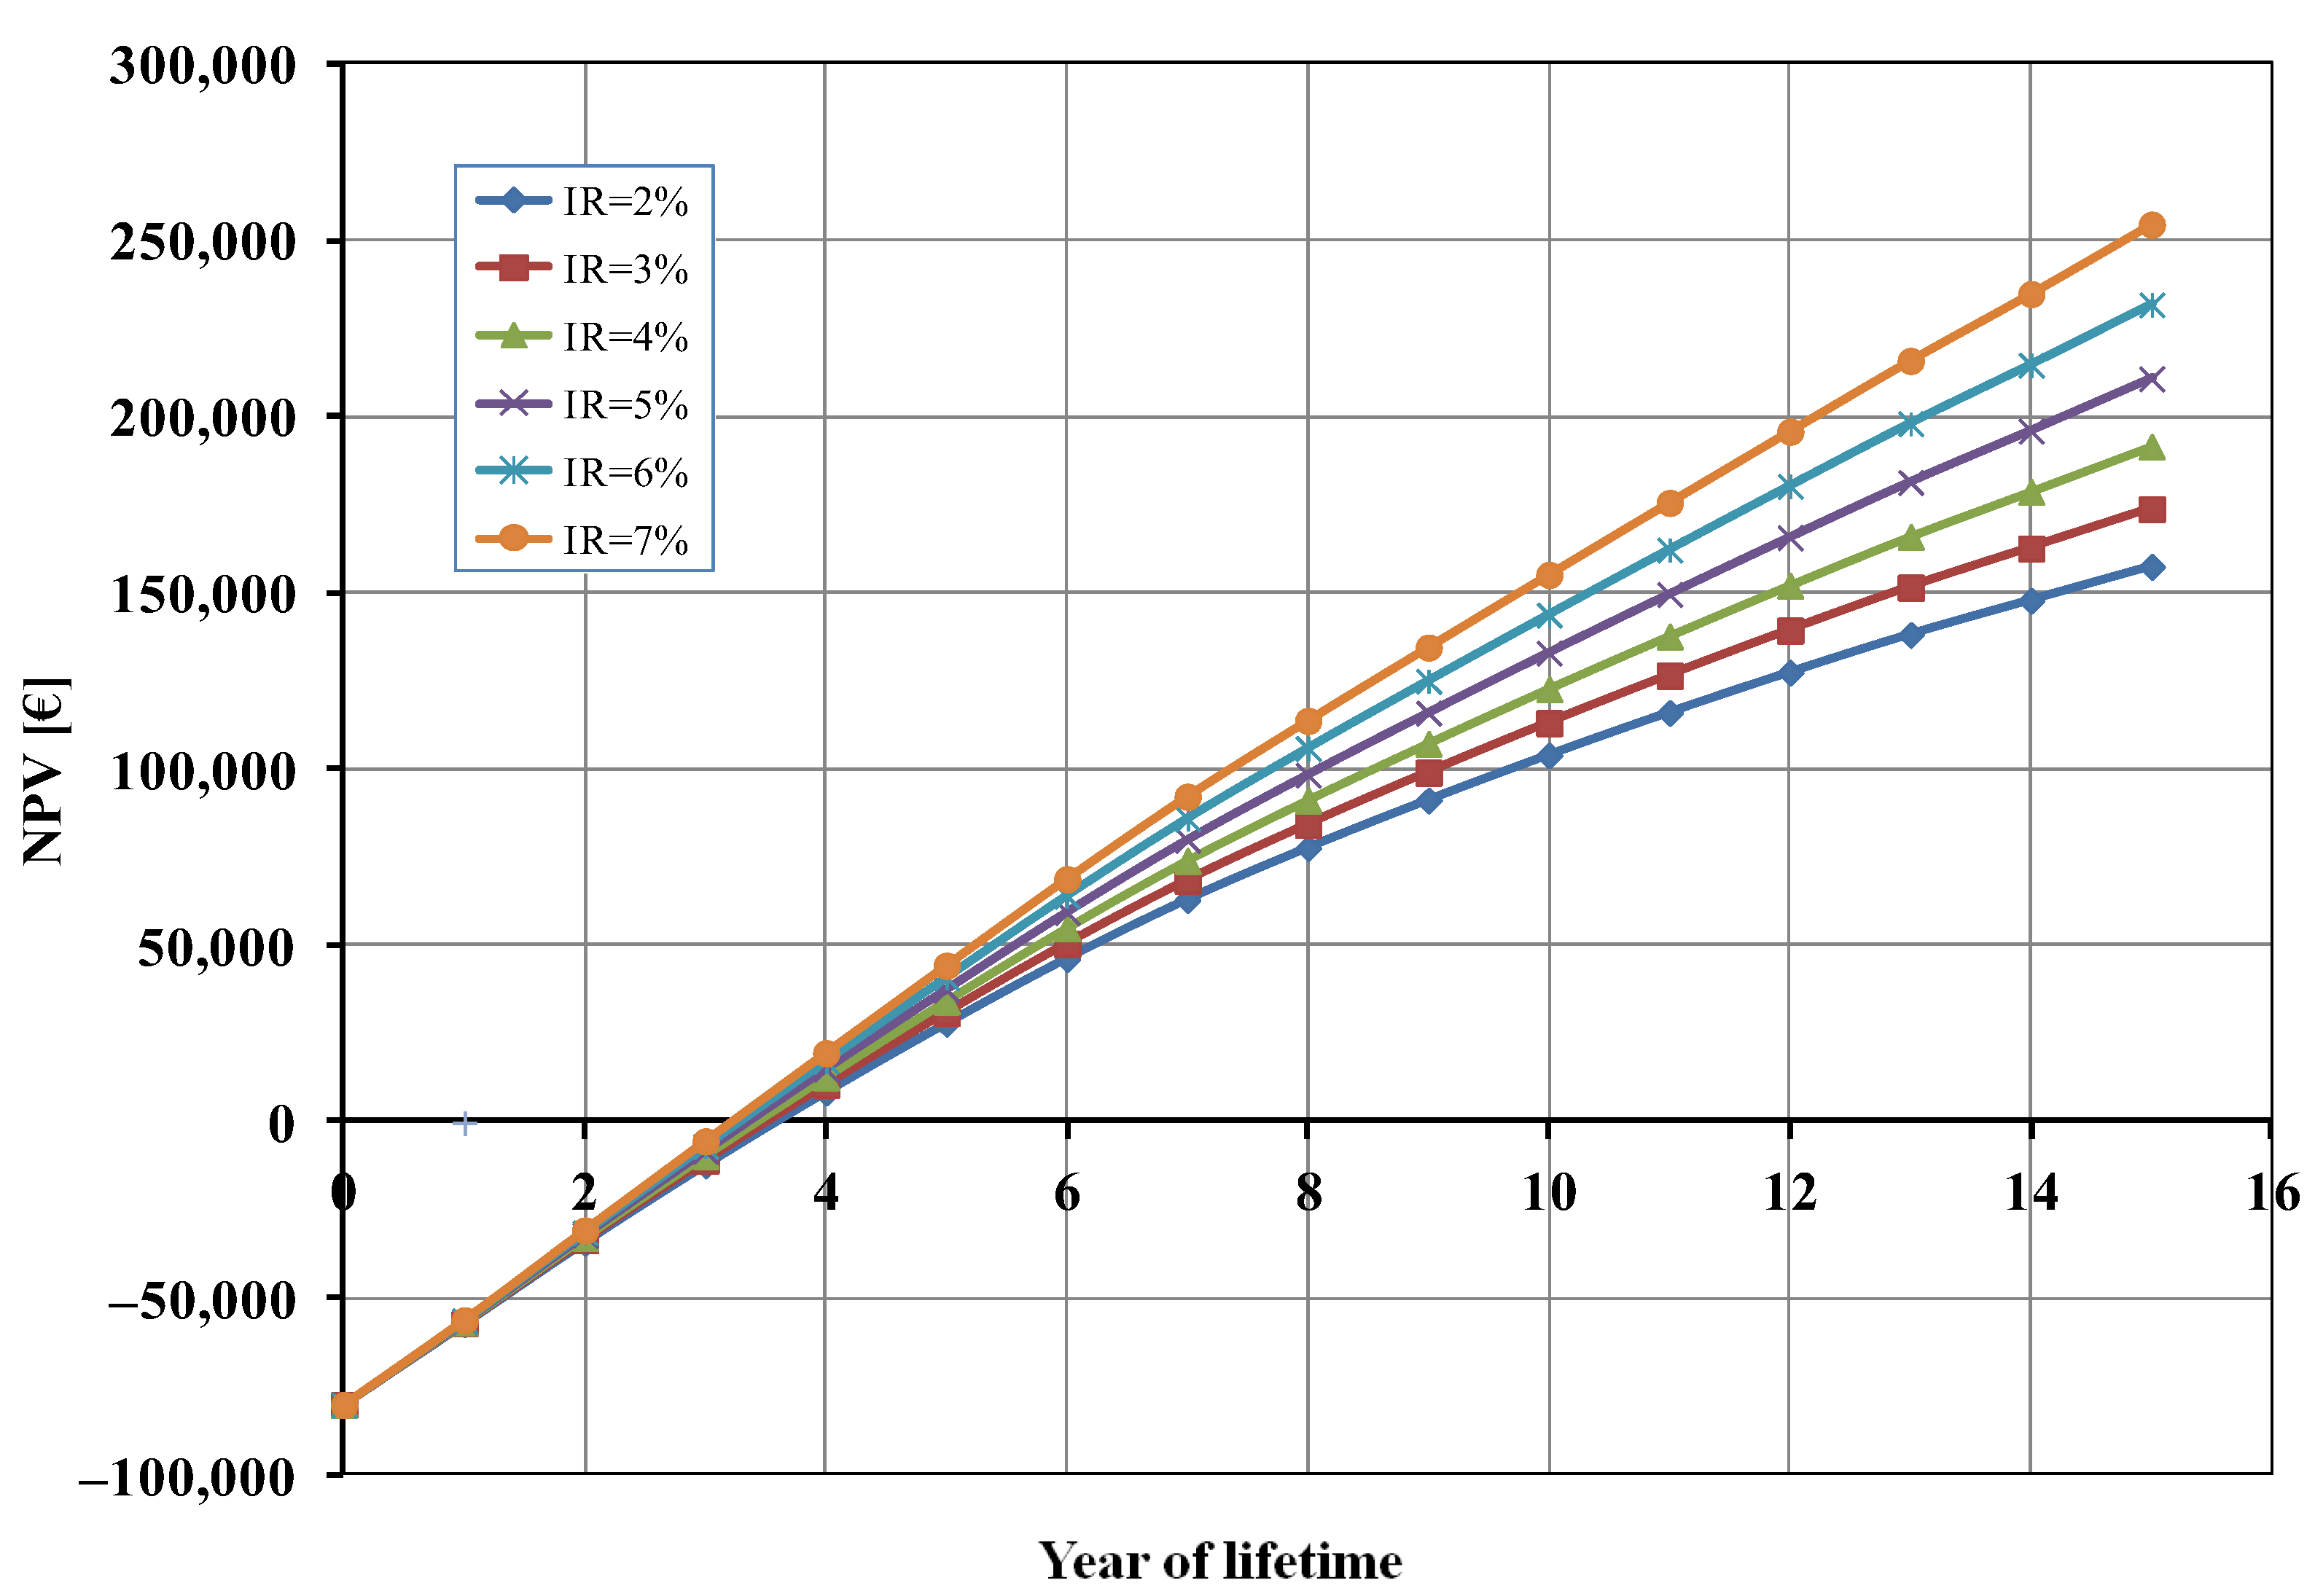
Finally, considering that—as already mentioned—some financial parameters, and, in particular, the inflation rate (IR), are subject to unforeseeable fluctuations, we also carried out a sensitivity analysis on the NPV as a function of the IR value (Figure 7). As shown in Figure 7, the effect of the inflation rate on the break-even point was negligible (less than 6 months of difference), but the profit after 15 years—as expected—increased as the IR increased.
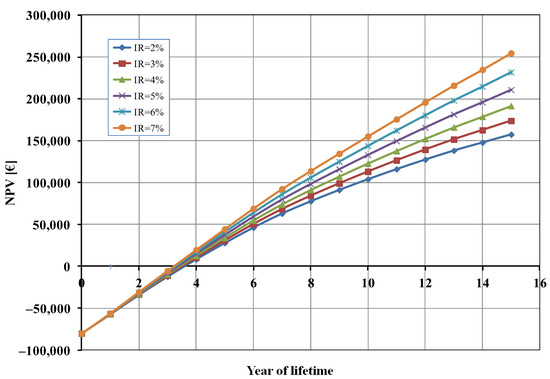
Figure 7.
Net present value (NPV) as a function of inflation rate (IR).
7. Conclusions
The objective of this paper was to perform an analysis to evaluate the economic and environmental feasibility of a photoelectrolysis cell for green hydrogen production. The analysis was based on semi-industrial production, with production volumes not exceeding 4500 units per year. The target market is not only the industry but also research and/or academic institutions.
The study took into account the early stage of the project and the immature nature of the technology, which is still under development, and simulated a real production and marketing process. The possibility of considering externalities as costs affecting the net present value (NPV) of the photoelectrolysis cell was included in the study and examined. The calculation of NPV showed that, in a base case, the break-even point will be reached within four years at a market price per single cell of about EUR 230.
Some simulations have also been performed to analyse the sensitivity of the economic calculations (NPV) as a function of some critical parameters; in particular, profit margin, percentage of unsold cells, percentage of electrical energy auto-consumption, and inflation rate.
From the techno-economic and financial analysis carried out, two relevant aspects emerged about the development of this new photoelectrolysis cell. The first concerned the ecological implications. As we can see, regardless of the approach used to calculate the externalities, their percentage of the total cost was negligible (see Table 6). This means that the process and product can be considered sustainable in terms of environmental impact. Therefore, this technology could play an important role in the energy transition processes and in the fight against climate change. On the contrary, from a strictly economic point of view, there were critical issues due to the high operating costs, which are heavily influenced by the cost of materials. This was compounded by the production process which, given its early stage and niche market status, is currently based on a largely manual method. These factors do not currently allow this technology to be offered at a competitive price. However, it can be evidenced that—apart from a few cases—the NPV outcomes were positive, showing good perspectives from a financial point of view, which can encourage potential investors.
This study has enabled us, through careful cost analysis, to draw up and present an economic–financial picture of this new type of photoelectrolysis cell. The data obtained is useful for identifying the cost factors which, together with more strictly technical factors such as efficiency, are currently an obstacle to making this technology competitive.
For this purpose, we believe that increases in the technology efficiency can lead to the following:
- Reduced Costs per Unit of Hydrogen: Higher STH efficiency typically results in greater hydrogen production for the same amount of solar input, thereby lowering costs associated with energy and materials.
- Enhanced Competitiveness: As STH efficiency improves, our process may become more competitive with other hydrogen production methods, making it more attractive for commercial applications.
- Long-term Economic Viability: Sustained advancements in STH efficiency could contribute to the long-term viability of solar-driven hydrogen production within the renewable energy landscape.
Regarding theoretical aspects, further research should include a comparison, again in terms of economic–environmental costs, with other green hydrogen production technologies, including those with a high level of readiness, market-readiness, as well as those with a lower level. Indeed, this represents a limitation of the methodology employed in this work, which could benefit from a more comprehensive perspective.
Author Contributions
Methodology, G.M., S.T. and M.G.; Software, G.M.; Formal analysis, S.T.; Investigation, S.T. and M.G.; Data curation, S.T.; Writing—original draft, G.M., S.T., A.N., S.V. and M.G.; Writing—review & editing, G.M., S.T., M.G. and A.N.; Supervision, S.V. and A.N.; Project administration, S.T.; Funding acquisition, S.T. All authors have read and agreed to the published version of the manuscript.
Funding
This work was made in the framework of the “Piano Triennale di realizzazione 2022–2024 della Ricerca di Sistema Elettrico Nazionale” funded by the Italian Ministry for the Environment and Energy Security.
Data Availability Statement
The data supporting the findings of this study are available within the article. Further data are available upon request from the corresponding author.
Acknowledgments
Parts of this paper first appeared in the Proceedings of the 8th AIEE Energy Symposium, Padua, Italy, 28–30 November 2024.
Conflicts of Interest
The authors declare no conflicts of interest.
Abbreviations and Acronyms
| ARERA | Autorità di Regolazione per Energia Reti e Ambiente (Authority for the Regulation of Energy, Networks, and Environment) |
| BEP | Break-even point |
| BTP | Buoni del Tesoro Poliennali (Italian government bonds) |
| CAPEX | Capital expenditure |
| CB | Conduction band |
| CCUS | Carbon Capture, Utilisation and Storage |
| CLCC | Conventional life cycle cost |
| EEA | Electrical energy auto-consumption |
| ELCC | Environmental life cycle cost |
| EN 15804 | European norm 15804 |
| EP | Environmental price |
| EVR | Eco-cost/value ratio |
| FCV | Fuel cell vehicle |
| FEP | Fluorinated ethylene propylene |
| FTO | Fluorine-doped tin oxide |
| GDL | Gas diffusion layer |
| GHG | Greenhouse gas |
| IDEMAT | Industrial Design & Engineering MATerials |
| IEA | International Energy Agency |
| IPCC | Intergovernmental Panel on Climate Change |
| IR | Inflation rate |
| IRAP | Imposta Regionale sulle Attività Produttive (Regional tax on productive activities) |
| IRES | Imposta sul Reddito delle Società (Italian corporate tax) |
| LCC | Life cycle cost |
| LCOH | Levelised Cost of Hydrogen |
| NHE | Normal Hydrogen Electrode |
| NPV | Net present value |
| OCV | Open circuit voltage |
| OPEX | Operational expenditure |
| PEC | Photoelectrochemical cell |
| PEM | Proton exchange membrane |
| PM | Profit margin |
| PPS | Polyphenylene sulphide |
| PTFE | Polytetrafluoroethylene (or Teflon) |
| PV | Photovoltaic |
| PVC | Polyvinylchloride |
| RdS | Ricerca di Sistema Elettrico Nazionale (National Program for Electric System Research) |
| REV | Revenue |
| SETAC | Society of Environmental Toxicology and Chemistry |
| SLCC | Social life cycle cost |
| STH | Solar-to-hydrogen |
| TR | Tax rate |
| TRL | Technology Readiness Level |
| UC | Unsold cells |
| VB | Valence band |
Appendix A
Table A1.
Environmental calculations for the total eco-costs approach.
Table A1.
Environmental calculations for the total eco-costs approach.
| Unit | Process | Total Eco-Cost (EUR/Unit) | Quantity (Unit) | Total Eco-Cost (EUR) |
|---|---|---|---|---|
| kg | Float glass | 0.2280 | 0.0656 | 1.50 × 10⁻² |
| kg | Metalloid oxides | 0.5186 | 2.40 × 10⁻⁴ | 1.24 × 10⁻⁴ |
| kg | Potassium hydroxide | 0.3183 | 0.0056 | 1.78 × 10⁻³ |
| kg | Ionomer | 3.2377 | 8.00 × 10⁻⁵ | 2.59 × 10⁻⁴ |
| kg | Fe2O3 = Other non-metal oxides (n = 2, std. = 0) | 0.1543 | 2.08 × 10⁻⁴ | 4.37 × 10⁻³ |
| kg | Ti = Titanium (primary) | 20.7550 | ||
| kg | P = Non-metal phosphates (n = 1, std. = –) | 0.1120 | ||
| kg | Carbon fibre (95%) | 16.2236 | 8.80 × 10⁻⁴ | 1.36 × 10⁻² |
| kg | PTFE (Teflon), chemical upcycled (5%) | 1.6762 | ||
| kg | Industrial reverse osmosis water Europe | 0.0027 | 0.0024 | 6.53 × 10⁻⁶ |
| kg | PTFE (Teflon), chemical upcycled | 1.6762 | 6.16 × 10⁻⁵ | 1.03 × 10⁻⁴ |
| kg | PVC (polyvinylchloride emulsion polymerised) | 0.7653 | 0.1424 | 1.09 × 10⁻¹ |
| kg | PPS (polyphenylene sulphide) | 4.5047 | 4.80 × 10⁻⁴ | 2.16 × 10⁻³ |
| kg | Ni = Nickel (primary) | 29.4569 | 6.40 × 10⁻⁷ | 2.23 × 10⁻⁵ |
| kg | Cu = Copper (primary) | 5.445 | ||
| MJ | PV panel (irradiation 1100 kWh per m2) | 0.0057 | 30.420 | 1.72 × 10⁻¹ |
| TOTAL | 3.19 × 10⁻¹ | |||
Appendix B
Table A2.
Environmental calculations for the two climate change approaches (EVR and EP).
Table A2.
Environmental calculations for the two climate change approaches (EVR and EP).
| Unit | Process | Carbon Footprint (kgCO2-eq/Unit) | Carbon Footprint (kgCO2-eq) | Climate Change EVR a (EUR) | Climate Change EP b (EUR) |
|---|---|---|---|---|---|
| kg | Float glass | 1.3715 | 9.00 × 10⁻² | 1.20 × 10⁻² | 5.13 × 10⁻³ |
| kg | Metalloid oxides | 3.4538 | 8.29 × 10⁻⁴ | 1.10 × 10⁻⁴ | 4.72 × 10⁻⁵ |
| kg | Potassium hydroxide | 1.7839 | 9.99 × 10⁻³ | 1.33 × 10⁻³ | 5.69 × 10⁻⁴ |
| kg | Ionomer | 11.5819 | 9.27 × 10⁻⁴ | 1.23 × 10⁻⁴ | 5.28 × 10⁻⁵ |
| kg | Fe2O3 = Other non-metal oxides (n = 2, std. = 0) | 0.9644 | 6.45 × 10⁻³ | 8.57 × 10⁻⁴ | 3.67 × 10⁻⁴ |
| kg | Ti = Titanium (primary) | 29.5599 | |||
| kg | P = Non-metal phosphates (n = 1, std. = –) | 0.4687 | |||
| kg | Carbon fibre (95%) | 87.8194 | 7.39 × 10⁻² | 9.83 × 10⁻³ | 4.21 × 10⁻³ |
| kg | PTFE (Teflon), chemical upcycled (5%) | 10.6690 | |||
| kg | Industrial reverse osmosis water Europe | 0.0086 | 2.06 × 10⁻⁵ | 2.74 × 10⁻⁶ | 1.17 × 10⁻⁶ |
| kg | PTFE (Teflon), chemical upcycled | 10.6690 | 6.57 × 10⁻⁴ | 8.74 × 10⁻⁵ | 3.75 × 10⁻⁵ |
| kg | PVC (polyvinylchloride emulsion polymerised) | 2.2200 | 3.16 × 10⁻¹ | 4.20 × 10⁻² | 1.80 × 10⁻² |
| kg | PPS (polyphenylene sulphide) | 7.1664 | 3.44 × 10⁻³ | 3.89 × 10⁻⁴ | 1.96 × 10⁻⁴ |
| kg | Ni = Nickel (primary) | 13.0955 | 1.11 × 10⁻⁵ | 1.47 × 10⁻⁶ | 6.31 × 10⁻⁷ |
| kg | Cu = Copper (primary) | 4.1896 | |||
| MJ | PV panel (irradiation 1100 kWh per m2) | 0.0250 | 7.60 × 10⁻¹ | 1.01 × 10⁻¹ | 4.33 × 10⁻² |
| TOTAL | 1.68 × 10⁻¹ | 7.19 × 10⁻² | |||
a Environmental climate change EVR (in old EN 15804) = 0.133 EUR2023/kgCO2-eq. [8]. b Environmental climate EP = 0.057 EUR2015/kgCO2-eq. [7].
References
- Pang, L.; Liu, L.; Zhou, X.; Hafeez, M.; Ullah, S.; Sohail, M.T. How does natural resource depletion affect energy security risk? New insights from major energy-consuming countries. Energy Strategy Rev. 2024, 54, 101460. [Google Scholar] [CrossRef]
- IEA. Global Hydrogen Review. 2023. Available online: https://www.iea.org/reports/global-hydrogen-review-2023 (accessed on 2 September 2024).
- Ciroth, A.; Hunkeler, D.; Huppes, G.; Lichtenvort, K.; Rebitzer, G.; Rüdenauer, I.; Steen, B. Environmental Life Cycle Costing. In Collaboration with SETAC (Society of Environmental Toxicology and Chemistry); Hunkeler, D., Lichtenvort, K., Rebitzer, G., Eds.; CRC Press: Boca Raton, FL, USA; Taylor & Francis Group: Boca Raton, FL, USA, 2008. [Google Scholar]
- Rodrigues, S.L.; da Silva, E.A. Implementation of environmental life cycle costing: Procedures, challenges, and opportunities. Int. J. Life Cycle Assess. 2024, 29, 803–837. [Google Scholar] [CrossRef]
- Nicita, A.; Maggio, G.; Andaloro, A.P.F.; Squadrito, G. Green hydrogen as feedstock: Financial analysis of a photovoltaic-powered electrolysis plant. Int. J. Hydrogen Energy 2020, 45, 11395–11408. [Google Scholar] [CrossRef]
- Vogtländer, J.G.; Brezet, H.C.; Hendriks, C.F. The virtual eco-costs ’99: A single LCA-based indicator for sustainability and the eco-costs-value ratio (EVR) model for economic allocation. Int. J. Life Cycle Assess. 2001, 6, 157–166. [Google Scholar] [CrossRef]
- De Bruyn, S.; Bijleveld, M.; de Graaff, L.; Schep, E.; Schroten, A.; Vergeer, R.; Ahdour, S. Environmental Prices Handbook EU28 Version; CE Delft: Delft, The Netherlands, 2018. [Google Scholar]
- IDEMAT. Sustainability Impact Metrics. A Spin-Off of the Delft University of Technology. 2023. Available online: https://www.ecocostsvalue.com/ecocosts/ (accessed on 20 June 2024).
- Ashari, P.A.; Oh, H.; Koch, C. Pathways to the hydrogen economy: A multidimensional analysis of the technological innovation systems of Germany and South Korea. Int. J. Hydrogen Energy 2024, 49, 405–421. [Google Scholar] [CrossRef]
- Mbah, R.E.; Wasum, D.F. Russian-Ukraine 2022 War: A review of the economic impact of Russian-Ukraine crisis on the USA, UK, Canada, and Europe. Adv. Soc. Sci. Res. J. 2022, 9, 144–153. [Google Scholar] [CrossRef]
- Albrecht, U.; Bünger, U.; Michalski, J.; Raksha, T.; Wurster, R.; Zerhusen, J.; International Hydrogen Strategies. A Study Commissioned by and in Cooperation with the World Energy Council Germany. 2020. Available online: https://www.weltenergierat.de/wp-content/uploads/2020/10/WEC_H2_Strategies_finalreport.pdf (accessed on 2 September 2024).
- IEA. Global Hydrogen Review. 2021. Available online: https://www.iea.org/reports/global-hydrogen-review-2021 (accessed on 2 September 2024).
- IEA. Global Hydrogen Review. 2022. Available online: https://www.iea.org/reports/global-hydrogen-review-2022 (accessed on 2 September 2024).
- Biden-Harris Administration Announces Awards for up to $2.2 Billion for Two Regional Clean Hydrogen Hubs to Bolster America’s Global Clean Energy Competitiveness and Strengthen Our National Energy Security. Available online: https://www.energy.gov/articles/biden-harris-administration-announces-awards-22-billion-two-regional-clean-hydrogen-hubs#:~:text=As%20part%20of%20President%20Biden's,energy%20product%20that%20can%20be (accessed on 20 February 2025).
- U.S. National Clean Hydrogen Strategy and Roadmap (June 2023). Available online: https://www.hydrogen.energy.gov/docs/hydrogenprogramlibraries/pdfs/us-national-clean-hydrogen-strategy-roadmap.pdf?sfvrsn=c425b44f_5 (accessed on 20 February 2025).
- Locke, K. The urgency of hydrogen: Environmental issues and the need for change. Future Sustain. 2024, 2, 46–58. [Google Scholar] [CrossRef]
- Epstein, P. Hydrogen’s Present and Future in the US Energy Sector. Shearman & Sterling LLP, October 2021. Available online: https://www.shearman.com/en/perspectives/2021/10/hydrogens-present-and-future-in-the-us-energy-sector#:~:text=Approximately%2010%20million%20metric%20tons,U.S.%20hydrogen%20production%20is%20grey (accessed on 2 September 2024).
- World Economic Forum. Green Hydrogen in China: A Roadmap for Progress; White Paper; World Economic Forum: Davos, Switzerland, 2023. [Google Scholar]
- European Commission. REPowerEU Plan—Communication from The Commission to The European Parliament, The European Council, The Council, The European Economic and Social Committee and The Committee of The Regions; European Commission: Luxembourg, 2022. [Google Scholar]
- European Patent Office (EPO) and International Energy Agency. In Hydrogen Patents for A Clean Energy Future; European Patent Office (EPO): Berlin, Germany, 2023.
- Basic Hydrogen Strategy—The Ministerial Council on Renewable Energy, Hydrogen and Related Issues. Available online: https://www.meti.go.jp/shingikai/enecho/shoene_shinene/suiso_seisaku/pdf/20230606_5.pdf (accessed on 20 February 2025).
- World Economic Forum, 2024. Hydrogen is Developing Fast in Japan, Edging Nearer to Wider Use in Society. April 2024. Available online: https://www.weforum.org/agenda/2024/04/hydrogen-japan/ (accessed on 2 September 2024).
- Bristowe, G.; Smallbone, A. The Key Techno-Economic and Manufacturing Drivers for Reducing the Cost of Power-to-Gas and a Hydrogen-Enabled Energy System. Hydrogen 2021, 2, 273–300. [Google Scholar] [CrossRef]
- Miyagawa, T.; Goto, M. Hydrogen Production Cost Forecasts since the 1970s and Implications for Technological Development. Energies 2022, 15, 4375. [Google Scholar] [CrossRef]
- IRENA. Global Hydrogen Trade to Meet the 1.5 °C Climate Goal: Part I—Trade Outlook for 2050 and Way Forward; International Renewable Energy Agency: Abu Dhabi, United Arab Emirates, 2022. [Google Scholar]
- Almaraz, S.; Kocsis, T.; Azzaro-Pantel, C.; Szanto, Z.O. Identifying social aspects related to the hydrogen economy: Review, synthesis, and research perspectives. Int. J. Hydrogen Energy 2024, 49, 601–618. [Google Scholar] [CrossRef]
- Gordon, J.A.; Balta-Ozkan, N.; Haq, A.; Nabavi, S.A. Coupling green hydrogen production to community benefits: A pathway to social acceptance. Energy Res. Soc. Sci. 2024, 110, 103437. [Google Scholar] [CrossRef]
- Maggio, G.; Nicita, A.; Squadrito, G. How the hydrogen production from RES could change energy and fuel markets: A review of recent literature. Int. J. Hydrogen Energy 2019, 44, 11371–11384. [Google Scholar] [CrossRef]
- Squadrito, G.; Maggio, G.; Nicita, A. The green hydrogen revolution. Renew. Energy 2023, 216, 119041. [Google Scholar] [CrossRef]
- Qiao, F. Photoelectrocatalytic hydrogen production: Hydrogen production principle, performance optimization strategy, application and prospect. Nano Res. Energy 2024, 3, e120132. [Google Scholar] [CrossRef]
- Fujishima, A.; Honda, K. Electrochemical photolysis of water at a semiconductor electrode. Nature 1972, 238, 37–38. [Google Scholar] [CrossRef]
- Kudo, A.; Miseki, Y. Heterogeneous photocatalyst materials for water splitting. Chem. Soc. Rev. 2009, 38, 253–278. [Google Scholar] [CrossRef] [PubMed]
- Song, H.; Luo, S.; Huang, H.; Deng, B.; Ye, J. Solar-Driven Hydrogen Production: Recent Advances, Challenges, and Future Perspectives. ACS Energy Lett. 2022, 7, 1043–1065. [Google Scholar] [CrossRef]
- Thangamuthu, M.; Ruan, Q.; Ohemeng, P.; Luo, B.; Jing, D.; Godin, R.; Tang, J. Polymer Photoelectrodes for Solar Fuel Production: Progress and Challenges. Chem. Rev. 2022, 122, 11778–11829. [Google Scholar] [CrossRef]
- Lewis, N.; Nocera, D. Powering the planet: Chemical challenges in solar energy utilization. Proc. Natl. Acad. Sci. USA 2006, 103, 15729–15735. [Google Scholar] [CrossRef]
- Acar, C.; Dincer, I. Investigation of a novel photoelectrochemical hydrogen production system. Chem. Eng. Sci. 2019, 197, 74–86. [Google Scholar] [CrossRef]
- Hisatomi, T.; Kubota, J.; Domen, K. Recent advances in semiconductors for photocatalytic and photoelectrochemical water splitting. Chem. Soc. Rev. 2014, 43, 7520–7535. [Google Scholar] [CrossRef] [PubMed]
- Parkinson, B.; Turner, J. CHAPTER 1: The Potential Contribution of Photoelectrochemistry in the Global Energy Future. In Photoelectrochemical Water Splitting: Materials, Processes and Architectures; Energy and Environment Series; RSC Publishing: London, UK, 2013. [Google Scholar]
- Nozik, A.J. CHAPTER 13: Novel Approaches to Water Splitting by Solar Photons. In Photoelectrochemical Water Splitting: Materials, Processes and Architectures; Energy and Environment Series; RSC Publishing: London, UK, 2013. [Google Scholar]
- Sivula, K.; Grätzel, M. CHAPTER 4: Tandem Photoelectrochemical Cells for Water Splitting. In Photoelectrochemical Water Splitting: Materials, Processes and Architectures; Energy and Environment Series; RSC Publishing: London, UK, 2013. [Google Scholar]
- Wang, J.; Hu, Y.; Toth, R.; Fortunato, G.; Braun, A. A facile nonpolar organic solution process of a nanostructured hematite photoanode with high efficiency and stability for water splitting. J. Mater. Chem. A 2016, 4, 2821–2825. [Google Scholar] [CrossRef]
- Masudy-Panah, S.; Siavash Moakhar, R.; Chua, C.S.; Tan, H.R.; Wong, T.I.; Chi, D.; Dalapati, G.K. Nanocrystal Engineering of Sputter-Grown CuO Photocathode for Visible-Light-Driven Electrochemical Water Splitting. ACS Appl. Mater. Interfaces 2016, 8, 1206–1213. [Google Scholar] [CrossRef]
- Sivula, K.; Le Formal, F.; Grätzel, M. Solar Water Splitting: Progress Using Hematite (α-Fe2O3) Photoelectrodes. ChemSusChem 2011, 4, 432–449. [Google Scholar] [CrossRef]
- Zhang, Y.; Jiang, S.; Song, W.; Zhou, P.; Ji, H.; Ma, W.; Hao, W.; Chen, C.; Zhao, J. Nonmetal P-doped hematite photoanode with enhanced electron mobility and high-water oxidation activity. Energy Environ. Sci. 2015, 8, 1231–1236. [Google Scholar] [CrossRef]
- Ling, Y.; Wang, G.; Wheeler, D.A.; Zhang, J.Z.; Li, Y. Sn-doped Hematite Nanostructures for Photoelectrochemical Water Splitting. Nano Lett. 2011, 11, 2119–2125. [Google Scholar] [CrossRef] [PubMed]
- Lo Vecchio, C.; Trocino, S.; Campagna Zignani, S.; Baglio, V.; Carbone, A.; Díez García, M.I.; Contreras, M.; Gómez, R.; Aricò, A.S. Enhanced Photoelectrochemical Water Splitting at Hematite Photoanodes by Effect of a NiFe-Oxide co-Catalyst. Catalysts 2020, 10, 525. [Google Scholar] [CrossRef]
- Trocino, S.; Lo Vecchio, C.; Campagna Zignani, S.; Carbone, A.; Saccà, A.; Baglio, V.; Gómez, R.; Aricò, A.S. Dry Hydrogen Production in a Tandem Critical Raw Material-Free Water Photoelectrolysis Cell Using a Hydrophobic Gas-Diffusion Backing Layer. Catalysts 2020, 10, 1319. [Google Scholar] [CrossRef]
- Lo Vecchio, C.; Carbone, A.; Trocino, S.; Gatto, I.; Patti, A.; Baglio, V.; Aricò, A.S. Anionic Exchange Membrane for Photo-Electrolysis Application. Polymers 2020, 12, 2991. [Google Scholar] [CrossRef]
- Lo Vecchio, C.; Trocino, S.; Giacoppo, G.; Barbera, O.; Baglio, V.; Díez García, M.I.; Contreras, M.; Gómez, R.; Aricò, A.S. Water Splitting with Enhanced Efficiency Using a Nickel-Based Co-Catalyst at a Cupric Oxide Photocathode. Catalysts 2021, 11, 1363. [Google Scholar] [CrossRef]
- Shen, S.; Lindley, S.A.; Dong, C.-L.; Chen, E.; Lu, Y.-R.; Zhou, J.; Hu, Y.; Wheeler, D.A.; Guo, P.; Zhang, J.Z.; et al. Enhancing Solar-Driven Water Splitting with Surface-Engineered Nanostructures. Solar RRL 2019, 3, 1800285. [Google Scholar] [CrossRef]
- Peerakiatkhajohn, P.; Yun, J.; Wang, S.; Wang, L. Review of recent progress in unassisted photoelectrochemical water splitting: From material modification to configuration design. J. Photonics Energy 2016, 7, 012006. [Google Scholar] [CrossRef]
- Kumar, S.; Ojha, K.; Ganguli, A.K. Interfacial Charge Transfer in Photoelectrochemical Processes. Adv. Mater. Interfaces 2017, 4, 1600981. [Google Scholar] [CrossRef]
- Liu, T.-K.; Jang, G.Y.; Kim, S.; Zhang, K.; Zheng, X.; Park, J.H. Organic Upgrading through Photoelectrochemical Reactions: Toward Higher Profits. Small Methods 2024, 8, 2300315. [Google Scholar] [CrossRef]
- Obata, K.; Schwarze, M.; Thiel, T.A.; Zhang, X.; Radhakrishnan, B.; Ahmet, I.Y.; van de Krol, R.; Schomäcker, R.; Abdi, F.F. Solar-driven upgrading of biomass by coupled hydrogenation using in situ (photo)electrochemically generated H2. Nat. Commun. 2023, 14, 6017. [Google Scholar] [CrossRef] [PubMed]
- Wenderich, K.; Kwak, W.; Grimm, A.; Kramer, G.J.; Mul, G.; Mei, B. Industrial feasibility of anodic hydrogen peroxide production through photoelectrochemical water splitting: A techno-economic analysis. Sustain. Energy Fuels 2020, 4, 3143–3156. [Google Scholar] [CrossRef]
- Gaillard, N.; Deangelis, A. Photoelectrochemical Water Splitting Using Photovoltaic Materials. In Solar to Chemical Energy Conversion. Lecture Notes in Energy; Sugiyama, M., Fujii, K., Nakamura, S., Eds.; Springer: Cham, Switzerland, 2016; Volume 32. [Google Scholar] [CrossRef]
- Frowijn, L.S.F.; Van Sark, W.G.J.H.M. Analysis of photon-driven solar-to-hydrogen production methods in the Netherlands. Sustain. Energy Technol. Assess. 2021, 48, 101631. [Google Scholar] [CrossRef]
- Pinaud, B.A.; Benck, J.D.; Seitz, L.C.; Forman, A.J.; Chen, Z.; Deutsch, T.G.; James, B.D.; Baum, K.N.; Baum, G.N.; Ardo, S.; et al. Technical and economic feasibility of centralized facilities for solar hydrogen production via photocatalysis and photoelectrochemistry. Energy Environ. Sci. 2013, 6, 1983–2002. [Google Scholar] [CrossRef]
- Mandal, K.C.; Das, T.; Das, B.K. Nanomaterials for sustainable water splitting towards green hydrogen production. Int. J. Green Energy 2025, 22, 804–829. [Google Scholar] [CrossRef]
- Karaca, A.E.; Dincer, I. Development and evaluation of a solar based integrated hydrogen energy system for mobile applications. Energy Convers. Manag. 2023, 280, 116808. [Google Scholar] [CrossRef]
- Jeje, S.O.; Marazani, T.; Obiko, J.O.; Shongwe, M.B. Advancing the hydrogen production economy: A comprehensive review of technologies, sustainability, and future prospects. Int. J. Hydrogen Energy 2024, 78, 642–661. [Google Scholar] [CrossRef]
- Percy, A.J.; Edwin, M. A comprehensive review on the production and enhancement techniques of gaseous biofuels and their applications in IC engines with special reference to the associated performance and emission characteristics. Sci. Total Environ. 2024, 934, 173087. [Google Scholar] [CrossRef]
- Abdalla, M.; Abdelrehim, O.; Weic, B.; Wang, X.; Azad, A.K.; Dawood, M.K. Hydrogen production technologies: Conventional processes, Chapter 11. In Hydrogen Economy, 2nd ed.; Processes, Supply Chain, Life Cycle Analysis and Energy Transition for Sustainability; Scipioni, A., Manzardo, A., Ren, J., Eds.; Academic Press: Cambridge, MA, USA, 2023; pp. 381–396. [Google Scholar]
- Qureshi, F.; Tahir, M. Photoelectrochemical water splitting with engineering aspects for hydrogen production: Recent advances, strategies and challenges. Int. J. Hydrogen Energy 2024, 69, 760–776. [Google Scholar] [CrossRef]
- Vilanova, A.; Dias, P.; Lopes, T.; Mendes, A. The route for commercial photoelectrochemical water splitting: A review of large-area devices and key upscaling challenges. Chem. Soc. Rev. 2024, 53, 2388–2434. [Google Scholar] [CrossRef]
- Ghosh, S.; Laha, D.; Kundu, S.; Baduri, S.; Ray, D.; Bhattacharya, C. Optimization of growth condition of n-type Bi2O3 semiconductors for improved photoelectrochemical applications. J. Solid State Electrochem. 2025, 29, 117–128. [Google Scholar] [CrossRef]
- Khan, H.R.; Akram, R.; Aamir, M.; Malik, M.A.; Tahir, A.A.; Choudhary, M.A.; Akhtar, J. Investigations of photoelectrochemical performance of polycrystalline Bi-doped ZnO thin films. J. Phys. Chem. Solids 2023, 181, 111529, ISSN 0022-3697. [Google Scholar] [CrossRef]
- Scharnberg, A.R.D.A.; Berutti, F.A.; Alves, A.K. Visible-light Bi-Fe-Nb-O photoanodes for solar-light driven hydrogen production. Environ. Technol. 2020, 42, 4355–4362. [Google Scholar] [CrossRef]
- Cogal, S.; Oksuz, A.U. Chapter 7—Photoelectrochemical water splitting based on 2D-transition metal dichalcogenide materials. In Nanophotonics, Photoelectrochemical Engineering for Solar Harvesting; Kazim, S., Tahir, M.N., Ahmad, S., Mathur, S., Eds.; Elsevier: Amsterdam, The Netherlands, 2024; pp. 175–209. ISBN 9780323954945. [Google Scholar] [CrossRef]
- Akhter, R.; Hussain, S.; Maktedar, S.S. Advanced graphene-based (photo & electro) catalysts for sustainable & clean energy technologies. New J. Chem. 2024, 48, 437. [Google Scholar] [CrossRef]
- Sharma, P.K.; Hamilton, J.W.J.; Byrne, J.A. Cu clusters modified aligned titania nanotubes for photoelectrochemical water splitting. Mater. Today Proc. 2021, 42, 1766–1771. [Google Scholar] [CrossRef]
- Sharma, R.; Arnoult, K.; Ramasahayam, S.K.; Azam, S.; Hicks, Z.; Shaikh, A. Photoelectrochemical Hydrogen Production Using Novel Heteroatom-Doped Carbon Under Solar Simulated Radiation. In IEEE Transactions on Industry Applications; IEEE: Singapore, 2016; Volume 52, no. 1; pp. 378–383. [Google Scholar] [CrossRef]
- Gulotta, T.M.; Salomone, R.; Mondello, G.; Saija, G.; Lanuzza, F.; Briguglio, N. Life Cycle Assessment and Environmental Life Cycle costing of a unitised regenerative fuel cell stack. Sci. Total Environ. 2023, 901, 166007, ISSN 0048-9697. [Google Scholar] [CrossRef]
- Arfan, M.; Eriksson, O.; Wang, Z.; Soam, S. Life cycle assessment and life cycle costing of hydrogen production from biowaste and biomass in Sweden. Energy Convers. Manag. 2023, 291, 117262. [Google Scholar] [CrossRef]
- Nicita, A.; Squadrito, G.; Maggio, G. Life-cycle cost (LCC) applied to hydrogen technologies: A review. Int. J. Life Cycle Assess. 2024, 29, 46–79. [Google Scholar] [CrossRef]
- Cornes, R.; Sandler, T. The Theory of Externalities, Public Goods, and Club Goods; Cambridge University Press: New York, NY, USA, 1996. [Google Scholar]
- Nguyen, T.L.T.; Laratte, B.; Guillaume, B.; Hua, A. Quantifying environmental externalities with a view to internalizing them in the price of products, using different monetization models. Resour. Conserv. Recycl. 2016, 109, 13–23. [Google Scholar] [CrossRef]
- ARERA—Italian Regulatory Authority for Energy, Networks and Environment. Annual Report 2024 (Relazione Annuale 2024, in Italian), Volume 1. 2024. Available online: https://www.arera.it/fileadmin/allegati/relaz_ann/24/RA24_vol1.pdf (accessed on 2 September 2024).
- MEF—15-Year Italian Government Bonds (BTP) Issued by the Italian Ministry of Economy and Finance, October 2024. Available online: https://www.dt.mef.gov.it/export/sites/sitodt/modules/documenti_it/debito_pubblico/risultati_aste/risultati_aste_btp_15_anni/BTP-15-Anni-Risultati-Asta-11-14.10.2024.pdf (accessed on 20 June 2024).
- ISTAT—Italian National Institute of Statistics. Consumer Prices, Released on 5 January 2023. Available online: https://www.istat.it/wp-content/uploads/2023/01/Consumer-prices_Prov_December2022.pdf (accessed on 9 July 2024).
- ISTAT—Italian National Institute of Statistics. Consumer Prices, Released on 16 January 2024. Available online: https://www.istat.it/wp-content/uploads/2024/01/Consumer-prices_FD_December2023.pdf (accessed on 9 July 2024).
- ISTAT—Italian National Institute of Statistics. Consumer Prices, Released on 7 January 2025. Available online: https://www.istat.it/wp-content/uploads/2025/01/Consumer-prices_Prov_December2024.pdf (accessed on 22 January 2025).

Disclaimer/Publisher’s Note: The statements, opinions and data contained in all publications are solely those of the individual author(s) and contributor(s) and not of MDPI and/or the editor(s). MDPI and/or the editor(s) disclaim responsibility for any injury to people or property resulting from any ideas, methods, instructions or products referred to in the content. |
© 2025 by the authors. Licensee MDPI, Basel, Switzerland. This article is an open access article distributed under the terms and conditions of the Creative Commons Attribution (CC BY) license (https://creativecommons.org/licenses/by/4.0/).