Article

Occurrence Mechanism of Crude Oil Components in Tight Reservoirs: A Case Study of the Chang 7 Tight Oil in the Jiyuan Area, Ordos Basin, China

1
State Key Laboratory of Petroleum Resources and Engineering, China University of Petroleum (Beijing), Beijing 102249, China
2
College of Geoscience, China University of Petroleum (Beijing), Beijing 102249, China
3
Hainan Institute of China University of Petroleum (Beijing), Sanya 572024, China
4
PetroChina Changqing Oilfield Co., Xi’an 710018, China
*
Author to whom correspondence should be addressed.
Energies 2025, 18(6), 1440; https://doi.org/10.3390/en18061440
Submission received: 9 February 2025 / Revised: 5 March 2025 / Accepted: 11 March 2025 / Published: 14 March 2025

Abstract

:
Tight oil is an important unconventional hydrocarbon resource. The differences in occurrence characteristics between light components (LCs) and heavy components (HCs) of tight oil profoundly affect its mobility and recovery. Current research has focused mainly on the rapid evaluation of the relative contents of LCs, whereas few studies have systematically analyzed the occurrence characteristics of LCs and HCs and their controlling factors. In this study, the differential occurrence characteristics between LCs and HCs are clarified on the basis of data from thin-section petrography, X-ray diffraction, nuclear magnetic resonance, confocal laser scanning microscopy, and reservoir pyrolysis analysis. An innovative quantitative characterization methodology for the relative occurrence volumes of LCs and HCs is proposed. On the basis of this method, the controlling factors that cause the different occurrence characteristics of LCs and HCs are elucidated. Furthermore, the occurrence characteristics of LCs and HCs in various source–reservoir combinations, physical properties, and development intensities of argillaceous laminae are summarized. Finally, an occurrence model of the crude oil components in the Chang 7 tight reservoir is established. The results show that LCs and HCs in the Chang 7 tight reservoir exhibit differences in occurrence volume, state, morphology, and pore size. These differences are primarily controlled by the hydrocarbon generation intensity of the source rock, the source-to-reservoir distance (SRD), and the content of oil-wet minerals in the reservoir. The source sandwich combination exhibits high physical properties, low hydrocarbon generation intensity, high SRD, and low oil-wet mineral content, resulting in relatively high LCs. The source–reservoir interbed and reservoir sandwich combinations feature a high content of argillaceous laminae, high hydrocarbon generation intensity, low SRD, and high oil-wet mineral content, resulting in relatively low LCs. There are three occurrence models of crude oil components in the Chang 7 tight reservoir: the charging force controlling model, the adsorption effect controlling model, and the argillaceous laminae controlling model. The results of this study provide significant guidance for predicting the fluidity of tight oil, accurately assessing the amount of recoverable tight oil resources, and achieving efficient extraction of tight oil.

1. Introduction

Tight oil, also known as tight reservoir oil, refers to petroleum resources stored in tight reservoirs, such as tight sandstone or tight carbonate rocks, with an in-situ matrix permeability of ≤0.1 mD [1]. Compared to conventional oil, tight oil is near mature, high-quality source rocks, lacks distinct trapping boundaries, and exhibits no natural productivity [2]. As an important component of unconventional oil and gas resources, tight oil is widely distributed and holds great resource potential for exploration and development [3,4]. At present, 66 identified basins contain tight oil resources, with a total globally recoverable reserve estimated at 639.3 billion tons [5]. The United States, recognized as the leading region for tight oil resource development, produced 378 million tons in 2022, representing 64% of its total crude oil output [6]. China also possesses abundant continental tight oil resources, totaling approximately 106.7 billion tons [7], which are located primarily in the Ordos, Songliao, Sichuan, and Junggar Basins [8]. Among them, the Ordos Basin has the highest quantity of tight oil resources, approximately 3.42 billion tons, making it an important potential replacement area for future oil and gas development in China [9,10].
The productivity and recovery efficiency of tight oil are influenced by various factors, including the physical properties of tight reservoirs [11], mineral wettability [12], oil saturation [13,14], crude oil mobility [15], and the stimulability of tight reservoirs [16]. Among these factors, crude oil mobility is one of the most important indicators from a geological perspective for evaluating the economic recoverability of a tight oil reservoir [3,17,18]. Moreover, under similar reservoir conditions, the fluid properties of crude oil are among the primary factors controlling the mobility of tight oil [15,19]. Compared with the heavy components (HCs) of crude oil, the light components (LCs) exhibit greater mobility in the same tight reservoir [15], which results in tight oil accumulation with a high LCs-to-HCs ratio (LHR), which is often an important target for economic recoverability [20]. In unconventional oil and gas reservoirs, which accumulate oil and gas driven by nonbuoyancy forces, including tight and shale reservoirs, the micromigration or short-distance migration of hydrocarbons results in the differential occurrence of LCs and HCs [21]. This causes an uneven distribution of the LHR within the reservoir, even under the condition of a uniform oil and gas source with the same fluid properties [22]. On the basis of crude oil injection experiments and confocal laser scanning microscopy (CLSM), Gao et al. [23] observed and quantitatively characterized the differential occurrence of HCs and LCs during the oil and gas injection process into shale reservoirs. The results revealed that HCs tend to occur more often on the surfaces of oil-wet minerals as adsorbed fluids than LCs do and are more enriched in the inner dark laminae, which contain high concentrations of clay minerals, inorganic carbon, or organic matter. Wang et al. [24] used molecular dynamics simulations to investigate the occurrence characteristics of crude oil with different component compositions in shale reservoirs. The results indicated that, compared with crude oil with a lower proportion of HCs, crude oil with a higher proportion of HCs has more adsorption layers and a greater adsorption density. On the basis of the results of pore network structure characterization of shale reservoirs and multistage pyrolysis experiments, Ma et al. [25] analyzed the effects of pore network structure, organic matter abundance, and maturity on the occurrence characteristics of crude oil. The results indicated that shale pore characteristics have a minor influence on the amounts of LCs and HCs, and that reservoirs with high organic matter abundance and maturity tend to have a relatively high LHR and free hydrocarbon content, making them favorable areas for exploration. In a study on the micromigration mechanisms of shale oil and gas, Hu et al. [21] reported that LCs, as the primary migrating fluid from hydrocarbon-rich layers to hydrocarbon-poor layers, are predominantly enriched in pores ranging from 100–5000 nm in size. In contrast, HCs, as the main residual fluid in hydrocarbon-rich layers, are enriched primarily in pores ranging from 1 to 2 nm. This suggests that, in shale reservoirs where significant migration phenomena occur, the pore distribution characteristics play a distinct role in controlling the differential distributions of LCs and HCs. In summary, in shale reservoirs, mineral wettability [23], pore structure characteristics [21,25], the presence of laminae rich in clay or inorganic carbon [23], organic matter content [26], and organic matter maturity [25] collectively control the differential distribution characteristics of LCs and HCs.
Tight oil and shale oil share many similarities, including their hydrocarbon charging force, which is overpressure within the source rock; their reservoir pore networks, which are composed of nanopores and micropores; their lithology, which contains a high content of clay minerals; and their reservoirs, which contain substantial amounts of carbonaceous and argillaceous laminae [20]. Moreover, the short-distance migration of oil during the charging process in tight reservoirs is significantly greater than the micromigration between different laminae within shale reservoirs [20,27]. Therefore, tight reservoirs also commonly exhibit different distributions of LCs and HCs [28]. However, research on the occurrence characteristics of crude oil and the differential distributions of LCs and HCs in tight reservoirs is very limited, resulting in an unclear understanding of the mechanisms and controlling factors for the differential occurrence of LCs and HCs in tight reservoirs. To address this scientific question, this study innovatively proposes a method that combines Rock-Eval reservoir pyrolysis with confocal laser scanning microscopy (CLSM) observations to characterize the differential distributions of LCs and HCs in tight reservoirs quantitatively. With this approach, the Chang 7 tight oil reservoir in the Jiyuan area of the Ordos Basin is taken as an example. Core data, field emission scanning electron microscopy (FE-SEM) observations, nuclear magnetic resonance (NMR) experiments, and whole-rock X-ray diffraction (XRD) analysis are used to clarify the controlling effects of the pore structure, source-to-reservoir distance (SRD), mineral wettability, and argillaceous laminae on the differential occurrence of LCs and HCs. Furthermore, the differential occurrence characteristics and controlling factors of crude oil in three different source–reservoir combinations within the Chang 7 tight reservoir are summarized and compared. Finally, a model for the occurrence of crude oil in the Chang 7 tight reservoir in the Jiyuan area is established. The findings of this study provide a method for rapidly predicting the spatial distribution of tight oil with high LCs contents and offer significant guidance for predicting the mobility and large-scale economic extraction of crude oil in tight reservoirs.

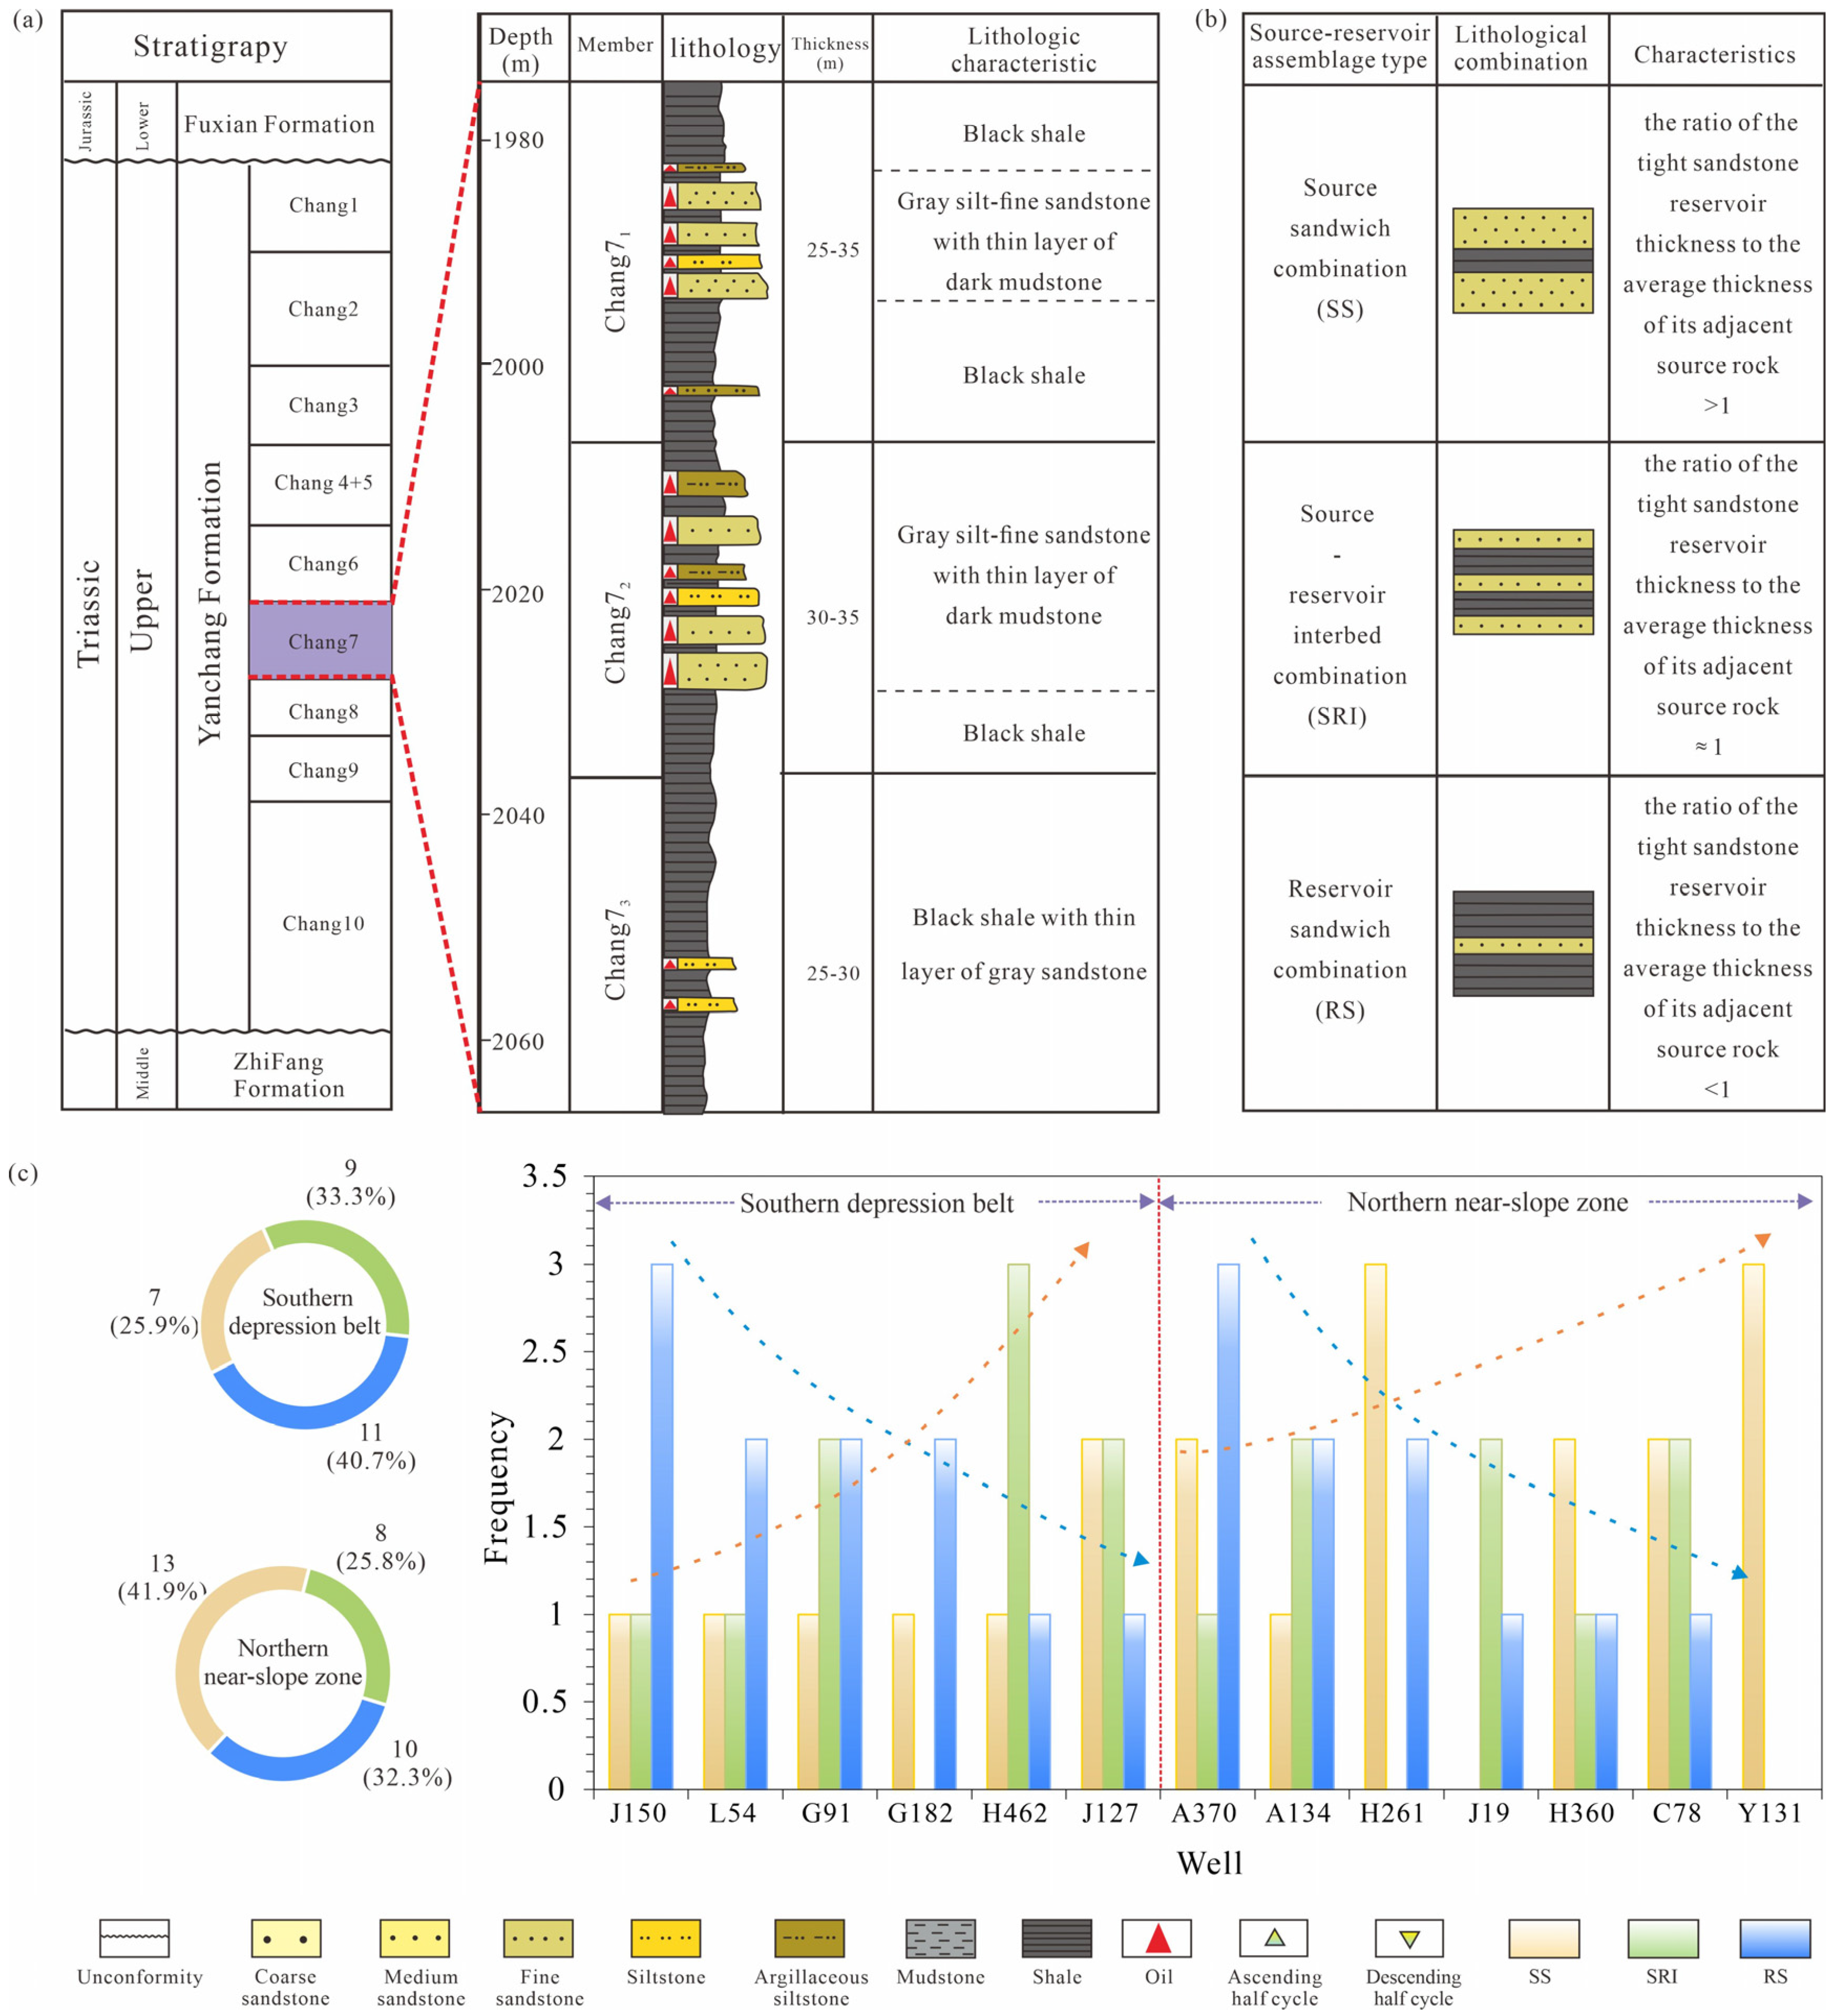
2. Geological Setting

The Ordos Basin is the second largest oil- and gas-bearing basin in China, with an area of approximately 37 × 104 km2 [29]. The Ordos Basin can be further divided into six structural units, from south to north, namely, the Yimeng uplift, the Weibei uplift, the western margin thrust belt, the Tianhuan depression, the Yishan slope, and the Jinxi folding belt [30] (Figure 1a). The Jiyuan area is one of the most important tight oil exploration blocks in the Ordos Basin [31]. It is located in the central–western part of the Ordos Basin and is distributed mainly in the Tianhuan depression, with a small part in the Yishan slope (Figure 1a). In the Jiyuan area, the Upper Triassic Yanchang Formation is the main oil-bearing stratum. It can be subdivided into ten members, from bottom to top, ranging from the Chang 10 member to the Chang 1 member (Figure 1b), which records the entire development process of the Ordos Basin [32]. Among them, the Chang 7 member is an important source rock and tight reservoir (Figure 1c). The Chang 7 member was deposited in an environment where the delta interacted with the lake. It is mainly composed of fine-grained sandstone interbedded with dark shale. The fine-grained sandstones, including fine sandstone, siltstone, and argillaceous siltstone, developed primarily in the subaqueous distributary channel environment of the delta front and the gravity flow environment of the prodelta (Figure 1b and Figure 2), providing important reservoir spaces for the development of tight oil [33,34]. The sandstone in the study area contains a high abundance of argillaceous laminae, which appear dark brown or gray-black under the microscope, with well-defined boundaries and a thickness of 0.1–3 mm per layer. These laminae have a high clay mineral content and contain a small amount of well-sorted quartz and other clastic minerals [35]. The dark shale mainly occurs in the Chang 73 submember, which developed in a semideep lake environment (Figure 1b) and is a thick source rock with good organic matter type, moderate maturity, and enormous resource potential, providing favorable oil-source conditions for the formation of tight oil (Figure 1c) [36,37].
The hydrocarbon generation intensity of the Chang 73 source rock ranges from 0 to 5 × 10⁶ t/km2 (Figure 1c). In the Jiyuan area, the hydrocarbon generation intensity of the Chang 73 source rock is relatively weak, at less than 2 × 10⁶ t/km2. The hydrocarbon generation intensity in the southern part of the Jiyuan area is greater than 1 × 10⁶ t/km2, whereas in the northern part of the Jiyuan area, it ranges from 0 to 1 × 10⁶ t/km2 (Figure 1c) [36]. The source–reservoir combination type is an important element affecting the hydrocarbon supply conditions, hydrocarbon charging conditions, and occurrence characteristics of crude oil in tight reservoirs [32]. In the Jiyuan area, there are three types of source–reservoir combinations: the source sandwich combination (SS), source–reservoir interbed combination (SRI), and reservoir sandwich combination (RS) (Figure 2). In this study, the source–reservoir combination types are defined on the basis of the ratio of the tight sandstone reservoir thickness to the average thickness of its adjacent source rock. A ratio greater than 1, approximately equal to 1, and less than 1 corresponds to SS, SRI, and RS, respectively. Moreover, as this ratio increases, the probability of the development of argillaceous laminae in tight reservoirs also increases (Figure 2). In the Jiyuan area, the SS is mainly developed in the low hydrocarbon generation intensity area in the northern near-slope zone, whereas the SRI and RS are primarily developed in the area with high hydrocarbon generation intensity in the southern depression belt (Figure 2).
The study area is characterized by the development of nearly SN-trending and NW-trending faults, followed by NE-trending faults [32]. Faults and associated fractures play a crucial role in modifying tight sandstones, serving as key controlling factors for tight gas production and significantly influencing the occurrence space and occurrence state of tight oil and gas [38]. However, the faults in the study area are relatively large in scale, and the overlying strata of the target formation mainly consist of sandstone reservoirs. This results in a lack of effective sealing conditions, leading to the faults acting as conduits and destructive forces on the tight oil reservoirs rather than significantly affecting the occurrence differentiation of LCs and HCs in tight oil.

3. Materials and Methodology

3.1. Samples

This study extensively collected optical thin section data from 165 wells in the Jiyuan area, specifically focusing on the Chang 7 member of tight sandstone reservoirs, to determine the main lithology characteristics, pore types, and pore sizes of the reservoir. Additionally, 13 representative wells were selected for intensive sampling of the tight reservoir cores, and a further series of experiments was conducted (Figure 1b,c). In the Jiyuan area, these wells are evenly distributed across the northern slope area, where the delta front and semideep lake sedimentary system are mainly developed, to the central depression, where the semideep lake and gravity flow sedimentary system are primarily developed (Figure 1b). A total of 40 representative samples of tight sandstone were selected from representative wells to further conduct Rock-Eval reservoir pyrolysis experiments, XRD analysis, and FE-SEM observations. Additionally, 12 samples with different source–reservoir combination types were selected from 40 samples for further analysis using nuclear magnetic resonance (NMR) experiments. Moreover, among these 40 samples, three tight reservoir samples with high crude oil saturation with different source–reservoir combination types were selected for CLSM observation to clarify the occurrence characteristics of crude oil in the tight reservoirs, including the sample from 2557.5 m in J127 (denoted as Sample I), the sample from 2407.8 m in L54 (denoted as Sample II), and the sample from 2710.1 m in G91 (denoted as Sample III). The lithology of Sample I is gray–brown fine sandstone, and its source–reservoir combination type is SS, while that of Sample II is gray fine sandstone with dark-colored argillaceous laminae, and its source–reservoir combination type is SRI. In contrast, Sample III is gray–brown siltstone, and its source–reservoir combination type is RS.

3.2. Experiments

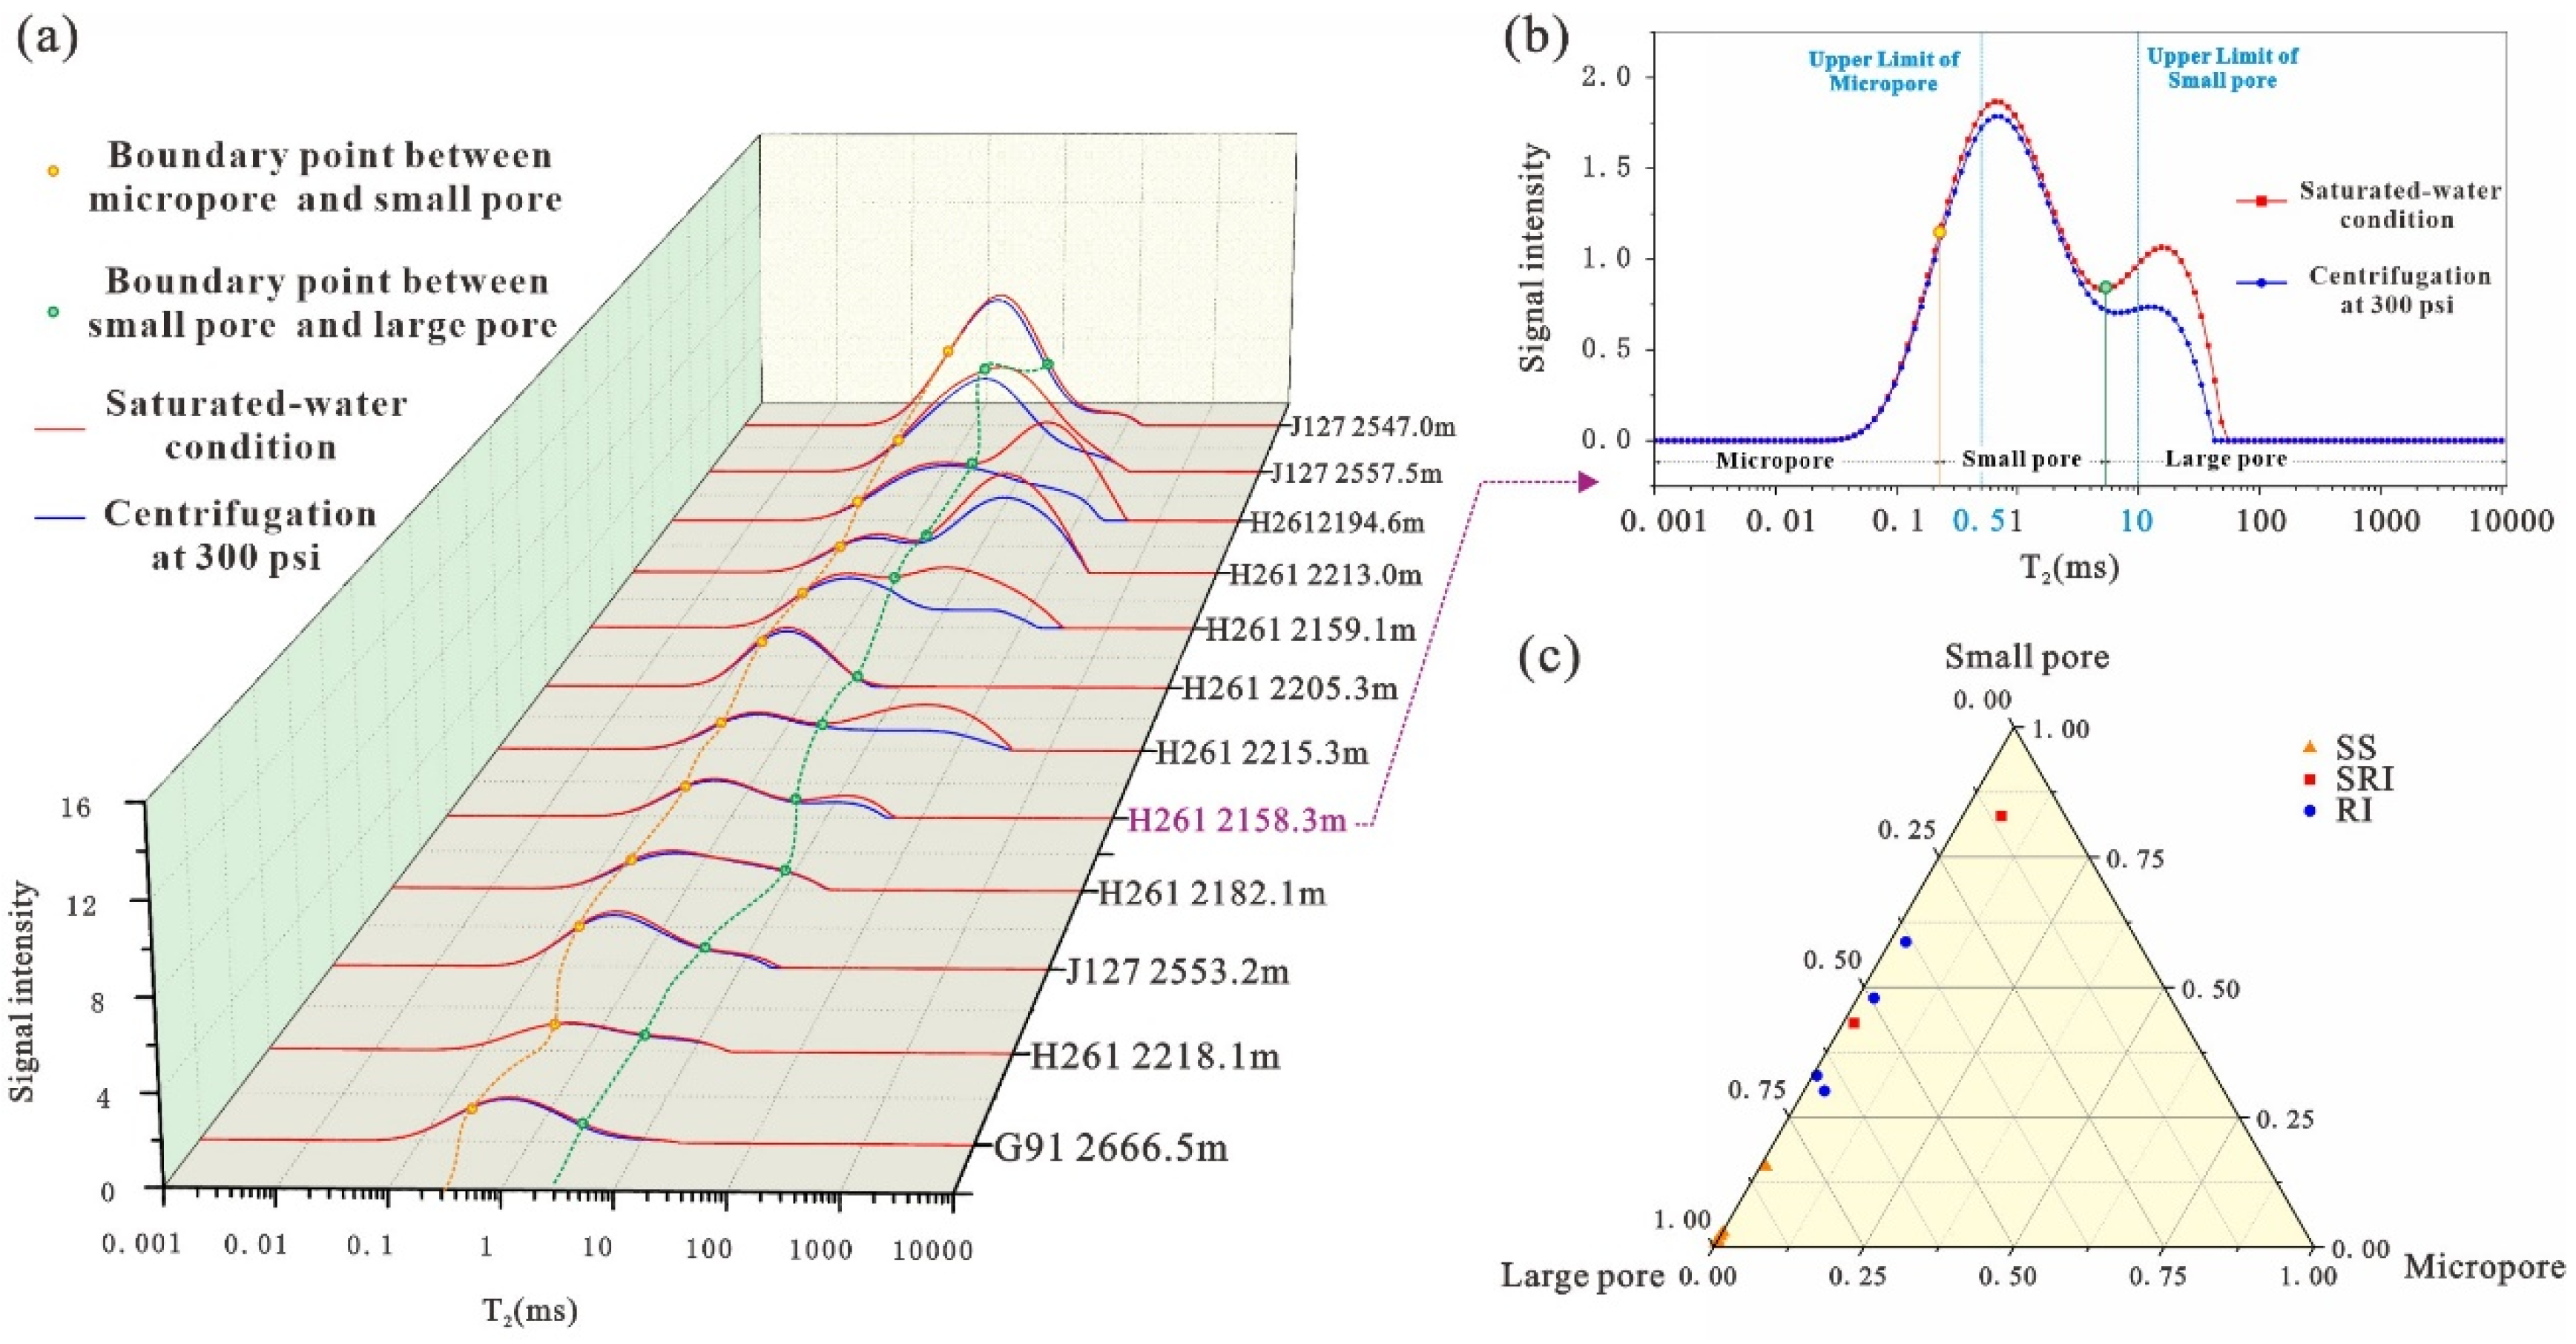
3.2.1. XRD, FE-SEM, and NMR Analysis

In this study, the X-ray diffraction (XRD) experiment was performed using a Bruker D2 Phaser instrument (Bruker AXS GmbH, Karlsruhe, Germany) at the State Key Laboratory of Petroleum Resources and Engineering, China University of Petroleum (Beijing), following the specific operating procedures described by Wang et al. [32]. The purpose of the XRD experiment was to determine the mineral composition and relative abundance of each tight sandstone reservoir sample. The field emission scanning electron microscopy (FE-SEM) observations were conducted using a Hitachi SU8010 instrument (Hitachi High-Tech Corporation, Tokyo, Japan) at the Energy Materials Microstructure Laboratory, China University of Petroleum (Beijing), and the specific operating procedures were described by Zang et al. [39]. The FE-SEM observations aimed to identify the mineral distribution characteristics and the geometric morphology, size, and connectivity of the pore structures in each tight reservoir sample. The nuclear magnetic resonance (NMR) experiment was conducted using a SPEC-RC035 low-field NMR spectrometer (Suzhou Niumag Analytical Instrument Corporation, Suzhou, China) at the State Key Laboratory of Petroleum Resources and Engineering, China University of Petroleum (Beijing). Additionally, the methods for sample pretreatment and obtaining T2 relaxation time spectra followed those described by Qiao et al. [40]. After the sample was centrifuged for 1 h under a pressure of 300 psi, NMR was performed on the sample again to obtain the T2 spectrum of the centrifuged sample. The T2 relaxation time, spectra obtained before and after centrifugation were used to characterize the physical properties of each sample.

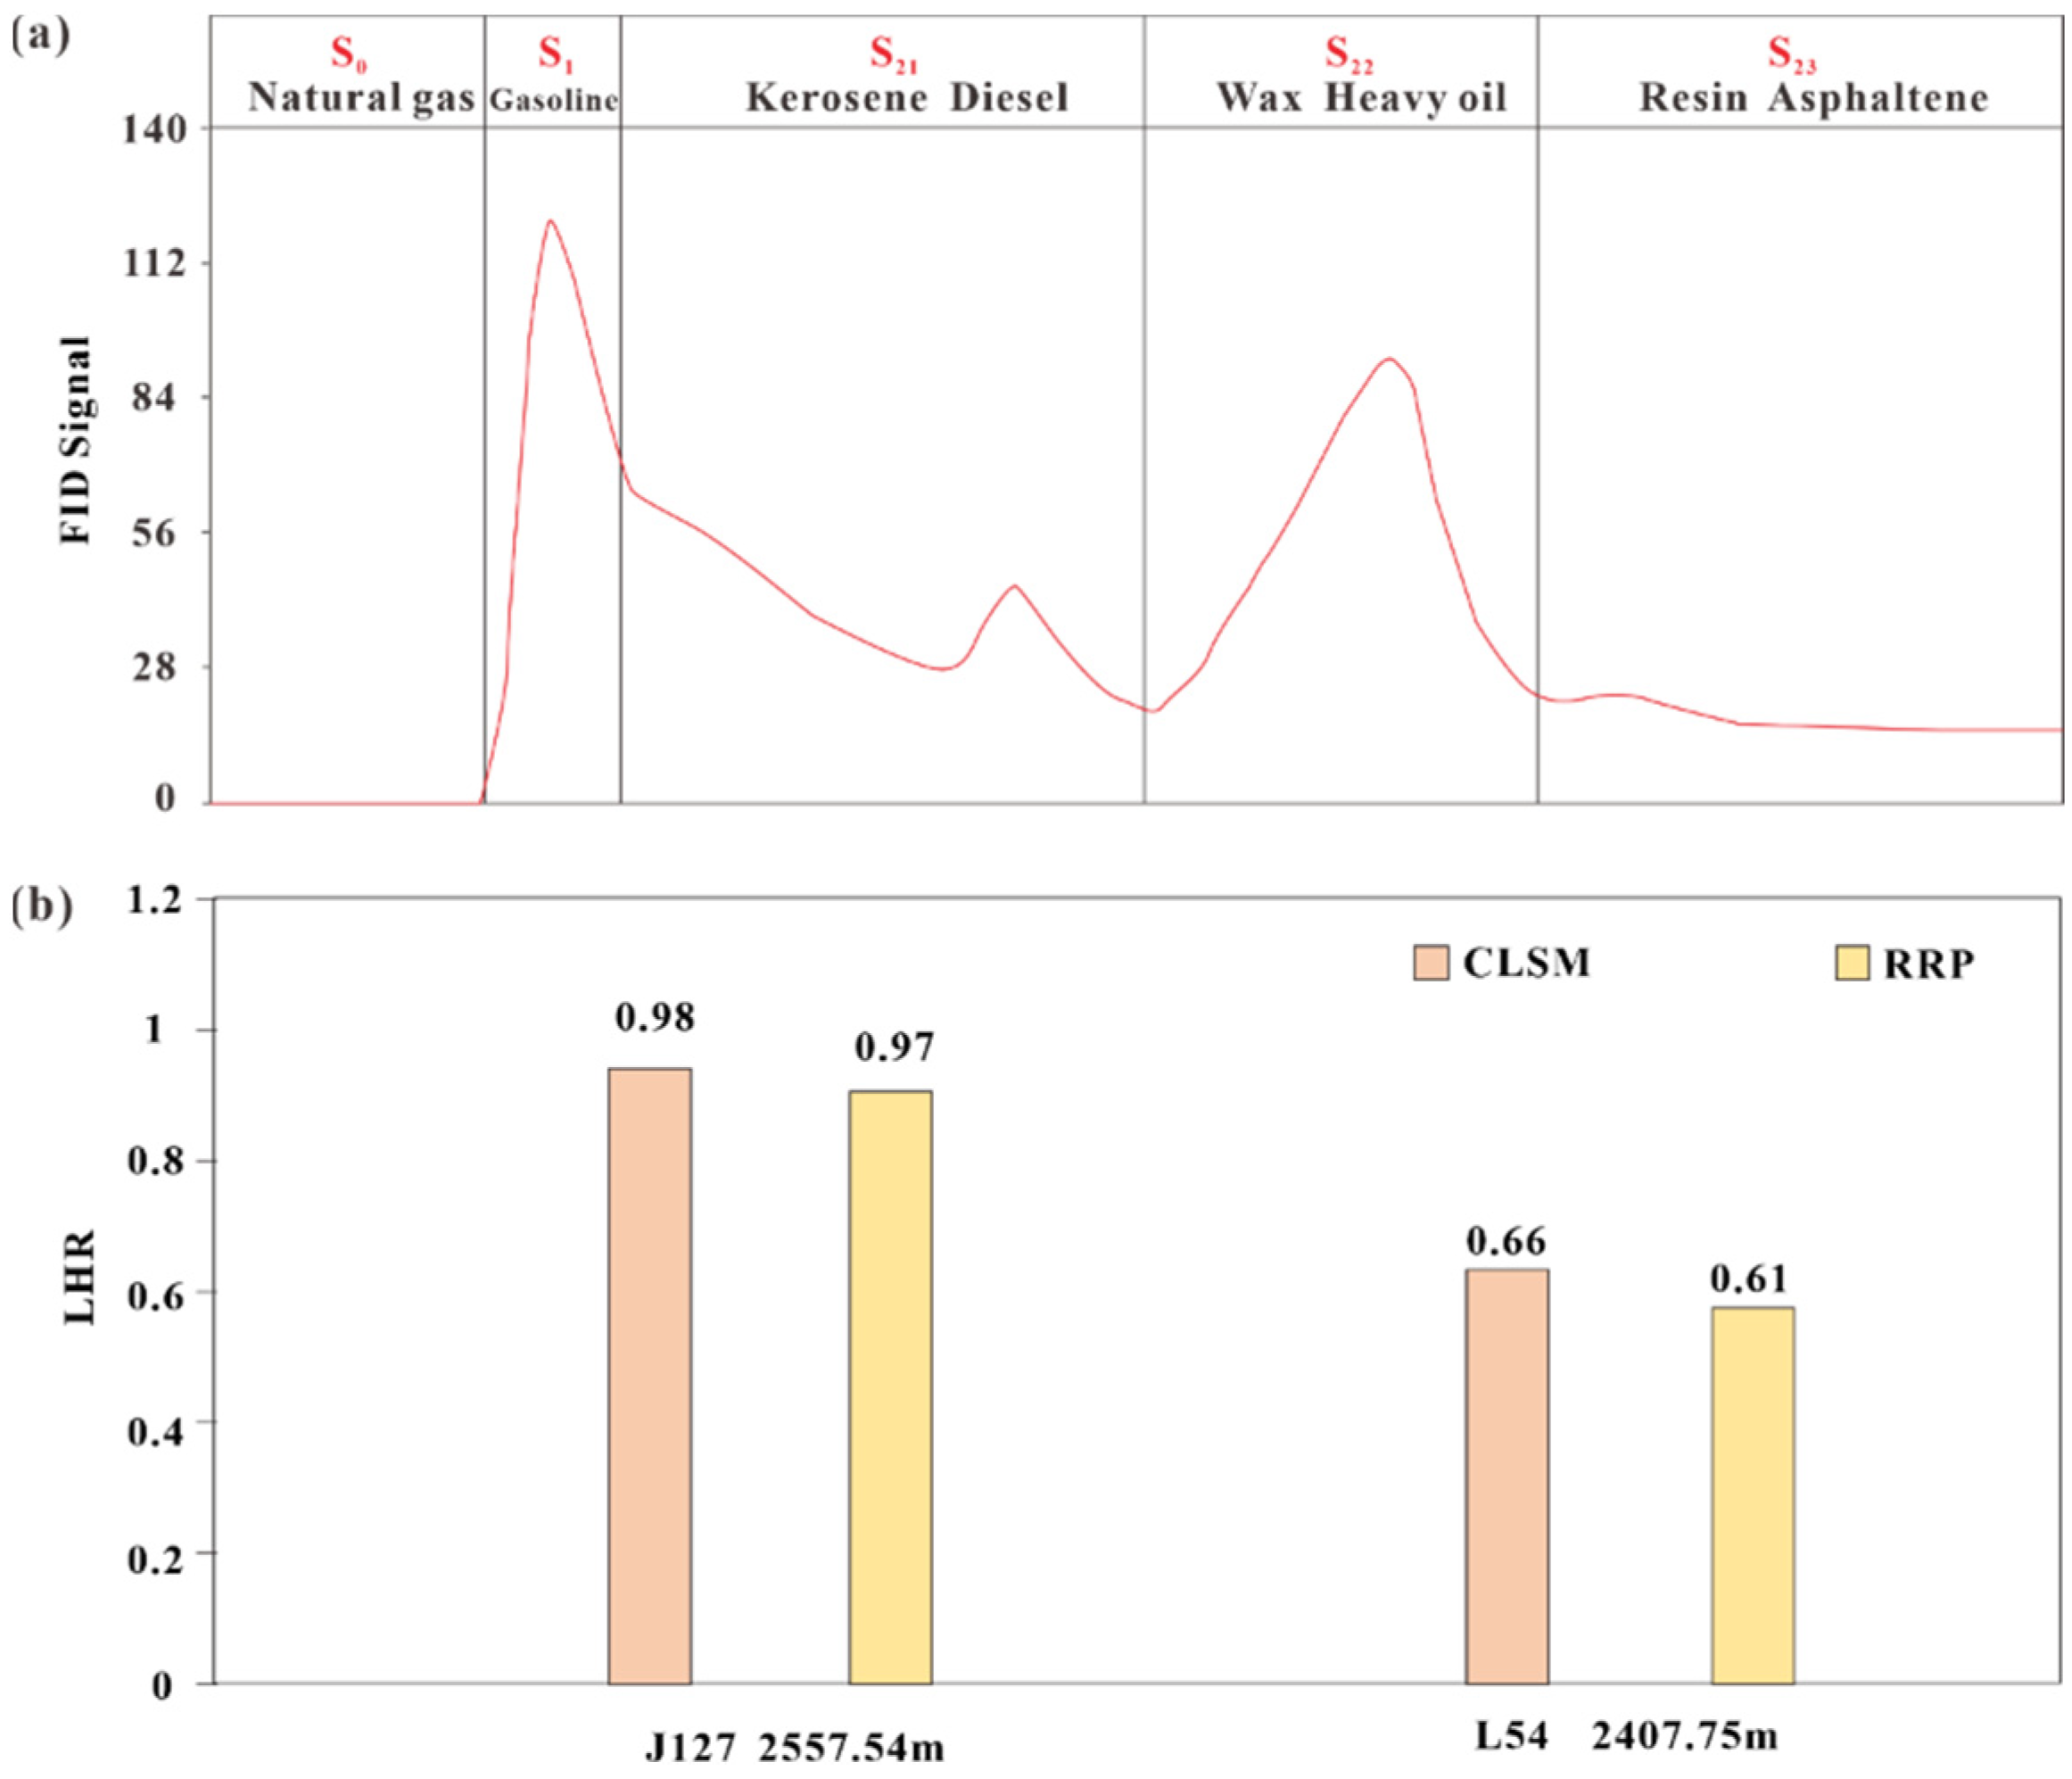
3.2.2. Reservoir Rock Pyrolysis Analysis

Reservoir rock pyrolysis experiments are methods that simulate the petroleum distillation process [41]. These methods are based on the differences in the boiling points of various components in crude oil, which are separated within specific temperature ranges as the temperature gradually increases. In this study, reservoir pyrolysis experiments on tight reservoir samples were conducted using a Rock-Eval II instrument (Vinci Technologies, Nanterre, France) at the State Key Laboratory of Petroleum Resources and Engineering, China University of Petroleum (Beijing). First, a sample weighing 99.5–100.5 mg was crushed to a particle size of 60–80 mesh. The crushed samples were subsequently placed in the crucible of the Rock-Eval II pyrolyzer to conduct the pyrolysis experiments. To prevent significant evaporation of light hydrocarbons, the crushing and testing of the samples were completed within 2 h. The pyrolysis crucible was initially heated at a constant temperature of 90 °C for 2 min to obtain the S0 signal. The sample was subsequently heated at a constant temperature of 200 °C for 1 min to obtain the S1 signal. Next, the temperature was increased at a rate of 50 °C/min to 350 °C and maintained at that temperature for 1 min to obtain the S21 signal. Afterward, the temperature was increased at 50 °C/min to 450 °C and maintained for 1 min to obtain the S22 signal. The temperature was increased at 50 °C/min to 600 °C and maintained for 1 min to obtain the S23 signal. Finally, the S4 signal was obtained at 600 °C for 7 min at a constant temperature. On the basis of this pyrolysis heating rate, the S0, S1, S21, S22, S23, and S4 signals represent the natural gas components, gasoline components, kerosene and diesel components, wax and heavy oil components, resin and asphaltene components, and residual carbon components in the crude oil, respectively (Figure 3a) [41]. The various components of crude oil are composed of hydrocarbons and nonhydrocarbons with different carbon chain lengths. The hydrocarbon and nonhydrocarbon components of natural gas, gasoline, kerosene, diesel, wax, heavy oil, resin, and asphaltene have carbon chain lengths ranging from 1–4, 5–12, 10–16, 12–20, 20–40, 20–60, 50–200, and 50–200, respectively. Additionally, on the basis of the carbon chain length of hydrocarbons, crude oil components can be classified into LCs and HCs. Crude oil components with a carbon chain length less than or equal to 20 have lower density and belong to the LCs of the crude oil, whereas other components of crude oil have higher density and belong to the HCs of the crude oil [42]. After pyrolysis, some residual oil remains. The residual oil content is determined by measuring the residual organic carbon through heat oxidation, and the residual organic carbon is divided by 0.9 to convert it into residual oil. Residual oil refers to the heavy oil components remaining in the rock after pyrolysis of the source rock, which mainly consists of the residues of resins and asphaltenes after pyrolysis [41]. For the reservoir rock pyrolysis experiments in this study, the mass of the LCs of crude oil is the sum of the S0, S1, and S21 signals, whereas the HCs are the sum of the S22, S23, and S4/0.9 signals.

3.2.3. Laser Scanning Confocal Microscopy

The laser scanning confocal microscopy (CLSM) experiment was conducted using a Leica TCS SP8 (Leica Microsystems, Wetzlar, Germany) at the State Key Laboratory of Petroleum Resources and Engineering, China University of Petroleum (Beijing). First, objective areas in the sample were selected for observation. The selected areas were then finely ground into slices with a thickness of 0.04–0.05 mm, and these slices were placed on a stage maintained at a temperature of 25 °C and a relative humidity of 30–46% for observation. The maximum imaging resolution of this equipment is approximately 200 nm, and a fixed wavelength 488 nm laser was used to excite the sample. On the basis of the wavelength of the fluorescence signals obtained from the excited sample, CLSM can independently observe and quantitatively characterize the occurrence volumes of the LCs and HCs in the tight reservoir. The fluorescence capture range for the LCs of crude oil is 490–600 nm, whereas the fluorescence capture range for the HCs is 600–800 nm [23]. CLSM distinguishes between LCs (including low-carbon saturated hydrocarbons and short-chain aromatic hydrocarbons) and HCs (including high-carbon saturated hydrocarbons, long-chain aromatic hydrocarbons, nonhydrocarbons, and asphaltenes) in crude oil on the basis of the different wavelength ranges of the fluorescence signals generated by excitation.

3.3. Characterization Method for LHRv

Although the CLSM and reservoir rock pyrolysis experiments have different principles for distinguishing LCs and HCs [43,44], both classify the crude oil components with lower density, i.e., those with shorter carbon chains, as LCs, and the crude oil components with higher density, i.e., those with longer carbon chains, as HCs. The differences in the principles of the two experiments lead to only slight differences in defining the critical conditions for distinguishing the LCs and HCs. This also indicates a high likelihood of a good correlation between the results of the two experiments. CLSM is an important experimental technique for observing the microscale characteristics of the LCs and HCs of crude oil, but it is difficult to characterize their macroscopic occurrence patterns [45]. On the other hand, the reservoir rock pyrolysis experiment is suitable for analyzing the macroscopic occurrence patterns of the LCs and HCs of crude oil, but their microscopic occurrence characteristics cannot be observed [46]. Therefore, if the linkage between the two experiments for the quantitative characterization of crude oil LCs and HCs is established, the results of the two experiments can complement each other to analyze the occurrence characteristics of the LCs and HCs on both the microscopic and macroscopic scales jointly. However, the results of reservoir pyrolysis experiments reveal the masses of different components [15], whereas CLSM provides the volume fractions of LCs and HCs [47]. In addition to the dimensional difference, the results obtained from CLSM are not absolute contents of the LCs and HCs but rather relative proportions [23]. To establish a connection between the results of the two experiments, the volume ratio of LCs and HCs (LHRv) was used to characterize the relative proportions of LCs and HCs (Formula (1)). The LHRv can be directly calculated according to the results of CLSM experiments. For the reservoir rock pyrolysis experiment, LHRv can be calculated via Formula (2). The LHRv values calculated on the basis of both experiments on Sample I and Sample II show small differences and are strongly relevant, demonstrating the feasibility of this approach (Figure 3b).
L H R v = L C s v H C s v
L H R v = ( S 0 ρ 0 + S 1 ρ 1 + S 21 ρ 21 ) / ( S 22 ρ 22 + S 23 ρ 23 + S 4 0.9 ρ 4 )
where LHRv represents the volume ratio of LCs and HCs, dimensionless; LCsv and HCsv denote the volume fraction of the LCs and HCs obtained from the CLSM experiment, nm3; S11, S21, S22, S23, and S4 denote the masses of gasoline, kerosene and diesel, wax and heavy oil, colloid and asphaltene, and residual oil obtained from the reservoir rock pyrolysis experiment, mg/g, respectively; and ρ0, ρ1, ρ21, ρ22, ρ23, and ρ4 represent the densities of the natural gas, gasoline, kerosene, and diesel, wax and heavy oil, colloidal and asphaltene, and residual oil components of the crude oil, g/cm3, with values of 0.0007, 0.7, 0.8, 1.0, 1.25, and 1.4, respectively [48].
Notably, in this study, the core samples were not saturated with oil during the experimental process. Additionally, during the processing of the raw experimental data, no light hydrocarbon recovery was performed on the results of the reservoir pyrolysis experiment. This approach was taken because it is challenging to replicate the actual geological conditions of the oil charging process under laboratory conditions [49]. This could impact the occurrence state of LCs and HCs and result in significant differences between the occurrence characteristics of LCs and HCs in processed core samples and their actual occurrence under geological conditions. In addition, there are numerous methods for light hydrocarbon recovery, and the factors influencing light hydrocarbon dissipation are diverse and complex [44]. Using a unified recovery method alone may increase the differences in the relative contents of LCs and HCs under actual geological conditions. Furthermore, this study focused primarily on the relative changes in LCs and HCs in tight oil. The trend of changes in the relative proportions of LCs and HCs in all samples caused by the dissipation of light hydrocarbons is the same. Therefore, not performing light hydrocarbon recovery on the results of the reservoir pyrolysis experiment allows for the maximum preservation of information on the relative contents of LCs and HCs in tight oil reservoirs.

4. Results

4.1. Tight Reservoir Characteristics

The lithology of the Chang 7 tight sandstone reservoir in the Jiyuan area is mainly composed of arkose and lithic arkose (Figure 4a). The clastic components are primarily clay minerals, quartz, and feldspar (including plagioclase and potassium feldspar), followed by calcite and dolomite (Figure 4b). The sandstone in the Chang 7 member is dominated by fine sandstone, moderately sorted, subangularly rounded, and presents point–line contacts between particles (Figure 4c1,c2). On the basis of microscopic observations, the pore types in the sandstone samples from the Jiyuan area can be classified into five categories: residual intergranular pores, intergranular dissolution pores, intragranular dissolution pores, and intercrystalline pores (Figure 4d,e). Residual intergranular pores dominate the pore system and are characterized by regular shapes between the clastic particles. Intergranular dissolution pores are formed by dissolving mineral particles (such as feldspar) or cementing materials (such as carbonate). Intragranular dissolution pores are distributed mainly within feldspar grains and often follow cleavage. In addition, intragranular dissolution pores can also occur within lithic fragments. The tight sandstone in the study area contains a significant number of intercrystalline pores. These pores often appear in the inner walls of dissolution pores and residual intergranular pores or on the surface of grains. Since faults and fractures primarily act as conduits and destructive factors in the tight oil reservoirs of the study area, with minimal impact on the occurrence differentiation of LCs and HCs in tight oil, this study focuses on the characteristics of pore storage space and does not provide a detailed discussion of fracture characteristics.
The reservoir water saturation NMR data in the study area can be classified into three types: unimodal, symmetric bimodal, and right-skewed bimodal (Figure 5a). By using the water saturation and centrifuged NMR results, the micropores, small pores, and large pores in tight sandstone reservoirs can be identified [50]. The boundary between micropores and small pores is defined by the T2 value corresponding to the point where differences start to appear in the T2 spectrum before and after centrifugation. Moreover, the boundary between small pores and large pores is defined by the T2 value corresponding to the point where a significant difference begins to appear in the T2 spectrum before and after centrifugation (Figure 5b). In addition, the T2 value of NMR is proportional to the pore size [5]. Previous studies have commonly used 1 ms and 10 ms as the boundary values between micropores and small pores, and between small pores and large pores, respectively [51,52]. Based on the distribution range of boundary values determined before and after centrifugation of the study area samples, this study adjusted the boundary values, defining 0.5 ms as the threshold between micropores and small pores and 10 ms as the threshold between small pores and large pores, to better reflect the actual conditions of the study area. The T2 value distribution of small pores in the study area generally ranges from 0.3 to 3 ms, whereas the T2 values of large pores are primarily distributed in the >3 ms range. The proportion of large pores in the SS is relatively high, with an average value of 95.88%. In contrast, the proportion of small pores corresponding to the SRI and RS is greater, with a distribution range of 30.03% to 82.91% (Figure 5c).

4.2. Occurrence Characteristics of LCs and HCs

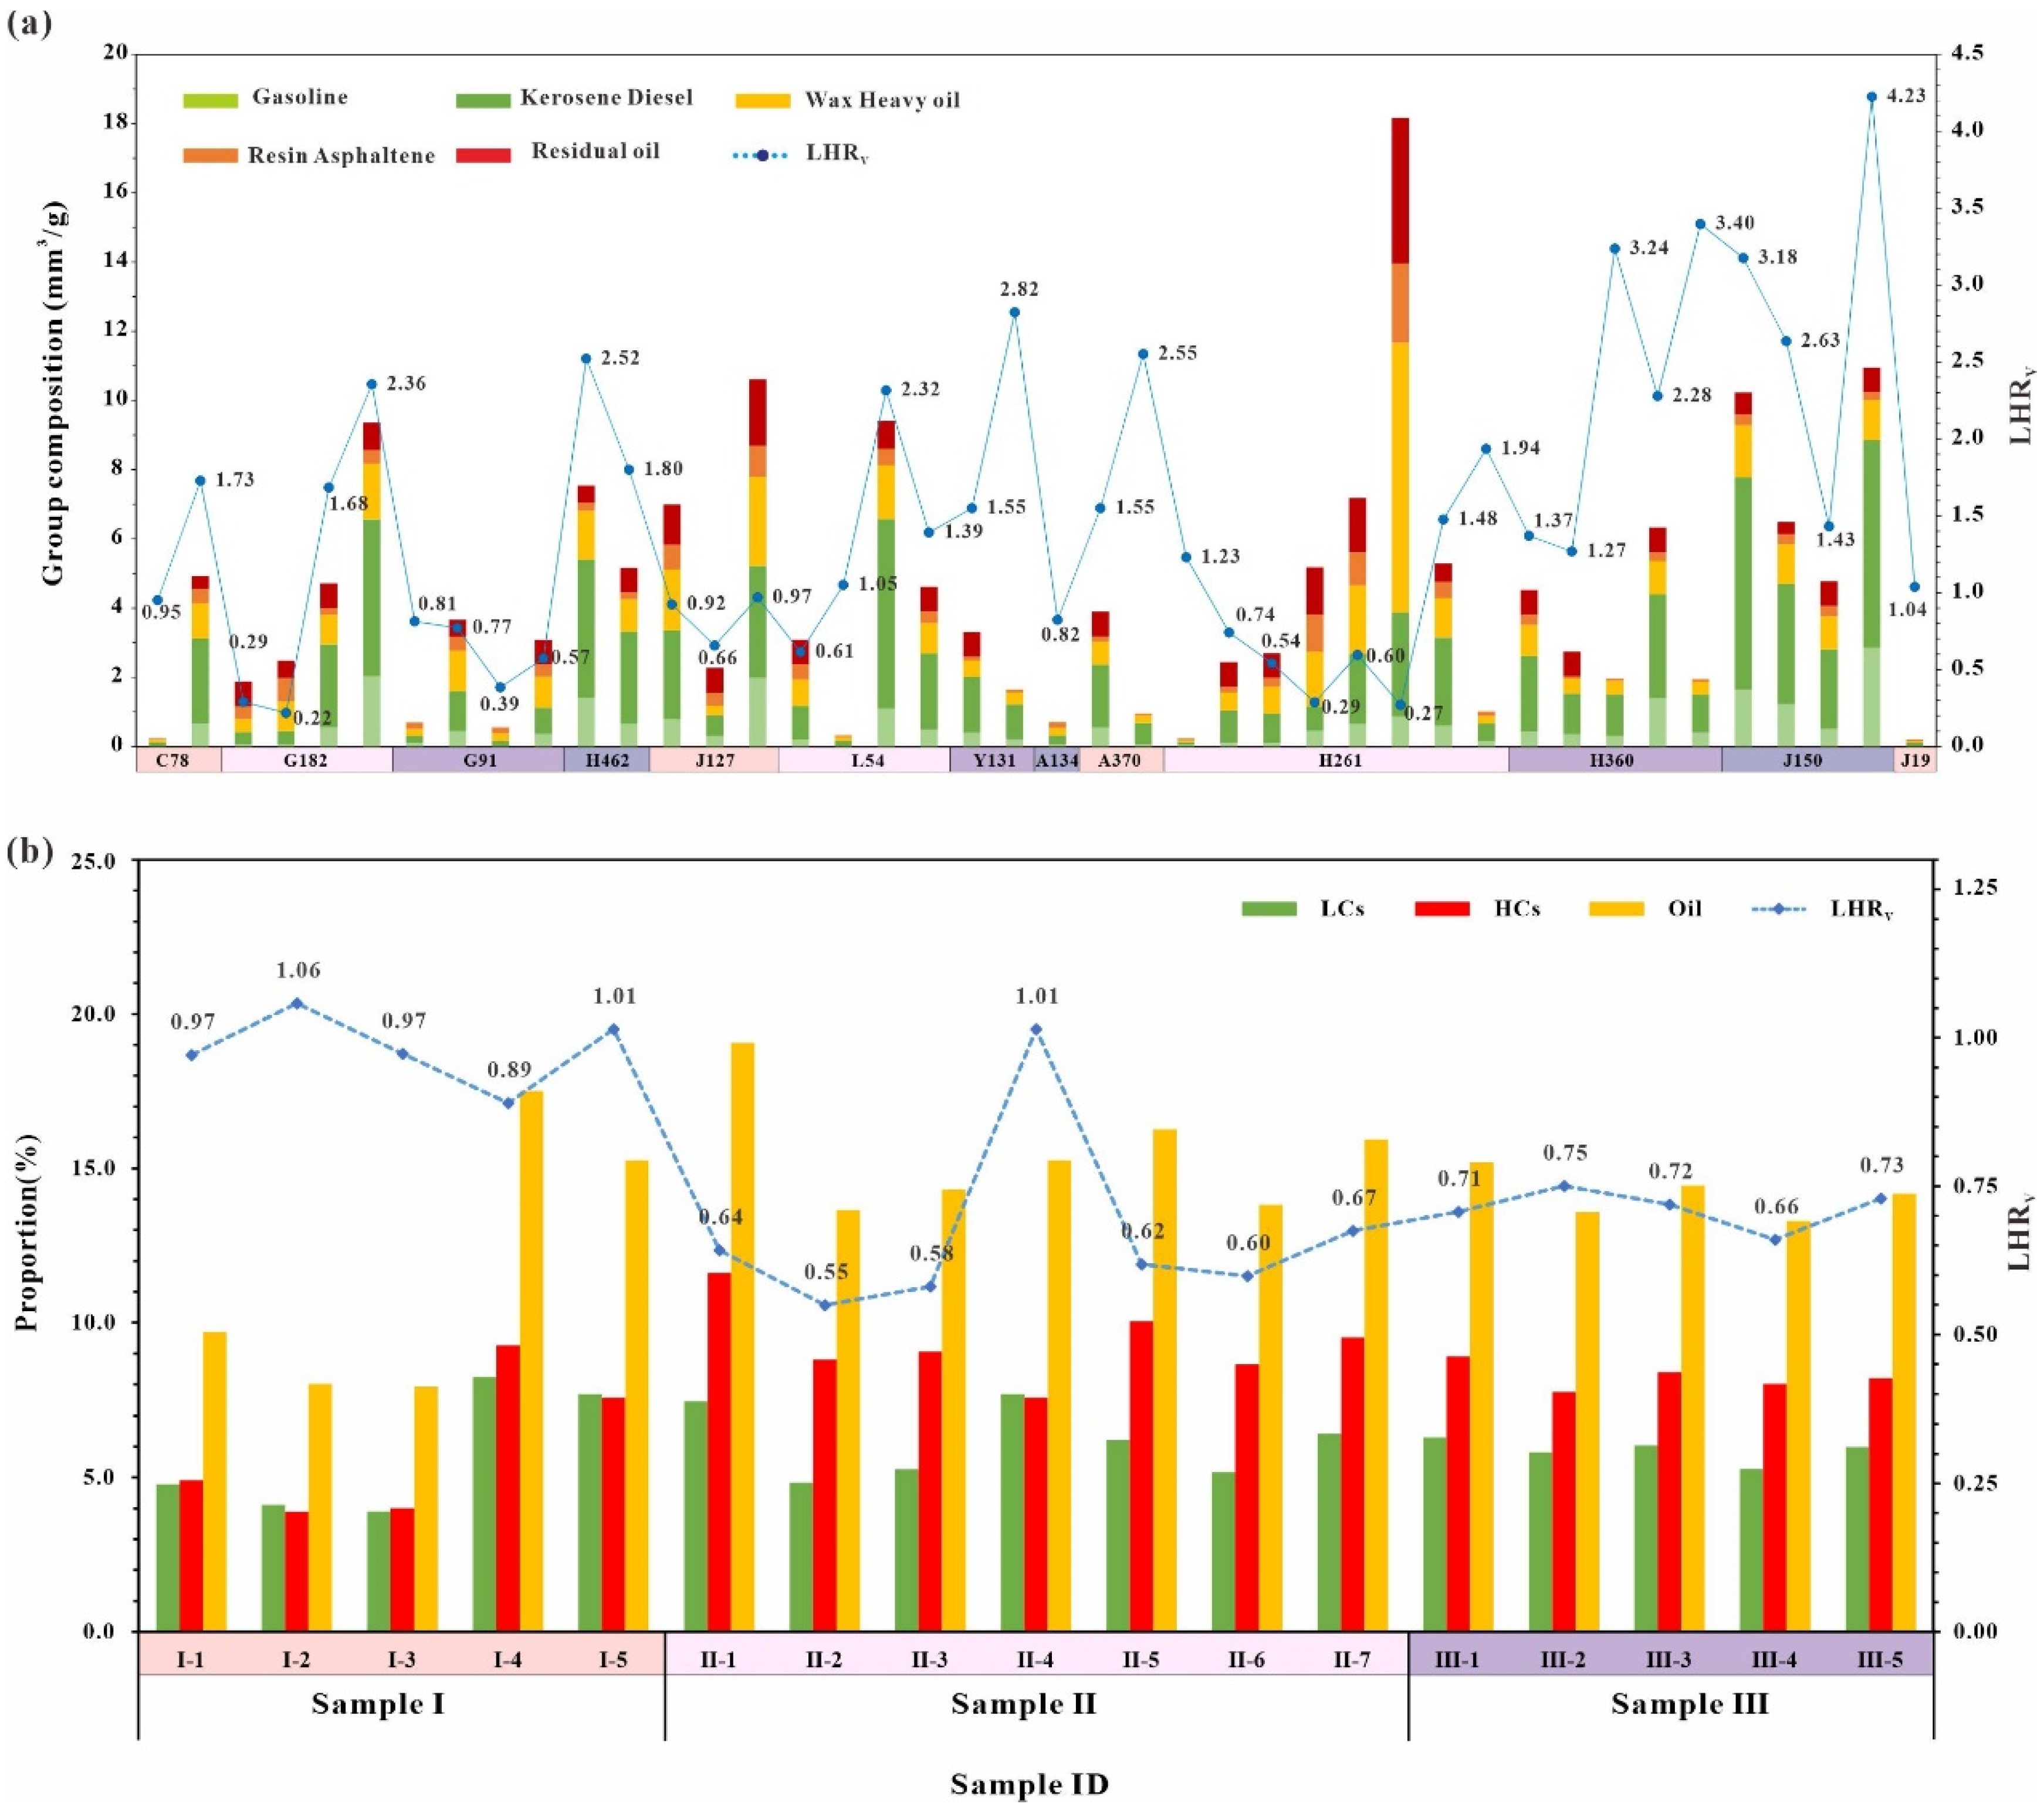
4.2.1. Occurrence Volume Characteristics

The volumetric transition results of the reservoir rock pyrolysis experiments reveal that there is a significant variation in the occurrence volume of crude oil in different tight reservoir samples, ranging from 0.20–18.16 mm3/g, with an average value of 4.39 mm3/g. However, the standard deviation can reach 3.69 mm3/g (Figure 6a). The LHRv in each sample also greatly differed, ranging from 0.22–4.23, with an average of 1.49 and a standard deviation of 0.97 (Figure 6a). Notably, even samples from adjacent depths within the same well show significant differences in the occurrence volumes of crude oil and LHRv (Figure 6a). For example, in the case of the four tight reservoir samples from well G182, the maximum depth difference between the samples is only 23.3 m, but the range of occurrence volumes of crude oil and LHRv can reach 7.48 mm3/g and 2.14, respectively (Figure 6a). Additionally, even within different CLSM fields of the same sample, there are still small variations in LHRv (Figure 6b). The range of LHRv in Sample I is 0.89–1.06, with a mean of 0.98 and a standard deviation of 0.06 (Figure 6b). The range of LHRv in Sample II is 0.55–1.01, with a mean of 0.66 and a standard deviation of 0.14 (Figure 6b). Among them, the anomalously high value of LHRv appears in fields of view II–4, which may be due to the large difference between the local reservoir characteristics corresponding to fields of view II–4 and the overall reservoir characteristics of Sample II. The range of LHRv in Sample III is 0.66–0.75, with a mean of 0.71 and a relatively low standard deviation of only 0.03 (Figure 6b).
The composition of the expelled crude oil from source rocks during each hydrocarbon expulsion stage is approximately the same, which means that the LHRv values of the expelled crude oil in each stage should also be approximately consistent and have a smaller standard deviation. The significant fluctuations in the LHRv among the different samples of the Chang 7 tight oil formation indicate that there was significant differentiation in the occurrence of LCs and HCs during the formation process, which primarily arises from the differences in fluid properties between the LCs and HCs of the crude oil and their interactions with the reservoir.

4.2.2. Occurrence State and Morphology Characteristics

In the original CLSM observation field, minerals can be identified as transparent or opaque on the basis of their light-transmitting properties [23]. Transparent minerals, such as quartz, calcite, potassium feldspar, and sodium feldspar, appear in light gray tones in the field of view, whereas opaque minerals, such as plagioclase feldspar, biotite, and pyroxene, appear darker (Figure 7). In the Chang 7 tight reservoir, the oil occurrence volume around translucent minerals is relatively large, whereas the oil occurrence volume around opaque minerals is relatively small. (Figure 7a1,b1,c1,d1). Moreover, the occurrence state of crude oil can be inferred from its occurrence morphology in tight or shale reservoirs [23]. For the Chang 7 tight reservoir, free oil is predominantly present in the form of spots, short columns, and clusters, which are mainly found in intergranular pores, intragranular pores, and throats. In contrast, bound oil occurs as films, strips, and clumps, which are primarily distributed in intergranular pores and intragranular pores (Figure 7a1,b1,c1,d1). The LCs and HCs of crude oil in tight reservoirs mainly exist as mixtures, but their occurrence states and morphologies slightly differ (Figure 7). In some small-sized intragranular pores and throats, only LCs are present in free states (Figure 7a,c). In contrast, in some large intragranular pores and intergranular pores, the area occupied by HCs is greater than that occupied by LCs (Figure 7). In addition, the LCs are distributed mainly in the middle of these pores, whereas the pore surfaces are exclusively occupied by HCs. This observation indicates that the adsorption capacity of HCs on pore surfaces is greater than that of LCs (Figure 7).

4.2.3. Occurrence Pore Size Distribution Characteristics

On the basis of the CLSM observations, Image-Pro Plus software (version 6.0) was used to characterize the occurrence volume of LCs and HCs of crude oil in pores of different sizes in each field of view of each sample. The overall occurrence volume of the LCs and HCs in the Chang 7 tight reservoir initially tended to increase but then decreased with increasing pore size (Figure 8b–d). The crude oil is primarily distributed in pores with radii ranging from 1–8 μm, with less than 10% distributed in pores with radii smaller than 1 μm or larger than 8 μm (Figure 8a). In pores with radii of 1–2 μm, the content of the LCs was significantly greater than that of the HCs, with the former occurrence volume ranging from 5–15%, whereas the latter occurrence volume ranged from 0–5% (Figure 8a). This is consistent with the phenomenon described in Section 4.2.2, where the LCs almost entirely occupied the point-like small pores and short columnar throats (Figure 7a,c). In pores with radii of 2–4 μm, the overall content of the LCs remained higher than that of the HCs, but the difference between the two was relatively small (Figure 8a). In pores with radii of 4–6 μm, the content of HCs begins to slightly exceed that of LCs (Figure 8a). In pores with radii of 6–8 μm, the content of HCs was significantly greater than that of LCs, with the former occurrence volume mainly ranging from 15–20% and the latter ranging from 5–15% (Figure 8a). This may be attributed to the stronger adsorption and occupation capacities on the pore surfaces of HCs than on those of LCs in larger pores (Figure 7 and Figure 8).
According to the differential characteristics of the occurrence of LCs and HCs in different-sized pores, the differences in the pore sizes of LCs and HCs can be divided into two categories: complete differentiation and partial differentiation. Complete differentiation refers to the phenomenon where only the LCs or HCs of the crude oil occur in specific-sized pores. If only LCs occur, it is referred to as LCs-dominated complete differentiation, and vice versa (Figure 7a,c and Figure 8c1,d). Partial differentiation refers to the phenomenon where the LCs and HCs of crude oil occur simultaneously in specific-sized pores, but their occurrence volumes significantly differ (Figure 7 and Figure 8b3,c3). If the occurrence volume of the LCs is greater than that of the HCs, it is referred to as LCs-dominated partial differentiation, and vice versa. In summary, in pores with radii of 1–2 μm, there is mainly LCs-dominated complete differentiation, with a small amount of LCs-dominated partial differentiation (Figure 7 and Figure 8). In pores with radii of 2–8 μm, partial differentiation primarily occurs. Among them, LCs-dominated partial differentiation occurs mainly in pores of 2–4 μm (Figure 7 and Figure 8), whereas HCs-dominated partial differentiation occurs mainly in pores with radii of 4–8 μm (Figure 7 and Figure 8).

4.3. Controlling Factors for the Occurrence Characteristics

The occurrence characteristics of LCs and HCs in tight reservoirs are influenced primarily by three critical mechanisms: the coupled control effects of the crude oil charging force and resistance [53], the adsorption effects of reservoir minerals [23], and the chromatographic effects of crude oil migration [54]. On the basis of these mechanisms, this study analyzes the impacts of hydrocarbon generation intensity, SRD, and mineral wettability on the occurrence of LCs and HCs in various source–reservoir combinations within the Chang 7 tight reservoir. Among these factors, the control effect of hydrocarbon generation intensity and SRD on occurrence can be summarized as the control effect of the crude oil charging force on occurrence, which helps to systematically elucidate the coupled effects of the charging force and resistance on the differential occurrence of LCs and HCs.

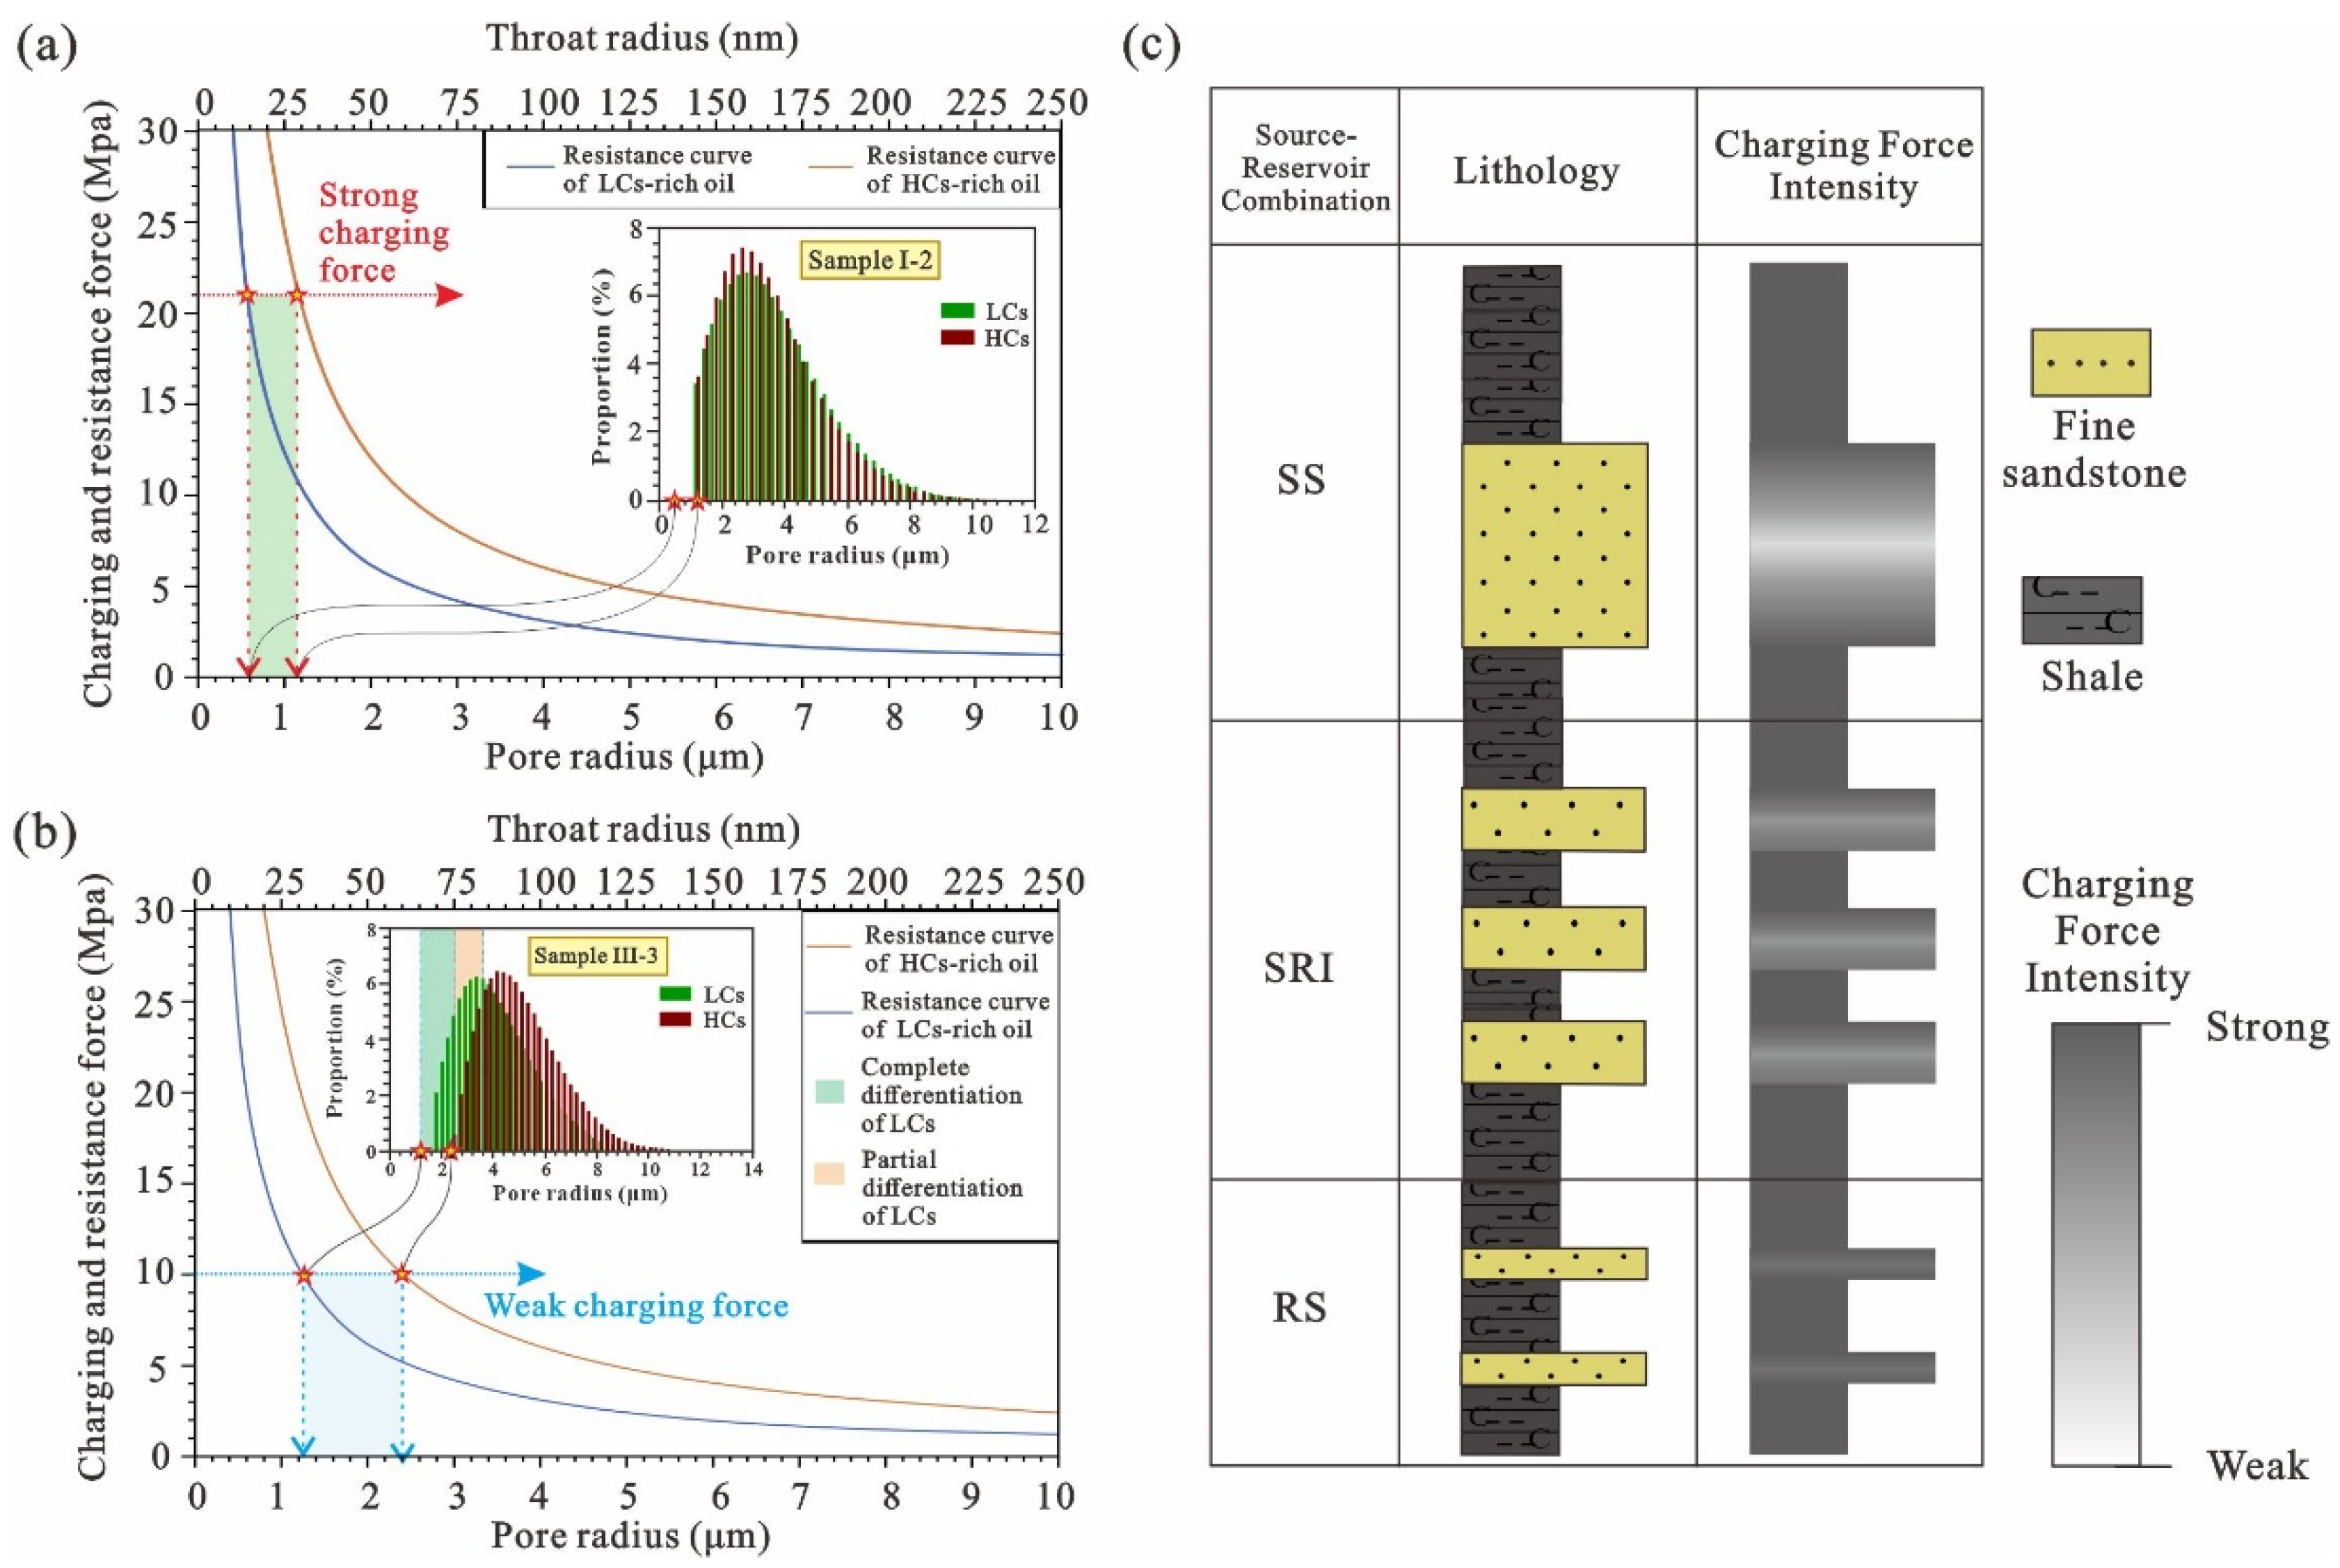
4.3.1. Charging Force

The physical properties of different crude oil components vary significantly, resulting in distinct capillary resistance between LCs and HCs under the same reservoir conditions [55]. During each individual hydrocarbon generation and expulsion period, the differences in the physical properties of crude oil are relatively minor [54]. Under such conditions, the differences in occurrence characteristics resulting from variations in the physical properties of different crude oil components are nearly unchanged. However, owing to the heterogeneous distribution of hydrocarbon generation pressure in source rocks [36] and the gradual attenuation of the crude oil charging force in the direction away from the source rock–reservoir contact surface [56], significant differences in the charging force of crude oil are distributed across various spatial locations. This can lead to very large differences in pore size and volume between LCs and HCs within tight reservoirs. To further explore the control mechanisms of the charging force on the occurrence characteristics of different crude oil components, two types of crude oils, LCs-rich and HCs-rich crude oils, are selected for use as approximate examples of LCs and HCs, respectively. Numerical simulation methods are employed to discuss the differential occurrence characteristics of LCs and HCs under different charging forces. The density and oil–water interfacial tension data for the two types of crude oils, as well as the wettability angle data for the HCs-rich crude oil referenced from numerical simulation parameters, are derived from relevant studies on the Chang 7 tight oil [57]. The wettability angle data for the LCs-rich crude oil in the oil–water–tight sandstone system are based on test results for similar-density oils in quartz-rich tight sandstone reservoirs [55]. The average pore–throat size ratio and the maximum hydrocarbon generation pressure of the Chang 7 tight reservoir are sourced from the studies of [58] and [59], respectively (Table 1).
On the basis of the Young–Laplace equation (Formula (3)), the capillary resistance of the two types of crude oil under different throat radius conditions was obtained through numerical simulation.
P c = 2 σ cos θ r
where P c is the capillary force exerted on the crude oil, σ is the interfacial tension between the crude oil and the formation water interface, θ is the wetting angle at the interface between the crude oil-tight reservoir mineral-formation water, and r is the throat radius of the tight reservoir.
LCs-rich crude oil is characterized by a lower density, smaller interfacial tension, and lower contact angle, which results in consistently lower capillary resistance than HCs-rich crude oil under the same throat radius conditions (Figure 9a,b). The relationship between the charging force of crude oil and the capillary force resistance it encounters determines whether it can overcome resistance and subsequently enter the pores of tight sandstone [53]. The throat radius at which the capillary force equals the charging force is defined as the critical throat radius (rc). During the initial charging process of crude oil into tight reservoirs, the crude oil can only overcome throats with radii larger than rc and subsequently enter the pores connected to these throats. The hydrocarbon generation pressure is a critical charging force for the Chang 7 tight reservoir. During geological history, the maximum hydrocarbon generation pressure of the Chang 73 source rock reached 21 MPa [59]. When the charging force is set to its maximum value (21 MPa), the rc for the LCs-rich crude oil is approximately 15 nm, whereas that for the HCs-rich crude oil is slightly larger, at approximately 30 nm (Figure 9a). On the basis of the mean throat-to-pore ratio of the Chang 7 tight sandstones [58], the critical charging pore radii for the LCs-rich and HCs-rich crude oils are approximately 0.6 μm and 1.2 μm, respectively (Figure 9a). The pore size of the Chang 7 tight reservoir is distributed primarily within the range of 1.2 μm to 12 μm (Figure 8). Therefore, under conditions of strong charging force, there is no significant difference in the occurrence pore size between LCs-rich crude oil and HCs-rich crude oil. The CLSM observations of Sample I in the second field of view are highly consistent with the aforementioned mechanism (Figure 9a). However, when the charging force is set to a low value of 10 MPa, the rc values for the LCs-rich and HCs-rich crude oils are approximately 30 nm and 60 nm, respectively. The corresponding critical charging pore radii are approximately 1.2 μm and 2.4 μm (Figure 9b). Under these conditions, only LCs-rich crude oil can occupy pores smaller than 2.4 μm, resulting in the complete differentiation of LCs-rich crude oil (Figure 9b). Furthermore, there is no strictly functional relationship between pore size and throat size, as a throat of a certain size often corresponds to a range of pores of similar sizes. This leads to the partial differentiation of LCs-rich crude oil within the pore size range adjacent to the complete differentiation range of LCs-rich crude oil (Figure 9b). The CLSM observations of Sample III in the third field of view validate the occurrence mechanism discussed above under weak charging force conditions. The complete differentiation of LCs is observed within the pore radius range of 1.6 μm to 2.4 μm, whereas partial differentiation of LCs occurs within the range of 2.4 μm to 3.2 μm (Figure 9b). In summary, under conditions of weak charging force, the complete and partial differentiation of LCs may occur within a range of pore radii, from the smallest pores to a certain pore radius in tight sandstone reservoirs, which will cause the occurrence volume of LCs to be significantly larger than that of HCs within these pores. The aforementioned mechanisms effectively explain the phenomenon observed in the Chang 7 tight reservoirs, where the volume of LCs exceeds that of HCs (Figure 8a), and complete and partial differentiation of LCs occurs in pores with sizes ranging from 0 µm to 4 µm (Figure 8b–d).
The variation trend of LHRv in the Chang 7 tight reservoir can also effectively validate the controlling mechanism of the charging force on pore size differentiation between LCs and HCs proposed in this study. Under geological conditions, weak charging forces of crude oil are primarily distributed in areas with low hydrocarbon generation intensities or in the middle of thick tight reservoirs [58]. As the distance from the contact face between the source rock and the tight reservoir, referred to as the source–reservoir distance, increases, the pressure gradually decreases, resulting in less remaining pressure in the middle of the thick tight reservoir. Therefore, under the same intensity of hydrocarbon generation, a weak charging force is more likely to occur in the SS than in the RS or SRI (Figure 9c). In the Chang 7 tight reservoir, the LHRv tends to decrease gradually with increasing hydrocarbon generation intensity (Figure 10a), especially when the hydrocarbon generation intensity is less than 0.6 t/km2. These findings indicate that under conditions of weak hydrocarbon generation intensity, the complete and partial differentiation of LCs within 0–4 μm pores is an important factor controlling the LHRv in tight reservoirs. Additionally, the control effect of the source–reservoir distance (SRD) on LHRv is more pronounced. CLSM observations reveal that, as the SRD increases, the minimum pore radius at which LCs occur remains relatively stable and is mainly distributed at approximately 2 µm (Figure 10b). However, from Sample I, with a low SRD, to Sample III, with a high SRD, the minimum pore radius for HCs shifted from approximately 2 µm to approximately 3 µm (Figure 10b). Moreover, the difference in the lower limit for the concentrated distribution between LCs and HCs, indicated by the boxed area in the box plot, also shows an increasing trend with increasing SRD (Figure 10b). Macroscopically, there is a strong and clear positive correlation between SRD and LHRv (Figure 10c). Nevertheless, charging forces can only cause relative enrichment of LCs within the 0–4 µm range in the Chang 7 tight reservoir and do not necessarily lead to an increase in the overall relative content of LCs. Therefore, the chromatographic effect is considered another important factor influencing the strong positive correlation between SRD and LHRv. During oil migration, the chromatographic effect causes HCs in crude oil to be lost along the migration pathway due to differences in the physicochemical properties of different components, leading to relatively high levels of LCs [54]. According to the above analyses, oil charging forces are important factors that cause the complete and partial differentiation of LCs within pores smaller than 4 µm; under conditions of weak hydrocarbon generation intensity, the hydrocarbon generation intensity has a significant effect on the LHRv, and SRD has a distinct control on the LHRv under the combined effects of the charging force and the chromatographic effect.
Owing to differences in geological conditions and tight reservoir thickness, the control of SRD on LHRv also varies among different source–reservoir combinations. The SS, characterized by thick tight sandstone, exhibits relatively weak hydrocarbon generation intensity and large SRD (Figure 10c). In this combination, LHRv shows a distinct increasing trend with increasing SRD (Figure 10d). In contrast, the SRI and RS are characterized by strong hydrocarbon generation intensity and short SRD, which results in an insignificant relationship between SRD and LHRv, especially under small SRD conditions (Figure 10d).

4.3.2. Mineral Wettability

The sandstone reservoir surface experiences varying degrees of adsorption forces on different components of the boundary fluid. This adsorption force originates primarily from the interaction between minerals and their adjacent fluids within the reservoir [60]. In the oil–water–tight reservoir system, the adsorption of crude oil by different minerals varies. Additionally, minerals have different wetting characteristics due to their specific chemical compositions and crystal structures and can be classified into three types: water-wet minerals, intermediate-wet minerals, and oil-wet minerals [61]. Water-wet minerals and intermediate-wet minerals have almost no adsorption force on crude oil, and include mainly quartz, illite, sodium feldspar, and potassium feldspar. Oil-wet minerals, including mixed-layer illite/smectite, chlorite, kaolinite, and carbonate minerals, such as calcite and dolomite, have strong absorption effects on crude oil [62]. Moreover, owing to their higher polarity and molecular weight, HCs adsorb more strongly on the surface of oil-wet minerals than LCs do [63]. Thus, oil-wet minerals play a significant controlling role in the occurrence volume of HCs in tight reservoirs.
In the Chang 7 tight reservoir, the content of oil-wet minerals exerts a distinct controlling effect on the LHRv. As the content of oil-wet minerals in tight reservoirs increases, the volume of HCs relative to LCs significantly increases, thereby leading to a decrease in LHRv (Figure 11a). Additionally, owing to the adsorption effect, pore surfaces composed of oil-wet minerals are almost exclusively occupied by HCs (Figure 7b–d), and HCs partial differentiation is always observed at pore radii greater than 4 μm (Figure 8). The control effect of the content of oil-wet minerals on the LHRv in a reservoir varies among different source–reservoir combinations due to differences in mineral components and the degree of complete and partial differentiation of LCs. In the SRI and RS, the content of oil-wet minerals strongly controls the LHRv (Figure 11b). However, in the SS, this control is not evident (Figure 11b), which may be attributed to the relative enrichment of LCs in pores smaller than 4 µm resulting from complete and partial differentiation (Figure 10d).

5. Discussion

5.1. Rock Physical Properties

The physical properties of rock are important factors affecting the degree of crude oil occurrence space in tight reservoirs [64]. In the Chang 7 tight reservoir, the content of micropores is relatively low, accounting for less than 10%, and the crude oil occurrence space is mainly distributed in small and large pores (Figure 5). For different source–reservoir combinations, the differences in the physical properties of tight reservoirs are significant. The NMR results reveal that the pore type for the SS is mainly large pores, with a low proportion of small pores, whereas the pore types for the SRI and RS are primarily small pores, with a relatively high proportion of small pores (Figure 12a). Owing to the differences in the main factors controlling the occurrence characteristics of LCs and HCs in tight reservoirs with different source–reservoir combinations, the influence of rock physical properties on the occurrence characteristics of LCs and HCs also varies across different source–reservoir combinations. For the SS, the difference in LCs and HCs occurrence characteristics arises mainly from the partial and complete differentiation of LCs in pores with a radius of 4 μm or less under weak charging force conditions. This leads to a greater proportion of small pores in the tight reservoir of the SS, which increases the space where partial and complete differentiation of LCs may occur, further resulting in greater relative enrichment of LCs in the reservoir (Figure 12a). For the SRI and RS, the main reason for the difference in LCs and HCs occurrence characteristics is the adsorption of HCs by oil-wet minerals in pores where LCs differentiation does not occur. This also indicates that, for the SRI and RS, the main reason for the difference in LCs and HCs occurrence characteristics is not the size of the crude oil occurrence space but the content of oil-wet minerals within the reservoir. Clay minerals, as important oil-wet minerals, also control the physical properties of reservoirs [62]. That is, the higher the clay mineral content is, the poorer the physical properties of the reservoir, but the greater the content of oil-wet minerals. In the Chang 7 tight reservoir, for the SRI and RS, the content of oil-wet minerals shows a significant positive correlation with the proportion of small pores in the reservoir (Figure 12b). This suggests that in the SRI and RS, the poorer the reservoir physical properties are, the more oil-wet minerals are enriched, which results in a significant negative correlation between the reservoir physical properties and LHRv (Figure 12a).

5.2. Argillaceous Laminae

Argillaceous laminae are commonly developed in tight sandstone reservoirs. Owing to the significant mineralogical differences between argillaceous laminae and pure sandstone, argillaceous laminae play an important role in controlling the distributions of LCs and HCs in tight sandstone reservoirs. The reservoir in the study area has many argillaceous laminae, which contain many clay minerals. Clay minerals, as important oil-wet minerals, have a strong adsorption effect on HCs [62]. Therefore, the difference in the adsorption effects of oil-wet minerals on LCs and HCs can be clearly observed in the argillaceous laminae. On the basis of the development position of the argillaceous laminae, the CLSM observation field of Sample II can be divided into three regions: the bright zone, dark zone, and transition zone (Figure 13b). The bright zone is mainly composed of relatively large quartz particles with a minimum pore radius of approximately 1.5 μm (Figure 13b,f). The dark zone is located in the development area of the argillaceous laminae and is mainly composed of clay minerals. The minimum pore radius is smaller than that in the bright zone, approximately 1 μm (Figure 13b,h). The transition zone is located at the boundary between the bright zone and the dark laminae. There is a noticeable change in particle size, with the particle diameter gradually decreasing from the bright zone to the dark zone. The minimum pore radius is approximately 1.2 μm (Figure 13b,g). The content of oil-wet minerals gradually increases, and the minimum pore radius of the reservoir progressively decreases from the bright zone to the dark zone. In addition, there are obvious differences in the distribution characteristics of LCs and HCs in different regions. In the bright zone, crude oil mostly exists in clusters and is present in a free state within the pores. Additionally, there are no significant differences in the occurrence state or volume of LCs and HCs in the reservoir (Figure 13c). A slight complete and partial differentiation of LCs occurs in pores smaller than 4 μm in radius, whereas in pores larger than 4 μm in radius, there is almost no differentiation in the occurrence volumes of LCs and HCs (Figure 13f). In the transition zone, crude oil mainly exists in the form of clusters and spots within the pores. LCs are primarily distributed in the middle of the pores, while the surfaces of the pores are mainly occupied by HCs (Figure 13d). In pores smaller than 4 μm in radius, the complete and partial differentiation of LCs is more pronounced, and in pores larger than 4 μm in radius, HCs also begin to show slight partial differentiation (Figure 13g). In the dark zone, crude oil mainly exists in the form of spots within the pores, and almost all the pore surfaces are occupied only by HCs. The occurrence volume of HCs is significantly larger than that of LCs (Figure 13e). In pores smaller than 4 μm in radius, the complete and partial differentiation of LCs is very pronounced, whereas in pores larger than 4 μm in radius, the partial differentiation of HCs is also quite evident (Figure 13h). The average LHRv in the bright zone, transition zone, and dark zone gradually decreases, with values of 0.83, 0.65, and 0.55, respectively (Figure 13a).
In tight sandstone reservoirs with larger pores and fewer oil-wet minerals, there is almost no differentiation in the occurrence of LCs and HCs. However, in the argillaceous laminae, owing to the small pore size and high content of oil-wet minerals in the reservoir, the differentiation of LCs in smaller pores and the differentiation of HCs in larger pores are very pronounced. However, because the adsorption effect of oil-wet minerals on HCs influences a broader pore size range, the overall LHRv in the argillaceous laminae continues to decrease.

5.3. Geological Occurrence Mode of Crude Oil

On the basis of this comprehensive analysis, three occurrence differentiation models of LCs and HCs have been identified in the tight sandstone reservoirs of the Chang 7 member in the study area. These models correspond to different source–reservoir combinations. Model A is developed in source sandwich combination (SS), is primarily controlled by the charging force, and is mainly distributed in near-slope areas (Figure 14a). In contrast, Model B and Model C, which are developed in source–reservoir interbed combination (SRI), and reservoir sandwich combination (RS), are primarily distributed in the sag and are dominated by mineral adsorption and argillaceous laminae, respectively (Figure 14b,c).
Model A is developed in SS and is primarily distributed in the northern part of the study area, on slopes with low hydrocarbon intensities. This region is characterized by delta-front depositional environments and relatively thick reservoirs with lower contents of oil-wet minerals and larger pore sizes. The occurrence differentiation of LCs and HCs mainly occurs in pores smaller than 4 μm in radius, where LCs are significantly more abundant than HCs. In pores exceeding 4 μm, little differentiation is observed, resulting in a relatively high LHRv. Model B and Model C are developed in SRI and RS and are primarily distributed in the southern part of the study area, which is in a sag with relatively high hydrocarbon intensity. These models are characterized mainly by semideep lacustrine and gravity flow depositional environments, as well as relatively thin reservoirs with higher contents of oil-wet minerals and smaller pore sizes. Model B, with stronger charging forces, exhibits weak differentiation of LCs in pores smaller than 4 μm. However, in pores larger than 4 μm, HCs tend to fully occupy oil-wet mineral surfaces due to adsorption effects, leading to a higher volume of HCs than LCs and a lower overall LHRv. While Model C also has a high charging force, the presence of argillaceous laminae further reduces the reservoir properties and increases the content of oil-wet minerals. In pores smaller than 4 μm, a clear differentiation of both complete and partial LCs is observed. Similarly, in pores larger than 4 μm, partial differentiation of HCs is also notable. However, the overall LHRv is further reduced compared with that in Model B reservoirs.
It is worth noting that the three occurrence differentiation models of LCs and HCs constructed in this study are based on research findings from continental tight reservoirs. These reservoirs are characterized by a highly complex geological background and sedimentary environment, well-developed laminar structures, and strong heterogeneity in pore-throat structure, mineral composition, and physical properties [65,66]. As a result, even within the same basin, the same block, or even the same structural belt and stratigraphic horizon, multiple occurrence differentiation models with different controlling factors often coexist. In contrast, marine tight reservoirs, such as Bakken, Eagle Ford, and Wolfcamp in North America, exhibit stronger homogeneity and are typically dominated by a single occurrence differentiation models of LCs and HCs. Therefore, the findings of this study provide valuable insights and have a certain degree of applicability across different geological settings.

6. Conclusions

(1)
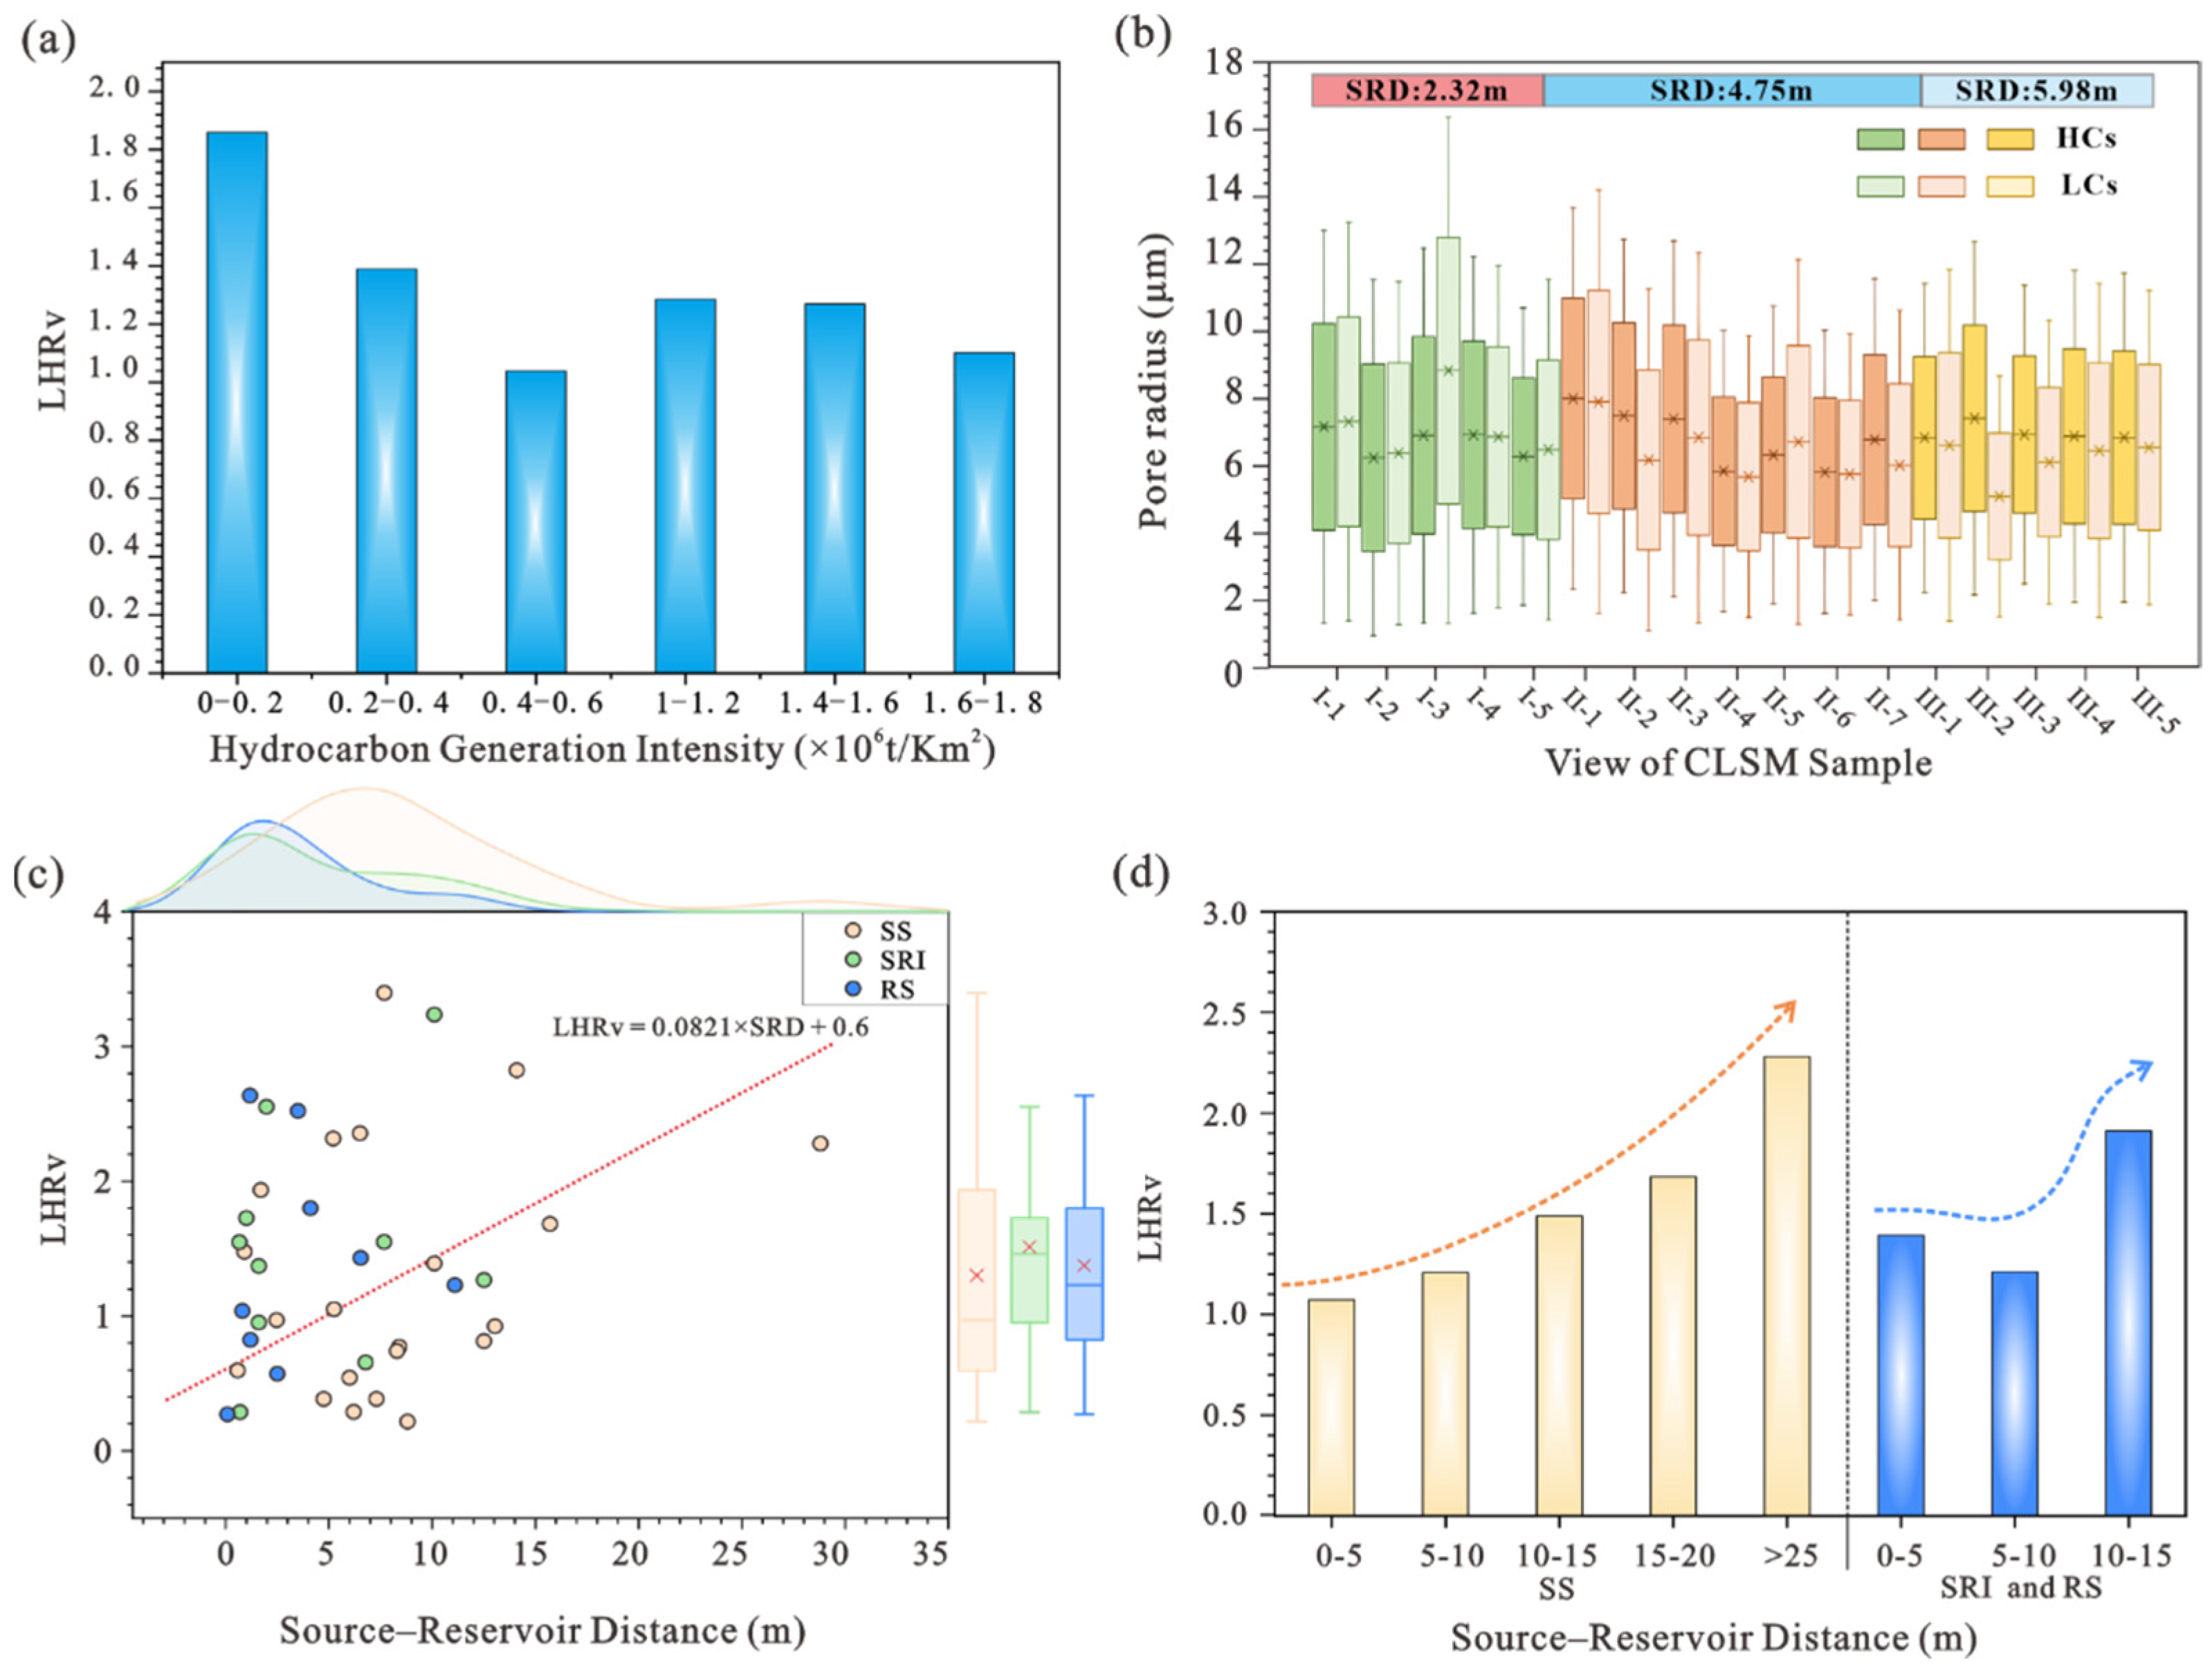
In the Chang 7 tight reservoir, LCs and HCs exhibit differences in occurrence volume, state, morphology, and pore size. The LHRv of crude oil varies significantly, ranging from 0.22 to 4.23, with an average value of 1.49. LCs predominantly occur in the form of spots, short columns, and clusters, and exist in a free state within intergranular pores, intragranular pores, and throats. The HCs mostly occur in the form of films, strips, and clumps in an adsorbed state and are present in intergranular pores and intragranular pores. In addition, the HCs mainly exhibit partial differentiation in pores with a pore radius greater than 4 μm, whereas the LCs primarily show complete or partial differentiation in pores with a pore radius smaller than 4 μm.
(2)
The differences in occurrence between the LCs and HCs of crude oil are primarily controlled by the coupled effects of the crude oil charging force and resistance, the adsorption effects of reservoir minerals, and the chromatographic effects of crude oil migration. The weaker the hydrocarbon generation intensity of the source rock is, the more likely the LCs are to undergo complete or partial differentiation in pores with radii smaller than 4 μm, increasing the LHRv. The larger the source-to-reservoir distance is, the more severe the attenuation of the charging force from the source rock, and the more significant the chromatographic effects during crude oil migration. This also led to a relative enrichment of the crude oil LCs and an increase in LHRv. Moreover, the adsorption effects of oil-wet minerals in tight reservoirs are important controlling factors for the relative enrichment of HCs in the pores of crude oil.
(3)
The extensive development of argillaceous laminae in tight reservoirs reduces the minimum pore size of the reservoir and increases the content of oil-wet minerals in the reservoir. This leads to the complete and partial differentiation of LCs in pores with radii smaller than 4 μm under strong charging forces, whereas strong partial differentiation of HCs develops in pores larger than 4 μm, which further reduces the overall LHRv of the reservoir.
(4)
In the Jiyuan area, there are three types of source–reservoir combinations: the source sandwich combination (SS), source–reservoir interbed combination (SRI), and reservoir sandwich combination (RS). The SS is characterized by high physical properties, low hydrocarbon generation intensity, high source-to-reservoir distance, and low oil-wet mineral content. It has a relatively high LHRv and is mainly developed in the northern part of the study area, near the slope area. In contrast, the RS and SRI are characterized by a high frequency of argillaceous laminae development, high hydrocarbon generation intensity, low source-to-reservoir distance, and high oil-wet mineral content, leading to a relatively low LHRv. They are mainly developed in the southern part of the study area in the sag. Three oil component differentiation models have been developed for the Chang 7 tight sandstone reservoir in the study area. First, Model A, developed in the SS, represents the charging force-dominated occurrence mode of crude oil in the near slope zone. Model B is developed in the SRI and RS, representing the mineral adsorption-dominated oil occurrence mode of crude oil. Model C is developed in both the SRI and RS, representing the argillaceous laminae-dominated oil occurrence mode of crude oil, both in the sag.
(5)
This study proposes three occurrence models of LCs and HCs based on the study area’s source–reservoir combination types, reservoir characteristics, and argillaceous laminae characteristics. For regions with geological settings similar to the study area, this research approach can be used as a reference to quantitatively characterize the occurrence characteristics of LCs and HCs and further explore their controlling factors. Moreover, this model can be further integrated with seismic data and well log information to effectively predict regions with relatively high LCs content, thereby achieving efficient extraction.

Author Contributions

Conceptualization, M.J., D.C., Q.W. and F.W.; Methodology, M.J.; Software, X.W. and K.M.; Validation, Q.W. and F.W.; Formal analysis, Y.W. (Yuchao Wang), W.L. and Y.W. (Yuqi Wang); Investigation, X.W., K.M., Y.W. (Yuchao Wang), W.L., Y.W. (Yuqi Wang), Z.Y., R.W. and L.R.; Data curation, M.J.; Writing—original draft, M.J.; Writing—review & editing, D.C.; Supervision, D.C. All authors have read and agreed to the published version of the manuscript.

Funding

This work was funded by the National Natural Science Foundation of China (Grant Nos. 42302141, 42402152) and the Science Foundation of China University of Petroleum, Beijing (No. 2462023XKBH011).

Data Availability Statement

The original contributions presented in the study are included in the article, further inquiries can be directed to the corresponding author.

Acknowledgments

We appreciate the support from the PetroChina Changqing Oilfield Company for providing the data and tight sandstone samples used in this study and the permission to publish the results. Additionally, we would like to thank everyone who provided valuable comments and suggestions during the interpretation and revision process of this paper.

Conflicts of Interest

Author Xiujuan Wang was employed by the company PetroChina Changqing Oilfield Co. The remaining authors declare that the research was conducted in the absence of any commercial or financial relationships that could be construed as a potential conflict of interest.

References

  1. Ledingham, G.W. Santiago pool, kern county, california: Geological notes. AAPG Bull. 1947, 31, 2063–2067. [Google Scholar]
  2. Law, B.E.; Curtis, J.B. Introduction to unconventional petroleum systems. AAPG Bull. 2002, 86, 1851–1852. [Google Scholar]
  3. Jiang, M.; Fang, H.; Liu, Y.; Zhang, Y.; Wang, C. On movable fluid saturation of tight sandstone and main controlling factors —Case study on the Fuyu oil layer in the Da’an oilfield in the Songliao basin. Energy 2023, 267, 126476. [Google Scholar] [CrossRef]
  4. Li, J.; Zhou, X.; Gayubov, A.; Shamil, S. Study on production performance characteristics of horizontal wells in low permeability and tight oil reservoirs. Energy 2023, 284, 129286. [Google Scholar] [CrossRef]
  5. Wang, Y.; Chen, D.; Rong, L.; Chen, J.; Wang, F.; He, S.; Wang, Y.; Yang, Z.; Lei, W. Evaluation of fluid mobility and factors influencing the deep tight sandstone of the third member of the Shahejie formation in the Jiyang depression, Bohai Bay Basin. Mar. Pet. Geol. 2024, 170, 107090. [Google Scholar] [CrossRef]
  6. Kazemzadeh, E.; Ahmadi Shadmehri, M.T.; Ebrahimi Salari, T.; Salehnia, N.; Pooya, A. Modeling and forecasting United States oil production along with the social cost of carbon: Conventional and unconventional oil. Int. J. Energy Sect. Manag. 2023, 17, 288–309. [Google Scholar] [CrossRef]
  7. Jia, C.; Zheng, M.; Zhang, Y. Unconventional hydrocarbon resources in China and the prospect of exploration and development. Pet. Explor. Dev. 2012, 39, 139–146. [Google Scholar] [CrossRef]
  8. Yao, W.; Chen, Z.; Hu, T.; Liang, Z.; Jia, C.; Wu, K.; Pan, T.; Yu, H.; Dang, Y. Storage space, pore structure, and primary control of igneous rock reservoirs in Chepaizi Bulge, Junggar Basin, western China: Significance for oil accumulation. J. Pet. Sci. Eng. 2020, 195, 107836. [Google Scholar] [CrossRef]
  9. Luo, Q.; Gong, L.; Qu, Y.; Zhang, K.; Zhang, G.; Wang, S. The tight oil potential of the Lucaogou Formation from the southern Junggar Basin, China. Fuel 2018, 234, 858–871. [Google Scholar] [CrossRef]
  10. Zhang, G.; Wang, Z.; Guo, X.; Sun, Y.; Sun, L.; Pan, L. Characteristics of lacustrine dolomitic rock reservoir and accumulation of tight oil in the Permian Fengcheng Formation, the western slope of the Mahu Sag, Junggar Basin, NW China. J. Asian Earth Sci. 2019, 178, 64–80. [Google Scholar] [CrossRef]
  11. Nelson, P.H. Pore-throat sizes in sandstones, tight sandstones, and shales. AAPG Bull. 2009, 93, 329–340. [Google Scholar] [CrossRef]
  12. Mirzaei-Paiaman, A. New methods for qualitative and quantitative determination of wettability from relative permeability curves: Revisiting Craig’s rules of thumb and introducing Lak wettability index. Fuel 2021, 288, 119623. [Google Scholar] [CrossRef]
  13. Wang, X.; Bai, X.; Li, J.; Jin, Z.; Wang, G.; Chen, F.; Zheng, Q.; Hou, Y.; Yang, Q.; Li, J.; et al. Enrichment model and major controlling factors of below-source tight oil in Lower Cretaceous Fuyu reservoirs in northern Songliao Basin, NE China. Pet. Explor. Dev. 2024, 51, 279–291. [Google Scholar] [CrossRef]
  14. Hu, T.; Pang, X.; Jiang, S.; Wang, Q.; Zheng, X.; Ding, X.; Zhao, Y.; Zhu, C.; Li, H. Oil content evaluation of lacustrine organic-rich shale with strong heterogeneity: A case study of the Middle Permian Lucaogou Formation in Jimusaer Sag, Junggar Basin, NW China. Fuel 2018, 221, 196–205. [Google Scholar] [CrossRef]
  15. Hu, T.; Pang, X.; Jiang, F.; Wang, Q.; Liu, X.; Wang, Z.; Jiang, S.; Wu, G.; Li, C.; Xu, T.; et al. Movable oil content evaluation of lacustrine organic-rich shales: Methods and a novel quantitative evaluation model. Earth Sci. Rev. 2021, 214, 103545. [Google Scholar] [CrossRef]
  16. Shi, X.; Wang, J.; Ge, X.; Han, Z.; Qu, G.; Jiang, S. A new method for rock brittleness evaluation in tight oil formation from conventional logs and petrophysical data. J. Pet. Sci. Eng. 2017, 151, 169–182. [Google Scholar] [CrossRef]
  17. Xiao, F.; Yang, J.; Li, S.; Yao, Y.; Huang, Y.; Gao, X. Enrichment and movability of lacustrine tight shale oil for the first member of the Upper Cretaceous Qingshankou Formation in the Sanzhao Sag, Songliao Basin, NE China: Insights from saturated hydrocarbon molecules. Fuel 2024, 368, 131615. [Google Scholar] [CrossRef]
  18. Qu, Y.; Sun, W.; Wu, H.; Huang, S.; Li, T.; Ren, D.; Chen, B. Impacts of pore-throat spaces on movable fluid: Implications for understanding the tight oil exploitation process. Mar. Pet. Geol. 2022, 137, 105509. [Google Scholar] [CrossRef]
  19. Sanei, H.; Wood, J.M.; Ardakani, O.H.; Clarkson, C.R.; Jiang, C. Characterization of organic matter fractions in an unconventional tight gas siltstone reservoir. Int. J. Coal Geol. 2015, 150–151, 296–305. [Google Scholar] [CrossRef]
  20. Zhao, W.; Hu, S.; Hou, L.; Yang, T.; Li, X.; Guo, B.; Yang, Z. Types and resource potential of continental shale oil in China and its boundary with tight oil. Pet. Explor. Dev. 2020, 47, 1–11. [Google Scholar] [CrossRef]
  21. Hu, T.; Liu, Y.; Jiang, F.; Pang, X.; Wang, Q.; Zhou, K.; Wu, G.; Jiang, Z.; Huang, L.; Jiang, S.; et al. A novel method for quantifying hydrocarbon micromigration in heterogeneous shale and the controlling mechanism. Energy 2024, 288, 129712. [Google Scholar] [CrossRef]
  22. Guo, Q.; Yao, Y.; Hou, L.; Tang, S.; Pan, S.; Yang, F. Oil migration, retention, and differential accumulation in “sandwiched” lacustrine shale oil systems from the Chang 7 member of the Upper Triassic Yanchang Formation, Ordos Basin, China. Int. J. Coal Geol. 2022, 261, 104077. [Google Scholar] [CrossRef]
  23. Gao, Z.; Duan, L.; Jiang, Z.; Huang, L.; Chang, J.; Zheng, G.; Wang, Z.; An, F.; Wei, W. Using laser scanning confocal microscopy combined with saturated oil experiment to investigate the pseudo in-situ occurrence mechanism of light and heavy components of shale oil in sub-micron scale. J. Pet. Sci. Eng. 2023, 220, 111234. [Google Scholar] [CrossRef]
  24. Wang, S.; Feng, Q.; Javadpour, F.; Xia, T.; Li, Z. Oil adsorption in shale nanopores and its effect on recoverable oil-in-place. Int. J. Coal Geol. 2015, 147–148, 9–24. [Google Scholar] [CrossRef]
  25. Ma, B.; Hu, Q.-H.; Pu, X.; Yang, S.; Wang, X.; Han, W.; Wen, J. Occurrence Mechanism and Controlling Factors of Shale Oil from the Paleogene Kongdian Formation in Cangdong Sag, Bohai Bay Basin, East China. J. Mar. Sci. Eng. 2024, 12, 1557. [Google Scholar] [CrossRef]
  26. Lu, M.; Duan, G.; Zhang, T.; Liu, N.; Song, Y.; Zhang, Z.; Qiao, J.; Wang, Z.; Fang, Z.; Luo, Q. Influences of paleoclimatic changes on organic matter enrichment mechanisms in freshwater and saline lacustrine oil shales in China: A machine learning approach. Earth Sci. Rev. 2025, 262, 105061. [Google Scholar] [CrossRef]
  27. Zhu, R.; Zou, C.; Mao, Z.; Yang, H.; Hui, X.; Wu, S.; Cui, J.; Su, L.; Li, S.; Yang, Z. Characteristics and distribution of continental tight oil in China. J. Asian Earth Sci. 2019, 178, 37–51. [Google Scholar] [CrossRef]
  28. Zhang, D.; Han, M.; Zhou, Q.; Ye, T.; Zhou, Y.; Chang, J.; Lin, X. The Micro-Occurrence Mechanisms of Tight Oil: Fluid–Rock Interactions at Microscale Pores, Nanoscale Pores, and Mineral Surfaces. Energies 2023, 16, 3917. [Google Scholar] [CrossRef]
  29. Wang, J.; Wu, S.; Li, Q.; Zhang, J.; Guo, Q. Characterization of the pore-throat size of tight oil reservoirs and its control on reservoir physical properties: A case study of the Triassic tight sandstone of the sediment gravity flow in the Ordos Basin, China. J. Pet. Sci. Eng. 2020, 186, 106701. [Google Scholar] [CrossRef]
  30. Yang, Y.; Li, W.; Ma, L. Tectonic and stratigraphic controls of hydrocarbon systems in the Ordos basin: A multicycle cratonic basin in central China. AAPG Bull. 2005, 89, 255–269. [Google Scholar] [CrossRef]
  31. Gu, Y.; Zhang, D.; Bao, Z. A new data-driven predictor, PSO-XGBoost, used for permeability of tight sandstone reservoirs: A case study of member of chang 4+5, western Jiyuan Oilfield, Ordos Basin. J. Pet. Sci. Eng. 2021, 199, 108350. [Google Scholar] [CrossRef]
  32. Wang, F.; Chen, D.; Yao, D.; Cheng, M.; Wang, Q.; Tian, Z.; Du, W.; Wang, C.; Chang, S.; Jiang, M. Disparities in tight sandstone reservoirs in different source-reservoir assemblages and their effect on tight oil accumulation: Triassic Chang 7 member in the Qingcheng area, Ordos Basin. J. Pet. Sci. Eng. 2022, 217, 110914. [Google Scholar] [CrossRef]
  33. Haughton, P.; Davis, C.; McCaffrey, W.; Barker, S. Hybrid sediment gravity flow deposits—Classification, origin and significance. Mar. Pet. Geol. 2009, 26, 1900–1918. [Google Scholar] [CrossRef]
  34. Talling, P.J. Hybrid submarine flows comprising turbidity current and cohesive debris flow: Deposits, theoretical and experimental analyses, and generalized models. Geosphere 2013, 9, 460–488. [Google Scholar] [CrossRef]
  35. Xi, K.; Li, K.; Cao, Y.; Lin, M.; Niu, X.; Zhu, R.; Wei, X.; You, Y.; Liang, X.; Feng, S. Laminae combination and shale oil enrichment patterns of Chang 73 sub-member organic-rich shales in the Triassic Yanchang Formation, Ordos Basin, NW China. Pet. Explor. Dev. 2020, 47, 1342–1353. [Google Scholar] [CrossRef]
  36. Cui, J.; Zhang, Z.; Liu, J.; Liu, G.; Huang, X.; Qi, Y.; Mao, Z.; Li, Y. Hydrocarbon generation and expulsion quantification and contribution of multiple source rocks to hydrocarbon accumulation in Yanchang Formation, Ordos Basin, China. J. Nat. Gas Geosci. 2021, 6, 375–391. [Google Scholar] [CrossRef]
  37. Zhang, W.; Yang, W.; Xie, L. Controls on organic matter accumulation in the Triassic Chang 7 lacustrine shale of the Ordos Basin, central China. Int. J. Coal Geol. 2017, 183, 38–51. [Google Scholar] [CrossRef]
  38. Li, H.; Tang, H.; Qin, Q.; Zhou, J.; Qin, Z.; Fan, C.; Su, P.; Wang, Q.; Zhong, C. Characteristics, formation periods and genetic mechanisms of tectonic fractures in the tight gas sandstones reservoir: A case study of Xujiahe Formation in YB area, Sichuan Basin, China. J. Pet. Sci. Eng. 2019, 178, 723–735. [Google Scholar] [CrossRef]
  39. Zang, Q.; Liu, C.; Awan, R.S.; Yang, X.; Li, G.; Wu, Y.; Lu, Z.; Feng, D. Occurrence characteristics of the movable fluid in heterogeneous sandstone reservoir based on fractal analysis of NMR data: A case study of the Chang 7 Member of Ansai Block, Ordos Basin, China. J. Pet. Sci. Eng. 2022, 214, 110499. [Google Scholar] [CrossRef]
  40. Qiao, J.; Zeng, J.; Chen, D.; Cai, J.; Jiang, S.; Xiao, E.; Zhang, Y.; Feng, X.; Feng, S. Permeability estimation of tight sandstone from pore structure characterization. Mar. Pet. Geol. 2022, 135, 105382. [Google Scholar] [CrossRef]
  41. Wu, L.; Zhang, Z.; Ma, W. Method for quantitative analysis of oil and gas components in reservoir rock. Mud Logging Eng. 2000, 3, 50–58, (In Chinese with English abstract). [Google Scholar]
  42. Speight, J. An Introduction to Petroleum Technology, Economics, and Politics; John Wiley & Sons: Hoboken, NJ, USA, 2011; pp. 1–320. [Google Scholar]
  43. Seifried, C.M.; Crawshaw, J.; Boek, E.S. Kinetics of Asphaltene Aggregation in Crude Oil Studied by Confocal Laser-Scanning Microscopy. Energy Fuels 2013, 27, 1865–1872. [Google Scholar] [CrossRef]
  44. Jiang, C.; Chen, Z.; Mort, A.; Milovic, M.; Robinson, R.; Stewart, R.; Lavoie, D. Hydrocarbon evaporative loss from shale core samples as revealed by Rock-Eval and thermal desorption-gas chromatography analysis: Its geochemical and geological implications. Mar. Pet. Geol. 2016, 70, 294–303. [Google Scholar] [CrossRef]
  45. Li, Y.; Yang, Y.; Sun, X.; Yang, D.; Zhang, N.; Yang, H.; Guo, H.; Zheng, J. The application of laser confocal method in microscopic oil analysis. J. Pet. Sci. Eng. 2014, 120, 52–60. [Google Scholar] [CrossRef]
  46. Pang, X.; Li, M.; Li, B.; Wang, T.; Hui, S.; Liu, Y.; Liu, G.; Hu, T.; Xu, T.; Jiang, F.; et al. Main controlling factors and movability evaluation of continental shale oil. Earth Sci. Rev. 2023, 243, 104472. [Google Scholar] [CrossRef]
  47. Pironon, J.; Canals, M.; Dubessy, J.; Walgenwitz, F.; Laplace-Builhe, C. Volumetric reconstruction of individual oil inclusions by confocal scanning laser microscopy. Eur. J. Mineral. 1998, 10, 1143–1150. [Google Scholar] [CrossRef]
  48. Liang, C.; Wu, J.; Cao, Y.; Liu, K.; Khan, D. Storage space development and hydrocarbon occurrence model controlled by lithofacies in the Eocene Jiyang Sub-basin, East China: Significance for shale oil reservoir formation. J. Pet. Sci. Eng. 2022, 215, 110631. [Google Scholar] [CrossRef]
  49. Zhao, W.; Wu, K.; Jiang, L.; He, M.; Li, X.; Jia, C. Charging and microscopic gas-water occurrence characteristics of tight sandstone gas based on pore network model. Nat. Gas Ind. 2022, 42, 69–79. [Google Scholar]
  50. Yao, Y.; Liu, D.; Cai, Y.; Li, J. Advanced characterization of pores and fractures in coals by nuclear magnetic resonance and X-ray computed tomography. Sci. Sin. 2010, 40, 1598–1607, (In Chinese with English abstract). [Google Scholar] [CrossRef]
  51. Yang, L.; Wang, S.; Tao, Z.; Leng, R.; Yang, J. The Characteristics of Oil Migration due to Water Imbibition in Tight Oil Reservoirs. Energies 2019, 12, 4199. [Google Scholar] [CrossRef]
  52. Xu, T.; Wang, J.; Lu, Y.; Wang, D.; Yu, L.; Tian, Y. Exploring pore-scale production characteristics of oil shale after CO2 huff ‘n’ puff in fractured shale with varied permeability. Int. J. Coal Sci. Technol. 2024, 11, 12. [Google Scholar] [CrossRef]
  53. Li, C.; Liu, G.; Cao, Z.; Sun, M.; Liu, N. Oil charging pore throat threshold and accumulation effectiveness of tight sandstone reservoir using the physical simulation experiments combined with NMR. J. Pet. Sci. Eng. 2021, 208, 109338. [Google Scholar] [CrossRef]
  54. Chen, J.; Ma, K.; Pang, X.; Yang, H. Secondary migration of hydrocarbons in Ordovician carbonate reservoirs in the Lunnan area, Tarim Basin. J. Pet. Sci. Eng. 2020, 188, 106962. [Google Scholar] [CrossRef]
  55. Xu, Y.; Yan, G.; Hou, B.; Su, K.; Zhang, F.; Liu, B.; Li, S.; Zhao, S.; Liu, Y. Different effects of resins and asphaltenes concentration of crude oil on sandstone wettability. Fuel 2024, 370, 131825. [Google Scholar] [CrossRef]
  56. Pang, Z.; Tao, S.; Zhang, Q.; Yang, J.; Zhang, B.; Wu, S.; Chen, R.; Huang, D.; Wei, T. Simulation experiments of tight oil secondary migration driving force and resistance: A case study of Jurassic oilfield in middle Sichuan basin. J. China Univ. Min. Technol. 2016, 45, 754–764, (in Chinese with English abstract). [Google Scholar]
  57. Zhang, H.; Zhang, S.; Liu, S.; Hao, J.; Zhao, M.; Tian, H.; Jiang, L. A theoretical discussion and case study on the oil-charging throat threshold for tight reservoirs. Pet. Explor. Dev. 2014, 41, 408–416. [Google Scholar] [CrossRef]
  58. Zhang, P.; Zhang, J.; Zhao, Q.; Chang, B.; Zhang, L.; Gao, F.; Cao, C.; Li, K. The application of constant-rate mercury penetration technology of Chang 7 tight sandstone reservoir pore-throat space representation in Dingbian Oildom. J. Northwest Univ. 2018, 48, 423–430, (in Chinese with English abstract). [Google Scholar]
  59. Wang, S. Overpressure Evolution Caused by Hydrocarbon Generation of Chang 7 Section in Yanchang Oilfield and Its Control Effect on Accumulation. Master’s Thesis, China University of Petroleum, Beijing, China, 2018. (In Chinese with English Abstract). [Google Scholar]
  60. Liu, G.; Wang, H.; Tang, J.; Liu, Z.; Yang, D. Effect of wettability on oil and water distribution and production performance in a tight sandstone reservoir. Fuel 2023, 341, 127680. [Google Scholar] [CrossRef]
  61. Wang, Z.; Luo, X.; Liu, K.; Fan, Y.; Wang, X. Impact of chlorites on the wettability of tight oil sandstone reservoirs in the Upper Triassic Yanchang Formation, Ordos Basin, China. Sci. China Earth Sci. 2021, 64, 951–961. [Google Scholar] [CrossRef]
  62. Zhong, J.; Wang, P.; Zhang, Y.; Yan, Y.; Hu, S.; Zhang, J. Adsorption mechanism of oil components on water-wet mineral surface: A molecular dynamics simulation study. Energy 2013, 59, 295–300. [Google Scholar] [CrossRef]
  63. Ritter, U.; Grøver, A. Adsorption of petroleum compounds in vitrinite: Implications for petroleum expulsion from coal. Int. J. Coal Geol. 2005, 62, 183–191. [Google Scholar] [CrossRef]
  64. Liu, G.; Ding, Y.; Wang, J.; Ge, L.; Chen, X.; Yang, D. Effect of pore-throat structure on air-foam flooding performance in a low-permeability reservoir. Fuel A J. Fuel Sci. 2023, 349, 128620. [Google Scholar] [CrossRef]
  65. Sun, L.; Zou, C.; Jia, A.; Wei, Y.; Zhu, R.; Wu, S.; Guo, Z. Development characteristics and orientation of tight oil and gas in China. Pet. Explor. Dev. 2019, 46, 12. [Google Scholar] [CrossRef]
  66. Luo, Q.; Goodarzi, F.; Zhong, N.; Qiu, N.; Wang, X.; Such, V.; Khan, I.; Zheng, X.; Liu, B.; Ardakani, O.H. Dispersed organic matter from pre-Devonian marine shales: A review on its composition, origin, evolution, and potential for hydrocarbon prospecting. Earth Sci. Rev. 2025, 261, 105027. [Google Scholar] [CrossRef]
Figure 1. (a) Structural unit division diagram of the Ordos Basin (modified from [32]); (b) Distribution characterization diagram of the sedimentary facies and thickness of the sandstone in the Chang 7 member; (c) Characterization diagram of the hydrocarbon generation intensity of the Chang 73 source rock in the Jiyuan area (according to [36]).
Energies 18 01440 g001
Figure 2. (a) Stratigraphic columns of the Triassic Chang 7 Member in the Jiyuan area, Ordos Basin. (b) Definition and geological model of the source–reservoir combination types. (c) Distribution characteristics of distinct source–reservoir combination types.
Energies 18 01440 g002
Figure 3. (a) Representative quantitative analysis spectrum of oil and gas components obtained from the reservoir rock pyrolysis experiment on Sample I. (b) Histogram showing the comparison of experimental results between the CLSM and reservoir rock pyrolysis experiment.
Energies 18 01440 g003
Figure 4. (a) Ternary plot illustrating the type of sandstones, with Q, F, and R representing quartz, feldspar, and rock fragments, respectively; (b) Box plot of the relative contents of different minerals in the Chang 7 tight reservoir; (c) Optical microscopy images under plane-polarized light with a 2.5× field of view, showing the grain size, sorting, roundness, and grain contact relationships of the Chang 7 tight reservoir. (c1) Fine sand predominates, followed by very fine sand. The development of rock pores is poor, with low connectivity (Well G91, 2677.6 m). (c2) Fine sand is in absolute dominance, with very little medium sand and very fine sand. The rock pores are moderately developed, and the connectivity is average (Well J127, 2557.5 m, 2.5x); (d) Optical microscopy images under plane-polarized light with a 20× field of view, showing the characteristics of distinct types of pores. The red areas are cast epoxy resin. (d1) The intergranular dissolution pores developed between clastic particles; the intragranular dissolution pores developed in feldspar grains (Well J127, 2557.5 m). (d2) Residual intergranular pores and intergranular dissolution pores developed between clastic particles (Well J127, 2557.5 m).; (e) FE-SEM images showing the characteristics of distinct types of pores. C represents calcite. (e1) Intergranular dissolution pores, intercrystalline micropores, and intragranular dissolution pores in feldspar grains (Well J127, 2557.5 m, 331x). (e2) Intragranular dissolution pores developed within calcite (Well J127, 2557.5 m, 272x).
Energies 18 01440 g004
Figure 5. (a) Characteristics of T2 relaxation time spectra before and after centrifugation of the Chang 7 tight reservoir; (b) Typical sample T2 relaxation time spectra before and after centrifugation and pore distribution; (c) Pore distribution characteristics of different source–reservoir combinations.
Energies 18 01440 g005
Figure 6. (a) Volumetric transition results of the reservoir rock pyrolysis experiment with different components and the distribution characteristics of LHRv in the Chang 7 tight reservoir. (b) CLSM results for LCs and HCs and the distribution characteristics of LHRv in the Chang 7 tight reservoir.
Energies 18 01440 g006
Figure 7. CLSM images illustrating the occurrence states and morphological characteristics of crude oil in the Chang 7 tight reservoir. From top to bottom: original CLSM images, LCs images, and HCs images for (a1–3) Sample I (Well J127, 2557.5 m), (b1–3,c1–3) two fields of view of Sample II (Well L54, 2407.75 m), and (d1–3) Sample III (Well G91, 2677.6 m).
Energies 18 01440 g007
Figure 8. (a) Distribution characteristics of LCs and HCs with different pore sizes; (bd) Distribution histograms of LCs and HCs contents under different pore sizes for (b1–3) Sample I (Well J127, 2557.5 m), (c1–3) Sample II (Well L54, 2407.75 m), and (d1–3) Sample III (Well G91, 2677.6 m).
Energies 18 01440 g008
Figure 9. (a,b) Schematic diagram showing the differentiation mechanism of occurrence pore radius between LCs and HCs under (a) strong charging force conditions and (b) weak charging force conditions; (c) Charging force attenuation patterns within different source–reservoir combinations.
Energies 18 01440 g009
Figure 10. (a) Control effect of hydrocarbon generation intensity on LHRv; (b) Pore radius distributions of LCs and HCs under different SRD conditions; (c) Distribution characteristics of SRD and LHRv and their cross-plots; (d) Correlation analysis of SRD and LHRv for different source–reservoir combinations.
Energies 18 01440 g010
Figure 11. Correlation analysis between the percentage of oil-wet minerals and LHRv.
Energies 18 01440 g011
Figure 12. Correlation analysis between LHRv (a), the percentage of oil-wet minerals (b), and reservoir physical properties.
Energies 18 01440 g012
Figure 13. (a) Occurrence volume of LCs and HCs in different regions of Sample II (L54, 2407.75 m); (b) Positional distribution in different regions of Sample II(L54, 2407.75 m); (ce) Occurrence state characteristics of LCs and HCs in the bright, transitional, and dark zones, respectively. (c1–3) represent the mineral images, LCs images, and HCs images in Field of view 1, respectively; (d1–3) and (e1–3) represent those in Fields of view 5 and 2, respectively.; (fh) Pore size distributions of LCs and HCs of Sample II, in the bright, transitional, and dark zones, respectively. (f1,2) represent view 1 and view 4 in the bright zone, respectively. (g1,2) represent view 5 and view 7 in the transitional zone, respectively. (h1,2) represent view 2 and view 3 in the dark zone, respectively.
Energies 18 01440 g013
Figure 14. Geological mode of crude oil occurrence in the Chang 7 tight reservoir in the research area. CF represents the charging force. (a) Sedimentary facies and lithology distribution model of the chang 71+2 submember in the jiyuan area; (b1), (c1), and (d1) represent the vertical evolution characteristics of crude oil charging force and capillary resistance in Models A, B, and C, respectively; (b2), (c2), and (d2) represent the occurrence state and morphological model of crude oil in Models A, B, and C, respectively; (b3), (c3), and (d3) represent the typical pore size distribution characteristics of light and heavy components of crude oil in Models A, B, and C, respectively.
Energies 18 01440 g014
Table 1. Physical and geological parameters of LCs-rich and HCs-rich crude oils in the Chang 7 tight reservoir [55,57,58,59].
Type of
Crude Oil
DensityInterfacial
Tension
Contact
Angle
Mean Size Ratio of
Pore and Throat
Maximum Hydrocarbon
Generation Pressure
LCs-rich772 kg/m319.3 mN/m142°40021 Mpa
HCs-rich842 kg/m330 mN/m180°
Disclaimer/Publisher’s Note: The statements, opinions and data contained in all publications are solely those of the individual author(s) and contributor(s) and not of MDPI and/or the editor(s). MDPI and/or the editor(s) disclaim responsibility for any injury to people or property resulting from any ideas, methods, instructions or products referred to in the content.

