Article

Innovative Power Generation System for Large Ships Based on Fuel Cells: A Technical–Economic Comparison with a Traditional System

1
Department of Astronautics, Electrical and Energy Engineering (DIAEE), University of Rome “Sapienza”, 00184 Rome, Italy
2
ENEA, The Italian National Agency for New Technologies, Energy and Sustainable Economic Development, 00193 Rome, Italy
3
Carnival Maritime GmbH, 20457 Hamburg, Germany
4
KiwaItaly, 40057 Granarolo dell’Emilia, Italy
*
Author to whom correspondence should be addressed.
Energies 2025, 18(6), 1456; https://doi.org/10.3390/en18061456
Submission received: 23 January 2025 / Revised: 3 March 2025 / Accepted: 10 March 2025 / Published: 16 March 2025

Abstract

:
At present, shipping companies are aiming to meet better energy and environmental requirements when designing large cruise ships, thus decreasing emissions, increasing efficiency and reliability and greatly reducing maintenance time and costs. This paper provides a technical–economic comparison for a real case study, including a complete feasibility study regarding the sizing of a generation system to supply base hotel loads, between two power plant architectures focused on fuel cells and diesel generators for a cruise ship. The paper describes, in detail, an innovative solid oxide fuel cell (SOFC) generation system, which offers high efficiency and low emissions, assessed for its technical, economic and environmental performance. This study examines generators for hotels, requiring continuous service at constant load and a 1 MW power supply. The work relates to ships with a tonnage of more than 100,000 tons. Subsequently, considering that, in the case study, the diesel generators are powered by LNG (liquefied natural gas), there will also be a comparison with a case where both systems are simply powered by LNG. The main technical specifications required by shipbuilders for choosing the most suitable system for on-board generation (weight, volume, maintenance intervals and operations, as well as investment and operational expenses) are analyzed and described. The economic comparison is based on two extreme assumptions of the purchase and operating costs of the fuel cell system and returns a different result depending on the assumption adopted. The usefulness of the proposed solution based on fuel cells is demonstrated on the basis of an accurate technical, energetic and economic comparison with the conventional technologies based on diesel generators. The work is completed by evaluating the overall power-generating reliability improvement achievable with the new technology, in comparison with the traditional system. The comparison between the fuel cell system and the diesel system shows that the former has a higher weight (+40%), volume (+75%) and initial investment cost (3–6 times higher). However, the lower LNG consumption reduces the annual operating cost and the size and weight of the on-board tanks or, with the same tank capacity, increases the system’s range. The overall reliability of the fuel cell system is significantly higher than that of the traditional system.

1. Introduction

Combining energy efficiency and renewable energy plays an essential role in the energy transition. In September 2020, the Commission adopted a proposal to reduce greenhouse gas emissions by at least 55% by 2030 and put the EU on a responsible path to become climate neutral by 2050. To achieve climate neutrality, a 90% reduction in transportation emissions is required by 2050. All modes of transport, including maritime transport, will need to contribute to this reduction [1] and also to support industry [2].
With the initiative of the EU Maritime European Commission (Fuel EU Maritime), the maritime sector has been included in the “Fit for 55” package [3].
The Fuel EU Maritime initiative aims to promote the use of sustainable alternative fuels in European shipping and ports by addressing the following issues:
  • Market barriers preventing their use;
  • Uncertainty about which technical options are ready for commercialization.
The initiative is part of a package aimed at aligning the sector with the EU’s goal of achieving climate neutrality by 2050. Updated scenarios for 2030 and actions to control climate change, following the Paris accord, imply new energy investment approaches [1]. Driven by environmental constraints and concerns related to the need for “clean” and sustainable energy, particularly in the maritime sector, fuel cells are taking a central role. Fuel cells (FCs) have all the attributes to become a potential source of clean electricity on board ships, but the technology applied to the maritime environment is still in the experimental phase and state-of-the-art knowledge is the result of on-going funded projects [2].
A comprehensive review on the basics of fuel cell technology implications in the maritime environment and experience from funded projects prior to 2016is given in the literature [4]. Since then, the European projects “MARANDA” [5], on the use of proton-exchange membrane fuel cells (PEMFCs), “SHIPFC”, on the use of ammonia as a fuel in SOFCs [6], “NAUTILUS”, based on the use of LNG in SOFCs hybridized with batteries [7], and “eShyps”, on the normative framework for an effective introduction of hydrogen in the maritime passenger transport sector, make up the most important sources for development in this application area [8].
In naval applications that require high power (several tens of MWs), such as cruise ships, it will be difficult for fuel cells alone to completely substitute diesel generators on board. A more realistic vision, today, could see the use of fuel cells for auxiliary power generation in uninterruptible power supplies or as a support to primary generation. Auxiliary power generation refers to constant and invariable loads, such as rooms and hotel services whose demand is known but not associated with propulsion. The next step in the maritime shipping industry will include the use of cleaner fuels on board, leading to further innovations of propulsion and electrical systems on board.
This paper includes a brief description of the generation and distribution grids on board large cruise ships and, based on the fuel cell technologies that are available today, identifies the most suitable architecture for the case study. The innovative contribution of this work consists of a multifactorial assessment of the sizing of fuel cells and their comparison with a traditional generation system of a cruise ship, based on weight, volume, cost and reliability. The case study focuses on an LNG-fueled cruise ship with an installed electrical power on board of between 40 and 60 MW [9]. The sizing of the components follows strict guidelines (RINA regulations) on both fuel bunkering and the minimum power to be guaranteed in case of failure on board ships, e.g., the minimum time that essential cargo loads need to be ensured is 18 h, and consequently, the sizing of the emergency power unit will be determined based on this datum. Section 2 reports the state of the art of FCs and their topologies, and Section 3 highlights the two basic architectures analyzed: a traditional layout of an on-board power system and a modular FC system. Section 4 reports the case study of a cruise ship and the design of FCs considering the number of stacks, as well as their weight and footprint. Section 5 describes a techno-economical comparison between the two generation systems, both powered by liquefied natural gas (LNG). The paper ends with an analysis on reliability between the old and the new system through the Reliability Block Diagram (RBD) method by identifying the most suitable series/parallel layout to ensure continuity downstream.

2. State-of-the-Art FC—Topology

FCs utilize an electrochemical process to obtain clean electrical energy. This energy can be used to power vehicles, for electronic appliances or as a distributed generation source [10]. During operation, the cells use hydrogen and oxygen in separate electrodes, the anode and cathode, respectively, generating electricity and water directly from the chemical energy of fuel [11] without combustion [9]. Thus, unlike batteries, a fuel cell converts fuel into electricity so that the amount of electrical energy that can be generated depends solely on the amount of fuel stored, not on the size of the system [10]. FCs are characterized by high power density, small size and high efficiency [12].In the shipping industry, fuel cell power production can eliminate NOX, SOX and particle matter(PM) emissions and reduce CO2 emissions, especially when compared with emissions from diesel engines [13].Nowadays, there are seven main fuel cell technologies, and they are alkaline fuel cells (AFCs), phosphoric acid fuel cells (PAFCs), molten carbonate fuel cells (MCFCs),solid oxide fuel cells (SOFCs), proton-exchange membrane fuel cells (PEMFCs), high-temperature PEMFCs (HT-PEMFCs) and direct methanol fuel cells (DMFCs) [11]. The main characteristics of these FC types are well known, as are their implications for maritime applications [4,14,15]. The main challenges for FC systems are still manufacturing costs, which are also related to the lack of mass production, and the availability of valuable materials to build FCs. Furthermore, the application of FCs requires specialized harnessing of heat recovery [16], fuel treatment [17], control [18] and degradation of membrane performance [19]. Typically, fuel cells systems have an electrical efficiency of between 40% and 60%, but in combined heat and power (CHP) systems, they can achieve efficiencies of up to 90% [11]. Authors are able to identify the ideal type of FC based on its size and related reliability [18].
The two technologies most suitable for the cruise ship case study are PEMFCs and SOFCs. PEMFCs in preferred because it has the highest power densities and respond well to changes in loads; however, they require high power densities on board, and storing large quantities of hydrogen is a problem [20]. The selection of LNG fuel represents a substantial advantage, leading to the choice of SOFC technology. The SOFC-type system for use on board sea-going vessels has already been studied in various projects, as reported in the Introduction. Regarding dynamic response, reference is made to [21], where a model of an SOFC engine and system is presented. Moreover, SOFC systems have begun to be investigated in the automotive industry [20]. This technology, compared with PEMFCs, offers greater power flexibility, lower sensitivity to impurities and a fair lifetime.

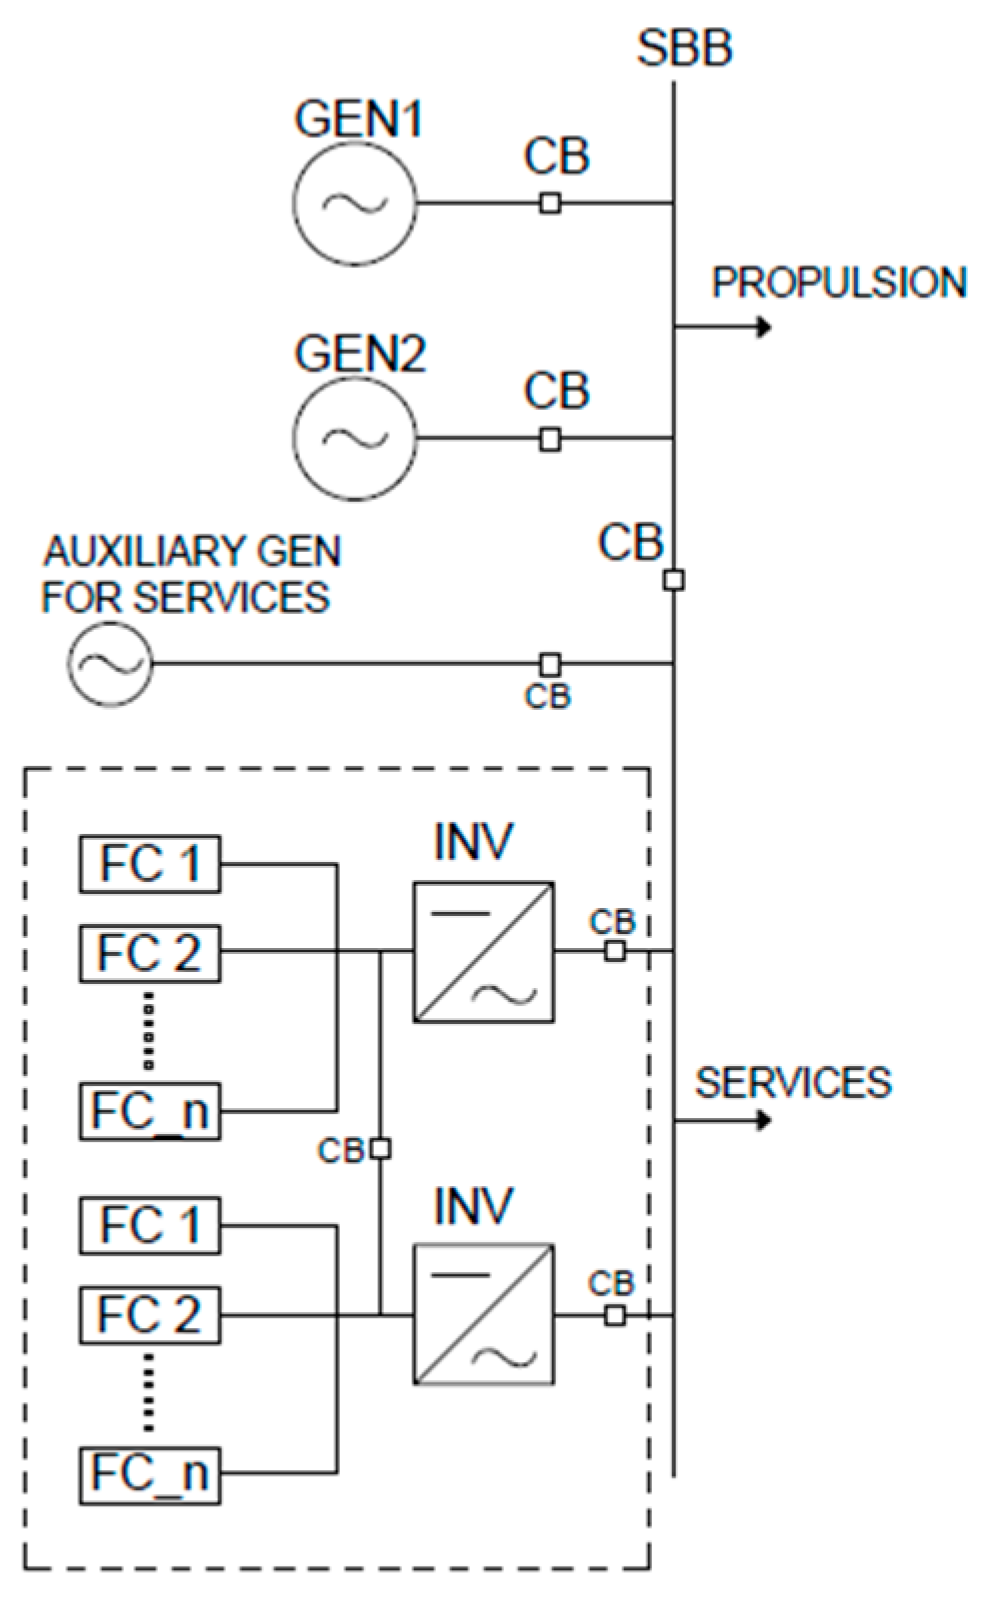
3. The Two Architectures Analyzed

Over time, naval electrical systems have evolved to meet increasing power demands, serving in both propulsion and on-board services [22]. Innovative systems are proposed to improve the environmental impact of a ship; using fuel cell generation for on-board services moreover eliminates the problematic pollution that large ships bring to port cities. From the operational point of view, shipboard power systems are similar to islanded terrestrial microgrids [23].The traditional layout of on-board power systems consists of LNG-fueled diesel generators, usually located in a pair of engine rooms (one forward and one aft) on the ship, and a distribution system that supplies power from the main switchboard via cables to all the end users scattered along the ship [11]. The overall electrical system must comply with the main standards and ensure the following basic requirements [24]:
  • Reliability and operational safety;
  • Contained weights and volumes of electrical machines;
  • Limited mechanical vibrations;
  • Reduced possibility of fire.
The voltage level of the primary and secondary distribution depends on the gross tonnage of the ship. However, on average, a cruise ship has a tonnage between 80,000 and 150,000 tons; the largest ships can weigh up to 225,000 tons. The total average power consumption by the base hotel loads (services), for this case study, is about 2 MW; the FC system can be divided into two sections (right and left), each sized for a 1 MW nominal load. Figure 1 describes the section of the architecture analyzed; it is located upstream of the MV busbar, i.e., in the area for generation of on-board services. The propulsion system is equipped with LNG combustion motor generators, as shown. On-board generation on cruise ships is carried out with two propulsion power generators in the tens of MW size for each power plant. There are two generators for on-board services that need a continuous supply. All generators in the on-board power plant are LNG-fueled, as well as the FC. Instead, the scheme described upstream of the MV busbar shown in Figure 2 is related to the innovative FC generation system proposed to substitute the service generators (“port gen for services”) and port connections [25].
Starting from the scheme in Figure 1 (the traditional one), the goal is to eliminate the generators used for base hotel loads and replace this with a 1 MW modular FC system. The generators used for propulsion remain unchanged. To increase the reliability of the system, however, an auxiliary generator will be retained as a back-up that will not be used under ordinary conditions and therefore is not dealt with here. Starting from the scheme in Figure 1, with two power generators and two generators for hotel loads, the system shown in Figure 2 can be obtained. In this model, 1 MW of the hotel loads will be replaced by the FCs, and two generators are added for back-up power (hot or cold) [26].
The scheme in Figure 2 allows high degrees of reliability to be achieved. The system is a redundant system with two inverters and n FCs connected to form the power stack we need.
Moreover, better than the traditional system, the architecture with FCs guarantees a good fault tolerance, with the possibility to switch to a back-up component or group by introducing redundancy. The prerequisite for practical redundant operation is an FC modular system that can be maintained or repaired during regular operation of the ship. The weak point of the system is the electronic inverter. For this reason, the generating system is connected to two inverters in parallel, both of which are sized for the maximum power (1 MW); as a result, the electronic converters turn out to back up each other. In the event of a cell stack failure, only a small percentage of generation may be lost; therefore, the generation system is divided into several FC stacks connected in parallel. The whole generation system, studied in this work, allows replacement and maintenance operations to be conducted with the system in operation, introducing some benefits, including the following:
  • Increased operational reliability and safety;
  • Containment of the weights and volumes of electrical machines;
  • Limits on mechanical vibration;
  • Reduced possibility of fire;
  • Reduced port pollution.

4. Case Study: Introduction and Scope

The cruise ship under study utilizes an 11 kV AC–60 Hz power system, which is consistent with the majority of cruise ships. If a power converter is needed, it is advisable to install it onshore, as suggested in reference [27]. A voltage level of 690 V AC will be chosen for the secondary distribution throughout the ship, except for in the kitchens, which use the 440 V value.
On board the ship, two power stations for the production of electrical energy are installed (each power station usually has three synchronous generators), as well as one emergency power station, usually sized for about 1 MW.
Overall, the generation power is about 60 MW, which is divided as follows: about 10 MW is used to power the on-board services (hotel loads) while the remainder is used for propulsion [27].
In this paper, only the electric generation part associated with continuous base hotel loads is included in the sizing, leaving the electric propulsion part unchanged. Moreover, only the base hotel load power of half a ship is considered (the target size is 1 MW), and only one of the two power plants on board is designed. For the economic comparison between the two systems and in component sizing, a very constant and predictable load profile is assumed [1].
The sizing of the components follows strict guidelines both on fuel bunkering and on the minimum power to be guaranteed in the event of a breakdown on board. RINA and SOLAS (Safety Of Life At Sea) regulations have also been taken into account to size the emergency generator [28]. All recommended regulatory inputs for increased safety are then used as a basis in technical design choices. There are usually four generators on board a ship for each side:
  • Two for propulsion;
  • Two for on-board services (hotel loads).
A comprehensive comparison between two equivalent power generation systems, a diesel generator and a fuel cell system, both fueled by LNG is presented below.
The comparison is structured into three main aspects. The first evaluates the volumes and weights of both systems, including the storage tanks. The second is an economic analysis, considering both purchasing and operating costs. Finally, the third aspect focuses on the reliability of the two solutions.

5. Comparison Between Traditional Generators and FC System

This section shows the comparison between the two systems previously illustrated: the SOFC system and the conventional electric generation system. Both systems are compared on the basis of weights and volumes and are powered by the same LNG fuel.

5.1. Weight and Volume Evaluation of Traditional Generator Tank

Table 1 reports the main features used for sizing the LNG 1 MW generator.
Taking into account Table 1, the 3512BTA 1500 generator with a power of 1500 kVA has been considered. Table 1 can be used if the reader wishes to extend the analysis to other systems.
The following main technical features can be summarized for an LNG system:
  • Generator weight (12,594 kg) and fuel/h weight;
  • Generator volume (24 m3).
The generator has an hourly consumption of 331.5 L per hour. The volume of the tank is 0.33 m3 (1).
Vtank = Ch = 331.5 L
where Vtank is the volume of the tank andCh is the hourly consumption of the unit.
Considering that natural gas has a density ranging from 0.42 kg/L to 0.47 kg/L [29],
VLNG = dLNG × Ctank= 0.42 × 331.5 = 129.23 kg
This is the hourly mass that must be added to the weight of the generator; assuming that the density is 0.47 kg/L, the result would be 155.81 kg. Continuing with FC tank sizing, a 1 MW system operating for 1 h will deliver the following:
EFC = Paverage × t=1 MW × 1 h = 1 MWh = 3600 MJ
Considering an SOFC and remembering that LNG has an energy density of 5.8 kWh/L [30] and the SOFC system has an efficiency rating of at least 60% [20],
V L N G = E M J E n e r g y d e n s i t y M J L × η F C = 3600   M J 5.8 × 3.6 × 0.6 = 287   L
The amount of LNG that is needed on board is directly proportional to the expected number of hours of operation. Therefore, the tank sizing is proportional to the amount of LNG needed. In a similar way to the previous case, it is possible to calculate the weight of the LNG for the fuel cell application.
m L N G = d L N G × V L N G = 0.42   k g L × 287   L = 120.54   k g
Opting for LNG density values of 0.42 kg/L or 0.47 kg/L, the resulting weights are 120.54 kg and 135 kg, respectively. This is for continuous operation at 1 MW power.

5.2. Sizing of Power Generators for On-Board Services

As previously mentioned, an FC system is compared with a diesel generator withthe same power. Single SOFCs generate around 10 W depending on the fueling conditions and the electric load, and these are connected in series to form stacks. The size of these stacks can vary depending on optimal power as well as fluid and thermal management for the specific cell architecture. Stacks are then usually integrated in stack modules that provide the plug-and-play interface with the overall system. To obtain the power of 1 MW, any configuration of stacks or stack modules can be employed, e.g., 1000 modules of 1 kW stacks or 10 modules of 100 kW stacks. This depends entirely on the engineering approach selected by the SOFC stack technology developer, and both stacks within the module and the modules themselves can be connected in parallel or in series. Usually, series connection is preferred to crank up the system voltage. The voltage generated by single fuel cells has a low value (0.6 to 0.8 V); therefore, full series connection is suggested, leading to an output voltage between 6 kV and 8 kV, very close to the desired 11 kV in MV.
Although SOFCs respond fairly well to load variations, in this case study, they are used for continuous base hotel loads. Electric propulsion powered by conventional generators is maintained as they are better suited to provide peak power in transients and can better safeguard the SOFC, preventing more rapid degradation of performance. LNG can be used in both natural gas engines and fuel cells and is characterized by 15% higher efficiency than diesel [20]. The FC modules are completed by the entire electrical system known as the Balance of Plant (BoP). The BoP includes all the facilities necessary for the operation of the plant (electronic control system, heat recovery system and the auxiliary equipment). The size of the BoP depends on the chosen FC technology.
Market surveys suggest adopting, for stacks of this type of cell, a power density of 0.073 kW/kg and 0.37 kW/L. With these data, the volume and weight of a 1000 kW system can be calculated. The result is that the SOFC modules weigh 12 tons and occupy a volume of 2.75 cubic meters. Similar systems, including the Balance of Plant (BoP), are housed in containers with the following dimensions:
6 m × 2.4 m × 2.5 m = 33 m3
The authors make the assumption that the Balance of Plant (BoP) weighs approximately 7 tons or less. They envision a real “container” that houses all the necessary equipment for supplying, conditioning and controlling reagent flows (such as fuel and air), managing heat exchange, regulating power and incorporating safety devices. This container, including both the Balance of Plant (BoP) and its associated accessories, is estimated to have a total weight of 10 tons.

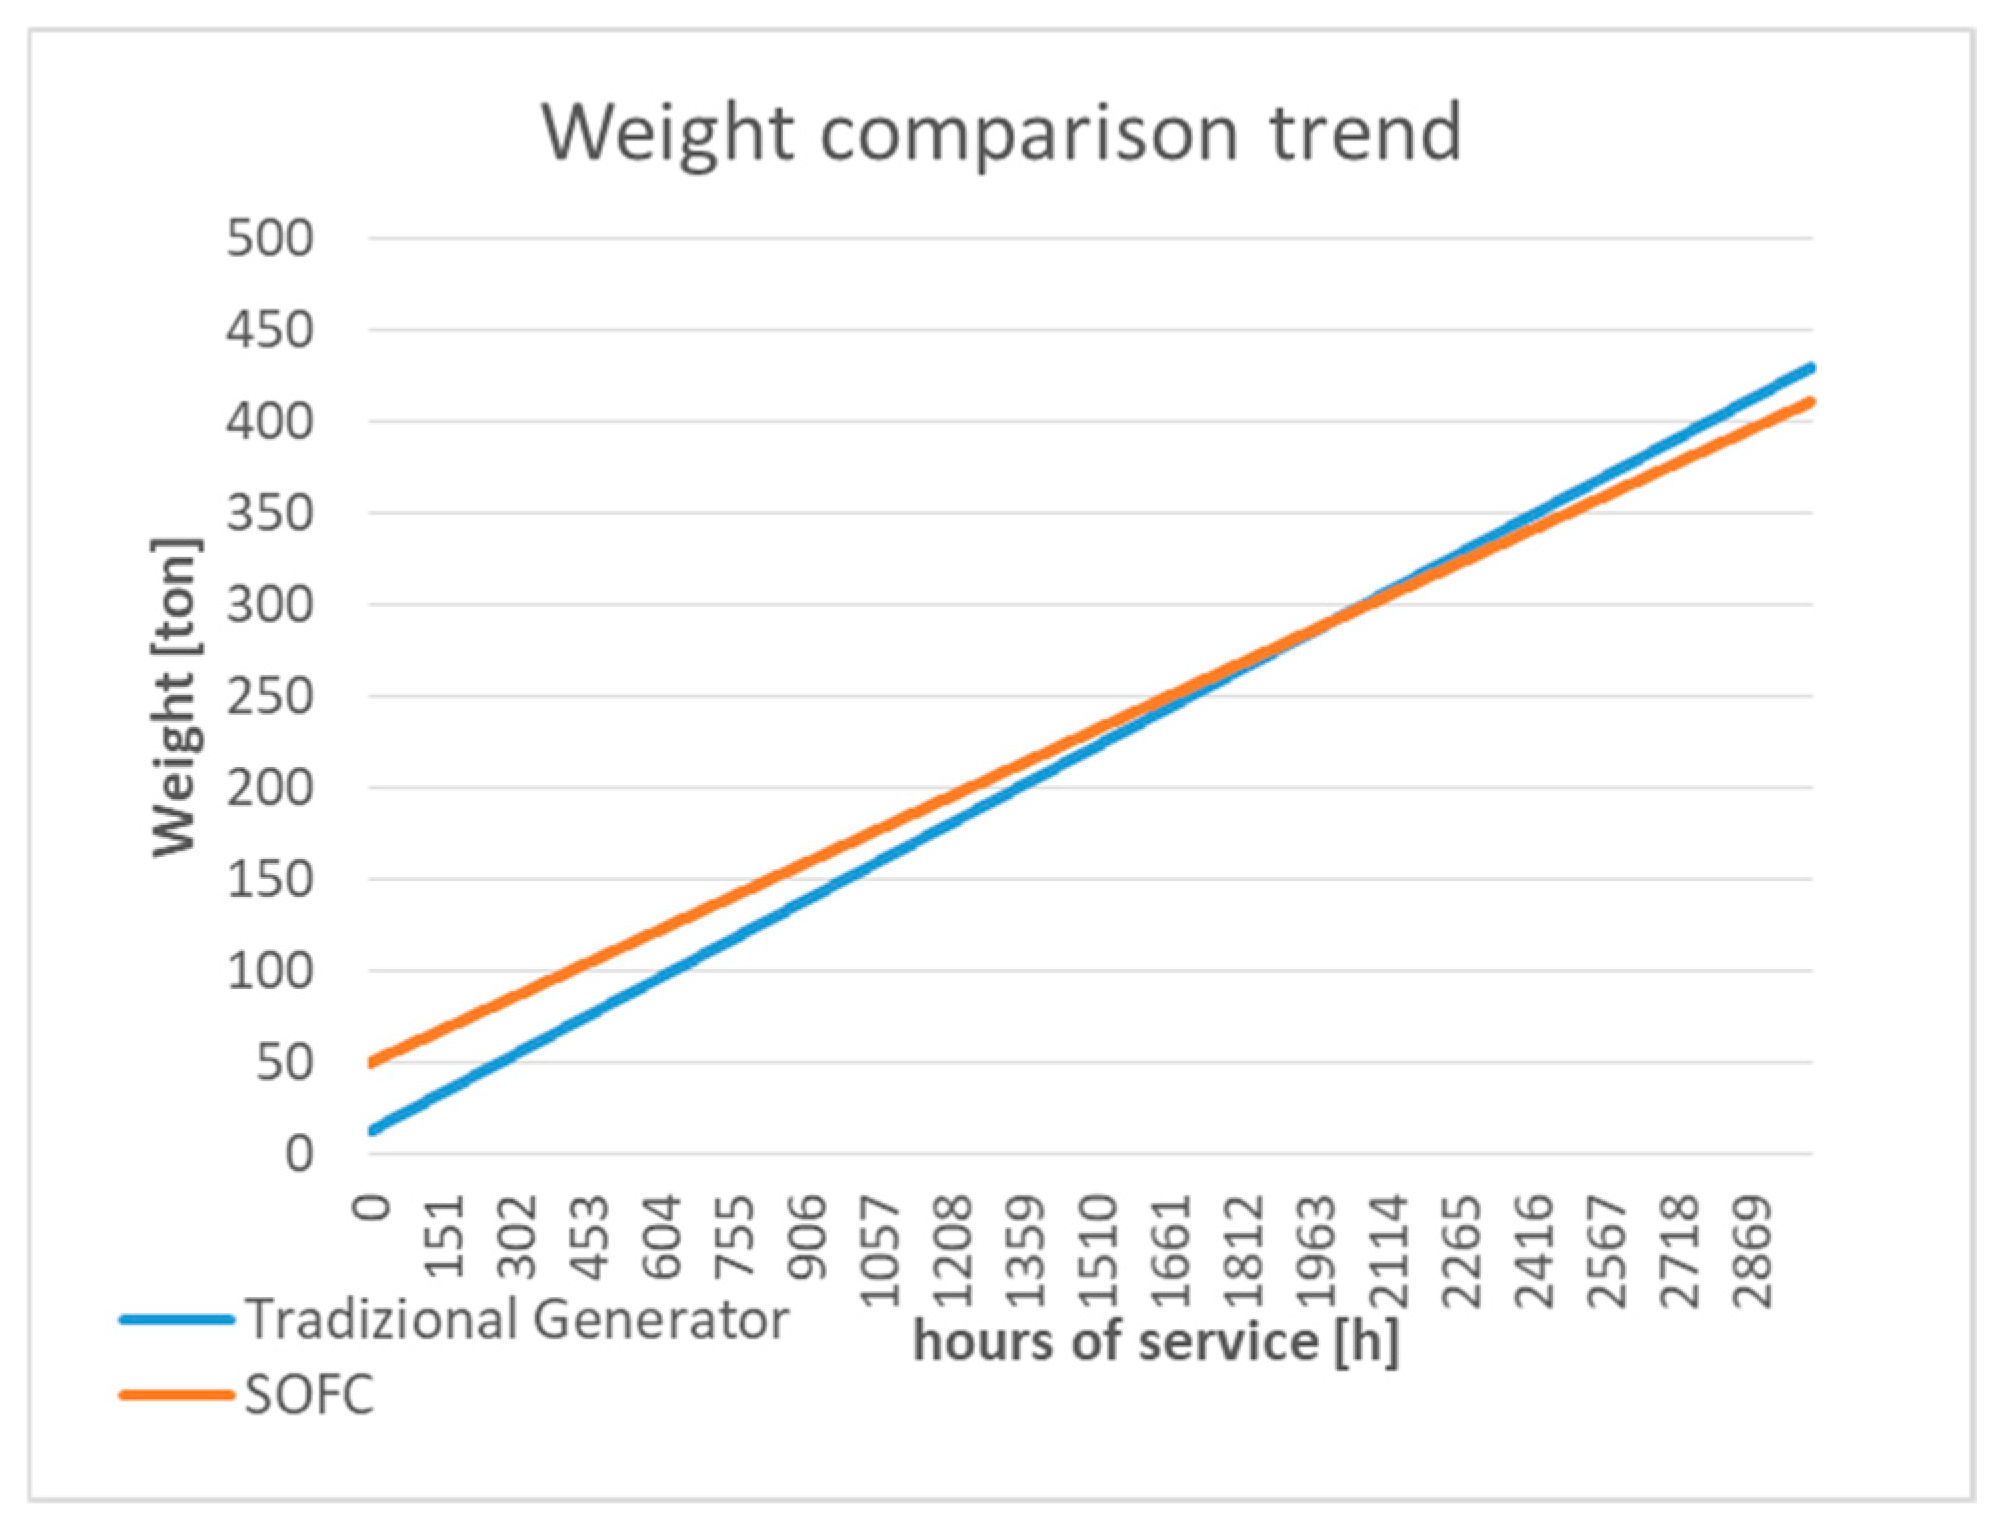
5.3. Weight and Volume Comparison Between Old Generators and New FC System

A comparison of the weights takes into account both the weight of the systems and the weight of the fuel for each hour of operation. A summary of the data associated with the weights and volume of the two systems, powered by LNG, is shown in Table 2.
The volume and weight of the generator can be obtained from the datasheet of the generator reported in Table 1.
To assess the suitability of the two systems from a weight perspective, Figure 3 has been evaluated.
Comparing the tank volumes of the systems reveals that the fuel cells (FCs) require a volume of 0.28 m3, while the generator, during hours of service, needs a volume of 0.33 m3. The trend of the graph is that of two straight lines represented by an equation of the following type:
y = mx + q
where m is the angular coefficient and represents, as well as the slope of the line, the hourly consumption (in kg), so it will be, in one case, 139.23 and, in the other, 120.54, and q represents the point of intersection with the y-axis and the weight of the two systems with the “empty” tanks, i.e., 50 and 12.5 tons in the two different cases. The point of intersection is equal to 2001.4 h.
The result obtained and shown in Figure 3 suggests that the fuel cell system is more convenient for operating times above 2001.4 h, while for generation with operation below 2001.4 h, the conventional generator is more convenient. This is under the assumption that there is no intermediate refueling in the cruise ship route.
From a technical point of view, the weight and volume assume a principal role to be taken into account in maritime application. The weights are important as the ship cannot load too much over the limit, in which case the waterline would go below the set level, compromising optimal navigation and increasing consumption. The graph also shows that both technologies are comparable in terms of weight, so the proposed new system appears to be absolutely viable.

6. Technical and Economic Comparison Between Old Generators and New FC Technology

Between the two different solutions, it is useful to evaluate the expenses incurred to determine which, among its solutions, is more cost-effective. Thanks to the previous section, the hourly consumption of the two systems, expressed in [kg/h], is known. The price of LNG fuel is 0.8 EUR/kg (11/2024 Source: Carnival Corporation).

6.1. Purchase Cost and Initial Investment

An initial investment of EUR 400,000 is assumed for the 3512BTA caterpillar generator shown in Table 1. The capital cost of investment for the SOFC system is between 1500 EUR/kW and 3000 EUR/kW: for the 1 MW system, an initial investment for the FC system of EUR 1.5–3 million is expected.

6.2. Maintenance and Operation Costs

Relevant for comparison purposes are the annual expenses related to maintenance and fuel. Maintenance costs for the generator follow very specific protocols, and, in particular, the following expenses will need to be addressed (case of Carnival Corporation):
  • EUR 15,000 for annual maintenance of the engine and alternator;
  • EUR 60,000 every 5 years;
  • EUR 15,000 over 5 years in various expenses not included in previous expenses;
  • Total for 5 years: EUR 150,000.
For the assessment of FC-related maintenance costs, it will be difficult to have concrete estimates given that they are an innovative technology. Evaluating the state of the art (current—2024) with an estimated performance life until 2027, the following costs will have to be incurred:
  • 1% per year of total invested capital: EUR 15–30,000;
  • 15% of annual capital invested for stack replacement: for this study, we consider the constant value of EUR 450,000.
Due to aging during operation, the SOFC stack should be replaced after 40,000 to 70,000 h. An important consideration is therefore the number of annual hours of use. Considering the high investment, especially in the SOFC system, we assume a minimum operation of 5000 h per year and a maximum of 8000 h. Table 3 reports all features described for the two systems fueled with the same LNG.
Below, the investment and operating costs for the two systems will be compared over a 40-year period, in the two scenarios where they operate for 5000 or 8000 h per year.

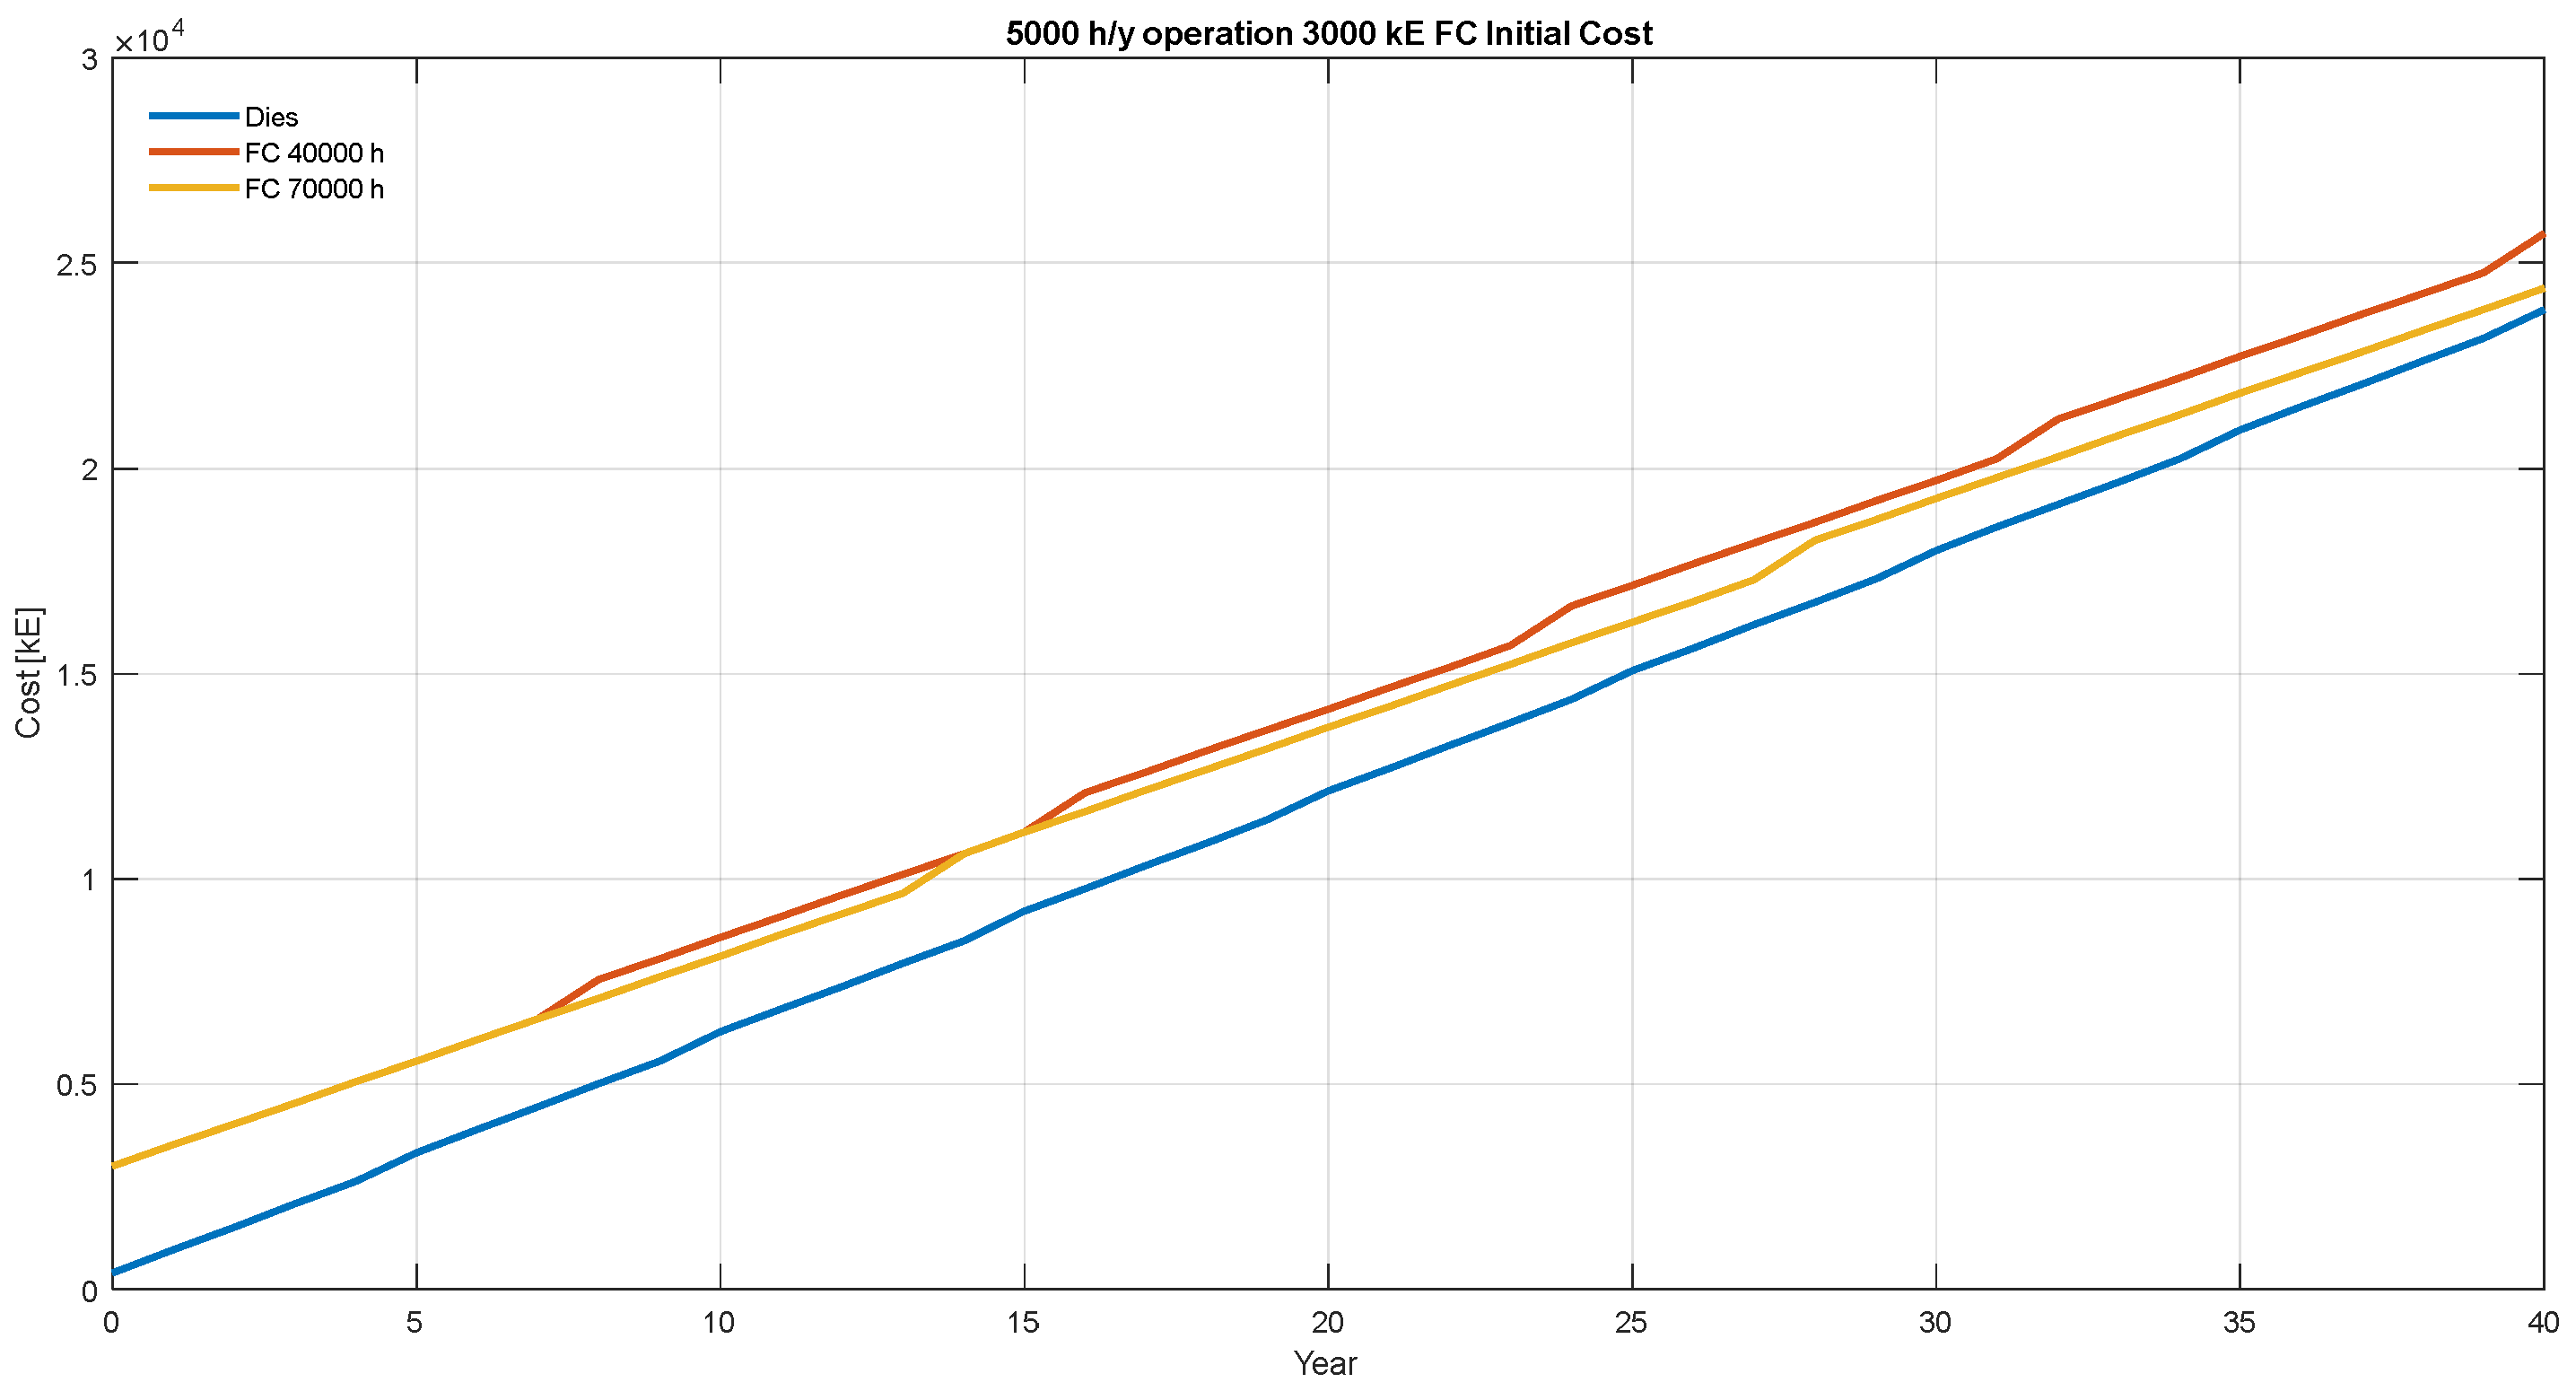
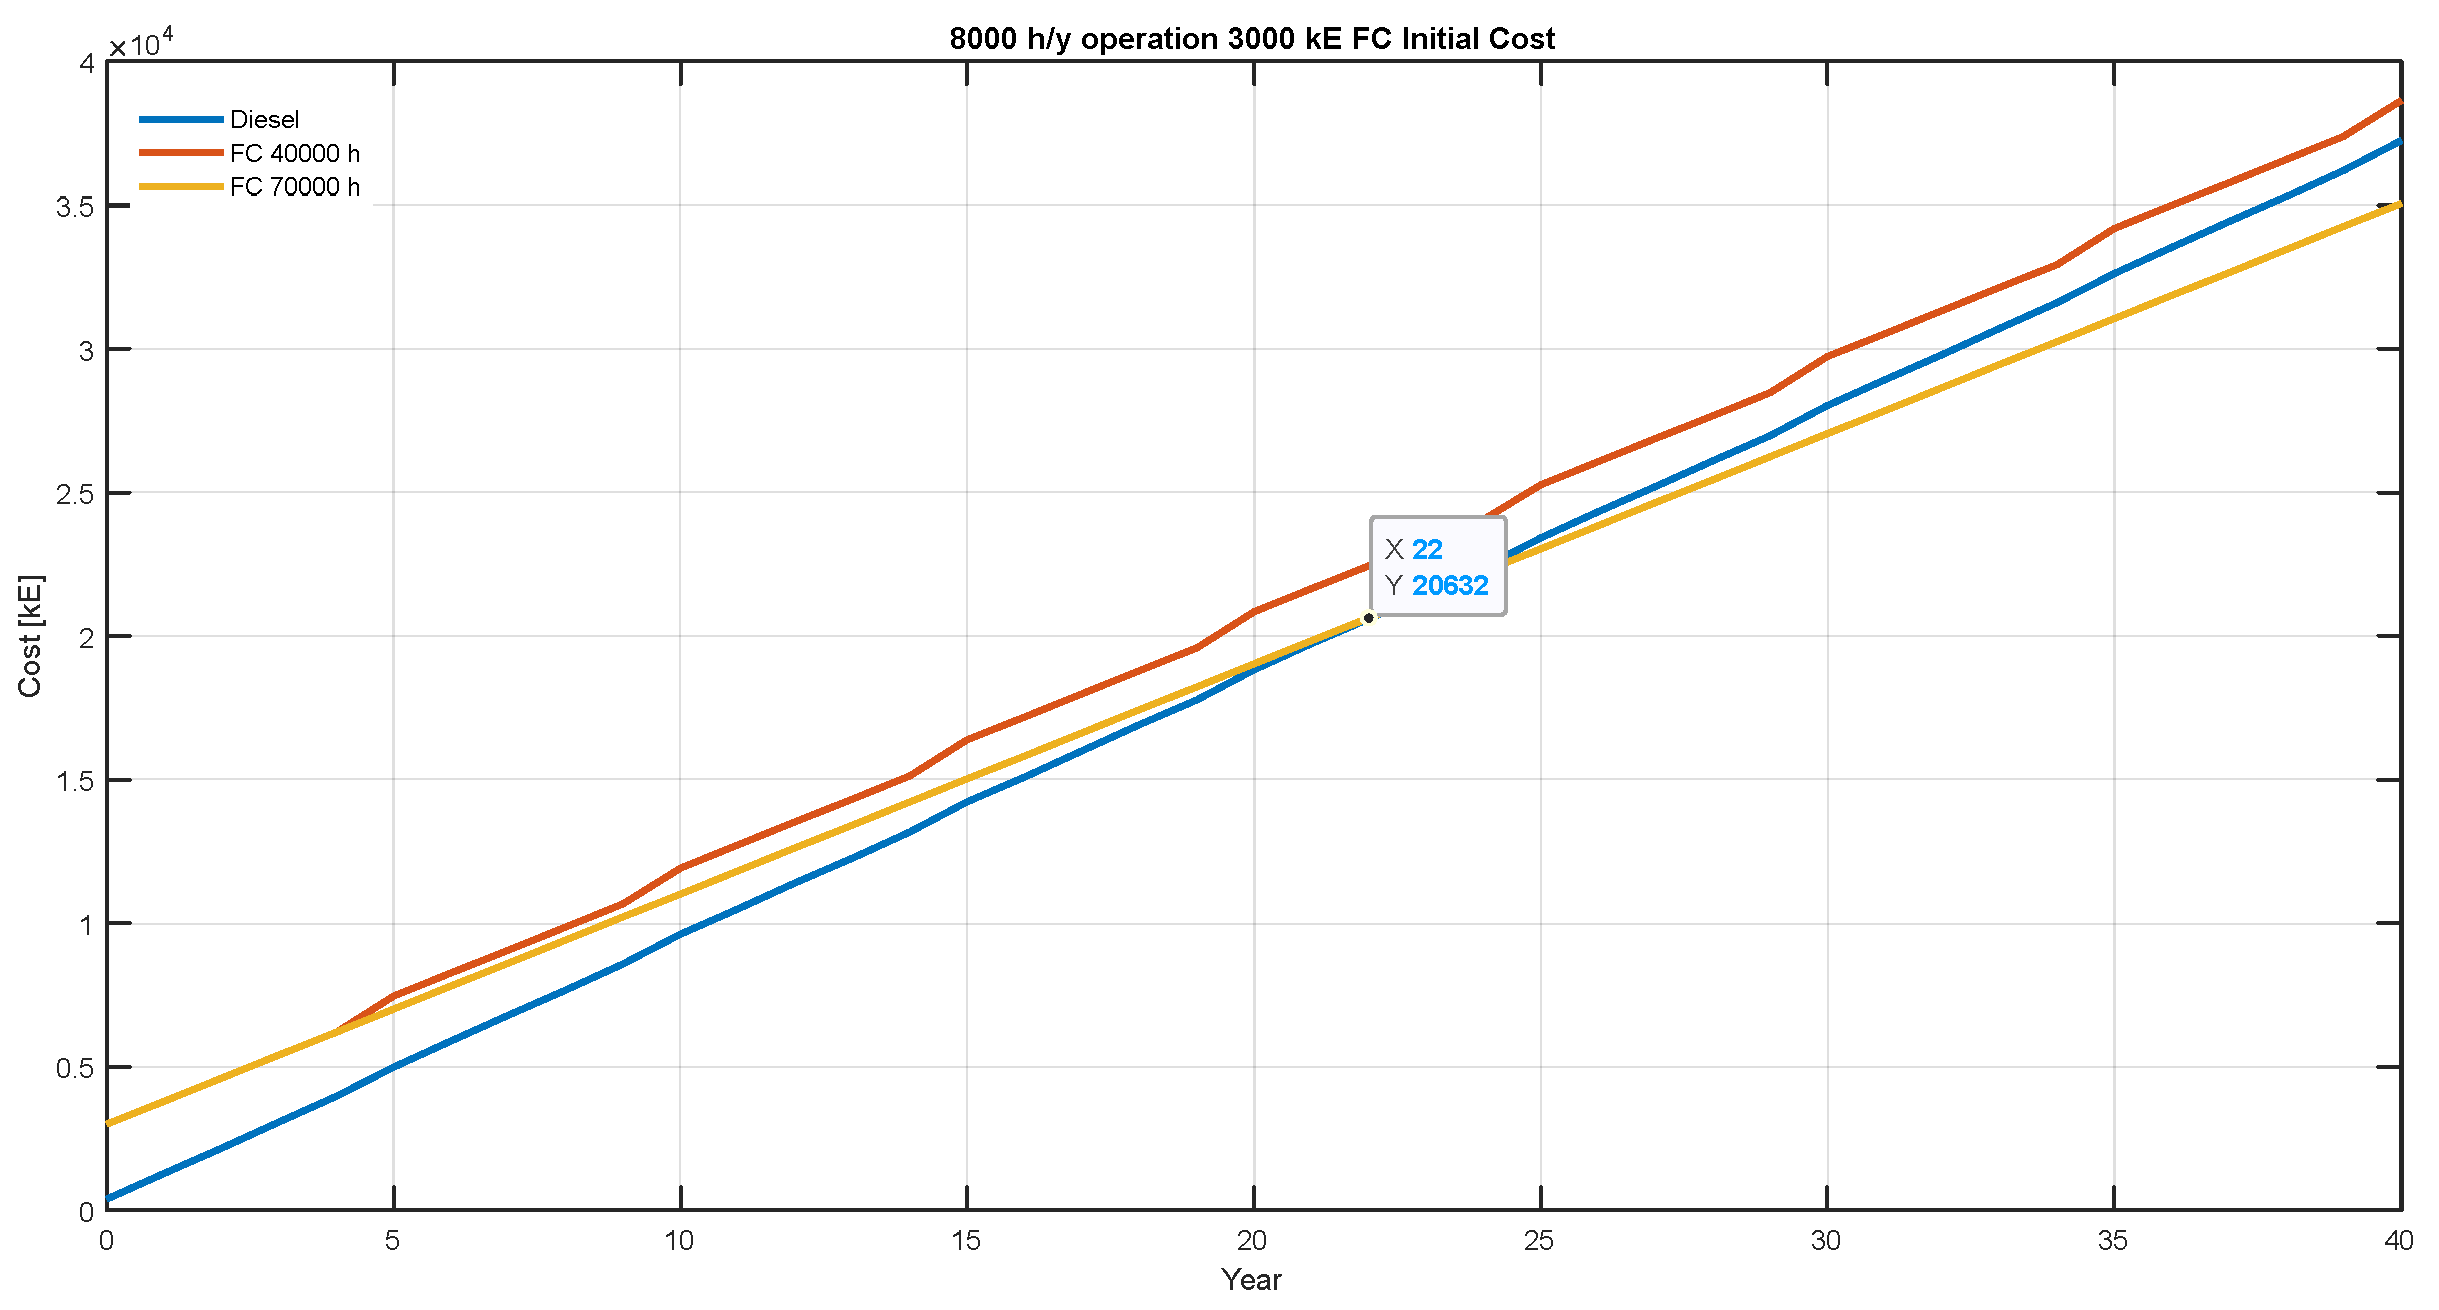
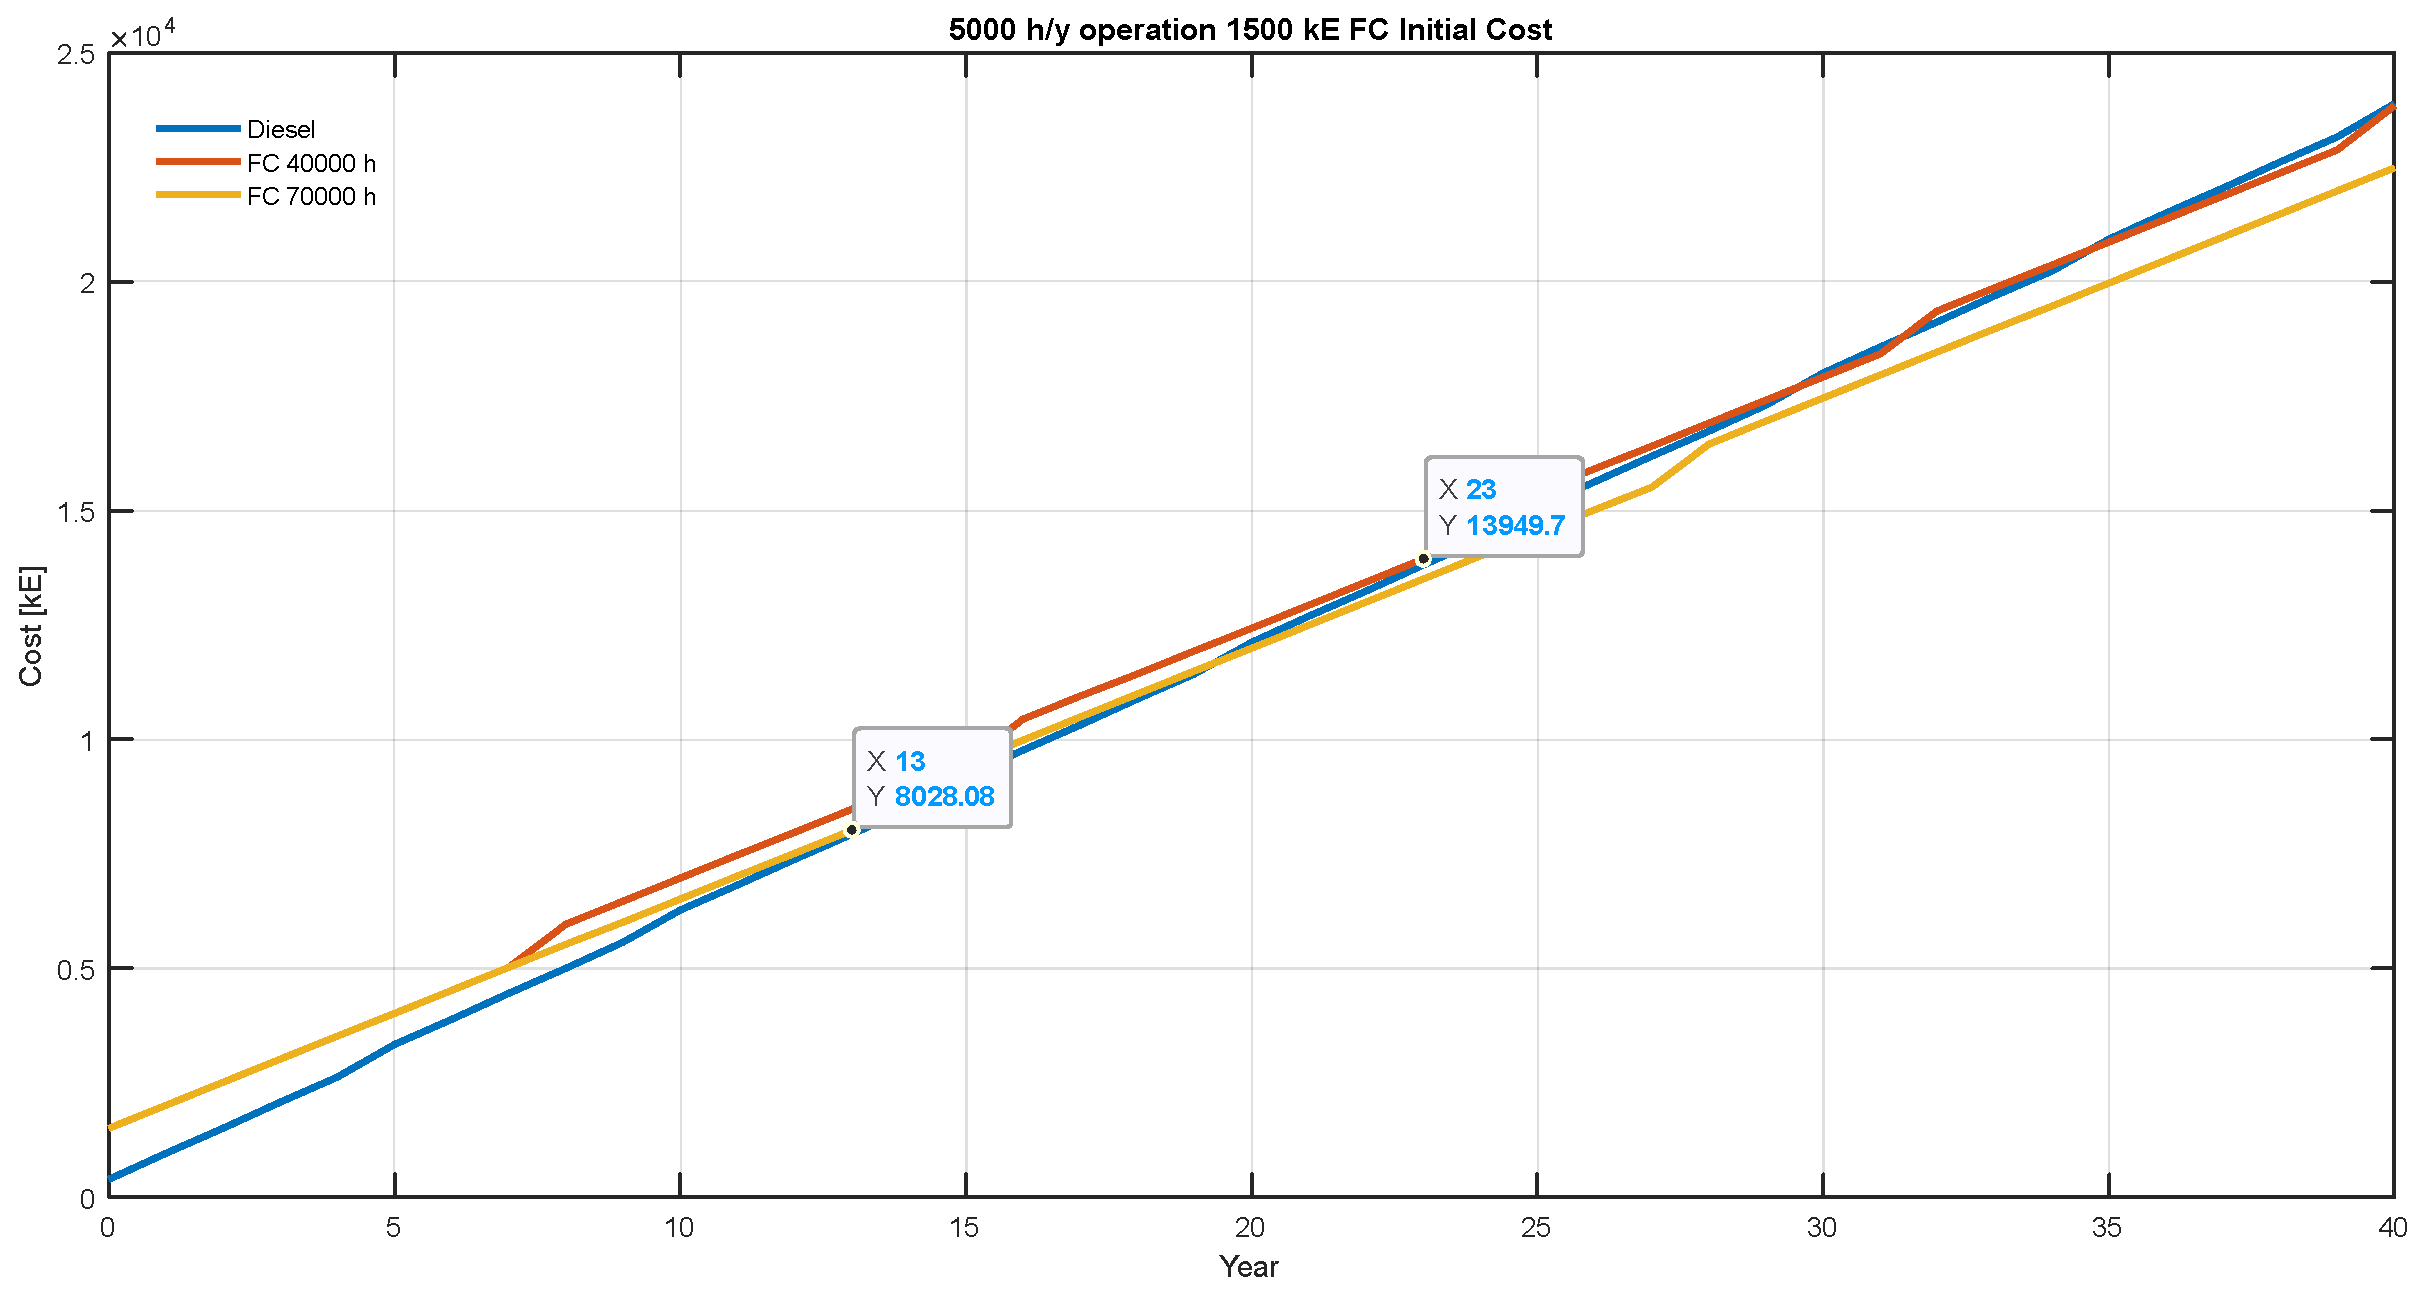
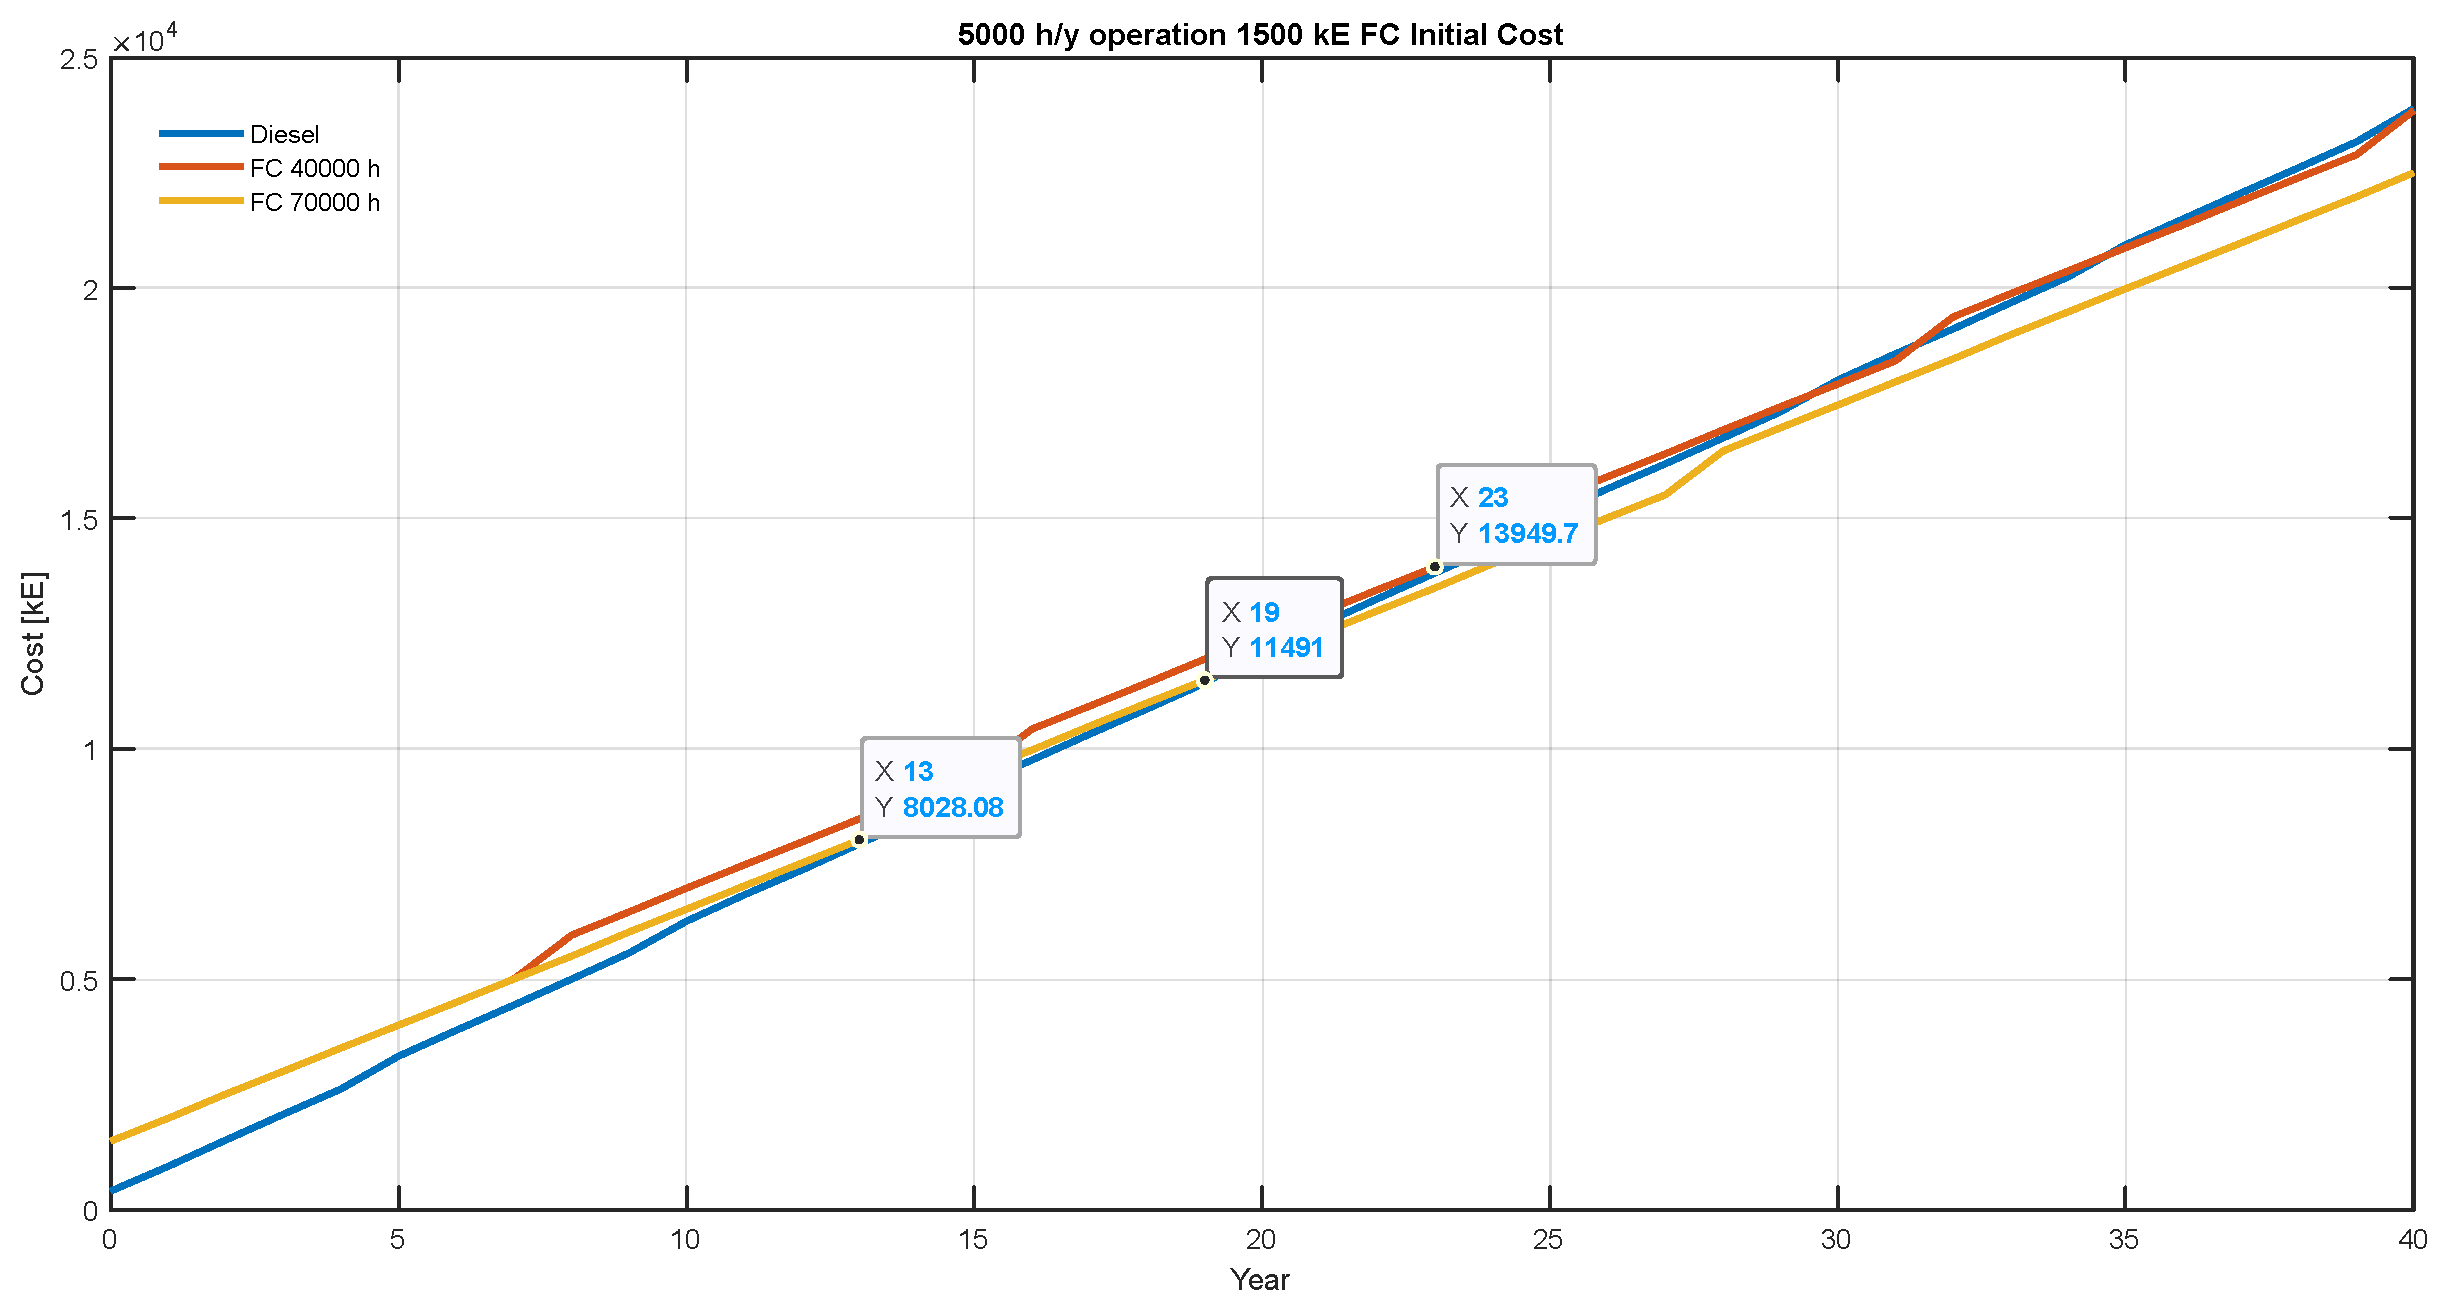
6.3. Estimation and Prediction

In order to conduct an investment analysis, a comparison between the purchase, operation and maintenance costs of the diesel generation system and the fuel cell system is made. It is assumed that both systems operate at a fixed point, generating part of the ship’s hotel load. This implies that fuel consumption remains constant throughout the service duration. Since the ship is never completely shut down (except for newly installed cold ironing systems, which are currently not widespread), very long operating periods can be assumed, which are interrupted only by maintenance stops. For the investment comparison, it is assumed that both systems operate for 5000 or 8000 h per year (one year = 8760 h). In the case of the diesel system, fuel consumption and its associated cost, as well as purchase and maintenance costs, and the number of operating hours after which maintenance is performed are known. For the fuel cell system, the extreme cases of cost/maintenance intervals presented in the previous tables need to be considered.
The following graphs show the total investment and operating costs of both systems, considering the annual operating time and the number of operating hours of the fuel cell stack before it is replaced with a new one.
Figure 4 presents the costs in the condition assuming the stack replacement every 40,000 or 70,000 h and with both systems operating for 5000 h/year; the initial cost of the FC system is kEUR3000.
From the graph shown in Figure 4, by running both systems at 5000 h per year and replacing the stack every 40,000 or 70,000 h, it is evident that the traditional generation system always pays off. It is evident that whatever the annual operating time of the cells is, it is always worthwhile, over the 40-year period of analysis, to opt for the conventional generation group. Now, the case is considered where the systems operate for 8000 h per year, and the stack cost is kEUR3000. The results are represented in Figure 5.
Even in this case, the investment in the fuel cell system does not seem very appealing, as it pays off in approximately 22 years and only if the stack is replaced after every 70,000 h of operation. The analysis is repeated under the most favorable conditions for the fuel cell, namely considering initial construction costs of kEUR1500. Figure 6 is analogous to Figure 4.
Now the scenario has changed: the investment in the FC stack proves to be advantageous if it is replaced every 70,000 h; otherwise, the two systems are practically equivalent after 19years of operation. Now, the most favorable case for the FC system is examined, namely investment costs of kEUR 1500 and 8000 h of operation per year (Figure 7).
In the extreme case, the FC system pays off in 13 years, is practically the same after 9 years, remains equivalent to the diesel system until 18 years, and becomes advantageous thereafter. However, with a stack replacement every 40,000 h, the investment is not very significant.

6.4. Results Discussion

The comparison just presented highlights that the real economic advantage of the fuel cell system lies in its higher efficiency compared to diesel. However, its investment and operating costs are significantly higher than those of diesel.
Table 4 summarizes the observations made up to this point. The number of years provided as the return on investment is the point at which the costs of the two systems are at least practically equivalent or the cost of the fuel cell system is definitively lower than that of the diesel system.
The simplified analysis indicates that the advantage of the fuel cell will emerge only with mass production and, potentially, an increase in the costs of the fuel gas.

7. Reliability

The traditional generation system, with the innovative one characterized by the addition of FCs, are compared in terms of reliability. For more in-depth analysis related to control logic and their strategies, reference is made to [18]. The comparison is used to identify and illustrate the optimal arrangement of SOFC systems, with the associated connection between the various complete systems, in order to ensure adequate reliability for the required utilization. The two systems are compared from the perspective of overall failure rates. The method used is the RBD (Reliability Block Diagram) method. Following SOLAS regulations, “a passenger ship must be designed so that essential systems remain operational after an accident. Vital systems must be contained within a watertight zone”. The basic requirement for ships is SRTP (safe return to port). It is planned to install one SOFC system for each fire zone. Remembering that there are five to eight fire zones in new ships, it is possible to cover the base load. Another advantage achieved is the equal distribution of weights on board a ship. The concepts of reliability, availability and MTBF have been calculated as reported in [31,32,33,34]. As follows, the probability of failure λ and the mean time to fault are defined in (7) and (8). In (7), λAVG is the average value of the failure rate, NF is the quantity of failed components, N is the total quantity of components in the analysis, T is time, MTTF is mean time to failure, MTBF is mean time between failures and MTTR is mean time to repair.
λ A V G = N F N t o t × T
M T T F = 1 λ A V G
The equations for calculating MTBF and availability are given in (9) and (10):
M T B F = M T T R + M T T F  
A = M T T F M T T R + M T T F
The RBD method is a tool for describing the effect of component failure in a complex system [35]. In order to apply the RBD method, it is important to make the assumption of constant failure rate over time and a non-repairable system. Having a system that is not repairable but is quick to replace means having an MTTR = 0. In the RBD method, the following basic rules were applied:
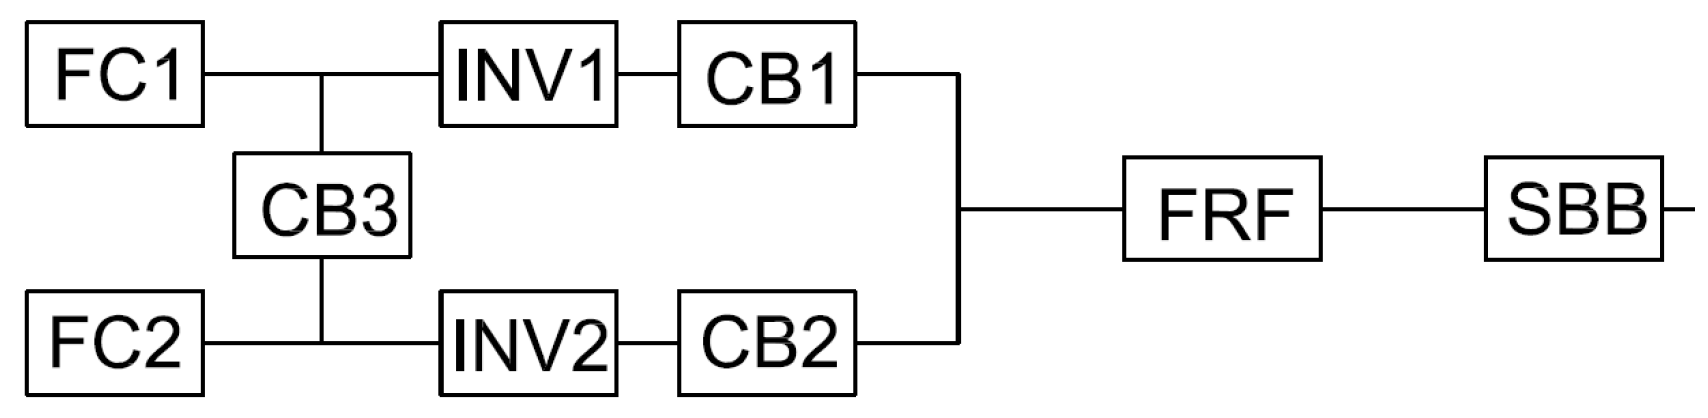
  • each component of the system is represented with a block;
  • different system configurations are considered, essentially to compare the traditional system with the proposed one.
For the innovative FC system, reference is made to the MTBF of the 1.5 kW stack alone [31]. The SOFC system, while having multiple components, is now characterized by the stack alone. The MTBF of the stack is between 100kh and 200kh. The other data were obtained accurately from [31] based on statistical data obtained over several years. The data chosen to make the subsequent calculations are presented in Table 5.
To ensure reliable results, a study of reliability is conducted based on tests that must follow stringent compliance. Valid scientific data are mainly collected in the laboratory environment through monitoring performed by [36].

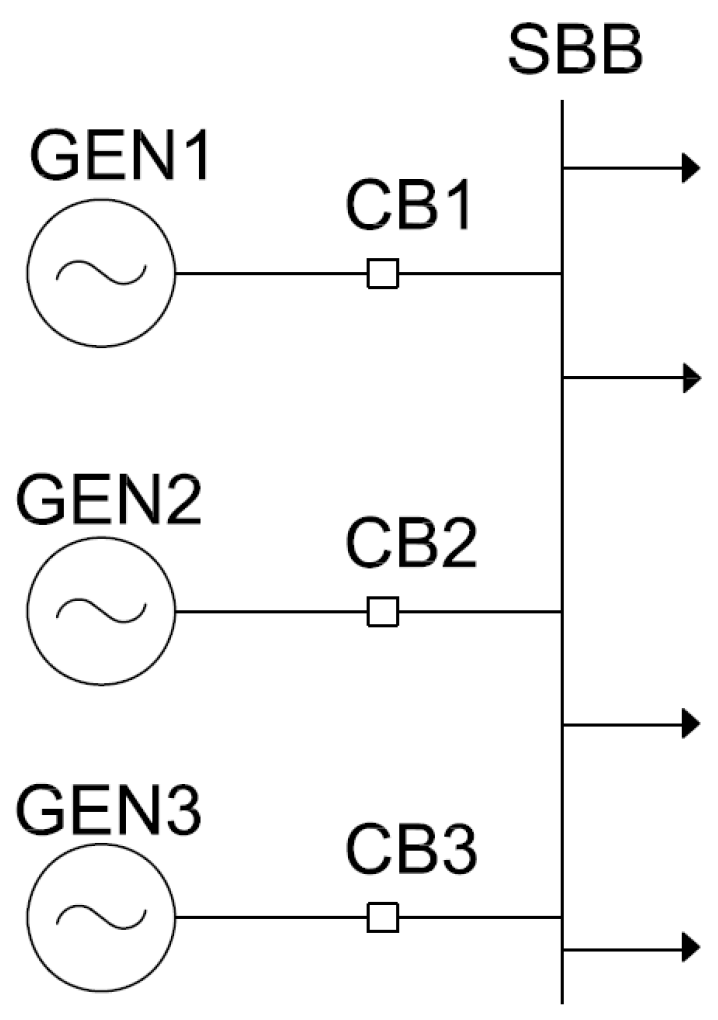
7.1. Reliability of Conventional Generator

Starting from the IEEE Gold Book data [37], an estimate of the reliability of the conventional generating set is made. Continuous operation of the synchronous generator is considered. The overall system, involving the generator pack plus all auxiliaries that make up the Balance of Plant, is taken into account.
The values of MTBF and MTTF reported in Table 6 refer to the operation of the generator for 8760 h/year. The reference MTBF value used in this analysis is 1997 h. However, it appears that the selected MTBF value of 1997 h is relatively low compared to the MTBFs listed in Table 6. This is attributed to the various potential failures that could affect the generator. Furthermore, the 1997 h MTBF includes all the auxiliaries of the generator. The most common failures of a generator are as follows [36]:
  • Control instrument failures;
  • Breaker failures;
  • Cooling system failures;
  • Engine failures (here, there will be many possible failure events related to the large number of mechanical components);
  • Exhaust system-related failures;
  • Fuel-related failures (starting from the fuel tank and going to the filters, pumps, any valves and injectors);
  • Failures related to the generator itself;
  • Failures related to oil lubrication.
Each type of failure contains within it multiple causes, and this would make the study of the overall MTBF of the system very long and complex. The symbol “FRF” refers to the risk of fire-related failure. A generator can be reliable for 15–20 years if routine and extraordinary maintenance are carried out. Quarterly maintenance of a synchronous generator is carried out after about every 2190 h of operation. If this quarterly maintenance results in “zeroing out” the possible causes of a failure event, then it could be argued that since 2190 h is greater than the MTBF of 1997 h, we could consider the system to be reliable overall. The value of the overall MTBF is quantified considering that there is always a medium-voltage switch downstream of each generator. The meaning of the acronyms reported from Figure 8, Figure 9, Figure 10, Figure 11, Figure 12, Figure 13, Figure 14, Figure 15 and Figure 16 are as follows:
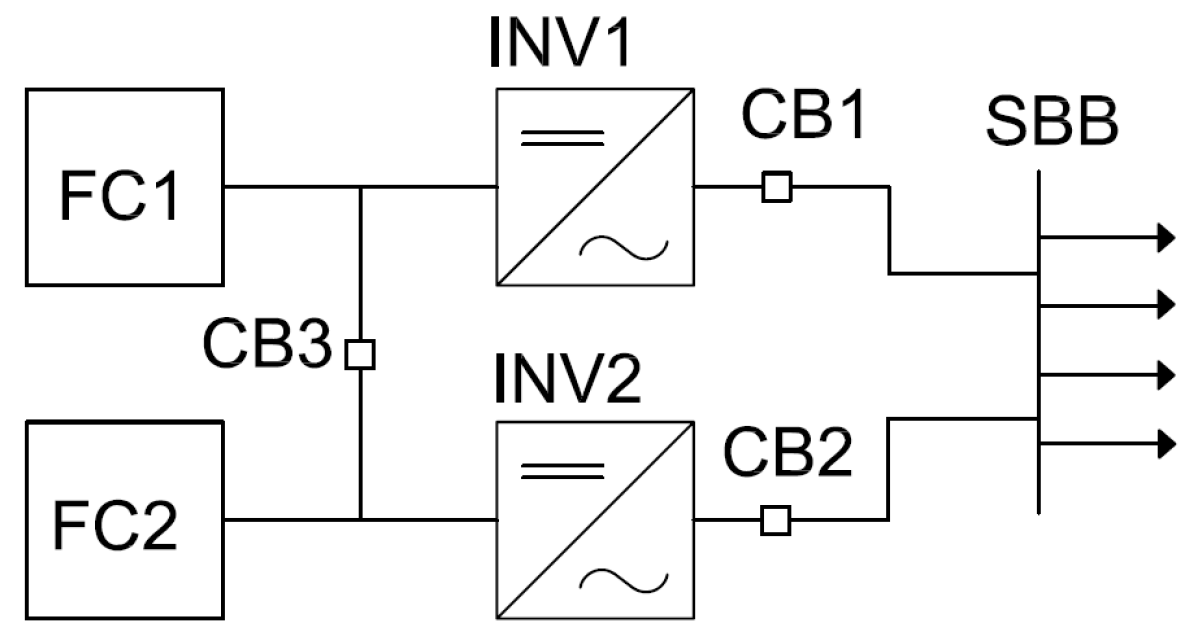
  • CB is circuit breaker;
  • SBB is switchgear busbar;
  • GEN is generator;
  • FRF is fire risk factor;
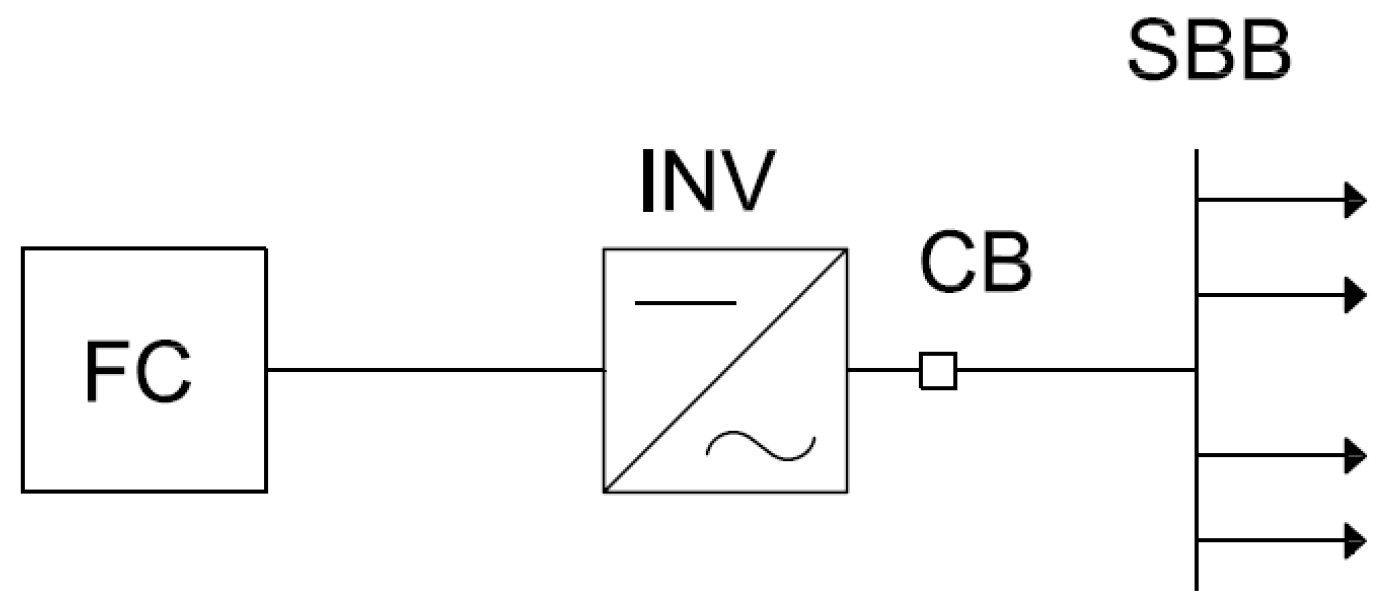
  • INV is inverter;
  • FC is fuel cell.
Regarding the analysis concerning control logic and its strategies, reference is made to [18]. The calculation of the total MTBF of the circuit is represented in the following equation:
M T B F T o t = 1 1 M T B F G E N + 1 M T B F C B + 1 M T B F F R F + 1 M T B F S B B = 1966   h = 0.22   y e a r s
As expected, the MTBF value is very similar to the 1997 h value of the synchronous generator alone. This is not a problem considering the very stringent maintenance protocols. Within the two shipboard power plants, as mentioned above, there will be a protocol based on redundancy. Usually, the redundancy is obtained with three generators for each independent power plant. This definitely raises the MTBF value and allows for continuity of generation when one or two of the three generators are under maintenance. Figure 10 reports the presence of three synchronous generators for each power plant, as is generally the case for cruise ships.
The calculations to assess reliability are reported below:
M T B F T o t = 1 1 M T B F G E N C B 123 + 1 M T B F F R F + 1 M T B F S B B = 3521   h = 0.4   y e a r s
where MTBFGENCB represents the three generator blocks and the switch in series:
M T B F G E N C B = 1 1 M T B F G E N + 1 M T B F C B = 1979.8   h
The MTBF value of the two systems in parallel is represented below:
M T B F G E N C B 123 = 0 R F G E N C B 123   d t = 3563.7   h
where
R G E N C B 12 = R G E N C B 1 + R G E N C B 2 R G E N C B 1 R G E N C B 2
The reliability value of the third branch put in parallel with branches 1 and 2 has been calculated in the same way, as follows:
R = e 1 M T B F × t
The total system with the three generators will have an MTBF value of 3521 h, which corresponds to 0.4 years. The MTBF value is a statistical value, and since the generator is subject to stringent maintenance protocols, it is considered reliable and safe.

7.2. Reliability of FC System

It is important to evaluate the complete reliability of the system from the stacks up to the 11kV busbar from which the different loads branch off. Figure 12 shows instead the scheme used for the RBD method. The symbol “FRF” refers to the risk of fire-related failure.
The calculation of the total MTBF of the circuit is represented in (19):
M T B F T o t = 1 1 M T B F F C + 1 M T B F I N V + 1 M T B F C B + 1 M T B F F R F + 1 M T B F S B B = 26,515   h = 3.02   y e a r s
These values are purely statistical data, and MTBF should therefore not be mistaken for the lifetime of a system. A given system may not fail during its operating life, while others perhaps may fail several times. The proposed circuit model definitely involves the presence of one or more UPS given the absolute continuity requirement. One might think that downstream of the SOFC system, there is a “no-break” load. The case study with UPS is not considered since a UPS is not present in the generation. For reliability, there is the concept of fault tolerance, and it is possible to switch to a back-up component or group by introducing the concept of redundancy. The prerequisite for practical redundant operation is a system that can be repaired. One could think of exploiting the SOFC system by dividing the 1 MW power into two or more systems and also dividing the related inverter by creating a link, which, as illustrated later, in the RBD model is a parallel connection. Systems, both fuel cells and inverters, can be connected in parallel. Increasing the number of components in parallel will increase the probability of failure but it will also tend to increase the MTBF value. The reason for parallel connection is the introduction of a redundant component. Redundancy increases reliability and the value of the MTBF. In an n + 1 system, the redundant unit (+1) must remain available for all remaining n units. The following figures report the presence of the power split in two. CB3 is a disconnect switch that is normally open and will be closed only if one of the two inverters goes out of service.
Assuming the same values for the MTBFs of both the inverter and the stacks, we can obtain the total MTBF in this case:
M T B F T o t = 1 1 M T B F F C I N V 12 + 1 M T B F F R F + 1 M T B F S B B = 38,073.32   h = 4.35   y e a r s
MTBFINV represents the two FC blocks, inverter and its switch in series:
M T B F F C I N V = 1 1 M T B F F C + 1 M T B F I N V = 29,113.78   h
The MTBF value of the two systems in parallel can be determined as follows:
M T B F F C I N V 2 = 0 R F C I N V 12   d t = 43,670.7   h
where
R F C I N V 12 = R F C I N V 1 + R F C I N V 2 R F C I N V 1 × R F C I N V 2
recalling that
R = e 1 M T B F × t
In this second case, the MTBF value has increased as expected and comes to 4.35 years. Table 7 shows schematically the state of the three switches in case of failure.
Figure 16 reports the block diagram where the fuel cell modules are divided into 10 blocks, fed by two inverters. The FCs can work in parallel or can be crossed to the inverters thanks to the bypass CB3.
The value of the total MTBF can be expressed as follows:
M T B F T o t = 1 1 M T B F F C I N V 12 + 1 M T B F F R F 1 + 1 M T B F S B B = 43529.5   h = 4.97   y e a r s
And in this case, the MTBFFCINV of a single FC module block plus its series inverter and its switch is equal to the following:
M T B F F C I N V = 1 1 M T B F 5 F C + 1 M T B F I N V + 1 M T B F C B = 34002.35   h
The MTBF value of the two systems in parallel can be determined as follows:
M T B F F C I N V 2 = 0 R F C I N V 12   d t = 51003.5   h
where
R F C I N V 12 = R F C I N V 1 + R F C I N V 2 R F C I N V 1 × R F C I N V 2
recalling that
R = e 1 M T B F × t
In this third case, the value of MTBF has increased as expected and is almost up to 5 years. With good management of parallel modules, it is possible to increase the MTBF value of the overall system from 26,515 h to 43,529.5 h. With the presence of two inverters, the power is divided. When testing one of the two inverters, one can choose to run the system at half power or run the system at full power. In case of failure when running the system at full power, the SOFC system will be oversized to compensate for the possible maintenance loss of one or more FCs. So, in order to use the “N−1 safety criterion”, it is necessary to oversize the SOFC system by twice as much power. Under ordinary conditions, it will operate at a maximum of 50% power. The largest increase in the MTBF value occurs from case 1 to 2, that is, with the introduction of a branch in parallel. From case 2 to 3, there is always an increase, but only by about 5 thousand hours.

7.3. Reliability Comparison

In the study with the generators the simple one-generator system is initially used to achieve a more real case than that involving three generators in parallel, to ensure increased redundancy, obtaining a final MTBF of 0.4 years. In the FC case study, an initial MTBF value of 3 years is chosen and, with appropriate redundancies, can be increased to as high as 5 years. Considering these two values at first reading, it would seem that the SOFC system is much more reliable than the traditional generation system. In reality, the traditional generation unit has a low MTBF value because there are many more components that make up the generation part than those that make up the innovative generation system in the FC system. The MTBF value of the FC system is only that of the stack. The MTBF values of the BoP are not available because it also consists of new technologies. From the point of view of maintenance, the traditional generation group is characterized by a greater commitment, both economically and also from the point of view of maintenance timing. Generation with the SOFC system is characterized by lower maintenance expense. The MTTR of FCs can be approximated to zero because there is rapid replacement (box type). Redundant generation systems allow failures in individual modules without causing the entire system to lose functionality and improving the general reliability as shown in Table 8. The probability of a double fault that could cause load power failure increases as the MTTR of the module increases.
The main advantages obtained with the FC system stand out from the perspective of both reliability and speed of repair. Generation with the SOFC system turns out to have significantly better characteristics on reliability (as shown in Figure 17) than the conventional generation system.

8. Conclusions

The paper reports a technical–economic analysis for a real cruise ship, with a complete feasibility study regarding the sizing of a generation system to supply 1 MW of base hotel load, comparing two power plant architectures focused on fuel cells versus diesel generators. Both electrical generation and distribution on board large cruise ships have been considered and the fuel cell technology best suited to the case study (SOFCs) has been selected. The sizing of the fuel cell system and its comparison with a conventional diesel-fueled generation system have been developed in relation to weights and volumes, costs and reliability. Particularly in terms of reliability, the FC system proves its merits. Installing one FC in each “fire zone” provides the base load with the dual advantage of optimal weight distribution. In terms of volume and weights, the two studied systems are comparable. Therefore, the FC system certainly is a feasible option. The cost-effectiveness of an SOFC system over traditional systems emerges for operating durations longer than 9 years, but only when highly competitive pricing (1500 EUR/kW) and very challenging lifetimes (70,000 h) of SOFC stack modules are considered. An advantage obtained is from the environmental point of view since the emissions associated with fuel cells are lower than those associated with conventional units. The biggest advantage is in port access and operation, thanks to the highly modular nature of fuel cell systems and their lack of rotating mechanisms. The FC system is very versatile and a similar application could be to connect them to low voltages or create small DC islands to further cut down their space and weight on board the ship. From a reliability point of view, we started from a scheme without redundancy up to an advanced scheme with redundancy. Redundancy is provided by the connection of multiple generators or through splitting the system into variable stack modules. The traditional generation group is characterized by a lower MTBF value than that of the FC system. This is related to the large number of components. The generator is characterized by stringent maintenance protocols, and due to the presence of multiple generators in parallel, continuity of operation will always be guaranteed. The components that make up the FC system can be replaced very quickly because they have no rotating parts inside them. On the other hand, from an economic point of view, the FC system based on SOFC technology still does not appear to be competitive and that is why it is not economically worthwhile. Strengths of the innovative SOFC system are in terms of energy efficiency, autonomy, reliability in overall operation and pollutant-free emissions. Except for the emergency generators that must always be present, the auxiliary generators that power on-board services could be feasibly substituted by FC generators. Future development of the technology and its adoption on board ships for hotel loads will certainly encourage further elaboration of the assessment carried out in this work towards power supply via FCs for propulsion as well. It is possible to further develop the presented study by quantifying the reduction in pollutant emissions achievable through the use of fuel cells, as well as the consequent decrease in the presence and cost of emission reduction systems onboard modern cruise or transport ships [38].
Additionally, auxiliary systems for managing high-power stacks (BoP—Balance of Plant) could be explored to reduce costs compared to current solutions, for example, by using a single compressor for multiple stacks.
An interesting extension of the study would be to evaluate the possibility of utilizing part of the heat generated by the fuel cell for LNG reforming, thereby producing hydrogen to power PEM fuel cells. These cells are better suited for variable power operation, such as during navigation, enabling the development of a hybrid propulsion system combining SOFCs, PEMs and diesel technologies.

Author Contributions

Conceptualization, A.R., S.E., M.P., R.P. and M.F.; Methodology, A.R., S.E., M.P., R.P. and S.M.; Software, S.E. and M.P.; Validation, A.R., S.E., M.P. and M.F.; Formal analysis, A.R., M.P., S.M. and M.F.; Investigation, S.E., S.M. and M.F.; Data curation, M.P., R.P. and S.M.; Writing—original draft, A.R., S.E., M.P. and M.F.; Writing—review & editing, A.R., S.E. and M.P.; Visualization, S.E.; Supervision, A.R., S.E. and R.P.; Project administration, A.R. and S.E. All authors have read and agreed to the published version of the manuscript.

Funding

This research received no external funding.

Data Availability Statement

The original contributions presented in the study are included in the article, further inquiries can be directed to the corresponding author.

Conflicts of Interest

Author Roberto Pibiri was employed by the company Carnival Corporation (United Kingdom). The remaining authors declare that the research was conducted in the absence of any commercial or financial relationships that could be construed as a potential conflict of interest.

References

  1. Coroiu, M. Energy efficiency holistic approach for new energy business model towards 2030. In Proceedings of the 8th International Conference on Modern Power Systems (MPS), Cluj-Napoca, Romania, 21–23 May 2019. [Google Scholar] [CrossRef]
  2. Campisi, D.; Mancuso, P.; Mastrodonato, S.L.; Morea, D. Efficiency assessment of knowledge intensive business services industry in Italy: Data envelopment analysis (DEA) and financial ratio analysis. Meas. Bus. Excel. 2019, 23, 484–495. [Google Scholar] [CrossRef]
  3. European Commission. Regulation of the European Parliament and of the Council; European Commission: Brussel, Belgium, 2021; pp. 1–4.
  4. van Biert, L.; Godjevac, M.; Visser, K.; Aravind, P.V. A review of fuel cell systems for maritime applications. J. Power Sources 2016, 327, 345–364. [Google Scholar] [CrossRef]
  5. Project “MARANDA”. Available online: https://projectsites.vtt.fi/sites/maranda/index.html (accessed on 15 January 2025).
  6. Project “SHIPFC” on the Use of Ammonia as a Fuel in SOFC. Available online: https://cordis.europa.eu/project/id/875156 (accessed on 25 January 2025).
  7. Project “NAUTILUS” on the Use of LNG in SOFC Hybridized with Batteries. Available online: https://nautilus-project.eu/ (accessed on 25 January 2025).
  8. Project “eShyps” the Wave of Hydrogen. Available online: https://e-shyips.com (accessed on 25 January 2025).
  9. GIIGNL. “Basic Properties of LNG,” The International Group of Liquefied Natural Gas Importers. 2019. Available online: https://giignl.org/wp-content/uploads/2021/10/giignl2019_infopapers1.pdf (accessed on 10 January 2025).
  10. Chaudhary, S.; Chauhan, Y.K. Studies and performance investigations on fuel cells. In Proceedings of the International Conference on Advances in Engineering & Technology Research (ICAETR-2014), Unnao, India, 1–2 August 2014; pp. 1–6. [Google Scholar] [CrossRef]
  11. Guaitolini, S.; Yahyaoui, I.; Fardin, J.F.; Encarnacao, L.F.; Tadeo, F. A review of fuel cell and energy cogeneration technologies. In Proceedings of the 9th International Renewable Energy Congress (IREC), Hammamet, Tunisia, 20–22 March 2018; pp. 1–6. [Google Scholar] [CrossRef]
  12. Smith, J.; Nehrir, M.; Gerez, V.; Shaw, S. A Broad Look at the Workings, Types and Applications of Fuel Cells. In Proceedings of the IEEE Conference, Chicago, IL, USA, 21–25 July 2002; pp. 70–75. [Google Scholar] [CrossRef]
  13. EMSA. Study of the Use of Fuel Cells in Shipping; EMSA: Lisbon, Portugal, 2017. [Google Scholar]
  14. Sulligoi, G.; Vicenzutti, A.; Tironi, E.; Corti, M.; Lamedica, R.; Ruvio, A.; Lipardi, G.; Piva, L. Naval smart grid: Integrated Power System for all electric naval vessels with control and reliability characteristics. In Proceedings of the 2014 AEIT Annual Conference—From Research to Industry: The Need for a More Effective Technology Transfer (AEIT), Trieste, Italy, 18–19 September 2014; pp. 1–6. [Google Scholar] [CrossRef]
  15. Bozorgmehri, S.; Hamedi, M. Modeling and optimization of anode-supported solid oxide fuel cells on cell parameters via artificial neural network and genetic algorithm. Fuel Cells 2012, 12, 11–23. [Google Scholar] [CrossRef]
  16. Aslinezhead, M.; Doremami, E.; Olamaei, J. Micro-combined heating and power generation and an economical and technical comparison of fuel cell technologies used. In Proceedings of the 17th Conference on Electrical Power Distribution (EPDC), Tehran, Iran, 2–3 May 2012; pp. 1–6, ISBN 978-1-4673-1418-3. [Google Scholar]
  17. Sarioglu, L.; Klein, O.P.; Schroder, H.; Kucukay, F. Energy Management for Fuel-Cell Hybrid Vehicles Based on Specific Fuel Consumption Due to Load Shifting. IEEE Trans. Intell. Transp. Systems. 2012, 13, 1772–17871. [Google Scholar] [CrossRef]
  18. D’Agostino, F.; Gualeni, P.; Schiapparelli, G.; Silvestro, F. Control Strateegy and Architecture for Integrating Distributed Fuel Cells on board Large Cruise Ships. In Proceedings of the 2020 International Symposium on Power Electronics, Electrical Drives, Automation and Motion (SPEEDAM), Sorrento, Italy, 24–26 June 2020; pp. 414–418. [Google Scholar] [CrossRef]
  19. Wu, Y.; Breaz, E.; Gao, F.; Paire, D.; Miraoui, A. Nonlinear Performance Degradation Prediction of Proton Exchange Membrane Fuel Cells Using Relevance Vector Machine. IEEE Trans. Energy Convers. 2016, 31, 1570–1582. [Google Scholar] [CrossRef]
  20. Haseltalab, A.; Van Biert, L.; Sapra, H.; Mestemaker, B.; Negeborn, R. Component sizing and energy management for SOFC-based ship power system. Energy Convers. Manag. 2021, 245, 114625. [Google Scholar] [CrossRef]
  21. Wu, Z.; Zhu, P.; Yao, J.; Xu, H.; Chen, B.; Yang, F.; Zhang, Z.; Porpatham, E.; Ni, M. Dynamic modeling and operation strategy of natural gas fueled SOFC-Engine hybrid power system with hydrogen addition by metal hydride. eTrasportation 2020, 5, 100074. [Google Scholar] [CrossRef]
  22. Skjong, E.; Rødskar, E.; Cabrera, M.M.M.; Johansen, T.A.; Cunningham, J. The marine vessel’s electrical power system: From its birth to present day. Proc. IEEE 2015, 103, 2410–2424. [Google Scholar] [CrossRef]
  23. D’Agostino, F.; Fidigatti, A.; Ragaini, E.; Silvestro, F. Integration of Shipboard Microgrids Within Land Distribution Networks: Employing a Ship Microgrid to Meet Critical Needs. IEEE Electrif. Mag. 2019, 7, 69–80. [Google Scholar] [CrossRef]
  24. Dumitrescu, M. Electric -power Supply Fault Tolerant Analysis for a Naval System. In Proceedings of the International Symposium on Electrical and Electronics Engineering (ISEEE), Galati, Romania, 28–30 October 2021; pp. 1–4. [Google Scholar] [CrossRef]
  25. IEC/ISO/IEEE 80005-1:2012; Artist, Utility Connections in Port-Part 1: High Voltage Shore Connection (HVSC) Systems—General Requirements; [rt]. (2006/339/EC) Edition 1.0 2012-07. 2012. Available online: https://standards.ieee.org/ieee/80005-1/5461/ (accessed on 9 December 2024).
  26. IEEE Recommended Pratice for 1kV to 35kV Medium-Voltage DC Power System on Ships. in IEEE std 1709-2018 (revision of IEEE std 1709-2010), December 2018, pp. 1–54. Available online: https://img.antpedia.com/standard/files/pdfs_ora/20230616-ieee/IEEE/Std/IEEE%20Std%201709-2018.pdf (accessed on 15 December 2024).
  27. Caprara, G.; Armas, V.; Mesquita, D.; Kermani, M.; Martirano, L. An Energy Storage System to support Cruise Ships Cold Ironing in the Port of Civitavecchia. In Proceedings of the 2021 IEEE International Conference on Environment and Electrical Engineering and 2021 IEEE Industrial and Commercial Power Systems Europe (EEEIC/I&CPS Europe), Bari, Italy, 7–10 September 2021; pp. 1–5. [Google Scholar] [CrossRef]
  28. Challamel, R.; Calmettes, T.; Gigot, N.C. A European hybrid high performance Satellite-AIS system. In Proceedings of the 2012 6th Advanced Satellite Multimedia Systems Conference (ASMS) and 12th Signal Processing for Space Communications Workshop (SPSC), Vigo, Spain, 5–7 September 2012; pp. 246–252. [Google Scholar] [CrossRef]
  29. Zeng, J.; Wang, M.; Liu, Y.; Qian, Y. Characteristics and prevention of road transport liquefied natural gas (LNG) accidents. In Proceedings of the 7th Advanced Forum on Transportation of China (AFTC 2011), Beijing, China, 22–22 October 2011; pp. 221–225. [Google Scholar] [CrossRef]
  30. Barelli, L.; Baumann, M.; Bidini, G.; Ottaviano, R.; Schneider, S.; Passerini, L. Trombetti. Reactive Metals as Energy Storage and Carrier Media: Use of Aluminum for Power Generation in Fuel Cell-Based Power Plants. Energy Technol. 2020, 8, 2000233. [Google Scholar] [CrossRef]
  31. Elia, S.; Santantonio, A. Fire Risk in MTBF Evaluation for UPS System. Adv. Electr. Electron. Eng. 2016, 14, 189–195. [Google Scholar] [CrossRef]
  32. Elia, S.; Santini, E.; Tobia, M. Comparison between Different Electrical Configurations of Emergency Diesel Generators for Redundancy and Reliability Improving. Period. Electr. Eng. Comput. Sci. 2018, 62, 144–148. [Google Scholar] [CrossRef]
  33. Boccaletti, C.; Elia, S.; Salas, M.; Pasquali, M. High reliability storage systems for genset cranking. J. Energy Storage 2020, 29, 101336. [Google Scholar] [CrossRef]
  34. D’Orazio, A.; Elia, S.; Santini, S.; Tobia, M. Succor System and Failure Indication for the Starter Batteries of Emergency Gensets. Period. Electr. Eng. Comput. Sci. 2020, 64, 412–421. [Google Scholar] [CrossRef]
  35. Rahmat, M.K.; Jovanovic, S.; Lo, L.K. Uninterruptible Power Supply (UPS) system configurations: Reliability comparison. In Proceedings of the 2010 IEEE International Conference on Power and Energy, Kuala Lumpur, Malaysia, 29 November–1 December2010; pp. 835–840. [Google Scholar] [CrossRef]
  36. Fairfax, S.; Dowling, N.; Weidknecht, P. Reliability Assessment of a Large Diesel Generator Fleet. IEEE Trans. Ind. Appl. 2020, 56, 942–951. [Google Scholar] [CrossRef]
  37. 493-2007—IEEE Recommended Practice for the Design of Reliable Industrial and Commercial Power Systems; IEEE: Piscataway, NJ, USA, 2007; ISBN 978-0-7381-5301-8. [CrossRef]
  38. Parliament, E.; Soone, J. Fuel EU Maritime—Sustainable Maritime Fuels; European Parliament: Strasbourg, France, 2022.
Figure 1. Overview representation of MV generation currently adopted (half a ship).
Energies 18 01456 g001
Figure 2. Outline representation of MT generation with implementation of FCs (half a ship).
Energies 18 01456 g002
Figure 3. Weight comparison trend between the two systems with the same LNG fuel (generators and tanks included).
Energies 18 01456 g003
Figure 4. Costs under the conditions of both systems running for 5000 h/year; initial cost of FC system is kEUR3000.
Energies 18 01456 g004
Figure 5. Costs under the conditions of both systems running for 8000 h/year; initial cost of FC system is kEUR3000.
Energies 18 01456 g005
Figure 6. Costs under the conditions of both systems running for 5000 h/year; initial cost of FC system is kEUR1500.
Energies 18 01456 g006
Figure 7. Costs under the conditions of both systems running for 8000 h/year; initial cost of FC system is kEUR1500.
Energies 18 01456 g007
Figure 8. Traditional generation system scheme.
Energies 18 01456 g008
Figure 9. Block diagram traditional generation system.
Energies 18 01456 g009
Figure 10. Traditional generation half-ship system scheme with three generators.
Energies 18 01456 g010
Figure 11. Black diagram of a complete traditional generation system.
Energies 18 01456 g011
Figure 12. DC generation system of half a ship.
Energies 18 01456 g012
Figure 13. RBD model diagram of DC generation by an FC.
Energies 18 01456 g013
Figure 14. Power generation system divided across two redundant inverters (half a ship).
Energies 18 01456 g014
Figure 15. Block diagram of generation system with generators divided across two redundant inverters (half a ship).
Energies 18 01456 g015
Figure 16. Block diagram case 3 with fuel cell module decomposition (half a ship).
Energies 18 01456 g016
Figure 17. Trend of MTBF values of the two generation systems.
Energies 18 01456 g017
Table 1. This datasheet of LNG traditional generator.
ModelEnginekVA Stand-ByEmission Standards[L/H]Length [mm]Width [mm]Height [mm]Weight
[kg]
C32 1100C321100Low Emissions243.24795169521626668
C32 1250C321250Low BSFC252.44874169521626985
C32 1400C321400Low BSFC2924551223121758099
C32 1500C321500Low BSFC3144551223121758099
3512TA140035121400Low BSFC297.85248197423679072
3512BTA 150035121500Low Emissions331.552371975234212,594
3512BTA 160035121600Low Emissions323.553581975236712,896
3512BHDTA 175035121750Low Emissions355.254692286236712,642
3512BHDTA 187535121875Low Emissions395.553952286236712,642
3516TA 200035162000Low BSFC420.963292286241016,670
3516BTA 225035162250Low Emissions495.1637322862494155,535
3516BHDTA 250035162500Low Emissions542.7637322862494155,535
3516CHDTA 275035162750Low Emissions57275422569309619,750
Table 2. Summary of weights associated with the two systems.
Tank
VolumeWeightVolumeWeight
[m3][t][m3/h][kg/h]
Generator2412.50.33129.23
FC + Accessories33220.28120.54
Table 3. Economic/cost comparison between the two systems with the same LNG fuel.
Fuel CellTraditional
Initial cost[kEUR]1500/3000400
LNG price[EUR/kg]0.80.8
Hourly consumption of LNG[L/h]287331.5
[kg/h]120.54139.23
Hourly consumption[EUR/h]96.432111.384
Annual hours[h]5000–80005000–8000
MaintenanceFuel cellTraditional
Annual maintenance[EUR/year]30,000\
Maintenance 5 years[EUR/5years]\150,000
Maintenance every 40,000–70,000 h[EUR]450,000\
Table 4. Payback times for investment/operating costs of the fuel cell system.
Initial
Cost [kEUR]
Stack Replacement
[h]
Maintenance
[h/year]
Years
[y]
300040,0005000>40
300070,0005000>40
300040,0008000>40
300070,000800022
150040,000500030
150070,000500019
150040,000800024
150070,00080009
Table 5. Average MTBF for components in a circuit to ensure absolute continuity [33].
ComponentSymbolMTBF [h]
Circuit breakerCB229,991
UPS systemUPS72,574
Control unitCU750,000
Fire-related risk factorFRF438,000
InverterINV50,000
Switchgear busbarSBB923,068
Stack of FCsFC100,000
Table 6. MTBF and MTTR values of a traditional generation group.
AuxiliaryGenerator
Failures (per unit year)3.94.3
MTBF [h]2233.51997
MTTR [h]2.96.4
Table 7. Summary of the status of the 3 switches in the case of a failed component.
Failed ComponentCB1CB2CB3Energy Provided by
FC1OPENCLOSEDOPEN100% FC2
FC2CLOSEDOPENOPEN100% FC1
INV1OPENCLOSEDCLOSED50% FC1 + 50% FC2 (INV1 sized on 100% of the ship power)
INV2CLOSEDOPENCLOSED50% FC1 + 50% FC2 (INV2 sized on 100% of the ship power)
Table 8. MTBF values of two generation systems.
MTBF [h]
[h]Years
1 Generator19970.22
2 Generators27020.3
3 Generators35210.4
1 FC26,5153.02
2 FCs38,073.34.35
3 FCs43,5294.97
Disclaimer/Publisher’s Note: The statements, opinions and data contained in all publications are solely those of the individual author(s) and contributor(s) and not of MDPI and/or the editor(s). MDPI and/or the editor(s) disclaim responsibility for any injury to people or property resulting from any ideas, methods, instructions or products referred to in the content.

