Article

The Impact of Green Finance and Renewable Energy Development on the Low-Carbon Transition of the Marine Industry: Evidence from Coastal Provinces and Cities in China

1
School of Economics, Ocean University of China, Qingdao 266100, China
2
Institute of Marine Development, Ocean University of China, Qingdao 266100, China
*
Author to whom correspondence should be addressed.
Energies 2025, 18(6), 1464; https://doi.org/10.3390/en18061464
Submission received: 13 February 2025 / Revised: 6 March 2025 / Accepted: 14 March 2025 / Published: 17 March 2025
(This article belongs to the Section C: Energy Economics and Policy)

Abstract

:
The marine industry’s low-carbon transition is critical to enhancing industrial competitiveness. This study empirically investigates how green finance, renewable energy development, and their synergistic effects influence the marine industry’s low-carbon transition, utilizing data from 11 Chinese coastal provinces and cities from 2006 to 2022 and employing fixed effects, moderating effects, and panel quantile regression models. The findings reveal the following: (1) Green finance and renewable energy development can promote the marine industry’s low-carbon transition. (2) Green finance and renewable energy development exhibit positive synergistic effects in driving the marine industry’s low-carbon transition. (3) Regression results across various stages of the marine industry’s low-carbon transition reveal that the influence of green finance and the synergistic effects intensify over time, whereas the effect of renewable energy development gradually weakens. (4) The heterogeneity results indicate that the influence of green finance and the synergistic effects on the marine industry’s low-carbon transition are more pronounced in the northern and eastern marine economic zones, while the impact of renewable energy development and the synergistic effects are stronger in provinces with moderate economic development levels. This study enriches the theoretical system of the low-carbon economy, expands the scope of application of green finance and renewable energy, provides scientific basis and policy recommendations for China to promote the green development of the marine economy under the goal of “dual carbon”, and provides practical experience for reference to countries for addressing climate change and promoting the low-carbon transition of the marine industry.

1. Introduction

According to available information, the rampant use of fossil fuels and carbon emissions has exacerbated global warming, highlighting the urgent need to optimize energy structures, reduce emissions, and promote low-carbon economic growth [1]. The marine industry, which includes aquaculture, maritime transportation, and tourism, is essential for worldwide economic growth. However, traditional marine activities—including overfishing, fuel consumption in transportation, and offshore oil and gas extraction—contribute significantly to carbon emissions and ecological degradation [2]. Advancing the marine industry’s low-carbon transition is thus imperative for both mitigating climate change and preserving marine ecosystems. Furthermore, this transition is crucial for enhancing the industry’s competitiveness and ensuring its sustainable development [3].
In recent years, green finance has grown rapidly as an essential means to further an economy’s low-carbon transition. It refers to financial activities and policies aimed at supporting environmental protection, energy-saving efforts, and projects involving renewable energy. Investing in environmentally sustainable and low-carbon industries is the main purpose of green finance, thereby lowering carbon emissions and preserving biodiversity. It provides long-term, stable financing for low-carbon projects, reduces financing costs, and strengthens market confidence [4]. On a global scale, institutions like the World Bank, along with countries and regions such as China and the European Union, have promoted green finance innovation in order to propel the market’s growth [5].
Renewable energy growth is instrumental in facilitating the economy’s shift toward low-carbon development. Renewable energy sources provide key benefits such as energy security, environmental sustainability, and long-term resource utilization [6]. By lowering greenhouse gas emissions and revolutionizing the energy industry, renewable energy significantly influences industrial structure and low-carbon economic development. With technological advancements and declining costs, renewable energy is gradually making up a larger share of the global energy mix. Simultaneously, its role in displacing non-renewable energy sources is becoming more pronounced, as evidenced by its growing contribution to total energy consumption.
Building on this foundation, this study examines the following questions: First, can green finance and renewable energy development drive the marine industry’s low-carbon transition? Second, do these two factors exhibit synergistic effects in advancing the marine industry’s low-carbon transition? Third, how do the average and marginal effects of these two factors and their interaction term influence the marine industry’s low-carbon transition at different stages of this transition? Fourth, how do the influences of these two factors and their interaction term on the marine industry’s low-carbon transition differ across various marine economic zones and economic development scales? Addressing these research questions expands the application of green finance theory, enriches the theoretical framework on the interaction between renewable energy and sustainable development, and provides a scientific foundation for advancing the marine industry’s low-carbon transition. This study adopts the panel data of 11 coastal provinces and cities in China from 2006 to 2022 and firstly constructs a fixed effects model to investigate the impact of green finance and renewable energy development on the low-carbon transition of the marine industry. Secondly, through the moderating effects model, it investigates the impact of synergistic effects of green finance and renewable energy development on the low-carbon transition of the marine industry. Then, through panel quantile regression, the average and marginal impacts of green finance and renewable energy development on the low-carbon transformation of the marine industry are investigated. This study provides a scientific basis and policy recommendations for China to promote the green development of the marine economy under the “dual-carbon” goal and provides practical experience for other countries to respond to climate change and promote the low-carbon transformation of the marine industry.
Currently, numerous scholars have explored the relationships between finance, energy, and industrial structure. However, research on the marine industry’s low-carbon transition is still in its early stages. Few studies have examined green finance, renewable energy development, and the marine industry’s low-carbon transition within a unified framework, nor have they considered the dynamic changes and evolutionary characteristics of finance and energy under different stages of the low-carbon transition.
Therefore, the innovative aspects of this study are as follows: First, it creatively establishes an evaluation indicator system for the low-carbon transition of the marine industry across four dimensions—industrial structure adjustment, greening transition, innovation, and efficiency—selecting 18 key indicators to gauge the level of low-carbon transition in 11 Chinese coastal provinces and cities. Second, this study pioneers the examination of green finance, renewable energy development, and the low-carbon transition of the marine industry within a unified framework, exploring the average and marginal effects of green finance and renewable energy development across different stages of the marine industry’s low-carbon transition. Third, the findings provide empirical evidence for improving China’s green finance system, optimizing the energy structure, promoting renewable energy development, and advancing the marine industry’s low-carbon transition. They also offer policy insights for addressing environmental pollution and achieving dual-carbon goals, with important theoretical and practical implications.
The remaining sections are arranged as follows: the literature review and research hypotheses are covered in Section 2, followed by the indicator construction and analysis in Section 3, the methodology in Section 4, the results in Section 5, and conclusions and policy recommendations in the final section.

2. Theoretical Hypotheses and Literature Review

2.1. The Construction of an Evaluation Indicator System for the Low-Carbon Transition of the Marine Industry

The recent literature increasingly emphasizes the marine industry’s low-carbon transition, highlighting the construction of an effective evaluation indicator system as the central issue. The development of such an index system must take into account economic, social, and environmental factors, while also considering the unique characteristics of the marine industry [7]. Industrial structural upgrading involves the rational allocation of internal resources, with changes in production structure altering the distribution of factors such as technology, labor, and capital, thereby improving efficiency [8]. Some scholars suggest that industrial upgrading includes both the advancement and rationalization of the structure [9]. Xu and Zhang developed an evaluation system aimed at optimizing industrial upgrading from the perspectives of rationalization, efficiency, and advancement. This framework supports the rational allocation of resources, boosts policy effectiveness, and enhances industrial competitiveness [10].
Globally, many scholars who have focused on green development, efficient utilization, technological innovation, and industrial restructuring when studying the marine industry have pointed out that Europe and the Atlantic Ocean were promoting the expansion of the marine industry into deeper waters through the technological improvement, efficiency enhancement, and sustainable management of marine resources in response to the “blue economy” strategy [11]. DeVoe identified technological innovation, ecological optimization, and industry restructuring as the key factors driving the US aquaculture industry and helping it to become a high-growth industry in the 21st century [12]. In the last decade, the European marine industry has made significant progress in AMS (Autonomous Marine Monitoring System) technological innovation, which not only improves the accuracy and efficiency of marine environmental monitoring, but also promotes the widespread application of intelligent and automated technologies in marine resource management, ecological protection, and sustainable development [13]. On the other hand, the United States relies on offshore wind power (OWD) technology and environmental governance measures to reduce carbon dioxide emissions and respond to climate change [14]. Empirical studies have shown that the marine industry in the United Kingdom exhibits outstanding potential in providing employment opportunities, and at the same time, with the rapid development of offshore wind energy, the structure of the marine industry in the United Kingdom is strategically transforming toward low-carbon energy [15]. The restructuring of the marine industry, such as optimizing the ratio of fisheries and marine industry and marine services, has helped to unleash the full potential of Indonesia’s marine industry [16]. At the same time, some scholars are also concerned about the problem of marine pollution, particularly the increase in marine litter caused by human factors. They are of the view that promoting the greening and restructuring of the marine industry is crucial to achieving sustainable development [17]. In addition, the North Sea region has established a systematic framework for the protection of the marine environment aimed at minimizing the damage caused by oil spills to the marine ecosystem. The region is actively promoting the green transformation of the marine industry and is gradually reducing the risk of oil pollution by increasing the proportion of clean energy used and promoting environmentally friendly shipping technologies [18].
Regarding China’s marine industry structure, Li argued that China’s marine economic policies significantly impact this structure, which has transitioned to a tertiary–secondary–primary structure [19]. Fully utilizing marine resources and building a modern maritime power are strategic choices for China [20]. Guided by marine economic policies, the industry structure has progressively advanced and become more rationalized. Consequently, building an evaluation system for the marine industry’s low-carbon transition is essential. According to some academics, innovation is what is primarily responsible for the upgrading and transition of the marine industry. Innovation fosters emerging industries, making the marine industry structure more efficient and greener [21]. Thus, a framework for the organizational transition and upgrading of the marine industry is constructed using the dimensions of driving force, industrial structure, and overall efficiency [22]. Ming et al. developed a green growth evaluation indicator system for China, with indicators covering environmental investment, energy efficiency, energy saving and emission mitigation, natural resources, and environmental quality [23]. Zhou et al. utilized the concept of industrial ecologicalization to develop an indicator system that evaluates urban industrial ecologicalization across five dimensions: resources, innovation, emission reduction, efficiency, and economy [24]. The evaluation framework for the ecologicalization of the marine industry typically involves the transformation of industrial structure, production methods, and technology [25]. Thus, promoting marine ecological protection and advancing marine technological innovation are essential components of the low-carbon transition evaluation indicator system [26].

2.2. The Driving Role and Evolutionary Characteristics of Green Finance and Renewable Energy Development

2.2.1. The Impact of Green Finance on the Low-Carbon Transition of the Marine Industry

The financial system impacts the real economy in two main ways: first, by providing diverse financing channels to the real sector, such as bank loans, bonds, and equity issuance, which facilitate the expansion of industrial sectors, and second, by improving the efficiency of capital allocation, directing resources through pricing mechanisms to more efficient sectors, thereby enhancing productivity. Green finance encompasses financial activities aimed at supporting environmental protection, energy conservation, green technology innovation, and climate change adaptation. The theory of externalities is one of the core theories of economics, which was systematically put forward by Arthur Pigou in his classic work The Economics of Welfare to explain the external impacts of economic activities that are not fully reflected in the market mechanism. From the perspective of economics, green finance plays an important role in the internalization of externalities, and it makes up for market failures by directing funds to sustainable development projects through mechanisms such as environmental performance assessment, green bonds, and green credit. In addition, green finance is also able to convert environmental and social impacts into financial costs or benefits through market-based means, promoting the accelerated low-carbon transformation of the marine industry [27].
Through green finance policies and financial instruments, capital is directed toward environmental protection projects, while gradually withdrawing from high-pollution industries, helping to alleviate China’s overly heavy industrial structure. The interplay between industrial structures and green finance has been widely explored in the existing research. The marine industry occupies an important position in the Irish economy, involving not only traditional industries such as fisheries and shipping, but also being closely linked to modern industries such as insurance, banking, and computer technology, and financial support plays a key role in promoting the development of the marine industry [28]. Alvarado-Ramírez et al. believed that by strengthening the green financial system, more sustainable sources of funding can be provided to the marine industry to support the development of marine renewable energy, environmental protection technology, and sustainable fisheries [29]. At the same time, optimizing the structure of the marine industry and improving the efficiency of resource utilization would help to enhance the competitiveness of the industry and reduce carbon emissions, thereby achieving high-quality, low-carbon, and sustainable development of the marine economy [30]. Shen suggested that green finance can increase the percentage of the tertiary industry within the industrial structure, reduce energy intensity, and thus promote the structural upgrading of industries [31]. Zhang et al. argued that green finance drives industrial upgrading by reducing carbon emissions, while also exhibiting spatial spillover effects that facilitate the optimization and enhancement of industrial structures in neighboring provinces [32]. He found that green finance and fintech demonstrate synergistic effects in promoting industrial structural upgrading and that fintech fosters progress in environmentally sustainable finance, expands coverage, and accelerates industrial structure optimization [33]. Xu and Lin argued that green finance positively influences urban carbon reduction through technological progress and industrial restructuring [34]. Liu and Yang believed that financial support promotes the growth of the marine economy and optimizes the marine industry structure through mechanisms such as industrial formation, industry–finance integration, and capital guidance [35]. Xu and Liu argued that China’s marine industry structure can undergo a green revolution thanks to carbon finance, a subset of green finance [36]. Thus, the hypothesis below is presented.
Hypothesis 1. 
Green finance promotes the low-carbon transition of the marine industry.

2.2.2. The Impact of Renewable Energy Development on the Low-Carbon Transition of the Marine Industry

Energy is a key input in production, and its efficiency improvements have significant impacts on driving economic growth. Theoretically, differences in energy use efficiency between industries can lead to the reallocation of energy across sectors, facilitating the optimal allocation of resources and driving economic development [37]. Energy is not only a fundamental material foundation for economic and social development but also a primary source of carbon emissions [38]. The theory of energy economics is a discipline that studies the interaction between energy and economic systems, focusing on how the development, distribution, and utilization of energy resources affect economic growth, social well-being, and environmental protection. The theory points out that traditional energy consumption patterns rely on fossil energy sources, causing significant environmental pollution and climate change problems. Therefore, energy economics emphasizes the introduction of renewable energy sources to achieve low-carbon development. Through this theory, the key role played by renewable energy development in the process of decarbonization of the marine industry can be revealed more systematically, and a theoretical basis and practical guidance can be provided for the achievement of the coordinated development of energy economy and ecological environment [39].
As renewable energy rules are established worldwide and the use of renewable energy becomes more popular, the reach of renewable energy initiatives has broadened. Coal and other conventional fossil fuels can be partially replaced by renewable energy, gradually reducing the economy’s dependence on highly polluting coal and consequently lowering carbon emissions [40].
Based on this, many scholars have explored how renewable energy affects industrial structure and carbon emissions. Scotland is supporting the development of the marine energy industry through a strong focus on renewable energy generation. By increasing the efficiency and share of renewable energy utilization in the marine energy sector, Scotland has contributed to the green transformation of the marine industry [41]. In Indonesia, marine renewable energy has significant strategic potential. Its development would not only contribute to the target of increasing the share of renewable energy in the national energy mix but also provide equitably accessible clean energy throughout the archipelago, thereby reducing carbon emissions and optimizing the structure of the marine industry [42]. In addition, it is believed that coastal cities can utilize marine renewable energy (MRE) to support their electricity supply. In Mexico, the low-carbon transformation of the marine industry would be further accelerated as technology would continue to advance, with positive impacts [43]. Zhou and Chen performed a study using relational analysis and Granger causality theory for examining the evolution of the energy consumption framework and industrial structure adjustment, and they found that changes in energy consumption patterns are often accompanied by shifts in industrial structure [44]. Chang et al. argued that China’s renewable energy has substantial growth potential [45]. Zhu et al. found that there is a short- and medium-term inverse correlation between renewable energy utilization and carbon emissions, and that this link becomes stronger over time [46]. Yu et al. found that China’s declining energy intensity is the main factor for its declining carbon intensity, with an increased growth of renewable energy sources, further lowering carbon emissions [47]. Su and Fan believed that advancements in advanced renewable energy technology would improve the way traditional companies used energy, slash energy prices, cut carbon emissions, and facilitate industrial upgrading and transformation [48]. Therefore, the hypothesis below is presented.
Hypothesis 2. 
Renewable energy development promotes the low-carbon transition of the marine industry.

2.2.3. Synergistic Effects of Green Finance and Renewable Energy Development on the Low-Carbon Transition of the Marine Industry

The application of sustainable development theory in the study of green finance and the low-carbon transition of the marine industry emphasizes the synergistic effects of the economy, society, and the environment. In the process of low-carbon transformation of the marine industry, green finance can provide long-term financial support and reduce the economic threshold of renewable energy technology innovation and promotion, while the application of renewable energy can reduce the carbon footprint of the marine economy, thus achieving the sustainable development of the industry. For example, the financing of green bonds can support projects such as offshore wind power, wave energy, tidal energy, etc., which can not only produce economic returns but also reduce marine carbon emissions while promoting green jobs in coastal areas. All these data show that green finance and renewable energy are complementary in the process of eco-modernization, and together, they can promote the transformation of the marine industry in a low-carbon direction [49].
Freeman et al. believed that financial support was critical to advancing the development of marine renewable energy in the United States, which would not only help to combat climate change but also optimize the structure of the marine industry, thereby creating an economic advantage [50]. Lange et al. noted that marine energy was becoming increasingly important in the future energy mix of many countries. Taking Ireland as an example, the country can promote the development and utilization of the marine energy industry by deepening the dynamic mechanisms of the energy and environmental systems, as well as optimizing the governance system, combining these factors with strong financial support [51]. At the same time, the authors of [52] believed that marine energy will play a key role in Europe’s long-term energy system. Increasing the investment in research and development and the innovation in the marine power industry will not only enhance the competitiveness of the marine industry but also effectively reduce its carbon emissions and contribute to a low-carbon transition [52]. Khan et al. discovered that progress in financial systems enhances renewable energy adoption, helping to mitigate carbon emissions [53]. Ma and Huang found that financial development positively influences renewable energy, primarily by enhancing technological innovation and easing indirect financing constraints within the renewable energy sector [54]. Xiao and Zhang discovered a threshold effect in the way that financial development affects the correlation between carbon emissions and the integration of renewable energy [55]. Consuming renewable energy raises carbon emissions at lower financial development levels, while it lowers carbon emissions at intermediate or high financial development levels. This effect becomes stronger as financial development increases. Hou et al. suggested that the development of renewable energy is positively influenced by green financing, and the additional gain of green finance grows as renewable energy development advances [56]. Lee et al. discovered that through financial support, market liberalization, and economic stimulation, green finance greatly encourages the progress of renewable energy [57]. Zheng et al. argued that green finance encourages breakthroughs in renewable energy [58]. Ge et al. discovered that the influence of innovations in renewable energy technologies on industrial structure can be mitigated via green finance [59]. Improving green financial assistance for the progress of renewable energy technologies can influence changes in industrial structure. Therefore, the hypothesis below is presented.
Hypothesis 3. 
Green finance and renewable energy development exhibit positive synergistic effects in promoting the low-carbon transition of the marine industry.

2.3. The Phased Evolutionary Characteristics of Green Finance and Renewable Energy Development

Three phases can be used to generally categorize China’s green finance development: the nascent, growth, and maturity phases. In the nascent period, industries predominantly operated under high carbon-emission traditional models, resulting in severe pollution, and green finance had limited impacts on the marine industry’s low-carbon transition. During the growth period, financial institutions implemented strict credit controls on projects misaligned with industrial policy or detrimental to the environment, consequently increasing the impact of green finance over time. In the maturity period, the government established a green finance framework and outlined priorities for green industry development, enhancing society’s capacity to address climate change. Green finance effectively drives the marine industry toward low-carbon development [60].
A switch from fossil fuels to cleaner energy sources will be required due to the depletion of energy reserves and the amplification of greenhouse gas release. In the initial stages of renewable energy development, projects were often located in areas with the most favorable geographic conditions, leading to a higher rate of substitution of renewable energy for traditional energy, positively contributing to the marine industry’s low-carbon transition. However, with the advancement of industrialization and urbanization, fossil fuel extraction and consumption rates have greatly surpassed those of renewable energy, leading to a decreasing rate of replacement. Consequently, promoting the marine industry’s low-carbon transition increasingly relies on alternative approaches [61].
The marine industry’s low-carbon transition is shaped by a range of factors, including resources, technology, and economic conditions. To increase the efficiency of the low-carbon transition, it is essential to leverage energy, finance, and other low-carbon pathways at various stages [62]. Compared to renewable energy, green finance has a broader application scope. It not only supports renewable energy development but also contributes to market innovation, clean technological progress, and energy conservation and environmental protection. As the levels of the marine industry’s low-carbon transition rise, the impact of green finance may exceed that of renewable energy development. Consequently, the synergistic effect between the two shows an increasing trend. Considering this, the hypothesis below is presented.
Hypothesis 4. 
As the level of the low-carbon transition in the marine industry increases, the influence of green finance and the synergistic effects gradually strengthen, while the impact of renewable energy development gradually weakens.

3. Indicator Construction and Analysis

3.1. Explanation of Indicator Selection

By examining the marine industry’s current situation and the connection between industrial structure and carbon reduction, we selected 18 indicators across four dimensions to construct an indicator system. This system was applied to evaluate the low-carbon transition of the marine industry in 11 Chinese coastal provinces and cities from 2006 to 2022, ensuring that the industry reduces carbon emissions while maintaining economic vitality and sustainable development.
The evaluation indicator system for the low-carbon transition of the marine industry is structured into three levels: the target level; the criterion level, encompassing four dimensions—structural adjustment, green transition, innovation, and efficiency; and the indicator level, consisting of the 18 specific indicators selected for these dimensions. First, structural adjustment determines the efficiency of resource allocation and the direction of industrial upgrading. Second, green transition is directly related to environmental pollution and energy consumption. Third, innovation is the core driving force to promote low-carbon transformation, and scientific research institutions and research topics reflect the support of talents and financial inputs to green technology R&D. Finally, efficiency emphasizes the intensive use of resources and the agglomeration effect to improve production efficiency. Taken together, the system can scientifically assess the progress of low-carbon transformation of the marine industry and provide a theoretical basis for policy formulation and industrial upgrading. This structure is illustrated below in Table 1.

3.2. Entropy-Weighted TOPSIS Method

This study adopts the entropy-weighted TOPSIS method to conduct a comprehensive evaluation of the low-carbon transformation of the marine industry. Because the entropy-weighted method can avoid the bias of subjective assignment, while the TOPSIS method is based on the relative proximity of ideal and negative ideal solutions for ranking, it can effectively measure the comprehensive performance of low-carbon transformation of the marine industry in each region or period and highlight the advantageous regions. In addition, this method can deal with multi-indicator and multi-dimensional data at the same time, which are suitable for the complex indicator system involved in this study. The steps of this method are as follows:
Step 1: according to the index weights determined using the entropy approach, the weighted matrix R for each evaluation indicator of the marine industry’s low-carbon transition should be constructed.
R = w j × Y i j m × n
w j represents the weight calculated using the entropy-weighted method, Y i j represents the standardized value, i i = 1,2 , 3 , , m represents the provinces and cities, j j = 1,2 , 3 , , m represents measurement indicators, m represents the number of provinces and cities, and n represents the number of measurement indices.
Step 2: determination of the positive ideal solutions Q j + and negative ideal solutions Q j .
Q j + = ( m a x r i 1 , m a x r i 2 , , m a x r i m ) Q j = ( m i n r i 1 , m i n r i 2 , , m i n r i m )
Step 3: calculation of the distance measures for the positive ideal solutions Q j + and negative ideal solutions Q j .
d i + = j = 1 m   Q j + r i j 2 d i = j = 1 m   Q j r i j 2
Step 4: calculation of the relative closeness to ideal solutions C i .
C i = d i d i + + d i
The relative closeness coefficients ( C i ) of each option are used for the ranking of these options; the greater the C i value, the better the option. According to this article, a greater C i value denotes a higher degree of low-carbon transition in province i’s marine industry.

3.3. Spatial–Temporal Difference Analysis of the Low-Carbon Transition Levels in the Marine Industry of Coastal Provinces and Cities

Using the entropy-weighted TOPSIS method, we calculated the marine industry’s low-carbon transition levels. Based on these levels, we categorized the 11 coastal provinces and cities into four groups—low (0–25%), lower–middle (25–50%), upper–middle (50–75%), and high (75–100%) levels—to conduct spatial–temporal difference analysis.

3.3.1. Temporal Difference Analysis

(1) Using MATLAB R2024a, this study generated a 3D kernel density plot of the marine industry’s low-carbon transition across 11 Chinese coastal provinces and cities from 2006 to 2022, as shown in Figure 1.
As shown in Figure 1, on the one hand, regarding distribution position, the kernel density curve of the marine industry’s low-carbon transition shifts to the right over time, indicating an overall upward trend in transition levels. On the other hand, the curve exhibits a multi-peak pattern, with peak heights initially increasing, then decreasing, and rising again, while peak widths become narrow, and the distribution curve extends with a pronounced tail in the right. This suggests a multi-level differentiation trend in low-carbon transition levels, revealing that the transition is neither uniform nor synchronous, but instead shaped by multiple influencing factors, resulting in varied levels of development.
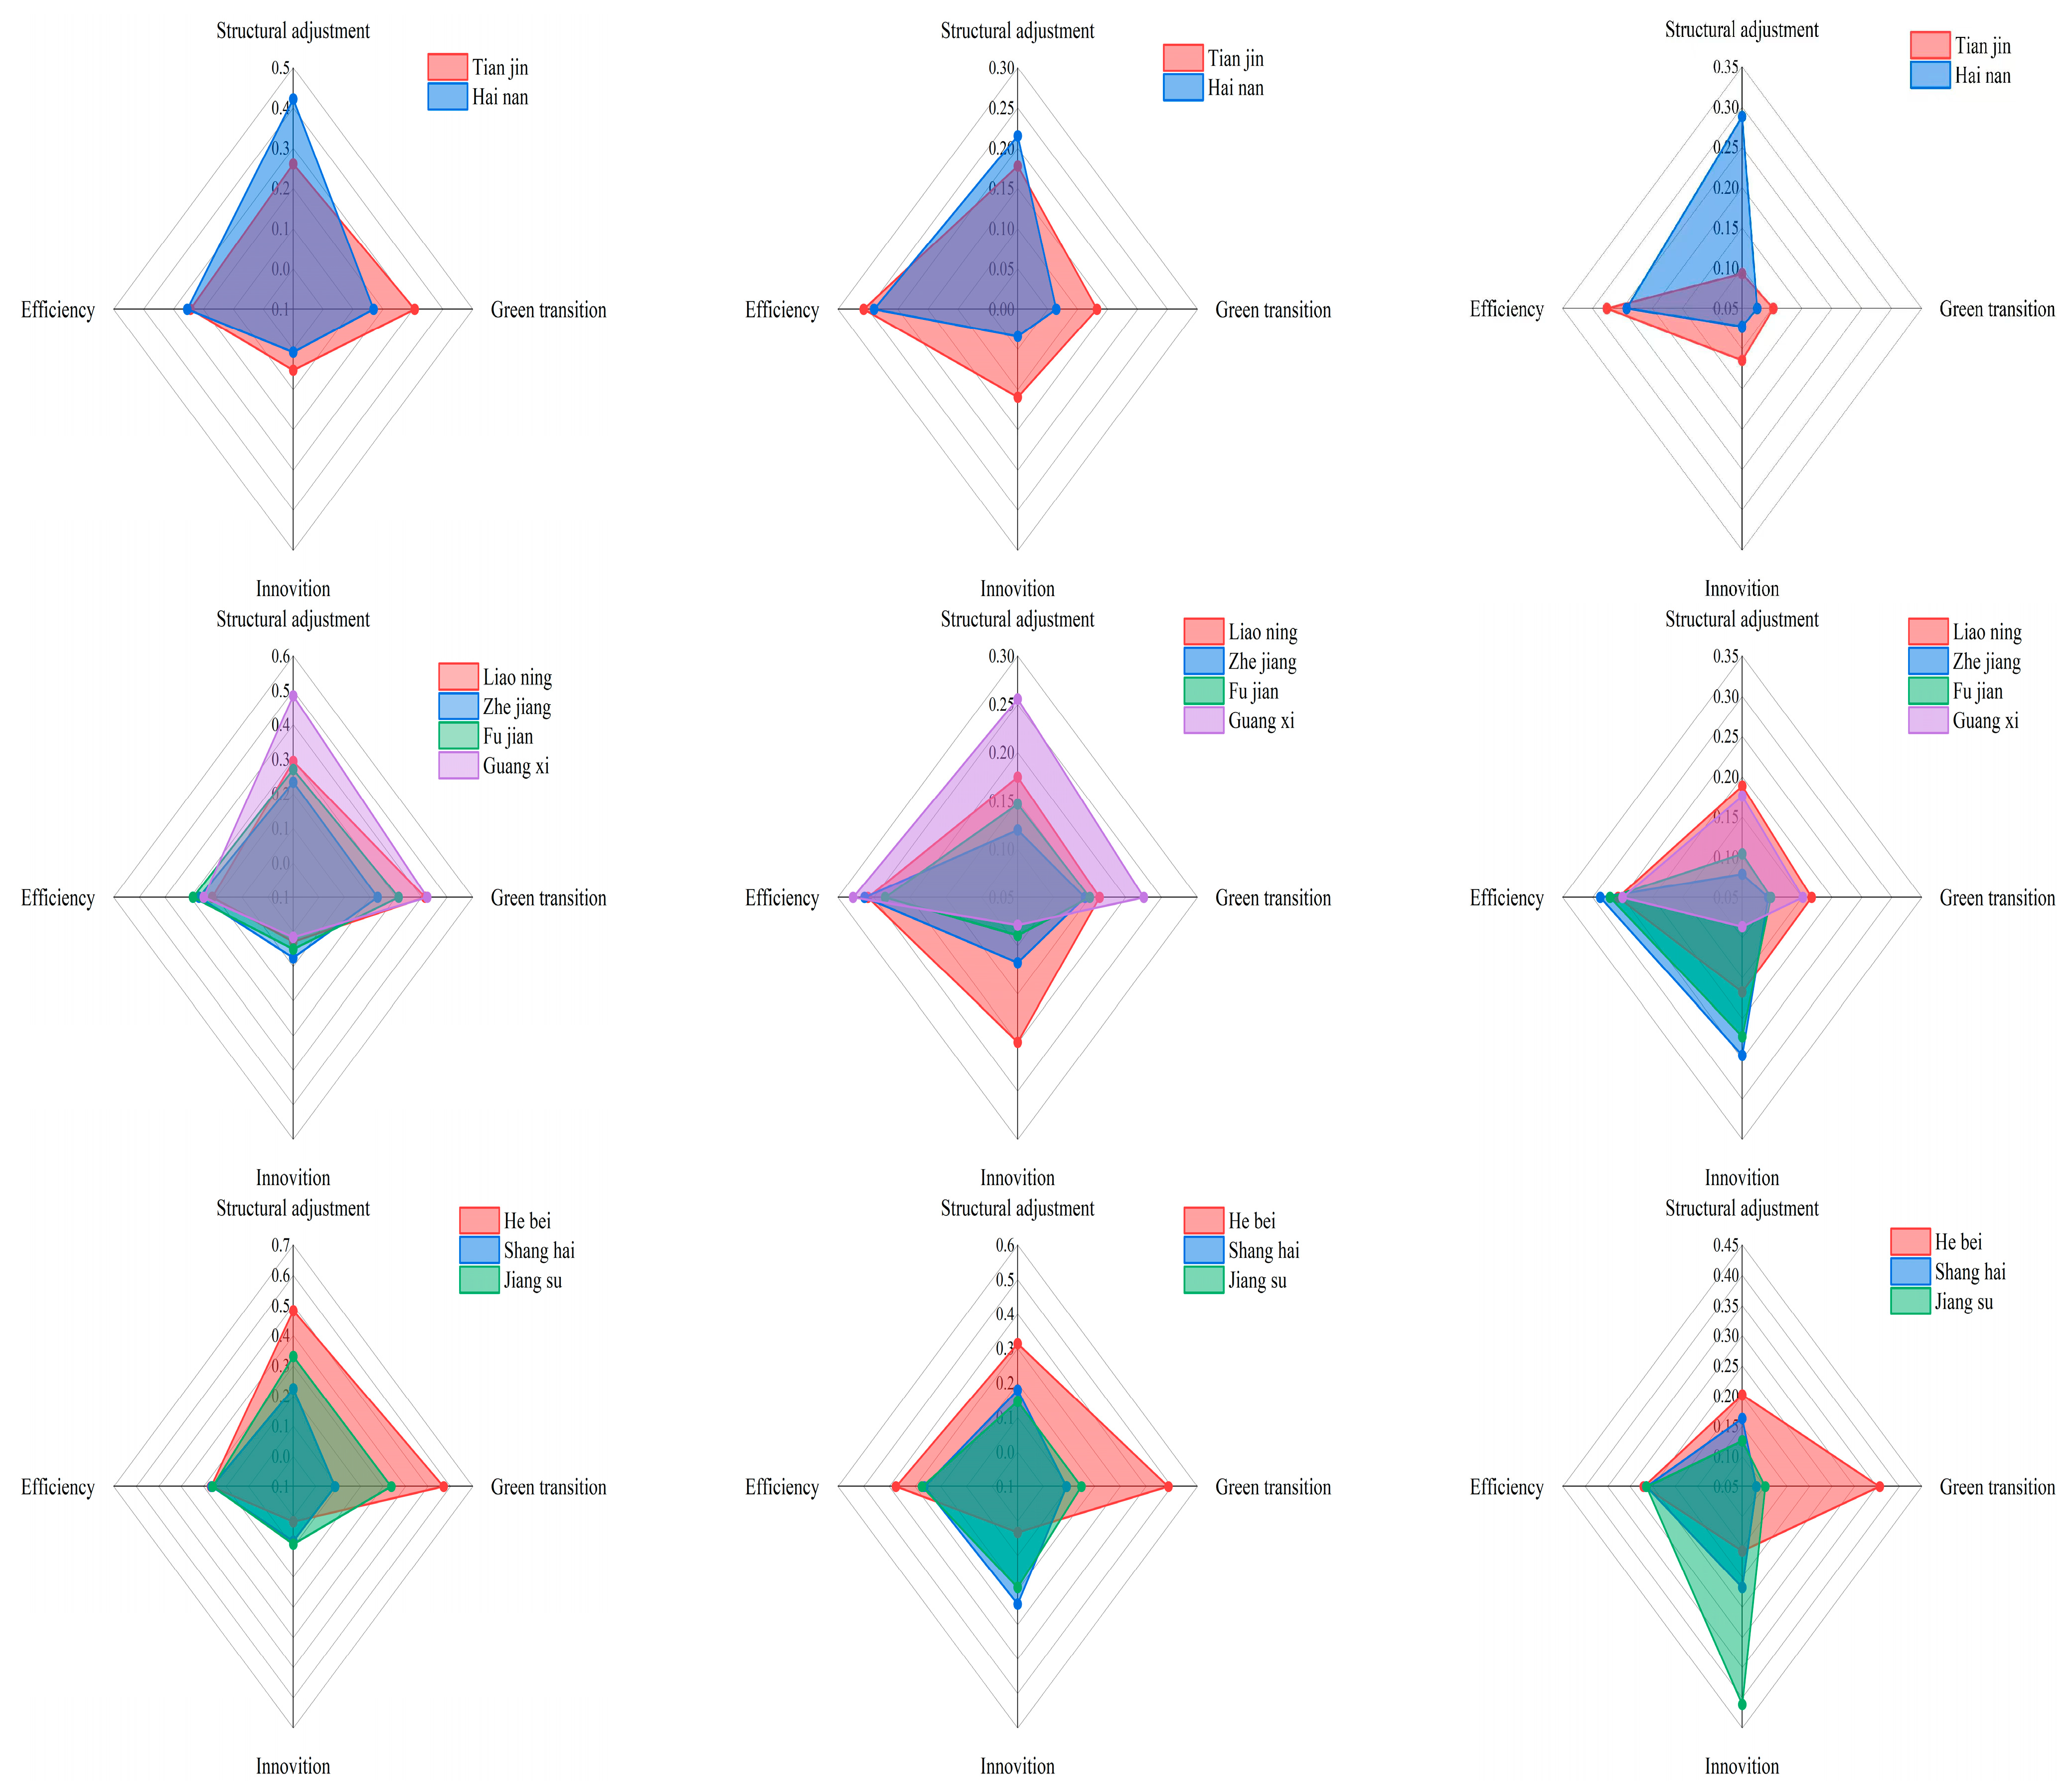
(2) To further examine the evolution of coastal provinces and cities across the four dimensions, 2006, 2015, and 2022 were selected as representative years in this study. This choice is based on the fact that 2006 was the first year that the statistical concept of gross marine product was formally proposed in China, marking the starting point of the marine economic data system. In 2015, the statistical caliber of the various marine industries was gradually improved, which provided higher-quality data support for the study. The year 2022 is the most recent year for which data are available for this study, and it can reflect the development trend in recent years. Radar charts for each dimension were generated using Origin software to conduct a temporal analysis for each province and city, as shown in Figure 2.
As shown in Figure 2, the levels of structural adjustment of the marine industry have declined across all coastal provinces and cities. Regarding the green transition of marine industry, Hebei has maintained a stable level of green transition, while Shanghai has shown improved levels, and other provinces have exhibited declined levels. In terms of efficiency in the marine industry, Tianjin, Hainan, Hebei, and Jiangsu have sustained stable levels of green transition, whereas other provinces have shown improved levels. Regarding innovation in the marine industry, Tianjin, Hainan, and Hebei have stable levels of innovation, while other provinces have shown increased levels. Therefore, it can be observed that, over time, the evolution trends across different dimensions vary among coastal provinces and cities.

3.3.2. Spatial Difference Analysis

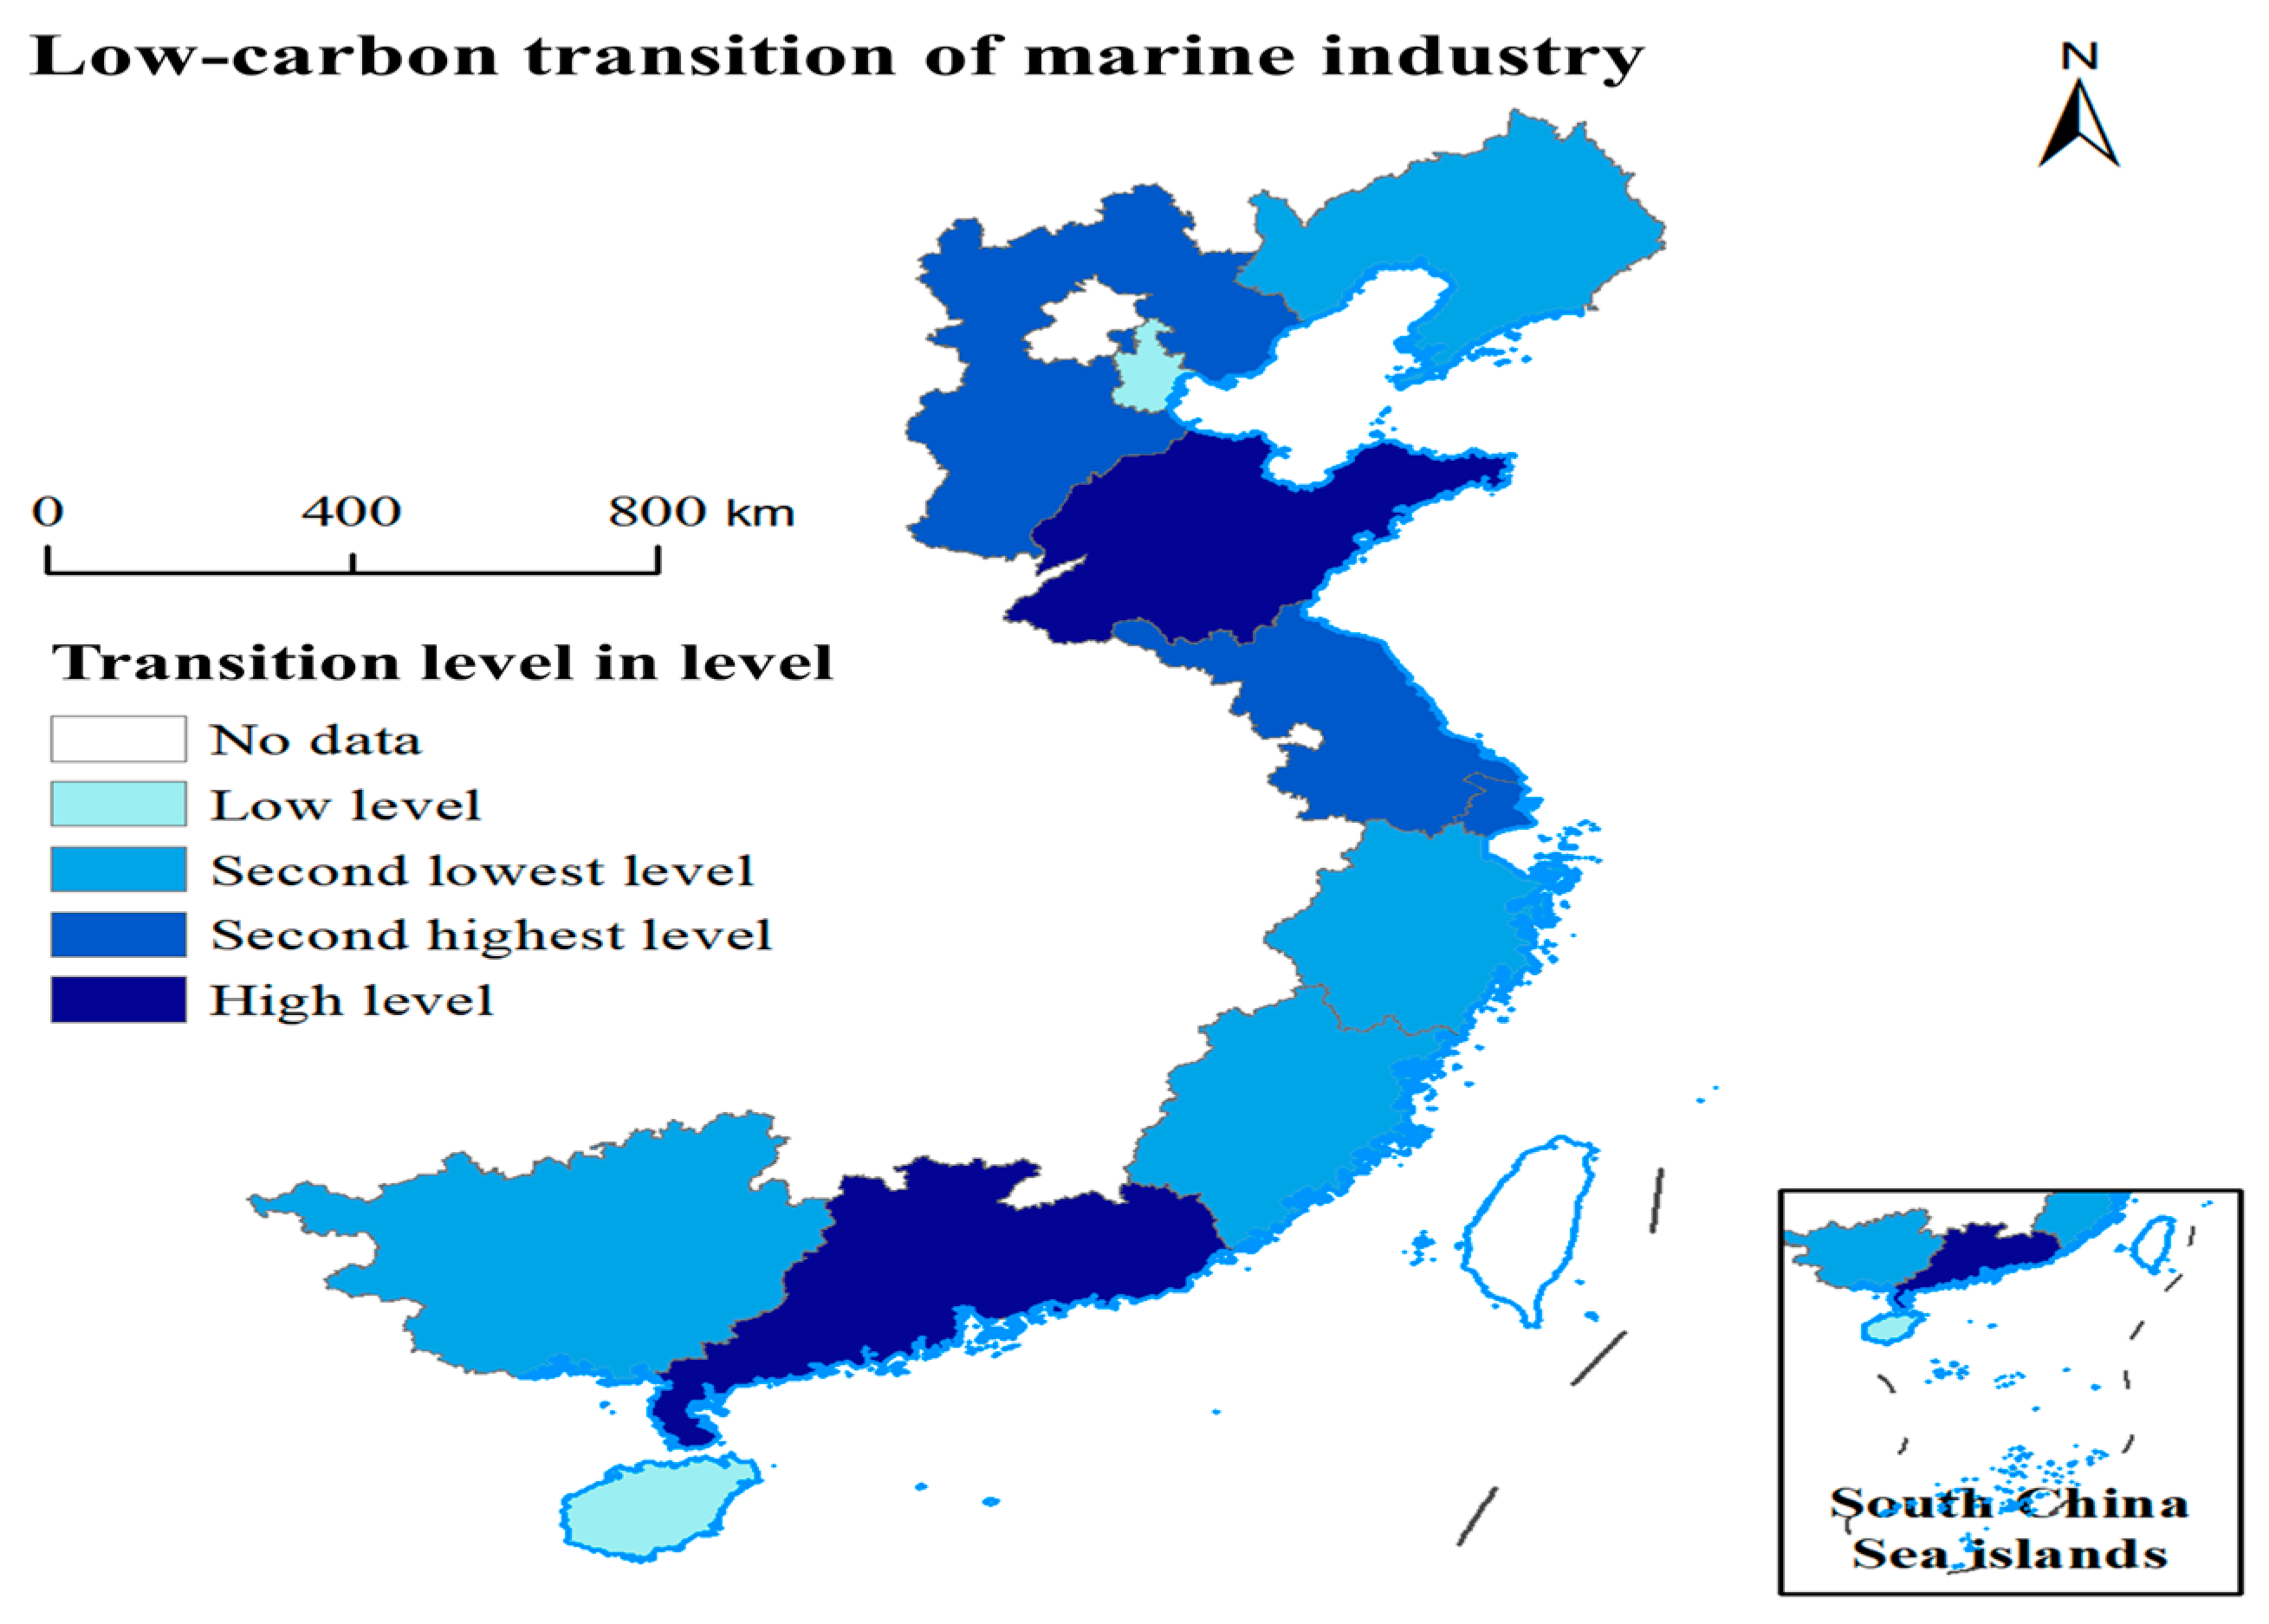
(1) This study created a geographical distribution map using ArcGIS 10.7 software to better examine the spatial evolution features of the low-carbon transition levels of the marine industry throughout China’s coastal provinces and cities. As seen in Figure 3, the color gradient, which ranges from light to dark, depicts the progress of low-carbon transition levels from low to high.
As observed in Figure 3, the low-carbon transition levels of the marine industry in Hainan and Tianjin remained generally low from 2006 to 2022. Guangxi, Fujian, Zhejiang, and Liaoning were at a sub-low level, while Hebei, Jiangsu, and Shanghai maintained sub-high levels. Shandong and Guangdong consistently exhibited high levels overall. As a result, the marine industry’s low-carbon transition levels in the eastern marine economic zone’s provinces and cities often stay high, whilst those in the southern and northern marine economic zones are more evenly distributed.
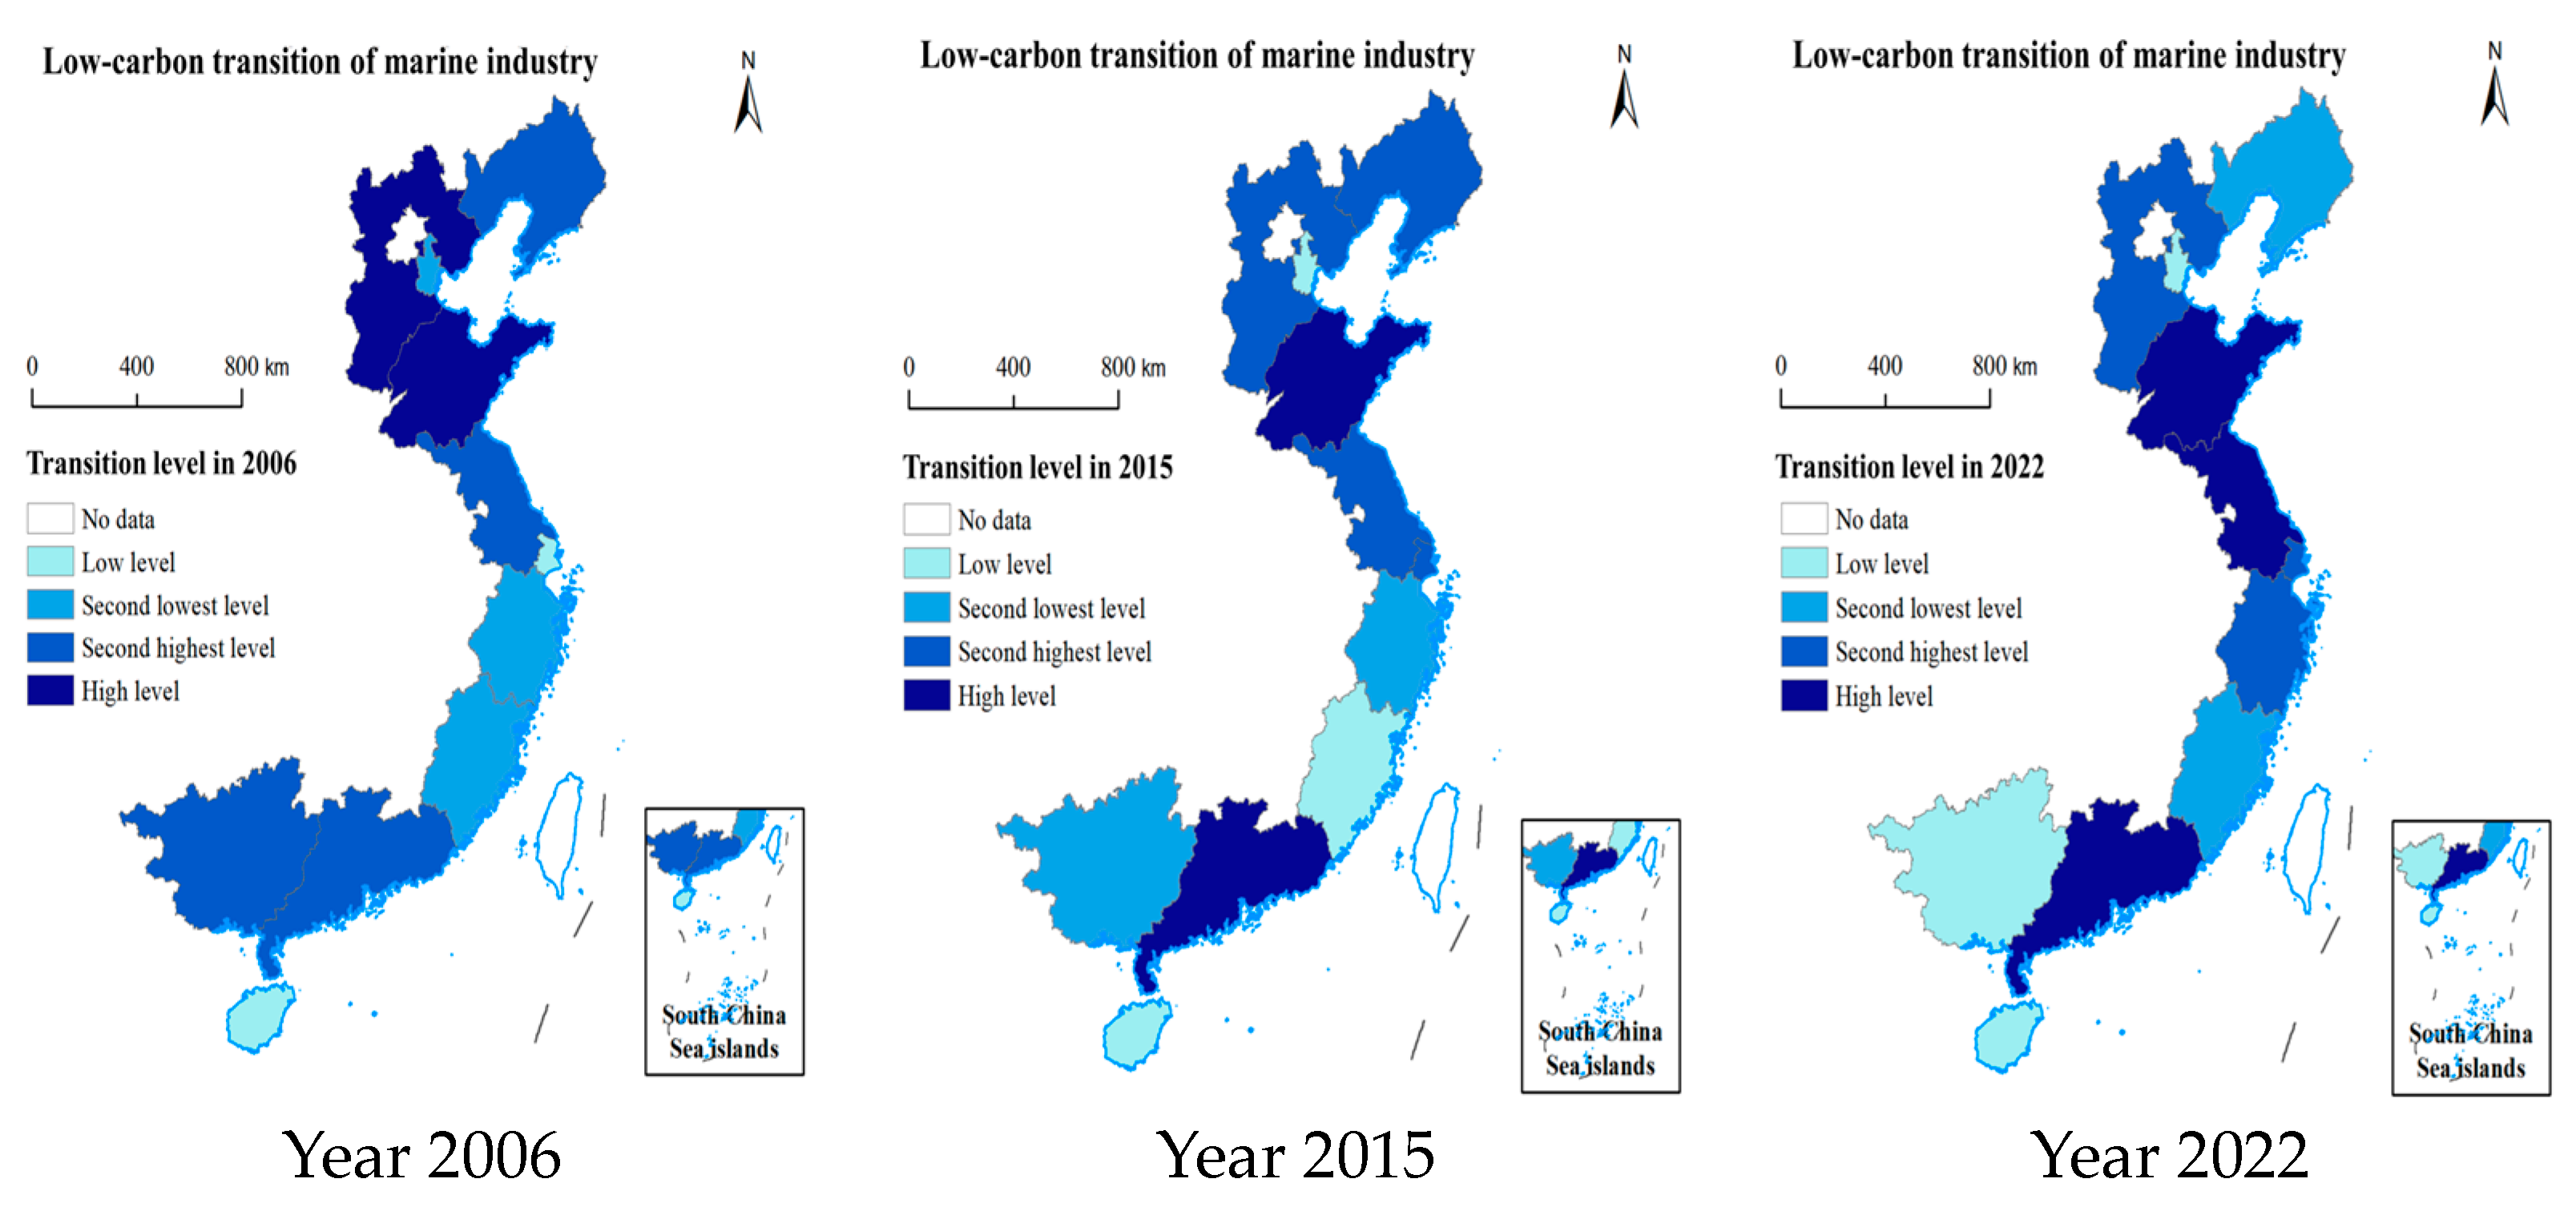
(2) To better observe the spatial pattern changes in the marine industry’s low-carbon transition levels across China’s coastal provinces and cities, this study selected spatial distribution maps for the years 2006, 2015, and 2022, as shown in Figure 4.
As shown in Figure 4, Hainan has consistently remained at a low level of low-carbon transition, while Shandong has consistently stayed at a high level. Guangdong and Jiangsu progressed from sub-high to high levels, and these levels remained stable. Zhejiang and Shanghai moved from sub-low and low levels to sub-high levels, maintaining stability. In contrast, Hebei and Liaoning declined from high and sub-high levels to low and sub-low levels, respectively, and these levels remained stable. Fujian dropped from a sub-low level to a low level before rising back to a sub-low level, while Guangxi and Tianjin experienced a continuous decline, showing low levels, and these levels have remained stable. Therefore, it can be observed that the primary trend is an increase in the low-carbon transition levels of the marine industry in provinces and cities within the eastern and southern marine economic zones, while a declining trend is evident in the northern zone.

4. Method and Data

4.1. Data Sources

This study employs a sample of 11 Chinese coastal provinces and cities from 2006 to 2022. The data are sourced from China Statistical Yearbook, China Ocean Statistical Yearbook, China Environmental Statistical Yearbook, China Energy Statistical Yearbook, China Industrial Statistical Yearbook, China Insurance Statistical Yearbook, China Rural Statistical Yearbook, provincial statistical yearbooks, the Economy Prediction System (EPS) database, and the Wind database. Missing data for some indicators were supplemented using interpolation methods. The indicators involved in this study have strong smoothness, and the interpolation method is used to fill in a small number of missing values during the data preprocessing process, which is able to maintain the temporal integrity of the sample data without affecting the overall trend of the data. Therefore, interpolation has a limited impact on the final results of this paper and does not significantly change the statistical characteristics of the variables.

4.2. Model Construction

4.2.1. Fixed Effects Model

To analyze the influence of green finance and renewable energy development on the low-carbon transition of the marine industry, this study constructs a two-way fixed effects model for analysis. The specific model setup is shown in (5):
M D i , t = β 0 + β 1 G F i , t + β 2 R E i , t + k   β k C o n t r o l k , i , t + μ i + γ t + ε i , t
where subscript i denotes the province, t represents the time, and k represents the number of control variables. GF, RE, and MD represent the level of green finance, renewable energy development, and the low-carbon transition of the marine industry, respectively. Control denotes the control variables, μ represents the province fixed effects, γ represents the time fixed effects, and ε denotes the error term. According to the above theoretical analysis, if the coefficients β 1 for G F and β 2 for R E are positive, then Hypotheses 1 and 2 are confirmed.

4.2.2. Moderating Effects Model

To further examine synergistic effects between GF and RE, an interaction term between GF and RE is incorporated into (5), resulting in the following model (6):
M D i , t = β 0 + β 1 G F i , t + β 2 G F i , t × R E i , t + β 3 R E i , t + k   β k C o n t r o l k , i , t + μ i + γ t + ε i , t
where G F × R E represents the interaction term between GF and RE. If the coefficient β2 is positive, Hypothesis 3 is confirmed.

4.2.3. Panel Quantile Regression Model

Furthermore, this study investigates the evolutionary features of the effects of GF, RE, and GF*RE on MD using the panel quantile regression method [63]. However, in traditional panel quantile models, fixed effects decompose the random disturbance term into multiple components, which complicates the interpretation of estimates across different quantiles. Powell proposed a non-additive fixed effects panel quantile regression model (QRPD), which provides more accurate coefficient estimates and more robust results [64]. The QRPD is constructed using five quantiles (20%, 40%, 60%, 80%, and 100%), as shown in (7):
Q M D i , t = σ 1 τ G F i , t + σ 2 τ G F i , t × R E i , t + σ 3 τ R E i , t + ( τ ) X i , t
where τ represents the respective quantile, and Q M D and X represent MD and a set of control variables at the respective quantiles. The influence of the independent variable on the dependent variable at a certain quantile is described by the regression coefficient at that quantile rather than under the condition of controlling for other variables.

4.3. Variable Selection

4.3.1. Dependent Variable

Based on the low-carbon transition indicator system for the marine industry constructed above, this study uses the low-carbon transition level of marine industry (MD) calculated through the entropy-weighted TOPSIS method as the dependent variable.

4.3.2. Independent Variable

Following the green finance indicator system set by Li and Xia, the independent variable green finance (GF) is categorized into five dimensions: green credit, green securities, green investment, green insurance, and carbon finance [65]. These five dimensions are combined into a comprehensive green finance development indicator using the entropy method [66], as shown in Table 2.
Renewable energy development (RE) is measured using the “renewable energy consumption ratio”, and the ratio of the energy consumption from renewable sources to the total energy consumption is used to calculate the renewable energy consumption ratio [67]. The renewable energy consumption ratio in each province excludes nuclear power and is based on the proportion of primary electricity.

4.3.3. Control Variables

The control variables include urbanization level (UB), openness to foreign trade level (OP), technology market development level (TH), industrialization level (ID), and labor force level (LR) [68,69]. Specifically, the ratio of the urban percentage to the overall population is used to calculate UB. The percentage of total goods imports and exports to regional GDP, adjusted for the USD-to-CNY exchange rate, is known as OP. The technology market turnover to regional GDP ratio is used to calculate TH. The natural logarithm of the number of employees is used to calculate LR, and the ratio of industrial added value to regional GDP is used to calculate ID.

4.4. Descriptive Statistical Analysis of the Sample Data

As shown in Table 3, the standard deviation of low-carbon transition levels in the marine industry (MD) across China’s coastal provinces was 0.123, with a mean of 0.262, indicating a noticeable disparity in the low-carbon transition levels among the coastal provinces. The standard deviation and mean of green finance development (GF) were 0.022 and 0.006, respectively, while those of renewable energy development (RE) were 0.263 and 0.062, indicating imbalances in the development of GF and RE across China’s coastal provinces, with significant room for improvement.

5. Results and Discussion

5.1. Baseline Regression Results

This study employs panel data to experimentally examine the average influence of GF and RE on MD in accordance with the research hypotheses and the model (5), as shown in Table 4. All empirical analyses in this study were conducted using Stata 17.0.
As shown in Table 4, MD is significantly improved by GF and RE. The results in column (3) show that the average effect of GF on MD is 0.591, meaning that for every 1% increase in the level of GF, MD increases by 0.591%. Similarly, the average effect of RE on MD is 0.077, indicating that for every 1% increase in RE, MD rises by 0.077%. These findings confirm that both GF and RE promote MD, validating Hypotheses 1 and 2. The above results may stem from the multiple mechanisms of GF’s role in MD. GF provides stable financial support for low-carbon technology investment and green infrastructure construction, reduces the cost of enterprise financing, and enhances its green development capability through capital supply, policy guidance, and spillover effects of technological innovation, thus accelerating industrial upgrading and low-carbon transformation. In contrast, RE mainly optimizes the energy structure and reduces the cost of clean energy and policy incentives to enhance the utilization rate of clean energy in the marine industry and reduce its dependence on fossil energy, thus promoting MD.
Regarding control variables, urbanization and labor levels have significant positive effects on MD, while openness to trade and technology market development shows a negative effect, contrary to expectations. This might be because the technology introduced during the low-carbon transition may not fully align with local conditions, particularly in terms of the environment, resources, and industrial structure mismatches, leading to suboptimal low-carbon transition outcomes. Furthermore, an increased openness to trade is often accompanied by an influx of foreign capital and enterprises into the marine industry. If foreign investments are concentrated in high-carbon sectors, such as traditional energy or heavy industry, they may hinder the low-carbon transition process [70].

5.2. Synergistic Effect Regression Results

Based on the research hypotheses and model (6), this study empirically tests the synergistic effects of GF and RE on MD, as shown in Table 5.
The results in the third column of Table 5 show that the coefficient of GF*RE is 0.229. This indicates that the synergistic effects of GF and RE contribute to the promotion of MD. In other words, the effective allocation and guidance of financial resources can promote RE. Through green bonds, green credit, and equity investments, GF can provide funding for renewable energy projects, reduce financing costs, and encourage more companies and projects to invest in renewable energy research, production, and application, thereby enhancing renewable energy’s contribution to MD. Accordingly, Hypothesis 3 is confirmed [71].

5.3. Robustness Tests

The main techniques used in this study’s robustness tests to confirm the validity of the empirical findings are replacing the core independent variable, the dependent variable, and the control variables and resolving endogeneity concerns.
First, to refine the elimination of measurement discrepancy indicators GF and RE in the baseline regression results, this study reconstructs the indicator GF using the entropy method, incorporating green credit, green investment, green insurance, green securities, green funds, and green stocks as sub-indicators. RE is measured based on the “renewable energy consumption” [72].
Second, MD is measured using the aforementioned entropy-weighted TOPSIS method. Here, the indicator is measured using the principal component analysis (PCA) method as an alternative.
Third, new control variables include government intervention (GI), social consumption level (SC), environmental regulation (ER), and R&D intensity (RD) [73].
Fourth, this study uses a one-period lag of the independent variable to examine the endogeneity of the empirical results. Due to the construction cycle of renewable energy projects and the delayed impact of green finance often influenced by policy, these factors cause capital investment to have a delayed effect rather than being fully effective in the same year. Thus, the influence of GF and RE on MD is subject to a time lag. To mitigate the interference of other contemporaneous factors, the independent variable lags by one period in this study, as shown in Table 6.
As shown in Table 6, gf, re, and gf*re represent the substituted GF, RE, and GF*RE, respectively, while md denotes the substituted MD. The coefficient of the interaction term is derived from Equation (6), while the remaining coefficients are derived from Equation (5).
From the second column of Table 6, it is evident that the substituted variables gf, re, and gf*re all exert positive influences on MD, with coefficients of 0.519, 0.246, and 0.101, respectively. The results in the third column indicate that the independent variables GF, RE, and GF*RE all exert positive influences on md, with coefficients of 0.141, 0.192, and 0.812, respectively. The results in the fourth column demonstrate that the coefficients for GF, RE, and GF*RE are 0.882, 0.090, and 0.252, respectively. The endogeneity test results in the fifth column show that the coefficients of gf, re, and gf*re are 0.513, 0.430, and 0.390, respectively, all of which are significantly positive.
The above analysis reveals that, across different methods, GF and RE both contribute to advancing MD, demonstrating a synergistic effect. Therefore, the empirical results presented above are robust and reliable, indicating that the conclusions of this study possess broad applicability and feasibility.

5.4. Further Analysis

5.4.1. The Impact of Green Finance and Renewable Energy Development on the Low-Carbon Transition of the Marine Industry at Different Transition Levels

(1) Average effects at different MD: This section further explores the average effects of GF and RE on MD. This study classifies coastal provinces and cities based on MD, dividing them into the following four groups for grouped regression analysis: the low-level group (0–25%), sub-low-level group (25–50%), sub-high-level group (50–75%), and high-level group (75–100%). Based on the above classification, this study employs models (5) and (6) to examine the respective impacts of GF, RE, and GF*RE on MD in these regions. Table 7 displays the regression results.
As shown in Table 7, columns (2), (3), (4), and (5), both GF and RE have positive impacts on MD at different transition levels. The coefficients for GF in the low, sub-low, sub-high, and high-level groups are 0.361, 0.580, 0.782, and 1.835, respectively, while the coefficients for RE in the corresponding groups are 0.984, 0.782, 0.201, and 0.155. The coefficients for GF*RE are 0.185, 0.152, 0.372, and 0.704. These results indicate that regardless of regions, both GF and RE contribute to promoting MD, demonstrating synergistic effects.
Notably, as MD increases, the impact of GF strengthens, while the impact of RE weakens, and the synergistic effect intensifies. The possible reason is that in the early stages of MD, RE primarily addresses funding challenges, helping to initiate low-carbon projects. At this stage, the marine industry may rely on RE, and the combination of GF and RE may not reach its full potential due to incomplete infrastructure and technology. However, as the transition progresses, GF gradually establishes a comprehensive financial support system, providing crucial funding for renewable energy projects, thereby leading to the broader application and dissemination of renewable energy technologies. Businesses and industrial chains move beyond solely relying on renewable energy and shift toward more diversified low-carbon development paths. Therefore, Hypotheses 1, 2, and 3 are further validated [74].
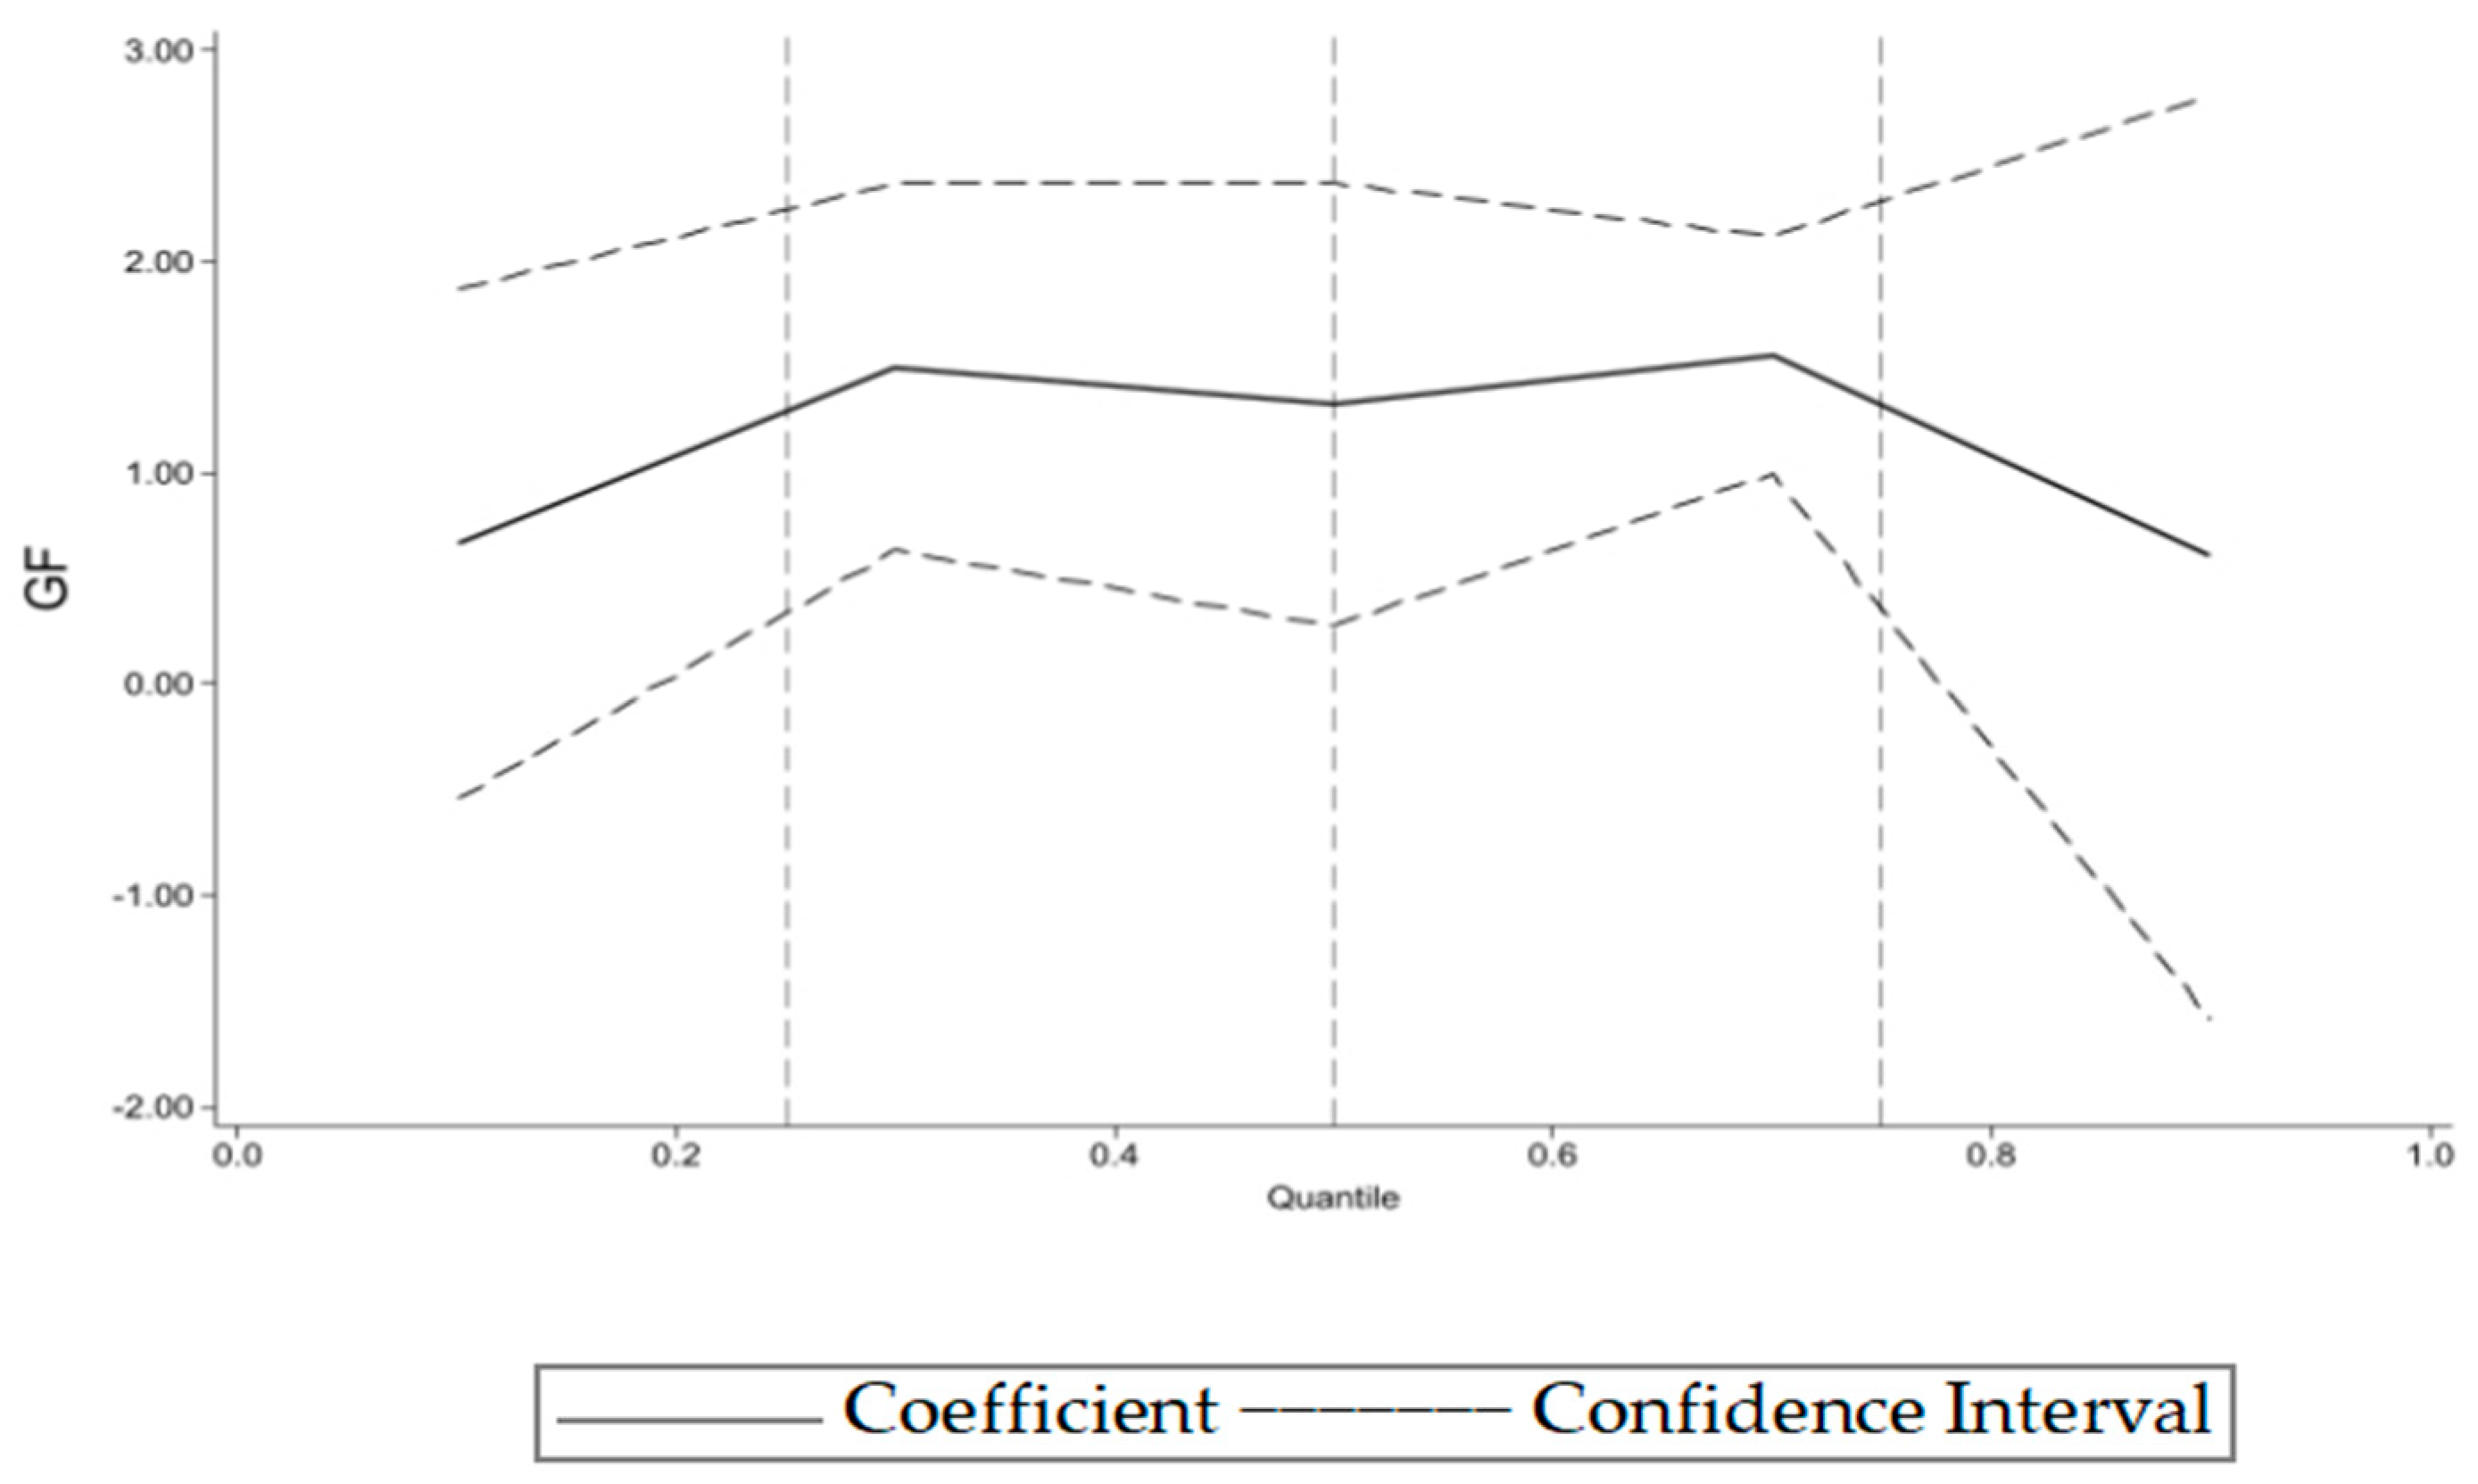
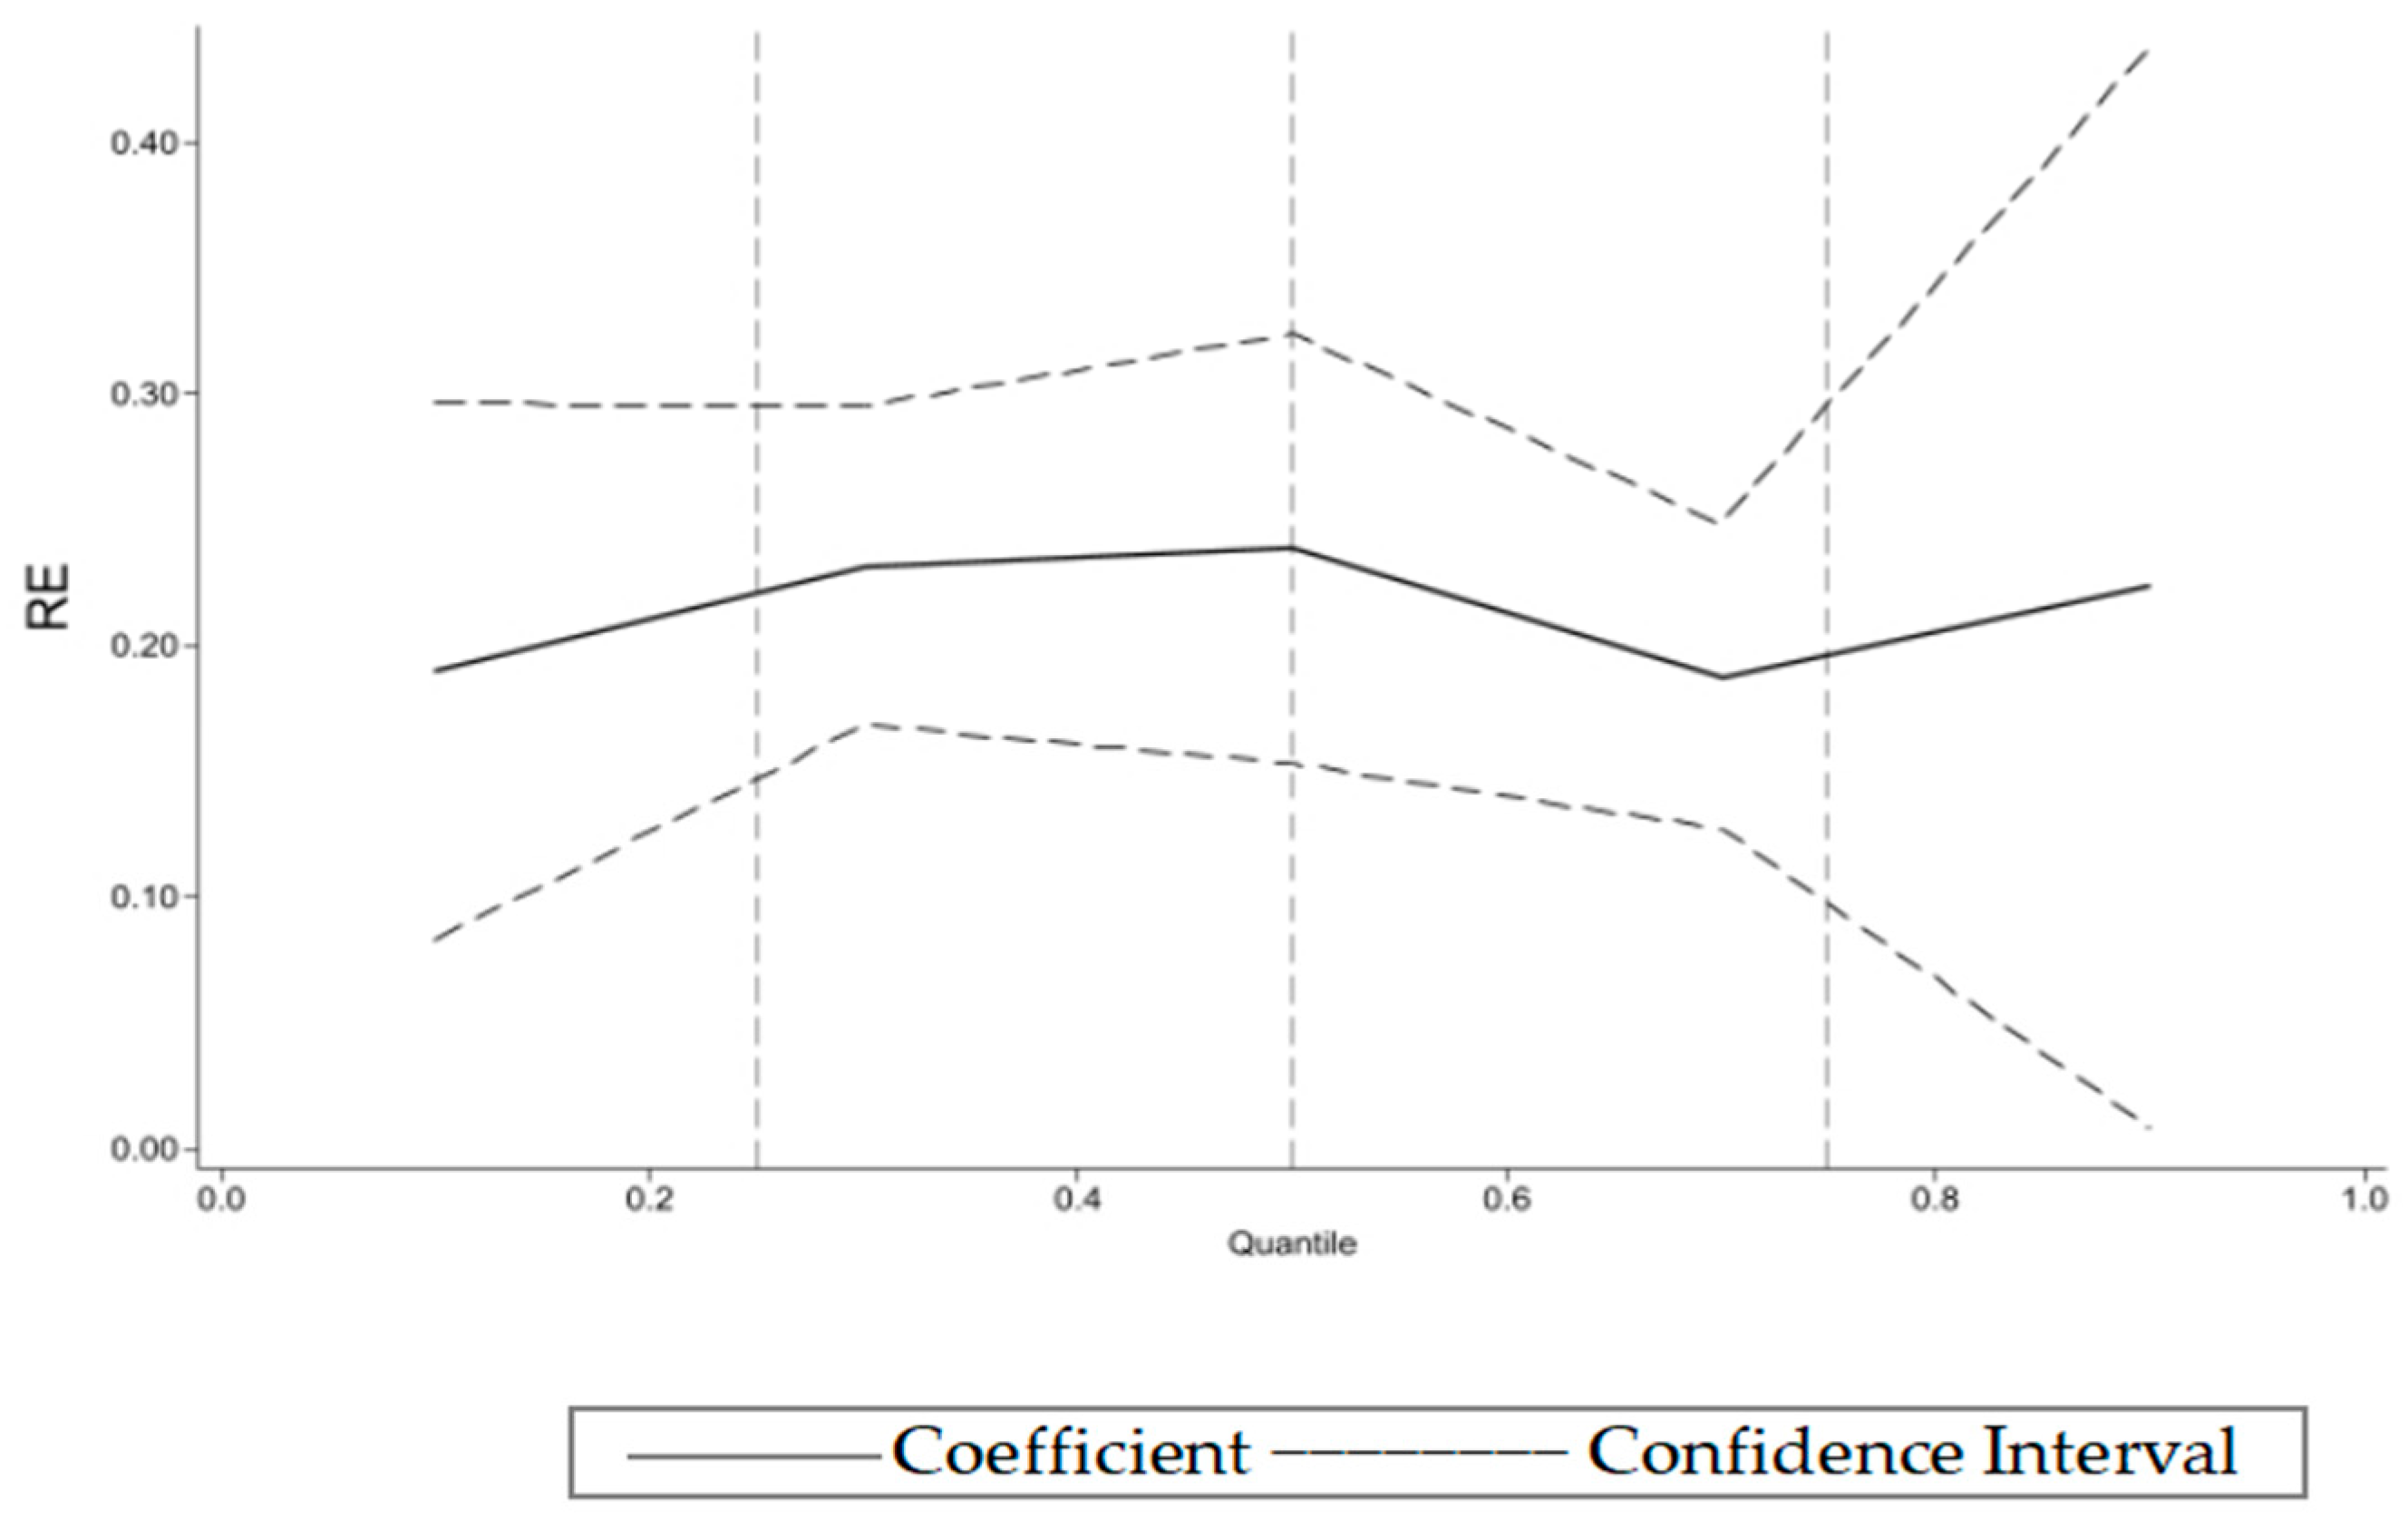
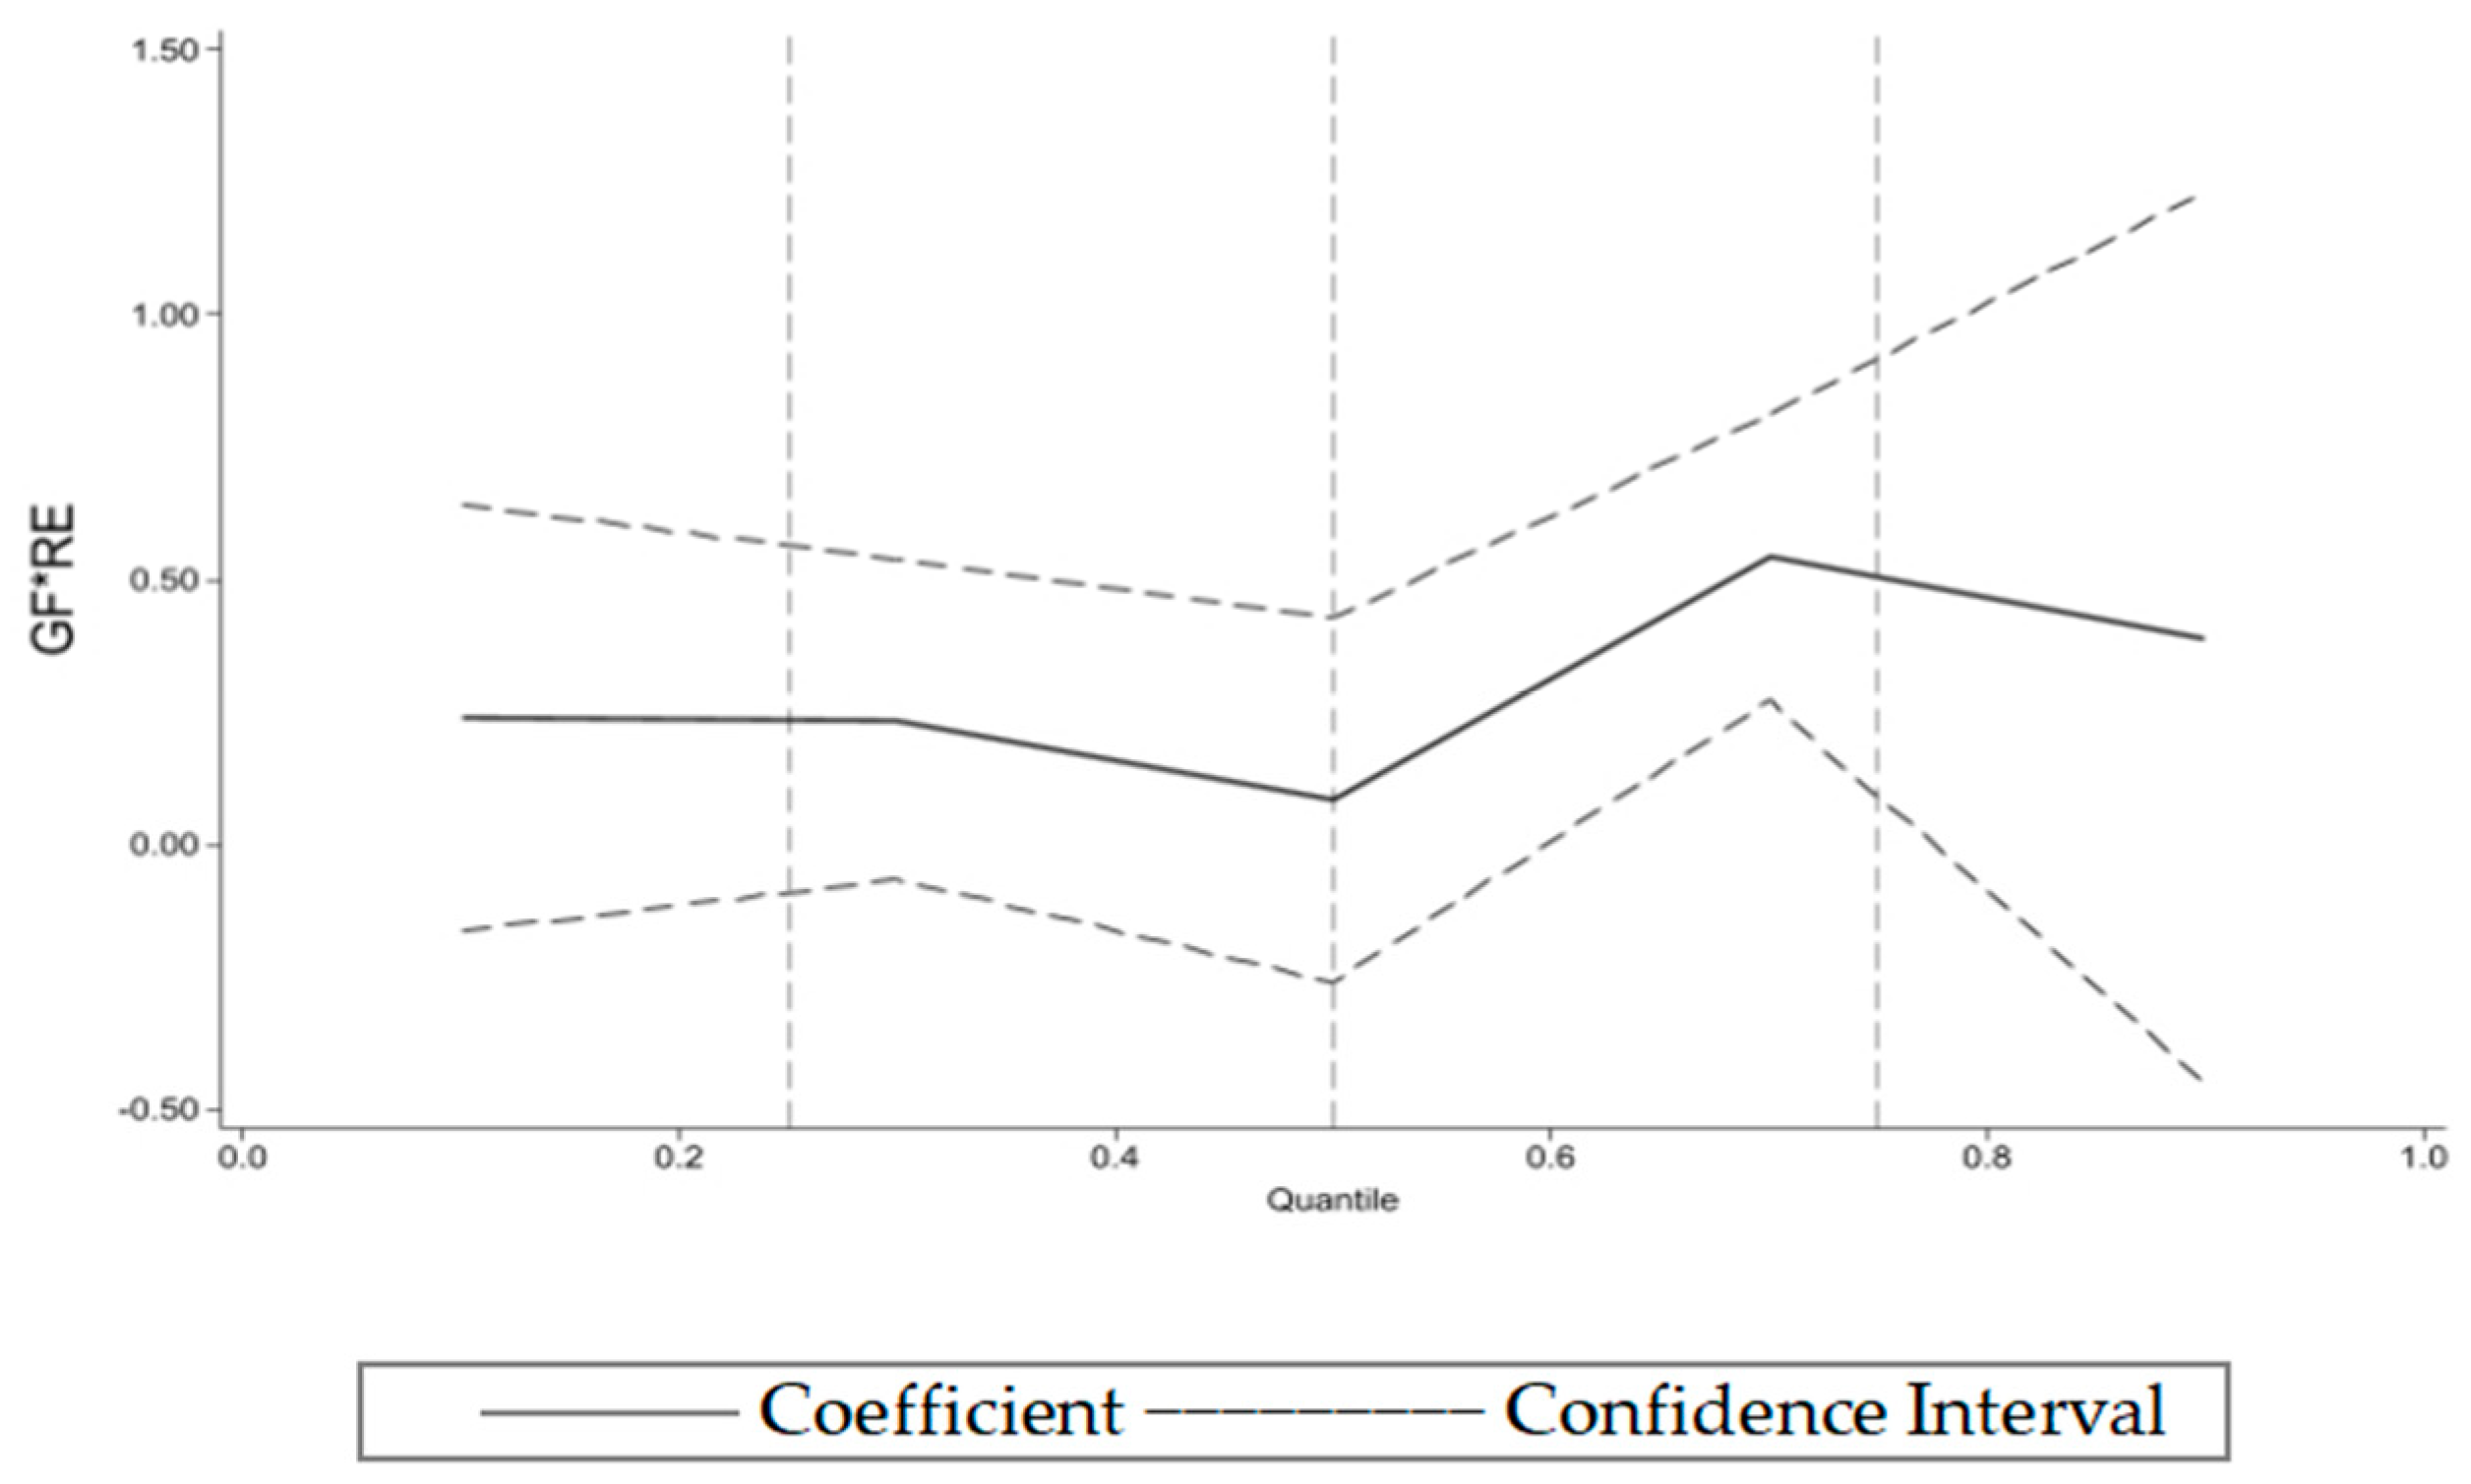
(2) Marginal effects at different MD: To more intuitively observe the marginal effects and dynamic evolution trajectories of GF, RE, and GF*RE at the different levels of MD, this study employs model (9) for parameter estimation. Specifically, the evolution trends of the marginal effects of GF, RE, and GF*RE, considering all control variables, are presented in Figure 5, Figure 6 and Figure 7.
As shown in Figure 5, regardless of the quantile level, the marginal effect of GF remains significantly positive. Specifically, when the quantile is positioned between 10% and 25%, the marginal effect of GF is significantly positive, with the trajectory showing an upward trend. When the quantile is between 25% and 75%, the marginal effect remains significantly positive, with the trajectory remaining stable. At quantiles above 75%, the marginal effect remains positive, but the trajectory shows a slight downward trend. These results indicate that the marginal effect of GF varies dynamically at the different levels of MD, generally exhibiting a rise at first, followed by a fall.
As shown in Figure 6, regardless of the quantile level, the marginal effect of RE remains significantly positive. Specifically, when the quantile is positioned between 10% and 25%, the marginal effect of RE is significantly positive, with a slightly upward trajectory. When the quantile is between 25% and 75%, the marginal effect remains significantly positive, with a slight downward trend. At quantiles above 75%, the marginal effect remains positive, but the trajectory shows a slight upward trend. These results suggest that the marginal effect of RE also varies dynamically across different MD, showing a general trend of initial growth followed by a decline.
As shown in Figure 7, regardless of the quantile level, the marginal effect of GF*RE remains significantly positive. Specifically, when the quantile is positioned between 10% and 25%, the marginal effect of GF*RE is significantly positive, with a stable trajectory. Between 25% and 75%, the marginal effect remains significantly positive, with a steadily upward trajectory. At quantiles above 75%, the marginal effect remains positive, with the trajectory remaining steady. These results indicate that at the different levels of MD, the marginal effect of the interaction between GF and RE is dynamic, with a general trend of stability followed by growth. Therefore, Hypothesis 4 is partially validated.

5.4.2. Heterogeneity Analysis

(1) Location heterogeneity analysis: The significant regional differences in MD across China may affect the findings of this study. Therefore, this study divided the coastal provinces and cities into three marine economic zones. Jiangsu, Shanghai, and Zhejiang comprised the eastern marine economic zone. Fujian, Guangdong, Guangxi, and Hainan comprised the southern marine economic zone, and Liaoning, Hebei, Tianjin, and Shandong comprised the northern marine economic zone. In this study, models (5) and (6) were regressed, and Table 8 shows the specific outcomes.
As shown in Table 8, GF, RE, and GF*RE all have significant impacts on MD across all regions. In the eastern marine economic zone, the coefficient of GF is 2.102; in the southern marine economic zone, the coefficient of RE is 0.701; and in the northern marine economic zone, the coefficient of GF*RE is 0.886.
The possible reason is that the eastern marine economic zone (e.g., Shanghai, Zhejiang, etc.) has a well-developed financial market, which amplifies the influence of GF in driving MD. In the southern marine economic zone (e.g., Guangdong, Hainan, etc.), the favorable climatic conditions are particularly suitable for the renewable energy projects, resulting in a higher coefficient for RE. The northern marine economic zone (e.g., Liaoning, Shandong, etc.) is a region with a concentration of traditional industries and has more complex structural adjustment demands in the low-carbon transition process, making the synergy effects even more crucial in this region [75].
(2) Heterogeneity in economic development levels: Based on differences in the economic development levels of the 11 coastal provinces, measured by GDP, these levels are divided into high, medium, and low groups. The high group includes Guangdong, Jiangsu, Shandong, and Zhejiang; the medium group includes Fujian, Shanghai, Hebei, and Liaoning; and the low group includes Tianjin, Guangxi, and Hainan. This study employs regressed models (7) and (8), and the specific results are presented in Table 9.
As shown in Table 9, GF, RE, and GF*RE all have positive impacts on MD across different economic development groups. In the high-level group, the coefficient of GF is 1.420. In the medium-level group, the coefficient of RE is 0.925. In the low-level group, the coefficient of GF*RE is 0.885.
The possible reason is that regions with higher economic development levels typically have more advanced financial markets and greater financial resources, enabling them to better leverage green financial tools to fund low-carbon projects. In regions with a medium level of economic development, the economy remains relatively dependent on traditional energy sources but has a certain level of technological foundation, facilitating the transition to renewable energy. In regions with lower economic development, due to weaker infrastructure and technical support, relying solely on GF or RE is insufficient to achieve significant low-carbon transition outcomes. However, the synergistic effect of the two can make up for the shortcomings of infrastructure and enhance the accessibility and application efficiency of low-carbon technologies, thus unleashing more significant emission reduction potentials and promoting the low-carbon transformation of the marine industry.
The heterogeneity regression analysis reveals the variations in the impact of GF and RE on MD across different regions and economic development levels. This provides valuable insights for formulating policies tailored to varying locations and levels of economic development.

5.5. Discussion

5.5.1. Discussion of Results

This section aims to explore the core findings of this study and compare them with those of the established literature to identify their commonalities and differences. In addition, based on the findings and the current academic development trend, this study will propose the possible directions for future research and suggestions for improvement, with a view of providing valuable references for subsequent related research.
The results of this study show that the development of green finance and renewable energy make a significant contribution to the low-carbon transition of the marine industry and that there is a positive synergistic effect between the two. Overall, our findings are to a certain extent consistent with those of the established literature. First, some scholars believe that green finance can promote the transformation and upgrading of industrial structure [17]. Zhang further argues that green finance promotes the optimization of industrial structure mainly through the carbon emission regulation mechanism [18]. In addition, Liu’s study emphasizes that finance can promote the growth of the marine economy and optimize the structure of the marine industry through mechanisms such as the integration of industry and finance [21]. Second, previous studies have mainly focused on exploring the potential of renewable energy, its role in promoting industrial structure upgrading, or the impact of carbon emission reduction, which is slightly relevant to our findings. However, their studies did not focus specifically on the marine industry, and even though they focused on the marine industry, they did not specifically explore the path of its low-carbon transformation [27,28,29]. On this basis, this study further expands the research perspective by utilizing empirical data from China’s coastal provinces and cities to systematically demonstrate the role of green finance and renewable energy development in promoting the low-carbon transition of the marine industry. At the same time, this study also reveals the dynamic evolutionary characteristics of this facilitating role: with the improvement in the level of low-carbon transformation of the marine industry, the promotion of green finance is gradually enhanced, while the facilitating effect of renewable energy development shows a decreasing trend, which is inextricably linked to the development stages of green finance and renewable energy [38,39,40]. Therefore, by comparing the results of this study with the established literature, we can not only verify the common conclusions of the study but also can identify the differences, which provide a new perspective for further expanding the related research in the future.

5.5.2. Limitations

Although this study reveals the role of green finance and renewable energy development in promoting the low-carbon transition of the marine industry, it still has some limitations.
First, the index construction and research scope of this study mainly focus on China, and although the conclusions of the study are universal to a certain extent, their applicability in different countries and regions still needs to be further tested. Different countries may exhibit large differences in green finance policies, renewable energy technology development levels, and marine industry structures; thus, the direct extension of this study’s conclusions to other countries or regions may face certain applicability problems. Second, in terms of data processing, this study adopts the interpolation method to fill in some of the missing data. Although the interpolation method is a common data filling method, it may introduce certain systematic biases, which in turn affect the robustness of the empirical results. Therefore, future research can further adopt multiple missing value treatment methods and conduct robustness tests to enhance the reliability of the findings. Third, the research methodology of this study mainly relies on econometric models, while qualitative research methods such as qualitative comparative analysis (QCA), case studies, and interviews are not used. Although econometric analysis can provide macro-level causality identification, qualitative research methods can provide more detailed mechanism exploration and case support. Therefore, future research can combine quantitative and qualitative methods to explore the specific mechanisms of green finance and renewable energy in promoting the low-carbon transition of the marine industry in different contexts from a more comprehensive perspective.

5.5.3. Future Outlook

To address the limitations of this study, future research can be improved and expanded in the following areas.
First, the scope of the study should be expanded to achieve cross-country comparisons. The current study is mainly based on the data from China’s coastal provinces and cities, and although they provide valuable empirical conclusions, their applicability may be limited by regional characteristics. Therefore, future research can consider comparing green finance policies, renewable energy development paths, and their impacts on the low-carbon transition of the marine industry in different countries or regions, analyzing the similarities and differences under different systems, economic structures, and technological levels. The study should be extended using the country-specific data to verify the application of research findings in other countries and explore the applicability of different policy tools. Second, to strengthen the robustness analysis of data processing and to address the possible bias of data interpolation methods, future research can adopt a more rigorous robustness test to ensure the reliability of the research conclusions. Third, quantitative and qualitative research methods should be integrated. The existing research mainly relies on econometric models, and future research can integrate multiple methods to provide more in-depth mechanism analysis and policy recommendations. This includes adopting qualitative comparative analysis (QCA) to identify the key conditions for the low-carbon transition in different regions, exploring the interactions of green finance, renewable energy, and the policy environment, or collecting opinions from policymakers, financial institutions, and business representatives to analyze the actual barriers and optimization space for green finance in low-carbon transition. Fourth, the in-depth exploration of regional heterogeneity and mechanism analysis should be conducted. The study can assess the heterogeneity in the role of green finance and renewable energy in different regions, and the differences between regions and the mechanisms behind them can be further explored in the future. For example, for different marine economic circles such as the east, north, and south, the in-depth analysis of policies, economic structures, energy resource endowment, and other factors that influence the synergistic effects of green finance and renewable energy is necessary.

6. Conclusions and Policy Recommendations

6.1. Conclusions

This study uses a fixed effects model, moderating effects model, and panel quantile regression model to empirically investigate the effects of green finance and renewable energy development on the low-carbon transition of the marine industry using panel data from 11 coastal provinces and cities in China between 2006 and 2022. The findings include the following.
First, green finance and renewable energy development can promote the low-carbon transition of the marine industry and exhibit positive synergistic effects. After various robust and endogeneity tests, the conclusions remain valid. Second, with the advancement of the low-carbon transition level of the marine industry, the influence of green finance and its synergistic effects with renewable energy development gradually increases, while the influence of renewable energy development decreases. Third, the impact of green finance and the synergistic effects is more pronounced in the northern and eastern marine economic zones, while the impact of renewable energy development and the synergistic effects is stronger in provinces with moderate economic development levels.
Based on the research on the low-carbon transformation of industrial structure and the analysis of the current situation of the marine industry, this study constructs an evaluation index system for the low-carbon transformation of the marine industry, and it further enriches the theoretical system of the low-carbon economy and deepens the understanding of the path of green transformation of industry. At the same time, this study takes the unique field of the marine industry as the entry point, expands the scope of application of green finance and renewable energy in the industry, deepens the intrinsic connection between the marine economy and low-carbon development from the academic level, and provides a new theoretical support for the multidisciplinary cross-study of the low-carbon economy, which is of significant theoretical value. In addition, the results of this study provide scientific basis and policy recommendations for China to promote the green development of the marine economy under the framework of the “dual-carbon” target. Especially during the critical period of energy structure adjustment and industrial upgrading, it provides practical guidance for the government to optimize green investment decisions and improve the low-carbon policy system. In the context of global climate change governance, the results of this study are not only of practical significance in guiding the low-carbon transformation of China’s marine economy but also provide practical experience and policy reference for other developing countries and coastal economies in promoting the transformation of the low-carbon economy, thus optimizing the energy structure and improving the green financial system. By revealing the role of green finance and renewable energy in the low-carbon transition of the marine industry, this study will help promote the sustainable development of the marine economy on a global scale, provide scientific support for the international community to jointly address climate change, and strengthen low-carbon cooperation, and this is of great practical significance.

6.2. Policy Recommendations

Drawing from the aforementioned findings, this study offers the following policy suggestions to help the marine industry make the transition to a low-carbon economy.
First, in the process of promoting the low-carbon transformation of the marine industry, a green financial support system combining government guidance and market drive should be established, focusing completely on the leverage effect of financial funds and promoting the efficient allocation of green financial resources. For example, the government should take the lead in setting up a “green development fund for the low-carbon transformation of the ocean” and attracting the participation of social capital. Through the innovation of green financial tools, the introduction of blue bonds, marine industry green credit, green equity investment funds, and other innovative financial tools enhances the coverage of green finance in the marine industry, optimizes the regulatory mechanism, establishes a sound green finance performance assessment and information disclosure system, and ensures that financial institutions accurately invest funds in low-carbon transition-related projects.
Second, in order to accelerate the innovation and application of offshore wind power and marine renewable energy technologies, governments and enterprises should increase their investment in research and development of relevant technologies and promote the upgrading of infrastructure to reduce the cost of technology implementation and enable the wider application of renewable energy in the marine industry. However, the development of marine renewable energy is still facing many technical and financial barriers, which need to be cracked by targeted policy measures. For example, through policy incentives to promote the cooperation between research institutes and marine enterprises, the establishment of marine renewable energy technology incubation centers accelerates the transformation of laboratory research and development results into commercial applications, and the enterprises are encouraged to adopt new types of high-efficiency generator sets, intelligent control systems, and energy storage technologies to improve the stability and economy of renewable energy. At the same time, a sound mechanism for trading marine carbon sinks has been established, allowing marine renewable energy projects to obtain additional revenues through carbon credit trading, and incorporating offshore wind power, tidal energy, and other projects into the carbon emission trading system enables enterprises to obtain financial subsidies through the sale of carbon emission reduction credits, thereby improving the economic rate of return of the projects, etc.
Third, the government should adopt differentiated regional support policies, formulate precise support measures for coastal areas with different levels of economic development, promote the synergistic development of green finance and renewable energy, and improve the effectiveness and pertinence of policy implementation. The northern and eastern marine economic zones, as the more developed regions of China’s marine economy, establish a green financial center for the marine industry. Relying on the core cities of the northern and eastern coasts (e.g., Qingdao, Shanghai, Tianjin, etc.), financial institutions, investment funds, and enterprises is encouraged for the joint development of green financial products for enhancing the vitality of the green financial market. For coastal provinces with moderate levels of economic development, such as Guangxi, Liaoning, and Fujian, the government should encourage them to fully benefit from their natural resource endowment advantages, focus on the development of renewable energy projects, set up marine renewable energy demonstration zones, and focus on the development of offshore wind power, tidal energy, wave energy, ocean temperature difference energy, etc., as well as provide policy subsidies to reduce the cost of initial investment. At the same time, through cross-regional cooperation and the carbon trading mechanism, the sharing of resources and complementarity of advantages between green finance and renewable energy has been achieved, forming a mutually beneficial and win–win pattern for low-carbon development and providing long-term and stable support for the sustainable transformation of the marine economy.

Author Contributions

Conceptualization, W.X. and J.Q.; methodology, J.Q.; software, J.Q.; validation, W.X. and J.Q.; formal analysis, W.X. and J.Q.; investigation, J.Q.; resources, J.Q.; data curation, W.X. and J.Q.; writing—original draft preparation, W.X. and J.Q.; writing—review and editing, W.X. and J.Q.; visualization, J.Q.; supervision, W.X.; project administration, W.X.; funding acquisition, W.X. All authors have read and agreed to the published version of the manuscript.

Funding

This research was funded by the General Project of Humanities and Social Sciences Research of the Ministry of Education “Study on Mechanism Analysis, Effect Evaluation, and Countermeasure Research of Carbon Unlocking in Manufacturing Empowered by Digital Economy” (Project Approval Number: 23YJC790164).

Data Availability Statement

The data used to support the findings in this study are available from the corresponding author upon request.

Acknowledgments

We would like to express our gratitude to the anonymous reviewers for their valuable comments and suggestions, as well as to the Editor-in-Chief.

Conflicts of Interest

The authors declare no conflicts of interest.

Appendix A

(1) The structural adjustment of the marine industry determines resource allocation methods and inter-sectoral synergies. By optimizing the industrial structure, reliance on high-carbon-emitting sectors can be reduced while increasing the percentage of renewable energy-related industries. The structural adjustment of the marine industry includes three representative indicators: the advancement, rationalization, and efficiency of the marine industry structure [76].
First, drawing from the method used by Gan et al., the advancement of the marine industry structure is measured by the ratio of added value in the tertiary marine industry to that in the secondary marine industry [77].
Second, the rationalization of the marine industry structure is gauged by the Theil index, which also indicates how well resources are used and how industrial sectors are developing in a balanced manner [78]. The formula for calculating the Theil index is as follows:
T L = i n   ( Y i Y ) l n ( Y i L i Y L )
where TL represents the Theil index, Y represents the GOP, L represents the number of employees in the marine industry, i represents the marine industry sector, and n represents the number of marine industry sectors.
Third, the level of efficiency in the marine industry structure is measured using social labor productivity. This indicator represents the output generated per unit of labor input, with higher values indicating greater labor efficiency. Here, we use the ratio of GOP to the number of employees in the marine industry as a measure.
(2) The green transition of the marine industry assesses the control of pollutant emissions during the production process and the efforts to protect the ecological environment, driving the industry toward green and sustainable development. The indicator system for the green transition of the marine industry includes seven representative indicators, as shown in Table 1.
(3) Innovation in the marine industry is a key driver of the low-carbon transition. Innovation brings new technologies, processes, materials, and models to the marine industry, helping it overcome the limitations of traditional development and achieve significant breakthroughs. The innovation indicator system of the marine industry includes five representative indicators, as shown in Table 1.
(4) Efficiency in the marine industry focuses on maximizing the operational performance in production and operations, minimizing resource waste, improving energy utilization, and reducing the carbon footprint. The efficiency in the marine industry includes three key indicators: the concentration of the primary, secondary, and tertiary marine industries.
The concentration of primary, secondary, and tertiary maritime industries across regions is measured using the location quotient approach. Industry concentration can lead to economies of scale, where firms reduce costs and increase efficiency through focused production and division of labor, reflecting the level of industrial efficiency.
L i j = E i j / E i E k j / E k
where L represents the location quotient, and E is determined by dividing the output value by the maritime industry’s added value. Of these, i denotes coastal provinces, j denotes marine industry, and k denotes the country. If L > 1, it suggests that the concentration is more than the average for the country.

References

  1. Jiang, Y.; Hu, Y.; Asante, D.; Mintah Ampaw, E.; Asante, B. The Effects of Executives’ Low-Carbon Cognition on Corporate Low-Carbon Performance: A Study of Managerial Discretion in China. J. Clean. Prod. 2022, 357, 132015. [Google Scholar] [CrossRef]
  2. Cui, Y.; Xu, H.; An, D.; Yang, L. Evaluation of Marine Economic Development Demonstration Zone Policy on Marine Industrial Structure Optimization: A Case Study of Zhejiang, China. Front. Mar. Sci. 2024, 11, 1403347. [Google Scholar] [CrossRef]
  3. Yang, J.; Liu, H. Empirical Analysis on the Correlation between Low-carbon Economy and Marine Industry Development. Discrete Dyn. Nat. Soc. 2022, 2022, 2987885. [Google Scholar] [CrossRef]
  4. Yin, Q. Nexus among Financial Development and Equity Market on Green Economic Finance: Fresh Insights from European Union. Renew. Energy 2023, 216, 118938. [Google Scholar] [CrossRef]
  5. Sun, Y.; Bao, Q.; Taghizadeh-Hesary, F. Green Finance, Renewable Energy Development, and Climate Change: Evidence from Regions of China. Humanit. Soc. Sci. Commun. 2023, 10, 107. [Google Scholar] [CrossRef]
  6. Ilyas, M.; Mu, Z.; Akhtar, S.; Hassan, H.; Shahzad, K.; Aslam, B.; Maqsood, S. Renewable Energy, Economic Development, Energy Consumption and Its Impact on Environmental Quality: New Evidence from Southeast Asian Countries. Renew. Energy 2024, 223, 119961. [Google Scholar] [CrossRef]
  7. Cardoso-Andrade, M.; Queiroga, H.; Rangel, M.; Sousa, I.; Belackova, A.; Bentes, L.; Oliveira, F.; Monteiro, P.; Sales Henriques, N.; Afonso, C.M.L.; et al. Setting Performance Indicators for Coastal Marine Protected Areas: An Expert-Based Methodology. Front. Mar. Sci. 2022, 9, 848039. [Google Scholar] [CrossRef]
  8. Pasinetti, L.L. Structural Change and Economic Growth: A Theoretical Essay on the Dynamics of the Wealth of Nations; Cambridge University Press: Cambridge, UK, 1988; ISBN 978-0-521-27410-4. [Google Scholar]
  9. Li, B.; Hu, J. Measurement and Comparative Analysis of the Optimization and Upgrading of Industrial Structure in China. J. Manag. Sci. 2008, 2008, 86–93. [Google Scholar]
  10. Xu, X.Y.; Zhang, X.L. Construction and Measurement of the Evaluation Index System for China’s Industrial Structure Optimization and Upgrading. Product. Res. 2016, 2016, 47–51. [Google Scholar]
  11. Van Den Burg, S.W.K.; Aguilar-Manjarrez, J.; Jenness, J.; Torrie, M. Assessment of the Geographical Potential for Co-Use of Marine Space, Based on Operational Boundaries for Blue Growth Sectors. Mar. Policy 2019, 100, 43–57. [Google Scholar] [CrossRef]
  12. DeVoe, M.R. Marine Aquaculture in the United States: A Review of Current and Future Policy and Management Challenges. Mar. Technol. Soc. J. 2000, 34, 5–17. [Google Scholar] [CrossRef]
  13. Burmeister, H.-C.; Weisheit, J.; Kuechle, J.; Bluhm, L.-F.; Bergmann, M. An Emerging Market? The European Maritime Industry’s View on Autonomous Maritime Systems: A Survey. J. Phys. Conf. Ser. 2024, 2867, 012017. [Google Scholar] [CrossRef]
  14. Methratta, E.T.; Silva, A.; Lipsky, A.; Ford, K.; Christel, D.; Pfeiffer, L. Science Priorities for Offshore Wind and Fisheries Research in the Northeast U.S. Continental Shelf Ecosystem: Perspectives from Scientists at the National Marine Fisheries Service. Mar. Coast. Fish. 2023, 15, e210242. [Google Scholar] [CrossRef]
  15. Stebbings, E.; Papathanasopoulou, E.; Hooper, T.; Austen, M.C.; Yan, X. The Marine Economy of the United Kingdom. Mar. Policy 2020, 116, 103905. [Google Scholar] [CrossRef]
  16. Nurkholis; Nuryadin, D.; Syaifudin, N.; Handika, R.; Setyobudi, R.H.; Udjianto, D.W. The Economic of Marine Sector in Indonesia. Aquat. Procedia 2016, 7, 181–186. [Google Scholar] [CrossRef]
  17. Kuroda, M.; Uchida, K.; Tokai, T.; Miyamoto, Y.; Mukai, T.; Imai, K.; Shimizu, K.; Yagi, M.; Yamanaka, Y.; Mituhashi, T. The Current State of Marine Debris on the Seafloor in Offshore Area around Japan. Mar. Pollut. Bull. 2020, 161, 111670. [Google Scholar] [CrossRef] [PubMed]
  18. Carpenter, A. Oil Pollution in the North Sea: The Impact of Governance Measures on Oil Pollution over Several Decades. Hydrobiologia 2019, 845, 109–127. [Google Scholar] [CrossRef]
  19. Li, F.; Xing, W.; Su, M.; Xu, J. The Evolution of China’s Marine Economic Policy and the Labor Productivity Growth Momentum of Marine Economy and Its Three Economic Industries. Mar. Policy 2021, 134, 104777. [Google Scholar] [CrossRef]
  20. Li, D. The Impact of Marine Industrial Structure Rationalization on Marine Economic Growth. J. Sea Res. 2023, 196, 102455. [Google Scholar] [CrossRef]
  21. Liu, Y. Analysis on the Independent Innovation Path and Development Trend of Emerging Marine Industry Based on DEA Model. Discrete Dyn. Nat. Soc. 2022, 2022, 8255444. [Google Scholar] [CrossRef]
  22. Ji, J.; Tang, R.; Sun, X. Marine Scientific and Technological Innovation, Marine Industrial Structure Upgrade and Marine Total Factor Productivity: Empirical Research Based on Threshold Effect of 11 Coastal Provinces in China. Sci. Technol. Manag. Res. 2021, 41, 73–80. [Google Scholar] [CrossRef]
  23. Ming, C.; Chen, L.; Zhong, S. Construction and Empirical Analysis of China’s Green Growth Comprehensive Evaluation Index System. Sci. Technol. Manag. Res. 2021, 41, 76–86. [Google Scholar] [CrossRef]
  24. Zhou, Y.; Luo, Y.; Wen, C. Construction and Comprehensive Evaluation of an Index System for Urban Industrial Ecologicalization Level. Stat. Decis. 2021, 37, 73–77. [Google Scholar] [CrossRef]
  25. Qin, M.; Liu, Y.; Cheng, C.Z. Comprehensive Evaluation of Marine Industrial Ecologization in China. China Popul. Resour. Environ. 2018, 28, 102–111. (In Chinese) [Google Scholar]
  26. Chen, H.; Wang, H.; Zhang, C. Construction and Measurement of the Evaluation Index System for the Ecological Level of Marine Industry in China. Stat. Decis. 2015, 2015, 48–51. [Google Scholar] [CrossRef]
  27. Xu, G.; Yang, D. Evolution and Development of Externality Theory. J. Soc. Sci. 2004, 2004, 26–30. [Google Scholar] [CrossRef]
  28. Morrissey, K.; O’Donoghue, C. The Role of the Marine Sector in the Irish National Economy: An Input–Output Analysis. Mar. Policy 2013, 37, 230–238. [Google Scholar] [CrossRef]
  29. Alvarado-Ramírez, L.; Santiesteban-Romero, B.; Poss, G.; Sosa-Hernández, J.E.; Iqbal, H.M.N.; Parra-Saldívar, R.; Bonaccorso, A.D.; Melchor-Martínez, E.M. Sustainable Production of Biofuels and Bioderivatives from Aquaculture and Marine Waste. Front. Chem. Eng. 2023, 4, 1072761. [Google Scholar] [CrossRef]
  30. Favoretto, F.; López-Sagástegui, C.; Sala, E.; Aburto-Oropeza, O. The Largest Fully Protected Marine Area in North America Does Not Harm Industrial Fishing. Sci. Adv. 2023, 9, eadg0709. [Google Scholar] [CrossRef]
  31. Shen, H.; Qin, M.; Li, T.; Zhang, X.; Zhao, Y. Digital Finance and Industrial Structure Upgrading: Evidence from Chinese Counties. Int. Rev. Financ. Anal. 2024, 95, 103442. [Google Scholar] [CrossRef]
  32. Zhang, G. The Heterogeneous Role of Green Finance on Industrial Structure Upgrading—Based on Spatial Spillover Perspective. Finance Res. Lett. 2023, 58, 104596. [Google Scholar] [CrossRef]
  33. He, J.; Iqbal, W.; Su, F. Nexus between Renewable Energy Investment, Green Finance, and Sustainable Development: Role of Industrial Structure and Technical Innovations. Renew. Energy 2023, 210, 715–724. [Google Scholar] [CrossRef]
  34. Xu, B.; Lin, B. How Can Green Finance Effectively Promote Low-Carbon Cities? Evidence from 237 Cities in China. J. Environ. Manag. 2024, 365, 121641. [Google Scholar] [CrossRef] [PubMed]
  35. Liu, Y.; Yang, X. Financial Support, Marine Economic Development and Optimization of Marine Industrial Structure—Take Fujian Province as an Example. Fujian Trib. Humanit. Soc. Sci. 2019, 2019, 189–196. [Google Scholar]
  36. Xu, S.; Liu, Y. Research on the Impact of Carbon Finance on the Green Transformation of China’s Marine Industry. J. Clean. Prod. 2023, 418, 138143. [Google Scholar] [CrossRef]
  37. Lin, B.; Zhou, Y. Does Energy Efficiency Make Sense in China? Based on the Perspective of Economic Growth Quality. Sci. Total Environ. 2022, 804, 149895. [Google Scholar] [CrossRef]
  38. Zhang, L.; Mu, R.; Zhan, Y.; Yu, J.; Liu, L.; Yu, Y.; Zhang, J. Digital Economy, Energy Efficiency, and Carbon Emissions: Evidence from Provincial Panel Data in China. Sci. Total Environ. 2022, 852, 158403. [Google Scholar] [CrossRef]
  39. Xing, W. The Present Condition of the Development of Energy Economics and Its Trend. Econ. Perspect. 2005, 8, 103–109. [Google Scholar]
  40. Yang, Z.; Zhang, M.; Liu, L.; Zhou, D. Can Renewable Energy Investment Reduce Carbon Dioxide Emissions? Evidence from Scale and Structure. Energy Econ. 2022, 112, 106181. [Google Scholar] [CrossRef]
  41. Want, A.; Crawford, R.; Kakkonen, J.; Kiddie, G.; Miller, S.; Harris, R.E.; Porter, J.S. Biodiversity Characterisation and Hydrodynamic Consequences of Marine Fouling Communities on Marine Renewable Energy Infrastructure in the Orkney Islands Archipelago, Scotland, UK. Biofouling 2017, 33, 567–579. [Google Scholar] [CrossRef]
  42. Iswadi, A.; Porter, J.S.; Bell, M.C.; Garniati, L.; Harris, R.E.; Priyotomo, G. Establishing an Agenda for Biofouling Research for the Development of the Marine Renewable Energy Industry in Indonesia. J. Mar. Sci. Eng. 2022, 10, 384. [Google Scholar] [CrossRef]
  43. Rivera, G.; Ortiz, M.; Rivera-Arriaga, E.; Mendoza, E. Identification of Applicable Regulation and Public Policy Gaps Regarding Marine Renewable Energy in Mexico. Ocean Coast. Manag. 2024, 254, 107171. [Google Scholar] [CrossRef]
  44. Zhou, Q.; Chen, H. Analysis of the Interactive Relationship between China’s Energy Consumption and Industrial Structure. Stat. Decis. 2018, 34, 99–102. [Google Scholar] [CrossRef]
  45. Chang, J.; Leung, D.Y.C.; Wu, C.Z.; Yuan, Z.H. A Review on the Energy Production, Consumption, and Prospect of Renewable Energy in China. Renew. Sustain. Energy Rev. 2003, 7, 453–468. [Google Scholar] [CrossRef]
  46. Zhu, Q.; Chen, X.; Song, M.; Li, X.; Shen, Z. Impacts of Renewable Electricity Standard and Renewable Energy Certificates on Renewable Energy Investments and Carbon Emissions. J. Environ. Manag. 2022, 306, 114495. [Google Scholar] [CrossRef]
  47. Yu, S.; Hu, X.; Li, L.; Chen, H. Does the Development of Renewable Energy Promote Carbon Reduction? Evidence from Chinese Provinces. J. Environ. Manag. 2020, 268, 110634. [Google Scholar] [CrossRef]
  48. Su, Y.; Fan, Q. Renewable Energy Technology Innovation, Industrial Structure Upgrading and Green Development from the Perspective of China’s Provinces. Technol. Forecast. Soc. Chang. 2022, 180, 121727. [Google Scholar] [CrossRef]
  49. Niu, W. Basic Understanding of the Theory of Sustainable Development. Prog. Geogr. 2008, 27, 1–6. [Google Scholar]
  50. Freeman, M.C.; O’Neil, R.; Garavelli, L.; Hellin, D.; Klure, J. Case Study on the Novel Permitting and Authorization of PacWave South, a US Grid-Connected Wave Energy Test Facility: Development, Challenges, and Insights. Energy Policy 2022, 168, 113141. [Google Scholar] [CrossRef]
  51. Lange, M.; O’Hagan, A.M.; Devoy, R.R.N.; Le Tissier, M.; Cummins, V. Governance Barriers to Sustainable Energy Transitions—Assessing Ireland’s Capacity towards Marine Energy Futures. Energy Policy 2018, 113, 623–632. [Google Scholar] [CrossRef]
  52. Sgobbi, A.; Simões, S.G.; Magagna, D.; Nijs, W. Assessing the Impacts of Technology Improvements on the Deployment of Marine Energy in Europe with an Energy System Perspective. Renew. Energy 2016, 89, 515–525. [Google Scholar] [CrossRef]
  53. Khan, H.; Khan, I.; Binh, T.T. The Heterogeneity of Renewable Energy Consumption, Carbon Emission and Financial Development in the Globe: A Panel Quantile Regression Approach. Energy Rep. 2020, 6, 859–867. [Google Scholar] [CrossRef]
  54. Ma, L.M.; Huang, C.L. Financial Drivers and Renewable Energy Development—A Dynamic Evolution Analysis Based on Multinational Data. China Ind. Econ. 2022, 2022, 118–136. [Google Scholar] [CrossRef]
  55. Xiao, D.; Zhang, Y. Statistical Test of Impact of Renewable Energy Consumption on Carbon Dioxide Emission. Stat. Decis. 2019, 35, 87–90. [Google Scholar] [CrossRef]
  56. Hou, H.; Wang, Y.; Zhang, M. Green Finance Drives Renewable Energy Development: Empirical Evidence from 53 Countries Worldwide. Environ. Sci. Pollut. Res. 2023, 30, 80573–80590. [Google Scholar] [CrossRef] [PubMed]
  57. Lee, C.-C.; Wang, F.; Chang, Y.-F. Does Green Finance Promote Renewable Energy? Evidence from China. Resour. Policy 2023, 82, 103439. [Google Scholar] [CrossRef]
  58. Zheng, M.; Feng, G.-F.; Chang, C.-P. Is Green Finance Capable of Promoting Renewable Energy Technology? Empirical Investigation for 64 Economies Worldwide. Oeconomia Copernic. 2023, 14, 483–510. [Google Scholar] [CrossRef]
  59. Ge, T.; Cai, X.; Song, X. How Does Renewable Energy Technology Innovation Affect the Upgrading of Industrial Structure? The Moderating Effect of Green Finance. Renew. Energy 2022, 197, 1106–1114. [Google Scholar] [CrossRef]
  60. Wei, L.; Yang, Y. On the Evolution Logic and Environmental Effects of Green Finance Policies in China. J. Northwest Norm. Univ. Soc. Sci. 2020, 57, 101–111. [Google Scholar] [CrossRef]
  61. Siddik, A.B.; Khan, S.; Khan, U.; Yong, L.; Murshed, M. The Role of Renewable Energy Finance in Achieving Low-Carbon Growth: Contextual Evidence from Leading Renewable Energy-Investing Countries. Energy 2023, 270, 126864. [Google Scholar] [CrossRef]
  62. Yu, J.; Yu, H.; Liu, S. An Analysis of the Evolution of China’s Marine Industrial Structure Based on the Tri-Axial Diagram. Shandong Econ. 2009, 25, 43–47. [Google Scholar] [CrossRef]
  63. Zhang, C.; Liu, G. Evolving Marginal Effects of Financial Structure on Economic Growth. Econ. Res. J. 2015, 50, 84–99. [Google Scholar]
  64. Powell, D. Quantile Regression with Nonadditive Fixed Effects. Empir. Econ. 2022, 63, 2675–2691. [Google Scholar] [CrossRef]
  65. Li, X.X.; Xia, G. Strengthening the Research on Green Finance. In Proceedings of the Socialism Collection of Economic Theory Research (2014)—China’s Economy Under the New Normal, Beijing, China, 16 November 2014; pp. 53–58. [Google Scholar]
  66. Zhou, C.; Tian, F.; Zhou, T. Green Finance and High-Quality Development: Mechanism and Effects. J. Guizhou Univ. Soc. Sci. 2022, 28, 1–13. [Google Scholar] [CrossRef]
  67. Dong, K.; Dong, X.; Dong, C. Determinants of the Global and Regional CO2 Emissions: What Causes What and Where? Appl. Econ. 2019, 51, 5031–5044. [Google Scholar] [CrossRef]
  68. Sadorsky, P. Renewable Energy Consumption and Income in Emerging Economies. Energy Policy 2009, 37, 4021–4028. [Google Scholar] [CrossRef]
  69. Zhang, N.; Yu, K.; Chen, Z. How Does Urbanization Affect Carbon Dioxide Emissions? A Cross-Country Panel Data Analysis. Energy Policy 2017, 107, 678–687. [Google Scholar] [CrossRef]
  70. Yu, F.; Zheng, S.; Zheng, S.; Guo, C. Does Carbon ETS Affect the Distribution of Labor’s Slice of the Factor Income Pie? From the Low-Carbon Transition Perspective. Energy Econ. 2024, 134, 107569. [Google Scholar] [CrossRef]
  71. Hu, W.; He, X. The Role of Fiscal Policies in Supporting a Transition to a Low-Carbon Economy: Evidence from the Chinese Shipping Industry. Transp. Res. Part Policy Pract. 2024, 179, 103940. [Google Scholar] [CrossRef]
  72. Dong, K.; Dong, X.; Jiang, Q. How Renewable Energy Consumption Lowers Global CO2 Emissions? Evidence from Countries with Different Income Levels. World Econ. 2020, 43, 1665–1698. [Google Scholar] [CrossRef]
  73. Fang, Y.; Shao, Z. Whether Green Finance Can Effectively Moderate the Green Technology Innovation Effect of Heterogeneous Environmental Regulation. Int. J. Environ. Res. Public. Health 2022, 19, 3646. [Google Scholar] [CrossRef] [PubMed]
  74. Rasoulinezhad, E.; Taghizadeh-Hesary, F. Role of Green Finance in Improving Energy Efficiency and Renewable Energy Development. Energy Effic. 2022, 15, 14. [Google Scholar] [CrossRef] [PubMed]
  75. Zhou, Y.; Liu, H.; Wang, J.; Yang, H.; Liu, Z.; Peng, G. Spatial Differentiation and Influencing Factors of Green Finance Development Level in China. Front. Environ. Sci. 2022, 10, 1023690. [Google Scholar] [CrossRef]
  76. Liu, H.P.; Chen, D.J. Spatial-Temporal Differences of Support Conditions for Marine Strategic Emerging Industries in China. Ocean Dev. Manag. 2016, 33, 9–17. [Google Scholar] [CrossRef]
  77. Gan, C.; Zheng, R.; Yu, D. An Empirical Study on the Effects of Industrial Structure on Economic Growth and Fluctuations in China. Econ. Res. J. 2011, 46, 4–16. [Google Scholar]
  78. Yu, S.; Yang, L. On the Transition of Marine Industries. Ocean Dev. Manag. 2009, 26, 61–66. [Google Scholar] [CrossRef]
Figure 1. The three-dimensional kernel density plot of the marine industry’s low-carbon transition. Sources: China Marine Statistical Yearbook, etc.
Energies 18 01464 g001
Figure 2. The radar chart of the different dimension levels for coastal provinces and cities. Sources: China Marine Statistical Yearbook, etc.
Energies 18 01464 g002aEnergies 18 01464 g002b
Figure 3. The spatial distribution of low-carbon transition levels in the marine industry. Sources: China Marine Statistical Yearbook, etc.
Energies 18 01464 g003
Figure 4. Spatial distribution map of low-carbon transition levels in the marine industry. Sources: China Marine Statistical Yearbook, etc.
Energies 18 01464 g004
Figure 5. Marginal effect of green finance.
Energies 18 01464 g005
Figure 6. Marginal effect of renewable energy development.
Energies 18 01464 g006
Figure 7. Marginal effect of interaction term.
Energies 18 01464 g007
Table 1. The construction of the indicator system for the low-carbon transition of the marine industry.
Target LevelCriterion LevelIndicator LevelIndex Attributes
Low-carbon transition of the marine industryStructural adjustment of the marine industryAdvancement of the industrial structure+
Rationalization of the industrial structure+
Efficiency of the industrial structure+
Green transition of the marine industryDirect discharge rate of industrial wastewater into the sea-
Comprehensive utilization of industrial solid waste per unit Gross Ocean Product (GOP)+
Industrial wastewater emissions per unit GOP-
Industrial waste gas emissions per unit GOP-
Growth rate of electricity consumption per unit GOP-
Energy consumption per unit output value-
Investment rate in marine pollution and environmental protection+
Innovation in the marine industryNumber of marine research institutions+
Number of marine science and technology projects+
Total number of invention patents held by marine research institutions+
Per capita funding for marine science and technology+
Proportion of marine research institution staff with a master’s degree or higher+
Efficiency in the marine industryConcentration of the primary marine industry+
Concentration of the secondary marine industry+
Concentration of the tertiary marine industry+
(1) Sources: China Marine Statistical Yearbook, China Environmental Statistical Yearbook, China Energy Statistical Yearbook, etc. (2) +, for positive impacts; -, for negative impacts. (3) See Appendix A for the description and measurement of indicators.
Table 2. Green finance index system.
Primary IndicatorSecondary IndicatorTertiary IndicatorIndicator DefinitionAttribute
Green financeGreen creditGreen credit ratioInterest expenditure from six high-energy-consuming industries/the total industrial interest expenditure-
Green securitiesMarket value ratio of high-energy-consuming industriesA-share market value of six high-energy-consuming industries/total A-share market value-
Green investmentInvestment ratio in environmental pollution controlPollution control investment/GDP+
Green insuranceAgricultural insurance scale ratioAgricultural insurance income/total agricultural output value+
Carbon financeCarbon intensityCO₂ emissions/GDP-
(1) Sources: China Environmental Statistics Yearbook, etc. (2) +, for positive impacts; -, for negative impacts.
Table 3. Descriptive statistics of variables.
VariablesObsMeanSDMinMax
MD1170.2620.1230.0500.604
GF1170.0060.022−0.0750.092
RE1170.0620.263−0.9321.265
UB1170.6550.1230.4030.896
OP1170.4970.3430.0821.590
TH1170.0190.040−0.0380.280
ID117−0.0050.032−0.1430.138
LR1170.0080.026−0.0610.183
Notes: Obs, Mean, SD, Min, and Max represent observed value, mean value, scale deviation, minimum value, and maximum value, respectively.
Table 4. Fixed effects model regression results.
Variables(1)(2)(3)
GF0.932 **1.319 ***0.591 **
(0.451)(0.477)(0.297)
RE0.234 ***0.237 ***0.077 **
(0.037)(0.037)(0.030)
UB −0.0840.436 **
(0.106)(0.178)
OP 0.033−0.248 ***
(0.038)(0.067)
TH −0.284−0.411 **
(0.282)(0.192)
ID 0.559 *0.099
(0.320)(0.220)
LR −0.849 *0.573 **
(0.434)(0.272)
Constant0.243 ***0.294 ***0.096
(0.010)(0.059)(0.117)
ControlsNOYESYES
Pro FENONOYES
Year FENONOYES
Observations117117117
Adjusted R-squared0.2830.2980.803
Notes: (1) standard errors in parentheses; (2) * p < 0.1, ** p < 0.05, *** p < 0.01.
Table 5. Moderating effects model regression results.
Variables(1)(2)(3)
GF0.909 **1.304 ***0.580 *
(0.452)(0.476)(0.293)
RE0.235 ***0.241 ***0.082 ***
(0.037)(0.037)(0.030)
GF*RE0.2350.2820.229 *
(0.216)(0.216)(0.124)
UB −0.0800.439 **
(0.106)(0.176)
OP 0.033−0.261 ***
(0.038)(0.066)
TH −0.317−0.428 **
(0.283)(0.189)
ID 0.609 *0.120
(0.322)(0.217)
LR −0.831 *0.577 **
(0.433)(0.268)
Constant0.241 ***0.289 ***0.098
(0.010)(0.059)(0.116)
ControlsNOYESYES
Pro FENONOYES
Year FENONOYES
Observations117117117
Adjusted R-squared0.2840.3030.809
Notes: (1) standard errors in parentheses; (2) * p < 0.1, ** p < 0.05, *** p < 0.01.
Table 6. Robustness tests.
VariablesReplacing the Independent VariableReplacing the Dependent VariableReplacing the Control VariableThe Lagged Independent Variable
MDmdMDMD
GF 0.141 **0.882 ***
(0.059)(0.331)
RE 0.192 **0.090 ***
(0.077)(0.032)
GF*RE 0.812 **0.252 *
(0.263)(0.135)
gf0.519 *** 0.513 **
(0.151) (0.166)
re0.246 *** 0.430 *
(0.039) (0.209)
gf*re0.101 * 0.390 ***
(0.055) (0.092)
UB0.502 *0.749 0.005
(0.235)(0.710) (0.167)
OP−0.386 ***−0.103 * −0.031 ***
(0.056)(0.049) (0.007)
TH−0.253 **0.157 ** 0.834 ***
(0.096)(0.070) (0.165)
ID0.188−0.065 0.597
(0.222)(1.670) (0.602)
LR−1.169 **0.750 0.429 *
(0.410)(0.537) (0.194)
GI −1.251
(1.341)
SC −0.201 ***
(0.070)
ER −0.146
(0.626)
RD −0.079
(6.763)
_cons0.118−0.2250.354 ***0.449 ***
(0.131)(0.582)(0.059)(0.086)
ControlsYesYesYesYes
Pro FEYesYesYesYes
Year FEYesYesYesYes
Observations72.000107.000117.000106.000
Adjusted R-squared0.5970.7810.4520.550
Notes: (1) standard errors in parentheses; (2) * p < 0.1, ** p < 0.05, *** p < 0.01.
Table 7. Regression results of the average effects.
VariablesLow-Level GroupSub-Low-Level GroupSub-High-Level GroupHigh-Level Group
GF0.361 ***0.580 ***0.782 ***1.835 **
(0.057)(0.095)(0.039)(0.560)
RE0.984 **0.782 ***0.201 ***0.155 **
(0.304)(0.203)(0.030)(0.039)
GF*RE0.185 *0.152 *0.372 ***0.704 *
(0.089)(0.064)(0.033)(0.228)
UB0.064 *−0.0860.370 ***0.713
(0.032)(0.210)(0.086)(0.394)
OP−0.0100.0690.105 ***−0.059
(0.038)(0.067)(0.003)(0.068)
TH0.560 **−2.5071.945 ***0.832 *
(0.169)(2.722)(0.160)(0.275)
ID0.224 ***−0.287 *−1.723 ***0.533
(0.047)(0.134)(0.228)(0.271)
LR−0.609 ***−0.219−0.089 ***0.781 **
(0.120)(0.309)(0.020)(0.232)
_cons0.092 **0.237 *−0.068−0.004
(0.033)(0.110)(0.056)(0.239)
ControlsYesYesYesYes
Pro FEYesYesYesYes
Year FEYesYesYesYes
Observations23.00023.00017.00018.000
Adjusted R-squared0.8200.5480.9990.937
Notes: (1) standard errors in parentheses; (2) * p < 0.1, ** p < 0.05, *** p < 0.01.
Table 8. Regression results of locational heterogeneity.
VariablesNorthern RegionEastern RegionSouthern Region
GF1.927 ***2.102 *1.315 ***
(0.014)(0.584)(0.007)
RE0.571 ***0.225 **0.701 ***
(0.069)(0.029)(0.094)
GF*RE0.886 **0.574 ***0.106 *
(0.156)(0.005)(0.037)
UB−0.3210.1560.547 **
(0.141)(0.074)(0.101)
OP−0.487 ***−0.344 ***−0.112
(0.077)(0.016)(0.076)
TH0.417 ***0.122 **0.203 **
(0.010)(0.025)(0.046)
ID0.152 ***0.317 ***0.736
(0.008)(0.007)(0.400)
LR0.817 *0.186*−0.496
(0.289)(0.060)(0.413)
_cons0.548 ***0.408 **−0.041
(0.077)(0.049)(0.098)
ControlsYesYesYes
Pro FEYesYesYes
Year FEYesYesYes
Observations14.00015.00030.000
Adjusted R-squared0.9440.9740.809
Notes: (1) standard errors in parentheses; (2) * p < 0.1, ** p < 0.05, *** p < 0.01.
Table 9. Regression results for heterogeneity in economic development levels.
VariablesHighMediumLow
GF1.420 **1.010 **0.402 *
(0.419)(0.182)(0.132)
RE0.105 **0.925 **0.119 **
(0.025)(0.253)(0.026)
GF*RE0.557 **0.690 **0.885 **
(0.135)(0.147)(0.163)
UB0.507 *0.216−0.314
(0.166)(0.118)(0.195)
OP−0.316 ***−0.134 **−0.017
(0.028)(0.029)(0.075)
TH0.129 **−0.454 ***−0.506
(0.036)(0.065)(0.453)
ID0.329 **0.823 ***0.530
(0.096)(0.139)(0.195)
LR−0.374−0.699 **−0.351 *
(0.355)(0.169)(0.118)
_cons0.2080.1590.344 *
(0.105)(0.080)(0.115)
ControlsYesYesYes
Pro FEYesYesYes
Year FEYesYesYes
Observations30.00023.00033.000
Adjusted R-squared0.9250.7940.743
Notes: (1) standard errors in parentheses; (2) * p < 0.1, ** p < 0.05, *** p < 0.01.
Disclaimer/Publisher’s Note: The statements, opinions and data contained in all publications are solely those of the individual author(s) and contributor(s) and not of MDPI and/or the editor(s). MDPI and/or the editor(s) disclaim responsibility for any injury to people or property resulting from any ideas, methods, instructions or products referred to in the content.