
A Forward-Looking Assessment of Robotized Operation and Maintenance Practices for Offshore Wind Farms


Abstract
:1. Introduction
- Regular/Preventative Maintenance;
- Unplanned/Corrective Maintenance;
- Spare Parts;
- Repair Labor;
- Others, such as the chartering of heavy-lift vessels and crews.
- Research already-existing O&M cost calculators (NOWIcob, O2M, etc.), and understand their main components, models, and inputs.
- Develop our own O&M cost calculator composed of several modules, taking into consideration robotics solutions to O&M problems. New contributions by the authors are realized in this section by understanding how to quantify the impact of these solutions, which are, at the moment, not yet sufficiently assessed.
- Through the previous tool, obtain parameters such as the availability and total power generated, which will be used to assess the economics of these robotic solutions, in comparison to regular (traditional) human-based ones.
- Purpose-built wind farm infrastructure designed for robotic accessibility and operation.
- Fully autonomous resident robotic systems capable of performing all minor repair tasks without human intervention.
- Robust implementation of inspection and maintenance strategies leveraging robotics.
- Lessons learned from early deployments being fed back into the design of future wind farms and turbines.
2. Literature Review
2.1. Existing Offshore O&M Simulation Tools
2.2. Research on the Impact of Robotized Solutions for O&M in OWF
- External inspections—UAVs and ROVs are widely used to inspect blades, towers, and substructures [25].
- Blade surface repairs—Robotic systems are being developed to apply coatings and perform minor structural repairs on blades [15].
- Subsea inspections and cleaning—ROVs are being used to inspect and clean underwater structures, reducing the need for divers [5].
3. Models and Methods
3.1. Assumptions
- Robotization factor—It represents an optimized future scenario.
- Failure Mode—It only deals with the normal life phase of wind turbine components, characterized by a constant failure rate.
- Availability—For unplanned maintenance, it assumes a fixed delay for the availability of spare parts and crew.
- Cost—It assumes a fixed cost for parts and maintenance.
- Crew Shift—If the repair time extends beyond a shift, it is assumed the crew stays until the fault is fixed.
- Repair—When a component is fixed, it is assumed to be 100% repaired, and the failure data remains the same.
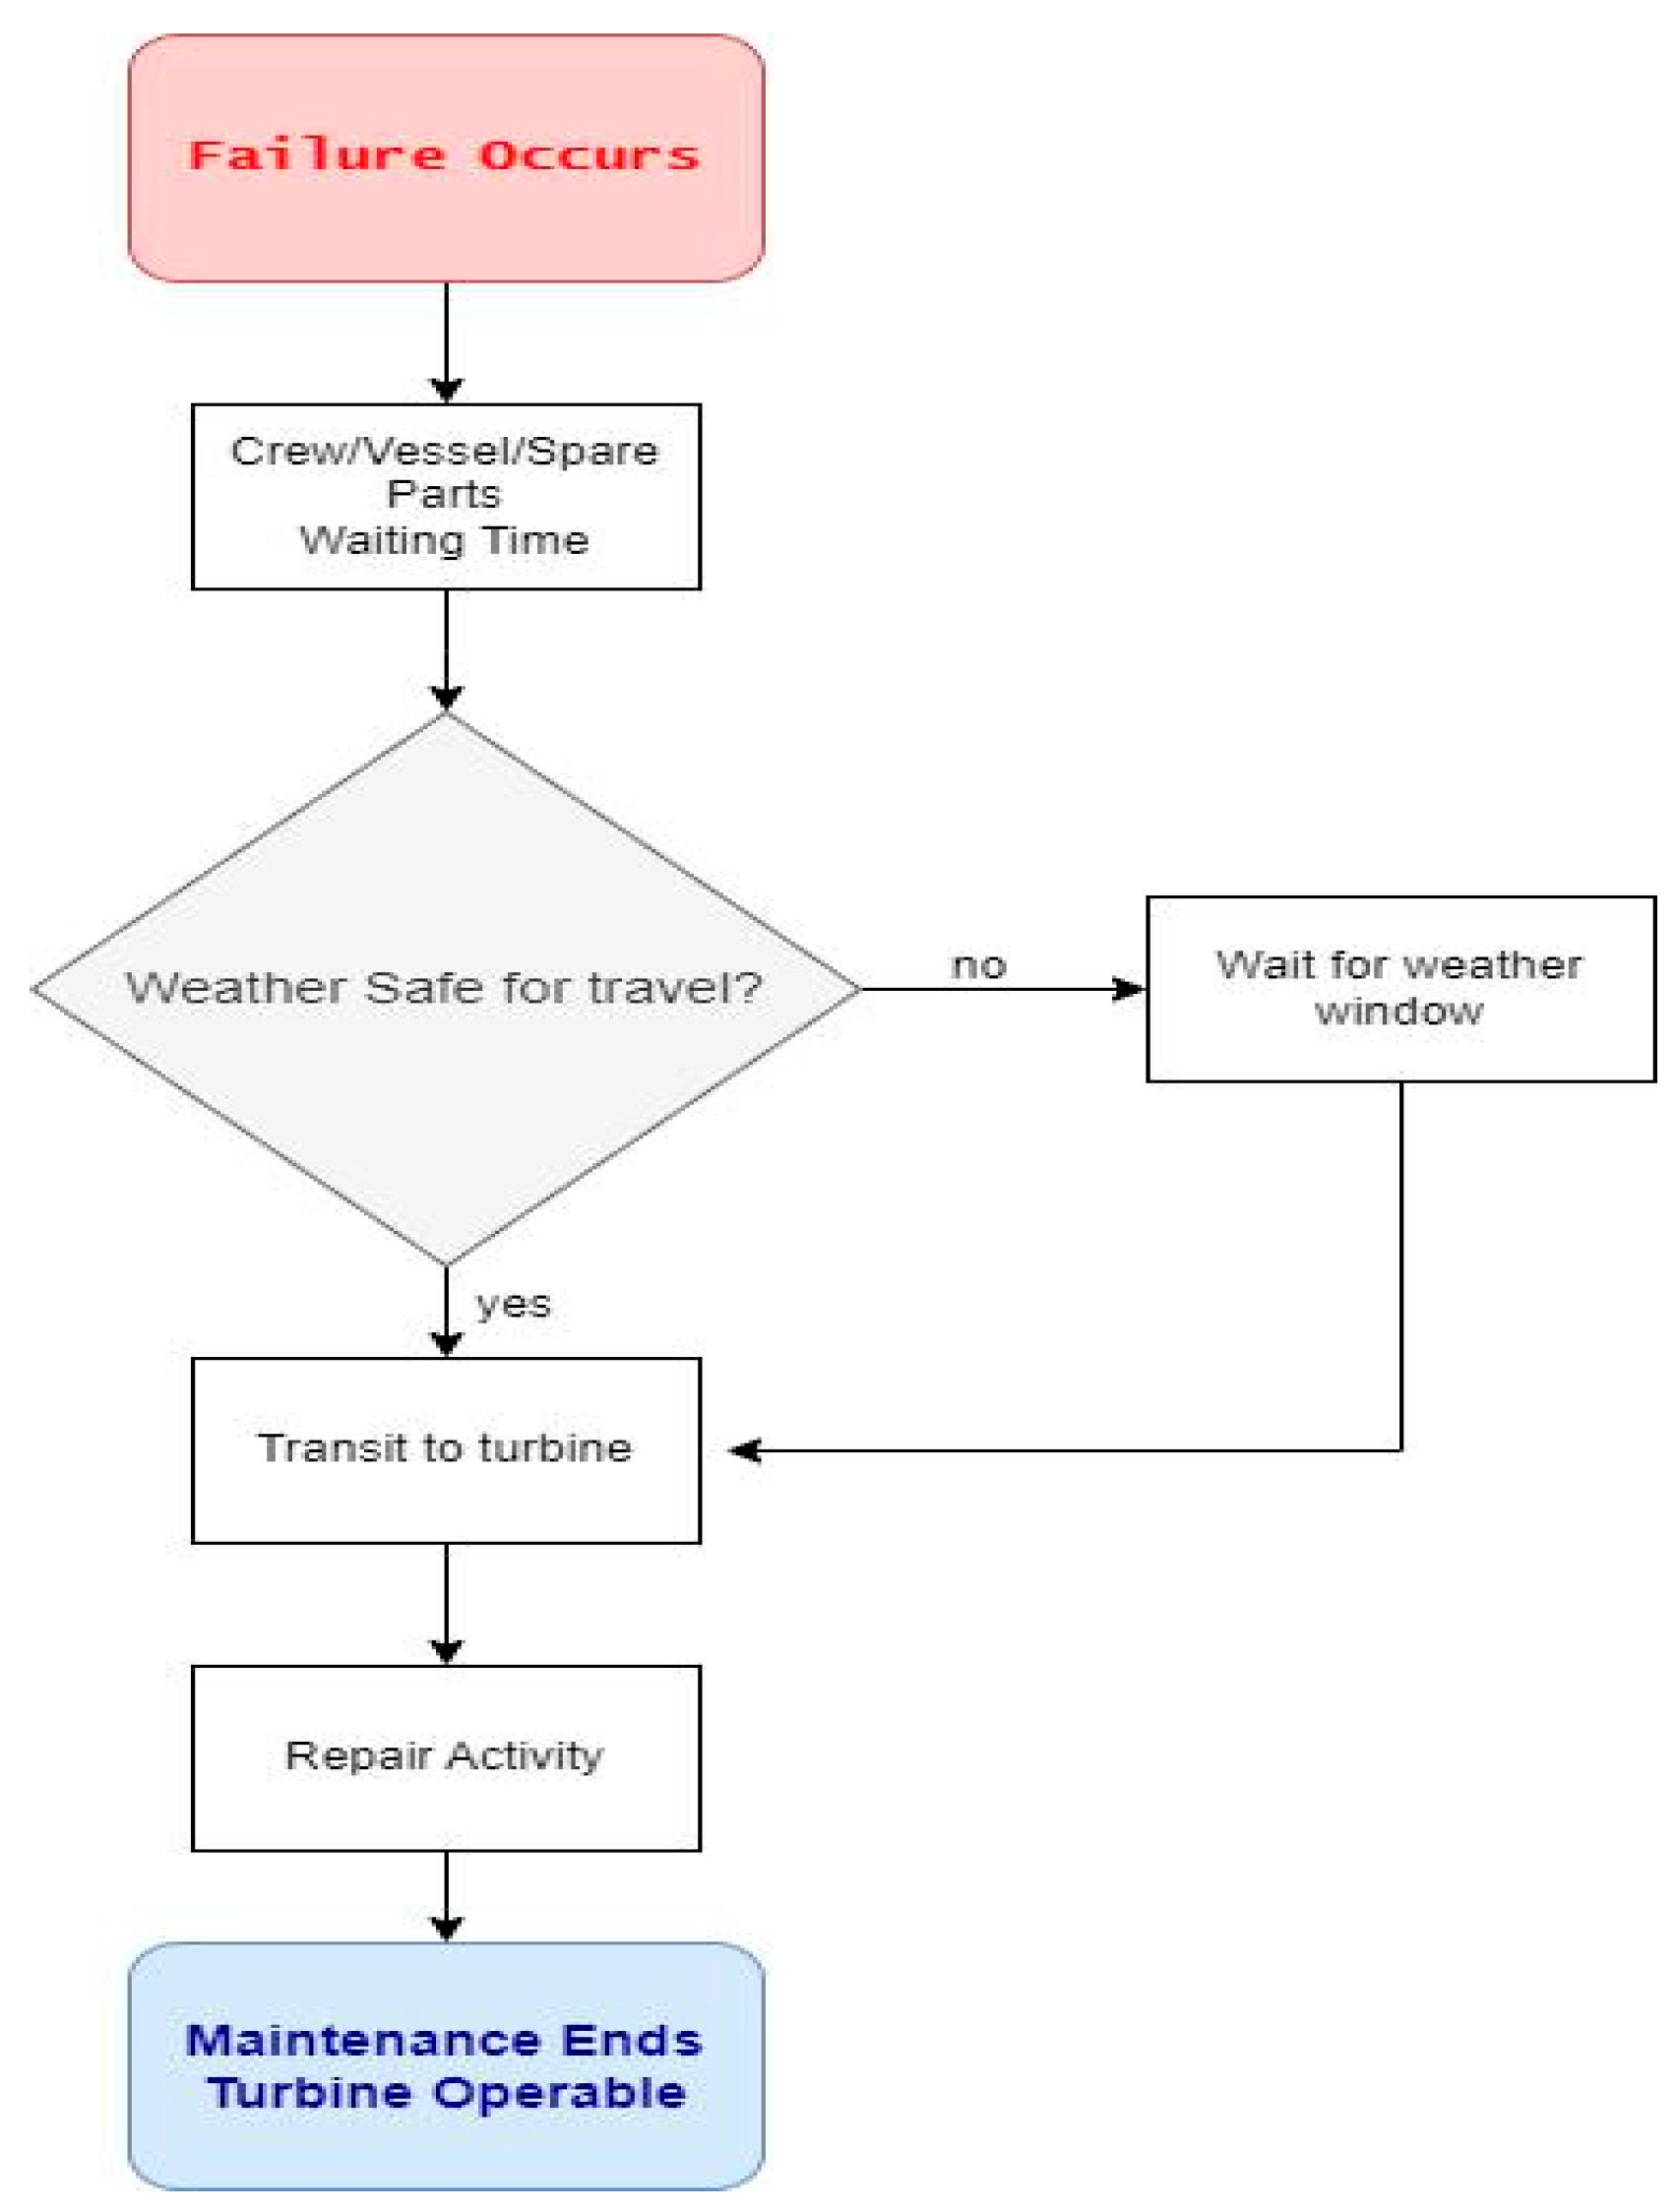
- Weather—The tool considers the weather safe for travel if the weather conditions are safe at the start and end of the maintenance.
3.2. O&M Tool
3.2.1. Weather Module
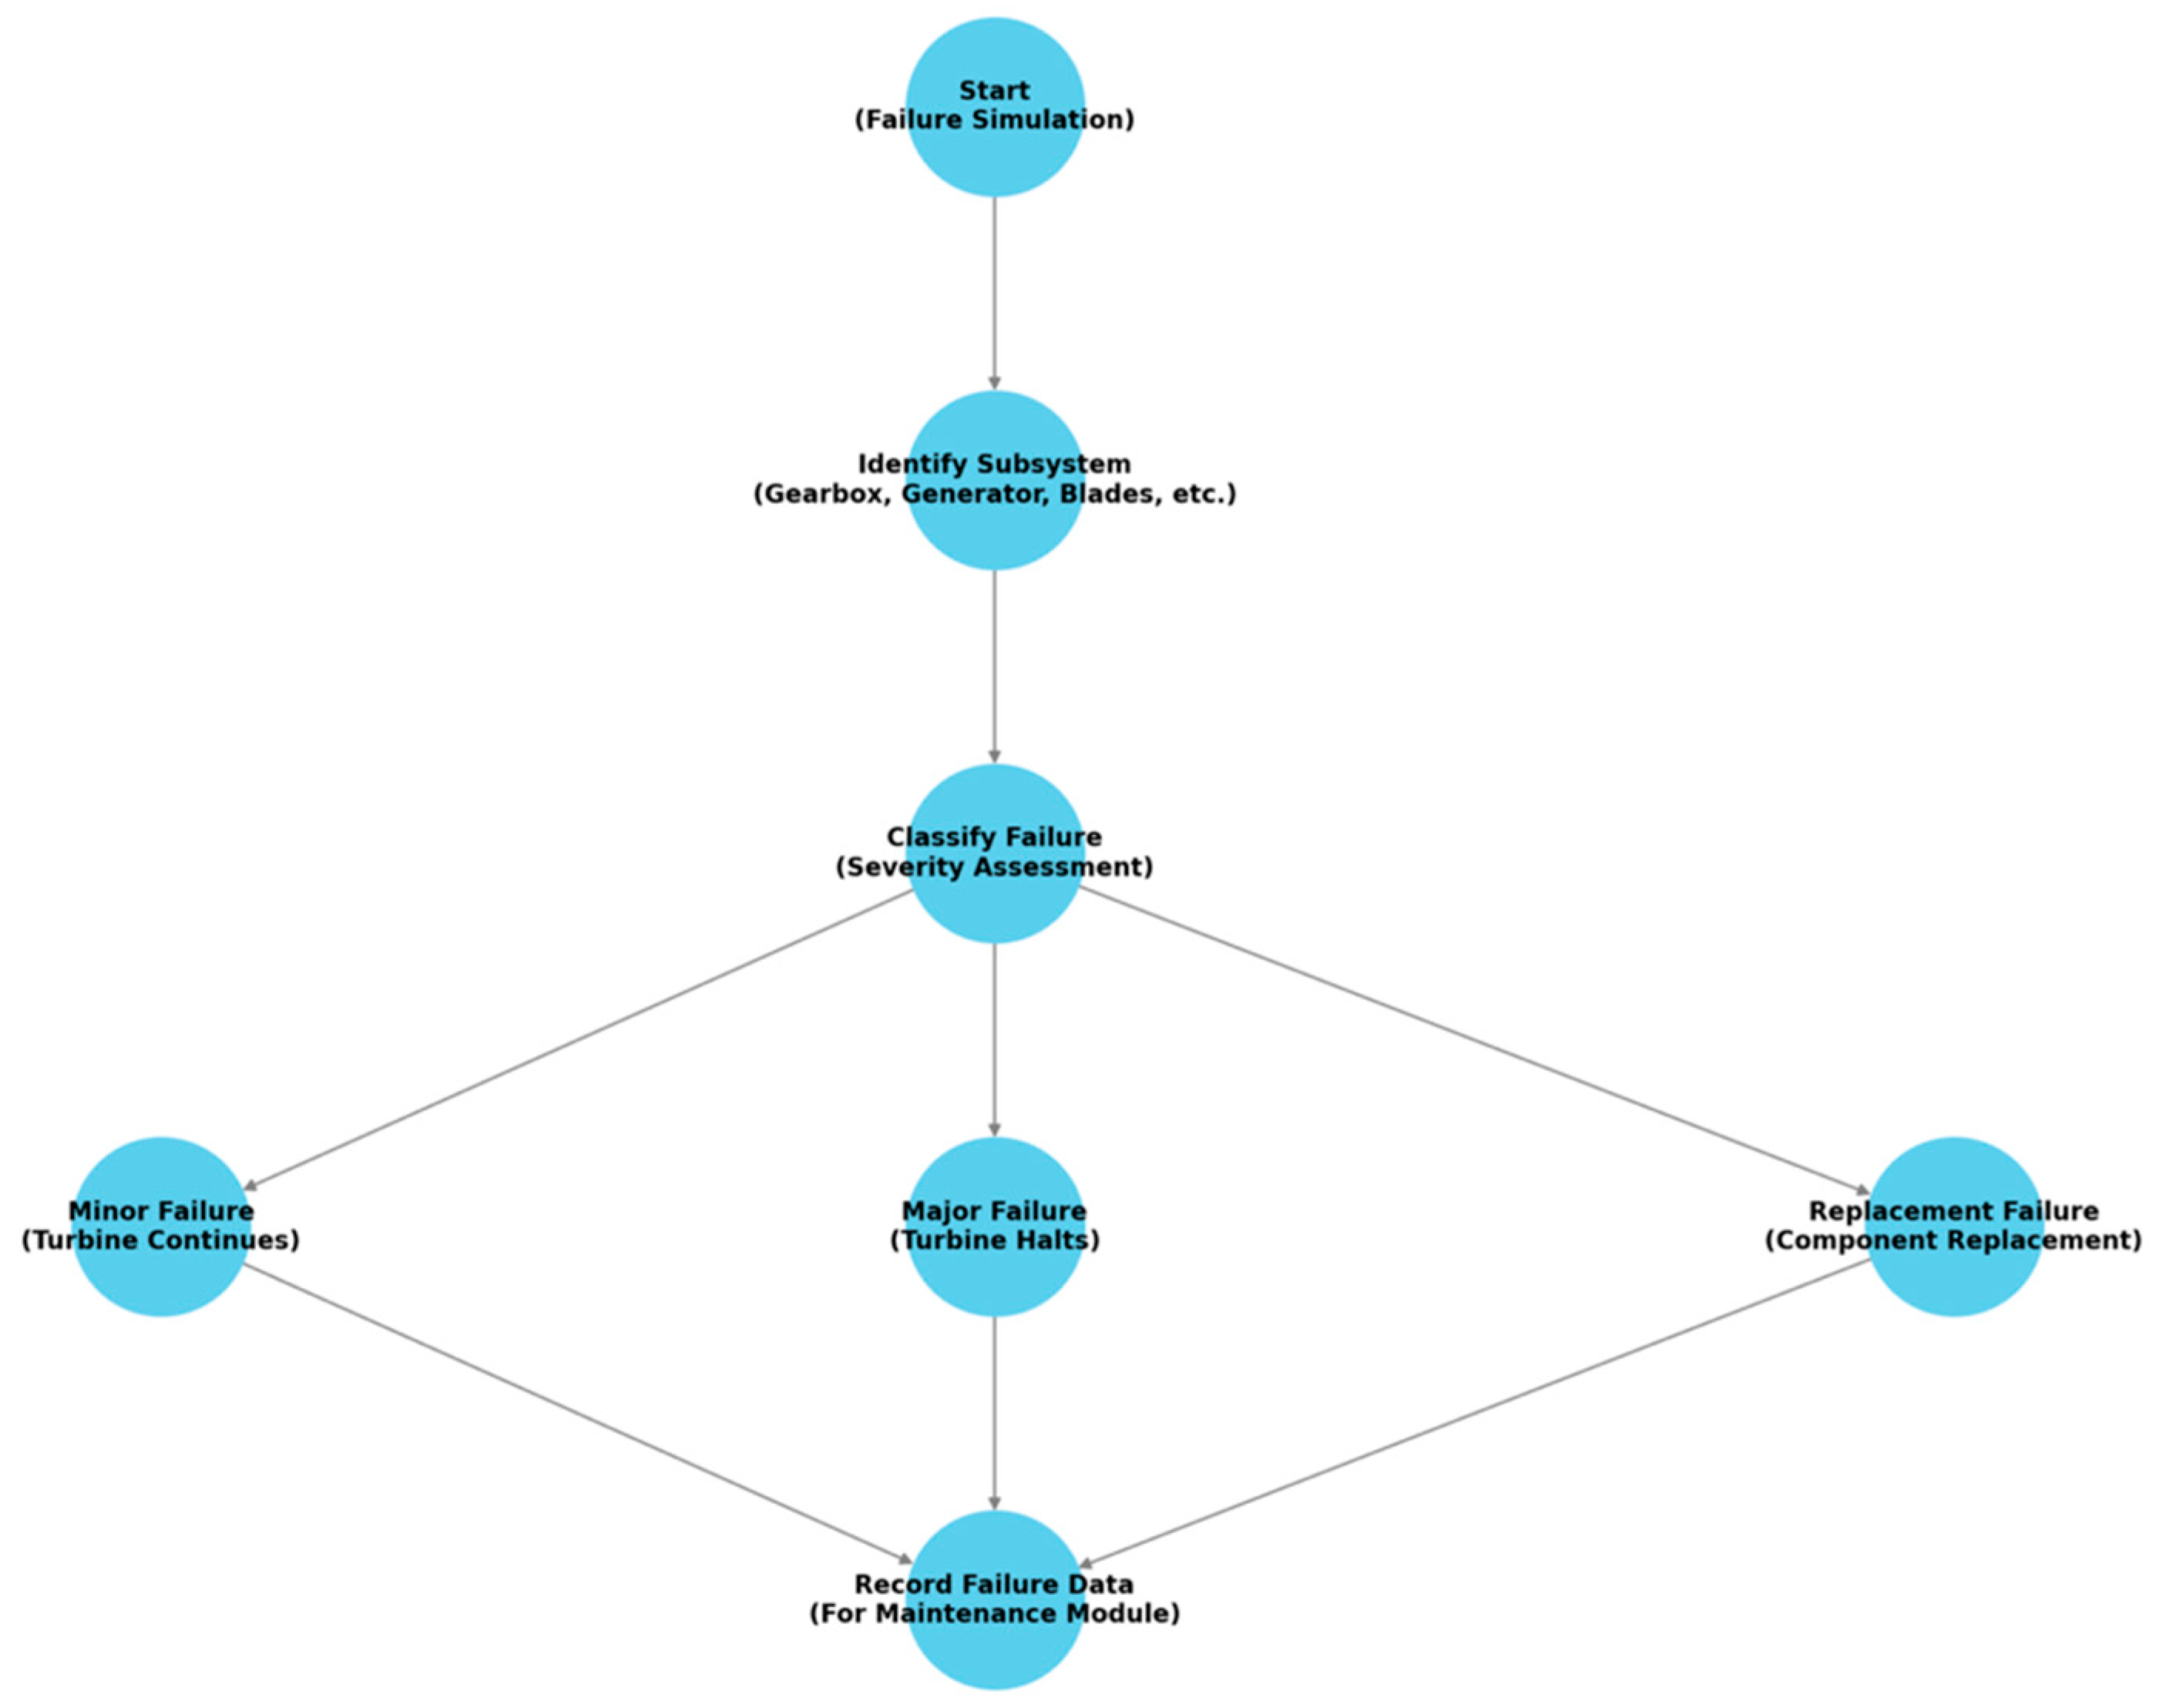
3.2.2. Failure Module
3.2.3. Maintenance Module
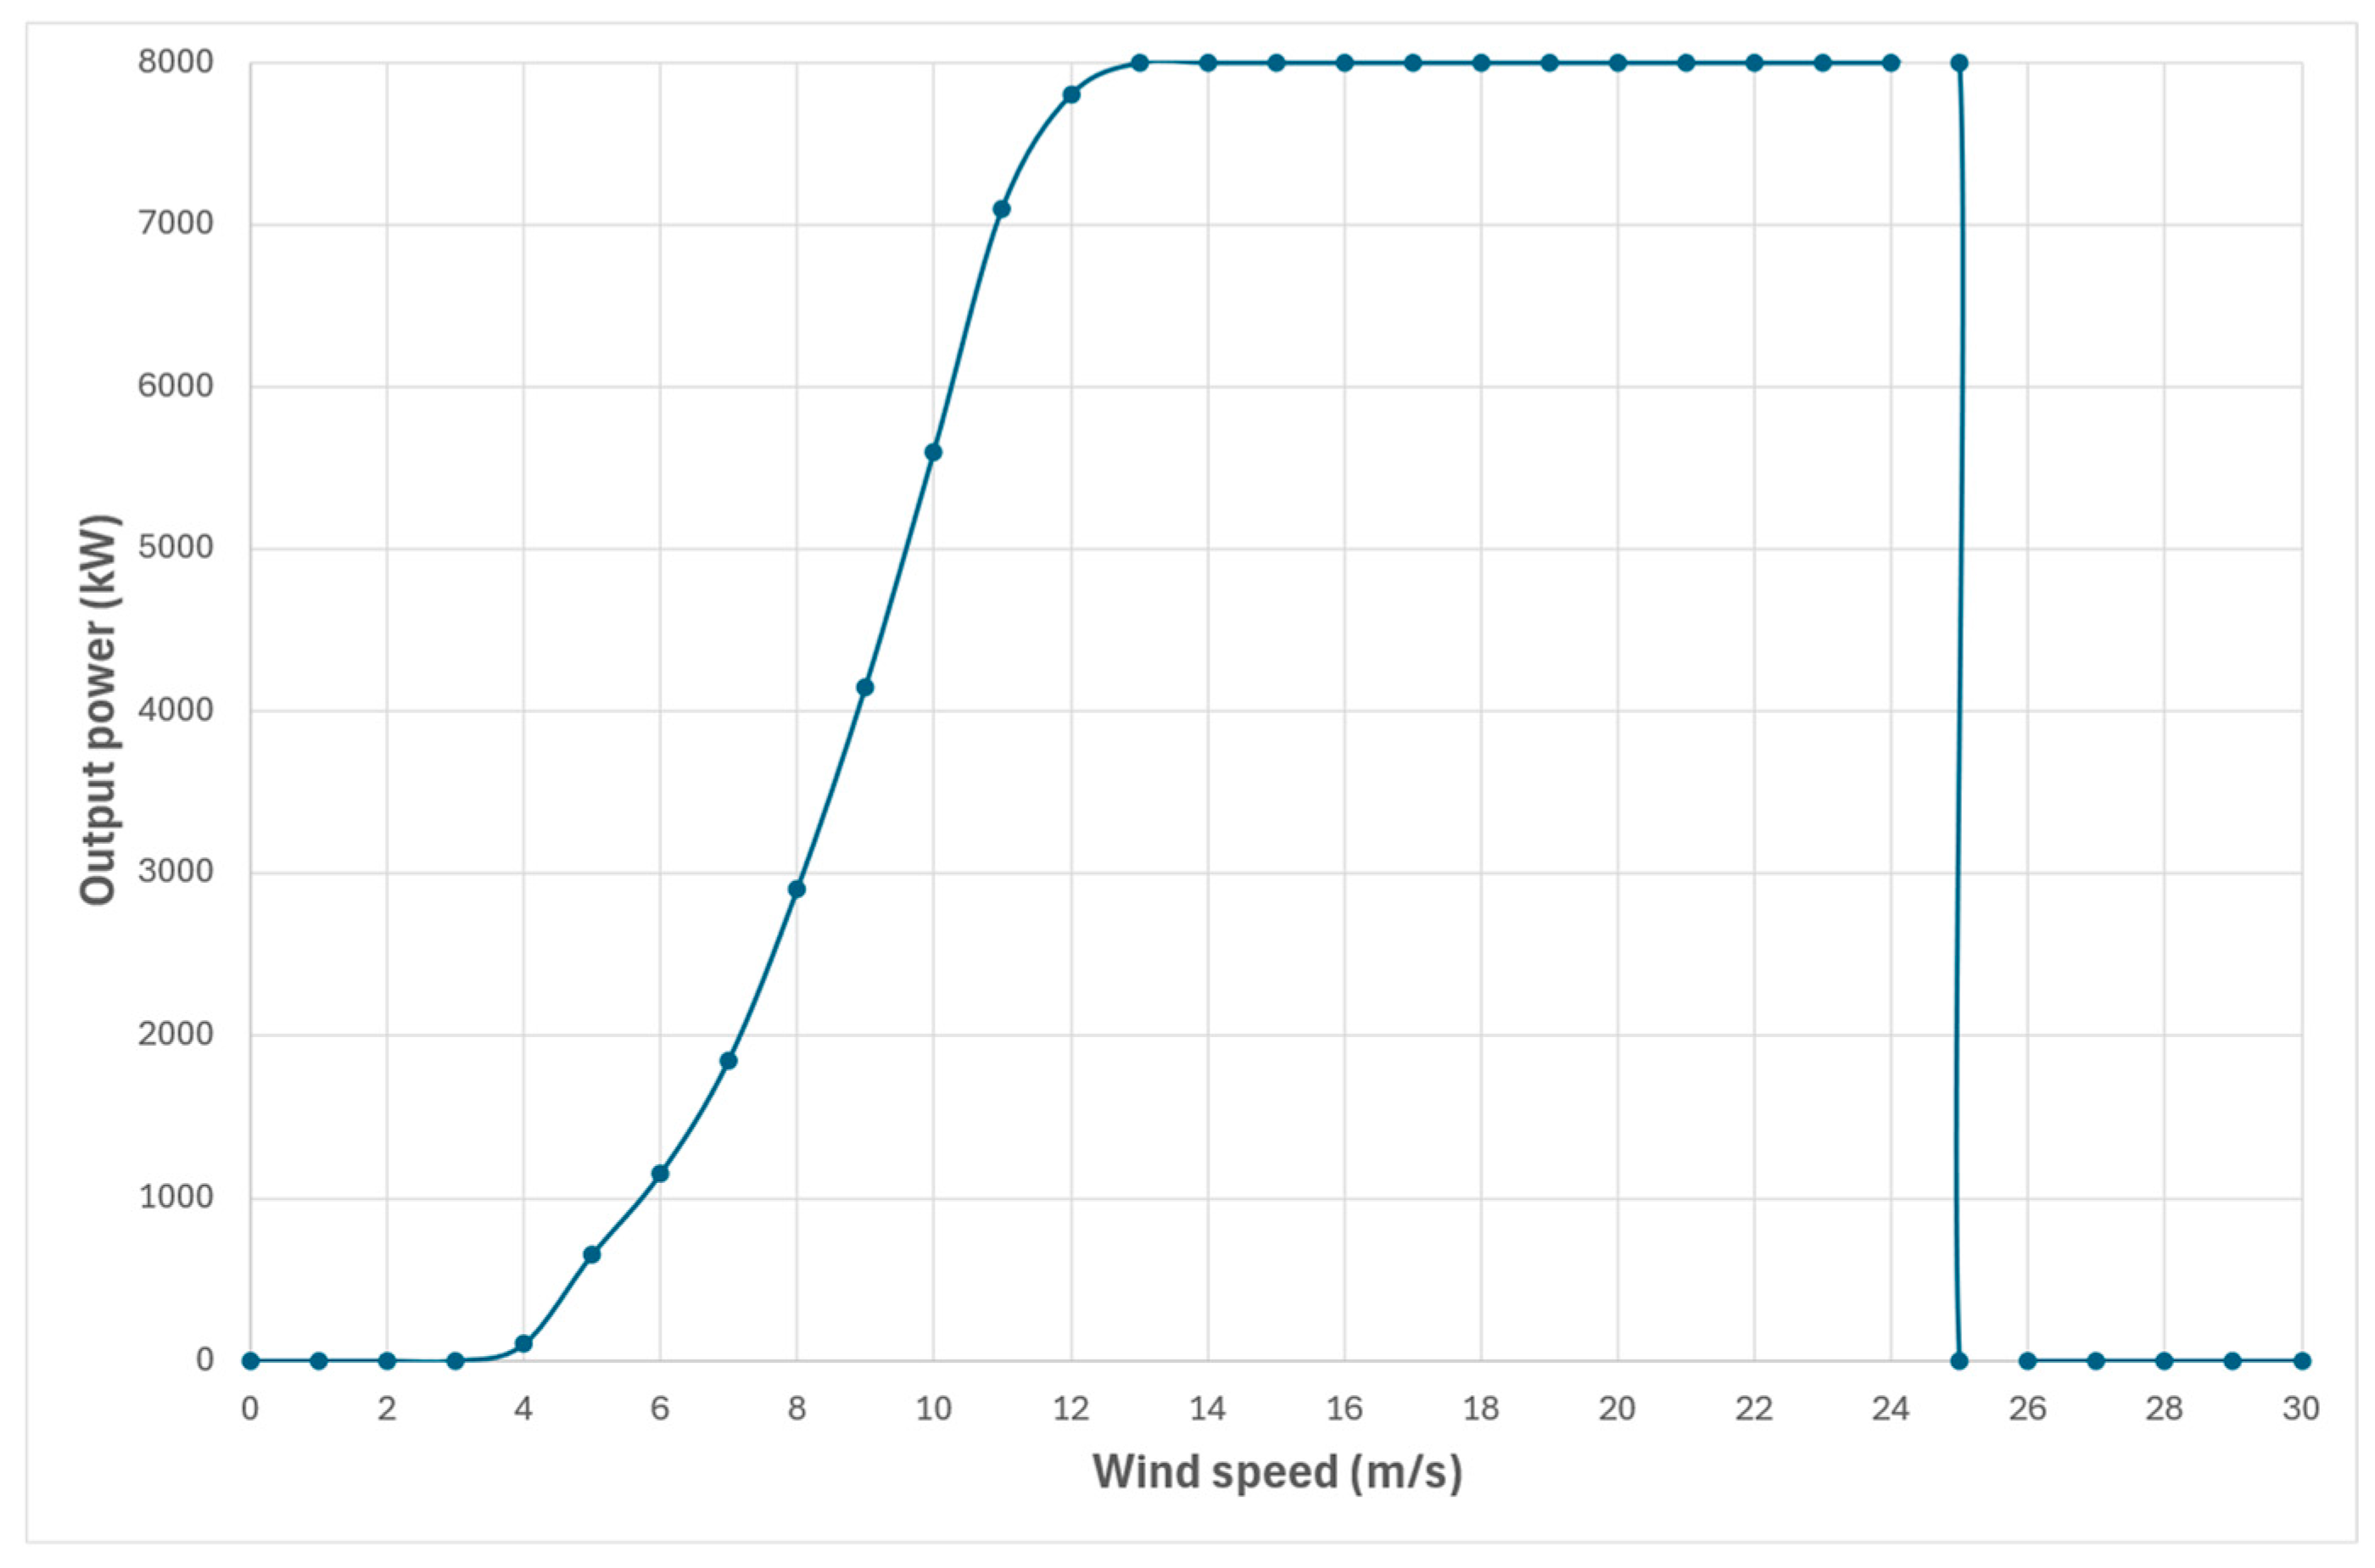
3.2.4. Power Module
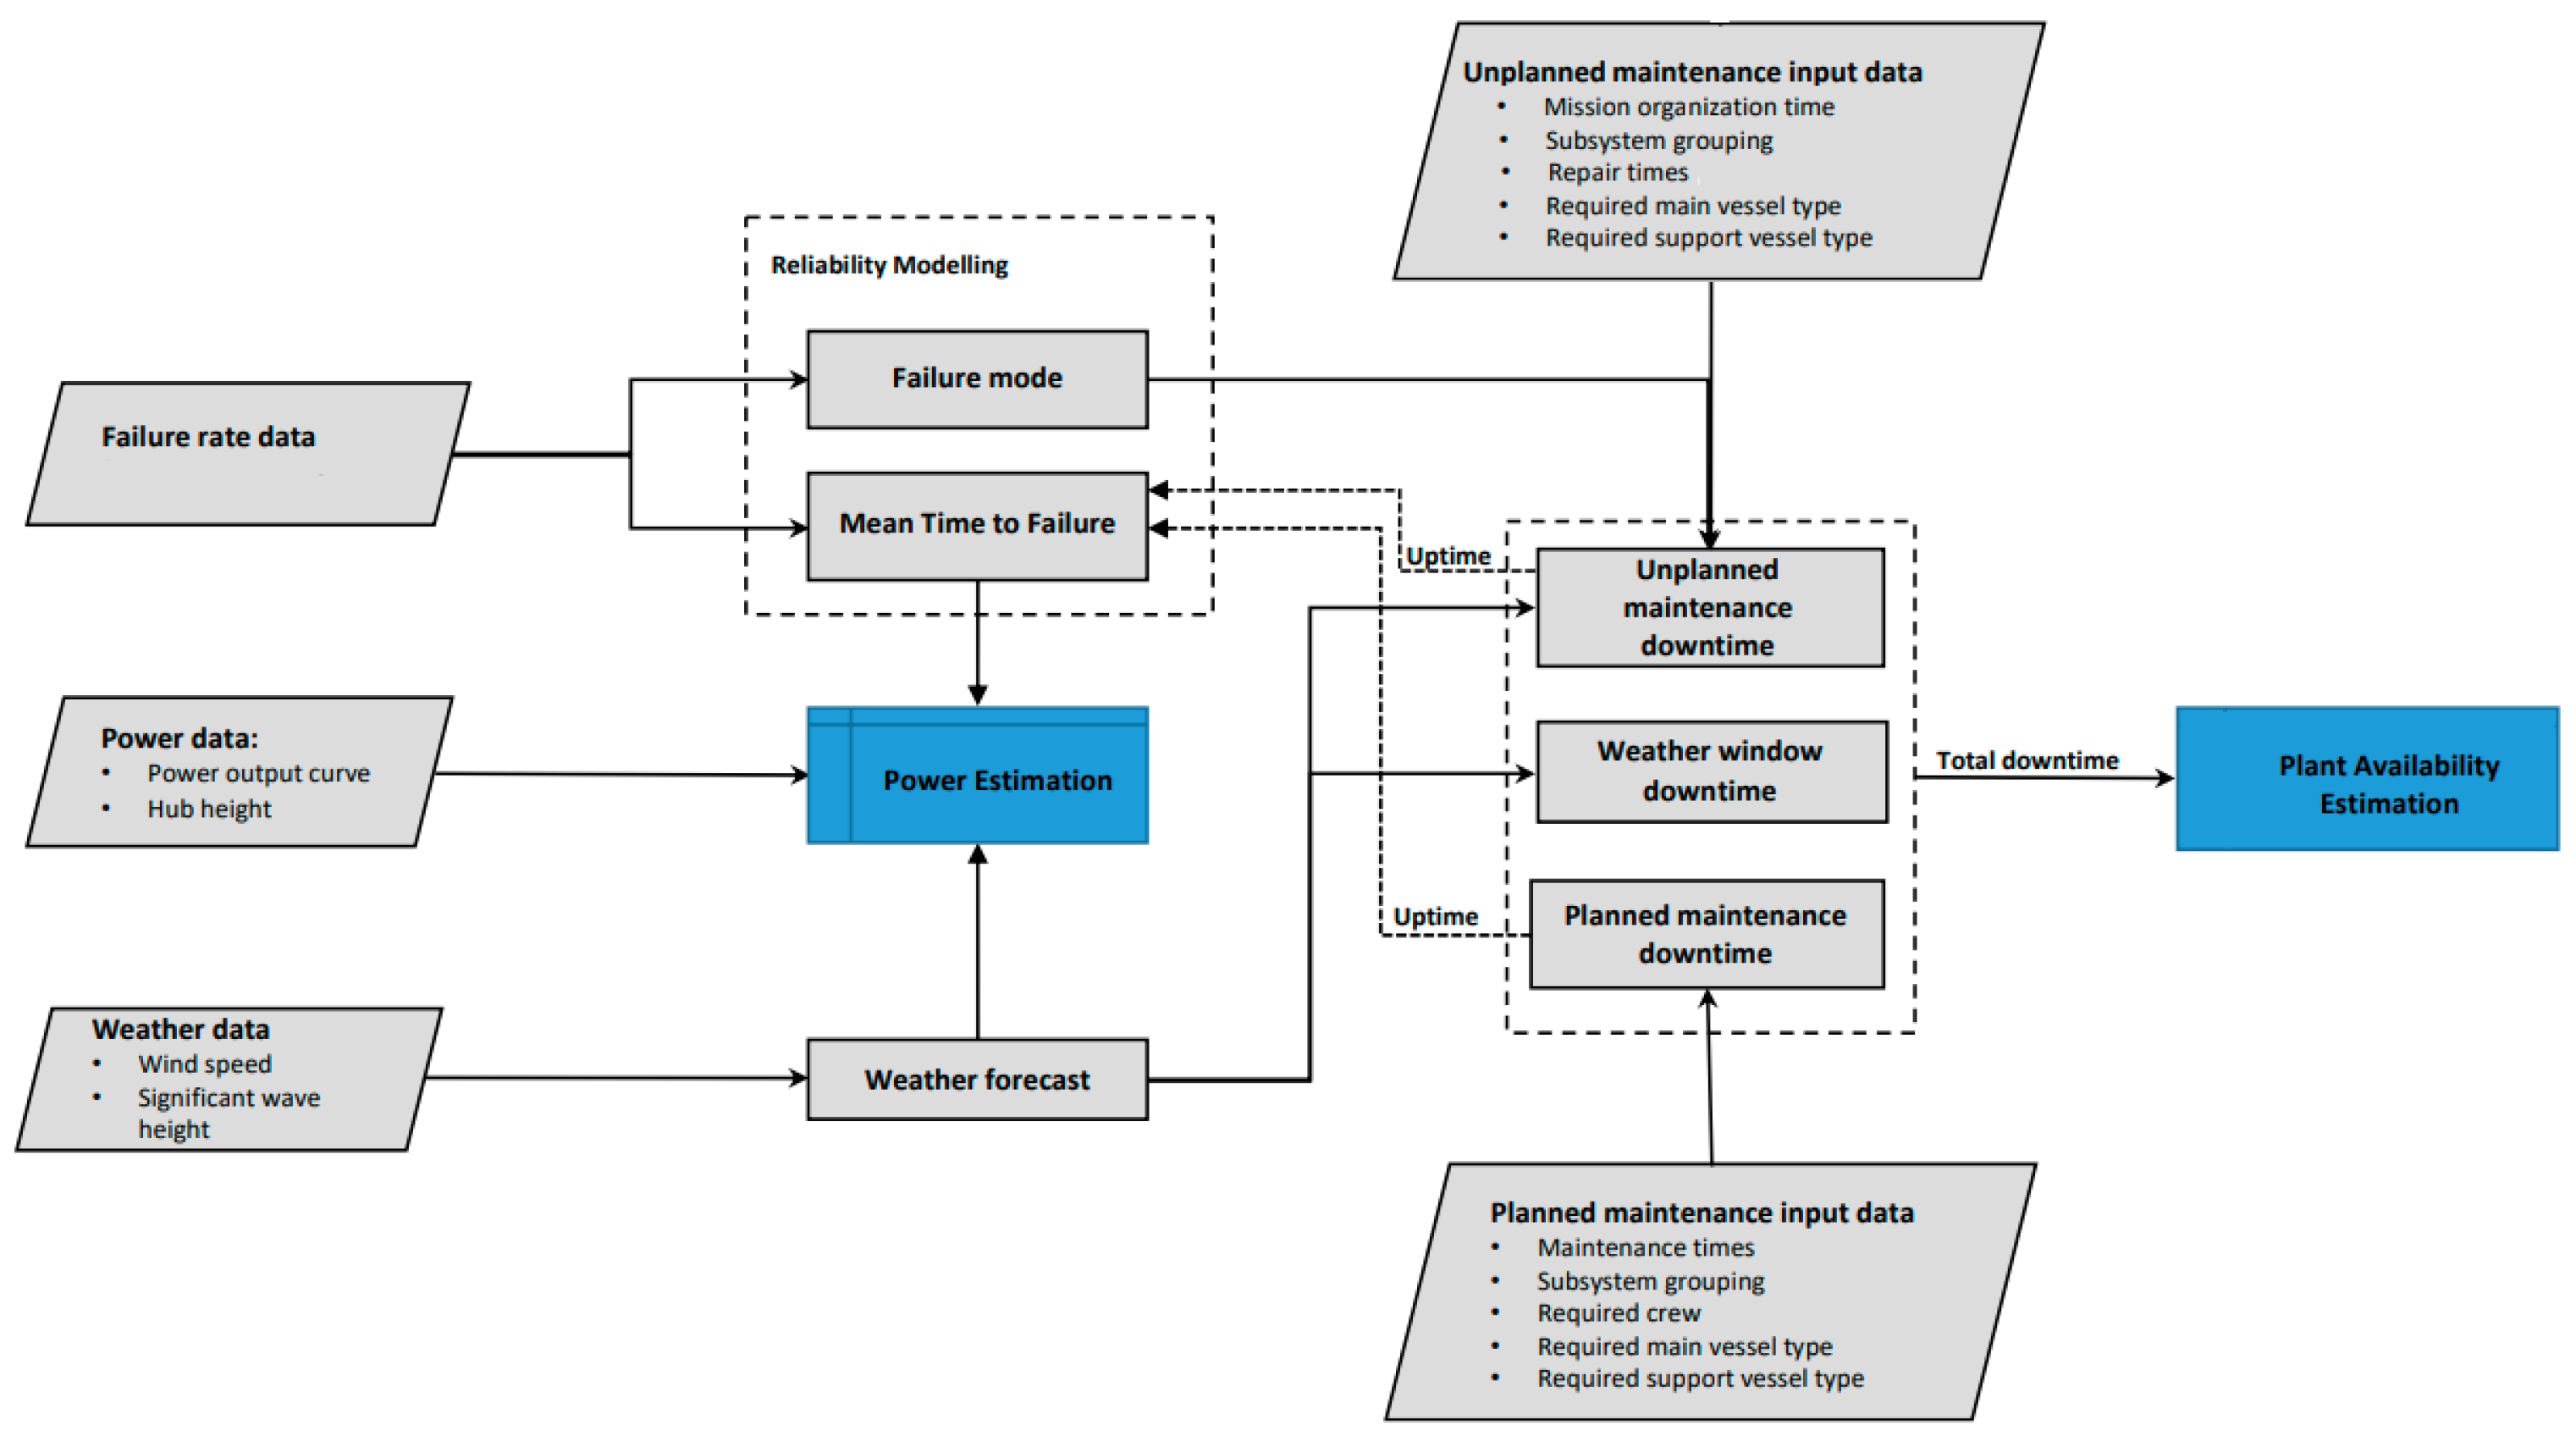
3.2.5. Summary
- Weather simulation—The first step involves generating synthetic weather data for the desired lifetime of the wind farm. This step is essential because the weather significantly impacts both turbine operations and maintenance activities.
- Failure simulation—Next, the tool simulates the occurrence of failures at specific timesteps for each turbine. The occurrence of these failures is based on historical failure data, providing a realistic representation of the types and frequency of failures that might occur in the wind farm.
- Maintenance simulation—For each simulated failure, the tool calculates the response by the O&M team. This includes estimating the costs associated with repairing the failure and the downtime for the turbine while the failure is being addressed. Downtime here refers to the period during which the turbine is non-operational due to failure and subsequent maintenance.
- Power generation—The simulation tool also keeps a record of the periods when each turbine is operational. With the wind speed data generated in the first step, the tool can then calculate the power generated by each turbine during its operational periods.
- Iteration and analysis—The entire simulation is repeated multiple times, with the results of each iteration saved for further analysis. This allows for a thorough examination of both individual iterations and the average values across all iterations.
3.3. Data Collection
3.4. Economic Analysis
4. Results and Discussion
4.1. Inputs and General Considerations
- Wind farm configuration—The simulated wind farm was composed of three VESTAS V164.8MW turbines, representing a small-scale offshore wind farm.
- Distance from shore—The wind farm was assumed to be located 20 km from the shore. This distance affects the time taken to reach the turbines during the inspections.
- Vessel speed—A vessel speed of 20 km/h was assumed for maintenance operations. This speed affects the time required to reach the wind farm from the shore and return.
- Simulation time frame—The simulation was run for 20 years, representing the typical lifetime of an offshore wind farm.
- Starting weather conditions—The initial weather conditions were set to a wave height of 1.5 m and a wind speed of 10 m/s. These starting conditions would trigger the generation of weather values, based on the Markov Chains simulation.
- Planned maintenance schedule—A planned maintenance inspection was scheduled for each turbine once a year, starting in the months of July and August. For the robotized solutions, an additional inspection was scheduled twice a year.
- Maximum safe weather conditions—The maximum safe weather conditions for maintenance operations were set to a wind speed of 15 m/s and a wave height of 2.5 m. These conditions determine when maintenance operations can be safely carried out.
- Prices and costs—The average repair costs for each type of failure were retrieved from [30], additionally, average technician costs were set to 82,886 €/year. The vessel charter cost was set to 3340 €/day. The vessel fuel costs were set to 1.5 €/L These values were obtained from [34,35]. Additionally, values for failure rates were taken from [30].
4.2. Tool Validation
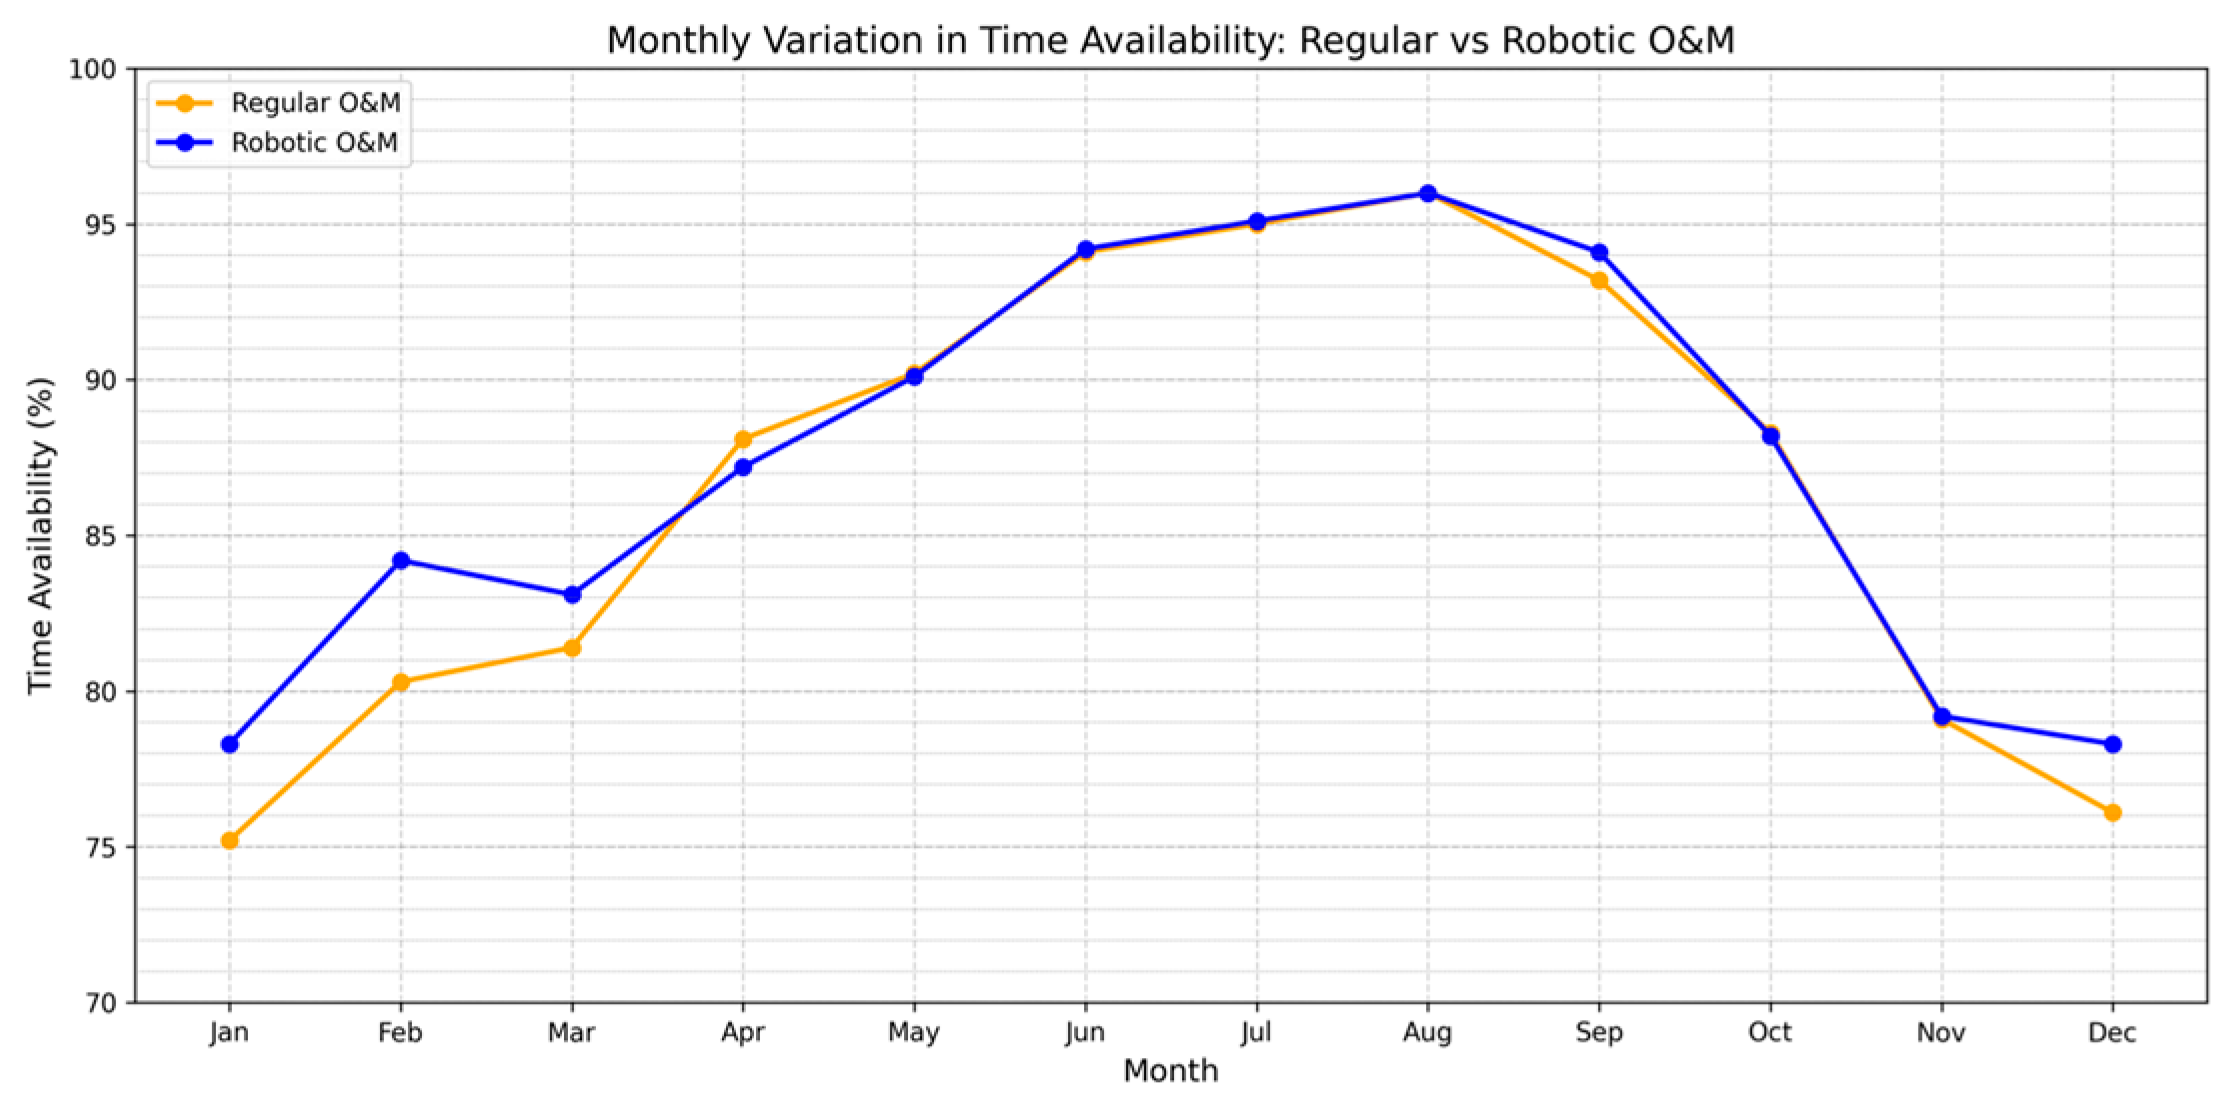
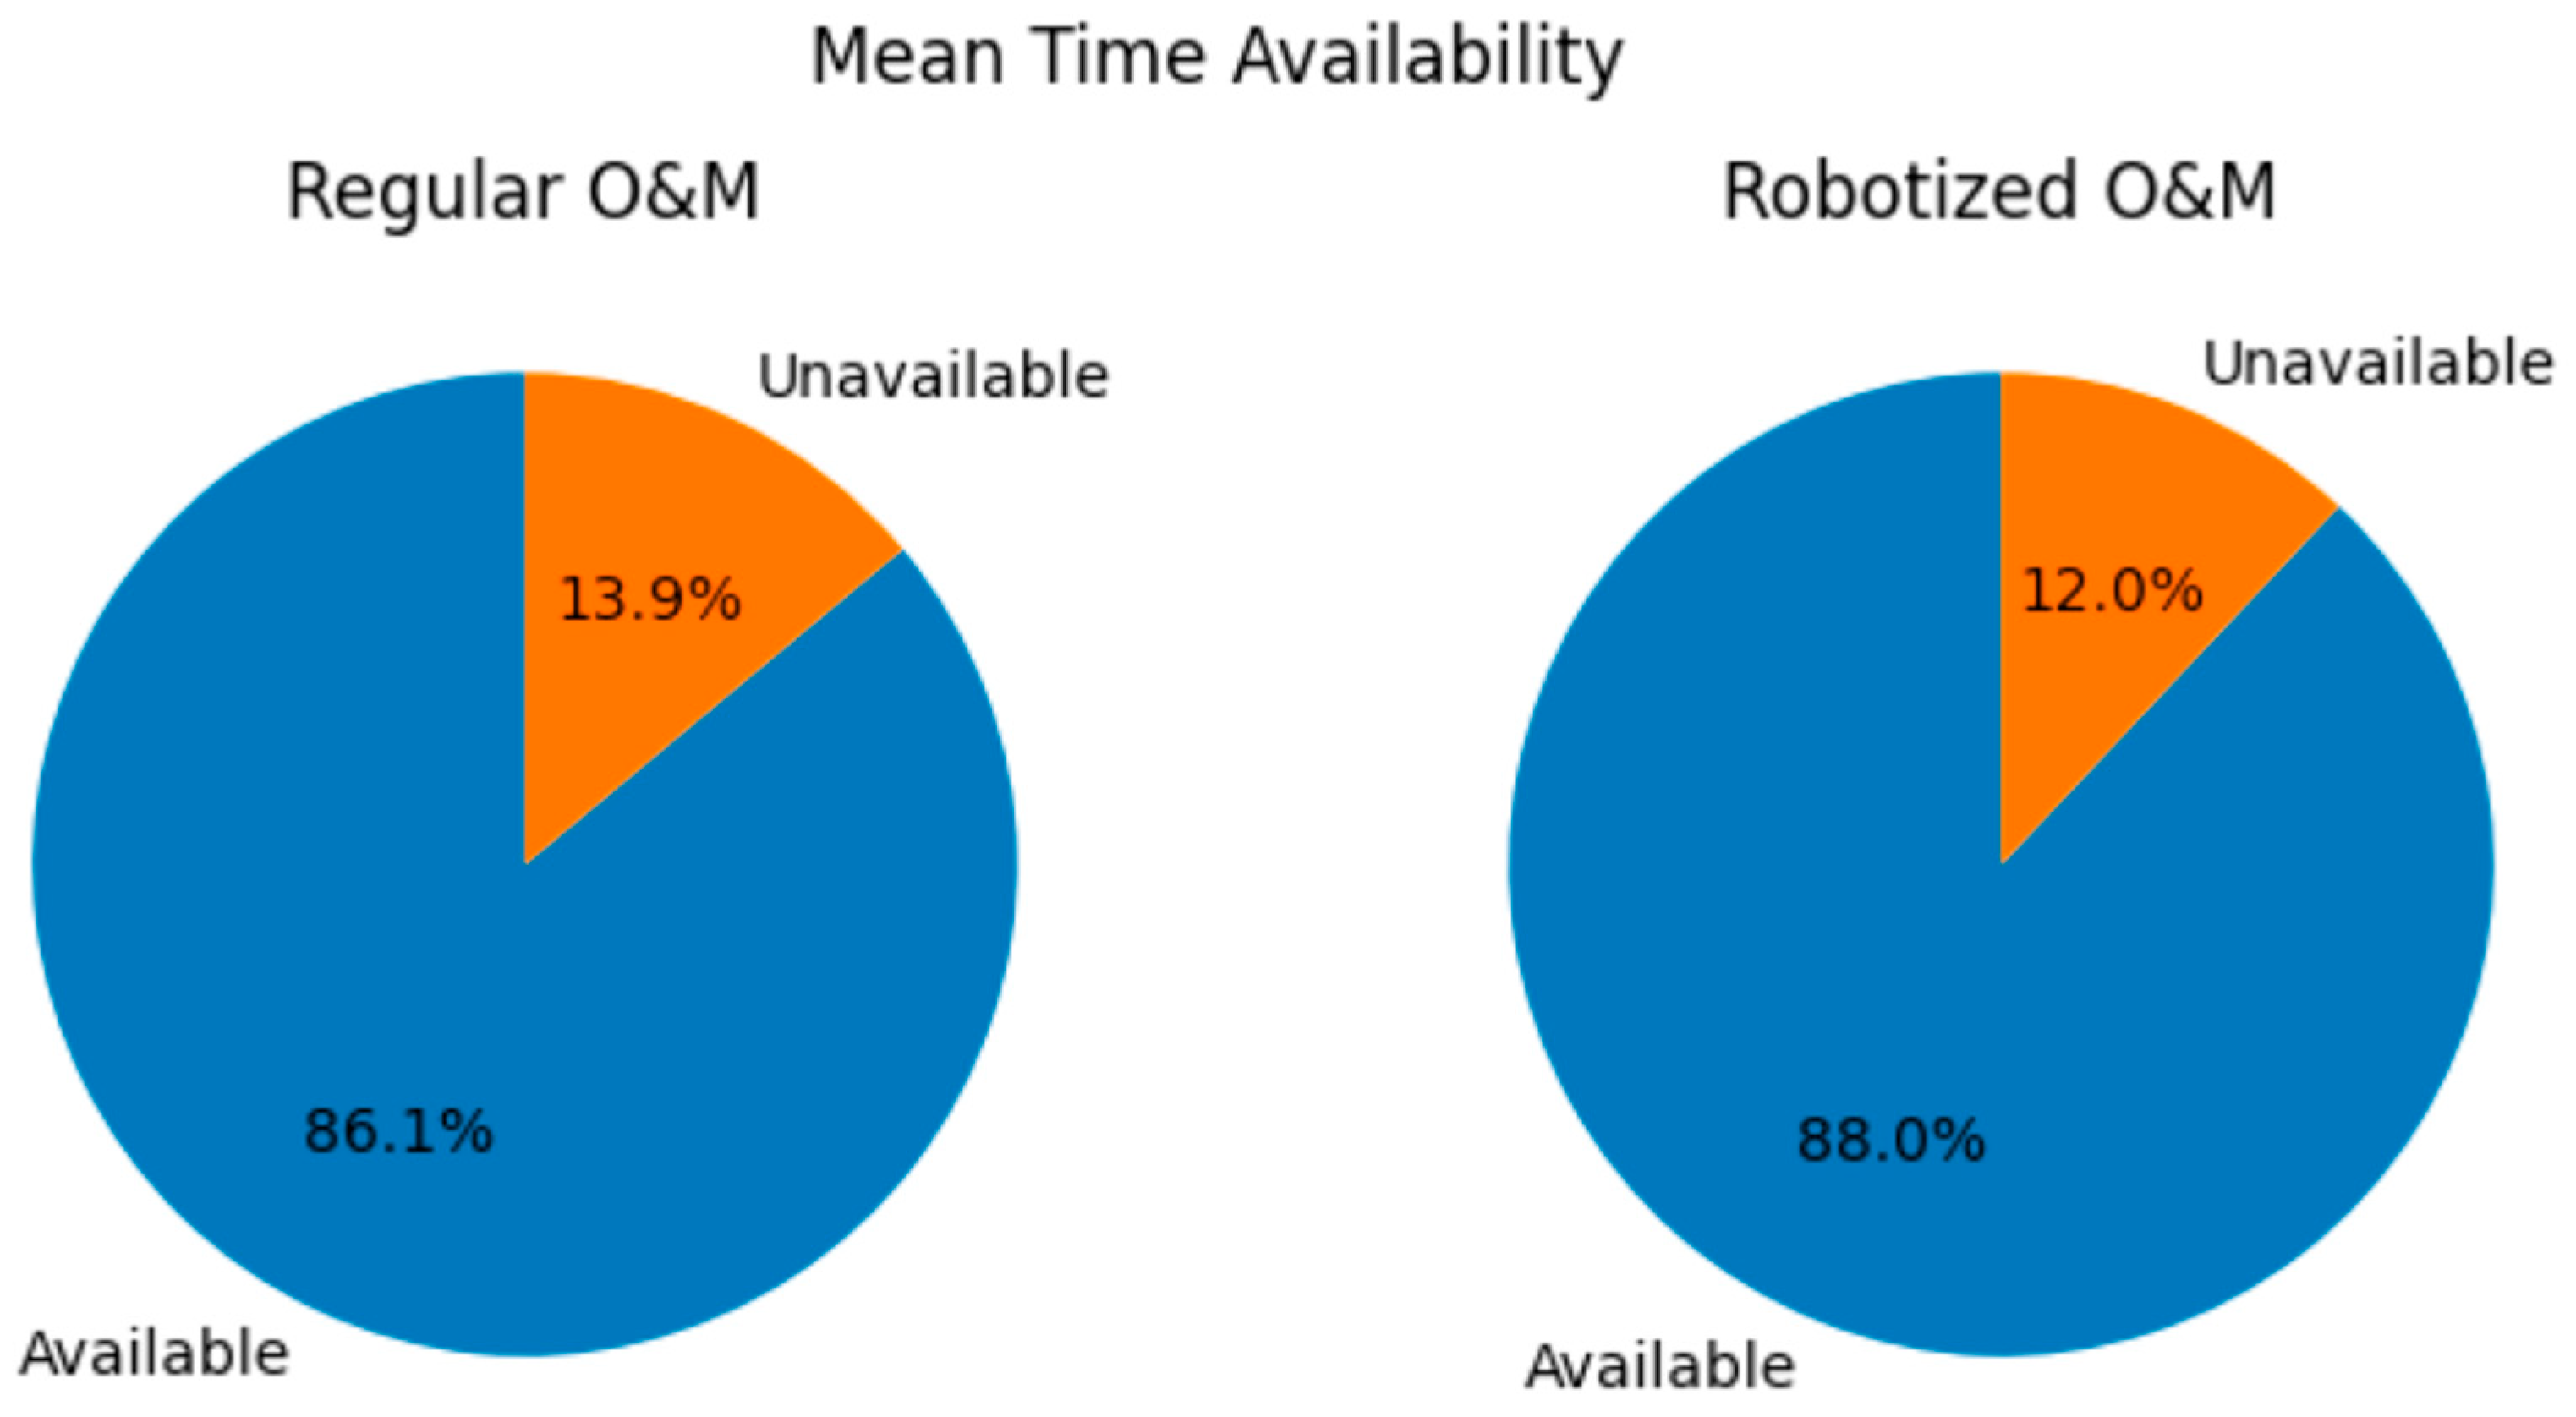
4.3. Time-Based Availability
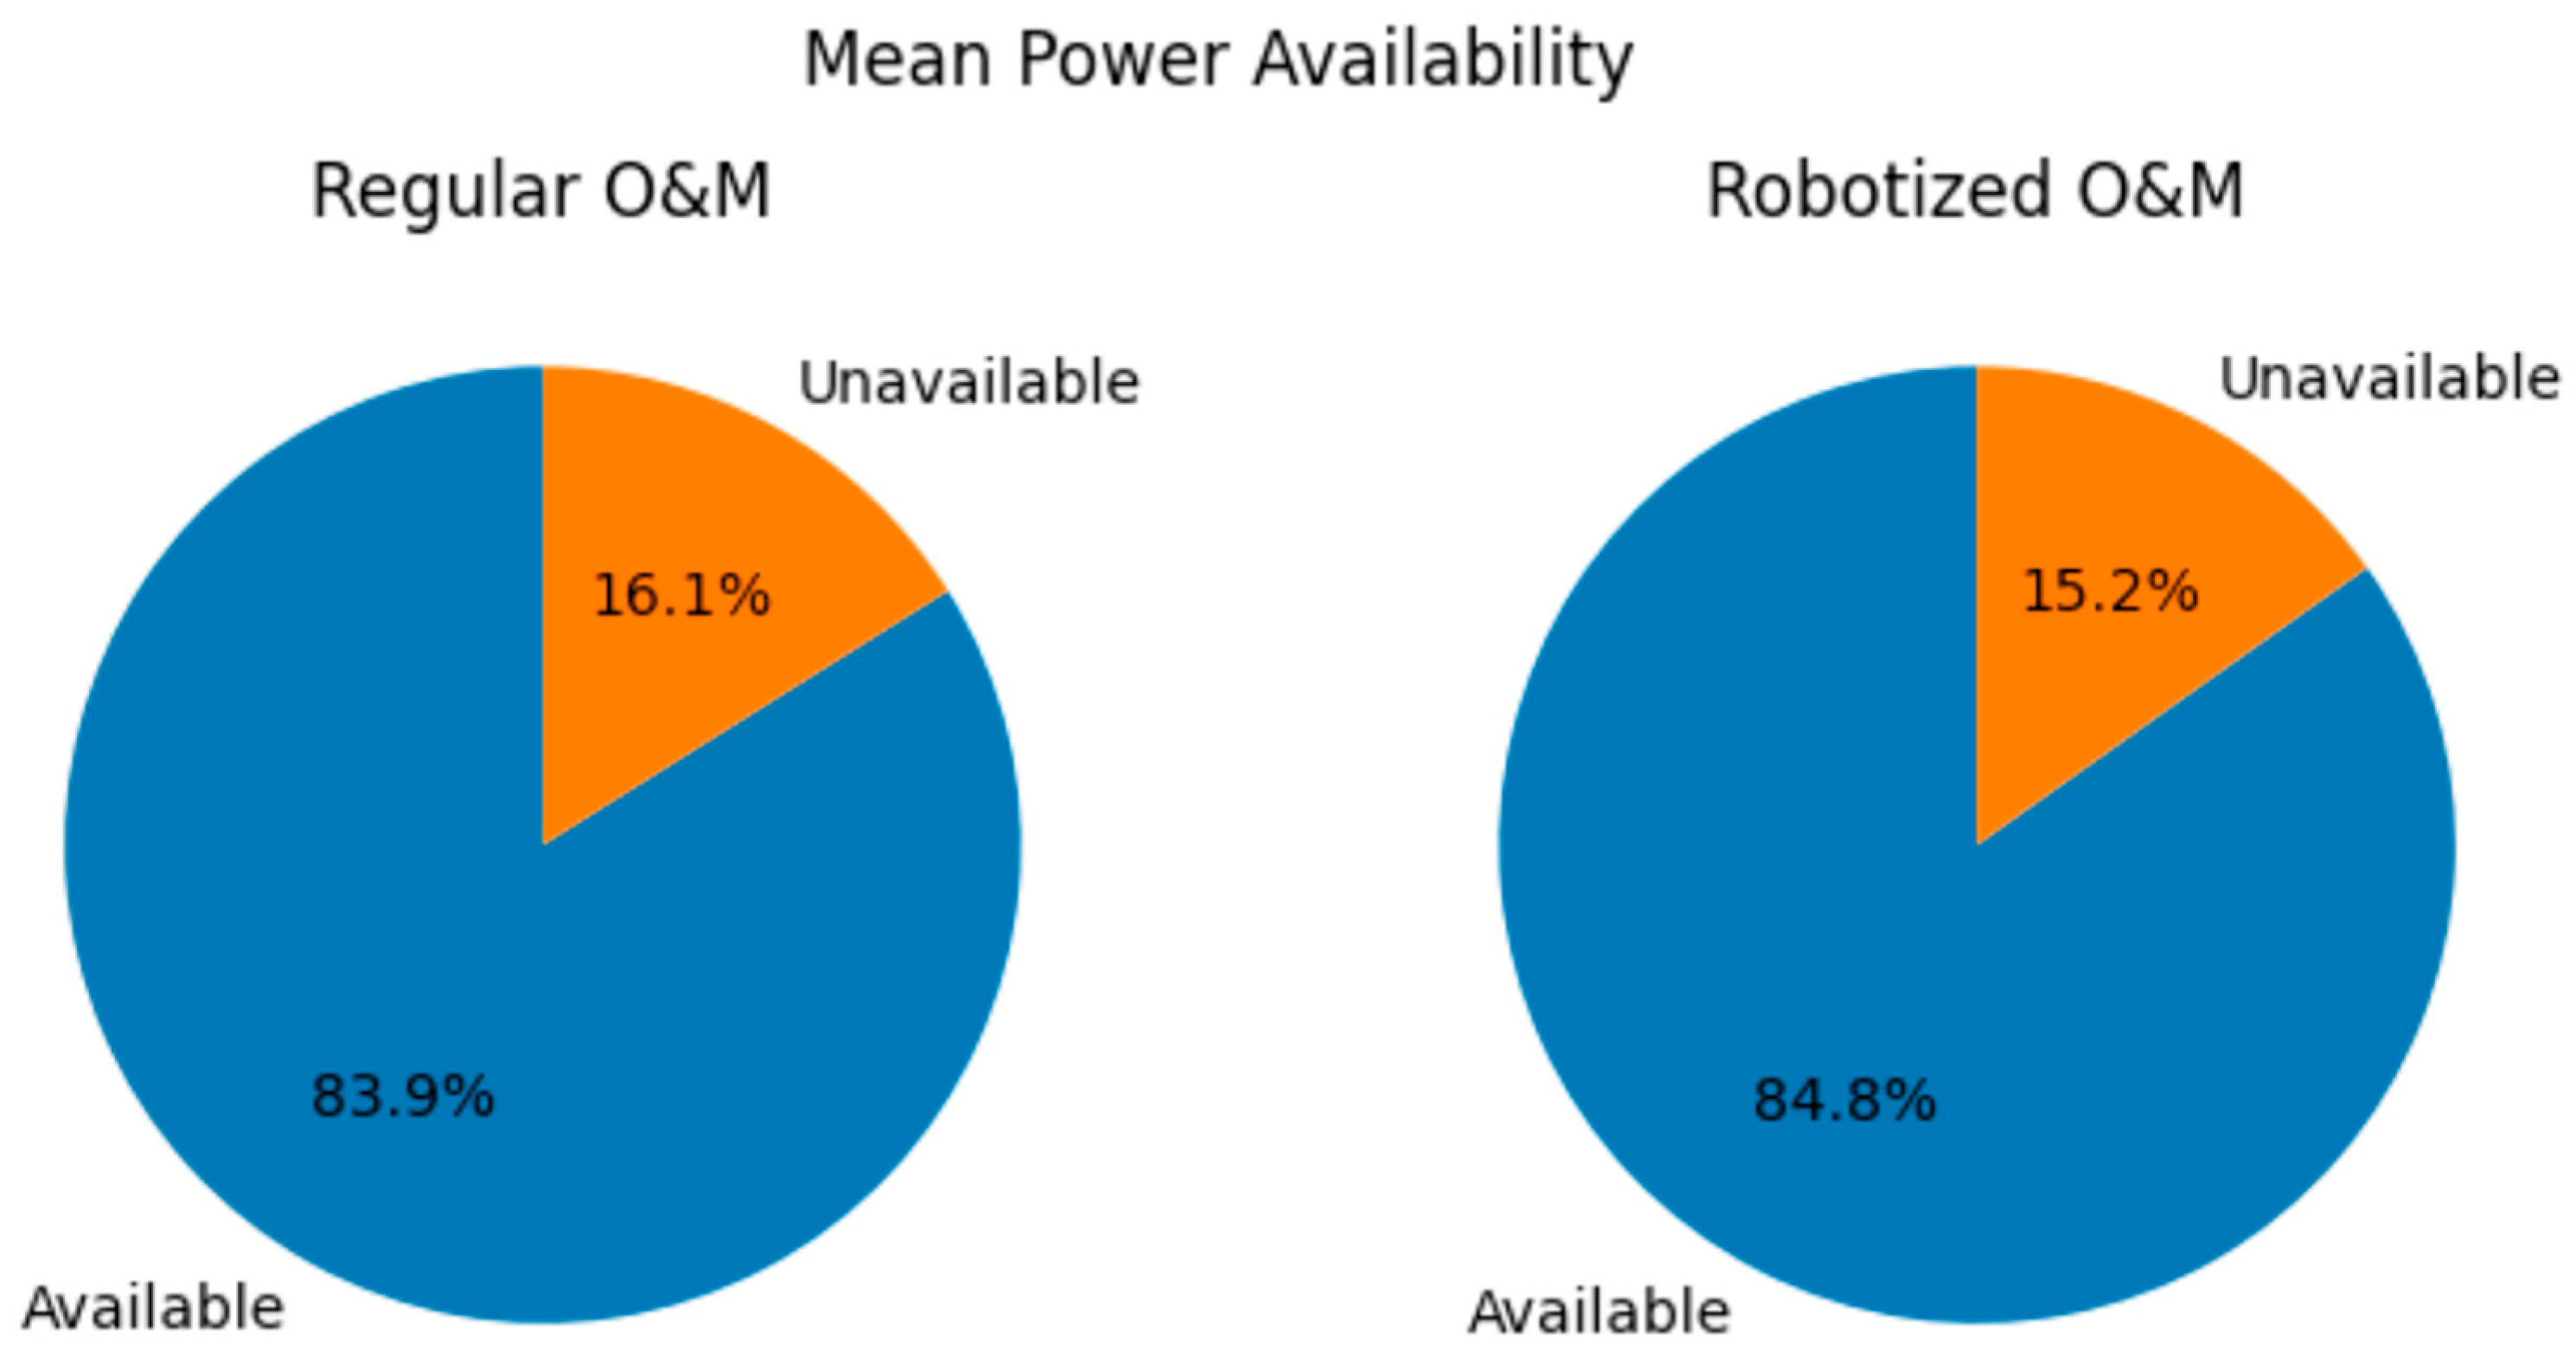
4.4. Power-Based Availability
4.5. O&M Costs
5. Conclusions
- Higher availability—The robotics O&M solution showed a higher time availability (88.0%) and power availability (84.8%) compared to regular O&M solutions (86.1% and 83.9%, respectively). Although it might seem small, this seemingly minor improvement has a significant impact. Over the lifespan of the wind farm, which was 20 years, this additional operational time accumulates, so a 2% increase in availability would result in an additional 3500 h of operation. This difference is largely due to robots’ ability to identify faults earlier, leading to reduced repair times and less downtime.
- Lower O&M costs—Despite slightly higher fuel costs due to additional inspections, the robotics solution resulted in lower repair costs (17% lower). This reduction in costs, coupled with a higher power availability, clearly demonstrates the cost-effectiveness of robotic solutions.
- Reduced lost revenue: The robotics solution also resulted in lower lost revenue costs. This is a direct consequence of the higher power availability, as less downtime translates into less lost power and thus less lost revenue. In our case, the reduction was 5.6% in comparison to regular O&M.
Author Contributions
Funding
Institutional Review Board Statement
Informed Consent Statement
Data Availability Statement
Acknowledgments
Conflicts of Interest
Appendix A

| Component | Failure Mode | Failure Rate | Average Repair Time (h) | Average Cost (€) |
|---|---|---|---|---|
| Pitch/Hyd | Minor | 0.824 | 9 | 210 |
| Pitch/Hyd | Major | 0.179 | 19 | 1900 |
| Pitch/Hyd | Replacement | 0.001 | 25 | 14,000 |
| Other Components | Minor | 0.812 | 5 | 110 |
| Other Components | Major | 0.042 | 21 | 2400 |
| Other Components | Replacement | 0.001 | 36 | 10,000 |
| Generator | Minor | 0.485 | 7 | 160 |
| Generator | Major | 0.321 | 24 | 3500 |
| Generator | Replacement | 0.095 | 81 | 60,000 |
| Gearbox | Minor | 0.395 | 8 | 125 |
| Gearbox | Major | 0.038 | 22 | 2500 |
| Gearbox | Replacement | 0.154 | 231 | 230,000 |
| Blades | Minor | 0.456 | 9 | 170 |
| Blades | Major | 0.01 | 221 | 1500 |
| Blades | Replacement | 0.001 | 288 | 90,000 |
| Grease/Oil/Cooling Liquid | Minor | 0.407 | 4 | 160 |
| Grease/Oil/Cooling Liquid | Major | 0.006 | 18 | 2000 |
| Grease/Oil/Cooling Liquid | Replacement | 0.00001 | 0 | 0 |
| Electrical Components | Minor | 0.358 | 5 | 100 |
| Electrical Components | Major | 0.016 | 14 | 2000 |
| Electrical Components | Replacement | 0.002 | 18 | 12,000 |
| Contactor/Circuit Breaker/Relay | Minor | 0.326 | 4 | 260 |
| Contactor/Circuit Breaker/Relay | Major | 0.054 | 19 | 2300 |
| Contactor/Circuit Breaker/Relay | Replacement | 0.002 | 150 | 13,500 |
| Controls | Minor | 0.355 | 8 | 200 |
| Controls | Major | 0.054 | 14 | 2000 |
| Controls | Replacement | 0.001 | 12 | 13,000 |
| Safety | Minor | 0.373 | 2 | 130 |
| Safety | Major | 0.004 | 7 | 2400 |
| Safety | Replacement | 0.00001 | 0 | 0 |
| Sensors | Minor | 0.247 | 8 | 150 |
| Sensors | Major | 0.07 | 6 | 2500 |
| Sensors | Replacement | 0.00001 | 0 | 0 |
| Pumps/Motors | Minor | 0.278 | 4 | 330 |
| Pumps/Motors | Major | 0.043 | 10 | 2000 |
| Pumps/Motors | Replacement | 0.00001 | 0 | 0 |
| Hub | Minor | 0.182 | 10 | 160 |
| Hub | Major | 0.038 | 40 | 1500 |
| Hub | Replacement | 0.001 | 298 | 95,000 |
| Heaters/Coolers | Minor | 0.19 | 5 | 465 |
| Heaters/Coolers | Major | 0.007 | 14 | 1300 |
| Heaters/Coolers | Replacement | 0.00001 | 0 | 0 |
| Yaw System | Minor | 0.162 | 5 | 140 |
| Yaw System | Major | 0.006 | 20 | 3000 |
| Yaw System | Replacement | 0.001 | 49 | 12,500 |
| Tower | Minor | 0.092 | 5 | 140 |
| Tower | Major | 0.089 | 2 | 1100 |
| Tower | Replacement | 0.00001 | 0 | 0 |
| Power Converter | Minor | 0.076 | 7 | 240 |
| Power Converter | Major | 0.081 | 14 | 5300 |
| Power Converter | Replacement | 0.005 | 57 | 13,000 |
| Service Items | Minor | 0.108 | 7 | 80 |
| Service Items | Major | 0.00001 | 24 | 1200 |
| Service Items | Replacement | 0.00001 | 0 | 0 |
| Transformer | Minor | 0.052 | 7 | 95 |
| Transformer | Major | 0.003 | 26 | 2300 |
| Transformer | Replacement | 0.001 | 1 | 70,000 |
References
- European Commission. An EU Strategy to Harness the Potential of Offshore Renewable Energy for a Climate-Neutral Future. Available online: https://eur-lex.europa.eu/legal-content/EN/TXT/?uri=COM:2020:741:FIN&qid=1605792629666 (accessed on 30 September 2024).
- Gray, A. What Are Operations and Maintenance Simulation Tools? 2020. Available online: https://ore.catapult.org.uk/wp-content/uploads/2020/08/OM_Model_Review_Paper_FINAL-2.pdf (accessed on 30 September 2024).
- Andrawus, J.A. Maintenance Optimisation for Wind Turbines. Ph.D. Thesis, Robert Gordon University, Aberdeen, UK, 2008. Available online: https://core.ac.uk/download/pdf/222839038.pdf (accessed on 30 September 2024).
- GL Garrad Hassan. 2013 A Guide to UK Offshore Wind Operations and Maintenance. Scottish Enterprise and The Crown Estate. Available online: https://kenburridge.com/wp-content/uploads/2014/05/Offshore-wind-guide-June-2013.pdf (accessed on 30 September 2024).
- Koltsidopoulos, A.; Wavell, D.; Gray, A. Quantifying the Impact of Robotics in Offshore Wind; Industry Insights Series; Offshore Renewable Energy Catapult: Blyth, UK, 2021; Available online: https://ore.catapult.org.uk/wp-content/uploads/2021/09/OWIH01_9501-OWIH-Deep-Dive-Robotics-compressed-2.pdf (accessed on 28 February 2025).
- Project Romeo. Deliverable Report D8.1: Review of Existing Cost and O&M Models, and Development of a High-Fidelity Cost/Revenue Model for Impact Assessment. 2018. Available online: https://romeoproject.eu/wp-content/uploads/2018/12/D8.1_ROMEO_Report-reviewing-exsiting-cost-and-OM-support-models.pdf (accessed on 30 September 2024).
- Obdam, T.; Braam, H.; Pieterman, R.V.D.; Rademakers, L. Properties of the O&M cost estimator (OMCE). Technical Report ECN-E--11-045. 2011. Available online: https://publications.tno.nl/publication/34629117/H5a2N6/e11045.pdf (accessed on 30 September 2024).
- Philips, J.; Morgan, C.; Jacquemin, J. Evaluating O&M strategies for offshore wind farms through simulation—The impact of wave climatology. In Proceedings of the OWEMES—European Seminar Offshore Wind and other Marine Renewable Energies in Mediterranean and European Seas. Resources, Technology and Applications, Rome, Italy, 20–22 April 2006. [Google Scholar]
- Hofmann, M.; Sperstad, I.B. NOWIcob—A tool for reducing the maintenance costs of offshore wind farms. Energy Procedia 2013, 35, 177–186. [Google Scholar] [CrossRef]
- Niemi, A.; Skobiej, B.; Kulev, N.; Sill Torres, F. Modeling Offshore Wind Farm Disturbances and Maintenance Service Responses within the Scope of Resilience. Reliab. Eng. Syst. Saf. 2024, 242, 109719. [Google Scholar] [CrossRef]
- Gutschi, C.; Furian, N.; Voessner, S.; Graefe, M.; Kolios, A. Evaluating the Performance of Maintenance Strategies: A Simulation-Based Approach for Wind Turbines. In Proceedings of the 2019 Winter Simulation Conference (WSC), National Harbor, MD, USA, 8–11 December 2019; pp. 1146–1157. [Google Scholar] [CrossRef]
- Netland, Ø.; Sperstad, I.B.; Hofmann, M.; Skavhaug, A. Cost-benefit evaluation of remote inspection of offshore wind farms by simulating the operation and maintenance phase. Energy Procedia 2014, 53, 239–247. [Google Scholar] [CrossRef]
- Netland, Ø.; Jenssen, G.D.; Skavhaug, A. The capabilities and effectiveness of remote inspection of wind turbines. Energy Procedia 2015, 80, 177–184. [Google Scholar] [CrossRef]
- Poleo, K.K.; Crowther, W.J.; Barnes, M. Estimating the impact of drone-based inspection on the levelised cost of electricity for offshore wind farms. Results Eng. 2021, 9, 100201. [Google Scholar] [CrossRef]
- Mitchell, D.; Blanche, J.; Harper, S.; Lim, T.; Gupta, R.; Zaki, O.; Tang, W.; Robu, V.; Watson, S.; Flynn, D. A review: Challenges and opportunities for artificial intelligence and robotics in the offshore wind sector. Energy AI 2022, 8, 100146. [Google Scholar] [CrossRef]
- Netland, Ø. Remote Inspection of Offshore Wind Turbines: A Study of the Benefits, Usability and Feasibility. Ph.D. Thesis, Norwegian University of Science and Technology, Torgarden, Norway, 2014. Available online: https://ntnuopen.ntnu.no/ntnu-xmlui/handle/11250/261141 (accessed on 30 September 2024).
- Bernardini, S.; Jovan, F.; Watson, S.; Weightman, A.; Moradi, P.; Richardson, T.; Sadeghian, R.; Sareh, S. A multi-robot platform for the autonomous operation and maintenance of offshore wind farms. In Proceedings of the 19th International Conference on Autonomous Agents and Multi-Agent Systems—AAMAS ’20, Auckland, New Zealand, 9–13 May 2020; pp. 1696–1700. [Google Scholar]
- Iqbal, J.; Al-Zahrani, A.; Alharbi, S.A.; Hashmi, A. Robotics inspired renewable energy developments: Prospective opportunities and challenges. IEEE Access 2019, 7, 174898–174923. [Google Scholar] [CrossRef]
- Mitchell, D.; Blanche, J.; Zaki, O.; Roe, J.; Kong, L.; Harper, S.; Robu, V.; Lim, T.; Flynn, D. Symbiotic system of systems design for safe and resilient autonomous robotics in offshore wind farms. IEEE Access 2021, 9, 141421–141452. [Google Scholar] [CrossRef]
- Maienza, C.; Avossa, A.; Ricciardelli, F.; Coiro, D.; Troise, G.; Georgakis, C. A life cycle cost model for floating offshore wind farms. Appl. Energy 2020, 266, 114716. [Google Scholar] [CrossRef]
- Bulder, B.H.; Swamy, S.K.; Warnaar, P.M.J. Pathways to Potential Cost Reductions for Offshore Wind Energy. 2021. Available online: https://publications.tno.nl/publication/34637553/S0BkPF/TNO-2020-R11926.pdf (accessed on 30 September 2024).
- Fahrni, L.; Thies, P.; Johanning, L.; Cowles, J. Scope and Feasibility of Autonomous Robotic Subsea Intervention Systems for Offshore Inspection, Maintenance and Repair. 2018. Available online: http://hdl.handle.net/10871/34856 (accessed on 30 September 2024).
- Shafiee, M.; Zhou, Z.; Mei, L.; Dinmohammadi, F.; Karama, J.; Flynn, D. Unmanned aerial drones for inspection of offshore wind turbines: A mission-critical failure analysis. Robotics 2021, 10, 26. [Google Scholar] [CrossRef]
- Ren, Z.; Verma, A.S.; Li, Y.; Teuwen, J.J.; Jiang, Z. Offshore wind turbine operations and maintenance: A state-of-the-art review. Renew. Sustain. Energy Rev. 2021, 144, 110886. [Google Scholar] [CrossRef]
- Khalid, O.; Hao, G.; Desmond, C.; Macdonald, H.; McAuliffe, F.D.; Dooly, G.; Hu, W. Applications of Robotics in Floating Offshore Wind Farm Operations and Maintenance: Literature Review and Trends. Wind Energy 2022, 25, 1880–1899. [Google Scholar] [CrossRef]
- Rinaldi, G.; Thies, P.R.; Johanning, L. Current Status and Future Trends in the Operation and Maintenance of Offshore Wind Turbines: A Review. Energies 2021, 14, 2484. [Google Scholar] [CrossRef]
- Hu, M.; Shi, J.; Yang, S.; Chen, M.; Tang, Y.; Liu, S. Current Status and Future Trends in Installation, Operation and Maintenance of Offshore Floating Wind Turbines. J. Mar. Sci. Eng. 2024, 12, 2155. [Google Scholar] [CrossRef]
- Jiang, Z. Installation of Offshore Wind Turbines: A Technical Review. Renew. Sustain. Energy Rev. 2021, 139, 110576. [Google Scholar] [CrossRef]
- Kolios, A.J.; Walgern, J.; Koukoura, S.; Pandit, R.; Chiachio-Ruano, J. openO&M: Robust O&M open access tool for improving operation and maintenance of offshore wind turbines. In Proceedings of the 29th European Safety and Reliability Conference (ESREL), Hannover, Germany, 22–26 September 2019. [Google Scholar] [CrossRef]
- Carroll, J.; McDonald, A.; McMillan, D. Failure rate, repair time and unscheduled O&M cost analysis of offshore wind turbines. Wind Energy 2016, 19, 1107–1119. [Google Scholar] [CrossRef]
- Vestas v164-8.0. Available online: https://en.wind-turbine-models.com/turbines/318-vestas-v164-8.0 (accessed on 30 September 2024).
- Hersbach, H.; Bell, B.; Berrisford, P.; Biavati, G.; Horányi, A.; Sabater, J.M.; Nicolas, J.; Peubey, C.; Radu, R.; Rozum, I.; et al. Era5 Hourly Data on Single Levels from 1940 to Present, 2023. Copernicus Climate Change Service (C3S) Climate Data Store (CDS). Available online: https://cds.climate.copernicus.eu/datasets/reanalysis-era5-single-levels?tab=overview (accessed on 30 September 2024).
- Dewan, A. Logistic Service Optimization for O&M of Offshore Wind Farms Model Development Output Analysis. Master’s Thesis, Delft University of Technology, Delft, The Netherlands, 2014. Available online: https://repository.tudelft.nl/islandora/object/uuid:cd8d6a48-e469-4fc2-becc-c5c1153f6522/datastream/OBJ/download (accessed on 30 September 2024).
- Maples, B.; Saur, G.; Hand, M.; van de Pieterman, R.; Obdam, T. Installation, Operation, and Maintenance Strategies to Reduce the Cost of Offshore Wind Energy; Technical Report; National Renewable Energy Laboratory (NREL): Golden, CO, USA, 2013. Available online: https://www.osti.gov/biblio/1087778 (accessed on 28 February 2025).
- Smart, G.; Smith, A.; Warner, E.; Iver, B.S.; Prinsen, B.; Lacal-Arántegui, R. IEA Wind Task 26: Offshore Wind Farm: Baseline Documentation; Technical Report NREL/TP-6A20-66262; IEA Wind: Roskilde, Denmark; National Renewable Energy Laboratory (NREL): Golden, CO, USA, 2016. Available online: www.nrel.gov/docs/fy16osti/66262.pdf (accessed on 28 February 2025).


| Reference | Technology Studied | Main Findings |
|---|---|---|
| [5] | Robotics in Offshore Wind O&M | Robotic technologies could reduce O&M costs by up to 27.1% and LCOE by up to 9.9%. |
| [10] | Robotics in Offshore Wind O&M | Provided a comprehensive review of O&M trends, highlighting the cost reduction potential of robotics. |
| [11] | Autonomous Systems for Floating Offshore Wind | Highlighted the potential of autonomous systems to improve installation and maintenance operations of floating wind turbines. |
| [12] | Remote robotic inspections inside turbine nacelle | Increased availability and reduced O&M costs |
| [13] | Remote inspection robots | Reduced inspection time but required operator training |
| [14] | Drone-based turbine inspections | 70% lower inspection costs, 90% reduction in downtime |
| [15] | AI-driven robotic maintenance | Improved intervention frequency and repair quality |
| [16] | Remote inspection with NOWIcob model | Enhanced availability and reduced energy costs |
| [17] | Multi-robot autonomous O&M platform (UAVs, ASVs, blade IMR robots) | Fully autonomous system for offshore wind turbine maintenance |
| [18] | Industry-wide review of robotic applications | High potential for cost savings but limited data available |
| [19] | Human-robot collaboration for O&M | Increased resilience and safety of robotic solutions |
| [20] | Life cycle cost modeling for floating OWFs | OPEX accounts for 18–20% of LCOE |
| [21] | Future cost-reduction pathways | Classified robotics as a safe, low-effort innovation |
| [22] | Autonomous underwater robotic intervention | Enhanced safety and reduced maintenance costs |
| [23] | Reliability and efficiency of UAV-based inspections | High feasibility, but RAM (Reliability, Availability, Maintainability) needs further study |
| [24] | Remote O&M strategies | Found remote inspections to be effective and viable |
| [25] | Resilience Modeling for Offshore Wind Farms | Introduced a framework for modeling disturbances and maintenance responses, combining traditional and robotic strategies. |
| [26] | Robotics in Offshore Wind Turbine Installation | Reviewed offshore wind turbine installation methods and the role of robotics in streamlining operations and reducing limitations. |
| [27] | O&M Strategies for Floating Offshore Wind Turbines | Discussed specific O&M challenges for floating wind turbines and the role of autonomous systems in improving efficiency and cost-effectiveness. |
| [28] | AI and Robotics in Offshore Wind Sector | Discussed challenges and opportunities for AI and robotics integration, including advancements in blade surface repairs. |
| Costs | Regular O&M (€) | Robotics O&M (€) |
|---|---|---|
| Repair | 832,364 | 689,784 |
| Technician | 82,886 | 82,886 |
| Vessel charter | 3340 | 3340 |
| Vessel fuel | 16,750 | 24,850 |
Disclaimer/Publisher’s Note: The statements, opinions and data contained in all publications are solely those of the individual author(s) and contributor(s) and not of MDPI and/or the editor(s). MDPI and/or the editor(s) disclaim responsibility for any injury to people or property resulting from any ideas, methods, instructions or products referred to in the content. |
© 2025 by the authors. Licensee MDPI, Basel, Switzerland. This article is an open access article distributed under the terms and conditions of the Creative Commons Attribution (CC BY) license (https://creativecommons.org/licenses/by/4.0/).
Share and Cite
Vieira, H.; Castro, R. A Forward-Looking Assessment of Robotized Operation and Maintenance Practices for Offshore Wind Farms. Energies 2025, 18, 1508. https://doi.org/10.3390/en18061508
Vieira H, Castro R. A Forward-Looking Assessment of Robotized Operation and Maintenance Practices for Offshore Wind Farms. Energies. 2025; 18(6):1508. https://doi.org/10.3390/en18061508
Chicago/Turabian StyleVieira, Henrique, and Rui Castro. 2025. "A Forward-Looking Assessment of Robotized Operation and Maintenance Practices for Offshore Wind Farms" Energies 18, no. 6: 1508. https://doi.org/10.3390/en18061508
APA StyleVieira, H., & Castro, R. (2025). A Forward-Looking Assessment of Robotized Operation and Maintenance Practices for Offshore Wind Farms. Energies, 18(6), 1508. https://doi.org/10.3390/en18061508