Article

Wind Power Prediction Method and Outlook in Microtopographic Microclimate

1
China Resources Power Technology and Research Institute Co., Ltd., Shenzhen 523808, China
2
China Resources New Energy (Lianzhou) Wind Energy Co., Ltd., Lianzhou 513444, China
3
China Resources New Energy (Liping) Wind Energy Co., Ltd., Liping 557300, China
4
Xuefeng Mountain National Field Scientific Observation and Research Station on Energy and Equipment Safety, Chongqing University, Chongqing 400044, China
*
Author to whom correspondence should be addressed.
Energies 2025, 18(7), 1686; https://doi.org/10.3390/en18071686
Submission received: 17 January 2025 / Revised: 24 February 2025 / Accepted: 25 February 2025 / Published: 27 March 2025
(This article belongs to the Special Issue Advances in Wind and Solar Farm Forecasting—3rd Edition)

Abstract

:
With the increase in installed capacity of wind turbines, the stable operation of the power system has been affected. Accurate prediction of wind power is an important condition to ensure the healthy development of the wind power industry and the safe operation of the power grid. This paper first introduces the current status of wind power prediction methods under normal weather, and introduces them in detail from three aspects: physical model method, statistical prediction method and combined prediction method. Then, from the perspectives of numerical simulation analysis and statistical prediction methods, the wind power prediction method under icy conditions is introduced, and the problems faced by the existing methods are pointed out. Then, the accurate prediction of wind power under icing weather is considered, and two possible research directions for wind power prediction under icy weather are proposed: a statistical prediction method for classifying and clustering wind turbines according to microtopography, combining large-scale meteorological parameters with small-scale meteorological parameter correlation models and using machine learning for cluster power prediction, and a power prediction model converted from the power prediction model during normal operation of the wind turbine to the power prediction model during icing. Finally, the research on wind power prediction under ice-covered weather is summarized, and further research in this area is prospected.

1. Introduction

With the dwindling reserves of non-renewable energy, wind power as a clean energy source is receiving increasing attention, and the development and utilization of clean and non-polluting wind energy is where the trend lies today. The installed capacity of wind turbines in China ranks first in the world [1], which fully utilizes the abundant wind energy resources in China and is conducive to the development of green power business in China. With the increase in installed wind turbine capacity and wind power utilization [2], the stability of the power system is affected. By geographic location, temperature, humidity, wind direction, wind speed and other uncertain factors, wind farm power generation and power generation will change, and the range of change is large, random, increasing the uncertainty of the power system [3] and not conducive to the scheduling work.
Due to the relative lack of understanding of the occurrence mechanism of wind turbine blade ice-covering influenced by meteorological and geographic factors, the above method has the problems of difficulty in loading large-scale data, high computational complexity and slow computation speed when the data size increases sharply. Meanwhile, the above method lacks the quantitative analysis of the contribution of different meteorological and geographic factors to wind turbine blade ice-covering under typical microtopographic conditions.
Wind farms are usually located in high-altitude areas with complex and changing environments, and wind turbines are exposed to ice-covered conditions, which further affects the stability of wind turbine operation. Therefore, it is necessary to accurately predict the output of wind farms so that the power system can operate safely and economically.
This paper describes the wind power prediction methods under normal weather and ice-covered weather, points out the existing problems of the current power prediction methods, then proposes two possible research directions for wind power prediction under ice-covered weather and finally puts forward the outlook for wind power prediction.

2. Traditional Wind Power Prediction Methods

The various existing wind power prediction methods can be divided into three main types according to the modeling means: the first one is the physical method, the second one is the statistical method and the third one is the combined prediction method with both [4]. Physical methods require the wind speed to be obtained by physical model prediction first, and then the wind turbine power characteristic curve is used to derive the actual output power of the wind turbine [5]. Statistical methods, on the other hand, require the use of historical wind power information data to establish a model, without taking into account some complex physical processes, mainly by using the analysis and research of historical sample data, so as to obtain a model that can reflect the corresponding nonlinear mapping relationship between the actual influencing factors and the power generated by wind farms, and predict the output power of wind farms based on the current weather forecast meteorological data. Different forecasting methods can be divided into ultra-short-term forecasting [6], short-term forecasting [7], medium-term forecasting [8] and long-term forecasting [9] according to the time scale, as shown in Table 1.

2.1. Physical Modeling Approach

The physical modeling method is the use of physical models; the main work is to improve the accuracy of the numerical weather prediction (NWP) model, and then accurately predict the temperature, wind speed and other meteorological parameters of a certain place. First of all, it is necessary to establish the NWP model of the area where the wind farm is located, and then obtain the meteorological parameters, such as wind speed and wind direction, at the hub height of the wind turbine, and then obtain the prediction of the wind turbine’s output from the operation of the wind turbine’s power curve. Due to the relatively slow update of digital weather forecasts, the physical method is usually only applicable to short-term and medium- to long-term forecasts even when the turbine is working normally. Physically based wind power prediction systems do not require much historical data and can be used for new wind farms. For example, Matthias Lange [10] and others in Germany have studied a wind power prediction system called Previento based on physical methods. However, the calculation of the wind power prediction system based on physical principles is more complicated, requiring a large number of mathematical solution processes and then prediction, and the established model is not generalized and can only be used for specific wind farms. In addition, the physical model-based power prediction method has a great limitation in that its prediction accuracy is not high, and the physical prediction model of NWP cannot provide reliable ground-based wind speed prediction in complex terrain.

2.2. Statistical Forecasting Methods

The advantage of statistical methods is that the prediction results spontaneously adapt to the location of the wind farm, which automatically reduces the system error; the disadvantage is that it requires long-term measured data and additional training, and it is difficult for the system to accurately predict for rare weather conditions.
Common statistical prediction models are Kalman filtering, traditional machine learning, time series prediction and deep learning. The scenarios for the use of different prediction methods as well as their advantages and disadvantages are shown in Table 2.

2.2.1. Kalman Filter

Kalman filtering is a recursive algorithm that estimates the state of the system by weighted averaging the observations and the system model to provide a prediction of the future state. It can be used for wind speed prediction and hence power prediction.
To address the problem of poor accuracy of wind speed prediction for NWP models in complex terrain, Federico Cassola [11] proposed a locally adjusted Kalman filter procedure for numerical wind speed prediction for wind energy, which reduces the prediction error and provides a significant improvement in the prediction results for wind speed, but the prediction accuracy of prediction models based on the Kalman filter procedure is limited by the influence of the process noise and observation noise; in complex terrain, the accuracy is still not very high. Adding particle swarm algorithm on the basis of the Kalman filter program can effectively reduce the error caused by process noise and improve the prediction accuracy of the Kalman algorithm [12], but the introduction of particle swarm algorithm also brings the problem of local optimal solution and increases the complexity of the algorithm, which leads to a longer computation time.
Although Kalman filtering has the advantages of real-time performance, high computational efficiency and robustness to noise, it is suitable for scenarios such as short-term wind turbine power prediction (seconds to minutes) and real-time control optimization. However, its prediction effect depends on the accuracy of the system model, has limited ability to handle nonlinear systems and has a difficult time capturing the complex relationship between wind speed and power, so the prediction accuracy may be insufficient in complex scenarios.

2.2.2. Traditional Machine Learning

Machine learning methods model the input–output relationship of the system based on historical input and output information through various learning mechanisms, and then estimate the future output of the system through this model. Artificial neural network (ANN) [13] is a commonly used machine learning method in the initial stage, which can fit the input and output of the model in a nonlinear way and fit the correlation between meteorological data and wind power. However, ANN methods require long-term training and learning on a large number of samples, and may also suffer from local optimum solution problems. The support vector machine (SVM) method [14] is also more commonly used, and compared with the ANN approach, SVM has certain advantages; this method is not prone to local optimal solution problems, and the computational speed is relatively fast, but the effect of the method will be affected by the parameters selected by the user.
The artificial neural network mainly builds a mapping model between the actual historical information input and the predicted data output, as shown in Figure 1. Based on the historical data, the model can be obtained by training various environmental parameters of the turbine location with the wind speed or output power at the next moment, but it lacks the consideration of the time correlation of the data series, so it has a limited effect on the prediction of wind power under complex meteorological conditions.
Researchers at home and abroad have carried out a lot of research on wind farm power prediction and also optimized the algorithms; for example, in 2011, De Giorgi [15] studied the prediction accuracy of five artificial neural networks, and the results show that when the prediction time is less than 12 h, the neural network with the simplest architecture has the highest prediction accuracy, and when the prediction time is longer, the prediction accuracy of the various models will decrease, so the ANN is mainly used for short-term wind power prediction. In 2017, Cui Jia et al. [16] used the wavelet transform for wind power prediction, using the wavelet function as the activation function, which deals with the nonlinear problem with better effect, and can better deal with the short-term fluctuations in the wind power to improve the prediction accuracy.

2.2.3. Time Course Prediction

Time series forecasting is the process of analyzing historical operating data and then building mathematical models to predict future operating data. Common time series prediction models include the autoregressive model (AR) [17], moving average model (MA), autoregressive moving average model (ARMA) [18], autoregressive integrative sliding average model (ARIMA) [19] and so on.
Due to the instability as well as stochasticity of wind power, it is difficult to meet the requirement of smoothness for time series prediction, and the error will be larger when using a single time series prediction model. Even through the difference and other methods of processing, the time series of wind power may still have a certain degree of non-stationarity, which will reduce the prediction effect, resulting in a relatively large prediction error.

2.2.4. Deep Learning

Deep learning is currently a more advanced method in wind power prediction. Compared with ANN, deep learning has a very good learning effect when the amount of data is very large. Convolutional neural networks (CNNs) [20] and recurrent neural networks (RNNs) [21] are currently more mature deep learning methods. CNN uses convolution and pooling for feature selection, which reduces the number of features, but it can only process individual inputs individually, and thus is usually used for processing images and cannot be used for processing sequential data. Connections between neurons in the hidden layer of an RNN are also established, and the previous moment’s hidden layer state is output to the current hidden layer unit, which in turn affects the current moment’s output, so RNN is better for processing time-series-related sequences; it is better for short-term prediction, and limited in dealing with long time sequences. Based on the RNN model was then developed a more advanced Long Short-Term Memory (LSTM) artificial neural network [22], as shown in Figure 2: the LSTM proposes a gate mechanism for the filtering of the unit state data, so it can handle long time sequences. Gated Recurrent Neural Network (GRU) is a modification of LSTM, which has only two gates, a simpler structure, faster training and better results when used for power prediction.
Among many deep learning models, recurrent neural networks (RNNs) are more effective in dealing with time series problems, and can better predict wind power. In 2013, Zhou Hongyu [23] and others used a combination of algorithms to successfully implement the establishment of the RNN architecture and optimize the weights of the network system, and thus completed the prediction of short-term wind power. The experimental results also proved the possibility of optimizing the parameters of the network system; in 2017, Zhu Qiaomu [24] and others used the LSTM network to carry out ultra-short-term power prediction, and compared with the traditional neural network, its prediction accuracy is higher.
Deep learning is able to automatically extract features from data and capture the complex relationship between wind speed and power through the powerful nonlinear modeling capability of neural networks, and performs well in medium- and long-term wind turbine power prediction (hourly to daily) and prediction under complex meteorological conditions. However, it requires a large amount of high-quality data for training, high computational complexity, long training and prediction time and poor model interpretability, which limits its application in scenarios with high real-time requirements or data scarcity.

2.3. Combined Forecasting Methods

Various statistical prediction methods only need to count the historical data of turbine power and meteorological parameters, and for power prediction under normal weather, these methods have good accuracy, but in complex environments, a single model may not be able to learn sufficiently, and there is a large prediction error.
Given that all types of prediction methods have certain advantages and shortcomings, in order to centralize the advantages of all types of prediction methods, researchers have proposed a combination of prediction methods: weight-based combination methods and other combination methods. The weight-based combination method is to predict the various methods independently, and then weigh the combination of the results of the various methods to obtain the final prediction results. This can make full use of the advantages of various models, and this method has a smaller error and higher reliability of the prediction results. Other combination methods are usually used for data processing, parameter selection, etc. [25]. Data processing is usually missing value processing and outlier processing; choosing appropriate parameters can improve the accuracy of the model, and at the same time, avoid the model being too complex or falling into local optimal solutions.
The advantage of weight-based combination prediction methods is that multiple methods can be studied simultaneously, and the accuracy of prediction can be continuously improved by replacing the methods as well as the weighting coefficients. However, the combined prediction method needs to use multiple methods to calculate separately, and the most important thing is to determine which methods to choose and the weight coefficients of the methods. The selection of methods and weights need to be constantly explored, and the combined prediction method is only a combination of various methods, which cannot essentially improve the prediction accuracy. For the prediction of wind power under ice-covered weather, the selection of methods and the weights of each method is an issue that needs to be emphasized, and if the selection is not appropriate, it may cause the prediction results to have a hard time achieving the expected accuracy.

3. Wind Power Prediction Under Complex Meteorological Conditions

When turbines are installed in cold regions, snow, frost or ice can accumulate on the surface of the blades. Ice on the blades can change the shape of the blades, resulting in the aerodynamic characteristics of the blades being severely affected. When the ice is evenly distributed on the blades, the turbine can utilize this ice buildup to generate electricity, but the aerodynamic efficiency and torque are reduced, resulting in power loss. When the ice cover is very severe, the torque of the wind turbine drops to zero, the turbine stops working and no power can be generated at all [26], which has a significant impact on the economic dispatch of the grid.
Accurate prediction of wind farm output under ice-covered weather can timely determine the operating status of wind turbines, and then timely overhaul the ice-covered wind turbines to minimize the loss caused by ice cover. However, under the ice-covered weather, the meteorological data inevitably have a certain amount of errors; the accuracy is not high, and these errors will be even greater when converted into the turbine power; and at the same time, the turbine power is also affected by terrain factors, which makes the prediction of wind turbine power under ice-covered weather very complicated. It is necessary to find a suitable power prediction method to predict the wind turbine power condition during ice-covered weather, which can help dispatchers make timely adjustments to meet the users’ demand for electricity, and researchers at home and abroad have made a lot of efforts to this end.
At present, wind power prediction in ice-covered weather is mainly based on two methods: numerical simulation analysis and statistical prediction methods. The numerical simulation analysis method can conveniently provide information about aerodynamic and energy production losses, as well as the energy required for de-icing under different wind turbine configurations and weather conditions [27]; the data-driven statistical prediction method based on the consideration of some complex physical processes is not considered, which mainly involves analyzing and researching the historical sample data [28], so as to obtain the data that can reflect the corresponding nonlinearities between the actual influencing factors and the wind farms’. The corresponding nonlinear mapping relationship model between the actual influencing factors and the power generation is used to predict the output power of the wind farm based on the current weather forecast meteorological data.

3.1. Numerical Simulation Analysis

The wind power generation technology in foreign countries started earlier, and a large number of numerical simulation studies have been conducted on the aerodynamic performance of wind turbines after ice cover. M. B. Bragg et al. summarized the research on the aerodynamic characteristics of ice-covered airfoils conducted by the NASA Lewis Laboratory after 1978 [29], which classified the ice cover into four major categories, namely, roughness, angular ice, streamline ice and ice ridges, and analyzed the influence law of the ice type on the airfoil’s aerodynamic performance, which laid the foundation for other researchers to follow. In 2003–2010, F. Rasmussen et al. [30] used numerical simulation methods to simulate the aerodynamic performance of different airfoils and the output power of wind turbines after ice cover, and came to the following conclusions: ice reduces the coefficient of lift of the blade and increases the coefficient of drag, and the aerodynamic performance of wind turbine blades after ice cover decreases. The aerodynamic performance of wind turbine blades after ice cover decreases. The effects of different angular ice structures are also different, with the effect of rainsong being greater and that of misty pine being smaller. In 2005, Bragg et al. [31] pointed out that the aerodynamic losses of wind turbine airfoils with different geometries are different for the same icing conditions, and therefore, it is not possible to build a generalized model suitable for all wind turbines. In 2008, Hochart Clement et al. [32] investigated the effect of ice cover on wind turbine blades under wet and dry conditions, and found that there was more ice accumulation at the tip of the blade in the wet condition, and the lift reduction at the tip of the blade was greater, of about 40%, in both cases. In 2011, Barber et al. [33] combined computational fluid dynamics (CFD) value simulations with experimental studies to investigate and analyze the effect of blade ice cover on the performance of the wind turbine, and it was pointed out that the outer side of the blade (95~100%) is the area where the impact of icing is the most serious, and this study also found that icing can be affected by many different factors, and even if the wind farm is at a lower altitude, due to the special combination of temperature conditions and humidity conditions, the wind turbine blade icing may be more serious than that of the wind farm at a higher altitude; therefore, it is necessary to divide the terrain where the wind turbine is located into icing-susceptible zones and non-ice-susceptible zones. In 2013, Lamraoui et al. [34] investigated the changes of each parameter when the wind turbine was iced over, and the results showed that after the blade was iced over, the output power loss was relatively large at 80% of the position along the blade spread, and the maximum loss reached 40%. In 2019, Ozcan Yirtici et al. [35] successfully predicted ice overtopping by combining the blade element momentum (BEM) method with an ice accumulation prediction code to predict wind turbine power generation under ice-covered conditions. In 2023, Galal M. Ibrahim et al. [36] simulated the ice characteristics of different blade sizes based on BEM and found that ice accumulates more near the tip of the blade.
Domestic-related research started late and mainly focused on numerical simulation. In 2010, Zhang Luting et al. [37] from Huazhong University of Science and Technology studied the static and dynamic stall characteristics of wind turbine blades under ice-covered weather with four different ice-covered patterns based on the S-A turbulence model. It was found that the effect of ice cover on lift during dynamic stall is complicated and more research is needed. In 2015, Hao Yanhuan et al. [38] calculated the effect of different types of ice cover on the torque and power loss of the wind turbine by using the CFD method, and pointed out that the foggy ice cover has a small effect on the torque and power loss, while the rainy ice cover leads to a significant decrease in the torque and a serious loss of power. Under both types of ice cover, the power loss becomes more and more serious with the increase in ice cover time. In 2018, Li Hantao [39] investigated the effect of ice cover roughness on the aerodynamic performance of wind turbine blades through numerical simulation analysis. In the literature [40], a theoretical study was conducted on the ice thickness distribution of wind turbine blades based on the concept of icing similar parameters and BEM theory, and icing tests were conducted in actual wind farms. It was found that the ice thickness near the tip of the blade was the largest, which was in line with the prediction results. In 2023, Yu Zhou et al. [41] proposed a method of calculating the wind power under the icing conditions based on the BEM theory, which was combined with the CFD to obtain the blade’s lift coefficient and drag coefficient for output power calculation.
Most of the methods analyzed using numerical simulation have studied the factors that have an impact on wind turbine power and analyzed them qualitatively, while it is difficult to determine how much the different factors specifically affect power loss. Although some researchers have also studied the specific power loss in a particular meteorological environment, the actual meteorological data have many parameters, such as wind speed, temperature, wind direction, liquid water content, etc., and their combinations are also highly variable. The ice cover under different meteorological conditions, such as the shape of the overlying ice, the thickness of the overlying ice and the duration of the overlying ice, is also different, and it is virtually impossible for the natural conditions to be identical to the simulated conditions. In addition, the parameters of wind turbines in different wind farms are also different; most of the models established through experiments are based on specific wind turbines and can only be used in specific meteorological conditions, so it is difficult to establish a common model for all wind turbines, and at present, wind farms are not able to realize the accurate monitoring of multiple environmental parameters at the location of each wind turbine, which makes numerical simulation and analysis methodology have great limitations. In order to popularize the numerical simulation analysis method, it is an unavoidable problem to accurately obtain the environmental parameters of each wind turbine location.

3.2. Statistical Prediction Methods for Wind Turbine Blade Ice-Covered Conditions

Because of the small number of ice-covered samples, there are not many studies using statistical prediction methods for wind power prediction under ice-covered weather. Jiang Binqi [42] used XGBoost (eXtreme Gradient Boosting) network to establish a model between ice-covered meteorological conditions and the degree of ice cover, as well as a model between ice-covered parameters and power loss, but the model did not take into account the influence of topographic factors for ice-covered power prediction, and the prediction accuracy needs to be further improved. Fan Qiang [43] analyzed the influence of meteorological parameters on the output power of wind farms in the region where the wind farms are located, and compared the differences existing in the wind power prediction in the mountainous region with other different terrain conditions, but did not consider the wind power prediction under ice-covered weather. Some terrains are prone to the formation of ice cover, and combining terrain factors with wind power prediction may provide ideas for wind power prediction during ice cover. Sebastian [44] proposed a statistical method based on random forest regression to predict turbine power production loss due to snow and ice growth. The method uses regional weather forecasts and on-site power measurements as inputs to predict the relative power production loss for the next 42 h on the basis of time series forecasts, thus improving the prediction of the next day’s power production. However, the method uses a small number of samples, which is an unavoidable problem with statistical forecasting methods. Molinder J [45] also used the random forest regression algorithm for ice-covered weather power prediction, and in addition to the use of weather forecast meteorological parameters, a physical icing model was incorporated into the modeling, which resulted in a more accurate prediction. The use of physical icing models improved prediction accuracy compared to using only numerical weather prediction data. However, these models are very specific to the wind farms that are trained using this method and are not generic models; different wind farms need to be trained with separate models.
Statistical prediction methods are mainly based on machine learning, by analyzing the sample historical data and then obtaining the nonlinear mapping relationship between each meteorological datum and wind power, but because the icing is an episodic event, the main problem of statistical prediction methods is that the number of training samples is small, which results in the establishment of power prediction models that do not adequately fit the inputs and outputs, and thus affects the prediction accuracy. Similar to the numerical simulation method, the model built by the statistical prediction method has the problem that it can only be used for specific wind farms. In addition, there are many meteorological factors that have an impact on wind turbine power, and how to select the input feature quantity is also a problem. To predict future wind power, the meteorological parameters of the future period need to be used as inputs to the model, and the meteorological parameters of the location of the wind turbine can be directly simulated during the study, but the weather forecast meteorological parameters that can actually be obtained are different from those of the actual environment where the wind turbine is located, which leads to a further decrease in the accuracy of the power prediction model. How to establish a correlation model between weather forecast large-scale meteorological parameters and microtopographic near-surface small-scale meteorological parameters, and accurately obtain the small-scale meteorological parameters where the wind turbine is located is also a difficult point facing the statistical prediction method.

4. Reflections on Accurate Prediction of Wind Power in Microtopographic Microclimates

Due to the ice-covered weather with input features difficult to choose, the number of samples is small and the statistical prediction method in predicting wind power under ice-covered weather conditions is extremely inaccurate; and physical model-based blade ice-covered growth and aerodynamic performance simulation method is difficult to be used in practical engineering for power prediction directly due to the complexity of the model, large amount of computation and long computation time. From the point of view of the existing wind farm power prediction methods, a single statistical model or physical model cannot well realize the wind power prediction under ice-covered conditions. The authors have thought about the following two aspects for realizing accurate wind power prediction under ice-covered weather.

4.1. Analysis of Factors Affecting Ice Cover Thickness in Microtopographic and Microclimatic Areas

According to the simplified Makonde ice accumulation model in the literature [46], the time-varying process of ice accumulation of a single turbine can be expressed by Equations (2)–(4) by extracting the meteorological data and the actual output data under the ice-covered conditions of the wind farm.
M = 0 t k t w V d t
where K is the blade ice accumulation coefficient, which is a simplified characterization of the blade size, ice accumulation type and ice accumulation process, and is positive when the external environment meets the conditions for ice accumulation, negative when it meets the conditions for ice melting and 0 when there is no ice accumulation; V is the wind speed at the height of the wheel hub; and w is the liquid water content in the air.
Since the liquid water content of the air is outside the scope of the commonly used NWP objects of interest, the literature [47] chose to approximate the liquid water content of the air by the precipitation S, which is expressed as follows:
ω = 0.067 S 0.846
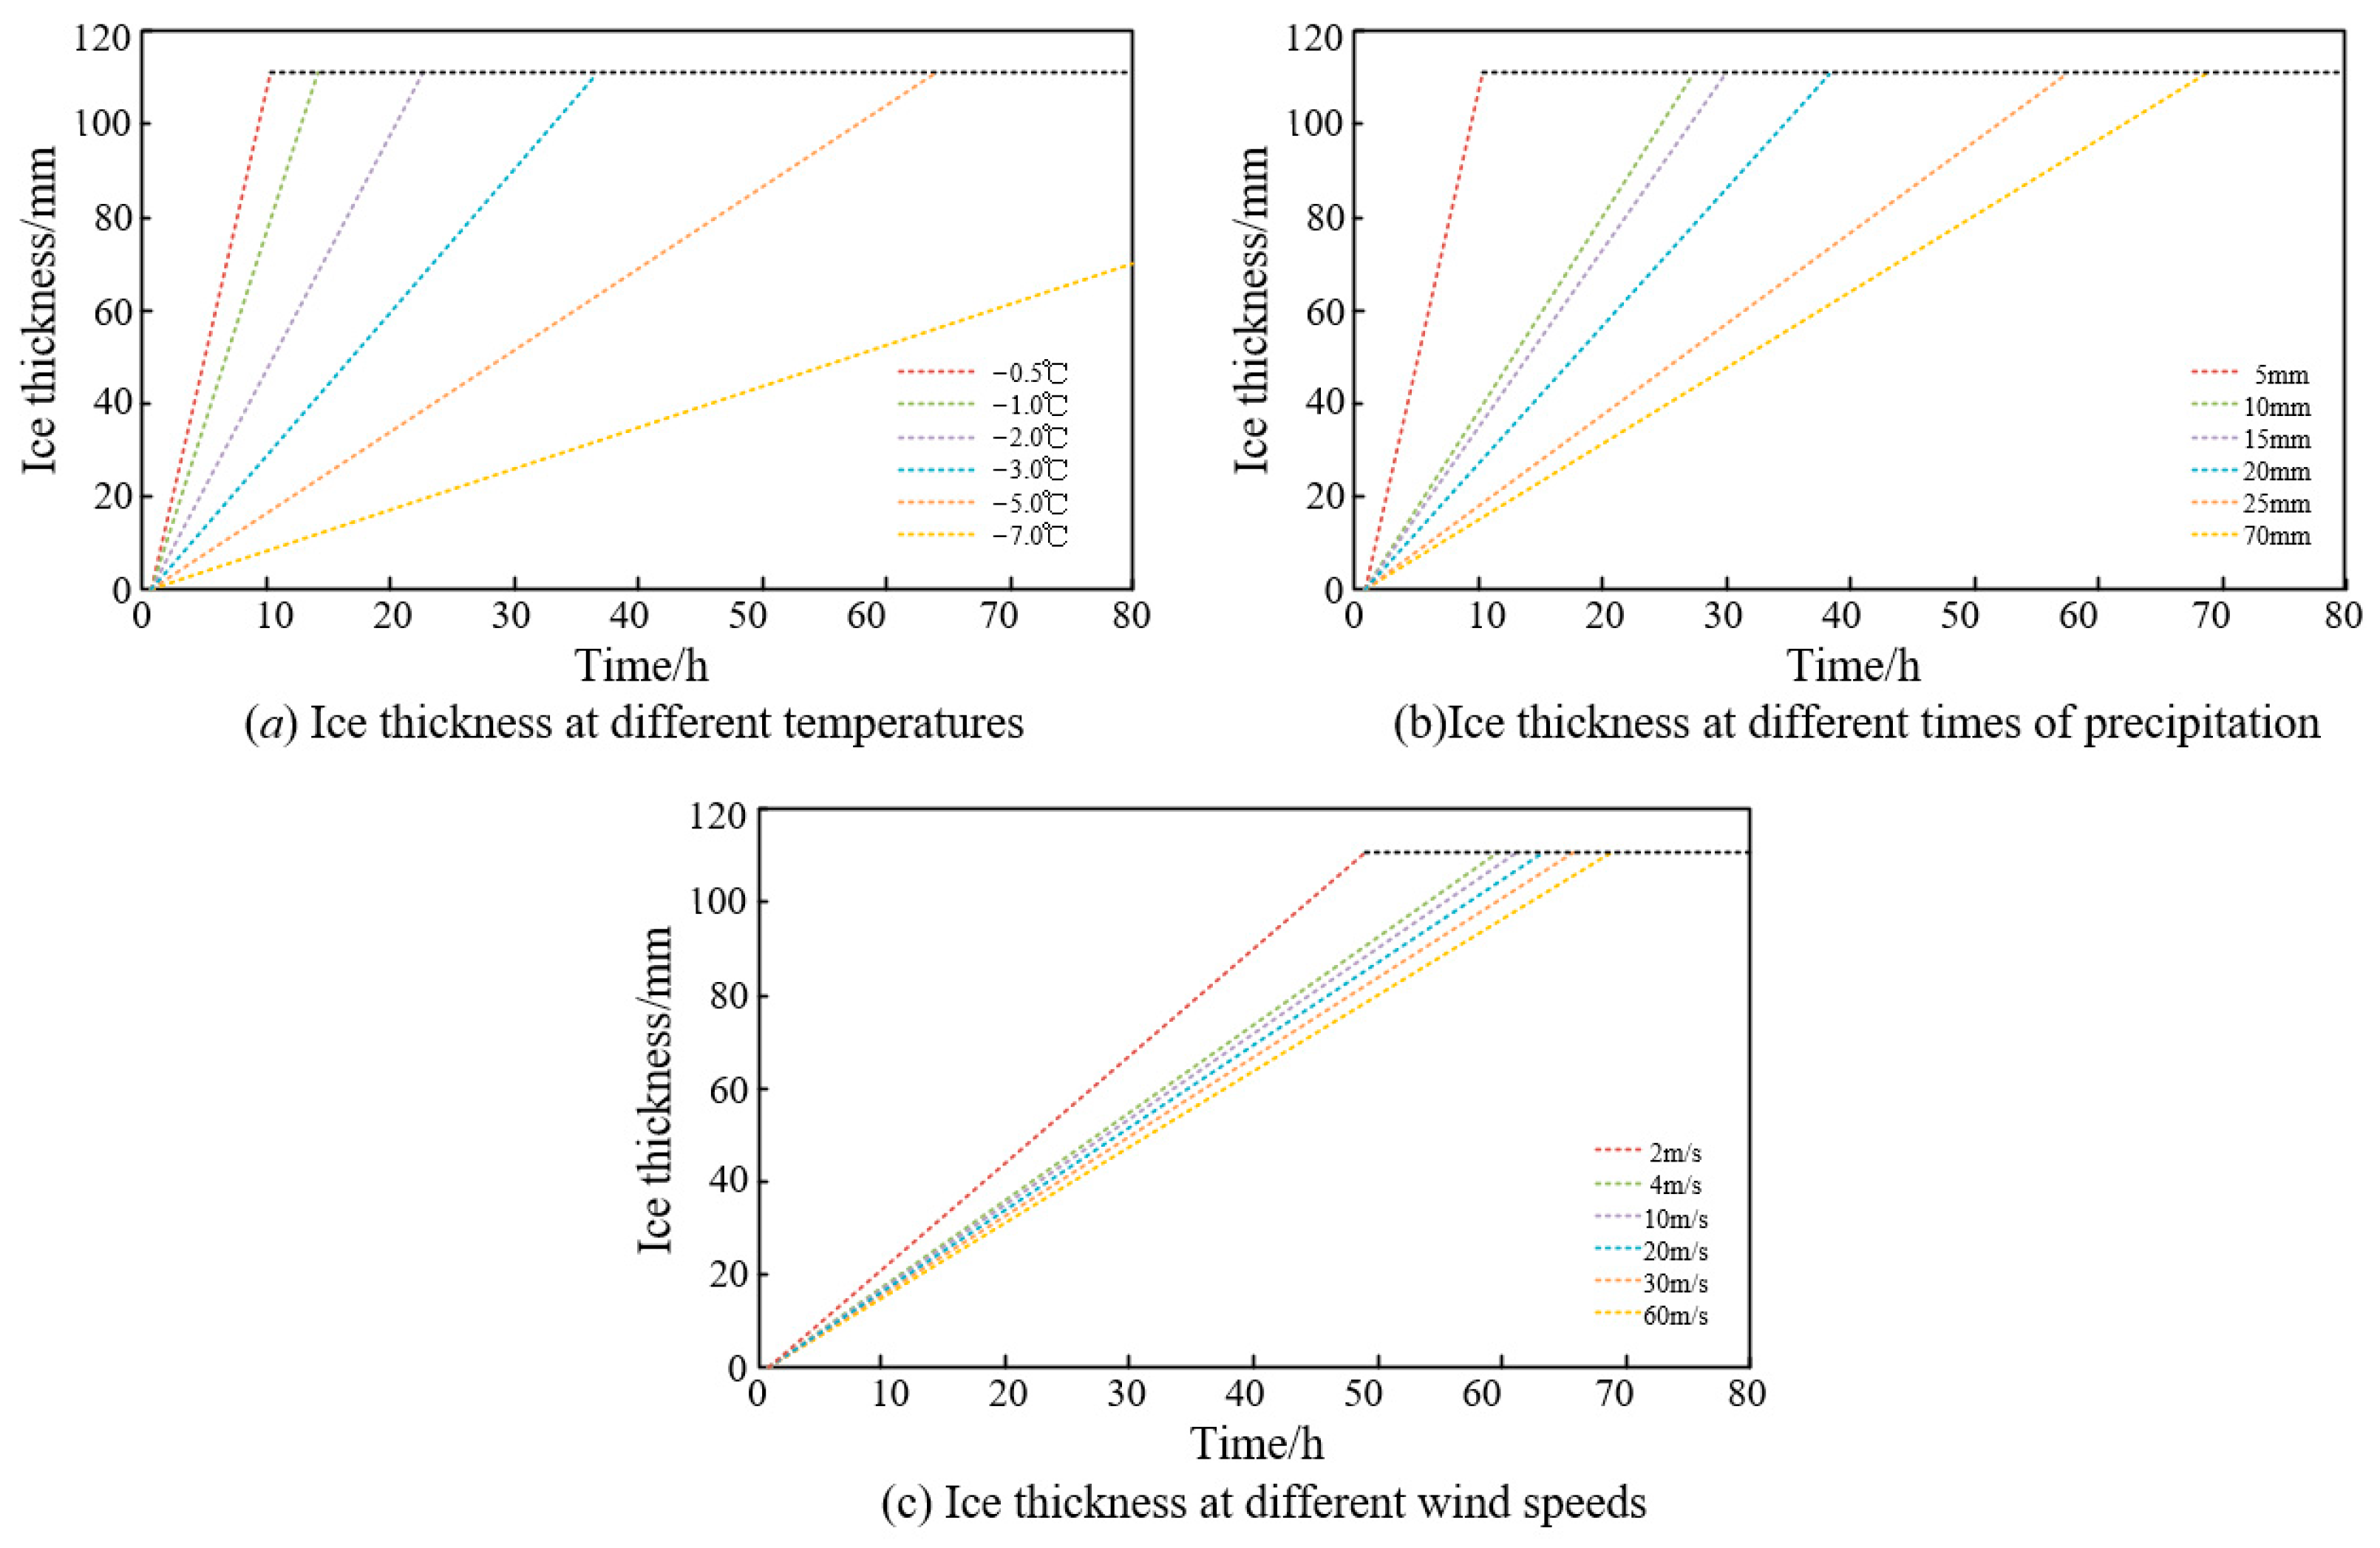
Blade ice cover is related to meteorological conditions, equipment flexibility and the actual properties of the ice accumulation object (e.g., shape and size), which are mainly driven by the air temperature, wind speed, liquid water content in the air and droplet size distribution. The causes, types and processes of blade icing are complex, and it is only necessary to establish a mapping relationship between the ice loads and the wind power output. Four meteorological factors, namely, temperature, wind speed, air pressure and large-scale precipitation, are introduced into the NWP by simplifying the Makonde ice accumulation simulation model to characterize the ice accumulation on wind turbine blades. The Pearson correlation coefficients are verified, as shown in Table 3, and it is found that the correlation coefficients of barometric pressure > air pressure > wind speed > precipitation > humidity > wind direction, and the preferred results of the characterization under the ice-covered scenarios are the precipitation, barometric pressure, temperature and wind speed, because the precipitation and humidity characterize the same kind of influence and the correlation coefficient of precipitation is higher. Therefore, the preferred results for characterizing the ice cover scenario are precipitation, air pressure, temperature and wind speed. Figure 3 shows the effects of temperature, precipitation and wind speed on ice cover thickness.
In terms of microtopography identification, the main types of ice-prone microtopography are considered to be valleys, ridges, passes, windward slopes and water vapor uplift areas [48]. According to the literature [49], humidity and daily minimum temperature are the most important factors for ice cover in the five microtopographic regions, followed by daily average temperature, and other topographic factors and meteorological factors have implicit or small effects on ice cover.
(1) Ridge terrain is often the line over the watershed, open terrain, temperature factor and humidity factor are the most critical. In mountainous areas, especially those with large elevation changes, there are strong stereo climatic features. The literature [50] shows that after exceeding the condensation height, the temperature decreases by 0.6~1.0 °C for every 100 m rise in altitude, and the possibility of ice cover increases. Considering that the air pressure is mainly affected by the altitude, it can also support the view that the ice cover of the ridge terrain is closely related to the altitude.
(2) The valley terrain is a low and narrow depression between two mountains that extends in one direction, and it is a water catchment (accumulation) line where humidity contributes more to ice cover. In addition, the valley terrain has mountains to block sunshine; in addition to the minimum daily temperature, the average daily temperature value is also more critical.
(3) Pass terrain is a low-lying area between rolling mountain ranges that usually creates a strong wind tunnel effect. Wind speeds may increase significantly at passes, especially when atmospheric pressure differences are high. Changes in wind speeds are mainly influenced by the mountain range, and wind speeds at passes can be 50–100% higher than in the surrounding flat areas [51].
(4) The airflow in the terrain of windward slopes is forced by the terrain to climb and elevate, the air temperature decreases with the elevation, the water vapor condenses and the air humidity increases.
(5) The area around large water bodies (lakes, reservoirs and rivers) is a typical water vapor gathering area, superimposed on the windward slope topography in the wind forced to rise along the mountain slopes; the ice-covered airflow condenses in the cold, and it is very easy to form ice cover.

4.2. Power Prediction for Wind Farms in Microclimatic Domains of Microtopographic Areas

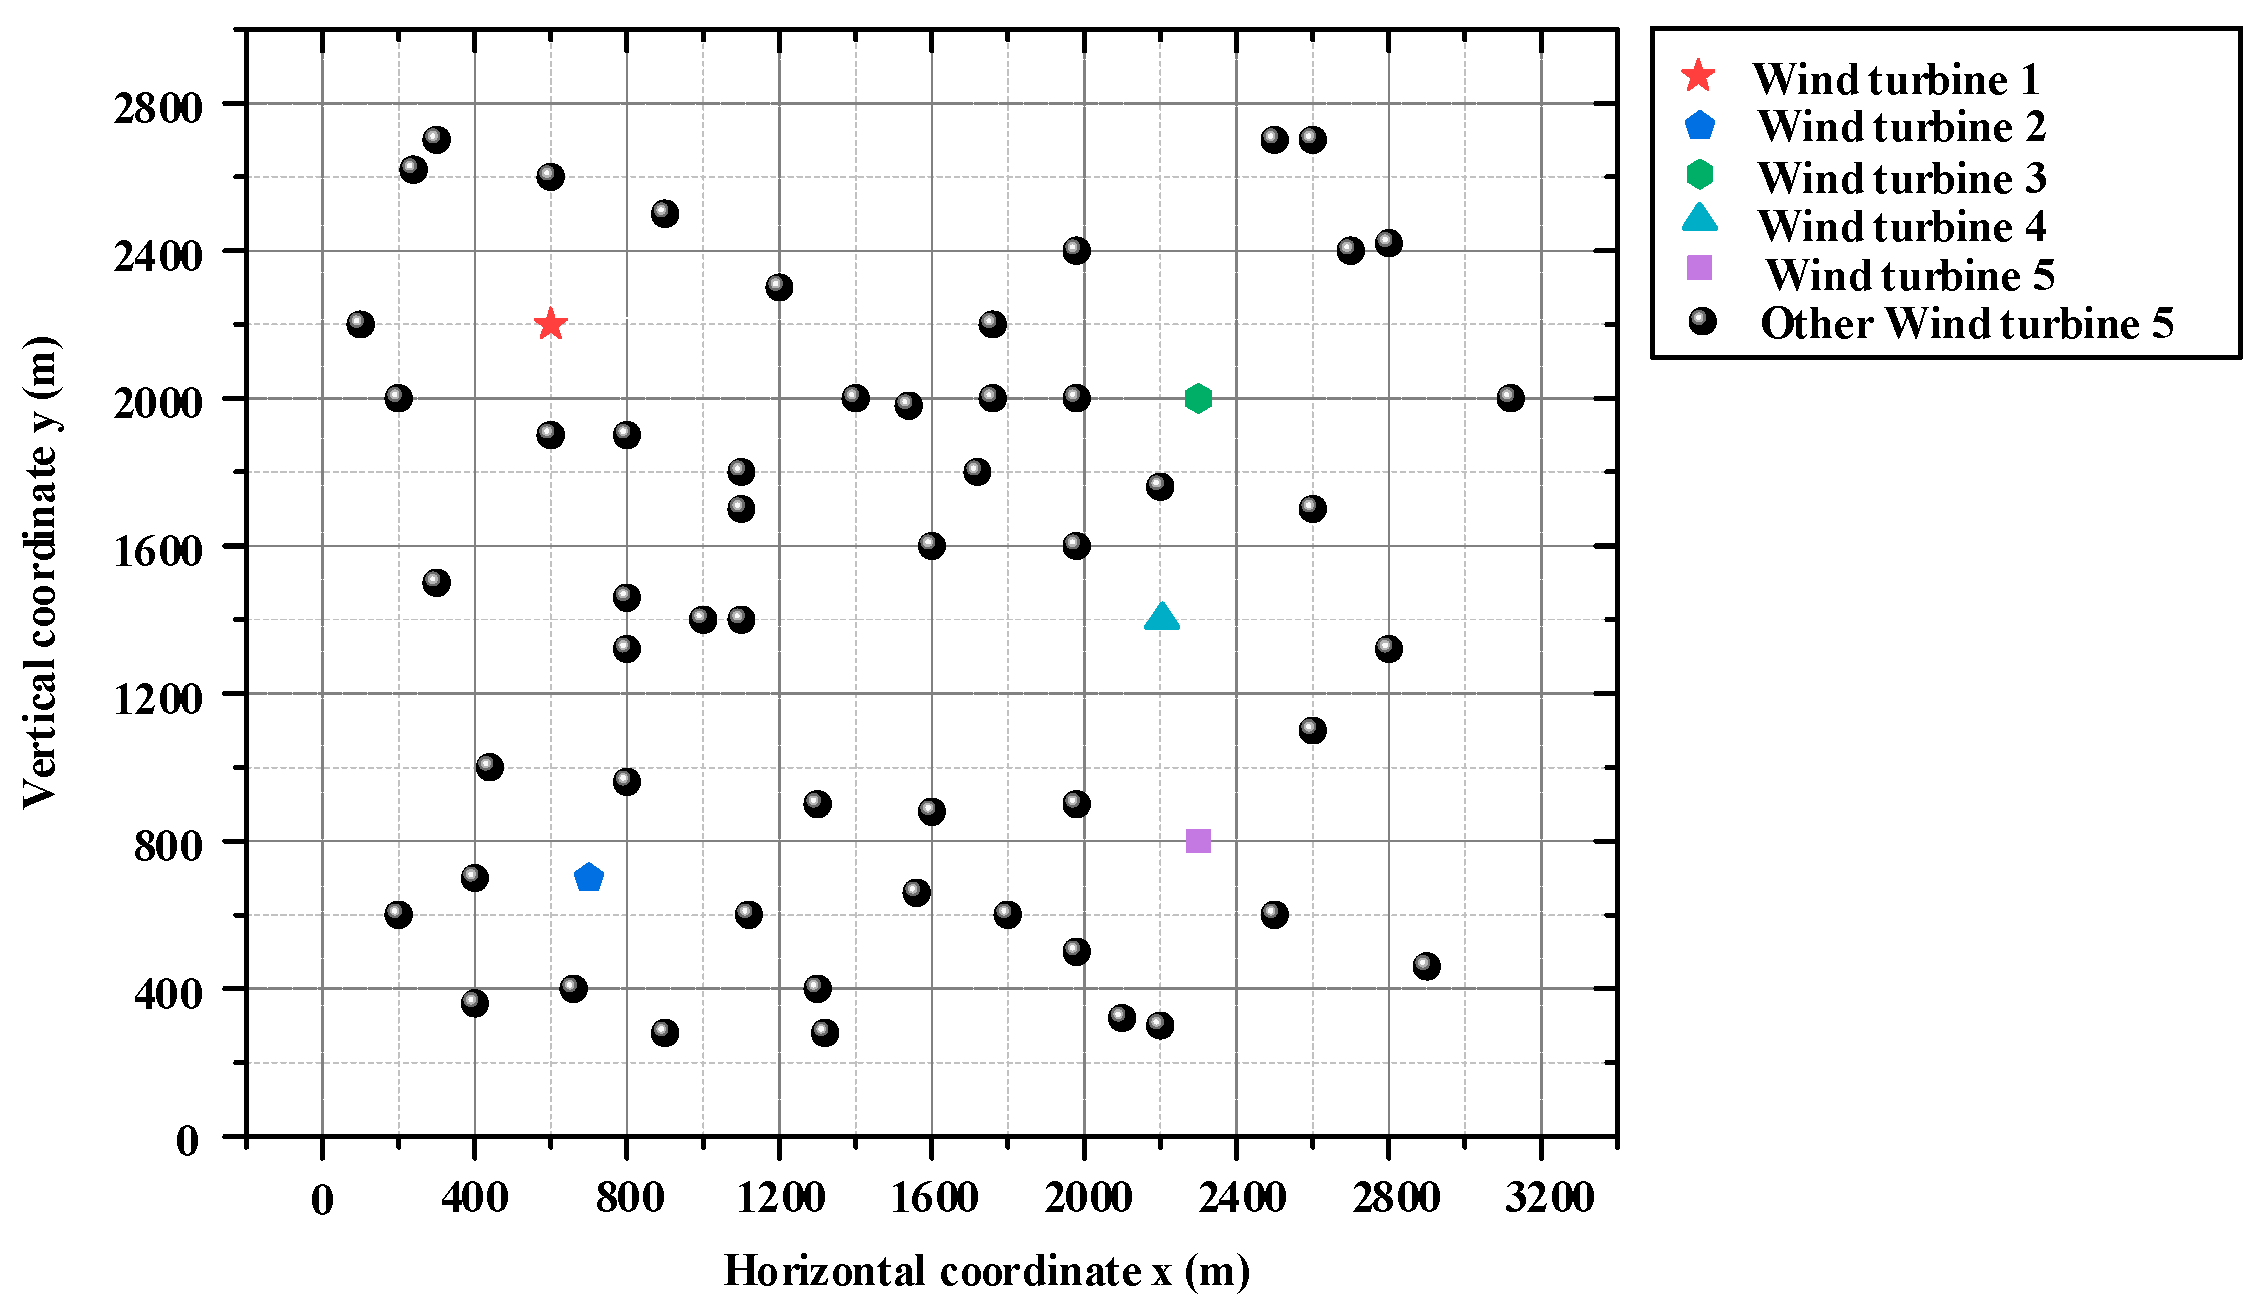
Depending on where the wind farm is located, its geographical characteristics, climate environment, wind farm turbine distribution and other factors vary, and each wind farm’s data characteristics are not the same, making it hard to find a common model to each wind farm power prediction; wind farm power prediction needs to be adapted to the local conditions. You can classify the turbines according to the microtopography, for the same wind farm, the same kind of wind turbines under the same microtopography will be used for cluster prediction, as shown in Figure 4.
Based on certain features, five representative wind turbines can be extracted from this wind farm, and then the rest of the wind turbines in this wind farm can be divided into five categories. For the same category of wind turbines, under the same microtopography, the ice-covering condition as well as the output condition of the same model wind turbines are largely similar, and it can be considered that the historical ice-covering data of each wind turbine are all the representative wind turbine’s historical data, so that there will be more training samples in the subsequent modeling, and the model will be more full. However, the criteria for zoning according to ice-covered weather and the improvement of prediction accuracy need to be further explored.
Microtopography can be considered by using positioning technology such as Geographic Information System (GIS)/Global Positioning System (GPS), and at the same time, based on the DEM elevation data, to extract all kinds of terrain features of wind farms. As shown in Figure 5, combined with the meteorological center data, at the same time, the GIS extracts and incorporates the latest topography and geomorphology information, and through the calculation of fitting and statistical analysis, obtains the microclimate regional classification standard of wind farm microtopography.
In the first step, information on the correlation between microtopography and wind turbine blade ice cover is collected by combining the specific geographic situation of the location of the large-scale wind farm, and the extraction of slope, slope direction, terrain undulation and valley line ridgelines are realized through surface flow simulation to extract various types of ground line features of microtopography. Combining the DEM of the location of the large wind farm, the micro-terrain factors are extracted. The microtopographic factors (focusing on the strong significance factor) are calculated and analyzed statistically to obtain the microtopographic area classification standard for large wind farms, as shown in Figure 6.
The second step is to establish a correlation model between the weather forecast large-scale meteorological parameters of the micro-terrain region and the microclimate parameters of the micro-terrain near-surface monitoring small-scale. The weather forecast meteorological parameters and the meteorological parameters of the turbine’s location are different, and the establishment of the correlation model can provide a more accurate source of data for the turbine power prediction model. First, the weather forecast large-scale meteorological parameters of the area are obtained from the meteorological center located in the micro-terrain area, and the small-scale meteorological parameters of the area are obtained from the real-time monitoring system installed near the ground in the micro-terrain. Secondly, considering the presence of bad data, the data also need to be screened and pre-processed. Finally, the parameters are normalized, the hierarchical analysis method is chosen to determine the weight coefficients between the parameters, and the large-scale meteorological parameters and small-scale meteorological parameters with relatively large correlation are selected to establish a correlation analysis model, in order to achieve the prediction of small-scale meteorological parameters on the near-surface of the microtopography with the large-scale meteorological parameters of the weather forecast. Machine learning is used to learn and train the historical data, and then the weather forecast real-time data number is input into the trained machine learning model, thus realizing the accurate prediction of microclimatic meteorological parameters in the micro-terrain area of large wind farms, and providing an accurate data source for the subsequent power prediction.
In the third step, the machine learning method is used to select the data when the wind turbine is running, discard the data of artificial shutdown, and learn the historical data, so that the historical operation data of the wind turbines under the same micro-terrain are all taken as the historical operation data of the representative wind turbine, thus increasing the number of samples in the training set and making the model more full, Modeling the relationship between microclimate and turbine power in microtopographic regions of wind farms.
At this stage, microtopography classification research is mostly carried out at the theoretical level, and there is no recognized criterion to classify different microtopographic regions, so it leads to low practical application value in engineering. How to quantify microtopography and analyze and extract terrain factors from DEM data to form classification criteria is one of the difficulties in practical microtopography classification. The amount of terrain information that needs to be extracted to establish a prediction model for power generation of large wind farms under ice-covered weather is relatively large, and the extraction of effective terrain factors from the database requires a lot of calculations and a long time of waiting. How to reduce the redundant data reception, simplify the calculation process, and improve the efficiency of micro-terrain recognition is one of the difficulties in realizing fast and accurate recognition. Due to the relative lack of understanding of the occurrence mechanism of wind turbine blade ice cover affected by meteorological and geographical factors, the above methods have the problems of difficulty in loading large-scale data, high computational complexity and slow computation speed when the data size increases dramatically. At the same time, the above method lacks quantitative analysis of the contribution of different meteorological and geographic factors to wind turbine blade ice cover under typical microtopographic conditions, which makes it difficult to provide guidance for site selection.
In addition, the results of wind power clusters directly affect the accuracy of power generation prediction of large-scale wind farms, relying on the wind turbine historical operation data to correct the results of wind farm clusters based on microtopography, which is conducive to improving the accuracy of the model. Due to the existence of a large number of blind zones for ice observation in micro-terrain areas such as high mountains, passes and canyons, the existing wind farm sites are still mainly designed using standardized design, and the micro-terrain and micro-meteorological environments are not taken into account. How to correct the power prediction model by combining the results of microtopography-based wind farm classification and historical power generation based on the results of cluster classification is the difficulty of the power prediction technology for large-scale wind farms under ice-covered conditions. Therefore, it is necessary to carry out targeted research on each type of area, and propose a universally applicable method for classifying and identifying ice-covered microtopographic areas. If there is a large deviation in the prediction results, the possible problem is that some turbines are under multiple microtopographies at the same time, and the power prediction will be clustered according to a certain microtopography, and under certain climatic conditions, its ice-covering condition is different from the rest of the turbines, and then there is an error. A new model can be built for turbines with multiple microtopographies, but the number of turbines in multiple microtopographies is relatively small, which leads to less ice cover data and may not be accurate when training the model.

4.3. Conversion Modeling of Wind Turbine Output Power Under Ice-Covered Weather

Three-dimensional CFD methods usually consume huge computational time and resources, and the generalizability of the computational results is yet to be further verified, which also greatly reduces the practicality of CFD methods. Therefore, the authors propose a simplified discounting model for wind power prediction under ice-covered weather.
In the first step, a statistical model for wind turbine power prediction under clean conditions is established based on the historical operating power of the wind turbine as well as the historical environmental and meteorological parameters of the wind farm to realize the output power prediction of the wind turbine under un-ice-covered conditions.
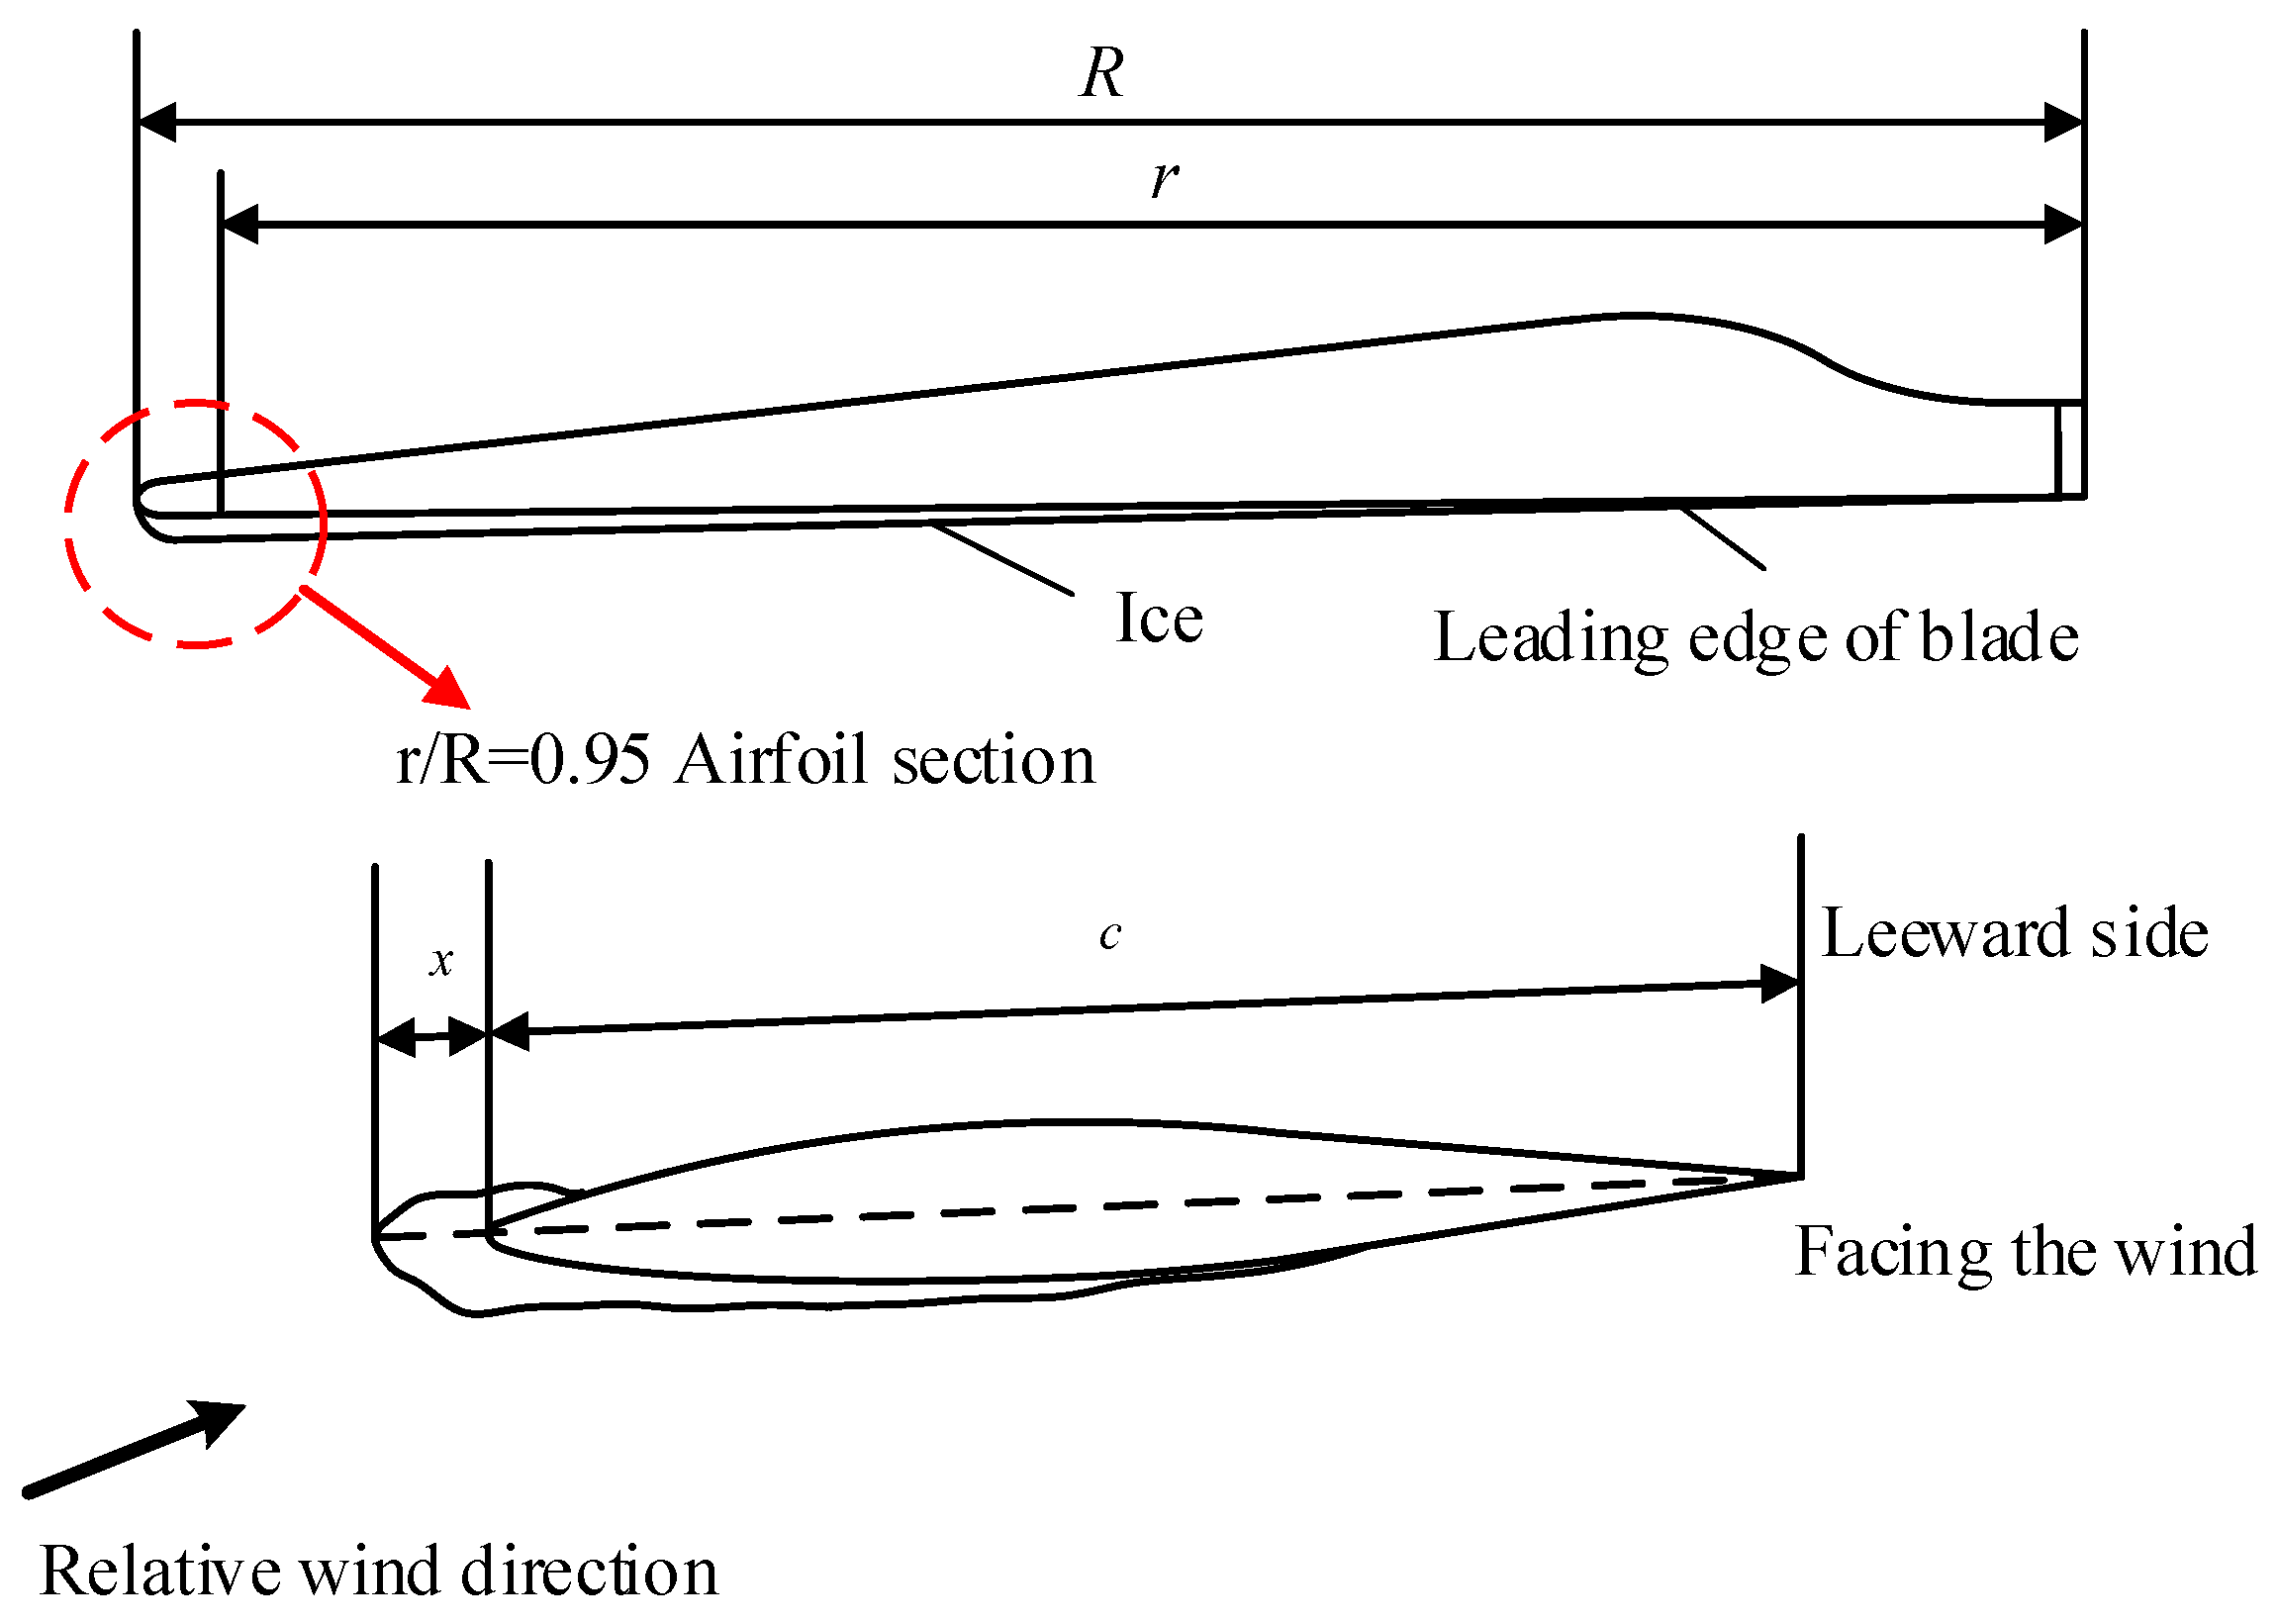
In the second step, firstly, the thickness of ice cover at the leading edge of the blade at the 95% section of the blade spreading direction is taken as a characteristic parameter characterizing the overall degree of ice cover of the blade, as shown in Figure 7, and the measured thickness of ice cover at the leading edge of the blade is taken as a label; secondly, tests are carried out on the wind turbine to obtain the corresponding parameters at the time of ice cover, and a correlation model is established based on deep learning between the meteorological parameters and the thickness of the ice cover to realize the predicted thickness of ice cover using parameters such as temperature, humidity, liquid water content, etc. Finally, the meteorological forecast results are used as inputs to the model to obtain the output of blade leading edge ice cover thickness, which realizes the transformation of meteorological forecast parameters to the degree of ice cover.
In the third step, Fluent is used to simulate and establish the mapping relationship between the degree of ice cover and the lift coefficient Cli and drag coefficient Cdi under different wind speeds and ice shapes, so as to realize the prediction of the corresponding lift coefficient and drag coefficient from the degree of ice cover.
In the fourth step, the power conversion factor, lift conversion factor and drag conversion factor are defined as follows:
P k = P i P o
C lk = C li C lo
C dk = C di C do
where Pk is the power conversion factor, Pi is the turbine power in the ice-covered condition and Po is the turbine power in normal operation. Clk is the lift conversion factor, Cli is the lift coefficient in the ice-covered condition and Clo is the lift coefficient in normal operation. Cdk is the drag conversion factor, Cdi is the drag coefficient in the ice-covered condition and Cdo is the drag coefficient in normal operation.
The three conversion factors were nonlinearly fitted using the ice-covered test data.
In the fifth step, according to the fitting results of the three conversion factors, the predicted lift coefficient and resistance coefficient are used to predict the power conversion factor under different working conditions, which is combined with the predicted power of the turbine under normal weather, and then converted to the power of the turbine during ice cover.
In the sixth step, the reliability analysis of the results is carried out, and the indicators to measure the deviation of the predicted value from the real value are absolute error MAE and root mean square error RMSE, and the smaller the two indicators are, the more accurate the prediction is.
Mean relative error:
M A P E = 1 n i = 1 n P i P i ¯ P i
Mean Square Error:
M S E = 1 n i = 1 n P i P i ¯ 2
where P i ¯ (1, 2, 3, …, n) is the fitted or predicted value of the model.
The current problem of the conversion model is that although the lift coefficient and drag coefficient affect the aerodynamic performance of the blade, which in turn affects the output power, the relationship between the lift coefficient and drag coefficient and the power of the turbine is difficult to express with the formula, and there will be a certain degree of error in the conversion model, and the ice-covering test sample data are large enough to reduce the error caused by the fitting, so that the results of the conversion are more accurate.
Shu [52] proposed a wind speed interval method (BIN) based on wind speed correction to statistically analyze the power characteristics of wind turbines under different ice cover conditions. It was found that the maximum power of the unit was reduced by 56.9%, 90.0% and 98.5% when the thickness of ice cover on the leading edge of the 95% section of the blade spreading direction was 48 mm, 86 mm and 112 mm, the maximum reduction of the rotational speed was 20.5%, 38.6% and 61.4%, and the maximum wind energy utilization factor was reduced by 38.1%, 51.5% and 95.6%, respectively. Ice cover reduces the optimal blade tip speed ratio for actual operation, resulting in the operation of the turbine deviating from the original matching working point of the wind wheel and generator, and the traditional control strategy is not well adapted to the operation of the wind turbine in the ice-covered area.
Shu [53] used CFD to establish a simplified calculation model of wind turbine output power under ice-covered conditions. In the model, based on the chord length-modified Viterna equation (Viterna), the calculation method of the lift coefficient of the ice-covered airfoil in the range of the full angle of attack is proposed; the calculation formulas of the relative wind speed of the blades and the angle of attack in the BEM are corrected by taking into account the effects of the wind turbine inclination angle, azimuth angle, taper angle and yaw angle. By comparing the test results, the maximum calculation error of the model does not exceed 17.3%.

5. Conclusions

The importance of wind power prediction is particularly important in micro-terrain microclimates. Microtopography (e.g., valleys, hills, coastlines, etc.) significantly affects the power generation efficiency of wind farms by altering wind speed, wind direction and turbulence intensity. This paper elaborates on the current status of wind power prediction research; most of the current research on wind power prediction methods under ice-covered weather is at the level of mechanism, from the point of view of the existing wind farm power generation prediction methods. The current various methods of wind power prediction under ice-covered weather have certain limitations, and a single statistical model or a physical model can not be well realized under the conditions of ice-covered wind power prediction. There are few studies on microtopography and microclimate, and the problems of insufficient samples of meteorological factors and model selection and establishment based on small samples need to be solved. Therefore, it is necessary to establish applicable methods for prediction models under microtopography and microclimate, and to realize the wind power modeling method considering microclimate. The authors have thought about the accurate prediction of wind power under ice-covered weather in terms of microclimate prediction of wind farm micro-terrain areas and the conversion model of wind turbine output power under ice-covered weather, but these two methods are also based on the theoretical level, and their feasibility has yet to be studied.

6. Future Research Directions

With the development of artificial intelligence and the continuous improvement of the physical model, the existing wind power prediction research method is constantly improved on the basis of the combination of meteorological center data and geographic information system, on the one hand, from the wind farm climatic conditions, geographic location, internal layout and other parameters of the continuous in-depth study, and on the other hand, combined with the numerical simulation and analysis method to establish a physical calculation model, and ultimately, it may be possible to realize the wind turbine power output under ice-covered weather. Accurate prediction would provide a basis for reasonable scheduling of the power grid in winter ice-covered weather, to ensure smooth power output of the power grid.
Statistical prediction methods during ice-covered weather currently have the problem of less sample data, and the training model is not sufficient. Cluster prediction of wind farms can be carried out by considering the combination of micro-terrain division, so that the sample data of the wind turbines under the same micro-terrain of the same wind farm are all taken as the sample data of the representative wind turbine, which can increase the number of samples of the training set of the model, and make the model more accurate. The total power of the turbines under each micro-terrain is approximated as the power of the representative turbine multiplied by the number of turbines under the micro-terrain, and the power of each micro-terrain can be summed up to realize the cluster power prediction; the cluster prediction will inevitably have a certain degree of error, and the sample data of the turbine’s ice-covered data will be gradually increased over time. The subsequent modeling can be performed with the operation data of the representative turbine only, and then the cluster prediction, which can realize the wind prediction under windy weather under ice-covered weather. This can realize the accurate prediction of wind power under ice-covered weather. In addition, the prerequisite for cluster prediction is microtopographic zoning, and how to develop the criteria for zoning according to the ice-covered weather and how to improve the accuracy of prediction need to be further explored.

Author Contributions

Conceptualization, J.H., F.T., Q.H. and J.F.; writing—original draft preparation, J.H.; writing—review and editing, Q.H.; visualization, X.J.; supervision, Q.H.; project administration, M.N. and C.L.; funding acquisition, Y.C. and H.M. All authors have read and agreed to the published version of the manuscript.

Funding

This research was funded by CR Power Technology Research Institute (7RDJy1-CGFw-20240600008) Funded Projects.

Data Availability Statement

No new data were created or analyzed in this study.

Acknowledgments

Thank you for the support of China Resources Power Technology Research Institute and Chongqing University.

Conflicts of Interest

The authors declare that this study received funding from CR Power Technology Research Institute. The funder was not involved in the study design, collection, analysis, interpretation of data, the writing of this article or the decision to submit it for publication. Authors Jia He, Fangchun Tang and Junxin Feng were employed by the company China Resources Power Technology and Research Institute Co., Ltd. Authors Chaoyang Liu and Youguang Chen were employed by the company China Resources New Energy (Lianzhou) Wind Energy Co., Ltd. Authors Mengyan Ni and Hongdeng Mei were employed by the company China Resources New Energy (Liping) Wind Energy Co., Ltd. The remaining authors declare that the research was conducted in the absence of any commercial or financial relationships that could be construed as a potential conflict of interest.

References

  1. Huang, S.; Wang, J.; Guo, P.; Li, Z. Short-term strategy and long-term prospect of energy structure optimization under carbon neutrality target. Chem. Ind. Eng. Prog. 2022, 41, 5695–5708. [Google Scholar]
  2. Zhao, P.; Tu, J.; Yang, X. Research of wind power prediction based on PSO-KELM. Electr. Meas. Instrum. 2020, 57, 24–29. [Google Scholar]
  3. Sun, R.; Zhang, T.; He, Q.; Xu, H. Review on key technologies and applications in wind power forecasting. High Volt. Eng. 2021, 47, 1129–1143. [Google Scholar]
  4. Qiao, Y.; Lu, Z.; Min, Y. Research & application of raising wind power prediction accuracy. Power Syst. Technol. 2017, 41, 3261–3268. [Google Scholar]
  5. Miao, C.; Wang, X.; Li, H.; Han, L.; Wen, C. Day-ahead prediction of wind power based on NWP wind speed error correction. Power Syst. Technol. 2022, 46, 3455–3462. [Google Scholar]
  6. Chen, H.; Li, H.; Kan, T.; Zhao, C.; Zhang, Z.; Yu, H. DWT-DTCNA ultra-short-term wind power prediction considering wind power timing characteristics. Power Syst. Technol. 2023, 47, 1653–1662. [Google Scholar]
  7. Tang, D.; Zhou, Q.; Song, W. Short-term power prediction method of canyon wind power based on grid clustering. Power Supply Consum. 2023, 40, 80–87. [Google Scholar]
  8. Chen, C.; Liu, H. Medium-term wind power forecasting based on multi-resolution multi-learner ensemble and adaptive model selection. Energy Convers. Manag. 2020, 206, 112492. [Google Scholar] [CrossRef]
  9. Ayele, S.T.; Ageze, M.B.; Zeleke, M.A.; Miliket, T.A. Adama II wind farm long-term power generation forecasting based on machine learning models. Sci. Afr. 2023, 21, e01831. [Google Scholar] [CrossRef]
  10. Focken, U.; Lange, M.; Waldl, H.P. Previento-a wind power prediction system with an innovative upscaling algorithm. In Proceedings of the European Wind Energy Conference, Copenhagen, Denmark, 2–6 July 2001; p. 276. [Google Scholar]
  11. Cassola, F.; Burlando, M. Wind speed and wind energy forecast through Kalman filtering of Numerical Weather Prediction model output. Appl. Energy 2012, 99, 154–166. [Google Scholar] [CrossRef]
  12. Li, D.; Yu, X.; Liu, S.; Dong, X.; Zang, H.; Xu, R. Wind power prediction based on PSO-Kalman. Energy Rep. 2022, 8, 958–968. [Google Scholar] [CrossRef]
  13. Huang, S.; Chen, Y.; Jin, Y. A multi-channel feature combination model for ultra-short-term wind power prediction under carbon neutral background. Power Gener. Technol. 2021, 42, 60–68. [Google Scholar]
  14. Yang, Y.; Yang, L.; Lang, J.; Yanyan, Z. Study on Multi-Scenario wind power prediction based on LS-SVM algorithm. Smart Power 2017, 45, 58–63. [Google Scholar]
  15. De Giorgi, M.G.; Ficarella, A.; Tarantino, M. Error analysis of short term wind power prediction models. Appl. Energy 2011, 88, 1298–1311. [Google Scholar] [CrossRef]
  16. Cui, J.; Yang, J.; Yang, L.; Gao, K.; Song, Z.; Gao, Z. A wind farm power prediction method based on the combination of improved CFD and wavelet hybrid neural network. Grid Technol. 2017, 41, 79–85. [Google Scholar]
  17. Latimier, R.L.G.; Le Bouedec, E.; Monbet, V. Markov switching autoregressive modeling of wind power forecast errors. Electr. Power Syst. Res. 2020, 189, 106641. [Google Scholar] [CrossRef]
  18. Zhang, Y.; Zhao, Y.; Kong, C.; Chen, B. A new prediction method based on VMD-PRBF-ARMA-E model considering wind speed characteristic. Energy Convers. Manag. 2020, 203, 112254. [Google Scholar] [CrossRef]
  19. Yuan, X.; Tan, Q.; Lei, X.; Yuan, Y.; Wu, X. Wind power prediction using hybrid autoregressive fractionally integrated moving average and least square support vector machine. Energy 2017, 129, 122–137. [Google Scholar] [CrossRef]
  20. Chen, H.; Zhou, Y.; Wang, C.; Wang, J.; Han, H.; Lü, X. Economic analysis of system spinning reserve based on improved CNN-LSTM short term wind power prediction. High Volt. Eng. 2022, 48, 439–446. [Google Scholar]
  21. Olaofe, Z.; Folly, K. Wind power estimation using recurrent neural network technique. In Proceedings of the 2012 IEEE Power and Energy Society Conference and Exposition in Africa: Intelligent Grid Integration of Renewable Energy Resources (PowerAfrica), Johannesburg, South Africa, 9–13 July 2012; IEEE: Piscataway, NJ, USA, 2012; pp. 1–7. [Google Scholar]
  22. Hochreiter, S.; Schmidhuber, J. Long short-term memory. Neural Comput. 1997, 9, 1735–1780. [Google Scholar] [CrossRef]
  23. Zhou, H.; Zeng, J.; Wang, Z.; Zhao, Q. Ridgelet neural network model for short-term wind power forecasting based on the combination of chaos DNA genetic and particle swarm optimization algorithm. Power Syst. Prot. Control 2013, 41, 144–149. [Google Scholar]
  24. Zhu, Q.; Li, H.; Wang, Z.; Chen, J.; Wang, B. Short-Term wind power forecasting based on LSTM. Power Syst. Technol. 2017, 41, 6. [Google Scholar]
  25. Tascikaraoglu, A.; Uzunoglu, M. A review of combined approaches for prediction of short-term wind speed and power. Renew. Sustain. Energy Rev. 2014, 34, 243–254. [Google Scholar] [CrossRef]
  26. Peltola, E.; Laakso, T.; Ronsten, G.; Tallhaug, L.; Horbaty, R.; Baring-Gould, I.; Lacroix, A. State-of-the-art of wind energy in cold climates. IEA Annex XIX 2003, 24, 53. [Google Scholar]
  27. Fakorede, O.; Feger, Z.; Ibrahim, H.; Ilinca, A.; Perron, J.; Masson, C. Ice protection systems for wind turbines in cold climate: Characteristics, comparisons and analysis. Renew. Sustain. Energy Rev. 2016, 65, 662–675. [Google Scholar] [CrossRef]
  28. Kariniotakis, G.N.; Stavrakakis, G.S.; Nogaret, E.F. Wind power forecasting using advanced neural networks models. IEEE Trans Energy Convers. 1996, 11, 762–767. [Google Scholar] [CrossRef]
  29. Ormsbee, A.I.; Bragg, M.B. Trajectory Scaling Laws for a Particle Injected into the Wake of an Aircraft. Ph.D. Thesis, Aviation Research Laboratory, Institute of Aviation, University of Illinois at Urbana-Champaign, Champaign, IL, USA, 1978. [Google Scholar]
  30. Rasmussen, F.; Hansen, M.H.; Thomsen, K.; Larsen, T.J.; Bertagnolio, F.; Johansen, J.; Madsen, H.A.; Bak, C.; Hansen, A.M. Present status of aeroelasticity of wind turbines. Wind Energy 2010, 6, 213–228. [Google Scholar] [CrossRef]
  31. Bragg, M.B.; Broeren, A.P.; Blumenthal, L.A. Iced-airfoil aerodynamics. Prog. Aerosp. Sci. 2005, 41, 323–362. [Google Scholar] [CrossRef]
  32. Hochart, C.; Fortin, G.; Perron, J.; Ilinca, A. Wind turbine performance under icing conditions. Wind Energy Int. J. Prog. Appl. Wind Power Convers. Technol. 2008, 11, 319–333. [Google Scholar] [CrossRef]
  33. Barber, S.; Wang, Y.; Jafari, S.; Chokani, N.; Abhari, R.S. The impact of ice formation on wind turbine performance and aerodynamics. J. Sol. Energy Eng. 2011, 133, 011007. [Google Scholar] [CrossRef]
  34. Lamraoui, F.; Fortin, G.; Benoit, R.; Perron, J.; Masson, C. Atmospheric icing impact on wind turbine production. Cold Reg. Sci. Technol. 2014, 100, 36–49. [Google Scholar] [CrossRef]
  35. Yirtici, O.; Cengiz, K.; Ozgen, S.; Tuncer, I.H. Aerodynamic validation studies on the performance analysis of iced wind turbine blades. Comput. Fluids 2019, 192, 104271. [Google Scholar] [CrossRef]
  36. Ibrahim, G.M.; Pope, K.; Naterer, G.F. Extended scaling approach for droplet flow and glaze ice accretion on a rotating wind turbine blade. J. Wind Eng. Ind. Aerodyn. 2023, 233, 105296. [Google Scholar] [CrossRef]
  37. Zhang, P.; Yang, T.; Lu, X. Influence of icing pattern on aerodynamic performance of wind turbine airfoils. J. Chin. Soc. Power Eng. 2011, 31, 955–959. [Google Scholar]
  38. Hao, Y.; Liu, G.; Yang, L.; Chen, Y.; Li, L. Study on ice numerical simulation and its power loss characteristics for the blades of wind turbine. Trans. China Electrotech. Soc. 2015, 30, 292–300. [Google Scholar]
  39. Li, H.; Shu, L.; Hu, Q.; Jiang, X.; Qiu, G. Numerical Simulation of Wind Turbine Blades Aerodynamic Performance Based on Ice Roughness Effect. Trans. China Electrotech. Soc. 2018, 33, 2253–2260. [Google Scholar]
  40. Gao, L.; Tao, T.; Liu, Y.; Hu, H. A field study of ice accretion and its effects on the power production of utility-scale wind turbines. Renew. Energy 2021, 167, 917–928. [Google Scholar] [CrossRef]
  41. Shu, L.; Yu, Z.; Li, H.; Hu, Q.; Jiang, X. Calculation method of wind turbine output power under clean and icing conditions verified by field tests. Trans. China Electrotech. Soc. 2023, 38, 3041–3051. [Google Scholar]
  42. Jiang, B. A Hybrid Times-Scale Assessment Method for Wind Power Density in Complex Mountainous Areas Based on Improved Xgboost. In Proceedings of the 2020 12th International Conference on Measuring Technology and Mechatronics Automation (ICMTMA), Phuket, Thailand, 28–29 February 2020. [Google Scholar]
  43. Fan, Q.; Wen, X.; Lin, C.; Zhang, Y. Research on meteorological impact factors of wind farm output power in plateau mountainous areas. In Proceedings of the 2017 2nd International Conference on Power and Renewable Energy (ICPRE), Chengdu, China, 20–23 September 2017; pp. 372–376. [Google Scholar]
  44. Scher, S.; Molinder, J. Machine learning-based prediction of Icing-Related wind power production loss. IEEE Access 2019, 7, 129421–129429. [Google Scholar] [CrossRef]
  45. Molinder, J.; Scher, S.; Nilsson, E.; Körnich, H.; Bergström, H.; Sjöblom, A. Probabilistic forecasting of wind turbine icing related production losses using quantile regression forests. Energies 2021, 14, 158. [Google Scholar] [CrossRef]
  46. Wang, H.; Wang, H.; Wang, C. Short-term output modeling of wind farms accounting for the effects of snow and ice. Power Syst. Prot. Control 2016, 44, 107–114. [Google Scholar]
  47. Best, A.C. The size distribution of raindrops. Q. J. R. Meteorol. Soc. 1950, 76, 16–36. [Google Scholar] [CrossRef]
  48. Minár, J.; Evans, I.S. Elementary forms for land surface segmentation: The theoretical basis of terrain analysis and geomorphological mapping. Geomorphology 2008, 95, 236–259. [Google Scholar] [CrossRef]
  49. Pirazzini, R. Factors Controlling the Surface Energy Budget over Snow and Ice; Finnish Meteorological Institute: Helsinki, Finland, 2008. [Google Scholar]
  50. Nienhuys, S. Basics of Thermal Insulation in High Altitude Areas of the Himalayas; 2012. Available online: https://www.researchgate.net/profile/Sjoerd-Nienhuys/publication/231182890_BASICS_OF_THERMAL_INSULATION_IN_HIGH_ALTITUDE_AREAS_OF_THE_HIMALAYAS/links/09e41506562bba1f2b000000/BASICS-OF-THERMAL-INSULATION-IN-HIGH-ALTITUDE-AREAS-OF-THE-HIMALAYAS.pdf (accessed on 24 February 2025).
  51. Oettli, P.; Camberlin, P. Influence of topography on monthly rainfall distribution over East Africa. Clim. Res. 2005, 28, 199–212. [Google Scholar] [CrossRef]
  52. Shu, L.; Li, H.; Hu, Q.; Jiang, X.; Qiu, G.; McClure, G.; Yang, H. Study of ice accretion feature and power characteristics of wind turbines at natural icing environment. Cold Reg. Sci. Technol. 2018, 147, 45–54. [Google Scholar] [CrossRef]
  53. Shu, L.; Li, H.; Hu, Q.; Jiang, X.; Qiu, G.; He, G.; Liu, Y. 3D numerical simulation of aerodynamic performance of iced contaminated wind turbine rotors. Cold Reg. Sci. Technol. 2018, 148, 50–62. [Google Scholar] [CrossRef]
Figure 1. Schematic diagram of ANN for wind power prediction.
Energies 18 01686 g001
Figure 2. Typical structure of LSTM network.
Energies 18 01686 g002
Figure 3. Relationship between meteorological quantities and ice cover thickness.
Energies 18 01686 g003
Figure 4. Schematic diagram of representative wind turbines.
Energies 18 01686 g004
Figure 5. Flowchart for accurate prediction of microclimate in microtopographic regions.
Energies 18 01686 g005
Figure 6. Microclimate classification criteria.
Energies 18 01686 g006
Figure 7. Schematic diagram of ice thickness at the blade leading edge.
Energies 18 01686 g007
Table 1. Classification of forecasting methods.
Classification of Prediction MethodsTime Scale
Ultra-short-term forecastsWithin 30 min
Short-term projections30 min–6 h
Medium-term forecast6 h–24 h
Long-term projectionsMore than 24 h
Table 2. Scenarios for the use of different prediction methods and their advantages and disadvantages.
Model TypeApplicable ScenariosAdvantagesDisadvantages
Kalman Filter
Real-time prediction
Noisy data
Linear or near-linear systems
Strong real-time performance, suitable for dynamic systems
Effective in handling noise
Limited effectiveness for nonlinear systems
Requires accurate system models and noise statistics
Traditional Machine Learning
Small to medium-sized datasets
Clear features (e.g., wind speed, temperature)
Limited computational resources
Simple models, easy to implement
Good performance on small to medium-sized datasets
Limited effectiveness on large datasets and high-dimensional features
Relies heavily on feature engineering
Time Series Forecasting
Strong time dependency
Short-term prediction (e.g., next few hours or days)
Captures trends and periodicity in time series
Suitable for short-term forecasting
Limited ability to handle nonlinear relationships
Poor performance for long-term forecasting
Deep Learning
Large datasets
Complex nonlinear relationships
Long-term prediction (e.g., next few days or weeks)
Automatically extracts features, reducing reliance on feature engineering
Excellent performance on large datasets
Requires large amounts of data and computational resources
Complex models with long training times
Table 3. Correlation coefficients between meteorological elements and wind power outputs.
Weather VariablesCorrelation CoefficientWeather VariablesCorrelation Coefficient
Air velocity0.472Direction of the wind0.025
Pressure−0.564Humidity−0.433
Temp0.491Rainfall−0.448
Disclaimer/Publisher’s Note: The statements, opinions and data contained in all publications are solely those of the individual author(s) and contributor(s) and not of MDPI and/or the editor(s). MDPI and/or the editor(s) disclaim responsibility for any injury to people or property resulting from any ideas, methods, instructions or products referred to in the content.