Article

Optimizing Anaerobic Co-Digestion Formula of Agro-Industrial Wastes in Semi-Continuous Regime

1
Department of Field Crops: Biomass and Bioproducts, Centre for Scientific and Technological Research of Extremadura (CICYTEX), Counseling of Education, Science and Vocational Training, Junta of Extremadura, 06187 Guadajira, Badajoz, Spain
2
Department of Applied Physics, School of Industrial Engineering, Avda. de Elvas, S/N, 06006 Badajoz, Badajoz, Spain
*
Author to whom correspondence should be addressed.
Energies 2025, 18(7), 1689; https://doi.org/10.3390/en18071689
Submission received: 21 February 2025 / Revised: 19 March 2025 / Accepted: 25 March 2025 / Published: 28 March 2025
(This article belongs to the Special Issue Sustainable Biofuels for Carbon Neutrality)

Abstract

:
The actual environmental and energy crises are two of the main problems existing in the world. Among the different technologies that can be implemented is anaerobic digestion, which employs waste and renewable biomass materials. To reach the optimum ratio of different raw materials or substrates in the feed of digesters, laboratory tests are necessary. This work aims to study the increase in the Organic Load Rate (OLR) (1 g VS L−1d−1, 2 g VS L−1d−1, 3 g VS L−1d−1 and 4 g VS L−1d−1, VS: Volatile Solid) and the raw materials number (sorghum (S), pig manure (P), triticale (T), corn stover (C) and microalgae biomass (M)) in the feedstock of the anaerobic digestion process. Mean values of methane yields for the evaluated set were lower in SMP and SMPTC assays (149.80 LCH4 kg VS−1 and 157.15 LCH4 kg VS−1, respectively) than SP, SM and SMPT assays (195.09 LCH4 kg VS−1, 197.69 LCH4 kg VS−1 and 195.76 LCH4 kg VS−1, respectively). Along the experiments, several parameters were evaluated, along with their interactions with OLR and number of raw materials. Two kinetic models were employed to fit the COD (Chemical Oxygen Demand) removal results.

1. Introduction

Climate change is one of the main problems in the world, so people need to be made aware of this issue. In Europe, the European Commission, the Climate Change Agreement and the United Nations establish diverse plans to obtain different objectives in the fight against climate change. However, each country must adhere to different guidelines to achieve its specific objectives. According to the National Plan of Energy and Climate of Spain, it is planned to reduce the importation of fossil fuels by EUR 75,379 million in 2030 That means, an energetic dependence of 59% against the 74% nowadays. Additionally, 2222 premature deaths from pollution will be avoided by 2030 [1]. Introducing renewable energies in industries helps to achieve decarbonization. Energetic gases can be useful to meet the energetic demand of industries and to generate electricity. The energetic use of biogas in Spain is far from the potential achieved in other countries of the European Union. All these reasons lead to work in processes to obtain biogas and to show the different alternatives of raw materials to acquire the energetic gas.
Anaerobic digestion (AD) is the process to obtain biogas. However, biogas yield is too low to make a biogas plant profitable due to low organic matter in simple raw material. A C/N ratio far from adequate values for an anaerobic digestion process can increase the risk of inhibition caused by high contents of ammonia nitrogen [2,3,4]. So, an anaerobic co-digestion (ACo-D) is carried out normally. ACo-D processes integrate more than one raw material in the digestion, the biogas yield is increased, and the process is more stable. In the same way, ACo-D processes improve pH buffer capacity and decrease concentrations of Volatile Fatty Acids (VFAs) [5,6]. Parameters mentioned are essential to control the ACo-D; high alkalinity measured by the equilibrium carbon dioxide–bicarbonate provides an excellent buffer capacity to avoid VFA accumulations and drops in pH values [7]. Ammonia nitrogen content can be toxic in ACo-D if threshold values are exceeded. Mosquera et al. [6] mentioned values above 1500–3000 mg L−1 as possible reason for inhibition of the process. However, monitoring studies in different biogas plant operating establishes the limit in the ammonia nitrogen content in a value of 5000 mg L−1 [8]. According to the last author, VFA concentrations are placed in 4000 mg L−1 as maximum permissible value to obtain the stability of the process, while Lorenzo and Obaya [9] maintain values of 2000 mg L−1 as inhibitory in the ACo-D process.
There are many raw materials that can be subjected to anaerobic co-digestion processes either for its high content in carbon or for its content in nitrogen or good buffer capacity. In this work, two kinds of raw materials have been chosen, one of them to provide an increase in carbon content in the digestion medium (sorghum, triticale and corn stover), and another to ensure stability to the process, with suitable nitrogen content and alkalinity concentration (microalgae biomass and pig manure). In the first group, substrates have been evaluated in diverse research works due to their origin as energy crops for sorghum and triticale and the waste cataloging in the field of corn stover. All of them have obtained excellent results of methane yield. Dareioti and Kornaros [10] achieved a value of 326 LCH4 kg VS−1 when the digestion was developed with pretreated silage sorghum, liquid cow sludge and cheese whey. Cantale et al. [11] studied 10 different varieties of triticale in batch regime anaerobic digestion process and obtained values ranging from 570 to 674 LCH4 kg VS−1. A chemical pretreatment of corn stover carried out by Khatri et al. [12] in batch regime assays achieved a methane yield of 473 LCH4 kg VS−1. In the second group, pig manure and microalgae biomass are raw materials responsible for providing stability to the process, but by themselves, it is not possible to obtain an elevated methane volume. Biomass microalgae mixture with tomato waste was studied in co-digestion anaerobic batch assays employing diverse proportions, obtaining the most productive mixture for 25:75 biomass microalgae–tomatoes waste with 266 LCH4 kg VS−1 [13]. Pig manure was co-digested with food waste using a 1:1 ratio on VS basis at different TS content, achieving 291.7 LCH4 kg VS−1 at 10% in TS by Wang et al. [14]. Other authors used the filamentous microalgae to improve the methane production of pig manure, varying the microalgae-to-pig manure ratios in the feed. Results obtained by these authors show values ranged from 300 to 600 LCH4 kg VS−1 [15]. Wang et al. researched the feedstock-to-inoculum ratio from the co-digestion of pig manure, corn stover and cucumber residue [16]. Pecar and Gorsek evaluated the kinetic of methane yield during anaerobic digestion of chicken manure with sawdust and miscanthus [17]; however, there is limited information on the feedstock composed by more than three raw materials.
Given the complexity of the substrate studied, mathematical models are used to evaluate the experimental results obtained. Models selected to describe the kinetics of COD removal were the second-order models. These models were also used to obtain the kinetic parameters of anaerobic processes when inhibition by substrate concentration or by presence of inhibitory compounds was detected, such as occurs for piggery wastewater, chicken manure or untreated two-phase olive pomace in the research work developed by De la Lama et al. [18].
The purpose of the present study is to assess the performance and stability of digesters by increasing the OLR and the number of raw materials in the feedstocks (sorghum, microalgae biomass, corn stover, pig manure and triticale) with a view to contributing as much as possible to the fight against the environmental and energy crises. Five assay sets were developed, analyzing the biogas and methane productions. For this purpose, several parameters were evaluated, carrying out experiments through statistical treatment, and their interactions with OLR and number of raw materials were established. Moreover, for predicting the performance of assays, experimental results were fitted to two kinetic models.

2. Materials and Methods

2.1. Evaluated Raw Materials

Different wastes, energy crops or biomasses were employed in this research to study the AD process in semi-continuous regime. Pig manure (P) and corn stover (C) were chosen as agricultural waste, the energy crop evaluated was sorghum (S) and biomasses from microalgae (industrial waste) and straw of triticale crop (M and T) were used. All raw materials evaluated were collected from a research center located in Guadajira (Badajoz, Spain) (+38°51′9.6768″, −6°40′15.5418″). Vegetable raw materials (S, C and T) were used milled, which means that they required previous pretreatments. These pretreatments consisted of crushing prior to the silage process and after the harvest of them. Before the AD, the material (for M, this treatment was performed too) was dried at 105 °C and finally milled. An inoculum was employed to help the development of specific microorganisms. The inoculum used in assays consisted of mixture of completely degraded organic material, with a high content of methanogenic microorganisms. Inoculum composed of a mixture of prickly pear and pig manure.

2.2. Experiment Design and Equipment Employed

Anaerobic reactors (Talleres Agrícolas Obreo Díez, Badajoz, Spain) were employed to develop the assay sets mentioned above. These reactors are made of stainless steel, and 4.5 L is the useful capacity to work. Mesophilic temperature range (38 °C) was used in these assays. Temperature can be maintained through the outer jacket of the reactors being filled with hot water and controlled by a thermostat. For homogenization substrates studied, a central agitator moved electrically.
The procedure of experiments consisted of a daily feeding of substrate mixtures. The experiment design was performed for five experiment sets, and each set was composed of four experiments at different OLRs (1, 2, 3 and 4 g VS L−1d−1). The mixture fed to digester was different for each set evaluated: two substrates composed the two first sets, three substrates the third set, four substrates the fourth set and five substrates the fifth set. Assays were identified with the letter of the raw material and the number of the OLR evaluated. For instance, SMPTC3 studied sorghum (S), microalgae biomass (M), pig manure (P), straw of triticale (T) and corn stover (C), and this assay was working with an OLR of 3 g VS L−1d−1. Table 1 explains each assay carried out in this research. Manually fed digesters were realized with a syringe three times a day. The SM set employed 100 mL of water to dissolve sorghum and microalgae biomass substrates.

2.3. Analytical Methods

Standard methods [19] were employed for substrate characterization. The Total Solid (TS) and Volatile Solid (VS) contents were determined by drying the sample in an oven (JP Selecta Digitheat, Cincinnati, OH, USA) at 105 °C for 48 h (2540 B method) and at 550 ° C for 2 h in a muffle oven (Hobersal 12PR300CCH, Barcelona, Spain) in an inert atmosphere (2540 E method), respectively. Electrodes were employed to measure pH and redox potential values of the digestion medium. To determinate the alkalinity of the medium, method 2320 was used. For Chemical Oxygen Demand (COD) of substrates evaluated, method 410.4 [20] was employed. A volumetric titration, according to the E4500-NH3 B method, was carried out to obtain the ammonia nitrogen (N-NH4), and Buchauer’s volumetric method [20] was used to find total Volatile Fatty Acids (VFAs). The initial C/N ratio in the substrates was determined according to Dumas method (True-Spec CHN Leco 4084 elementary analyzer (Bloomfield, CT, USA)) and the criteria set by the standard UNE-EN 16948 for biomass analysis of C, N and H [21]. Components of biogas produced in assays were automatically monitored on-site throughout the experiments with an Awite System of Analysis Process series 9 analyzer (Bioenergie GmbH, Waldmünchen, Germany). Sensors of the analyzer mentioned are the following: two IR sensors for methane and carbon dioxide measurements and three electrochemical sensors for hydrogen, hydrogen sulfide and oxygen contents. Individually, counters were located for each anaerobic reactor (Ritter model MGC-1 V3.2 PMMA, Waldenbuch, Germany) to measure the biogas produced, which was stored in Tedlar bags. Biogas produced was expressed at standard conditions (0 °C, 101,325 kPa). Finally, digestate obtained in assays was characterized. Digestate samples were digested in a microwave (Millestone Start D, Milan, Italy) and subsequently analyzed in a spectroscopy ICP-OES Varian 715 ES (Agilent Technologies, Santa Clara, CA, USA).

2.4. Statistical Treatment of Results

A statistical treatment of results of COD, VS, C/N ratio, ammonia nitrogen, alkalinity and VFA performance variables was carried out. These variables were subjected to an ANOVA (Analysis of Variance) of a factor and means separation to study the statistical significance (p-value of 0.05) per each experiment set (four experiments per set) separately. Six repetitions per sample were studied. The statistical program used was Minitab 18.

2.5. Evaluation of Substrate Removal Kinetic Models

Kinetic models were used to determine the relationship between some variables and the experimental results. In this research, two kinetic models were employed based on the substrate removal rate, Grau second-order multicomponent and Modified Stover–Kicannon models [18].
A complete mixed-hydraulic condition must be considered to apply the Grau second-order multicomponent model. When multicomponent substrates are evaluated, the substrate removal rate can be expressed according to Equation (1):
d S d t = k n ( s ) · X · S e S i n
where −dS/dt is the substrate removal rate, kn(s) is the reaction constant, X is the concentration of the microorganisms, which can be assumed as constant, Se is the substrate concentration at any time and Si is the initial substrate concentration.
Integrating Equation (1) for n = 2 and linearizing it after, the following linear expression is obtained, as shown in Equation (2):
S i · HRT S i S e = HRT + S i k s · X
The value of the second-order reaction constant can be obtained by the plot of (Si·HRT)/(SiSe) versus HRT (Hydraulic Retention Time). The term HRT is the Hydraulic Retention Time value for each set assay.
In the Modified Stover–Kicannon model, the substrate removal rate is expressed as function of the OLR, as follows in Equations (3) and (4):
d S d t = S i S e HRT
d S d t = U max · S i HRT k B + S i HRT
where dS/dt is the substrate removal rate, kB is the reaction constant, Umax is the maximum substrate removal rate, Si and Se are the substrate concentrations explained above and HRT is the Hydraulic Retention Time, as specified before.
When Equations (3) and (4) are equalized and integrated, and the resulting expression is linearized after, the Equation (5) is obtained, as follows:
HRT S i S e = k B U max · HRT S i + 1 U max
Experimental results fitted to Equation (5) give a linear expression where the reaction constant can be obtained from the slope.

3. Results and Discussion

3.1. Experiment Set Analysis

Physicochemical characteristics of raw materials are shown in Table 2. All raw materials were analyzed in the state used in the assays studied, S, C, T and M, on a dry basis and P on a wet basis. Two main objectives were evaluated in raw materials researched. Substrates with a high N content and alkalinity are suitable for AD microorganisms (P and M), and substrates with elevated C/N ratios in the raw materials achieved enough organic matter for the AD microorganisms (S, C and T).
Raw materials’ influence was evaluated in the AD process, establishing different mixtures in the digester feed. This influence was measured through the methane yield obtained for each experiment designed. Five experiment sets were performed, studying a different mixture in the feed, and each experiment set was developed at four different values of OLR.
An exhaustive analysis of Figure 1 shows a constant evolution of methane yield in the process for experiment sets evaluated. Higher differences in the methane yield are presented in experiments from the first graph (left) in Figure 1. It can be observed that a positive influence of S was contained in the mixture feed for the methane yield evaluated. SP and SM sets have the most elevated proportions of S, and the methane yield shows higher values than methane yields of the SMP, SMPT and SMPTC sets. According to previous research [22], the S methane yield potential is more elevated than M, P, T and C, as can be observed in Table 1. Nonetheless, an increase in OLR (Figure 1) induces a decrease in the methane yield of the SP and SM sets.
As OLR increases, the organic matter from raw materials is also elevated for methanogenic microorganisms; so, the methane yields are shown to be very similar for all experiment sets. It reflects a slight decrease in the SP and SMP sets when the methane yield is represented in graphs above in Figure 1. These sets contain the highest P proportions in the feed mixture to the digester. It is normal to see a downward trend in the AD process development because the COD and VS contents of this substrate (Table 2) are the lowest of all raw materials studied in this research.
Table 3 shows the methane yield obtained from experiments carried out at different OLRs, referred to as the digester volume (X1) and the feed VS amount (X2). An increase in the methane volume produced can be observed when the OLR value is higher; if the results are referred to, the digester volume in all experiments sets is studied. However, if the methane yield is expressed in terms of VS feed, the trend shown in Table 3 is not the same, and the different experiment sets’ behaviors vary. The SP, SM, SMP and SMPT sets show a decrease in the methane yield when the OLR is increasing, but in the most elevated OLR value studied, the methane yield increases again for the SP and SMP experiment sets. The trend of the SMPTC set is the opposite. An increase is experimented for OLR values elevated, and the methane yield value decreased when the OLR evaluated was the highest. According to the literature, variability in the substrates used in the feed mixture to the digester leads to higher methane yields [23]; however, in this work, a marked effect is not observed when the raw material numbers in the feed mixture is increased. The reason probably is found in the ratio of substrates, which provides buffer power (P and M) and vegetable substrates (S, T and C) with elevated carbon content. The ratio between the mentioned substrates employed in the SMPTC set was not 1:1 (it can be observed in Table 1). It happens in the SMP set also (Table 1), and this is the reason the mean values (X3) for each evaluated set are lower in SMP and SMPTC (149.80 LCH4 kg VS−1 and 157.15 LCH4 kg VS−1, respectively) than in SP, SM and SMPT (195.09 LCH4 kg VS−1, 197.69 LCH4 kg VS−1 and 195.76 LCH4 kg VS−1, respectively). Other researchers achieved methane yields of 178 LCH4 kg SV−1 when the OLR was 1 g VS L−1d−1, working with wheat straw [24]. This result supports the hypothesis that a co-digestion of several raw materials increases the methane yields obtained, obviously in the right proportion. Hermann et al. [25] published mean values of 295.5 LCH4 kg VS−1, evaluating a mixture of microalgae (45%) and beet (55%) previously siled, and higher results than the SM set were carried out in this work. Even though Hermann et al. [25] obtained inhibition in the experiment carried out with an OLR of 4 g VS L−1d−1, it was not observed in the SM4 experiment, with a methane yield of 170.49 LCH4 kg VS−1 (Table 3).
In the methane concentration of biogas produced, a wide range in values obtained was not observed, it was varying between 48% and 54%.

3.2. Parameter Evaluation Along the Process

To control experiment sets evaluated, a weekly sample was analyzed. Results obtained have been subjected to ANOVA statistical treatment (it can be observed in Table 4). A significant difference between experiments is represented by different letters. Regarding COD and VS parameters evaluated in experiment sets, an increase is reflected in their values when the OLR achieves higher values, as is expected. Significant differences are found in SP and SMPT sets with respect to theVS parameter, and the significant differences shown in the COD parameter appear in SMP and SMPT sets.
For VFA parameters, significant differences are not shown for any experiment set in Table 4. However, an elevated concentration is highlighted for the SMPT and SMPTC sets in the VFA parameter; concretely, the SMPT set exceeded threshold values considered inhibitory in the anaerobic digestion process, 4000 mg L−1 [8]. Nonetheless, this study confirmed that the right operation of biogas plants explaining that microorganisms are acclimated achieves higher stability when the VFA concentration increases until values near the inhibitory, and then, methane yields are not so affected by the elevated VFA concentration.
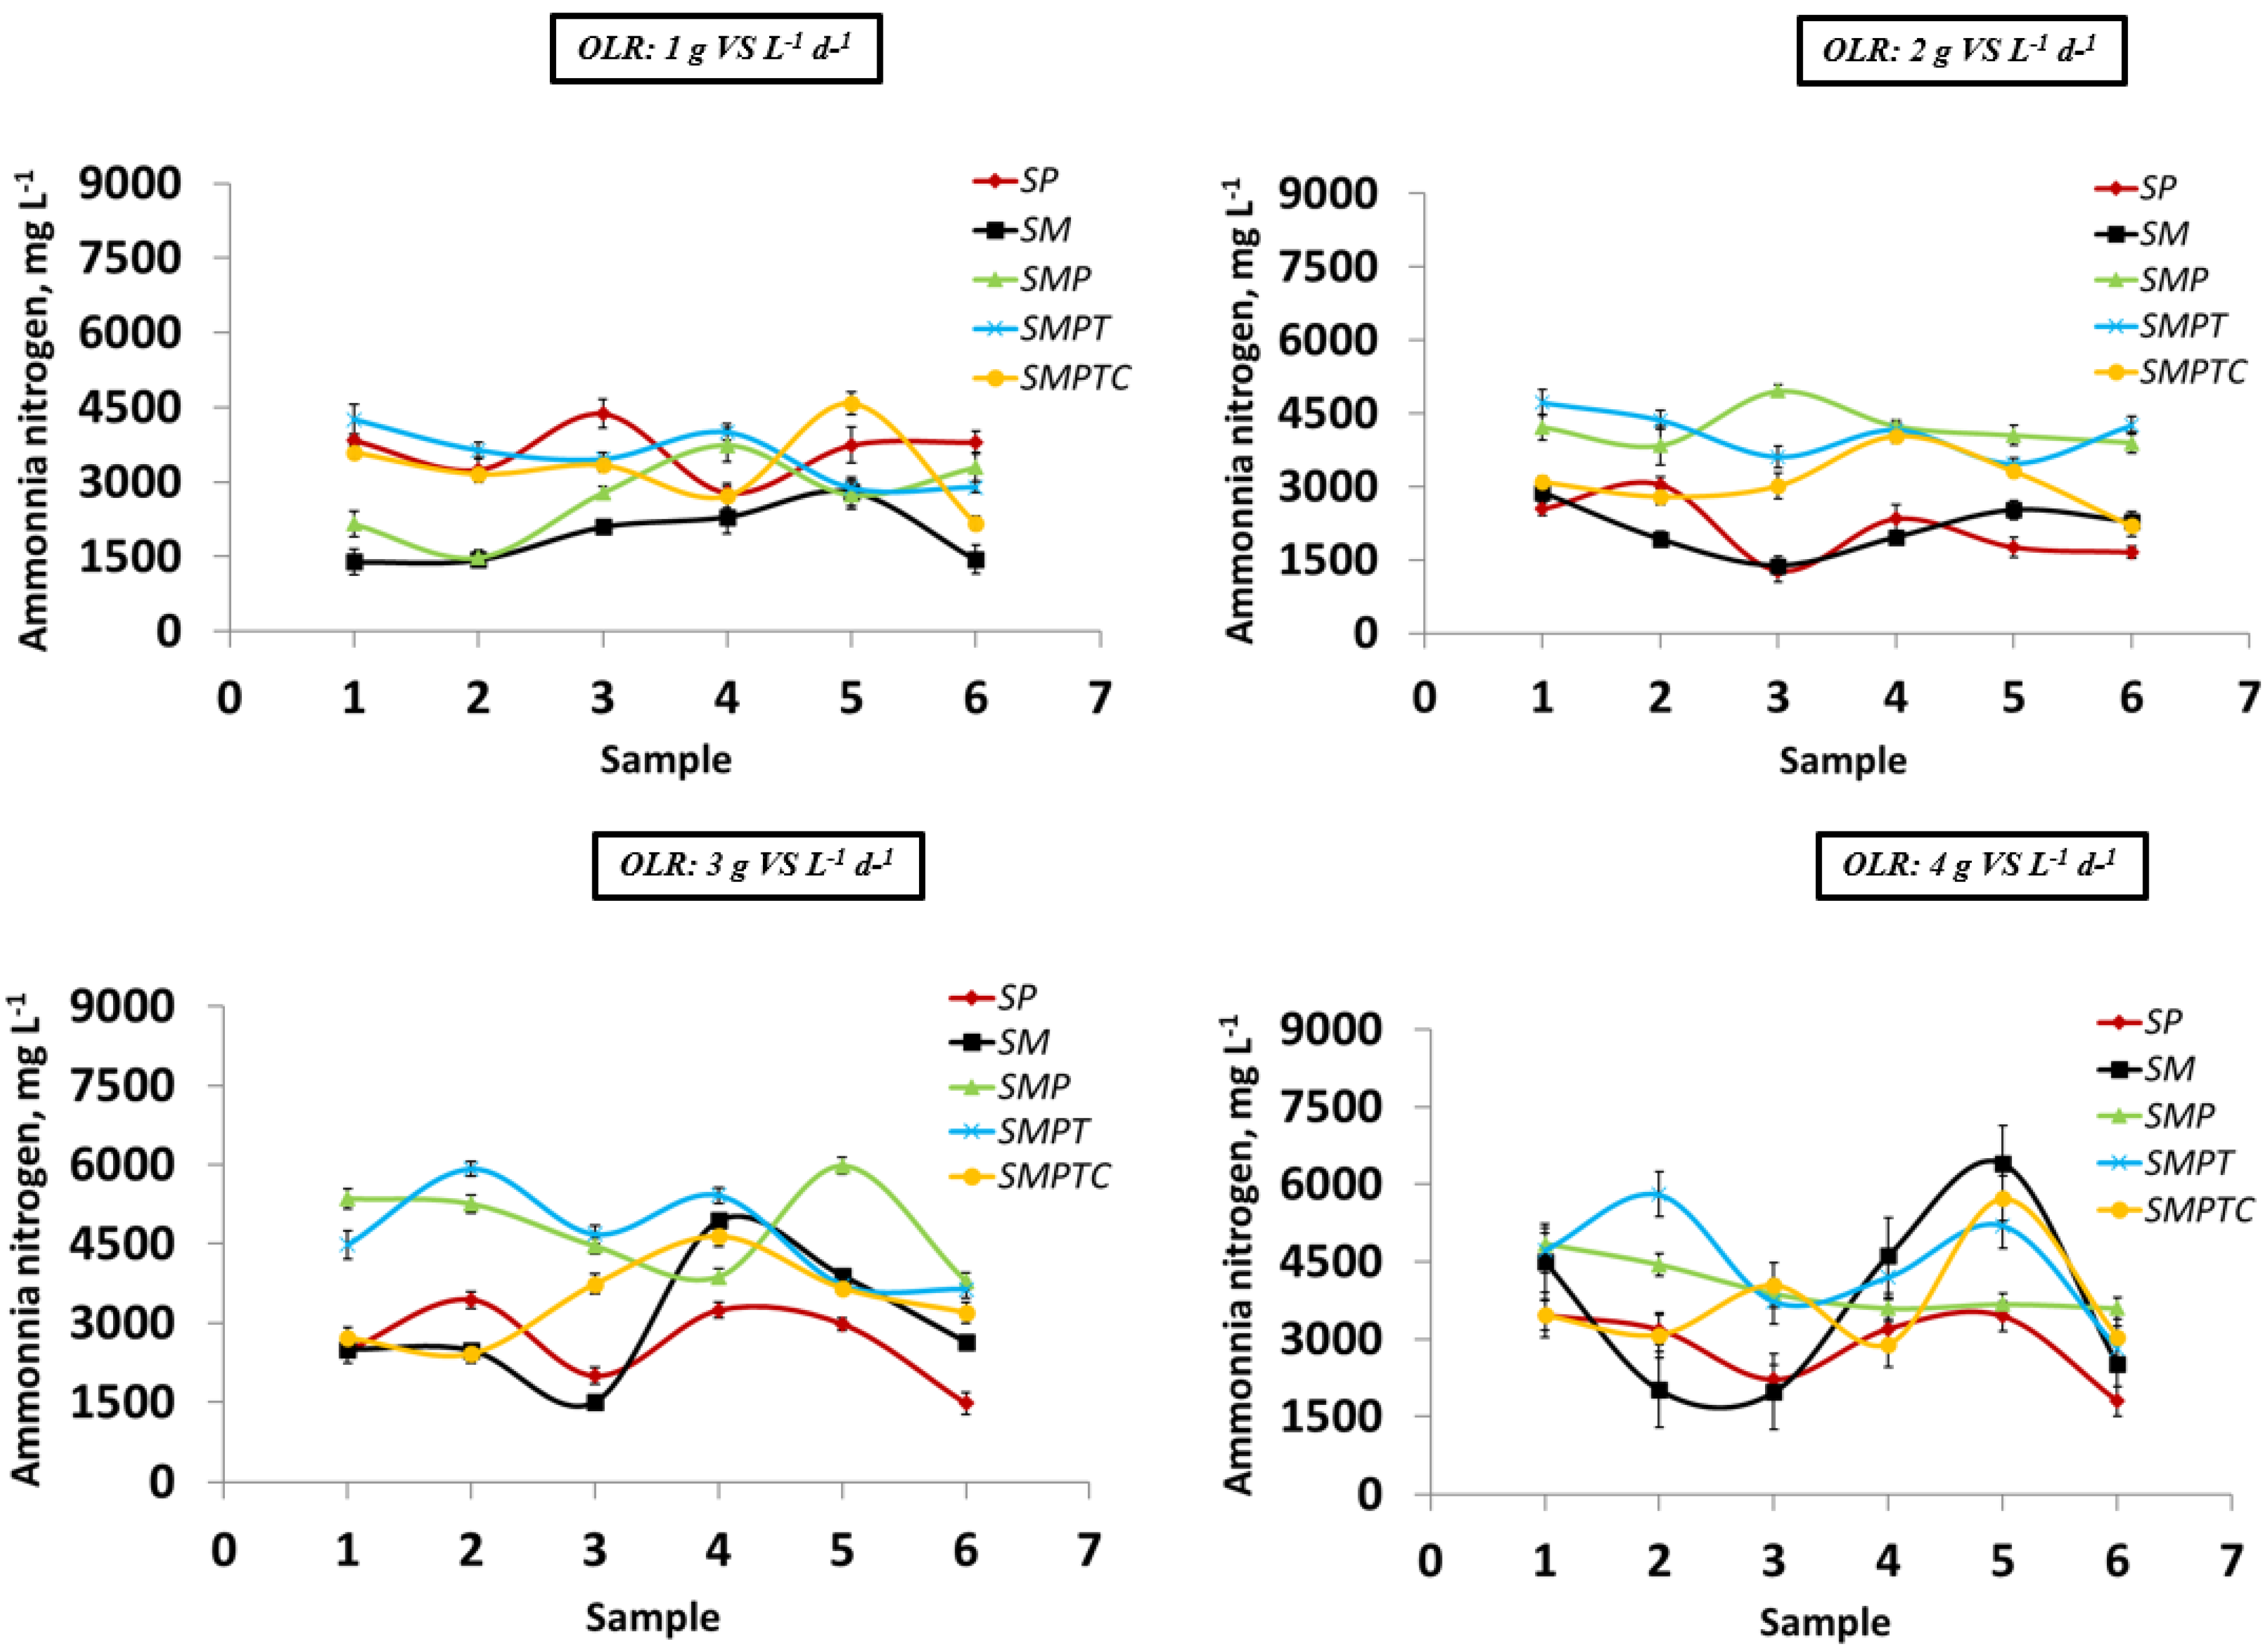
For the SMP and SMPT sets, ammonia nitrogen concentrations are higher than the rest of the sets carried out. According to the literature, inhibitory values would have been overcome (2000–3000 mg L−1) [26]. Other researchers regard the limit value of ammonia nitrogen in 5000 mg L−1 [8]. For this parameter, the stability of the process will depend on the adaptation of the microorganism to the medium conditions. Significant differences between SP set experiments are observed in Table 4 due to the use of different pig manures in SP1 experiment versus SP2 to SP4 experiments. In the SMP set, significant differences locate the experiment SMP1 in a different group than the rest of experiments in the same set. It could be due to the ratio between S and the buffered substrates (M and P). Concretely, there are lower amounts of S than M and P, substrates with elevated ammonia nitrogen concentrations. It seems to indicate a decrease in the OLR evaluated entails low ammonia nitrogen content in the digester.
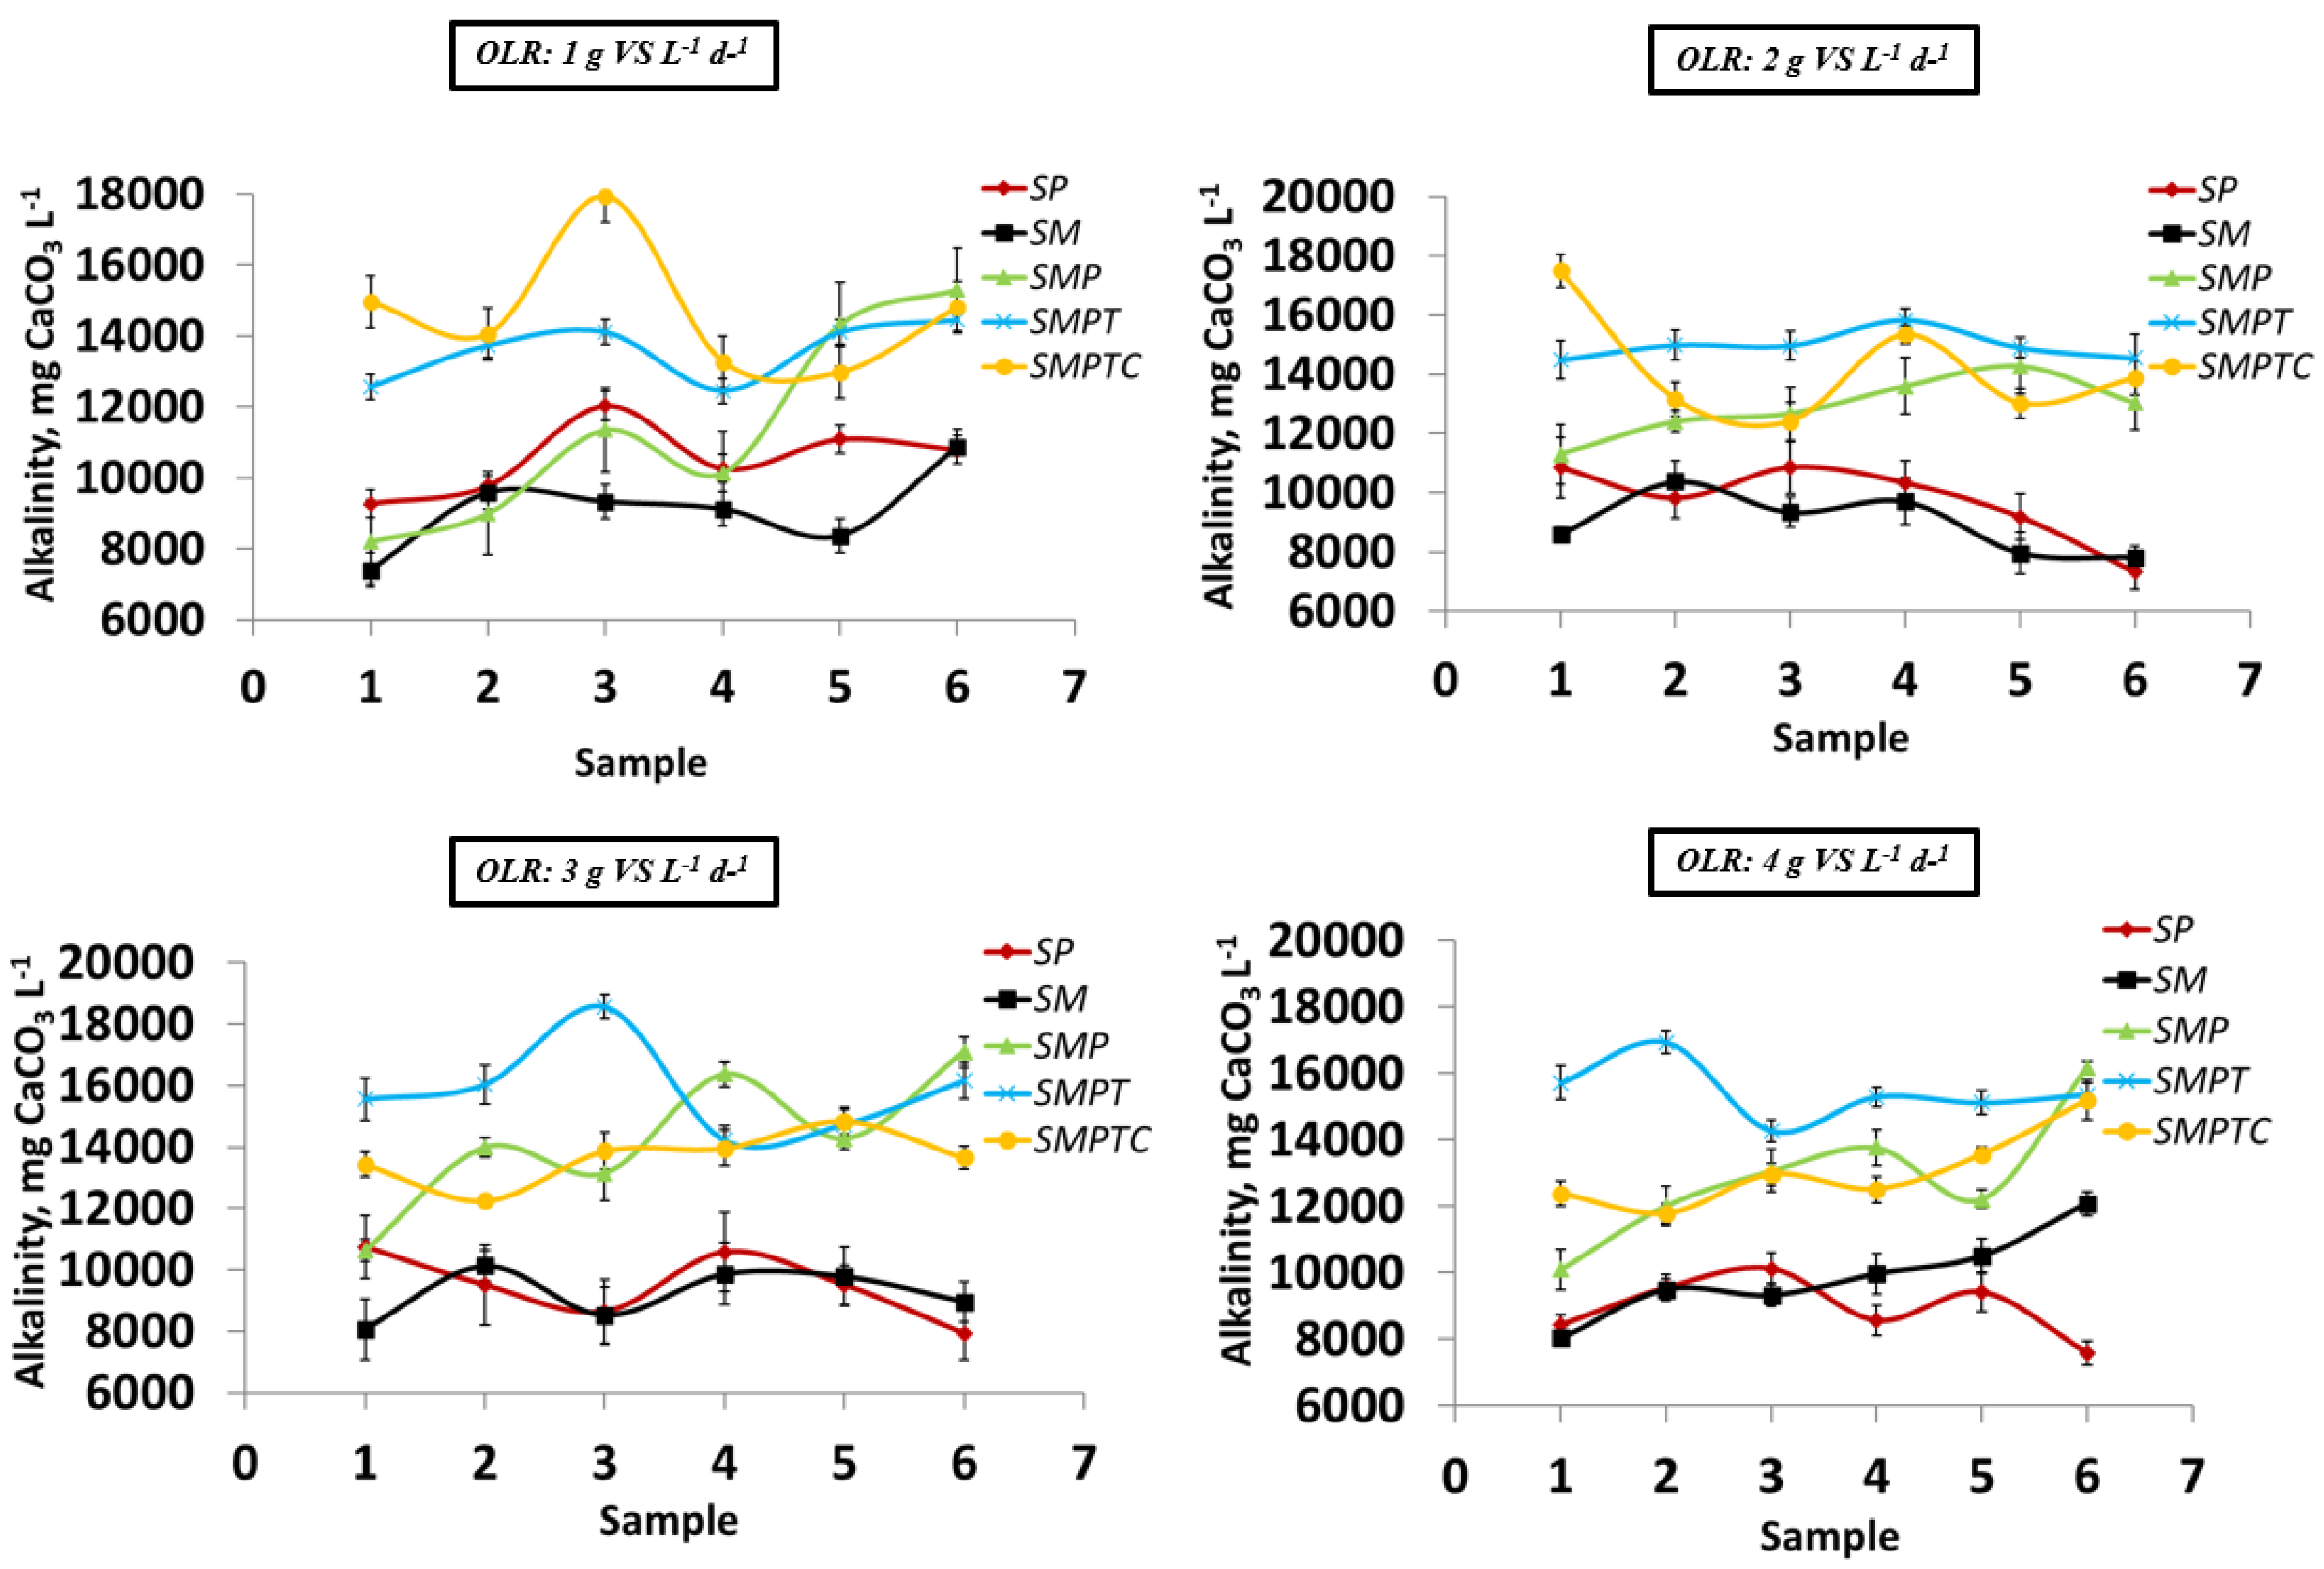
An evolution of some parameters studied along the process is represented in Figure 2, Figure 3 and Figure 4. According to Figure 2, the evolution shown in the VFA indicates more stability in this parameter using less substrates in the feed mixture. This behavior is observed for each OLR evaluated, and the AD process needs those higher values reached in this parameter for SMP, SMPT and SMPTC to be compensated continuously. However, for alkalinity and ammonia nitrogen, the mentioned trend is not observed. An appreciable separation between the SP and SM sets is shown in the alkalinity evolution represented in Figure 3 when compared to the SMP, SMPT and SMPTC sets studied in all OLRs evaluated. Lower values in alkalinity are obtained in the SP and SM experiment sets opposite the rest of the experiment sets carried out in this work. Buffer capacity (alkalinity) is higher in sets evaluated with greater substrate numbers due to the need to buffer the digestion medium to compensate for the increase in the VFA and ammonia nitrogen values, as observed in Figure 2 and Figure 4.

3.3. Interactions of Parameters Measured in the Process

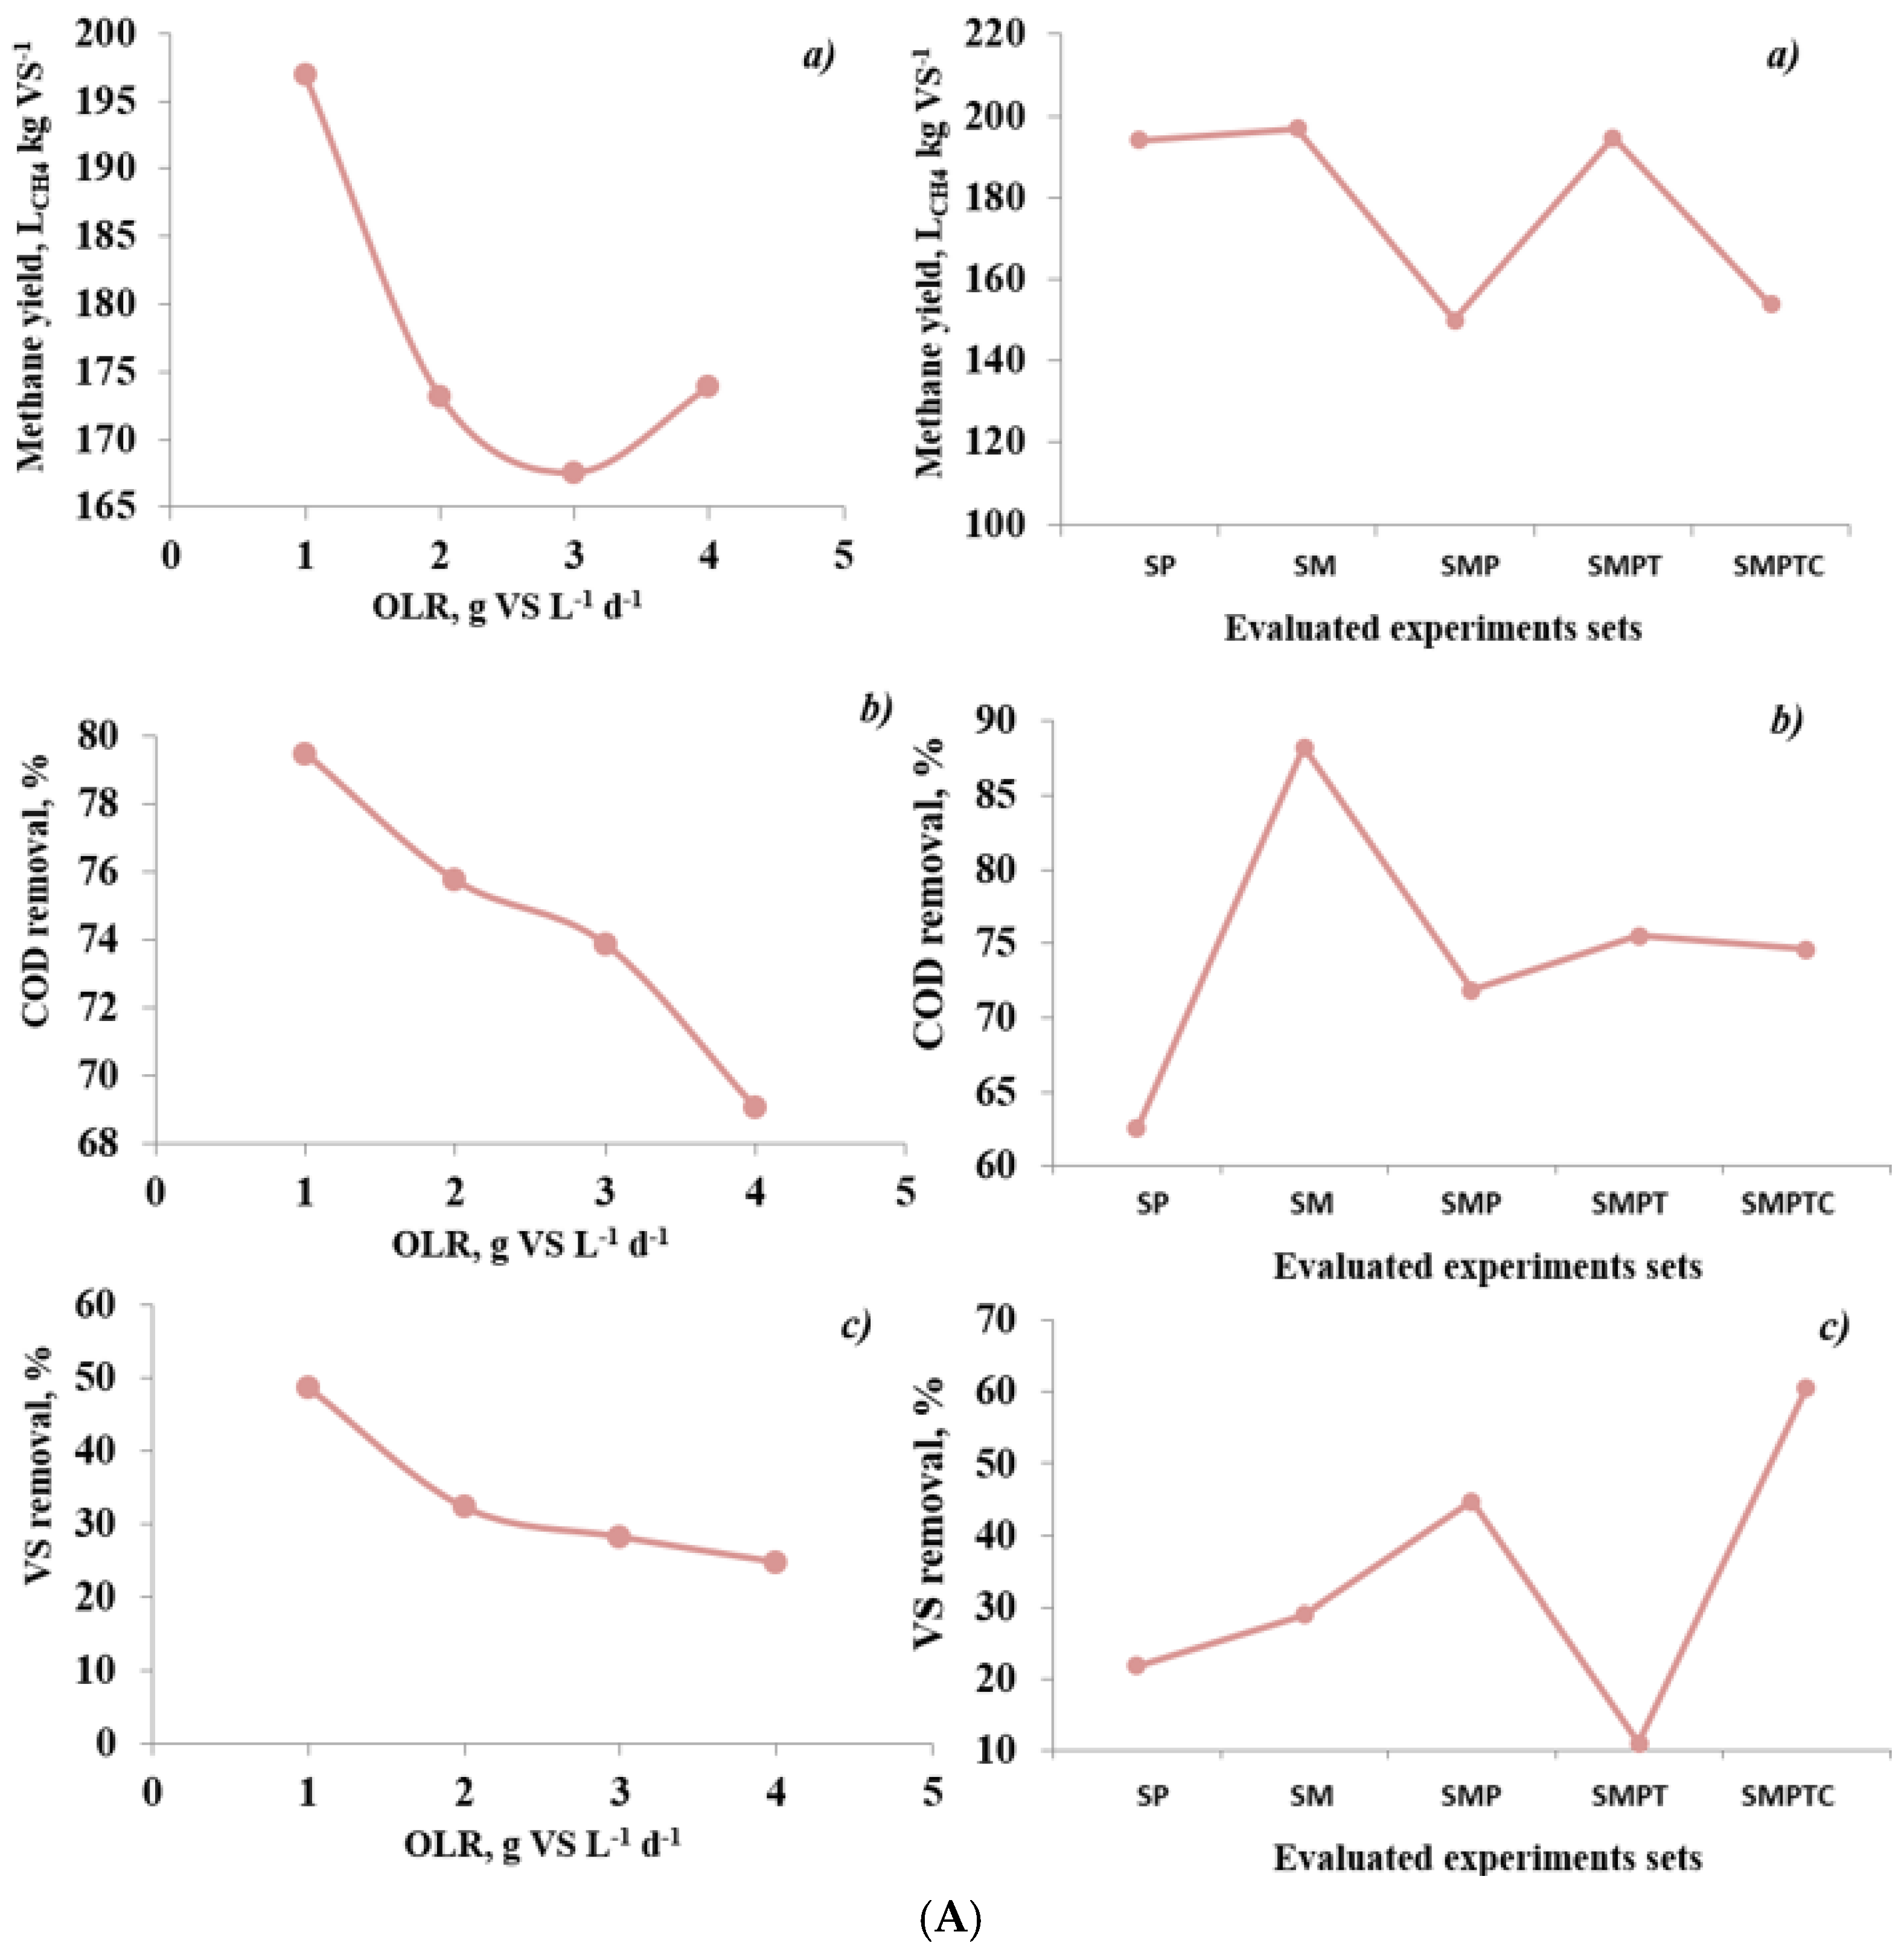
An interaction study of parameters determined in the AD process and different values of OLR or experiments carried out is represented in Figure 5. An expected inverse interaction is presented for COD and VS removal when the OLR studied is increased. Zahan et al. [23] found the same interaction in the study of different mixtures of chicken litter, food waste, wheat straw and hay grass in anaerobic co-digestion in semi-continuous regime at 2, 2.5 and 3 g TS L−1d−1. This behavior is related to the trend observed in methane yield, decreasing as OLR is rising, except when OLR was 4 g VS L−1d−1. Also, an increasing interaction is shown in Figure 5B between ammonia nitrogen and OLR. A sharply direct relationship of alkalinity and OLR evaluated is reflected; nonetheless, the value of OLR of 4 g VS L−1d−1 presents a decrease in alkalinity. This fact perhaps indicates the maximum limit to buffered capacity of the AD medium, according to this study above. C/N and VFA parameters analyzed do not show any interaction when the OLR is rising. In the same way, all parameters are represented at different substrate mixture ratios (different sets studied). A sharp increase is found in the parameters alkalinity and ammonia nitrogen when the substrate number in the mixture evaluated rises, except in the SMPTC set. This may explain why the vegetable substrates in the employed feed mixture predominate; so, the alkalinity and ammonia nitrogen contents in this kind of substrate are low. Any relationship is found in the rest of the parameters at different sets studied.

3.4. Substrate Removal Kinetics in Experimental Semi-Continuous Sets

All kinetic parameters for two models obtained by fitting experimental data to the detailed equations above are shown in Table 5. These results are very similar to those obtained by other authors [18,27,28], as presented in Table 5.
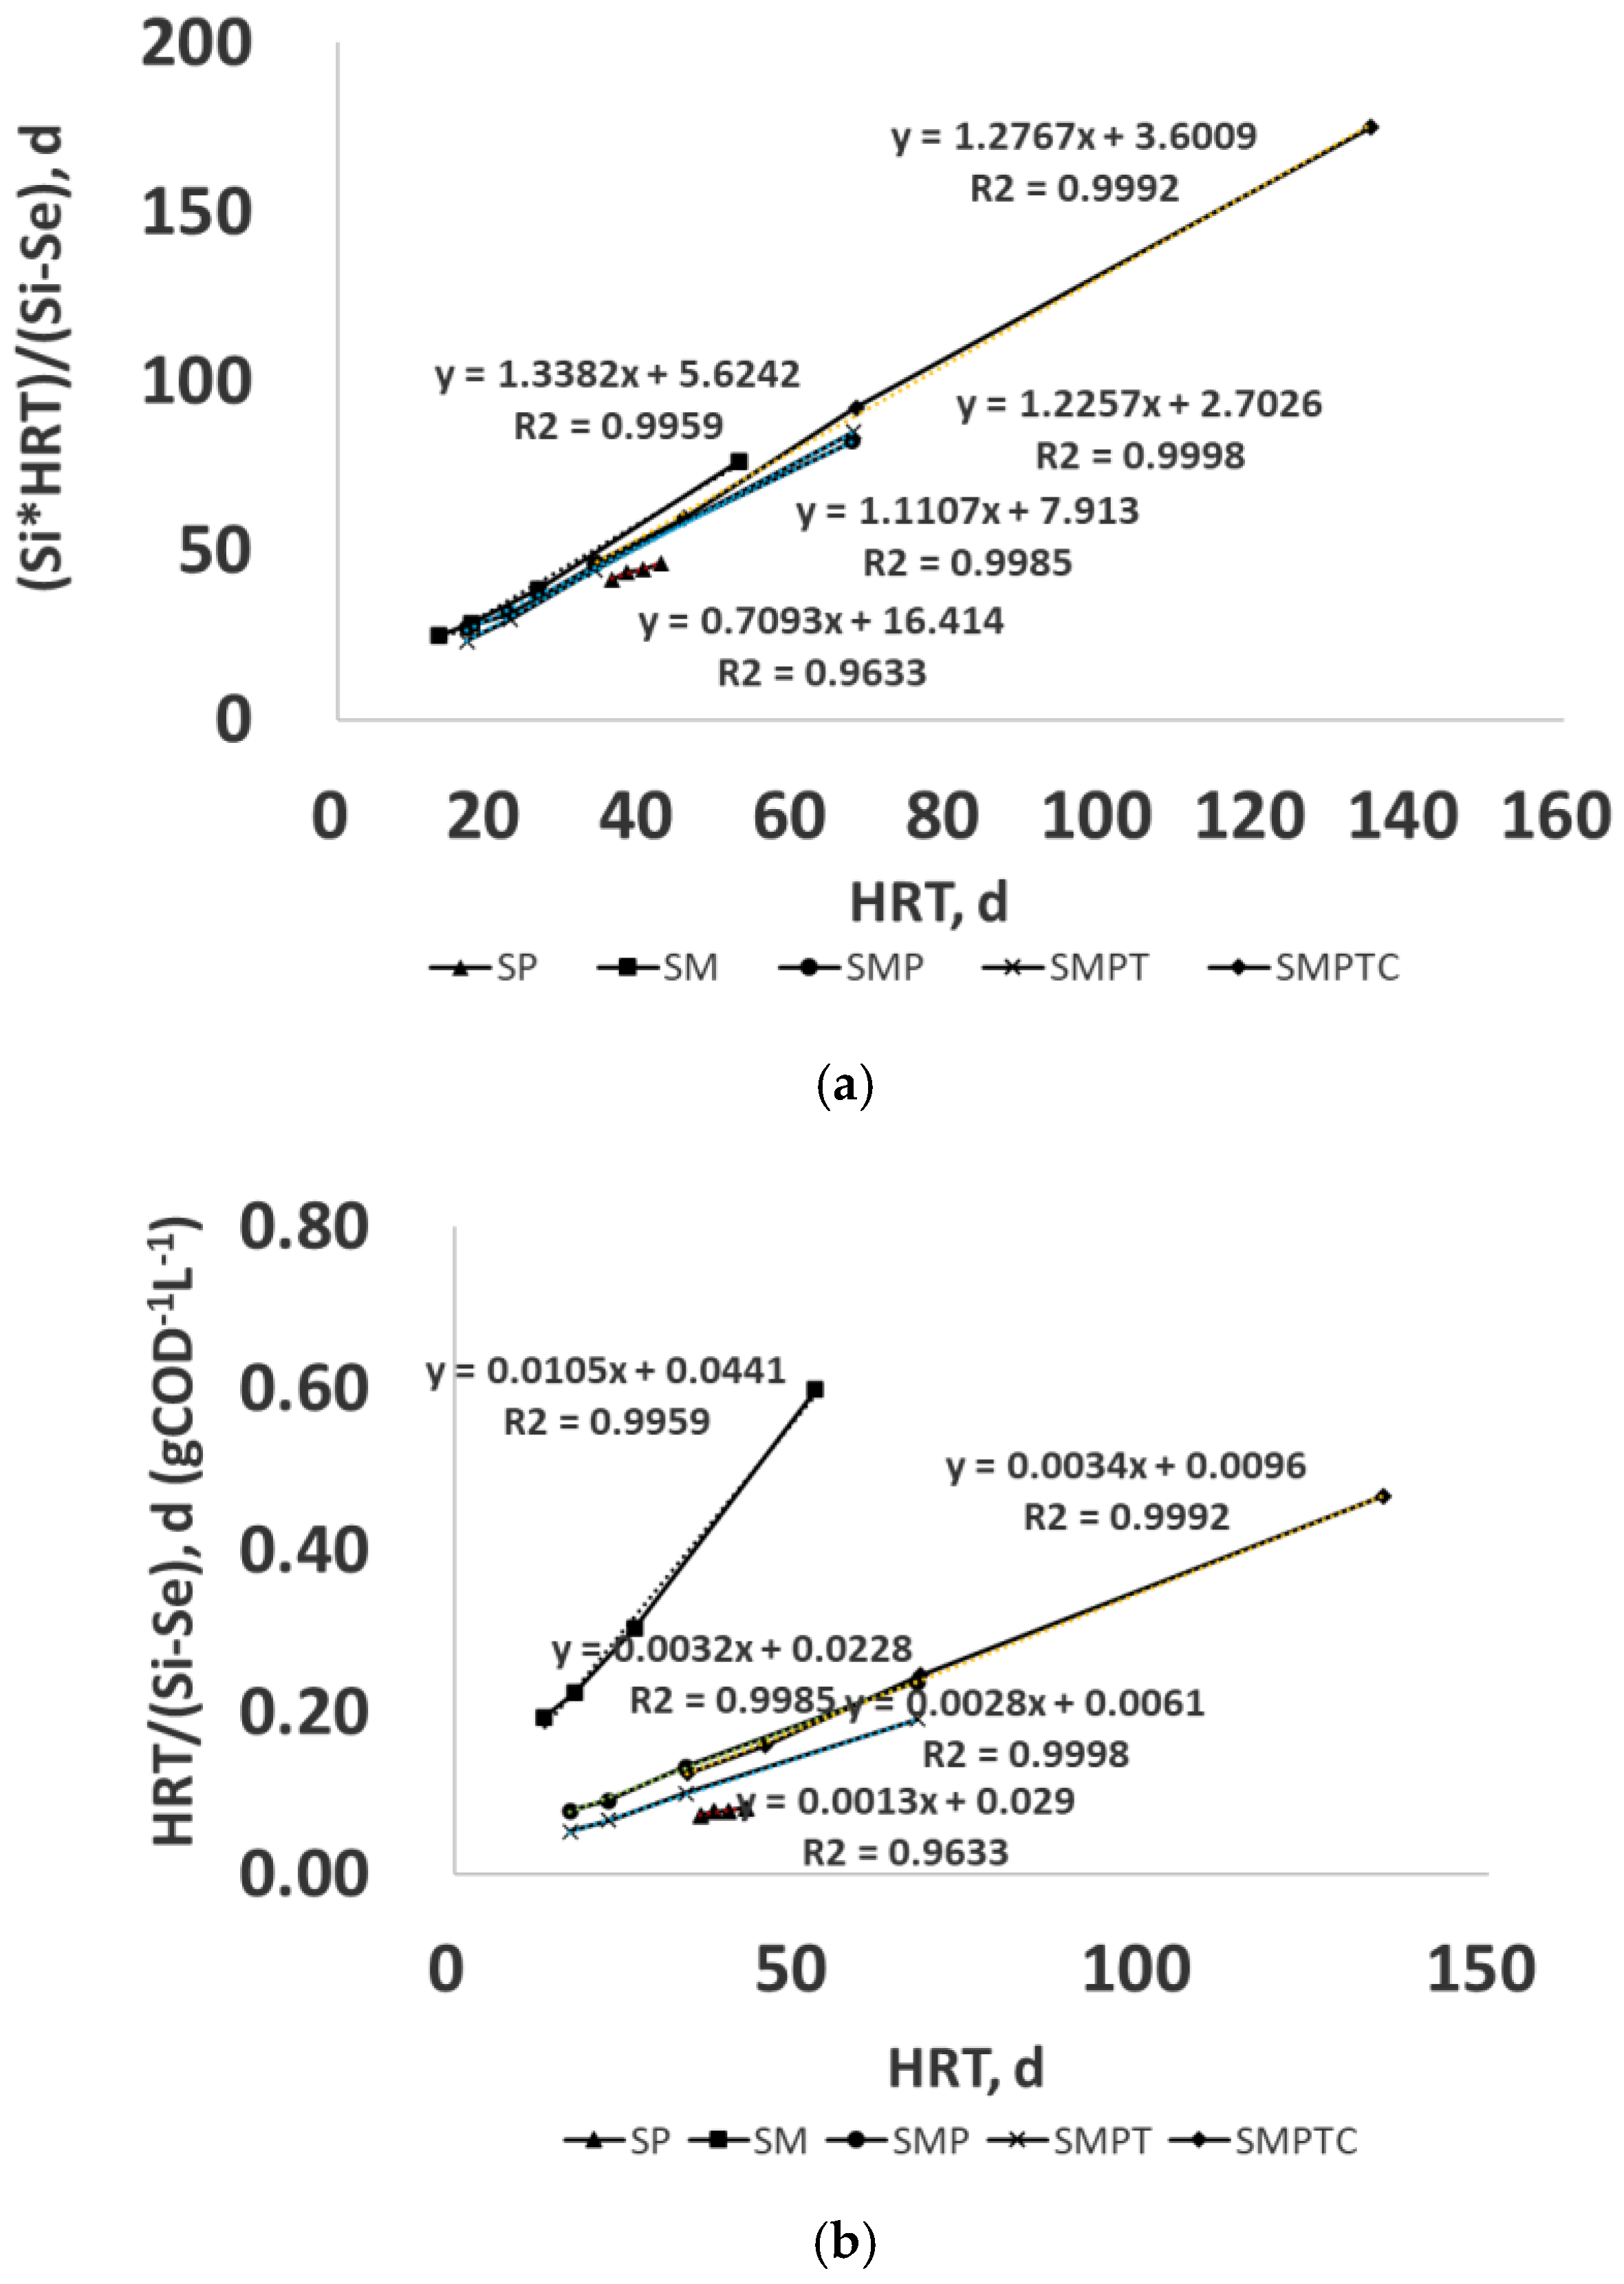
For the Grau second-order model, the kinetic constant for five assay sets is determined from Figure 6a by plotting Equation (2), and the kinetic constant (kS) is calculated from the intercept of the straight line. To determine the reaction constant (kB) for the Stover–Kincannon model, Equation (5) is plotted in Figure 6b, and the value is obtained from the slope of the straight line for each assay set.
The regression coefficients obtained for all assay sets indicate that Grau second-order multicomponent and Stover–Kincannon substrate removal models are appropriate for predicting the performance of the assays carried out in the semi-continuous regime in the laboratory. However, worse regression coefficients have been obtained by fitting the SMPTC set, i.e., 0.9633 for both models.
Higher values of kinetic constants should be noted in this study compared to other research, probably due to the use of lower quantities of OLRs in assays developed. A lower value of kinetic constant kS (0.25 g COD g VS−1 d−1) has been reported by De la Lama et al. for “alperujo” in semi-continuous anaerobic digestion of thermally pretreated [18]. A lower kinetic constant kB (8.2 g COD L−1 d−1) has been found in the study developed by Isik and Sponza, using a lab-scale up-flow anaerobic sludge blanket with textile wastewater [28].
In this work, several substrates have been studied in the feed, which may have contributed to obtaining elevated values of kinetic constants for two models. Moreover, it is found that assays carried out with different substrates in the feed throw higher kinetic constants in both models evaluated. It must be noted that the SMP and SMPTC assay sets break this trend. Again, the reason probably is found in the ratio of substrates, which provides buffer power (P and M) and vegetable substrates (S, T and C) with elevated carbon content.

4. Conclusions

Five assay sets have been developed, and each experiment set was developed at four different values of OLR. Average methane yields for sets evaluated have obtained higher results for SP, SM and SMPT (195.09 LCH4 kg VS−1, 197.69 LCH4 kg VS−1 and 195.76 LCH4 kg VS−1, respectively) than SMP and SMPTC (149.80 LCH4 kg VS−1 and 157.15 LCH4 kg VS−1, respectively). The probable reason is the ratio employed between substrates in the feed. An evolution of some parameters studied seems to indicate more stability in the process using fewer substrate numbers in the feed mixture. Several interactions have been found between parameters measured and when the OLR is increased: inverse interactions have been observed for COD and VS removal when the OLR studied is increased; and the literature and direct interaction have been found between alkalinity and OLR evaluated. Direct interactions are reflected in alkalinity and ammonia nitrogen and the number of substrates employed. Finally, experimental results have been fitted into two kinetic models (Grau second-order multicomponent and Stover–Kincannon) for predicting the assay performances, both with excellent regression coefficients obtained ranging from 0.9998 to 0.9959, except for the SMPTC experiment with regression coefficients of 0.9633. Anaerobic co-digestion for different substrates is an alternative to keep working biogas plants that use temporary production waste. Nevertheless, researchers need to transfer experiments of this kind to larger pilot plants.

Author Contributions

Conceptualization, A.I.P., J.G. and J.F.G.; methodology, A.I.P., J.G. and J.F.G.; software, A.I.P.; validation, A.I.P.; formal analysis, A.I.P., J.G. and J.F.G.; investigation, A.I.P., and L.R.; resources, A.I.P. and L.R.; data curation, A.I.P. and L.R.; writing—original draft preparation, A.I.P.; writing—review and editing, J.G. and J.F.G.; visualization, J.F.G.; supervision, J.F.G.; project administration, J.G. and J.F.G.; funding acquisition, J.G. and J.F.G. All authors have read and agreed to the published version of the manuscript.

Funding

This research was funded by European Regional Development Fund (ERDF) Operational Program for Extremadura 2014–2020, projects ESTRIBER and GREENHOPE and Extremadura Government FEDER “Fondos Europeos de Desarrollo Regional”, GR21139.

Data Availability Statement

The data presented in this study are available in the article.

Acknowledgments

The authors are grateful to the funding support by European Regional Development Fund (ERDF) Operational Program for Extremadura 2014–2020, concretely as a part of projects from Counseling of Economy, Science and Digital Agenda from Junta of Extremadura, “Desarrollo e implementación de nuevas estrategias alimentarias y de manejo para optimizar la sostenibilidad económica y ambiental de las explotaciones porcino Ibérico” (ESTRIBER) and “Estrategias agroganaderas para la sostenibilidad económica y ambiental del secano extremeño” (GREENHOPE). In the same way, the authors would like to thank the Extremadura Government (“Junta de Extremadura, Ayudas para la realización de actividades de investigación y desarrollo tecnológico, de divulgación y de transferencia de conocimiento por los Grupos de Investigación de Extremadura”) and the FEDER “Fondos Europeos de Desarrollo Regional (Una manera de hacer Europa)” for the financial support received (GR21139).

Conflicts of Interest

The authors declare no conflicts of interest.

References

  1. Ministerio para la Transición Ecológica y el Reto Demográfico (MITECO); Instituto para la Diversificación y el Ahorro de la Energía (IDAE). Plan Nacional Integrado de Energía y Clima 2021–2030; Spanish Gobern: Madrid, Spain, 2020; Available online: https://www.miteco.gob.es/content/dam/miteco/images/es/pnieccompleto_tcm30-508410.pdf (accessed on 10 January 2025).
  2. Feng, L.; Perschke, Y.M.L.; Fontaine, D.; Nikolausz, M.; Word, A.J.; da Rocha, U.N.; Corrêa, F.B.; Eriksen, J.; Sorensen, P.; Moller, H.B. Anaerobic digestion of co-ensiled cover crop and barley straw: Effect of co-ensiling ratios, manure addition and impact on microbial community structure. Ind. Crops Prod. 2020, 144, 112025. [Google Scholar] [CrossRef]
  3. Rani, P.; Pathak, V.V.; Bansal, M. Co-digestion of wheat straw and animal manure pretreated with calcium hydroxide for biomethane production: Kinetic study. Curr. Res. Green Sustain. Chem. 2021, 4, 100145. [Google Scholar] [CrossRef]
  4. Riau, V.; Burgos, L.; Camps, F.; Domingo, F.; Torellas, M.; Antón, A.; Bonmatí, A. Closing nutrient loops in a maize rotation. Catch crops to reduce nutrient leaching and increase biogas production by anaerobic co-digestion with dairy manure. Waste Manag. 2021, 126, 719–727. [Google Scholar] [CrossRef] [PubMed]
  5. Prabhu, A.V.; Raja, A.; Avinash, A.; Pugazhendhi, A. Parametric optimization of biogas potential in anaerobic co-digestion of biomass wastes. Fuel 2021, 288, 119574. [Google Scholar] [CrossRef]
  6. Mosquera, J.; Varela, L.; Santis, A.; Villamizar, S.; Acevedo, P.; Cabeza, I. Improving anaerobic co-digestion of different residual biomass sources readily available in Colombia by process parameters optimization. Biomass Bioenergy 2020, 142, 105790. [Google Scholar] [CrossRef]
  7. Somridhivej, B.; Boyd, C.E. An assessment of factors affecting the reliability of total alkalinity measurements. Aquaculture 2016, 459, 99–109. [Google Scholar] [CrossRef]
  8. Parralejo, A.I.; Royano, L.; Cabanillas, J.; González, J. Pretreatment and Nanoparticles as Catalysts for Biogas Production Reactions in Pepper Waste and Pig Manure. Catalysts 2023, 13, 1029. [Google Scholar] [CrossRef]
  9. Lorenzo, Y.; Obaya, M.C. La digestión anaerobia. Aspectos teóricos. Parte I” ICIDCA. Sobre Deriv. Caña Azúcar 2015, 39, 35–48. [Google Scholar]
  10. Dareioti, M.A.; Kornaros, M. Anaerobic mesophilic co-digestion of ensiled sorghum, cheese whey and liquid cow manure in a two-stage CSTR system: Effect of hydraulic retention time. Bioresour. Technol. 2015, 175, 553–562. [Google Scholar] [CrossRef]
  11. Cantale, C.; Petrazzuolo, F.; Correnti, A.; Farneti, A.; Felici, F.; Latini, A.; Galeffi, P. Triticale for Bioenergy Production, Florence “Sustainability of Well-Being International Forum”. 2015: Food for Sustainability and not just food, FlorenceSWIF2015. Agric. Agric. Sci. Procedia 2016, 8, 609–616. [Google Scholar] [CrossRef]
  12. Khatri, S.; Wu, S.; Kizito, S.; Zhang, W.; Li, J.; Dong, R. Synergistic effect of alkaline pretreatment and Fe dosing on batch anaerobic digestion of maize straw. Appl. Energy 2015, 158, 55–64. [Google Scholar] [CrossRef]
  13. Zhang, Y.; Caldwell, G.S.; Zealand, A.M.; Sallis, P.J. Anaerobic co-digestion of microalgae Chlorella vulgaris and potato processing waste: Effect of mixing ratio, waste type and substrate to inoculum ratio. Biochem. Eng. J. 2019, 143, 91–100. [Google Scholar] [CrossRef]
  14. Wang, W.; Jiang, Y.; Wang, S.; Zhang, Y.; Hu, Y.; Hu, Z.; Wu, G.; Zhan, X. Impact of total solids content on anaerobic co-digestion of pig manure and food waste: Insights into shifting of the methanogenic pathway. Waste Manag. 2020, 114, 96–106. [Google Scholar] [CrossRef]
  15. Hu, Y.; Kumar, M.; Wang, Z.; Zhan, X.; Stengel, D.B. Filamentous microalgae as an advantageous co-substrate for enhanced methane production and digestate dewaterability in anaerobic co-digestion of pig manure. Waste Manag. 2021, 119, 399–407. [Google Scholar] [CrossRef]
  16. Wang, Y.; Zhang, J.; Li, Y.; Jia, S.; Song, Y.; Sun, Y.; Zheng, Z.; Yu, Z.; Cui, Z.; Han, Y.; et al. Methane production from the co-digestion of pig manure and corn stover with the addition of cucumber residue: Role of the total solids content and feedstock-to-inoculum ratio. Bioresour. Technol. 2020, 306, 123172. [Google Scholar] [CrossRef]
  17. Pecar, D.; Gorsek, A. Kinetics of methane production during anaerobic digestion of chicken manure with sawdust and miscanthus. Biomass Bioenergy 2020, 143, 105820. [Google Scholar] [CrossRef]
  18. De la Lama, C.; Borja, R.; Rincón, B. Performance evaluation and substrate removal kinetics in the semi-continuous anaerobic digestion of thermally pretreated two phase olive pomace or “Alperujo”. Process. Saf. Environ. 2017, 105, 288–296. [Google Scholar] [CrossRef]
  19. APHA, American Public Health Association. Standard Methods for Examination of Water and Wastewater, 22nd ed.; American Public Health Association: Washington, DC, USA, 2012. [Google Scholar]
  20. Parralejo, A.I.; Royano, L.; González, J.; González, J.F. Small scale biogas production with animal excrement and agricultural residues. Ind. Crops Prod. 2019, 131, 307–314. [Google Scholar] [CrossRef]
  21. Norma UNE-EN 16948; Biocombustibles Sólidos, Determinación de Contenido total de C, H y N. AENOR, Asociación Española de NORmalización: Madrid, Spain, 2015.
  22. González, J.F.; Parralejo, A.I.; González, J.; Álvarez, A.; Sabio, E. Optimization of the production and quality of biogas in the anaerobic digestion of different types of biomass in a batch laboratory biodigester and pilot plant: Numerical modelling, kinetic study and hydrogen potential. Int. J. Hydrog. Energy 2022, 47, 39386–39403. [Google Scholar] [CrossRef]
  23. Zahan, Z.; Georgious, S.; Muster, T.H.; Othman, M.Z. Semi-continuous anaerobic co-digestion of chicken little with agricultural and food wastes: A case study on the effect of carbon/nitrogen ratio, substrates mixing ratio and organic loading. Bioresour. Technol. 2018, 270, 245–254. [Google Scholar] [CrossRef]
  24. Croce, S.; Wei, Q.; D’Imporzano, G.; Dong, R.; Adani, F. Anaerobic digestion of straw and corn stover: The effect of biological process optimization and pre-treatment on total bio-methane yield and energy performance. Biotechnol. Adv. 2016, 34, 1289–1304. [Google Scholar] [CrossRef] [PubMed]
  25. Hermann, C.; Kalita, N.; Wall, D.; Xia, A.; Murphy, J.D. Optimised biogas production from microalgae through co-digestion with carbon rich co-substrate. Bioresour. Technol. 2016, 214, 328–337. [Google Scholar] [CrossRef]
  26. Parralejo, A.I.; Royano, L.; Acevedo, M.; Cabanillas, J.; González, J. Study of the influence of pre-treatment in the grape waste biogas generation. Mod. Environ. Sci. Eng. 2019, 5, 207–214. [Google Scholar] [CrossRef]
  27. Rajagopal, R.; Torrijos, M.; Kumar, P.; Merohtra, I. Substrate removal kinetics in high-rate upflow anaerobic filters packed with low density polyethylene media treated high-strengh agro-food wastewater. J. Environ. Manag. 2013, 116, 101–106. [Google Scholar] [CrossRef]
  28. Isik, M.; Sponza, D.T. Substrate removal kinetic in an upflow anaerobic sludge blanket reactor decolorising simulated textile wastewater. Process Biochem. 2015, 40, 1189–1198. [Google Scholar] [CrossRef]
  29. Jijai, S.; Srisuwan, G.; O-thong, S.; Ismaile, N.; Siripatana, C. Effect of Granule Sizes on the Performance of Upflow Anaerobic Sludge Blanket (UASB) Reactors for Cassava Wastewater Treatment. Energy Procedia 2015, 79, 90–97. [Google Scholar]
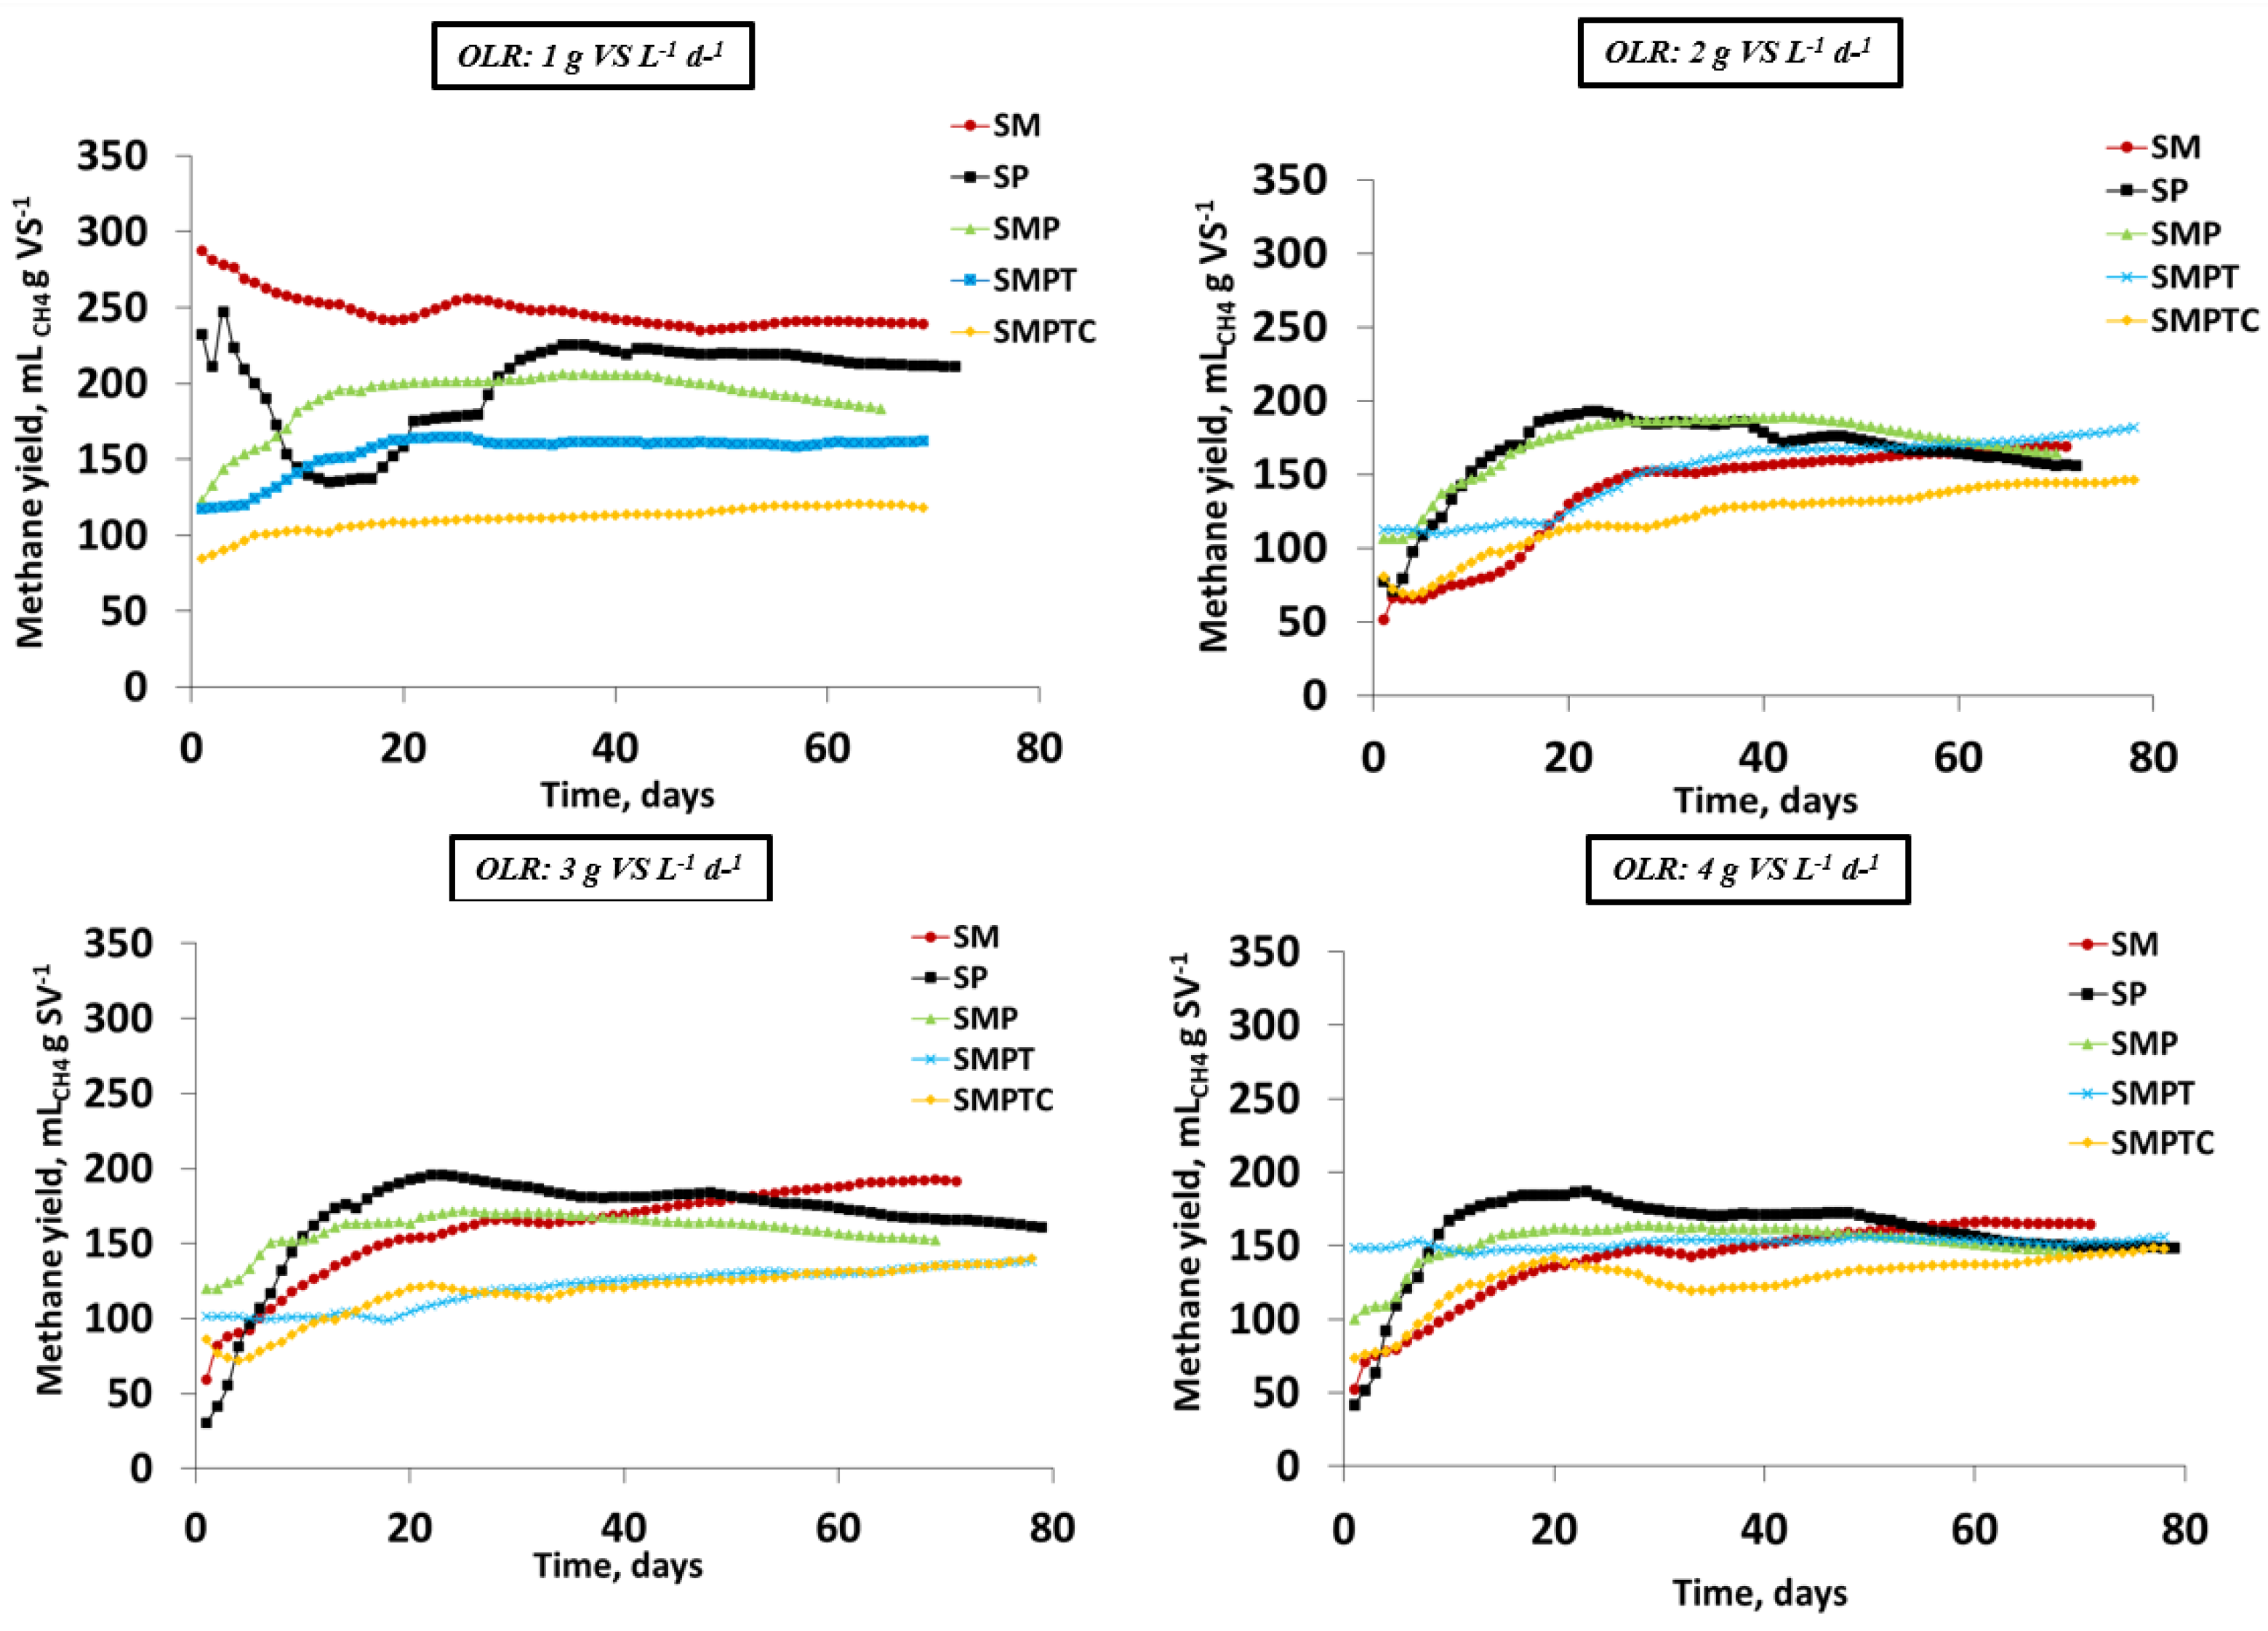
Figure 1. Methane yield evolution in AD process with raw material mixtures in different proportions for each experiment set for OLRs of 1 to 4 g VS L−1d−1.
Energies 18 01689 g001
Figure 2. VFA evolution in AD process with raw material mixtures in different proportions for each experiment set for OLRs from 1 g VS L−1d−1 to 4 g VS L−1d−1.
Energies 18 01689 g002
Figure 3. Alkalinity evolution in AD process with raw material mixtures in different proportions for each experiment set for OLRs from 1 g VS L−1d−1 to 4 g VS L−1d−1.
Energies 18 01689 g003
Figure 4. Ammonia nitrogen evolution in AD process with raw material mixtures in different proportions for each experiment set for OLRs from 1 g VS L−1d−1 to 4 g VS L−1d−1.
Energies 18 01689 g004
Figure 5. (A) Main effects and interactions of different studied OLRs and substrates on feed mixture for parameters (a) methane yield, (b) COD removal and (c) VS removal. (B) Main effects and interactions of different studied OLRs and substrates on feed mixture for parameters (d) ammonia nitrogen and (e) alkalinity. (C) Main effects and interactions of different studied OLRs and substrates on feed mixture for parameters (f) VFA and (g) C/N ratio. Parameters on the left are referred to the OLRs interactions and parameters on the right belong to evaluated experiments set interactions.
Energies 18 01689 g005aEnergies 18 01689 g005b
Figure 6. (a) Determination of kinetic constant for Grau second-order multicomponent substrate removal model in different assay sets. (b) Determination of kinetic constant for Stover–Kincannon substrate removal model in different assay sets.
Energies 18 01689 g006
Table 1. Experimental design in assay sets evaluated.
AssaysSubstrates
(Proportion)
OLR,
g VS L−1 d−1
OLR,
g COD L−1 d−1
Time, d
SP1S and P
(1:1)
0.891364
SP21.812564
SP32.683864
SP43.555064
SM1S and M
(1:1)
1.00364
SM22.00664
SM33.00964
SM44.001164
SMP1S, M and P
(1:0.5:1)
1.14864
SMP22.331564
SMP33.442364
SMP44.593164
SMPT1S, M, P and T
(1:1:1:1)
0.981064
SMPT21.942064
SMPT32.913064
SMPT44.003964
SMPTC1S, M, P, T and C
(1:1:1:1:1)
1.00864
SMPTC22.001764
SMPTC33.002564
SMPTC44.003364
Table 2. Physicochemical characteristics of raw materials studied.
ParameterSMPTC
pH3.64 ± 0.027.64 ± 0.017.68 ± 0.124.71 ± 0.015.80 ± 0.03
VS, %93.10 ± 0.2065.00 ± 0.110.43 ± 0.0593.30 ± 0.2094.76 ± 0.12
C/N ratio a65.78 ± 0.246.02 ± 0.086.41 ± 0.0347.50 ± 0.1064.18 ± 0.08
Proteins, % a4.06 ± 0.0241.63 ± 0.0614.06 ± 0.185.69 ± 0.066.75 ± 0.05
Carbohidrates, % a93.84 ± 0.0855.77 ± 0.1685.32 ± 0.2592.89 ± 0.1092.65 ± 0.12
Lipids, % a2.10 ± 0.162.60 ± 0.010.62 ± 0.031.42 ± 0.210.60 ± 0.10
Alkalinity, mg L−1-2616 ± 2410,096 ± 102--
COD, mg O2 L−1936,000 ± 31001,500,000 ± 50,00011,000 ± 20149,600 ± 16,000988,000 ± 10,100
VFA, mg L−1-319 ± 184800 ± 411--
N-NH4, mg L−1<30214 ± 263850 ± 10030 ± 5140 ± 10
Methane yield b, LCH4 kg VS−1419 ± 62306 ± 38102 ± 23373 ± 12345 ± 73
Na, ppm a600 ± 481368 ± 110651 ± 12212 ± 53347 ± 18
Mg, ppm a2657 ± 2112074 ± 408211 ± 411947 ± 121844 ± 253
Fe, ppm a744 ± 512201 ± 8425 ± 4702 ± 261675 ± 360
Ca, ppm a2853 ± 12829,415 ± 2051485 ± 174276 ± 2153925 ± 281
Cd, ppm a<2<2<232 ± 5<2
Cu, ppm a<522 ± 47 ± 226 ± 3<5
a: Over dry matter. b: Determined in previous research works [22].
Table 3. Methane yields obtained in experiment sets developed with raw material mixtures in different proportions at different OLRs.
ExperimentX1,
mLCH4 L−1
X2,
LCH4 kg VS−1
t, DaysX3,
LCH4 kg VS−1
SP1210.20 ± 3.85236.13 ± 3.8555195.09 ± 25.19
SP2294.62 ± 3.74162.88 ± 1.8768
SP3438.43 ± 6.46163.92 ± 2.1577
SP4771.28 ± 8.02217.43 ± 2.0059
SM1231.36 ± 6.79231.36 ± 7.6371197.69 ± 37.39
SM2393.22 ± 4.99196.61 ± 2.7684
SM3576.91 ± 5.92192.30 ± 2.2190
SM4681.94 ± 8.70170.49 ± 2.4566
SMP1197.17 ± 3.50173.03 ± 3.0757149.80 ± 16.39
SMP2333.31 ± 7.51142.99 ± 3.2258
SMP3463.92 ± 6.51135.06 ± 1.9065
SMP4679.60 ± 8.60148.13 ± 1.9064
SMPT1202.50 ± 2.55206.99 ± 2.6183195.76 ± 14.36
SMPT2405.84 ± 5.32209.34 ± 2.7491
SMPT3534.03 ± 5.86183.70 ± 2.0292
SMPT4731.94 ± 6.78183.02 ± 1.6996
SMPTC1139.75 ± 2.45139.75 ± 2.4549157.15 ± 12.87
SMPTC2312.47 ± 3.19156.24 ± 1.60119
SMPTC3509.69 ± 4.49169.90 ± 1.5093
SMPTC4650.89 ± 5.82162.72 ± 1.4593
Table 4. ANOVA of evaluated parameters in experiment sets carried out with raw material mixtures in different proportions at different OLRs.
ExperimentVS, %COD, %VFA, mg L−1Ratio C/NN-NH4, mg L−1Alkalinity,
mg CaCO3 L−1
SP12.09 ± 0.88
a
40,083 ± 18,0342134 ± 64110.11 ± 1.733630 ± 550
b
10,538 ± 987
SP24.33 ± 1.16
b
41,417 ± 99321504 ± 31220.38 ± 4.762103 ± 651
a
9720 ± 675
SP35.30 ± 1.36
b
49,667 ± 12,8281275 ± 39116.99 ± 4.342603 ± 760
a
9483 ± 797
SP45.39 ± 1.39
b
60,083 ± 13,5591597 ± 87521.23 ± 5.382883 ± 699
ab
8949 ± 910
SM12.99 ± 0.6749,583 ± 21,0801898 ± 63411.21 ± 4.371913 ± 5809112 ± 1175
SM23.64 ± 0.5460,167 ± 17,8962399 ± 73511.93 ± 5.212157 ± 5238966 ± 1015
SM34.39 ± 0.4778,167 ± 44,6462514 ± 86911.75 ± 4.772993 ± 12239223 ± 830
SM44.47 ± 0.8077,917 ± 36,3752747 ± 100510.97 ± 4.853673 ± 17869900 ± 1348
SMP14.18 ± 1.4067,250 ± 22,026
a
2049 ± 42510.58 ± 1.782701 ± 755
a
11,389 ± 2878
SMP25.29 ± 1.01103,667 ± 11,479
b
1679 ± 25710.26 ± 1.934202 ± 1035
b
12,879 ± 1031
SMP35.35 ± 0.68119,167 ± 43,792
bc
2057 ± 33410.51 ± 2.024790 ± 777
b
14,250 ± 2320
SMP45.11 ± 0.50126,750 ± 13,758
c
1712 ± 84310.19 ± 1.724007 ± 1279
b
12,890 ± 2350
SMPT16.65 ± 1.79
a
92,700 ± 18,368
a
4983 ± 146812.67 ± 0.853523 ± 56413,573 ± 852
a
SMPT26.48 ± 1.06
ab
108,333 ± 16,241
ab
4979 ± 219912.56 ± 0.464092 ± 49814,949 ± 484
b
SMPT37.59 ± 1.06
b
109,167 ± 17,848
ab
4194 ± 141312.71 ± 0.804643 ± 90815,878 ± 1522
b
SMPT47.66 ± 1.05
b
124,250 ± 17,581
b
5143 ± 71612.97 ± 0.784410 ± 106815,452 ± 872
b
SMPTC15.29 ± 1.8986,250 ± 28,6563439 ± 197613.22 ± 1.473260 ± 69414,664 ± 1786
SMPTC25.55 ± 1.8887,008 ± 21,1193574 ± 154512.92 ± 1.493080 ± 60614,213 ± 1893
SMPTC35.39 ± 1.9791,416 ± 11,2543891 ± 133712.83 ± 1.113397 ± 79813,670 ± 845
SMPTC45.81 ± 1.00107,083 ± 13,9452871 ± 80511.90 ± 1.563707 ± 106913,066 ± 1204
For standard deviation, six samples were taken over the process. Different letters indicated significant differences between values of the same parameter per set. No significant differences were found in those parameters without any letter.
Table 5. Comparison of kinetic constant in Grau second-order and modified Stover–Kicannon Models.
Set/SubstratesOLR,
g VS L−1 d−1
HRT, dks, g COD g VS−1 d−1Reference
Grau Second-Order MulticomponentSP0.89–3.5513–524In this work
SM1.00–4.0036–4239In this work
SMP1.14–4.5917–6710In this work
SMPT0.98–4.0017–6729In this work
SMPTC1.00–4.0034–13520In this work
Cassava wastewater3.76–18.80 *1–51.55–8.23[29]
Fruit canning9–11.6 *0.48–2.255[27]
Cheese dairy wastewater23–40 *1.3–6.21.93[27]
“Alperujo”2–747–1160.25[18]
Textile wastewater1.0–15.80.25–4.170.337[28]
Set/SubstratesOLR,
g VS L−1 d−1
HRT, dkB, g COD L−1 d−1Reference
Modified Stover–KicannonSP0.89–3.5513–526In this work
SM1.00–4.0036–42135In this work
SMP1.14–4.5917–6749In this work
SMPT0.98–4.0017–67204In this work
SMPTC1.00–4.0034–135133In this work
Cassava wastewater3.76–18.80 *1–56.11–48.24[29]
Fruit canning9–11.6 *0.48–2.25109.7[27]
Cheese dairy wastewater23–40 *1.3–6.249.7[27]
“Alperujo”2–747–11611.15[18]
Textile wastewater1.0–15.80.25–4.178.2[28]
* g COD L−1 d−1.
Disclaimer/Publisher’s Note: The statements, opinions and data contained in all publications are solely those of the individual author(s) and contributor(s) and not of MDPI and/or the editor(s). MDPI and/or the editor(s) disclaim responsibility for any injury to people or property resulting from any ideas, methods, instructions or products referred to in the content.