Article

Driving Factors of Final Energy Consumption in the European Union: A Comprehensive Analysis

1
Department of Cybernetics, Informatics, Finance and Accounting, Faculty of Economic Sciences, Petroleum-Gas University of Ploiesti, 39 Bucharest Avenue, 100680 Ploiesti, Romania
2
Department of Business Administration, Faculty of Economic Sciences, Petroleum-Gas University of Ploiesti, 39 Bucharest Avenue, 100680 Ploiesti, Romania
*
Authors to whom correspondence should be addressed.
Energies 2025, 18(7), 1703; https://doi.org/10.3390/en18071703
Submission received: 25 February 2025 / Revised: 24 March 2025 / Accepted: 26 March 2025 / Published: 28 March 2025
(This article belongs to the Special Issue Decarbonization and Sustainability in Industrial and Tertiary Sectors)

Abstract

:
The global efforts to combat climate change, decarbonize the economies, and move towards a more sustainable future are focused on improving energy efficiency and reconfiguring the energy mix. Considering the impact on the environment and economic activity of energy production and consumption, this paper focuses on identifying the driving factors of final energy consumption in the European Union countries, which are undisputed leaders in the transition to a low-carbon economy. The goals of the paper are (1) to establish a model pattern that shows the relationships between the variation in final energy consumption and its driving forces and (2) to perform a comparative analysis to better understand the differences between the European Union (EU) economies in terms of energy efficiency improvement and decarbonization opportunities. Taking into consideration the objective of the research, comparative and correlation analyses were performed, and a decomposition technique (factorial analysis) was used in order to analyze the dynamic relationships between energy-related indicators for the EU as a whole and the 27 EU countries in 2023 compared to 2015. The research question is as follows: what are the main factors that generate final energy consumption in the EU? The hypothesis of this paper (H1) is that the variation in final energy consumption is determined by economic activity, lifestyle and consumer behavior, climate effect, and energy savings. This study’s main conclusions are that the variation in final energy consumption between 2015 and 2023 in EU countries was mostly due to key factors linked to economic activity, lifestyle and consumer behavior, climate effect, and energy savings. Thus, transport contributed the most to the variation in energy consumption, followed by services and manufacturing. The results indicate a shift to less energy-intensive sectors that positively impacted final energy consumption reduction, leading to energy savings. Concerning lifestyle and consumer behavior, household energy consumption had the highest contribution to the variation in energy consumption, followed by the number of passenger cars and the average annual net earnings. The climate effect was mostly due to the change in the cooling degree days that explained over 34.4% of the variation in the final energy consumption in households per capita. As for the energy savings effect, the results show that an increase in investments in the energy sector targeting efficiency improvements contributed to a reduction in energy consumption, leading to energy savings.

1. Introduction

Decarbonization, the process of reducing carbon emissions, especially carbon dioxide (CO2), from the atmosphere through the transition to cleaner and more sustainable energy sources, is essential to fight climate change and achieve the goals set by the Paris Agreement [1,2]. The global efforts to combat climate change, decarbonize the economies, and move towards a more sustainable future are focused on improving energy efficiency and reconfiguring the energy mix. Energy use accounts for nearly two-thirds of world CO2 emissions [3]. Increasing energy efficiency is widely accepted as essential for achieving decarbonization and environmental goals [4,5,6,7,8]. In this respect, the European Commission stated that energy efficiency is one of the cleanest and most cost-efficient measures by which to address climate change and energy transition [9,10,11,12].
The European Union (EU) is the undisputed leader of energy transition [13], with the EU’s binding reduction target for net GHG emissions having been raised to at least 55% by 2030, and it aims to achieve a climate-neutral EU by 2050. Thus, an additional 11.7% reduction in energy consumption by 2030 has been stated by the 2023 revised directive [14]. Directive (EU) 2023/1791 of the European Parliament and the Council establishes the legal framework for the promotion of energy efficiency in the EU, reinforcing the EU’s commitment to achieving climate neutrality by 2050. The main objective is reducing energy consumption. The “energy efficiency first” principle (for the first time, this principle has become fundamental in EU energy policy, obliging member states to integrate it into all relevant policy decisions and major investments in both the energy and non-energy sectors) involves annual energy savings, public sector final energy consumption reduction, private sector energy management systems, monitoring of the energy performance of data centers and local heating and cooling plans development.
According to the Directive (EU) 2023/1791, overall EU energy consumption by 2030 should not exceed 992.5 million tons of oil equivalent (Mtoe) for primary energy and 763 Mtoe for final energy. Therefore, EU countries have to achieve cumulative end-use energy savings of at least 1.3% in 2024–2025, 1.5% in 2026–2027, and 1.9% in 2028–2030 [15].
Given the ambitious objectives stated by the European Commission, we appreciate that implementing energy policies based on good knowledge of the key factors that influence energy consumption and the gap between EU countries in terms of their impact is the only way to achieve these goals successfully. Therefore, in-depth and up-to-date analyses are needed to assess the factors influencing energy consumption in EU countries. This is an imperative requirement, given that studies that analyze the impact of the key factors on energy consumption in the EU are few and not up to date.
Decarbonization is a complex process that can be achieved based on collaborative efforts from governments, industries, and individuals through different approaches focused on energy transition and sustainable industrial and transportation practices (Figure 1).
Scientific studies addressing the issues of energy efficiency or energy consumption and decarbonization are increasingly numerous and aim at the impact of these topics on the 17 sustainable development objectives, the main links being those with SDG 7, Affordable and Clean Energy, SDG 13 Climate Action and SDG 10 Sustainable Cities and Communities, demonstrating the efforts of the academic community to promote the principles of sustainable development and the efforts to identify solutions to reduce energy consumption, increase energy efficiency, and achieve a rapid transition towards a low-carbon economy (Figure 2).
In this context, we believe that this study, focused on the driving factors of the final energy consumption in EU countries between 2015 and 2023, is particularly important. Our findings will help us understand how a number of driving factors influence the final energy consumption in the EU countries, and they will also allow us to make several policy recommendations to increase end-use energy savings and support the decarbonization of European economies. Decarbonization and energy consumption are key aspects of energy policies in the EU, and public authorities must set related targets to reduce greenhouse gas emissions and increase the use of renewable energy sources [17,18].
Given the objective of this study, the goals are (1) to establish a model (pattern) that shows the relationships between the variation in final energy consumption and its driving forces and (2) to perform a comparative analysis to understand better the differences between EU economies in terms of energy efficiency improvement and decarbonization opportunities.

2. Literature Review

The international literature abounds in scientific studies on energy transition that focus either on energy consumption or on the use of new energy sources in the complex process of changing the energy mix. Population growth, urbanization, improving the standard of living, and the intensification of globalization have generated an increase in energy consumption and a dramatic impact on the environment [19,20,21,22,23,24,25,26].
The issues of energy efficiency or energy consumption and decarbonization have been the subject of an increasing number of articles, starting in 2010, due to the intensification of international registration processes to regulate national efforts to decarbonize national economies (Figure 3).
The complexity of the phenomenon of decarbonization of the economy and the impact of reducing energy consumption and increasing energy efficiency in the transition to a low-carbon economy is demonstrated by the scientific fields in which the articles have been published (Figure 4).
Numerous studies have been conducted regarding the main drivers of energy consumption. Most of them used either decomposition techniques, such as Structural Decomposition Analysis (SDA) and Index Decomposition Analysis (IDA), or econometric tools [27]. Decomposition techniques have become widely accepted analytical tools in energy-related studies.
The SDA technique, which was first introduced by Leontief (1970), has been used in energy-related carbon emission research [28,29,30] to decompose energy consumption change in China, identify the main influencing factors of energy consumption, and discover the real drivers of energy consumption [31,32]. Lan et al. [31] analyzed the magnitude and distribution of the drivers of energy footprints across countries using a comprehensive multi-regional database for 186 nations from 1990 to 2010. The study showed that in almost all countries, affluence and population drive up energy footprints.
The Logarithmic Mean Divisia Index (LMDI), which was first introduced by Ang et al. [33,34], is one of the prevalent techniques after modifying the negative values [35,36]. The LMDI technique is also broadly used in both energy and environmental economics, for example, for the analysis of energy consumption and CO2 emissions [28,37,38,39,40]. Using the LMDI method, Román-Collado and Morales-Carrión [41] found that the main drivers of energy consumption in the Latin America region are the activities and the population effect. Fernández Gonzáles et al. [42] used the LMDI technique to analyze the factors of aggregate energy consumption change in the EU-27 from 2001 to 2008. The results showed that improvements in energy efficiency were not enough to overcome the pressure of European economic activity on aggregate energy consumption. Mediterranean countries, especially former communist states, increased their energy consumption, most of them being favored by structural change. The study underlined R&D, quality energies, efficient technologies, “Green” attitudes, and changes in consumer choices as the main tools to lower energy consumption.
Considering that decomposition and econometric methods cannot reveal the universal interactions of various influencing factors when they work together to change the dependent variable, Wang et al. [39] applied the interaction detector from the modified geographical detector to compare the drivers of the world’s top three consumers for primary energy, namely China, the USA, and India. The results indicate that the factors played different roles in various areas. Shuibul Qarnain et al. [43] used the Best–Worst Method to analyze India’s driving factors for building energy efficiency. The results show that the five main factors that are key drivers of energy efficiency in homes are motivation, education and awareness, coercive factors, occupant behavior, and energy-saving equipment. Barrera-Santana et al. [44] constructed an energy efficiency governance index (EEGI) to analyze the relationship between income and energy consumption for 32 OECD countries between 2000 and 2015. The results indicate that increasing energy governance quality by one standard deviation could reduce energy consumption growth by approximately 0.50%. Also, energy governance can be improved by establishing strategic plans that identify the laws’ quantitative objectives and the economic costs necessary to monitor and enforce them. Işık et al. [45] used the CS-ARDL model with the AMG and CCEMG techniques to study how economic, environmental, social, and governance factors affect SDG-based energy efficiency for G-7 countries. The results reveal that while economic factors negatively impact energy efficiency, environmental factors positively impact it. Therefore, policymakers must align conflicting economic and environmental policies on energy efficiency. Nevskaya et al. [46] used the R Project tools to develop a multiple regression model that can be utilized to analyze and predict the impact of energy losses, the share of energy produced from carbon-containing sources, CO2 emissions, population size, gross domestic product (GDP), and the volume of primary energy used on the national energy intensity of both economically developed and developing countries. The results underline that primary energy, CO2 emissions, and GDP contributed the most to energy intensity.
In the EU, the energy efficiency analysis in each end-use sector in the EU and for each country is based on the ODYSSEE database, which is used to monitor and evaluate annual energy efficiency trends and energy-related CO2 emissions. The ODYSSEE database uses several facilities to calculate energy-related indicators. For example, the Energy Efficiency Index (ODEX) by sector is employed to evaluate energy efficiency progress (measured in percentages), and energy savings are used to calculate the amount of energy saved through energy efficiency improvements across the EU countries. It also uses a decomposition tool that facilitates easy analysis of the main drivers of primary and final energy consumption by decomposing the variation in energy consumption between two years into several effects. The variation in the final energy consumption is decomposed into seven effects linked to several factors for each end-use sector, as presented below (Table 1).
The analysis presented in a previous report [47] shows that four main drivers contributed to the increase in final economic consumption in 2012, compared to 2000, namely EA by around 100 Mtoe, DE by 40 Mtoe, LS by 20 Mtoe, and CL by 20 Mtoe. On the other hand, EV generated a decrease in the final energy consumption by 80 Mtoe. The other two main drivers, ST and RS, had a lower contribution, reducing energy consumption by 30 Mtoe.
So, final energy consumption is a complex interplay of economic, technological, policy, and behavioral factors. Understanding these drivers helps policymakers and businesses implement energy efficiency and sustainability strategies. The key to reducing consumption is improving efficiency, promoting cleaner energy sources, and adopting smarter consumption habits.
As presented above, the literature assessing the driving forces of the change in energy consumption is vast. However, it refers mostly to developing countries like APEC countries and India, which face intense pollution due to modest regulations or a lack of will to implement complex regulations, while the analyses focused on the EU are few [42,47] and not up to date.

3. Materials and Methods

Considering the objective of this research, we performed comparative and correlation analyses, and the decomposition technique (factorial analysis) was used to analyze the dynamic relationships between energy-related indicators for the EU as a whole and the 27 EU countries in 2023 compared to 2015. Considering the research objective of the paper, the factorial analysis is justified in identifying the factors that impact final energy consumption in EU member states. In addition, this method aligns with its data structure and sample size.
Keeping in mind the main drivers (MDs) of energy consumption and the key factors underlined in Section 2 and given the limitation of the data available in international databases, several indicators that quantify the most accurate final energy consumption and energy efficiency, as well as the factors that explain their change, were selected, as follows:
  • The final energy consumption (FEC) was measured in Mtoe, and the final energy consumption per capita (FEC/capita) was measured in tons of oil equivalent (toe) [48]. This indicator has been the subject of country-focused scientific studies in the EU [49,50,51,52,53].
  • The energy intensity of GDP in purchasing power standards (EI) was measured in kilograms of oil equivalent (KGOE) per thousand euro [54]. This indicator was used in specific studies focused on the energy transition in different countries or regions [55,56,57,58]. We selected this indicator because it is more suitable for comparison across countries.
  • The indicators that quantify the factors that explain the variation in final energy consumption are summarized in Table 2.
In this study, the energy efficiency is reflected by the EI and the final energy consumption per capita (FEC/capita). The first indicator (EI) shows the quantity of final energy used to produce a unit of GDP, while the second one (FEC/capita), calculated as the ratio between the FEC and the population, highlights the quantity of final energy used, on average, by a person in one year. Using FEC/capita allows us to perform better correlation analyses with other indicators that are calculated per capita, such as FEC-H, PCR, and ANE.
To establish the dynamic relationships between the analyzed indicators, we performed the following steps:
I.
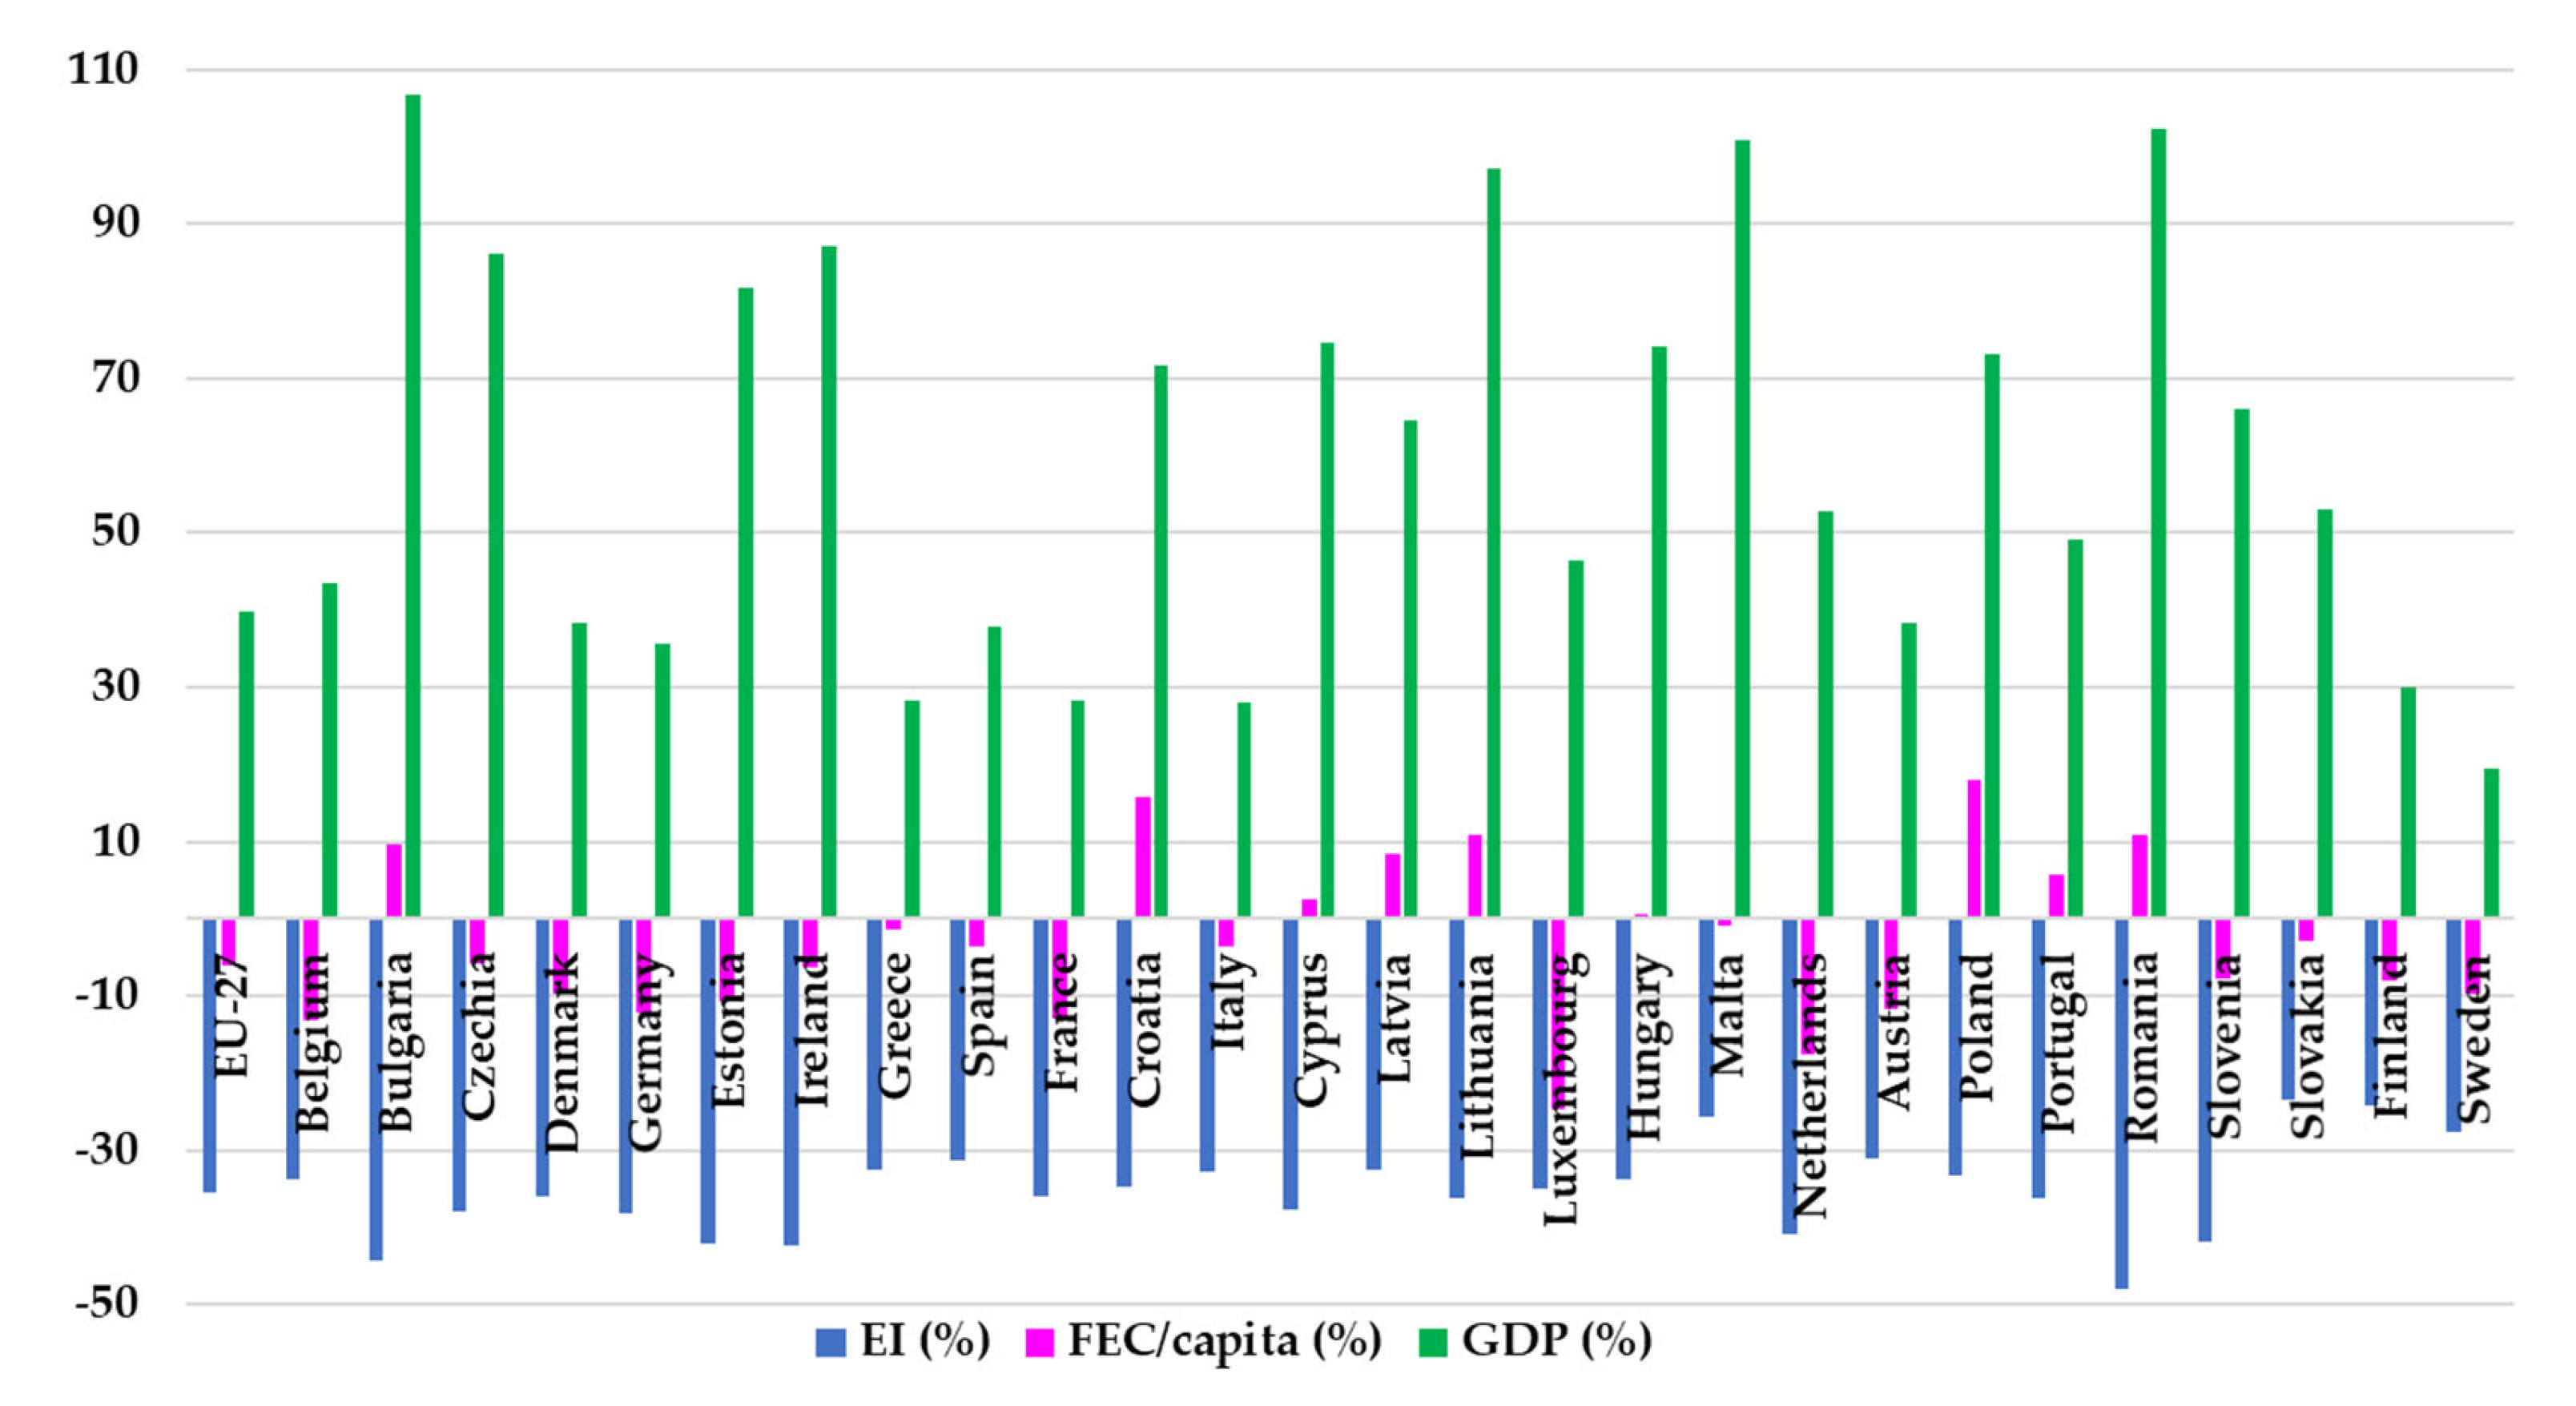
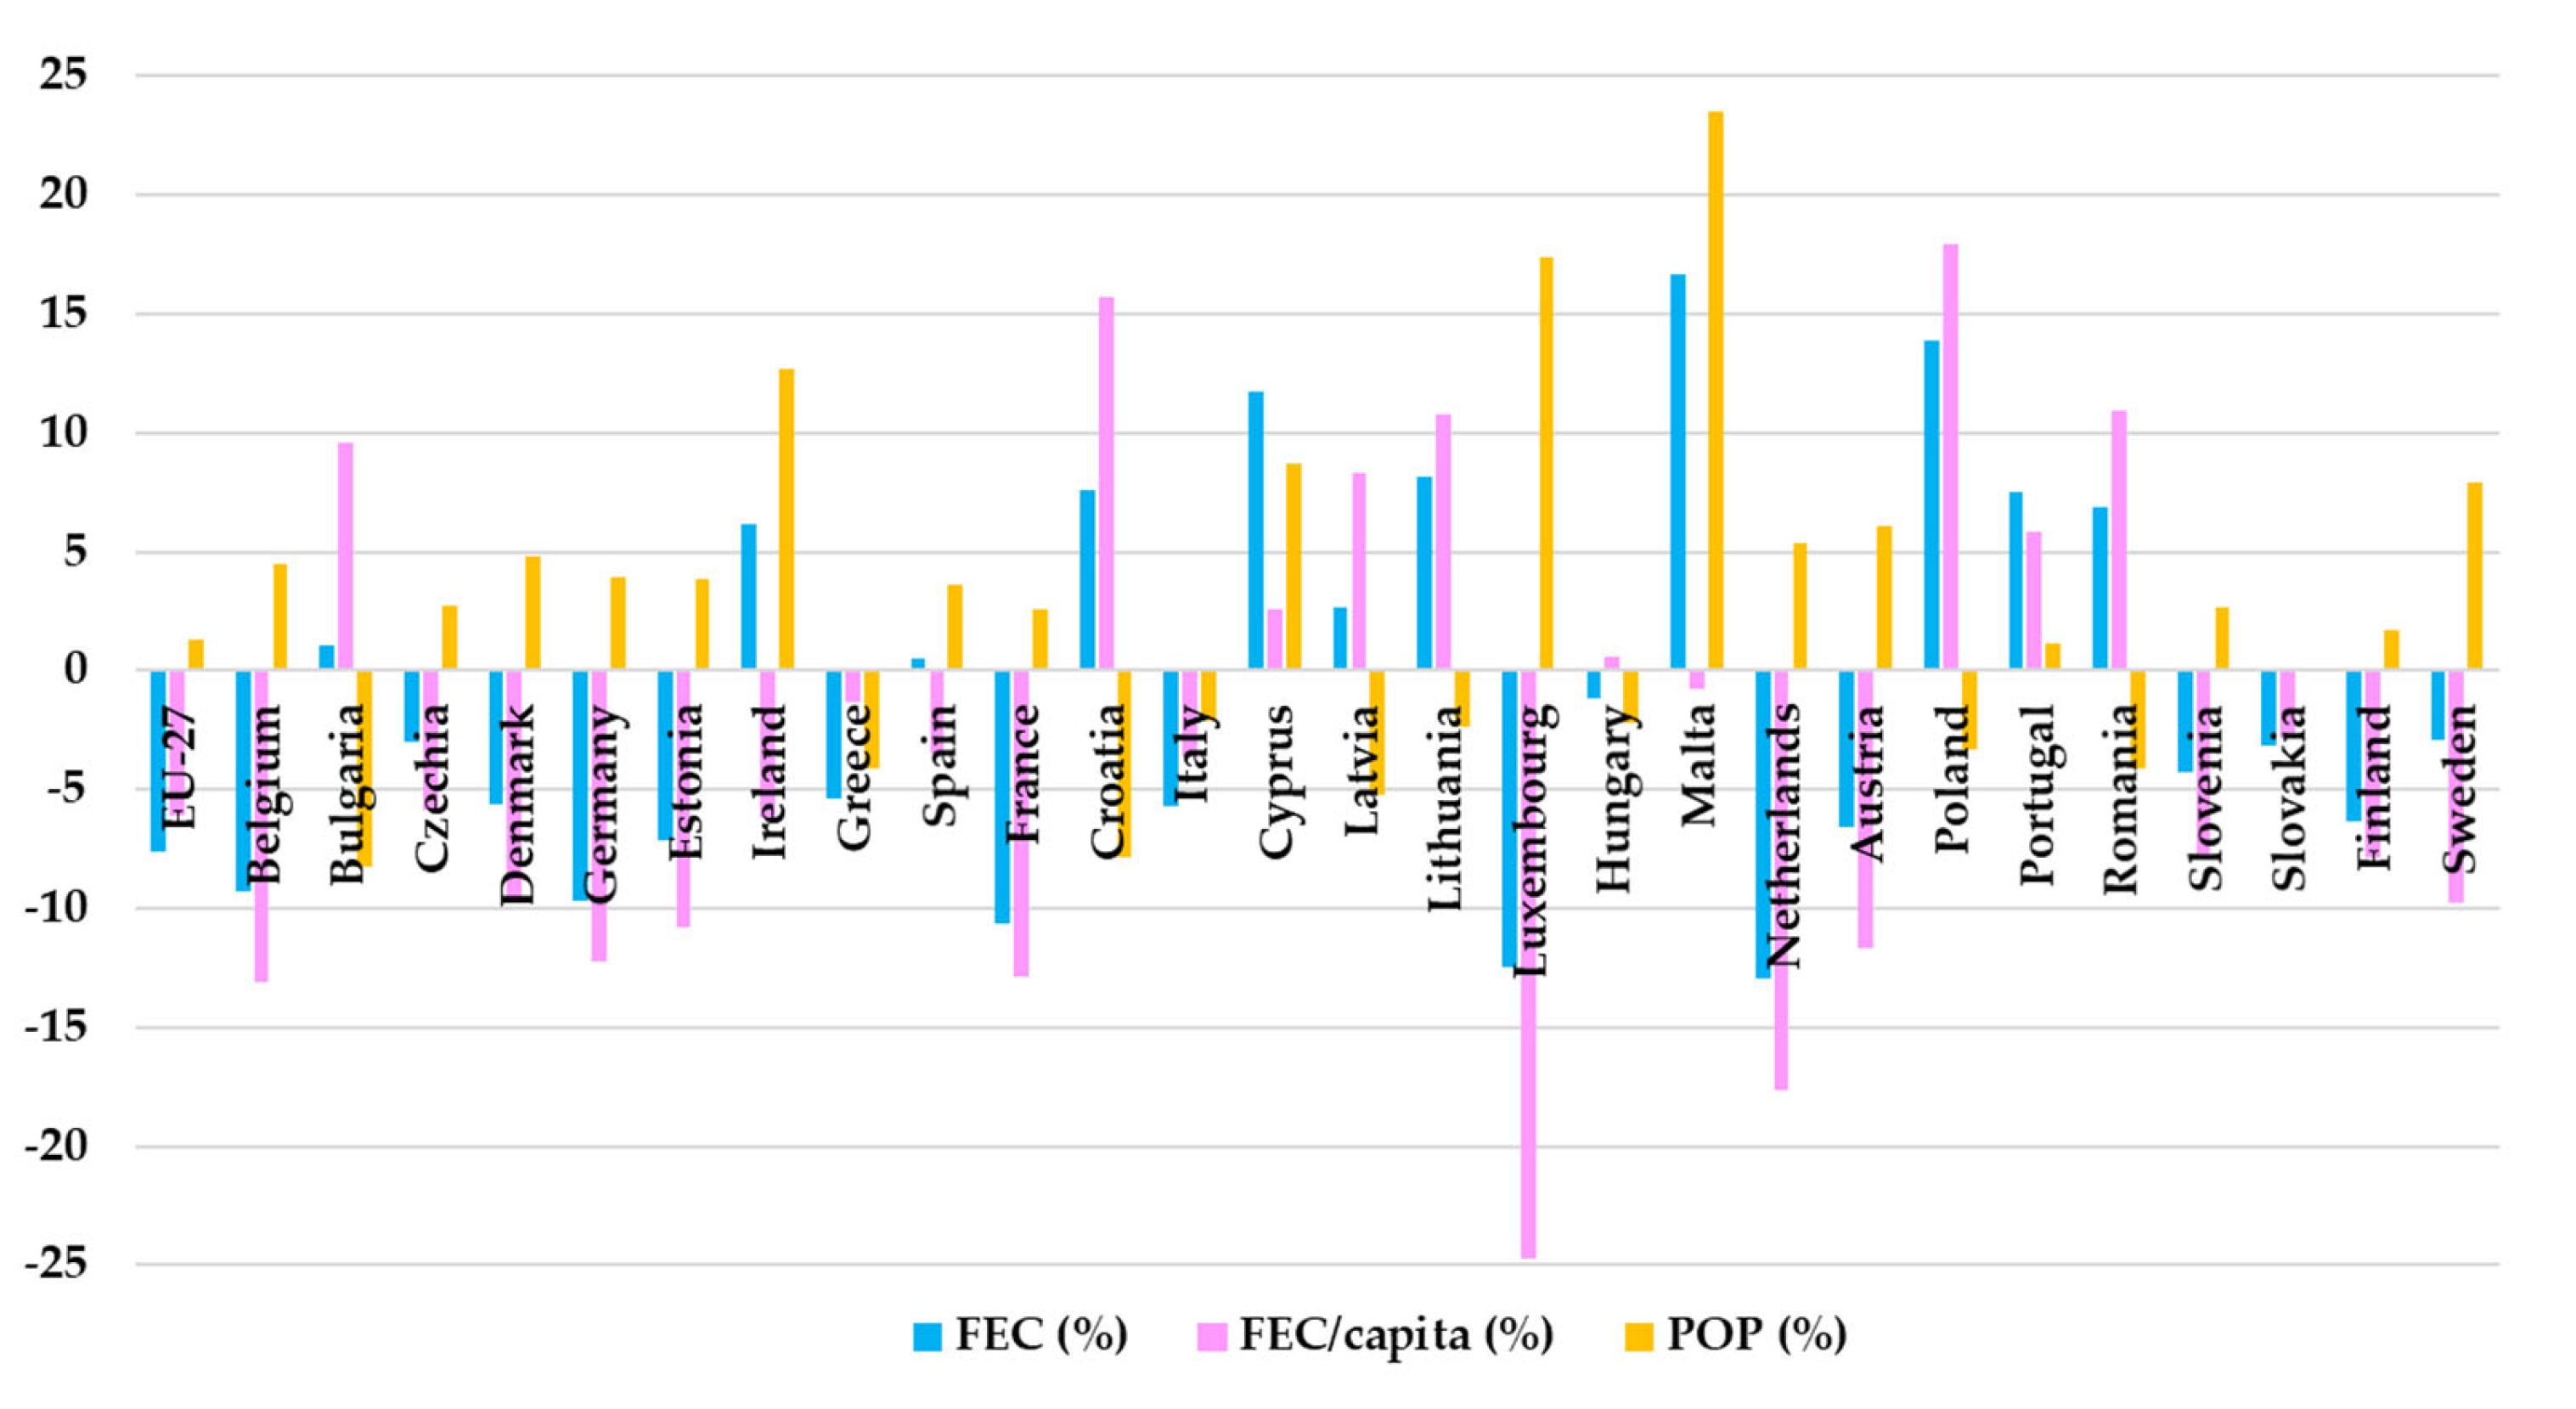
We calculated the relative change (%) in the above indicators in 2023, compared to 2015, for EU-27 member states and the EU. Based on these values, we performed a comparative analysis underlying the differences between EU countries;
II.
We performed more in-depth analyses to better understand the differences among EU economies, as follows:
We used a multiplicative factorial model to decompose the variation in FEC and quantify each analyzed factor’s impact using Equation (1).
F E C = P O P × F E C P O P = P O P × F E C / c a p i t a  
where:
POP is population.
Using Equation (1), the variation in FEC measured in Mtoe can be decomposed in the contribution of each factor, all things being equal, as follows:
F E C = F E C 1 F E C 0 , of which:
  • The contribution of POP is as follows:
    F E C ( P O P ) = P O P 1 P O P 0 × F E C / c a p i t a 0
  • The contribution of FEC/capita is as follows:
    F E C ( F E C / c a p i t a ) = P O P 1 × F E C / c a p i t a 1 F E C / c a p i t a 0
Thus:
F E C = F E C ( P O P ) + F E C ( F E C / c a p i t a )
where:
  • 0—the first year of the period (2015);
  • 1—the last year of the period (2023).
This model underlines the direct positive relationship between FEC/capita and FEC. Thus, a decrease in FEC/capita due to several causes, such as lifestyle and consumer behavior changes or household energy efficiency improvements, will positively impact final energy consumption, leading to energy savings.
We determined the Pearson correlation coefficient (r) between the variation in FEC (%) as a dependent variable and the change in EI (%) and FEC/capita (%) as independent variables using the Pearson statistical function in Microsoft Excel. Also, to establish the direct and indirect relationships between the analyzed factors and highlight their impact on FEC variation, we calculated the Pearson correlation coefficient (r) between the following:
  • FEC (%) and X (%);
  • GVA (%) and X (%); FEC/capita (%) and X (%);
  • FEC-H (%) and THC (%); FEC-H (%) and HDD (%); FEC-H (%) and CDD (%); I-GVA (%) and M-GVA (%); ET (%) and ES (%).
Based on the highest correlation coefficient values, we established a model (pattern) on 3 levels, which shows the relationships between the variation in final energy consumption and its driving forces.
III.
We applied the model to three EU countries, namely Romania, Estonia, and Germany, and performed a comparative analysis to better understand the differences between EU economies in terms of energy efficiency improvements.
Finally, based on the results of the analyses performed, we present the conclusions in the last section of this paper and propose actions that can be taken to reduce the final energy consumption in the EU as a whole and in Romania.

4. Results

4.1. Comparative Analysis of the Energy Efficiency Trends in EU Countries

Between 2015 and 2023, in the EU, EI and FEC/capita decreased by 35.52% and 6.13%, respectively, while the GDP increased by 39.7%. Most EU countries followed the same trend, except for Bulgaria, Croatia, Cyprus, Latvia, Lithuania, Hungary, Poland, Portugal, and Romania, as presented in Figure 5.
Energy intensity decreased in all the EU countries, with values ranging between 23.53% (Slovakia) and 47.92% (Romania). Rates of reduction over 40% were also registered in another four countries, namely Bulgaria (44.26%), Ireland (42.26%), Estonia (42.12%), and Slovenia (41.79%). Simultaneously, the GDP increased in all EU states, with rates ranging from 19.54% in Sweden to 106.79% in Bulgaria. Rates over 100% were registered in Romania (102.36%) and Malta (100.97%). Therefore, in all the EU member states, the high economic growth was doubled by a significant increase in energy efficiency. Comparatively, the final energy consumption per capita decreased in 18 out of the 27 analyzed countries with rates of 0.76% (Malta) to 24.71% (Luxembourg), while in the other nine countries, the FEC/capita increased with values ranging between 0.57% (Hungary) and 17.9% (Poland), as presented in Figure 6.
Between 2015 and 2023, the final energy consumption at the EU level decreased by 7.58% (i.e., 45.6 Mtoe). Until 2019, the consumption rose each year, with an average annual growth rate of 0.89%. In 2019, this trend was reversed, with a decrease in the final energy consumption, compared to 2018 with 5.1 Mtoe (0.52%), followed by a significant drop in 2020, representing a change of −7.99% compared to 2019, which was mostly due to the COVID-19 pandemic. In 2021, energy consumption recorded substantial growth (6.37%) as the EU economy started recovering after the COVID-19 pandemic. In 2022 and 2023, the trend reversed, and a 5.63% decrease was recorded in 2023 compared to 2021.
As for the EU countries, in 2023, compared to 2015, the final energy consumption decreased in 16 out of the 27 analyzed countries, with rates of 1.18% (Hungary) to 12.95% (The Netherlands), while in the other 11 countries, energy consumption increased, with values ranging between 0.5% (Spain) and 16.67% (Malta).
Therefore, in some EU countries, mostly the traditionally developed ones, economic growth was possible with a reduction in energy consumption (group I), while in other countries, most of them from Central and Eastern Europe (CEE), high economic growth was based on larger energy consumption (group II). In group I, both energy intensity and FEC/capita decreased compared to group II, in which the per capita energy consumption increased despite the high rates of energy intensity reduction (Table 3).
In Ireland, Spain, and Malta (group III), population growth was larger than FEC/capita reduction, resulting in an increase in final energy consumption, while in Hungary, the contraction of the population was higher than FEC/capita growth, resulting in a decrease in energy consumption.
It must be noted that the final energy consumption and FEC/capita had a similar trend for most of the EU countries, except for Ireland, Spain, Malta, and Hungary, which underlined the positive relationship between these two variables. Comparatively, the FEC and EI had different trends. Thus, FEC increased, although EI decreased for 11 out of the 27 analyzed countries (groups II and III).

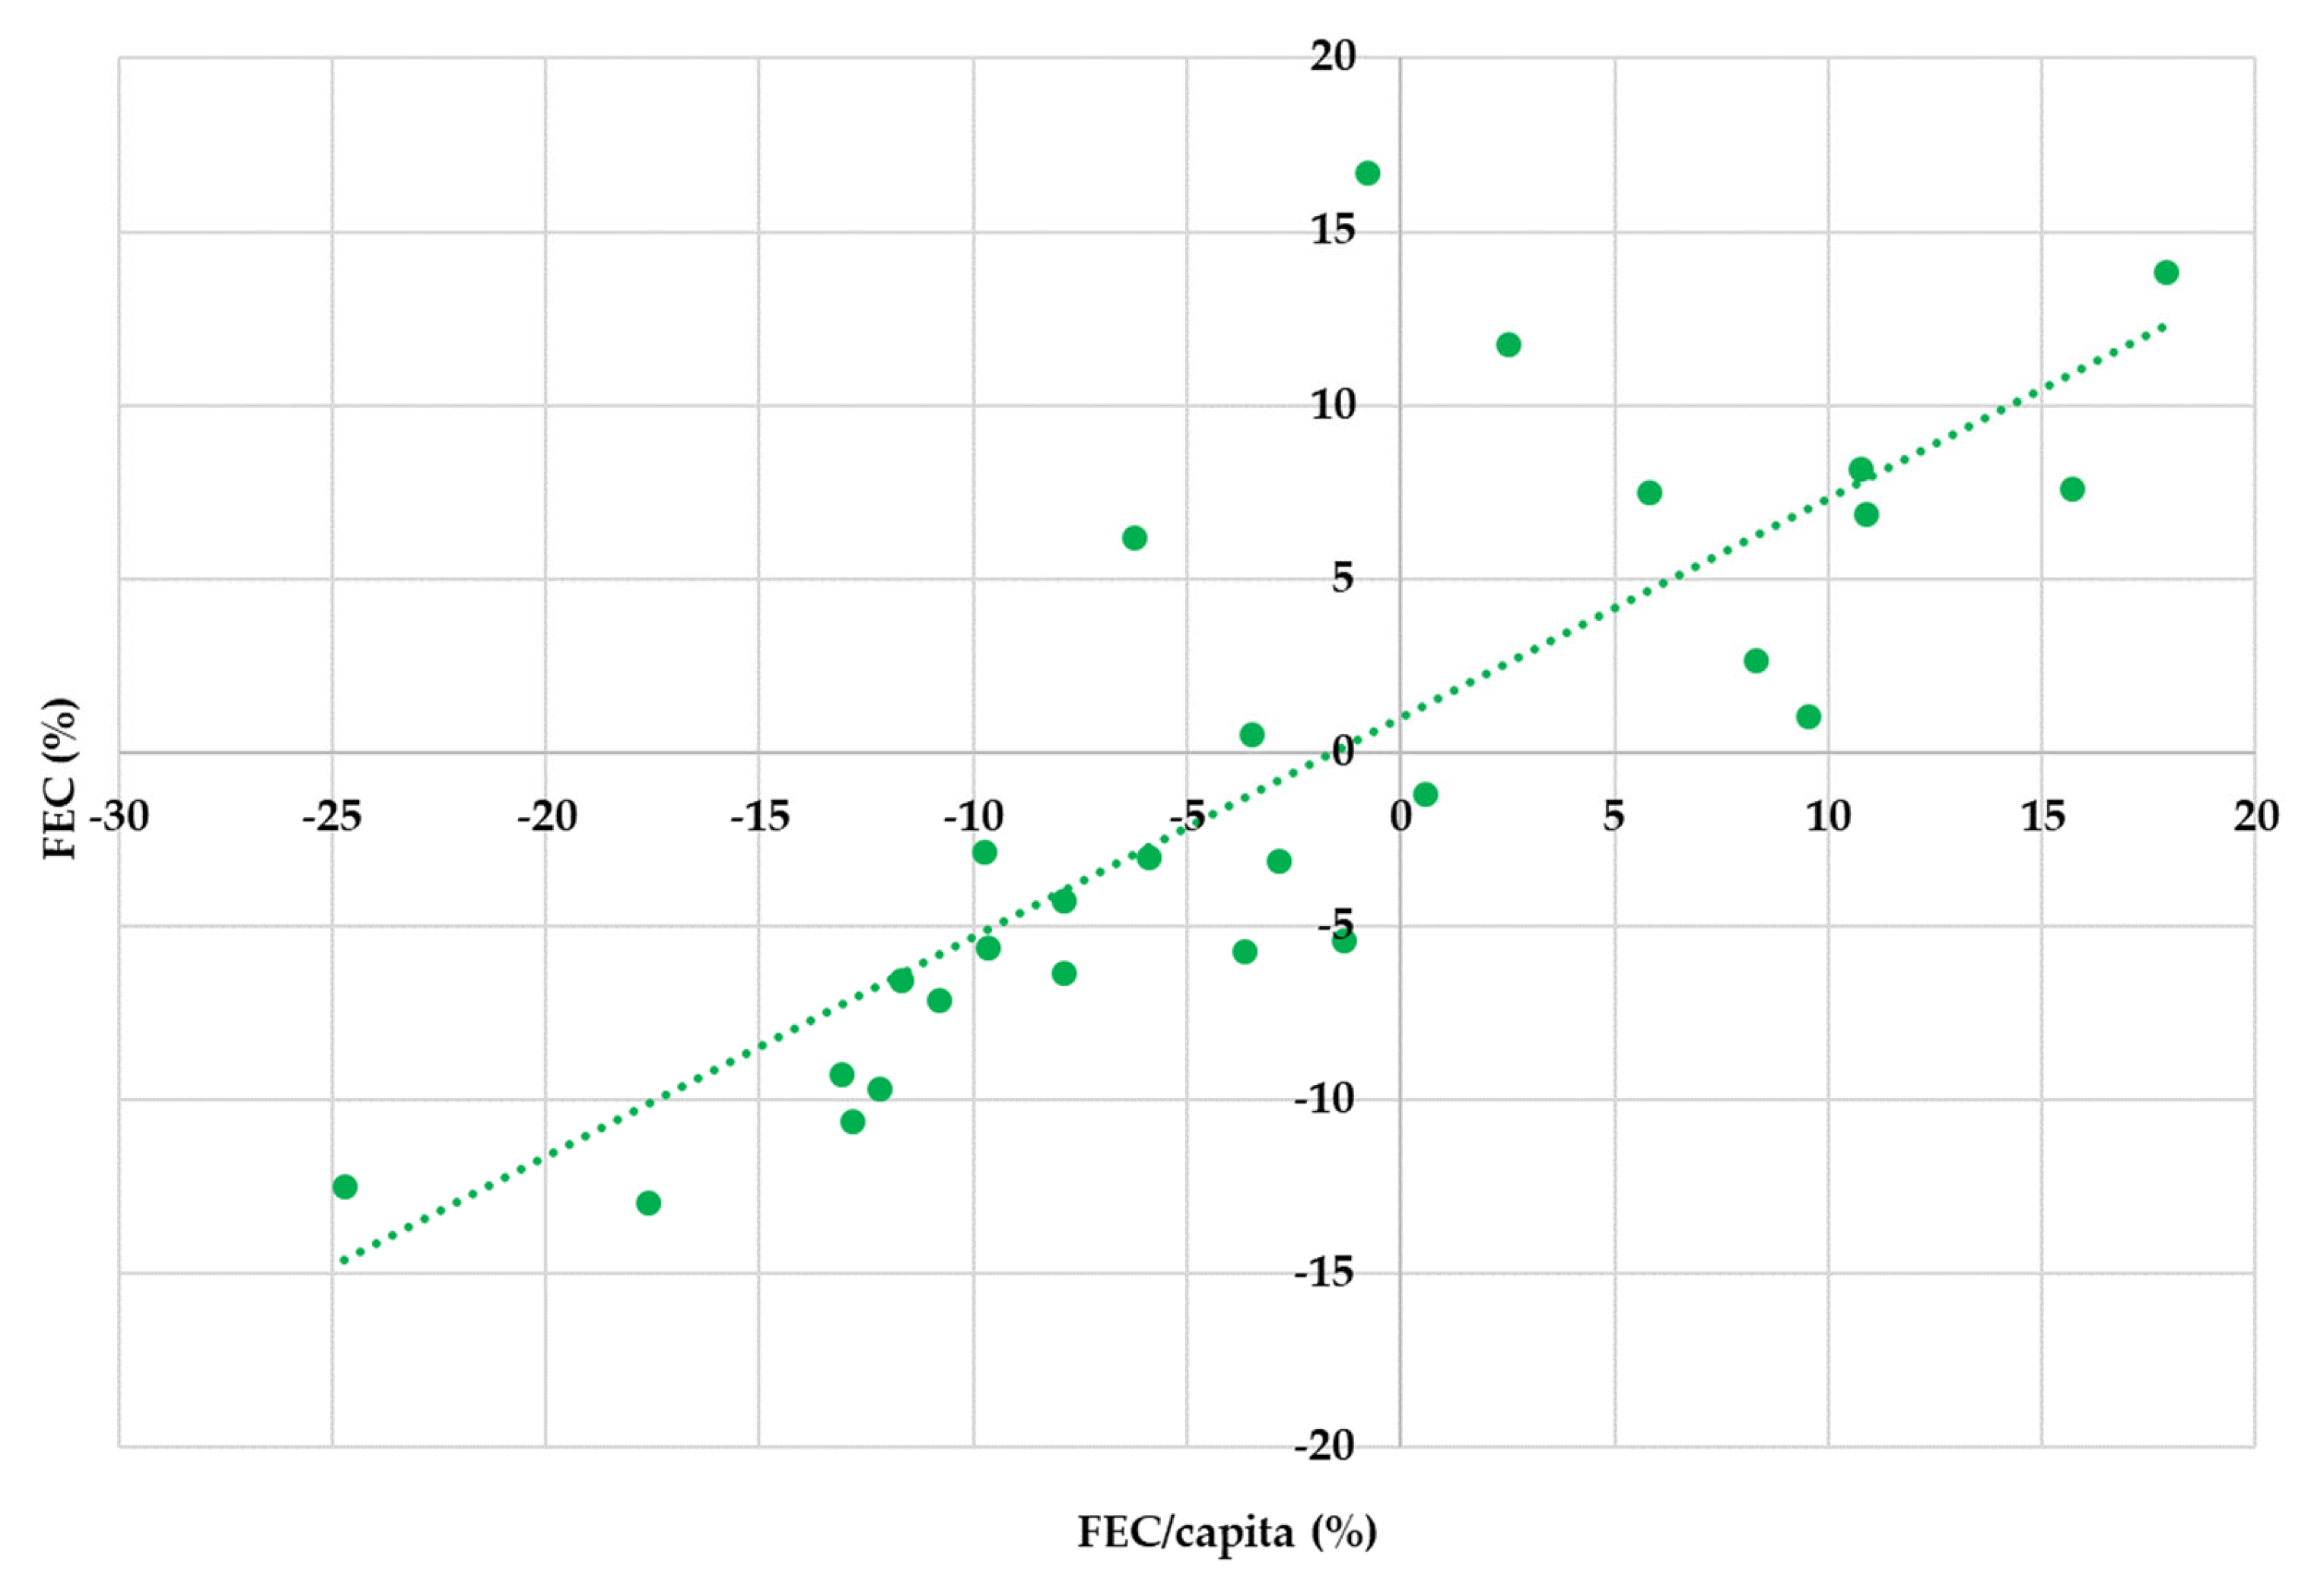
4.2. Correlation and Factorial Analyses

Based on the results of the analysis presented above (Table 3), we determined the Pearson correlation coefficient (r) between the following:
  • FEC (%), as a dependent variable, and EI (%), as an independent one;
  • FEC (%), as a dependent variable, and FEC/capita (%), as an independent variable.
The value of the correlation coefficient between FEC (%) and EI (%) is 0.0137, underlining a non-significant positive relationship between the analyzed variables (Figure 7).
As underlined above, only 1.37% of the variation in FEC is explained by the change in energy efficiency reflected by the energy intensity of GDP in PPSs calculated by Eurostat (EI). Comparatively, the high value of the correlation coefficient (0.8054) between FEC (%), as a dependent variable, and FEC/capita (%), as an independent one, shows a powerful positive relationship between them. Thus, the change in FEC/capita explains over 80% of the variation in final energy consumption (Figure 8).
Using the multiplicative factorial model presented in Section 3, we decomposed the variation in the final energy consumption (ΔFEC), measured in Mtoe, to quantify the contribution of the FEC/capitaFEC(FEC/capita)) and the population (ΔFEC(POP)). The results are summarized in Table 4.
At the EU level, the contraction of the final energy consumption by 45.60 Mtoe was entirely due to a 6.13% decrease in FEC/capita, which had a high positive impact on FEC, resulting in energy savings of 58.34 Mtoe. A population growth of 1.33% negatively impacted final energy consumption, leading to energy gains of 12.74 Mtoe. Most of the traditionally developed European economies and several CEE countries (Czechia, Estonia, Slovenia, and Slovakia) recorded similar developments, respectively, energy savings due to a decrease in FEC/capita, which offset the negative impact of the population growth, resulting in the contraction of the final energy consumption. Comparatively, in Bulgaria, Croatia, Cyprus, Latvia, Lithuania, Poland, Portugal, and Romania, the increase in the FEC/capita contributed to the final energy consumption growth, with values ranging between 0.05 Mtoe (Cyprus) and 10.66 Mtoe (Polonia). In these countries, except Cyprus and Portugal, population decline had a positive impact on energy consumption, leading to energy savings of 2.16 Mtoe in Poland, 0.79 Mtoe in Romania, 0.74 Mtoe in Bulgaria, 0.46 Mtoe in Croatia, 0.20 Mtoe in Latvia, and 0.11 Mtoe in Lithuania. In Cyprus and Portugal, population growth contributed to an increase of 0.15 Mtoe and 0.25 Mtoe in energy consumption, respectively.
The results of the analyses presented above highlight the gap between EU countries in terms of energy efficiency improvement between 2015 and 2023. Thus, in traditionally developed EU countries as well as in Czechia, Estonia, Slovenia, and Slovakia, a decrease in energy consumption was based on per capita energy savings due to energy efficiency improvement. In contrast, in several CEE countries (Poland, Romania, Bulgaria, Croatia, Latvia, and Lithuania), the faster FEC/capita growth offset the population decline’s positive impact, leading to energy gains, even though the EI had decreased.
In order to better understand the discrepancies between EU states, a more in-depth analysis of the factors that led to these developments was performed. Table 5 shows the values of the correlation coefficient between the variation in the indicators that quantify the factors that explain the energy consumption change and the variation in the final energy consumption.
Based on the highest correlation coefficient values, we developed a model (pattern) on three levels that show the relationships between the variation in final energy consumption and its driving forces (Figure 9).
The variation in the final energy consumption per capita had the highest impact on the change in energy consumption. Thus, the decrease in FEC/capita positively impacted the reduction in final energy consumption, leading to energy savings. Lifestyle and consumer behavior changes, measured by the variation in FEC-H, PCR, and average ANE, explained over 60% of the variation in FEC/capita. Therefore, the increase in the number of passenger cars, household equipment, and larger homes led to FEC/capita growth, resulting in an increase in energy consumption. The contribution of households to the variation in energy consumption (around 67%) was significant given that at the level of the year 2022, households accounted for 27% of the final energy consumption. Among the level 3 factors, the change in the CDD had the highest impact (34.4%) on the variation in the final energy consumption in households per capita. The effects of climate change in Europe explain this development. The last Eurostat Report, from 2024, [72] shows that the need for cooling in buildings has increased in most EU countries, primarily in Malta, Cyprus, and Spain. Given the significant impact of households on the final energy consumption, increasing the energy efficiency of homes is imperative as buildings consume a high amount of energy for heating, cooling, cooking, and lighting. This goal can be achieved through thermal insulation, double-glazed window installation, LED lighting systems, and improvement in cooling and heating systems. In addition, advanced technologies such as heat pumps and solar panels can be used to reduce energy consumption and increase energy efficiency [13].
The change in FEC_T also significantly impacted the variation in energy consumption, explaining 76.16% of the change in FEC. Hence, the decrease in FEC_T due to energy efficiency improvements or modal shifts led to energy savings. If the oldest and less efficient cars are replaced by new ones with lower specific consumption or vehicles that use cleaner and more efficient technologies, such as electric vehicles [13], the average energy performance of the car fleet will improve, resulting in decreased energy consumption. In addition, if other transport modes replaced part of the road traffic, for example, rail or water for goods and public transport for passengers, the final energy consumption would decrease. Data show that the 2015–2023 period was marked by a change in the development of energy consumption for transport due to the COVID-19 pandemic. Thus, energy consumption for transport activities at the EU level increased constantly until 2020, when it contracted by 12.9% compared to 2019, followed by a steady recovery in 2021–2023, but it was still below the 2019 level. In the year 2022, all transport modes accounted for 31% of the final energy consumption.
The variation in the gross value added (GVA) had a high positive impact on the change in energy consumption, explaining 75.16% of the change in FEC. Industry had the highest contribution (over 62%), followed by the services (around 60%) and construction (around 54%) sectors, while agriculture had a lower impact (around 42%) on the change in the final energy consumption. The contribution of manufacturing to the impact of industry on GVA variation was significant (around 88%). It can be noticed that the contribution of services on the change in gross value added (59.5%) was higher than the manufacturing contribution (53.9%), underlying a shift to less energy-intensive sectors, with a positive impact on final energy consumption as “services require around 7 times less energy per unit of value added than industry” [47]. In this respect, the last Eurostat data from 2022 [15] show that industry accounted for 25% of the final energy consumption at the EU level, while services accounted for 13%.
The variation in the INV had a low impact on the change in final energy consumption (around 10%) compared to the change in the investments made in the energy sector, which explains around 23% of the change in energy consumption. Thus, the increase in investments in the energy sector targeting efficiency improvements positively impacted energy consumption reduction, leading to energy savings.
The change in NH had a relatively low impact on the variation in final energy consumption (around 18%). Hence, the increase in the number of households negatively impacted final energy consumption, resulting in energy gains.

4.3. Comparative Analysis Between Romania, Estonia, and Germany

Based on the above analysis, we performed a comparative analysis between a country from group II (Table 3), namely Romania, and two countries from group I (one from CEE, namely Estonia, and the other being a traditionally developed one, namely, Germany). The patterns of the relationships between the factors that explain the variation in final energy consumption are presented in Figure 10 (Romania), Figure 11 (Estonia), and Figure 12 (Germany).
Between 2015 and 2023, Romania recorded a very high growth rate of value added (30.73%) compared to Estonia (18.62%) and Germany (8.76%). Also, as underlined in Section 4.1, the GDP growth rate in Romania was 102.36%, while it was 81.77% in Estonia and 35.64% in Germany. So, in 2023, compared to 2015, the gap between the level of economic development in Romania and that in Estonia and Germany was significantly reduced due to higher economic growth. Data show that in 2015, the gap was around 12,227 euros per capita compared to the EU-27, 5855 euros/capita compared to Estonia, and approximately 19,362 euros per capita compared to Germany. In 2023, the gap was reduced to 3790 euros per capita compared to the EU-27, 5093 euros per capita compared to Estonia, and around 14,552 euros per capita compared to Germany (Figure 13).
The economic growth in Romania was mostly based on transport, construction, and agriculture, while services had a low contribution to the increase in GVA. Also, the contribution of industry and manufacturing to the value-added growth decreased by around 7% and 1%. Comparatively, in Estonia, the GVA growth was mainly due to construction, services, and manufacturing, while in Germany, agriculture and services had the highest contribution, followed by manufacturing. Therefore, in Romania, the final energy consumption in transport recorded a high growth rate (44.23%) compared to Estonia (11.29%) and Germany (−11.32%). It is also true that the significant reduction in energy consumption in transport recorded in Germany was due to energy efficiency improvements, modal shift, and the use of cleaner and more efficient technologies, such as electric vehicles. Data show that 70% of recharging stations at the EU level are concentrated in three countries, namely, The Netherlands, France, and Germany. In addition, the shift to less energy-intensive sectors, such as services, in Estonia and Germany, compared to Romania, further decreased final energy consumption.
In Romania, the final energy consumption growth rate in households per capita was higher (6.45%) than in Estonia (4.75%), while in Germany, the energy consumption in households decreased by 5.94%. Also, total housing costs in Romania increased significantly by 74.53%, although the need for cooling and heating decreased by around 7% and 10%, respectively. These negative developments in Romania could be explained by an increase in energy prices and higher energy consumption due to larger homes or the acquisition of more household appliances. Comparatively, in Estonia, the housing costs grew only by 39.51%, even though the need for cooling and heating increased. The number of passenger cars recorded a higher growth rate in Romania (62.83%) compared to Estonia (22.57%) and Germany (7.3%). A similar development was registered by the average annual net earnings that increased by 102.6% in Romania, while in Estonia and Germany, only an increase of around 31% was observed. So, it seems that in Romania, higher earnings sustained a larger energy consumption in homes and a rise in the number of passenger cars, which had a negative impact on energy consumption.
Investments in the energy sector decreased by 53.18% in Romania, while in Estonia and Germany, they increased by 51.94% and 149.73%, respectively. Therefore, the efficiency improvements in the energy sector contributed to greater energy consumption reduction in Estonia and Germany compared to Romania.
The energy transition and decarbonization process in Romania, Estonia, and Germany follows different paths based on their unique energy landscapes, policies, and historical dependence on fossil fuels. All three countries are advancing toward cleaner energy but with different approaches based on their resources and economic realities. Germany leads in renewables but struggles with costs and grid stability, Estonia faces a major shift from oil shale, and Romania balances nuclear, hydro, and wind expansion. Amid the major challenges generated by the conflict in Ukraine, each country faces specific challenges in the decarbonization process, such as high costs and grid stability for Germany, oil shale dependence and a small energy market in Estonia, and aging infrastructure and investment needs in Romania.

5. Discussion

The results of the correlation analysis show that only 1.37% of the variation in final energy consumption is explained by the change in energy efficiency reflected by the energy intensity of GDP in PPSs, which Eurostat calculates as the ratio of final consumption to GDP in PPSs. Comparatively, the change in FEC/capita explains over 80% of the variation in final energy consumption. Thus, we recommend that future studies assessing the relationship between energy efficiency and energy consumption only use the energy intensity of GDP in PPSs to approximate energy efficiency.
There is a gap between EU countries in terms of energy consumption between 2015 and 2023. Thus, economic growth was possible with reduced final energy consumption due to energy efficiency improvement in traditionally developed EU countries and in Czechia, Estonia, Slovenia, and Slovakia. In contrast, in several CEE countries (Poland, Romania, Bulgaria, Croatia, Latvia, and Lithuania), the high economic growth has been based on larger energy consumption. In these former communist countries, the positive impact of the population decline on energy consumption was offset by the faster growth of FEC/capita, leading to energy gains. Therefore, EU countries have different incentives for energy consumption, depending on their level of development.
The variation in final energy consumption between 2015 and 2023 in EU countries was mostly due to key factors linked to economic activity, lifestyle and consumer behavior, the climate effect, and the energy savings effect. Thus, transport contributed the most to the variation in energy consumption, followed by services and manufacturing. The results indicate a shift to less energy-intensive sectors that positively impacted final energy consumption reduction, leading to energy savings. Concerning lifestyle and consumer behavior, household energy consumption had the highest contribution to the variation in energy consumption, followed by the number of passenger cars and the average annual net earnings. The climate effect was mostly due to the change in the cooling degree days, which explained over 34.4% of the variation in the final energy consumption in households per capita. As for the energy savings effect, the results show that the increase in investments in the energy sector targeting efficiency improvements contributed to the reduction in energy consumption, leading to energy savings.
These findings are reinforced by the results of the comparative analysis, which showed that the gap between Romania, Estonia, and Germany in terms of final energy consumption reduction is mostly due to economic structure, lifestyle and consumer behavior, and the energy savings effect. Thus, the high economic growth in Romania was mainly based on energy-intensive sectors, namely, transport, which contributed the highest energy consumption, and construction. Also, the changes in lifestyle and consumer behavior stimulated by a significant increase in the average annual net earnings negatively reflected on the final energy consumption in households and the number of passenger cars, leading to energy gains. Moreover, the substantial decrease in the investments in efficiency improvements in the energy sector contributed to the growth of the final energy consumption.
In this context, various measures could be adopted to reduce energy consumption by transportation, buildings, and individuals and to increase energy efficiency in the energy sector, starting from other EU countries’ good practices. To decrease energy consumption in transport, we consider the following effective measures: (1) part of the road traffic can be replaced by other transport modes, for example, public transport for passengers and rail for goods; (2) new vehicles can gradually replace oldest and less efficient ones with lower specific consumption; and (3) as recharging infrastructure develops and the standard of living rises, vehicles that use cleaner and more efficient technologies, such as electric cars, can replace most of the old ones. To increase energy efficiency in buildings, consumers can be encouraged to thermally insulate buildings, install double-glazed windows, use LED lighting systems, and improve the cooling and heating systems. As the standard of living rises, more expensive advanced technologies, such as solar panels and heat pumps, can be used to reduce energy consumption and increase the energy efficiency of buildings. In addition, to reduce energy consumption in homes, consumers can be encouraged to replace older and less efficient appliances with new ones with lower energy consumption (energy class A). To encourage end-consumers to adopt a “Green” attitude oriented towards energy savings, a mix of policy tools can be used, as follows: motivational policies, including incentives and educational and awareness policies, and coercive policies, including fines and penalties. Global warming is expected to increase CDD (higher cooling demand) and decrease HDD (lower heating demand) in many regions. Even though regional variations exist, some colder areas might still experience significant heating needs despite rising temperatures. Global warming has an impact on energy consumption. Higher CDD will increase electricity demand for air conditioning, leading to peak loads in summer, and lower HDD will reduce fossil fuel consumption for heating, affecting natural gas and oil demand. In addition, seasonal energy supply–demand imbalances will require better grid management and storage solutions; so, climate change generates challenges for the energy transition process.
Climate change also has implications for renewable energy integration and the reconfiguration of the energy mix in specific situations. Increased cooling demand aligns well with solar energy production, which peaks in summer, and reduced heating demand could lower dependence on gas or coal, supporting decarbonization efforts. So, the need for grid flexibility can accommodate seasonal variations in renewable energy generation. Considering these specific situations, the implications of infrastructure can be detected. With energy-efficient building design and passive cooling strategies, urban planning should adapt to rising cooling needs. Investments in energy storage, smart grids, and demand-side management are necessary to handle shifting energy loads [73,74,75,76].
As several studies underline, the success of energy policies depends on the quality of governance. Therefore, policymakers must balance climate ambition and the economic, technological, and social challenges that the energy transition brings. In this respect, we appreciate that impact studies based on realistic data are needed for each of the proposed measures.
The decarbonization of European economies is supported not only by public authorities but also by companies and universities, which, based on partnerships, have been actively involved in supporting technical progress by identifying complex solutions to reduce energy consumption and increase energy efficiency in various fields, such as smart buildings and advanced insulation materials, by using sensors and artificial intelligence to manage energy consumption and supporting the development of advanced thermal windows and building materials with superior insulating properties [77]. In addition, solutions like smart grids help implement smart meters for efficient household and industrial consumption management. Other solutions are energy storage, such as developing advanced batteries with longer lifespans and higher storage capacity and using hydrogen storage solutions. The use of robots and AI systems to optimize production processes and waste heat recovery and reuse in industry are examples of industrial automation with a positive impact on energy efficiency [78]. The increasing number of electric and hybrid vehicles and the implementation of environmentally friendly public transport (electric buses and hydrogen-powered trains) are additional technological examples of sustainable mobility.

6. Conclusions

The progress made by EU countries in the process of reducing energy consumption is due to the concrete actions taken by European authorities, who have very meticulously regulated the stages of the energy transition, as well as the stakeholders, i.e., companies, consumers, and local communities that comply with European directives and that have accepted new technologies and understood the importance of responsible behavior. The EU has adopted numerous policies and supported technological advances to save energy, reduce dependence on fossil fuels, and increase energy efficiency. The most important policies are (i) the Clean Energy for All Europeans Package, which introduces measures for household and industrial consumers to reduce energy consumption in order to increase the energy efficiency target to 32.5% by 2030; (ii) the Energy Efficiency Directive 2012, revised in 2018 and 2023, which set binding energy reduction targets and imposed obligations for member states to renovate public buildings to improve energy efficiency; (iii) the Energy Labelling and Product Standards (Ecodesign Regulation), which introduced the energy efficiency classification (A+++ to G) for household appliances and electronic devices and imposed strict requirements for reducing the energy consumption of electrical equipment; and (iv) the European Green Deal and Fit for 55, which set a target to reduce net greenhouse gas emissions by 55% by 2030 and measures to increase the use of renewable energy and energy efficiency.
Decarbonizing the EU is an ambitious but necessary process to combat climate change. Success will depend on innovation, investment, and collaboration between EU member states, and the future will be shaped by considering the economic, social, and political particularities of each country and the EU as a whole. Countries such as Denmark, Germany, and The Netherlands have made significant progress in the transition to renewable energy, but economies like France are focusing on nuclear energy as a solution to reduce emissions. Some big countries, such as Romania and Poland, still depend on coal but are taking steps towards cleaner sources. The Nordic countries have advanced carbon tax policies and investments in sustainable technologies.
In conclusion, energy consumption in the EU is influenced by economic, technological, and social factors such as the economic and industrial structure, energy mix and sources, energy efficiency, EU policies and regulations, demographic characteristics, and consumer behavior. To reduce energy consumption and support decarbonization, the EU needs to adopt complex measures to create a more integrated and flexible energy system and increase the interconnectivity between member states’ energy networks. Standardizing energy-efficient household appliances and renovating buildings to reduce energy consumption can boost energy efficiency. Developing their energy storage, expanding the infrastructure for electric vehicles, developing Green public transport, and higher taxation of fossil fuels could be appropriate measures for decarbonizing the economy. EU policymakers need to balance energy security, affordability, and sustainability. The success of the transition depends on coherent policies, adequate financing, and collaboration between member states.
This study considers the influence of the determinants on the final energy consumption. In this sense, a series of statistical–econometric analysis methods, such as comparative analysis, dynamics, factorial decomposition, and the study of correlations between variables (Pearson correlation), were used to highlight these influences. Of course, there are many statistical–econometric tools, and other methods can be used to argue these influences, but the authors consider that what is presented in this paper offers a comprehensive picture of how the studied factors influence the final energy consumption at the level of the EU. Thus, this study can be a basis for future research.
The results of this study suggest that specific policies for climate-resilient infrastructure and low-carbon cooling technologies should be promoted to ensure a climate-resilient infrastructure while considering the international experiences registered in Asian and Nordic countries. Singapore is a good example for EU countries because of its strategy of expanding district cooling networks to reduce urban heat and energy demand. Nordic countries are international leaders in heat pump adoption, leveraging renewable energy sources for heating and cooling. This strategy is also spread in Central and Eastern Europe by projects funded by Nordic countries. As global temperatures rise, the energy systems should adapt to increasing cooling demands and changing seasonal energy consumption patterns. So, there is a need for resilient infrastructure to mitigate the energy burden, reduce reliance on fossil fuels, and integrate renewable energy. Low-carbon cooling technologies can be a solution to improve climate change’s impact on the energy transition and decarbonization process. District cooling systems are ideal for dense urban environments and large commercial areas, with the main advantage of reducing energy consumption and peak electricity loads compared to individual cooling units. Heat pumps can be integrated into district energy systems for large-scale deployment, providing heating and cooling and offering a low-carbon alternative to traditional systems. To encourage adoption, policies should focus on specific measures. Financial incentives and subsidies like tax credits, rebates, and grants for energy-efficient cooling solutions can be used to manage the impact of climate change on energy transition. Energy efficiency standards can be promoted by having specific regulations that require buildings to use high-efficiency cooling technologies. Urban Planning Integration should be a solution for mandating district cooling in new developments and retrofitting the existing infrastructure.

Author Contributions

Conceptualization, V.I.; methodology, V.I., M.P., A.S. and Ș.I.; software, V.I., M.P., A.S. and Ș.I.; validation, V.I., M.P., A.S. and Ș.I.; formal analysis, V.I.; M.P., A.S. and Ș.I.; investigation, V.I., M.P., A.S. and Ș.I.; resources, V.I., M.P., A.S. and Ș.I.; data curation, V.I., M.P., A.S. and Ș.I.; writing—original draft preparation, V.I.; writing—review and editing, V.I., M.P., A.S. and Ș.I.; visualization, V.I., M.P., A.S. and Ș.I.; supervision, V.I., M.P., A.S. and Ș.I.; project administration, M.P. All authors have read and agreed to the published version of the manuscript.

Funding

This research received no external funding.

Data Availability Statement

Data will be provided upon request.

Acknowledgments

This research was supported by a grant from the Petroleum-Gas University of Ploiesti, Romania (project numbers GO-GICS-30707/10.12.2024 and GO-GICS-30710/10.12.2024), through the Internal Grant for Scientific Research.

Conflicts of Interest

The authors declare no conflicts of interest.

Abbreviations

The following abbreviations are used in this manuscript:
A₋GVAGross value added, agriculture
ANEAnnual net earnings of a full-time single worker without children earning an average wage
CDDCooling degree days
CEECentral and Eastern Europe
C-GVAGross value added, construction
CLClimate
CO₂Carbon dioxide
DEDemography
EAEconomic activity
EEGIEnergy efficiency governance index
EIEnergy intensity of GDP in purchasing power standards
EVEnergy savings
ESEmployees by economic activities, services
ETEmployees by economic activities, total
EUEuropean Union
FECFinal energy consumption
FEC/capitaFinal energy consumption per capita
FEC₋HFinal energy consumption in households per capita
FEC₋TFinal energy consumption in transport, total
GDPGross domestic product
GVAGross value added, total
HDDHeating degree days
IDAIndex Decomposition Analysis
I₋GVAGross value added, industry
INVInvestments in climate change mitigation, total
INV₋EInvestments in climate change mitigation—electricity, gas, steam, and air conditioning supply
KGOEKilograms of oil equivalent
LMDILogarithmic Mean Divisia Index
LSLifestyle
MDMain driver
M₋GVAGross value added, manufacturing
MtoeMillion tons of oil equivalent
NHNumber of households
ODEXEnergy Efficiency Index
PCRPassenger cars per thousand inhabitants
POPPopulation
PPSPurchasing Power Standard
RSResidual
SDAStructural Decomposition Analysis
STStructure
THCTotal housing costs
toeTons of oil equivalent

References

  1. Papadis, E.; Tsatsaronis, G. Challenges in the decarbonization of the energy sector. Energy 2020, 205, 118025. [Google Scholar] [CrossRef]
  2. Li, K.; Tan, X.; Yan, Y.; Jiang, D.; Qi, S. Directing energy transition toward decarbonization: The China story. Energy 2022, 261, 124934. [Google Scholar] [CrossRef]
  3. International Energy Agency. Energy Efficiency. Available online: https://www.iea.org/energy-system/energy-efficiency-and-demand/energy-efficiency (accessed on 20 January 2025).
  4. Khan, S.A.R.; Panait, M.; Guillen, F.P.; Raimi, L. Energy Transition. Economic, Social and Environmental Dimensions; Springer Nature: Singapore, 2022. [Google Scholar] [CrossRef]
  5. Martini, C.; Toro, C. Special Issue “Industry and Tertiary Sectors towards Clean Energy Transition”. Energies 2022, 15, 4166. [Google Scholar] [CrossRef]
  6. Panait, M.; Apostu, S.A.; Vasile, V.; Vasile, R. Is energy efficiency a robust driver for the new normal development model? A Granger causality analysis. Energy Policy 2022, 169, 113162. [Google Scholar] [CrossRef]
  7. Pereira, F.; Caetano, N.S.; Felgueiras, C. Increasing energy efficiency with a smart farm—An economic evaluation. Energy Rep. 2022, 8, 454–461. [Google Scholar] [CrossRef]
  8. Rosca, C.M.; Ariciu, A.V. Unlocking Customer Sentiment Insights with Azure Sentiment Analysis: A Comprehensive Review and Analysis. Rom. J. Pet. Gas Technol. 2023, IV, 173–182. [Google Scholar] [CrossRef]
  9. Costantini, V.; Morando, V.; Olk, C.; Tausch, L. Fuelling the Fire: Rethinking European Policy in Times of Energy and Climate Crises. Energies 2022, 15, 7781. [Google Scholar] [CrossRef]
  10. Santolamazza, A.; Introna, V.; Cesarotti, V.; Martini, F. The Evolution of Energy Management Maturity in Organizations Subject to Mandatory Energy Audits: Findings from Italy. Energies 2023, 16, 3742. [Google Scholar] [CrossRef]
  11. Popescu, C.; Dissanayake, H.; Mansi, E.; Stancu, A. Eco Breakthroughs: Sustainable Materials Transforming the Future of Our Planet. Sustainability 2024, 16, 10790. [Google Scholar] [CrossRef]
  12. Dobrowolski, Z.; Drozdowski, G.; Panait, M.; Apostu, S.A. The Weighted Average Cost of Capital and Its Universality in Crisis Times: Evidence from the Energy Sector. Energies 2022, 15, 6655. [Google Scholar] [CrossRef]
  13. Panait, M.; Iacob, Ș.; Voica, C.; Iacovoiu, V.; Iov, D.; Mincă, C.; Teodorescu, C. Navigating through the Storm—The Challenges of the Energy Transition in the European Union. Energies 2024, 17, 2874. [Google Scholar] [CrossRef]
  14. European Parliament and of the Council. Directive (EU) 2023/1791 on Energy Efficiency and Amending Regulation (EU) 2023/955. 2023. Available online: https://eur-lex.europa.eu/legal-content/EN/TXT/?uri=OJ:JOL_2023_231_R_0001 (accessed on 18 January 2025).
  15. European Commission. Energy. Available online: https://commission.europa.eu/topics/energy_en (accessed on 19 January 2025).
  16. Clarivate. Report Graphic Derived from Clarivate Web of Science. Available online: https://access.clarivate.com/ (accessed on 19 January 2025).
  17. Popescu, C.; Gabor, M.R.; Stancu, A. Predictors for Green Energy vs. Fossil Fuels: The Case of Industrial Waste and Biogases in European Union Context. Agronomy 2024, 14, 1459. [Google Scholar] [CrossRef]
  18. Dobrowolski, Z.; Drozdowski, G. Does the Net Present Value as a Financial Metric Fit Investment in Green Energy Security? Energies 2022, 15, 353. [Google Scholar] [CrossRef]
  19. Costantini, V.; Martini, C. The causality between energy consumption and economic growth: A multi-sectoral analysis using non-stationary cointegrated panel data. Energy Econ. 2010, 32, 591–603. [Google Scholar] [CrossRef]
  20. Frederiks, E.; Stenner, K.; Hobman, E. The Socio-Demographic and Psychological Predictors of Residential Energy Consumption: A Comprehensive Review. Energies 2015, 8, 573–609. [Google Scholar] [CrossRef]
  21. Meng, Z.; Wang, H.; Wang, B. Empirical Analysis of Carbon Emission Accounting and Influencing Factors of Energy Consumption in China. Int. J. Environ. Res. Public Health 2018, 15, 2467. [Google Scholar] [CrossRef]
  22. Zaharia, A.; Diaconeasa, M.C.; Brad, L.; Lădaru, G.-R.; Ioanăș, C. Factors Influencing Energy Consumption in the Context of Sustainable Development. Sustainability 2019, 11, 4147. [Google Scholar] [CrossRef]
  23. Caruso, G.; Colantonio, E.; Gattone, S.A. Relationships between Renewable Energy Consumption, Social Factors, and Health: A Panel Vector Auto Regression Analysis of a Cluster of 12 EU Countries. Sustainability 2020, 12, 2915. [Google Scholar] [CrossRef]
  24. Toro, C.; Biele, E.; Herce, C.; Martini, C.; Salvio, M.; Threpsiadi, A.; Wilkinson-Dix, J. Overview of Energy Efficiency Policies and Programmes for SMEs in Italy. In Proceedings of the Energy Evaluation Europe 2022 Conference, Paris, France, 28–30 September 2022; pp. 1–5. Available online: https://energy-evaluation.org/wp-content/uploads/2022/10/eee2022-paper-toro.pdf (accessed on 19 January 2025).
  25. Marzouk, O.A. Portrait of the Decarbonization and Renewables Penetration in Oman’s Energy Mix, Motivated by Oman’s National Green Hydrogen Plan. Energies 2024, 17, 4769. [Google Scholar] [CrossRef]
  26. Roșca, C.-M.; Cărbureanu, M. A Comparative Analysis of Sorting Algorithms for Large-Scale Data: Performance Metrics and Language Efficiency. In Emerging Trends and Technologies on Intelligent Systems. Proceedings of the 4th International Conference ETTIS 2024; Lecture Notes in Networks and Systems; Springer: Singapore, 2024; pp. 99–113. [Google Scholar] [CrossRef]
  27. Liu, Y.; Xiao, H.; Lv, Y.; Zhang, N. The effect of new-type urbanization on energy consumption in China: A spatial econometric analysis. J. Clean. Prod. 2017, 163, S299–S305. [Google Scholar] [CrossRef]
  28. Lyu, W.; Li, Y.; Guan, D.; Zhao, H.; Zhang, Q.; Liu, Z. Driving forces of Chinese primary air pollution emissions: An index decomposition analysis. J. Clean. Prod. 2016, 133, 136–144. [Google Scholar] [CrossRef]
  29. Cansino, J.M.; Román, R.; Ordóñez, M. Main drivers of changes in CO2 emissions in the Spanish economy: A structural decomposition analysis. Energy Policy 2016, 89, 150–159. [Google Scholar] [CrossRef]
  30. Chen, G.; Hadjikakou, M.; Wiedmann, T. Urban carbon transformations: Unravelling spatial and inter-sectoral linkages for key city industries based on multi-region input–output analysis. J. Clean. Prod. 2017, 163, 224–240. [Google Scholar] [CrossRef]
  31. Lan, J.; Malik, A.; Lenzen, M.; McBain, D.; Kanemoto, K. A structural decomposition analysis of global energy footprints. Appl. Energy 2016, 163, 436–451. [Google Scholar] [CrossRef]
  32. Rosca, C.M.; Gortoescu, I.A.; Tanase, M.R. Artificial Intelligence—Powered Video Content Generation Tools. Rom. J. Pet. Gas Technol. 2024, V, 131–144. [Google Scholar] [CrossRef]
  33. Ang, B.; Zhang, F.; Choi, K. Factorizing changes in energy and environmental indicators through decomposition. Energy 1998, 23, 489–495. [Google Scholar] [CrossRef]
  34. Ang, B.W. Decomposition analysis for policymaking in energy. Energy Policy 2004, 32, 1131–1139. [Google Scholar] [CrossRef]
  35. Ang, B.W.; Liu, N. Negative-value problems of the logarithmic mean Divisia index decomposition approach. Energy Policy 2007, 35, 739–742. [Google Scholar] [CrossRef]
  36. Ang, B.W.; Liu, N. Handling zero values in the logarithmic mean Divisia index decomposition approach. Energy Policy 2007, 35, 238–246. [Google Scholar] [CrossRef]
  37. Ang, B.W.; Xu, X.Y.; Su, B. Multi-country comparisons of energy performance: The index decomposition analysis approach. Energy Econ. 2015, 47, 68–76. [Google Scholar] [CrossRef]
  38. Cansino, J.M.; Sánchez-Braza, A.; Rodríguez-Arévalo, M.L. Driving forces of Spain׳s CO2 emissions: A LMDI decomposition approach. Renew. Sustain. Energy Rev. 2015, 48, 749–759. [Google Scholar] [CrossRef]
  39. Wang, Q.; Jiang, X.-T.; Yang, X.; Ge, S. Comparative analysis of drivers of energy consumption in China, the USA and India—A perspective from stratified heterogeneity. Sci. Total Environ. 2020, 698, 134117. [Google Scholar] [CrossRef] [PubMed]
  40. Rosca, C.M. Comparative Analysis of Object Classification Algorithms: Traditional Image Processing Versus Artificial Intelligence—Based Approach. Rom. J. Pet. Gas Technol. 2023, IV, 169–180. [Google Scholar] [CrossRef]
  41. Román-Collado, R.; Morales-Carrión, A.V. Towards a sustainable growth in Latin America: A multiregional spatial decomposition analysis of the driving forces behind CO2 emissions changes. Energy Policy 2018, 115, 273–280. [Google Scholar] [CrossRef]
  42. Fernández González, P.; Landajo, M.; Presno, M.J. Multilevel LMDI decomposition of changes in aggregate energy consumption. A cross country analysis in the EU-27. Energy Policy 2014, 68, 576–584. [Google Scholar] [CrossRef]
  43. Shuibul Qarnain, S.; Muthuvel, S.; Bathrinath, S. Modelling of driving factors for energy efficiency in buildings using Best Worst Method. Mater. Today: Proc. 2021, 39, 137–141. [Google Scholar] [CrossRef]
  44. Barrera-Santana, J.; Marrero, G.A.; Ramos-Real, F.J. Income, energy and the role of energy efficiency governance. Energy Econ. 2022, 108, 105882. [Google Scholar] [CrossRef]
  45. Işık, C.; Ongan, S.; Islam, H.; Balsalobre-Lorente, D.; Sharif, A. ECON-ESG factors on energy efficiency: Fostering sustainable development in ECON-growth-paradox countries. Gondwana Res. 2024, 135, 103–115. [Google Scholar] [CrossRef]
  46. Nevskaya, M.A.; Raikhlin, S.M.; Vinogradova, V.V.; Belyaev, V.V.; Khaikin, M.M. A Study of Factors Affecting National Energy Efficiency. Energies 2023, 16, 5170. [Google Scholar] [CrossRef]
  47. European Commission. Synthesis: Energy Efficiency Trends and Policies in the EU. An Analysis Based on the ODYSSEE and MURE Databases. 2015. Available online: https://www.odyssee-mure.eu/publications/archives/synthesis-energy-efficiency-trends-policies.pdf (accessed on 10 January 2025).
  48. Eurostat. Final energy consumption, sdg_07_11. 2025. Available online: https://ec.europa.eu/eurostat/databrowser/product/page/SDG_07_11 (accessed on 28 January 2025).
  49. Sun, J.W. Changes in energy consumption and energy intensity: A complete decomposition model. Energy Econ. 1998, 20, 85–100. [Google Scholar] [CrossRef]
  50. Cabeza, L.F.; Palacios, A.; Serrano, S.; Ürge-Vorsatz, D.; Barreneche, C. Comparison of past projections of global and regional primary and final energy consumption with historical data. Renew. Sustain. Energy Rev. 2018, 82, 681–688. [Google Scholar] [CrossRef]
  51. Mehedintu, A.; Sterpu, M.; Soava, G. Estimation and Forecasts for the Share of Renewable Energy Consumption in Final Energy Consumption by 2020 in the European Union. Sustainability 2018, 10, 1515. [Google Scholar] [CrossRef]
  52. Simionescu, M.; Strielkowski, W.; Tvaronavičienė, M. Renewable Energy in Final Energy Consumption and Income in the EU-28 Countries. Energies 2020, 13, 2280. [Google Scholar] [CrossRef]
  53. Lisaba, E.B.; Lopez, N.S. Using Logarithmic Mean Divisia Index method (LMDI) to estimate drivers to final energy consumption and emissions in ASEAN. In Proceedings of the 11th AUN/SEED-Net Regional Conference on Mechanical and Manufacturing Engineering, Manila, Philippines, 14–15 January 2021; p. 12070. [Google Scholar] [CrossRef]
  54. Eurostat. Energy Intensity, nrg_ind_ei. 2025. Available online: https://ec.europa.eu/eurostat/databrowser/product/page/NRG_IND_EI (accessed on 28 January 2025).
  55. Andrieu, B.; Vidal, O.; Le Boulzec, H.; Delannoy, L.; Verzier, F. Energy Intensity of Final Consumption: The Richer, the Poorer the Efficiency. Environ. Sci. Technol. 2022, 56, 13909–13919. [Google Scholar] [CrossRef]
  56. Liu, F.; Zhang, X.; Adebayo, T.S.; Awosusi, A.A. Asymmetric and moderating role of industrialisation and technological innovation on energy intensity: Evidence from BRICS economies. Renew. Energy 2022, 198, 1364–1372. [Google Scholar] [CrossRef]
  57. Meșter, I.; Simuț, R.; Meșter, L.; Bâc, D. An Investigation of Tourism, Economic Growth, CO2 Emissions, Trade Openness and Energy Intensity Index Nexus: Evidence for the European Union. Energies 2023, 16, 4308. [Google Scholar] [CrossRef]
  58. Sueyoshi, T.; Goto, M. Energy Intensity, Energy Efficiency and Economic Growth among OECD Nations from 2000 to 2019. Energies 2023, 16, 1927. [Google Scholar] [CrossRef]
  59. Eurostat. Gross Value Added and Income by Main Industry (NACE Rev.2), nama_10_a10. 2025. Available online: https://ec.europa.eu/eurostat/databrowser/product/page/NAMA_10_A10 (accessed on 22 January 2025).
  60. International Labour Organization. Indicators and Data Tools. 2025. Available online: https://ilostat.ilo.org/data/# (accessed on 12 January 2025).
  61. International Labour Organization. Employment by Sex, Age and Economic Activity (Thousands)—Annual, EMP_TEMP_SEX_AGE_ECO_NB_A. 2025. Available online: https://rshiny.ilo.org/dataexplorer18/?lang=en&id=EMP_TEMP_SEX_AGE_ECO_NB_A (accessed on 20 January 2025).
  62. Eurostat. Final Energy Consumption in Transport by type of fuel. nrg_bal_c. 2025. Available online: https://ec.europa.eu/eurostat/databrowser/product/page/TEN00126 (accessed on 22 January 2025).
  63. Eurostat. Number of Households by Household Composition, Number of Children and Age of Youngest Child (1 000), lfst_hhnhtych. 2025. Available online: https://ec.europa.eu/eurostat/databrowser/product/page/LFST_HHNHTYCH (accessed on 22 January 2025).
  64. Eurostat. Final Energy Consumption in Households per Capita. demo_gind, nrg_bal_c. 2025. Available online: https://ec.europa.eu/eurostat/databrowser/product/page/SDG_07_20 (accessed on 27 January 2025).
  65. Eurostat. Total Housing Costs in pps, ilc_mded03. 2025. Available online: https://ec.europa.eu/eurostat/databrowser/product/page/ILC_MDED03 (accessed on 27 January 2025).
  66. Eurostat. Passenger Cars-per Thousand Inhabitants. road_eqs_carhab. 2025. Available online: https://ec.europa.eu/eurostat/databrowser/product/page/ROAD_EQS_CARHAB (accessed on 27 January 2025).
  67. Eurostat. Annual Net Earnings of a Full-Time Single Worker Without Children Earning an Average Wage. earn_nt_netft. 2025. Available online: https://ec.europa.eu/eurostat/databrowser/product/page/EARN_NT_NETFT (accessed on 28 January 2025).
  68. Eurostat. Cooling and Heating Degree Days by Country-Annual Data, nrg_chdd_a. 2025. Available online: https://ec.europa.eu/eurostat/databrowser/product/page/NRG_CHDD_A (accessed on 27 January 2025).
  69. Eurostat. Investments in Climate Change Mitigation by NACE Rev. 2 Activity. env_ac_ccminv. 2025. Available online: https://ec.europa.eu/eurostat/databrowser/view/env_ac_ccminv/default/table?lang=en (accessed on 28 January 2025).
  70. Eurostat. Gross Domestic Product (GDP) and Main Components per Capita, nama_10_pc. 2025. Available online: https://ec.europa.eu/eurostat/databrowser/product/page/NAMA_10_PC (accessed on 17 January 2025).
  71. Eurostat. Population on 1 January by Age and Sex. demo_pjan. 2025. Available online: https://ec.europa.eu/eurostat/databrowser/product/page/DEMO_PJAN (accessed on 19 January 2025).
  72. Eurostat. Heating and Cooling Degree Days—Statistics. 2024. Available online: https://ec.europa.eu/eurostat/statistics-explained/SEPDF/cache/92378.pdf (accessed on 19 January 2025).
  73. De Rosa, M.; Bianco, V.; Scarpa, F.; Tagliafico, L.A. Historical trends and current state of heating and cooling degree days in Italy. Energy Convers. Manag. 2015, 90, 323–335. [Google Scholar] [CrossRef]
  74. Larsen, M.A.D.; Petrović, S.; Radoszynski, A.M.; McKenna, R.; Balyk, O. Climate change impacts on trends and extremes in future heating and cooling demands over Europe. Energy Build. 2020, 226, 110397. [Google Scholar] [CrossRef]
  75. Andrade, C.; Mourato, S.; Ramos, J. Heating and Cooling Degree-Days Climate Change Projections for Portugal. Atmosphere 2021, 12, 715. [Google Scholar] [CrossRef]
  76. Pangsy-Kania, S.; Biegańska, J.; Flouros, F.; Sokół, A. Heating and cooling degree-days vs climate change in years 1979–2021. Evidence from the European Union and Norway. Econ. Environ. 2024, 88, 619. [Google Scholar] [CrossRef]
  77. Rosca, C.M. Convergence Catalysts: Exploring the Fusion of Embedded Systems, IoT, and Artificial Intelligence. In Engineering Applications of AI and Swarm Intelligence; Yang, X.-S., Ed.; Springer Nature: Singapore, 2025; pp. 69–87. [Google Scholar] [CrossRef]
  78. Rosca, C.-M. New Algorithm to Prevent Online Test Fraud Based on Cognitive Services and Input Devices Events. In Proceedings of Third Emerging Trends and Technologies on Intelligent Systems. ETTIS 2023, Noida, India, 23–24 February 2023; Lecture Notes in Networks and, Systems; Noor, A., Saroha, K., Pricop, E., Sen, A., Trivedi, G., Eds.; Springer Nature: Singapore, 2023; Volume 730, pp. 207–219. [Google Scholar] [CrossRef]
Figure 1. Factors of decarbonization.
Energies 18 01703 g001
Figure 2. Relationships between SDGs—energy efficiency or energy consumption and decarbonization in the international scientific literature [16].
Energies 18 01703 g002
Figure 3. Number of published articles focusing on energy efficiency or energy consumption and decarbonization between 2001 and 2025 [16].
Energies 18 01703 g003
Figure 4. General topics of articles focused on energy efficiency or energy consumption and decarbonization [16].
Energies 18 01703 g004
Figure 5. Variation in energy intensity, final energy consumption per capita, and GDP in EU countries from 2015 to 2023 [70].
Energies 18 01703 g005
Figure 6. Variation in final energy consumption, final energy consumption per capita, and population in EU countries from 2015 to 2023 [71].
Energies 18 01703 g006
Figure 7. Correlation between FEC (%) and EI (%).
Energies 18 01703 g007
Figure 8. Correlation between FEC (%) and FEC/capita (%).
Energies 18 01703 g008
Figure 9. Factors influencing the variation in final energy consumption in 2023, compared to 2015.
Energies 18 01703 g009
Figure 10. Factors related to final energy consumption growth in Romania in 2023, compared to 2015.
Energies 18 01703 g010
Figure 11. Factors related to final energy consumption reduction in Estonia in 2023, compared to 2015.
Energies 18 01703 g011
Figure 12. Factors related to the decrease in final energy consumption in Germany in 2023, compared to 2015.
Energies 18 01703 g012
Figure 13. GDP/capita in current prices (PPS, EU-27 from 2020) in the EU-27, Romania, Estonia, and Germany [70].
Energies 18 01703 g013
Table 1. Main drivers of final energy consumption [47].
No.EffectsFactors
1Economic activity (EA)
  • Value added in industry and agriculture;
  • Number of employees in services;
  • Traffic of passengers and goods in transport.
2Demography (DE)
  • Number of households
3Structure (ST)
  • Structure of the value added in industry among the various branches;
  • Modal shift in transport.
4Lifestyle (LS)
  • Household equipment ownership;
  • Larger homes.
5Energy savings (EV)
  • Energy efficiency improvements.
6Climate (CL)
  • Effect of different winter severity levels between the two years.
7Residual (RS)
  • Behavioral changes for heating;
  • Change in the valorization of products in industry (ratio of value added to production).
Table 2. Indicators (factors) explaining variation in FEC.
MDIndicatorsAbrev.Source
EA effectGross value added, total, chain-linked volumes, index 2015 = 100GVA[59]
Gross value added, industry, chain-linked volumes, index 2015 = 100I-GVA
Gross value added, manufacturing, chain-linked volumes, index 2015 = 100M-GVA
Gross value added, construction, chain-linked volumes, index 2015 = 100C-GVA
Gross value added, agriculture, chain-linked volumes, index 2015 = 100A-GVA
Employees by economic activities, total (1000)ET[60]
Employees by economic activities, services (1000)ES[61]
Final energy consumption in transport, total (Thousand toe)FEC-T[62]
DE effectNumber of households, total (1000)NH[63]
LS effectFinal energy consumption in households per capita (KGOE)FEC-H[64]
Total housing costs in purchasing power standards (PPSs), ownerTHC[65]
Passenger cars per thousand inhabitants (Number)PCR[66]
Annual net earnings of a full-time single worker without children earning an average wage (PPS)ANE[67]
CL effectHeating degree days (Number)HDD[68]
Cooling degree days (Number)CDD
EV effectInvestments in climate change mitigation, total (Million Euro)INV[69]
Investments in climate change mitigation—electricity, gas, steam, and air conditioning supply (Million Euro)INV-E
Table 3. GDP, EI, FEC, and FEC/capita trends in EU countries from 2015 to 2023.
GroupChangesCountries
GDPEIFECFEC/Capita
IBelgium, Czechia, Denmark, Germany, Estonia, France, The Netherlands, Austria, Slovenia, Slovakia, Finland, Luxembourg, Sweden, Greece, and Italy.
IIBulgaria, Croatia, Latvia, Lithuania, Poland, Romania, Cyprus, and Portugal.
IIIIreland, Spain, and Malta.
IVHungary
Note: stands for increase; stands for decrease.
Table 4. Contributions of the FEC/capita and the population to the variation in FEC (Mtoe).
CountriesΔFECΔFEC (POP)ΔFEC (FEC/Capita)
UE-27−45.6012.74−58.34
Belgium−3.201.50−4.70
Bulgaria0.10−0.740.84
Czechia−0.700.71−1.41
Denmark−0.800.62−1.42
Germany−20.106.05−26.15
Estonia−0.200.11−0.31
Ireland0.701.49−0.79
Greece−0.90−0.69−0.21
Spain0.403.29−2.89
France−15.403.69−19.09
Croatia0.50−0.460.96
Italy−6.60−2.47−4.13
Cyprus0.200.150.05
Latvia0.10−0.200.30
Lithuania0.40−0.110.51
Luxembourg−0.500.64−1.14
Hungary−0.20−0.300.10
Malta0.100.11−0.01
The Netherlands−6.102.63−8.73
Austria−1.701.49−3.19
Poland8.50−2.1610.66
Portugal1.200.250.95
Romania1.50−0.792.29
Slovenia−0.200.18−0.38
Slovakia−0.30−0.03−0.27
Finland−1.500.39−1.89
Sweden−0.902.36−3.26
Table 5. Values of the correlation coefficient.
IndicatorFEC/capita (%)GVA (%)I-GVA (%)M-GVA (%)C-GVA (%)A-GVA (%)FEC-T (%)NH
(%)
FEC-H (%)PCR
(%)
HDD (%)CDD (%)INV
(%)
INV-E (%)ANE (%)THC (%)ES
(%)
ET
(%)
FEC (%)0.80540.75160.39090.34160.43870.24840.7620.1840.63330.3528−0.416−0.055−0.1025−0.22940.33470.09070.23840.3358
GVA (%)--0.62170.5390.53810.4194----------0.5950.6242
FEC/capita (%)--------0.66580.6279-0.1413-0.014--0.62610.0135--
FEC-H (%)----------0.12860.344---0.145--
I-GVA (%)---0.8795--------------
ET (%)----------------0.9613-
Note: The orange color is the level 1 correlation; the blue color is the level 2 correlation; the green color is the level 3 correlation.
Disclaimer/Publisher’s Note: The statements, opinions and data contained in all publications are solely those of the individual author(s) and contributor(s) and not of MDPI and/or the editor(s). MDPI and/or the editor(s) disclaim responsibility for any injury to people or property resulting from any ideas, methods, instructions or products referred to in the content.

