
Analyzing the Carbon Performance Gap and Thermal Energy Performance Gap of School Buildings in Osijek-Baranja County, Croatia


Abstract
1. Introduction
2. Literature Review
2.1. EPG Analysis in Various Types of Buildings
2.2. EPG Analysis in Educational Buildings
2.3. CPG Analysis in Various Buildings
3. Methodology
3.1. Energy Rating of Buildings in Croatia
3.2. Study Area: Osijek-Baranja County, Croatia
3.3. EPC Data Collection
3.4. Actual Data Collection
4. Results and Discussion
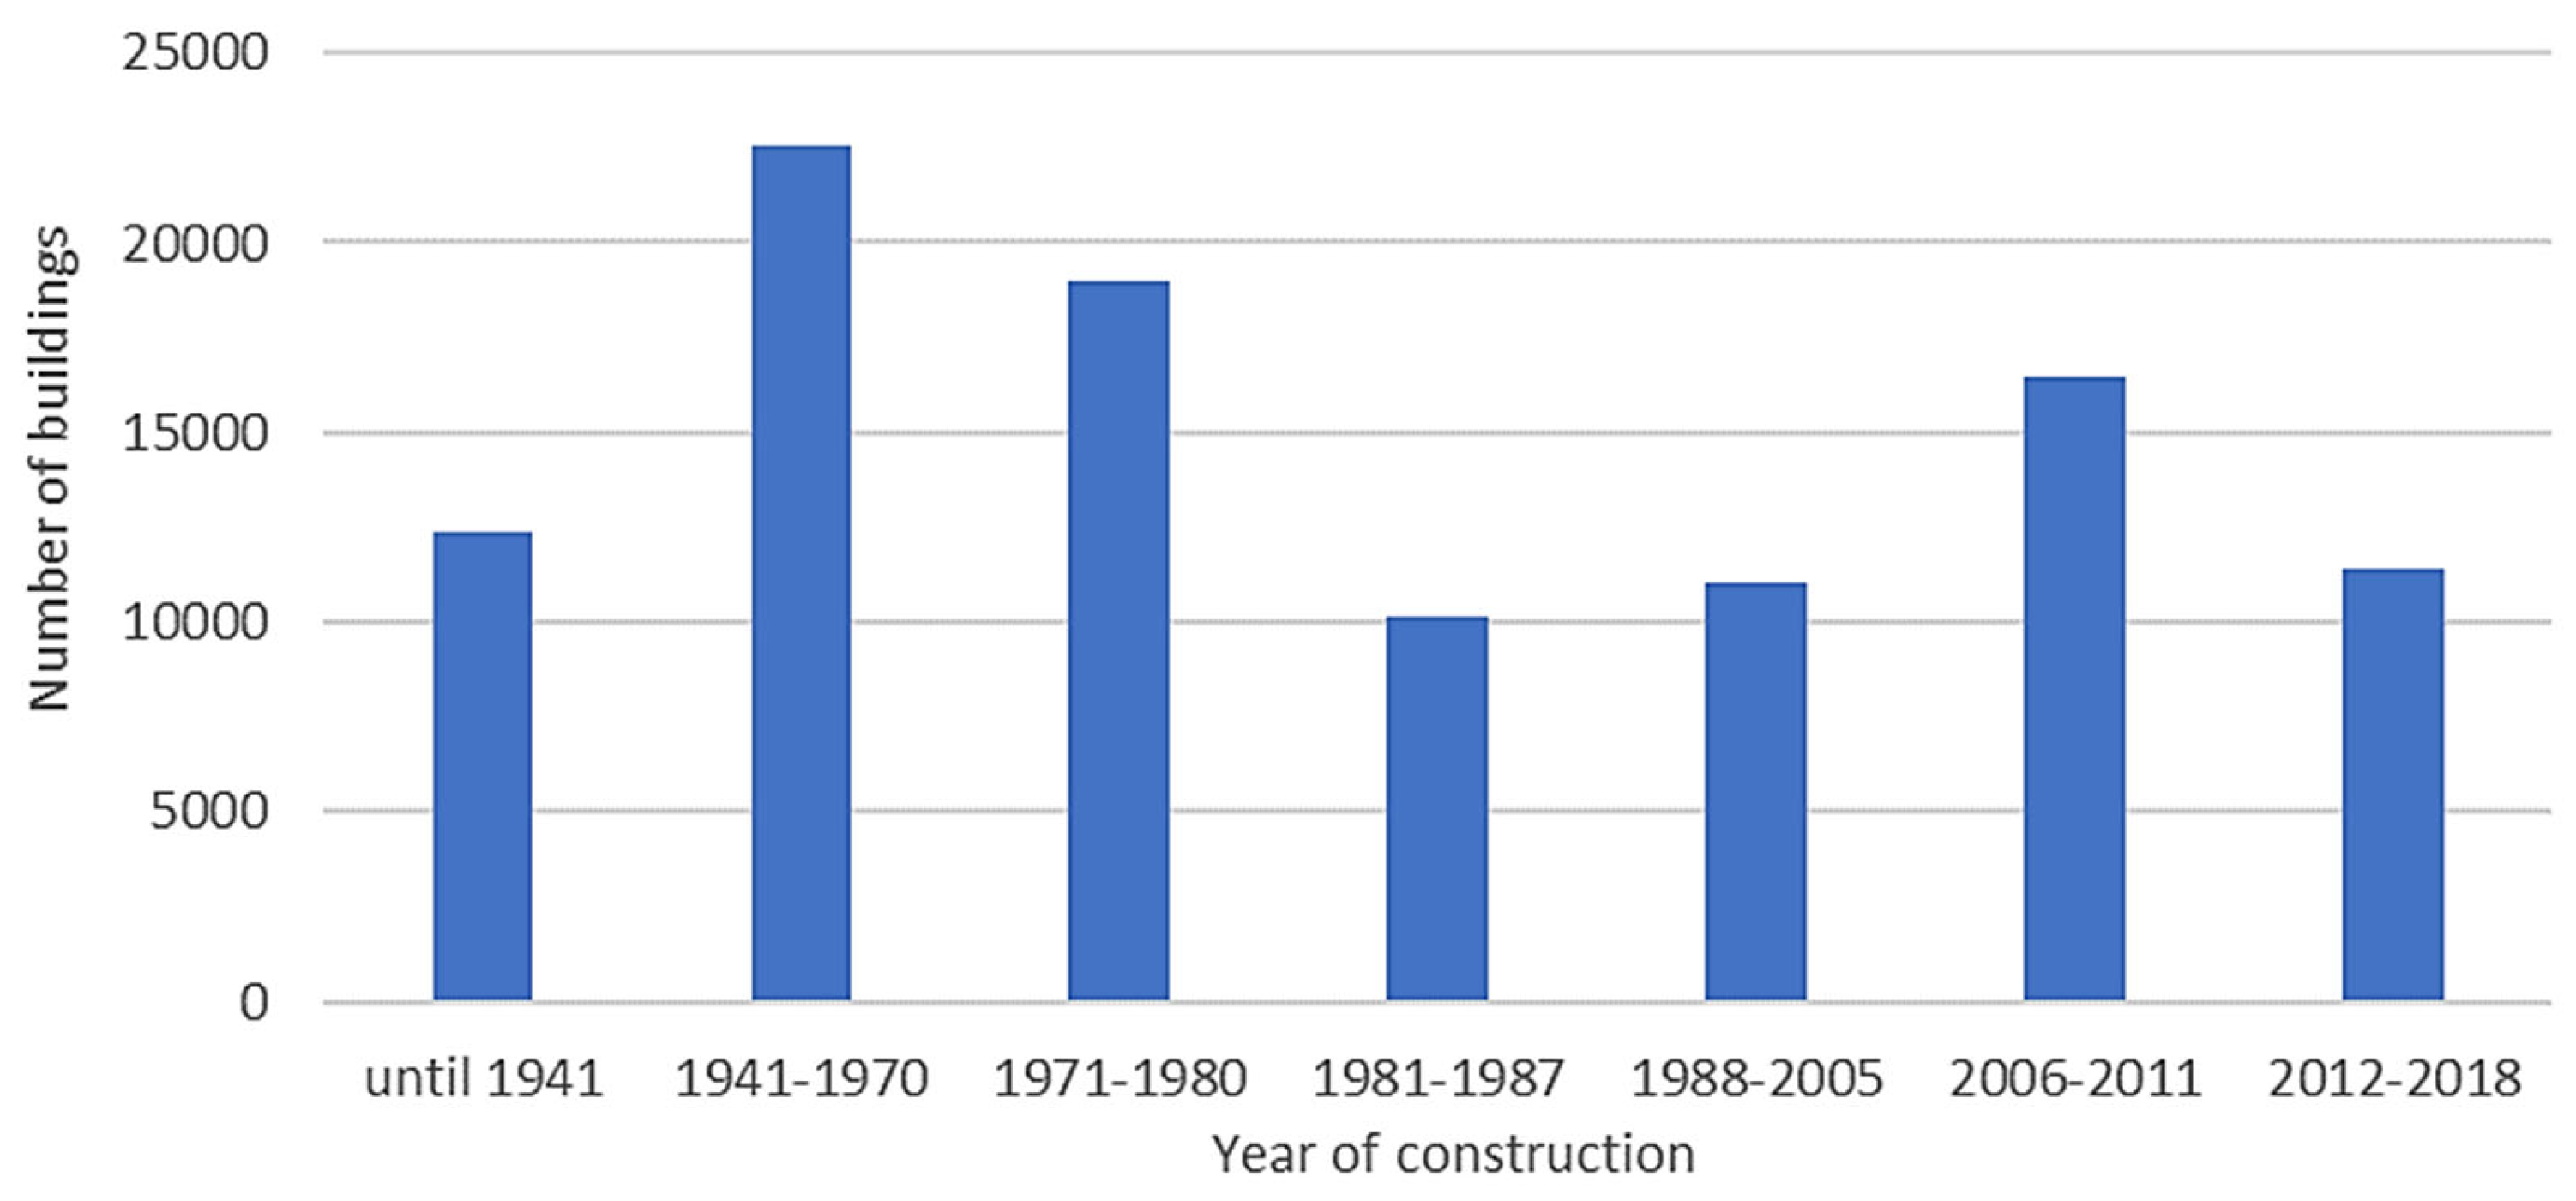
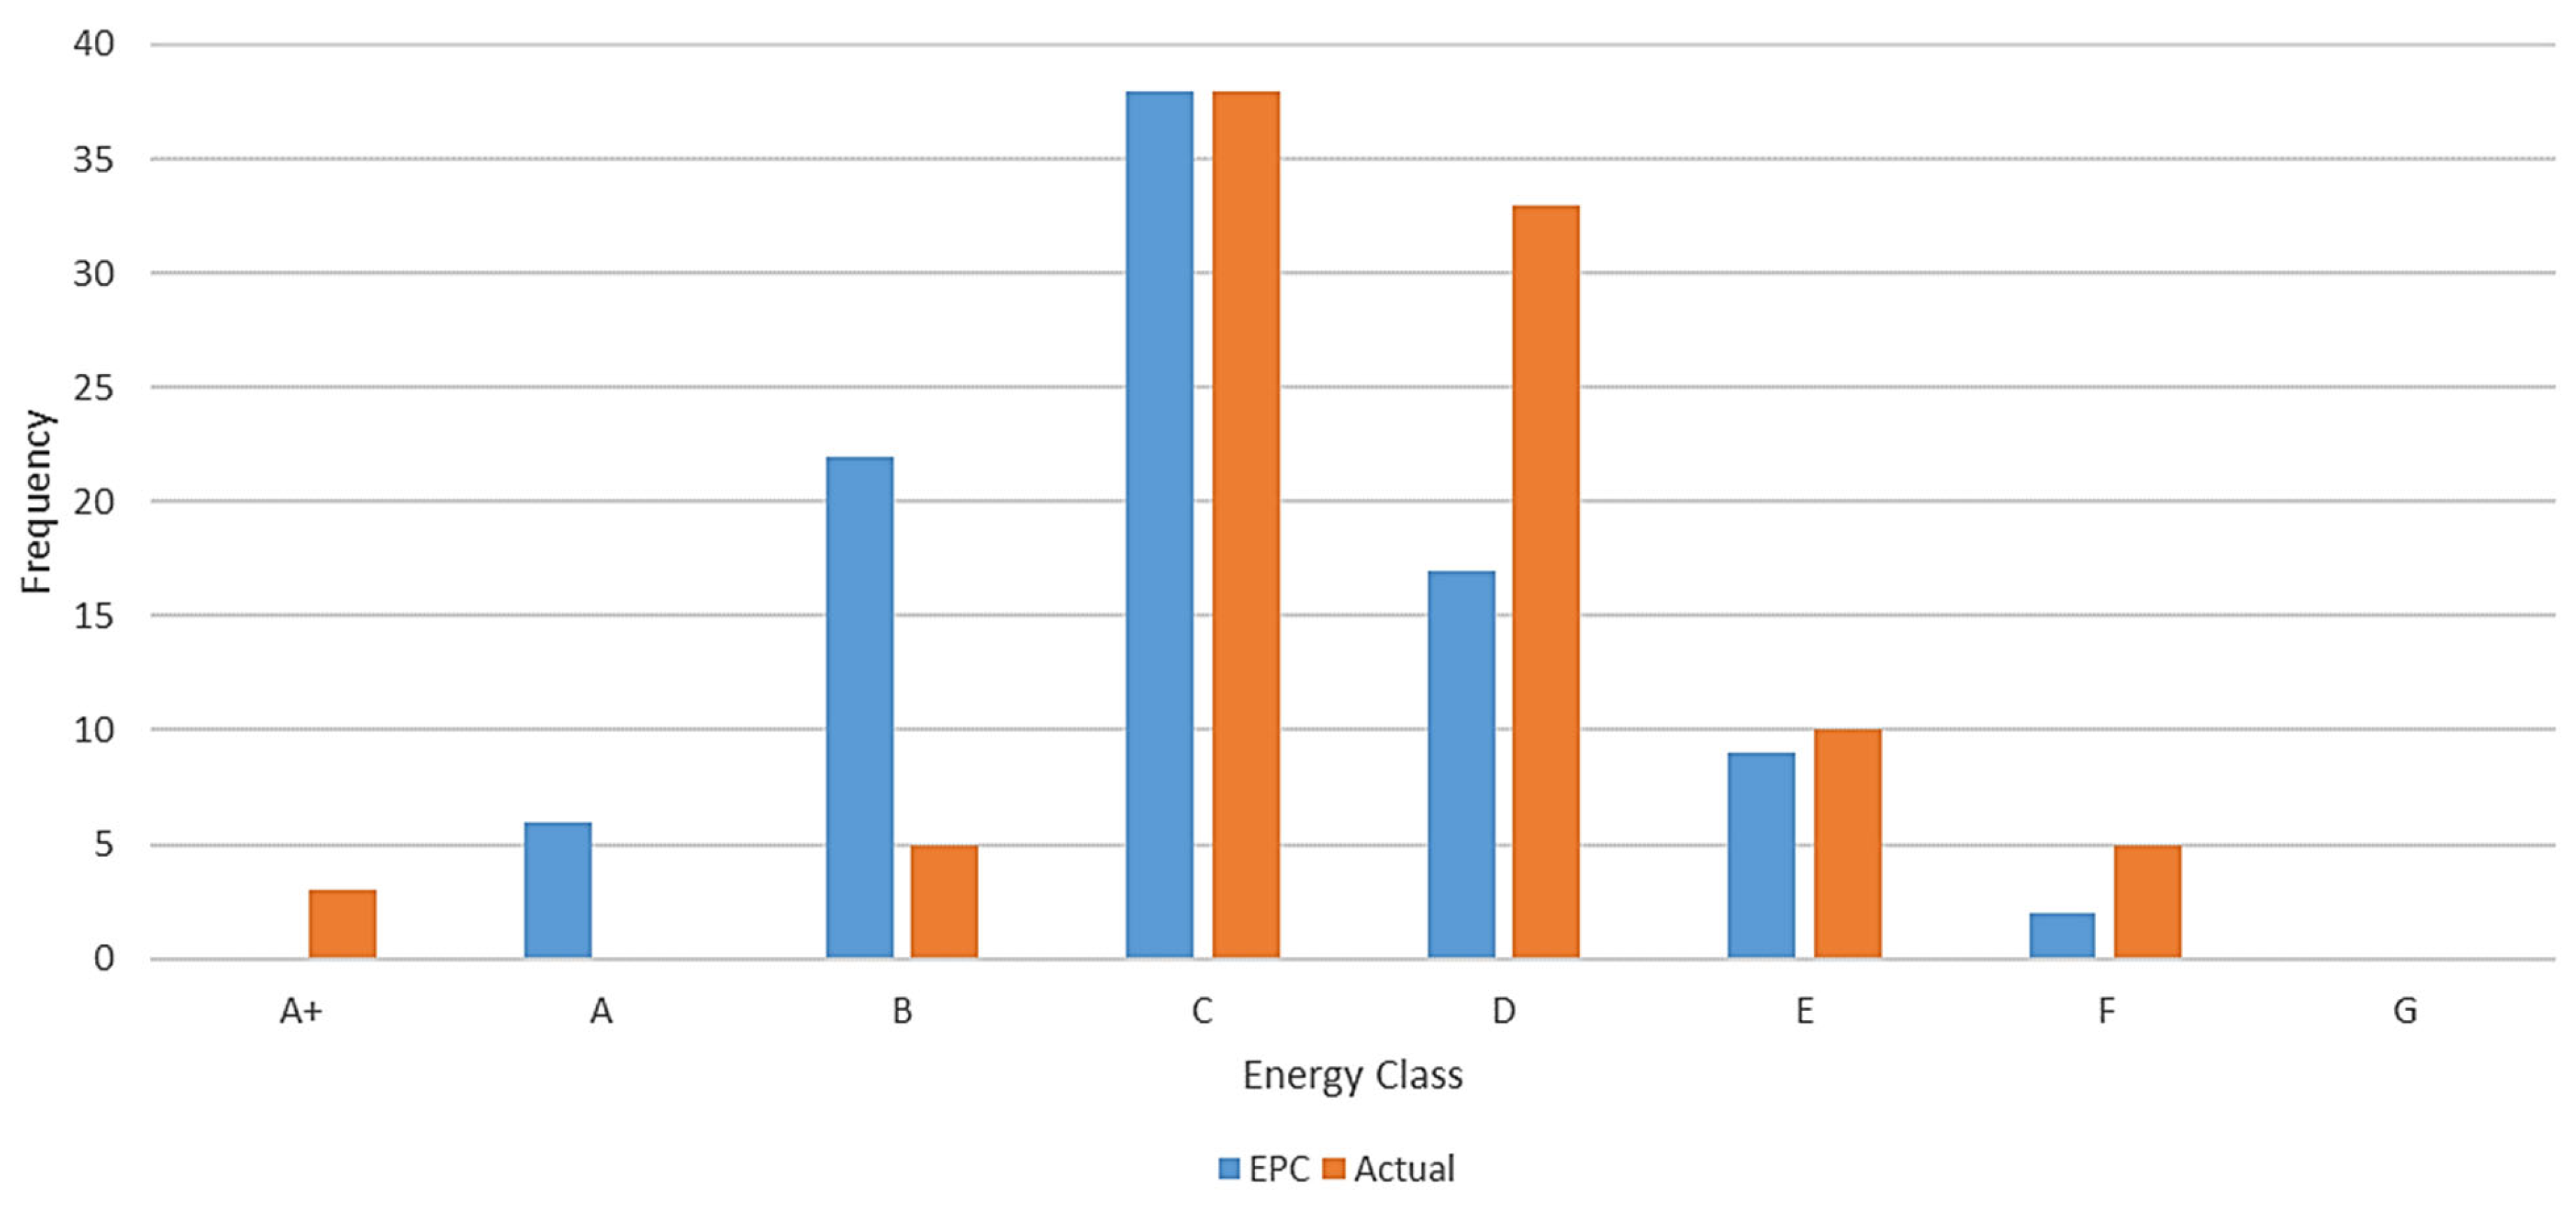
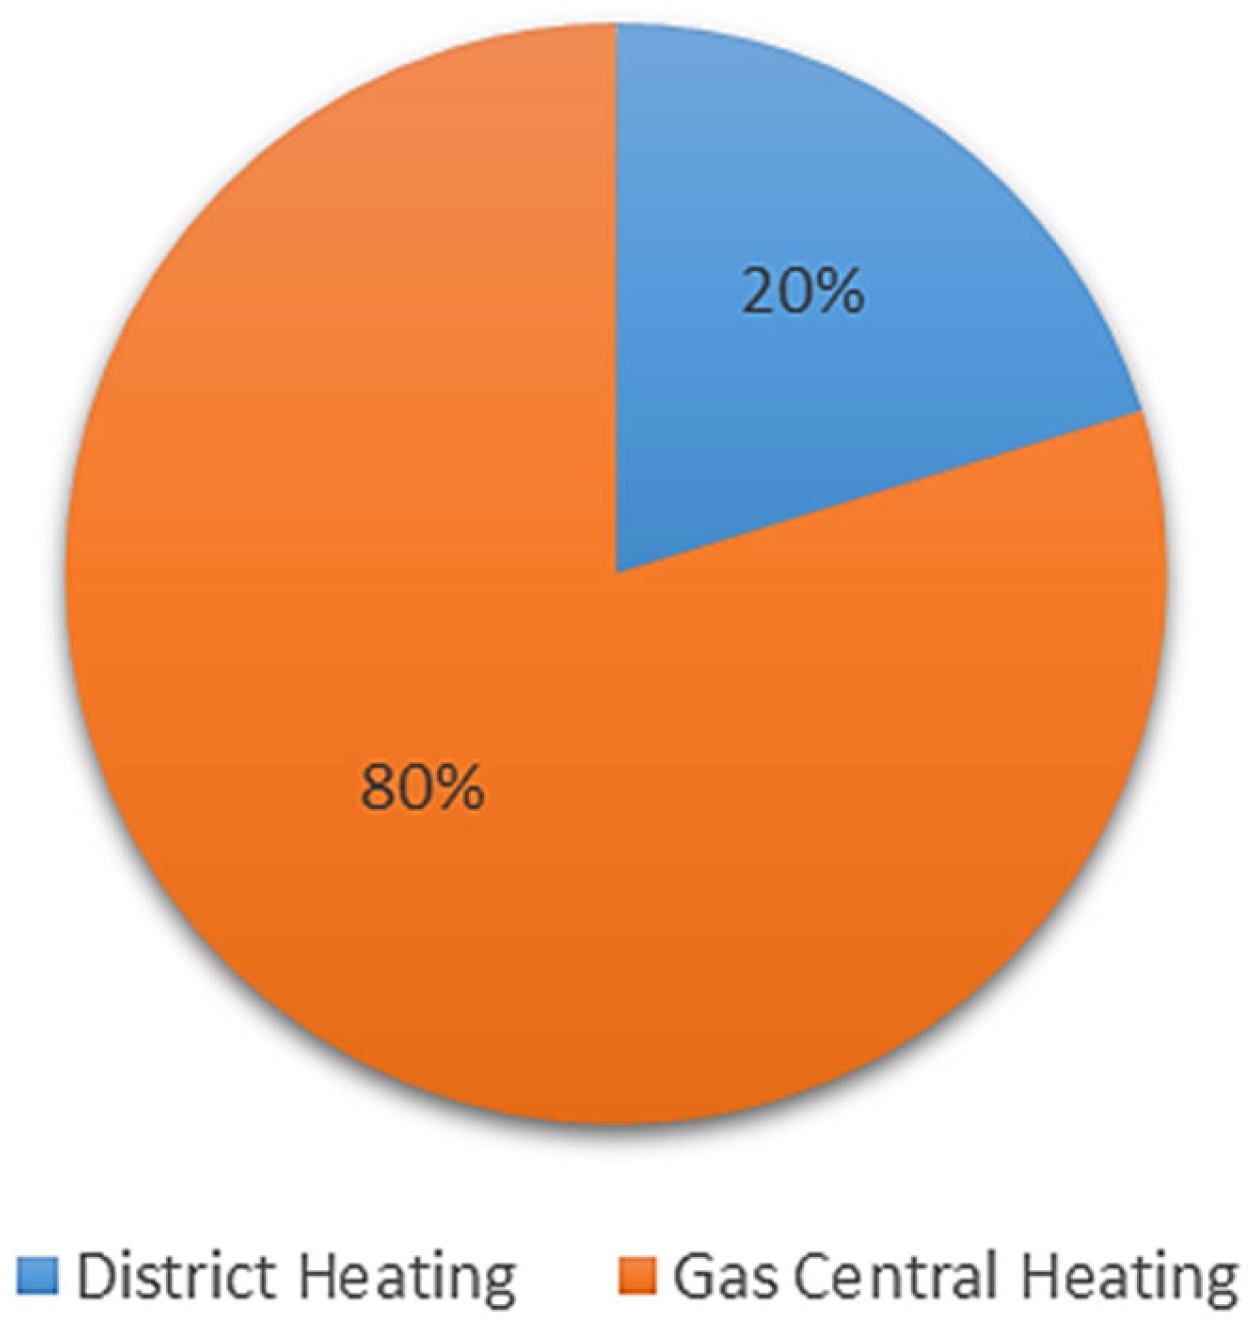
4.1. Descriptive Analysis
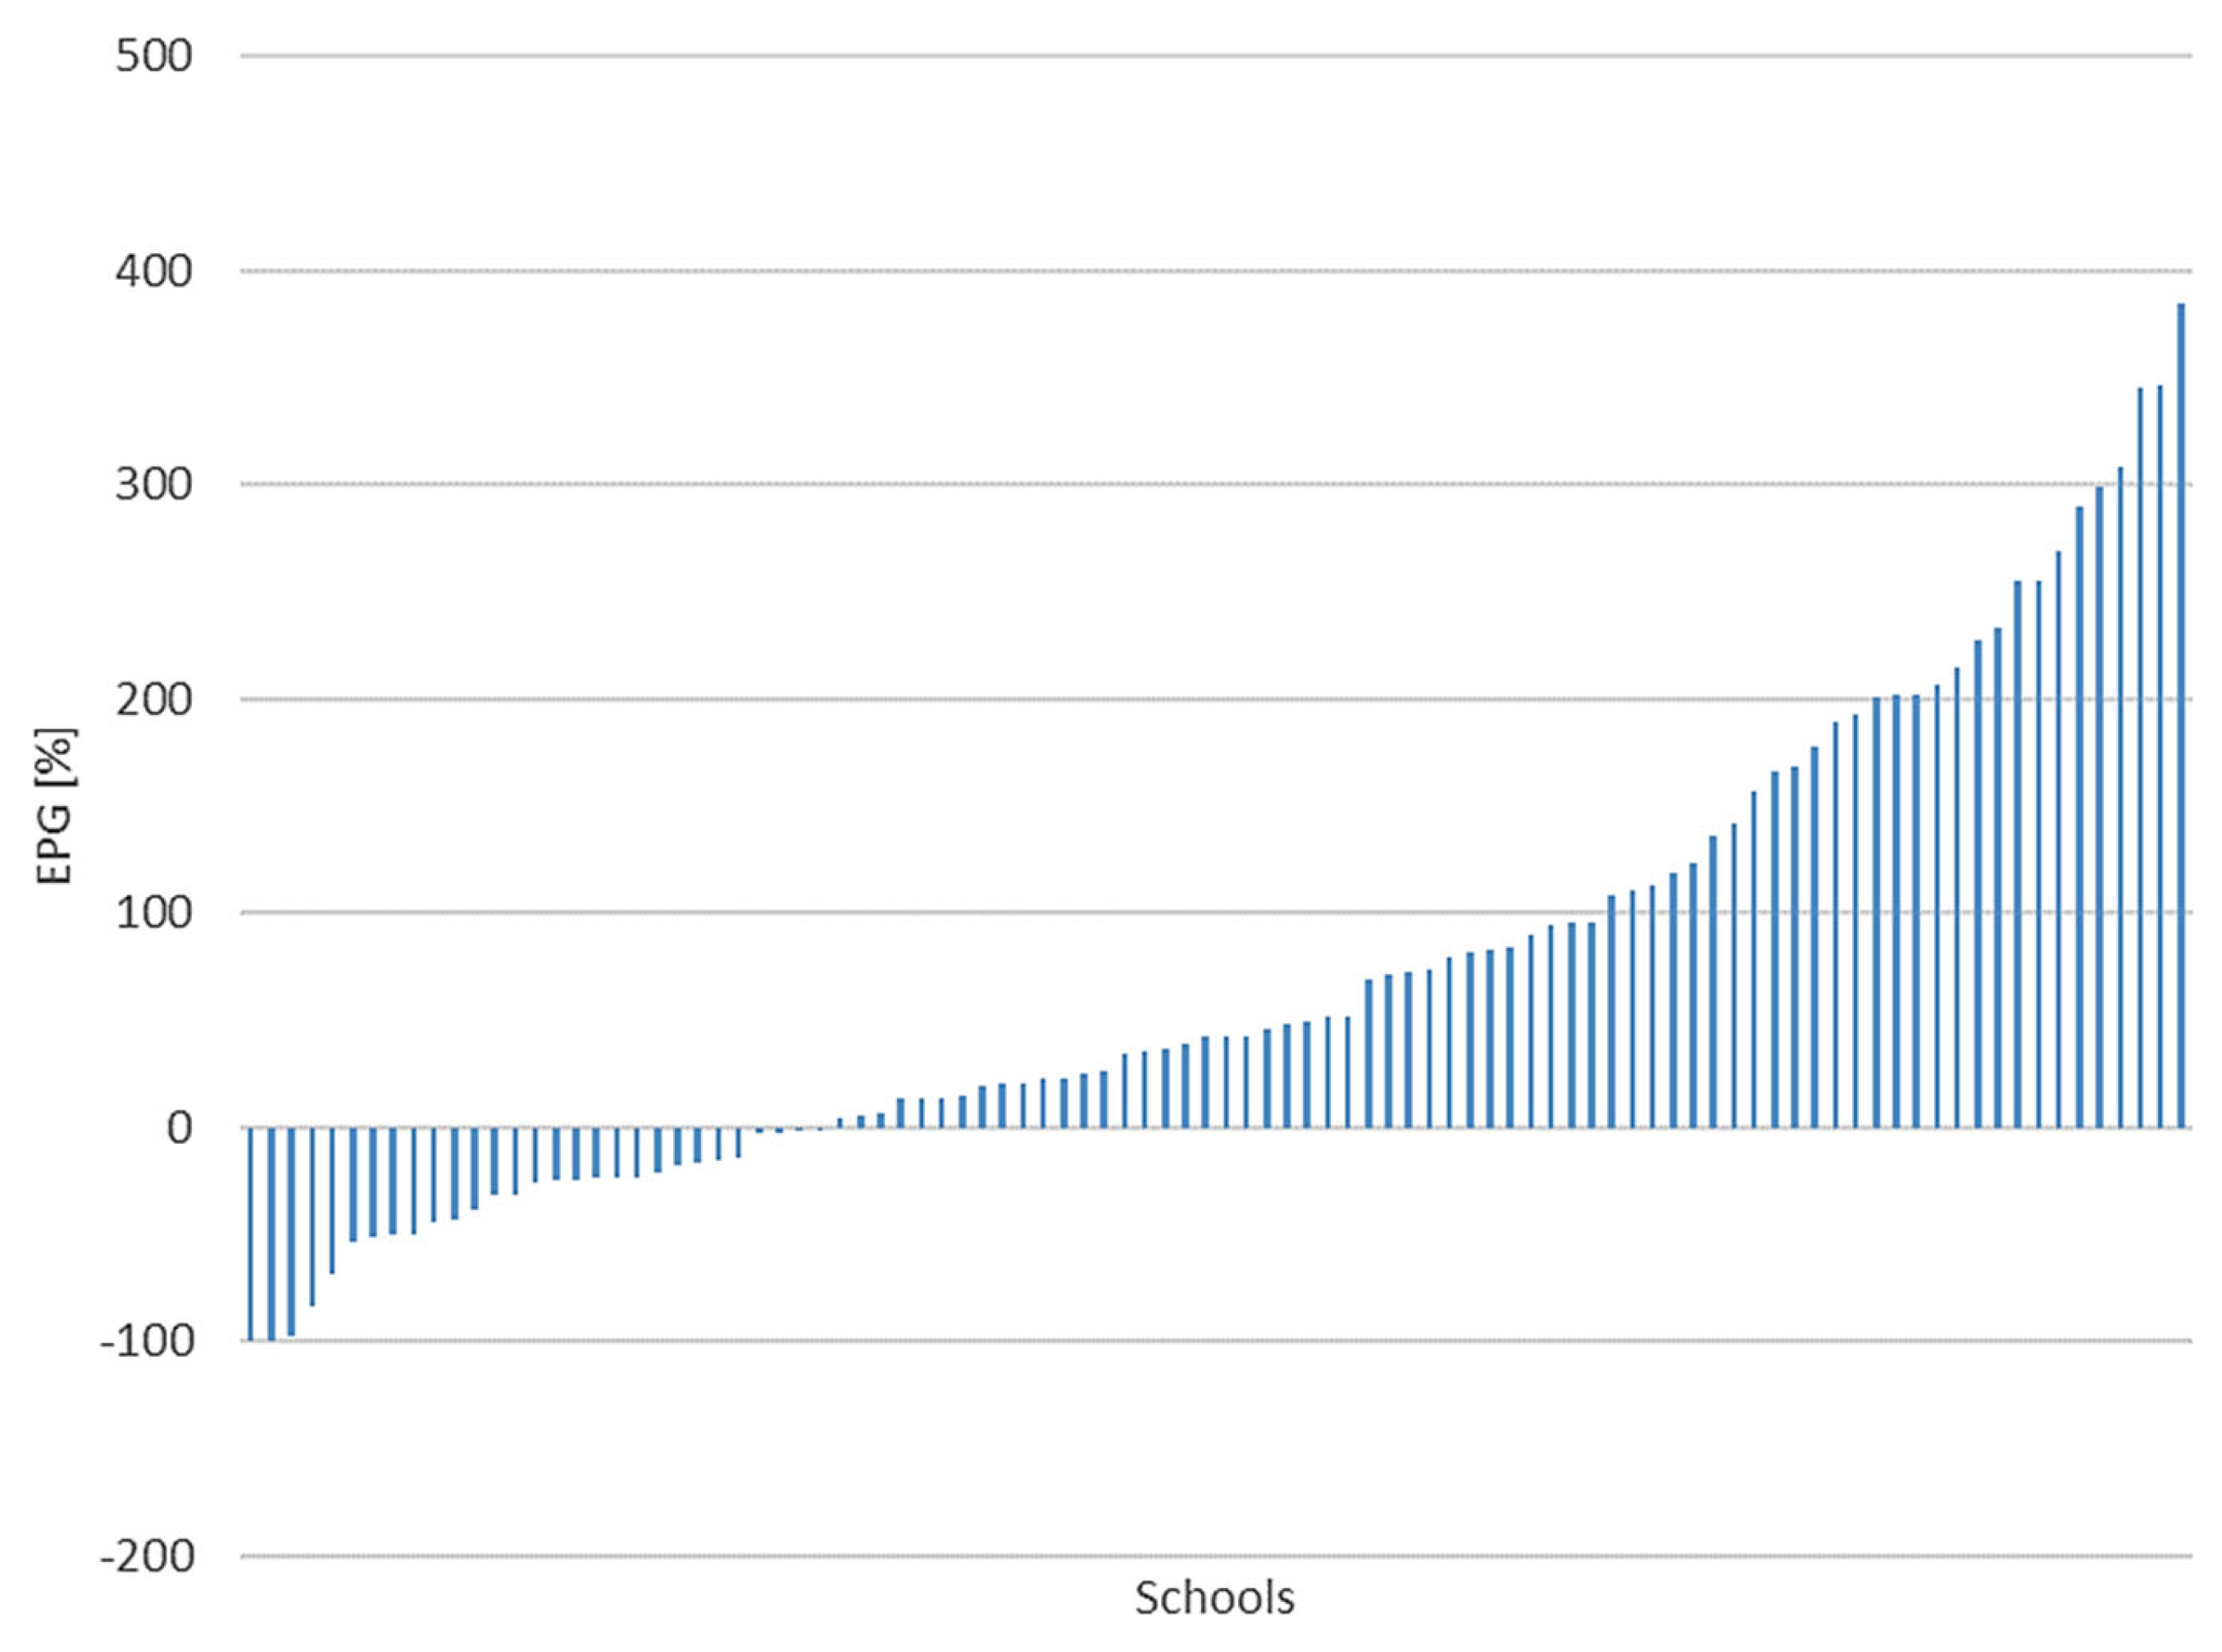
4.2. EPG and CPG Analysis
4.3. Discussion
5. Limitations
6. Conclusions
Author Contributions
Funding
Data Availability Statement
Conflicts of Interest
Abbreviations
| EPG | Energy Performance Gap |
| CPG | Carbon Performance Gap |
| GHG | Greenhouse Gas |
| EU | European Union |
| EPC | Energy Performance Certificate |
| IEC | Information System of Energy Certificates |
| EMIS | Energy Management Information System |
References
- Pérez-Lombard, L.; Ortiz, J.; Pout, C. A review on buildings energy consumption information. Energy Build. 2008, 40, 394–398. [Google Scholar] [CrossRef]
- Alghoul, S.K.; Gwesha, A.O.; Naas, A.M. The effect of electricity price on saving energy transmitted from external building walls. Energy Res. J. 2016, 7, 1–9. [Google Scholar] [CrossRef]
- Cao, X.; Dai, X.; Liu, J. Building energy-consumption status worldwide and the state-of-the-art technologies for zero-energy buildings during the past decade. Energy Build. 2016, 128, 198–213. [Google Scholar] [CrossRef]
- D’Agostino, D.; Cuniberti, B.; Bertoldi, P. Energy consumption and efficiency technology measures in European non-residential buildings. Energy Build. 2017, 153, 72–86. [Google Scholar] [CrossRef]
- Republic of Croatia Ministry of Economy and Sustainable Development Energy in Croatia 2022. Available online: https://mingo.gov.hr/UserDocsImages/slike/Vijesti/2022/Energija%20u%20HR%2022_WEB_%20Velika.pdf (accessed on 15 September 2024).
- Reyna, J.L.; Chester, M.V. The growth of urban building stock: Unintended lock–in and embedded environmental effects. J. Ind. Ecol. 2015, 19, 524–537. [Google Scholar] [CrossRef]
- European Commission. Energy Performance of Buildings Directive. Available online: https://energy.ec.europa.eu/topics/energy-efficiency/energy-efficient-buildings/energy-performance-buildings-directive_en (accessed on 15 September 2024).
- European Commission. Public Buildings. Available online: https://energy.ec.europa.eu/topics/energy-efficiency/energy-efficiency-targets-directive-and-rules/public-buildings_en (accessed on 20 September 2024).
- Ministarstvo Prostornog Uređenja Graditeljstva i Državne Imovine Republike Hrvatske Long-Term Strategy for National Building Stock Renovation by 2050. Available online: https://energy.ec.europa.eu/document/download/b87dca97-b7c1-452e-ae65-fad83be5f80b_en?filename=hr_2020_ltrs_en_version.pdf (accessed on 25 September 2024).
- Geraldi, M.S.; Ghisi, E. Building-level and stock-level in contrast: A literature review of the energy performance of buildings during the operational stage. Energy Build. 2020, 211, 109810. [Google Scholar] [CrossRef]
- Min, J.; Yan, G.; Abed, A.M.; Elattar, S.; Khadimallah, M.A.; Jan, A.; Ali, H.E. The effect of carbon dioxide emissions on the building energy efficiency. Fuel 2022, 326, 124842. [Google Scholar] [CrossRef]
- Omer, A.M. Energy use and environmental impacts: A general review. J. Renew. Sustain. Energy 2009, 1, 053101. [Google Scholar] [CrossRef]
- Lopes, M.A.; Antunes, C.H.; Martins, N. Energy behaviours as promoters of energy efficiency: A 21st century review. Renew. Sustain. Energy Rev. 2012, 16, 4095–4104. [Google Scholar] [CrossRef]
- Williamson, K.; Satre-Meloy, A.; Velasco, K.; Green, K. Climate Change Needs Behavior Change: Making the Case for Behavioral Solutions to Reduce Global Warming; Rare: Arlington, VA, USA, 2018. [Google Scholar]
- Al-Shargabi, A.A.; Almhafdy, A.; Ibrahim, D.M.; Alghieth, M.; Chiclana, F. Buildings’ energy consumption prediction models based on buildings’ characteristics: Research trends, taxonomy, and performance measures. J. Build. Eng. 2022, 54, 104577. [Google Scholar] [CrossRef]
- Yang, L.; Yan, H.; Lam, J.C. Thermal comfort and building energy consumption implications—A review. Appl. Energy 2014, 115, 164–173. [Google Scholar] [CrossRef]
- Službeni list SFRJ br. 35/70. Pravilnik o tehničkim mjerama i uvjetima za toplinsku zaštitu zgrada. 1970.
- Coyne, B.; Denny, E. Mind the energy performance gap: Testing the accuracy of building energy performance certificates in Ireland. Energy Effic. 2021, 14, 57. [Google Scholar] [CrossRef] [PubMed]
- Cozza, S.; Chambers, J.; Deb, C.; Scartezzini, J.-L.; Schlüter, A.; Patel, M.K. Do energy performance certificates allow reliable predictions of actual energy consumption and savings? Learning from the Swiss national database. Energy Build. 2020, 224, 110235. [Google Scholar] [CrossRef]
- Buildings Performance Institute Europe (BPIE) Energy Performance Certificates Across the EU. Available online: https://bpie.eu/wp-content/uploads/2015/10/Energy-Performance-Certificates-EPC-across-the-EU.-A-mapping-of-national-approaches-2014.pdf (accessed on 15 September 2024).
- Ministry of Physical Planning Construction and State Assets Regulations in the Field of Energy Efficiency. Available online: https://mpgi.gov.hr/access-to-information/regulations-126/regulations-in-the-field-of-energy-efficiency-8645/8645 (accessed on 15 September 2024).
- Droutsa, K.G.; Kontoyiannidis, S.; Dascalaki, E.G.; Balaras, C.A. Mapping the energy performance of hellenic residential buildings from EPC (energy performance certificate) data. Energy 2016, 98, 284–295. [Google Scholar] [CrossRef]
- Li, Y.; Kubicki, S.; Guerriero, A.; Rezgui, Y. Review of building energy performance certification schemes towards future improvement. Renew. Sustain. Energy Rev. 2019, 113, 109244. [Google Scholar] [CrossRef]
- Balaras, C.A.; Dascalaki, E.G.; Droutsa, K.G.; Kontoyiannidis, S. Empirical assessment of calculated and actual heating energy use in Hellenic residential buildings. Appl. Energy 2016, 164, 115–132. [Google Scholar] [CrossRef]
- Palladino, D. Energy performance gap of the Italian residential building stock: Parametric energy simulations for theoretical deviation assessment from standard conditions. Appl. Energy 2023, 345, 121365. [Google Scholar] [CrossRef]
- Gupta, R.; Kotopouleas, A. Magnitude and extent of building fabric thermal performance gap in UK low energy housing. Appl. Energy 2018, 222, 673–686. [Google Scholar] [CrossRef]
- Hårsman, B.; Daghbashyan, Z.; Chaudhary, P. On the quality and impact of residential energy performance certificates. Energy Build. 2016, 133, 711–723. [Google Scholar] [CrossRef]
- Mahdavi, A.; Berger, C.; Amin, H.; Ampatzi, E.; Andersen, R.K.; Azar, E.; Barthelmes, V.M.; Favero, M.; Hahn, J.; Khovalyg, D. The role of occupants in buildings’ energy performance gap: Myth or reality? Sustainability 2021, 13, 3146. [Google Scholar] [CrossRef]
- Zheng, Z.; Zhou, J.; Jiaqin, Z.; Yang, Y.; Xu, F.; Liu, H. Review of the building energy performance gap from simulation and building lifecycle perspectives: Magnitude, causes and solutions. Dev. Built Environ. 2024, 17, 100345. [Google Scholar] [CrossRef]
- Hernandez-Cruz, P.; Giraldo-Soto, C.; Escudero-Revilla, C.; Hidalgo-Betanzos, J.M.; Flores-Abascal, I. Energy efficiency and energy performance gap in centralized social housing buildings of the Basque Country. Energy Build. 2023, 298, 113534. [Google Scholar] [CrossRef]
- Cozza, S.; Chambers, J.; Brambilla, A.; Patel, M.K. In search of optimal consumption: A review of causes and solutions to the Energy Performance Gap in residential buildings. Energy Build. 2021, 249, 111253. [Google Scholar] [CrossRef]
- De Wilde, P. The gap between predicted and measured energy performance of buildings: A framework for investigation. Autom. Constr. 2014, 41, 40–49. [Google Scholar] [CrossRef]
- Zou, P.X.; Wagle, D.; Alam, M. Strategies for minimizing building energy performance gaps between the design intend and the reality. Energy Build. 2019, 191, 31–41. [Google Scholar] [CrossRef]
- Menezes, A.C.; Cripps, A.; Bouchlaghem, D.; Buswell, R. Predicted vs. actual energy performance of non-domestic buildings: Using post-occupancy evaluation data to reduce the performance gap. Appl. Energy 2012, 97, 355–364. [Google Scholar] [CrossRef]
- Innovate UK. Building Performance Evaluation Programme Findings from Non-Domestic Projects. 2016. Available online: https://www.ukri.org/wp-content/uploads/2021/12/IUK-061221-NonDomesticBuildingPerformanceFullReport2016.pdf (accessed on 15 September 2024).
- Cozza, S.; Chambers, J.; Patel, M.K. Measuring the thermal energy performance gap of labelled residential buildings in Switzerland. Energy Policy 2020, 137, 111085. [Google Scholar] [CrossRef]
- Vassallo, P. Analysing the” Performance Gap” Between Energy Performance Certificates and Actual Energy Consumption of Non-Residential Buildings in Malta. Ph.D. Thesis, University of Malta, Marsaxlokk, Malta, 2020. [Google Scholar]
- Van Dronkelaar, C.; Dowson, M.; Burman, E.; Spataru, C.; Mumovic, D. A review of the energy performance gap and its underlying causes in non-domestic buildings. Front. Mech. 2016, 1, 17. [Google Scholar] [CrossRef]
- Katić, D.; Krstić, H. Potrošnja toplinske energije školskih zgrada u regiji jug Federacije Bosne i Hercegovine. E-Zb. Elektron. Zb. Rad. Građevinskog Fak. 2022, 12, 20–35. [Google Scholar]
- Balaras, C.; Dascalaki, E.G.; Droutsa, K.G.; Kontoyiannidis, S. Prevazilaženje razlike između stvarne i proračunate energije grejanja modeliranjem fonda stambenih zgrada metodom odozdo naviše (bottom-up). KGH 2017, 46, 59. [Google Scholar] [CrossRef]
- Demanuele, C.; Tweddell, T.; Davies, M. Bridging the Gap Between Predicted and Actual Energy Performance in Schools. In Proceedings of the World Renewable Energy Congress XI, Abu Dhabi, United Arab Emirates, 16 September 2010; Future Technology Press: Abu Dhabi, United Arab Emirates, 2010; pp. 25–30. [Google Scholar]
- Dasgupta, A.; Prodromou, A.; Mumovic, D. Operational versus designed performance of low carbon schools in England: Bridging a credibility gap. HVAC&R Res. 2012, 18, 37–50. [Google Scholar] [CrossRef]
- Jradi, M. Dynamic energy modelling as an alternative approach for reducing performance gaps in retrofitted schools in Denmark. Appl. Sci. 2020, 10, 7862. [Google Scholar] [CrossRef]
- Andaloro, A.P.; Salomone, R.; Ioppolo, G.; Andaloro, L. Energy certification of buildings: A comparative analysis of progress towards implementation in European countries. Energy Policy 2010, 38, 5840–5866. [Google Scholar] [CrossRef]
- Delghust, M.; Roelens, W.; Tanghe, T.; De Weerdt, Y.; Janssens, A. Regulatory energy calculations versus real energy use in high-performance houses. Build. Res. Inf. 2015, 43, 675–690. [Google Scholar] [CrossRef]
- Begić, H. The Difference Between Actual and Calculated Energy Consumption in Public Buildings. Available online: https://dabar.srce.hr/islandora/object/gfos%3A1503 (accessed on 15 October 2024).
- Sunikka-Blank, M.; Galvin, R. Introducing the prebound effect: The gap between performance and actual energy consumption. Build. Res. Inf. 2012, 40, 260–273. [Google Scholar] [CrossRef]
- Galvin, R. Making the ‘rebound effect’more useful for performance evaluation of thermal retrofits of existing homes: Defining the ‘energy savings deficit’ and the ‘energy performance gap’. Energy Build. 2014, 69, 515–524. [Google Scholar] [CrossRef]
- Padey, P.; Goulouti, K.; Wagner, G.; Périsset, B.; Lasvaux, S. Understanding the reasons behind the energy performance gap of an energy-efficient building, through a probabilistic approach and on-site measurements. Energies 2021, 14, 6178. [Google Scholar] [CrossRef]
- Anđelković, A.S.; Kljajić, M.; Macura, D.; Munćan, V.; Mujan, I.; Tomić, M.; Vlaović, Ž.; Stepanov, B. Building energy performance certificate—A relevant indicator of actual energy consumption and savings? Energies 2021, 14, 3455. [Google Scholar] [CrossRef]
- Motuzienė, V.; Lapinskienė, V.; Rynkun, G.; Bielskus, J. Energy performance gap analysis in energy efficient residential buildings in Lithuania. Environ. Climate Technol. 2021, 25, 610–620. [Google Scholar] [CrossRef]
- Kim, Y.K.; Bande, L.; Tabet Aoul, K.A.; Altan, H. Dynamic energy performance gap analysis of a university building: Case studies at UAE university campus, UAE. Sustainability 2020, 13, 120. [Google Scholar] [CrossRef]
- Herrando, M.; Cambra, D.; Navarro, M.; de la Cruz, L.; Millán, G.; Zabalza, I. Energy Performance Certification of Faculty Buildings in Spain: The gap between estimated and real energy consumption. Energy Convers. Manag. 2016, 125, 141–153. [Google Scholar] [CrossRef]
- Ministarstvo Zaštite Okoliša Prostornog Uređenja i Graditeljstva Pravilnik o Energetskom Certificiranju Zgrada (NN 36/2010). Available online: https://narodne-novine.nn.hr/clanci/sluzbeni/2008_10_113_3293.html (accessed on 15 October 2024).
- Ministarstvo Graditeljstva i Prostornog Uređenja Pravilnik o Energetskom Pregledu Zgrade i Energetskom Certificiranju. Available online: https://www.zakon.hr/cms.htm?id=45406 (accessed on 20 October 2024).
- Sveučilište u Zagrebu Fakultet Strojarstva i Brodogradnje Algoritam za Proračun Potrebne Energije za Grijanje i Hlađenje Prostora Zgrade Prema HRN EN ISO 13790. Available online: https://mpgi.gov.hr/UserDocsImages/dokumenti/EnergetskaUcinkovitost/Propisi/2017/Algoritam-HRN-EN-ISO-13790.pdf (accessed on 26 March 2025).
- Knauf Insulation. KI EXPERT PLUS. Available online: https://www.knaufinsulation.hr/en/node/416 (accessed on 26 March 2025).
- Thorium Thorium A+. Available online: http://thoriumaplus.com/ (accessed on 26 March 2025).
- MGIPu Računalni Program za Određivanje Energetskog Svojstva Zgrade. Available online: https://mpgi.gov.hr/o-ministarstvu/djelokrug/energetsko-certificiranje-zgrada-8304/racunalni-program-za-odredjivanje-energetskog-svojstva-zgrade-8359/8359 (accessed on 26 March 2025).
- Mgipu Tablični Prikazi Meteoroloških Veličina, Položaja i Visina za Referentne Postaje. Available online: https://narodne-novine.nn.hr/clanci/sluzbeni/dodatni/377664.pdf (accessed on 26 March 2025).
- MGIPU Faktori Primarne Energije i Emisija CO2. Available online: https://mpgi.gov.hr/UserDocsImages/dokumenti/EnergetskaUcinkovitost/meteoroloski_podaci/FAKTORI_primarne_energije.pdf (accessed on 26 March 2025).
- Ministry of Physical Planning Construction and State Assets Information System of Energy Certificates (IEC). Available online: https://eenergetskicertifikat.mpgi.hr/login.html (accessed on 26 March 2025).
- Ministry of Physical Planning Construction and State Assets Ministry of Physical Planning, Construction and State Assets. Available online: https://mpgi.gov.hr/en (accessed on 26 March 2025).
- Ministarstvo Graditeljstva i Prostornoga Uređenja Pravilnik o Sustavnom Gospodarenju Energijom u Javnom Sektoru (NN 18/2015). Available online: https://narodne-novine.nn.hr/clanci/sluzbeni/2015_02_18_389.html (accessed on 26 March 2025).
- Agencija za Pravni Promet i Posredovanje Nekretninama Informacijski Sustav za Gospodarenje Energijom—ISGE. Available online: https://apn.hr/gospodarenje-energijom-isge/informacijski-sustav-za-gospodarenje-energijom (accessed on 26 March 2025).
- Cloud Software Group Inc. TIBCO Statistica® 14.1.0. Available online: https://docs.tibco.com/products/tibco-statistica-14-1-0 (accessed on 26 March 2025).
- Microsoft Microsoft Excel. Available online: https://www.microsoft.com/en-us/microsoft-365/excel (accessed on 26 March 2025).
- HEP Plin, d.o.o. Gas Prices. Available online: https://www.hep.hr/plin/cijene-plina-i-usluga/cijene-plina/1605 (accessed on 26 March 2025).
- HEP-TOPLINARSTVO, d.o.o. Prices—Central Heating System—Osijek. Available online: https://www.hep.hr/toplinarstvo/UserDocsImages/dokumenti/krajnji-kupci/cijene/Prilog3_CJENIK_CTS_OSIJEK.PDF (accessed on 26 March 2025).
- Teni, M.; Krstić, H.; Kosiński, P. Review and comparison of current experimental approaches for in-situ measurements of building walls thermal transmittance. Energy Build. 2019, 203, 109417. [Google Scholar] [CrossRef]
- Majcen, D.; Itard, L.; Visscher, H. Theoretical vs. actual energy consumption of labelled dwellings in The Netherlands: Discrepancies and policy implications. Energy Policy 2013, 54, 125–136. [Google Scholar] [CrossRef]
- Majcen, D.; Itard, L.; Visscher, H. Actual and theoretical gas consumption in Dutch dwellings: What causes the differences? Energy Policy 2013, 61, 460–471. [Google Scholar] [CrossRef]
- Evangelisti, L.; Guattari, C.; Gori, P.; De Lieto Vollaro, R. In situ thermal transmittance measurements for investigating differences between wall models and actual building performance. Sustainability 2015, 7, 10388–10398. [Google Scholar] [CrossRef]
- van den Brom, P.; Meijer, A.; Visscher, H. Performance gaps in energy consumption: Household groups and building characteristics. Build. Res. Inf. 2018, 46, 54–70. [Google Scholar] [CrossRef]
- European Council. Directive (EU) 2024/1275 of the European Parliament and of the Council. 2024. Available online: https://eur-lex.europa.eu/legal-content/EN/TXT/PDF/?uri=CELEX:32024L1275 (accessed on 26 March 2025).


| Study | Building Type | Location | EPG/CPG Range | Key Findings |
|---|---|---|---|---|
| Palladino [25] | Residential | Italy | Prebound: 0% to +80%; Rebound: −30% to 0% | EPG varies by climate zone, insulation, and consumption profile. |
| Hernandez-Cruz et al. [30] | Residential | Spain | 0.70 to 2.28 times higher than the calculated consumption | Large variation in energy consumption across identical buildings. |
| Padey et al. [49] | Energy-Efficient | Switzerland | 20–30% | EPG exists even in highly efficient buildings. |
| Coyne & Denny [18] | Residential | Various | +39% (most efficient homes); −24% to −56% (less efficient homes) | EPCs have little effect on actual energy consumption. |
| Anđelković et al. [50] | District/Gas Heating Buildings | Serbia | Significant disparity (Gas heating has a higher gap) | EPC underestimated actual consumption, more so in gas-heated buildings. |
| Motuziene et al. [51] | High-Energy Performance | Lithuania | −101% to +77% (Class A); +18% to 76% (A+); +23% to 77% (A++) | EPG higher in high-energy performance buildings. |
| Cozza et al. [36] | Residential | Switzerland | Median: −11%; Class B: +12.4%; Class G: −40.4% | Low-rated buildings consume less, high-rated consume slightly more. |
| Kim et al. [52] | Educational | UAE | 25% cooling energy wasted | Systems mismanagement caused high consumption. |
| Van Dronkelaar et al. [38] | Educational (schools and universities) | United Kingdom | 67% | EPG consistent across schools and universities. |
| Herrando et al. [53] | Faculty Buildings | Spain | +30% | Actual energy use exceeded EPC predictions. |
| Innovate UK [35] | Public Buildings | UK | CPG: 3.8 times higher than design estimates | Large carbon emission discrepancies. |
| Energy Class | Q″H,nd—Specific Annual Required Thermal Energy for Heating [kWh/m2·a] |
|---|---|
| A+ | ≤15 |
| A | ≤25 |
| B | ≤50 |
| C | ≤100 |
| D | ≤150 |
| E | ≤200 |
| F | ≤250 |
| G | >250 |
| Variable | N | Mean | Median | Min. | Max. | Lower Quartile | Upper Quartile |
|---|---|---|---|---|---|---|---|
| EPC Q″H,nd [kWh/m2·a] | 94 | 82.06 | 67.13 | 17.00 | 238.00 | 39.00 | 116.06 |
| Actual Q″H,nd [kWh/m2·a] | 94 | 105.52 | 102.02 | 0.46 | 239.79 | 75.36 | 136.70 |
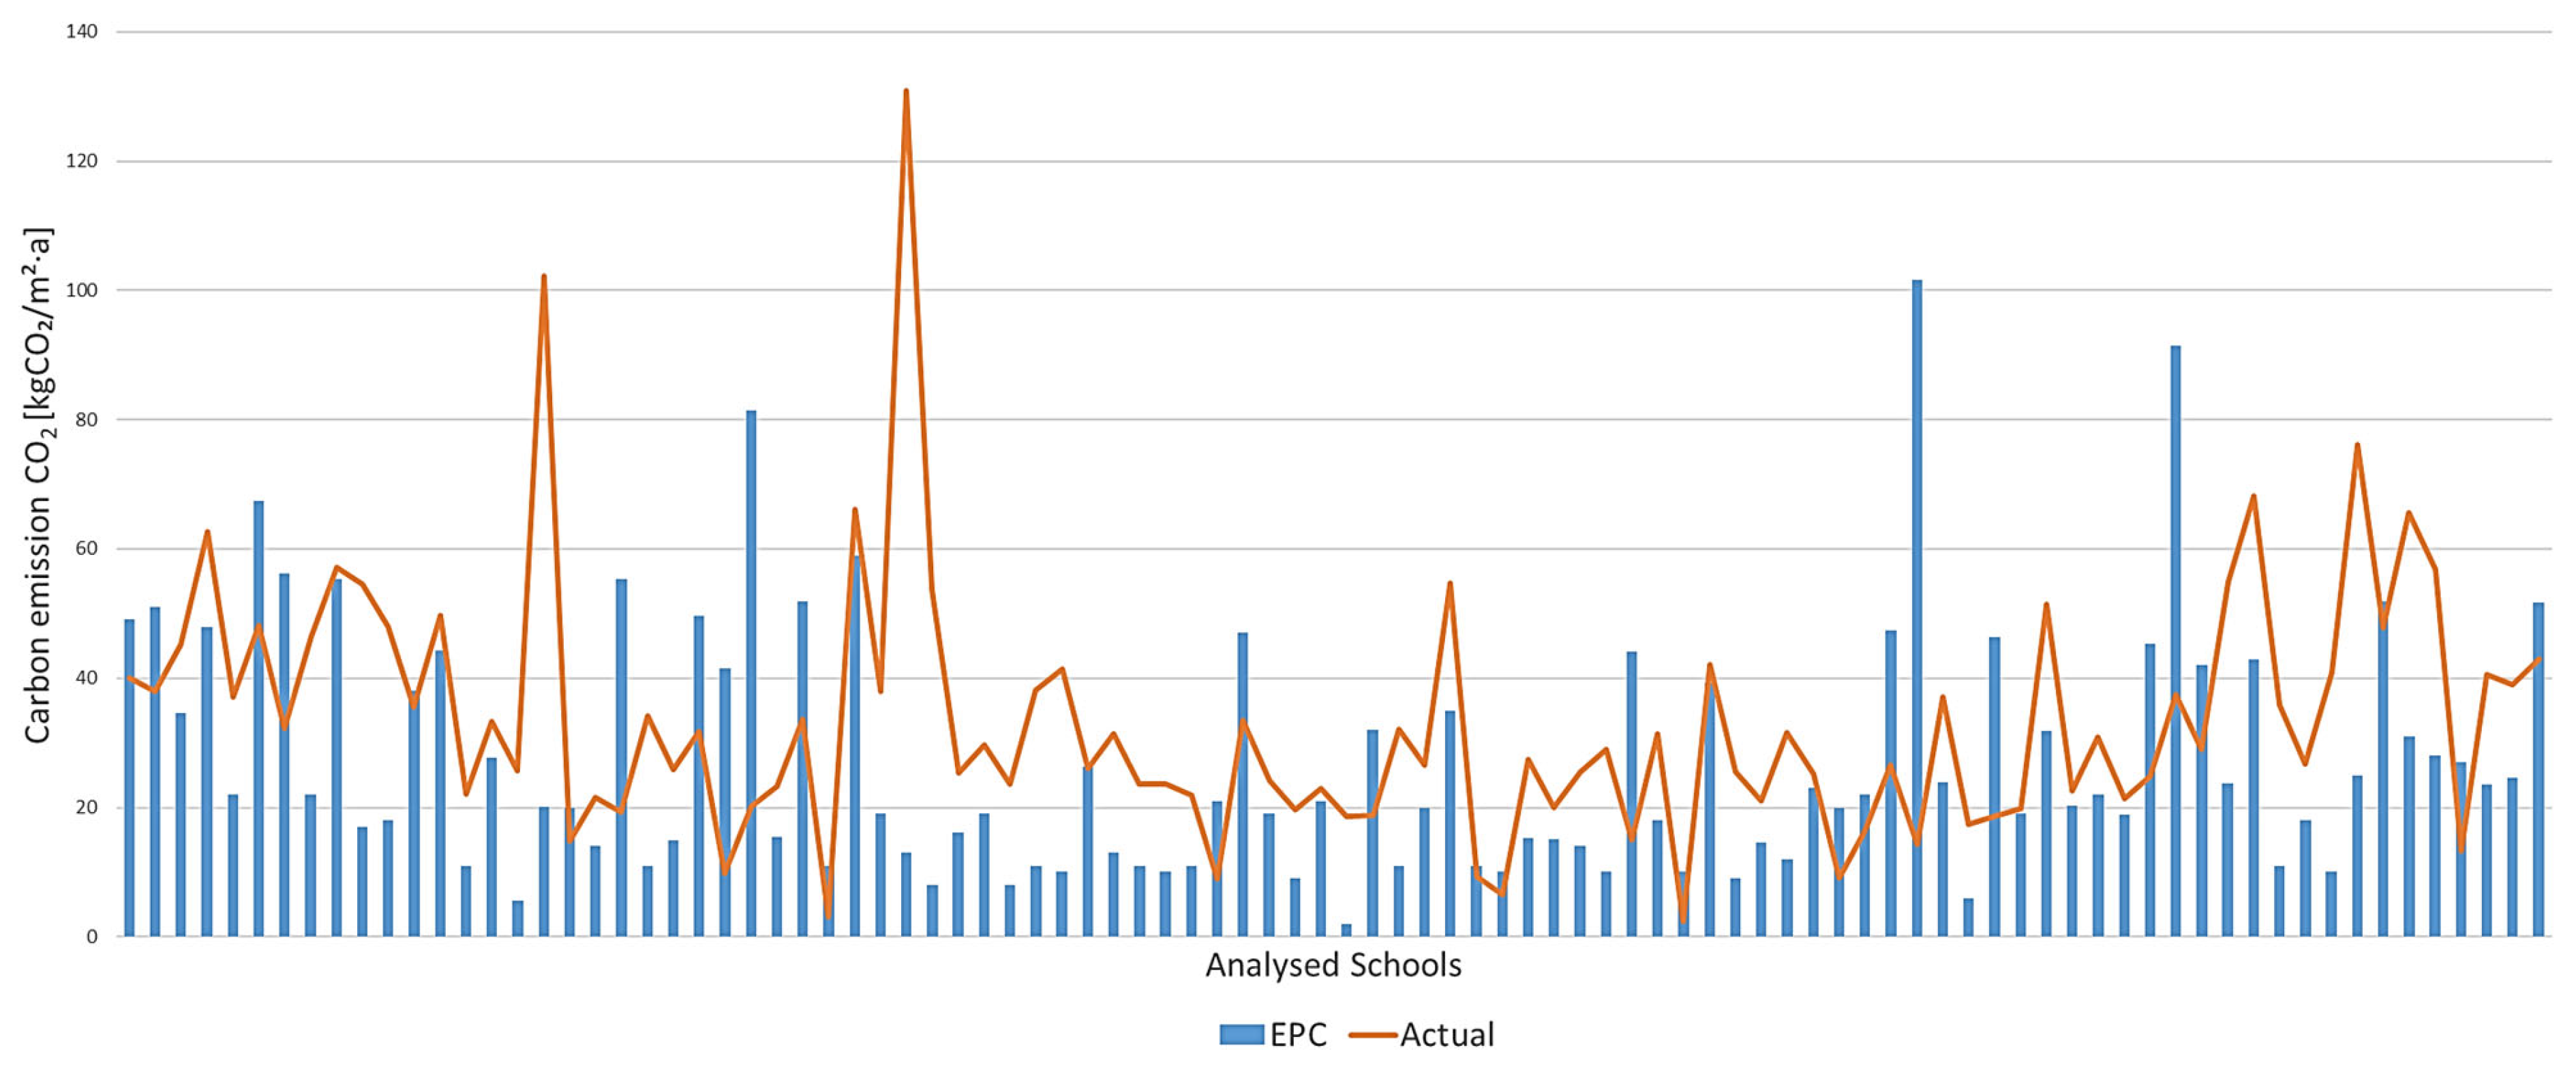
| EPC CO2 [kgCO2/m2·a] | 84 | 27.50 | 20.13 | 2.00 | 101.53 | 13.50 | 40.35 |
| Actual CO2 [kgCO2/m2·a] | 84 | 33.09 | 28.20 | 2.46 | 130.83 | 21.48 | 40.77 |
| Variable | N | Mean | Median | Min. | Max. | Lower Quartile | Upper Quartile |
|---|---|---|---|---|---|---|---|
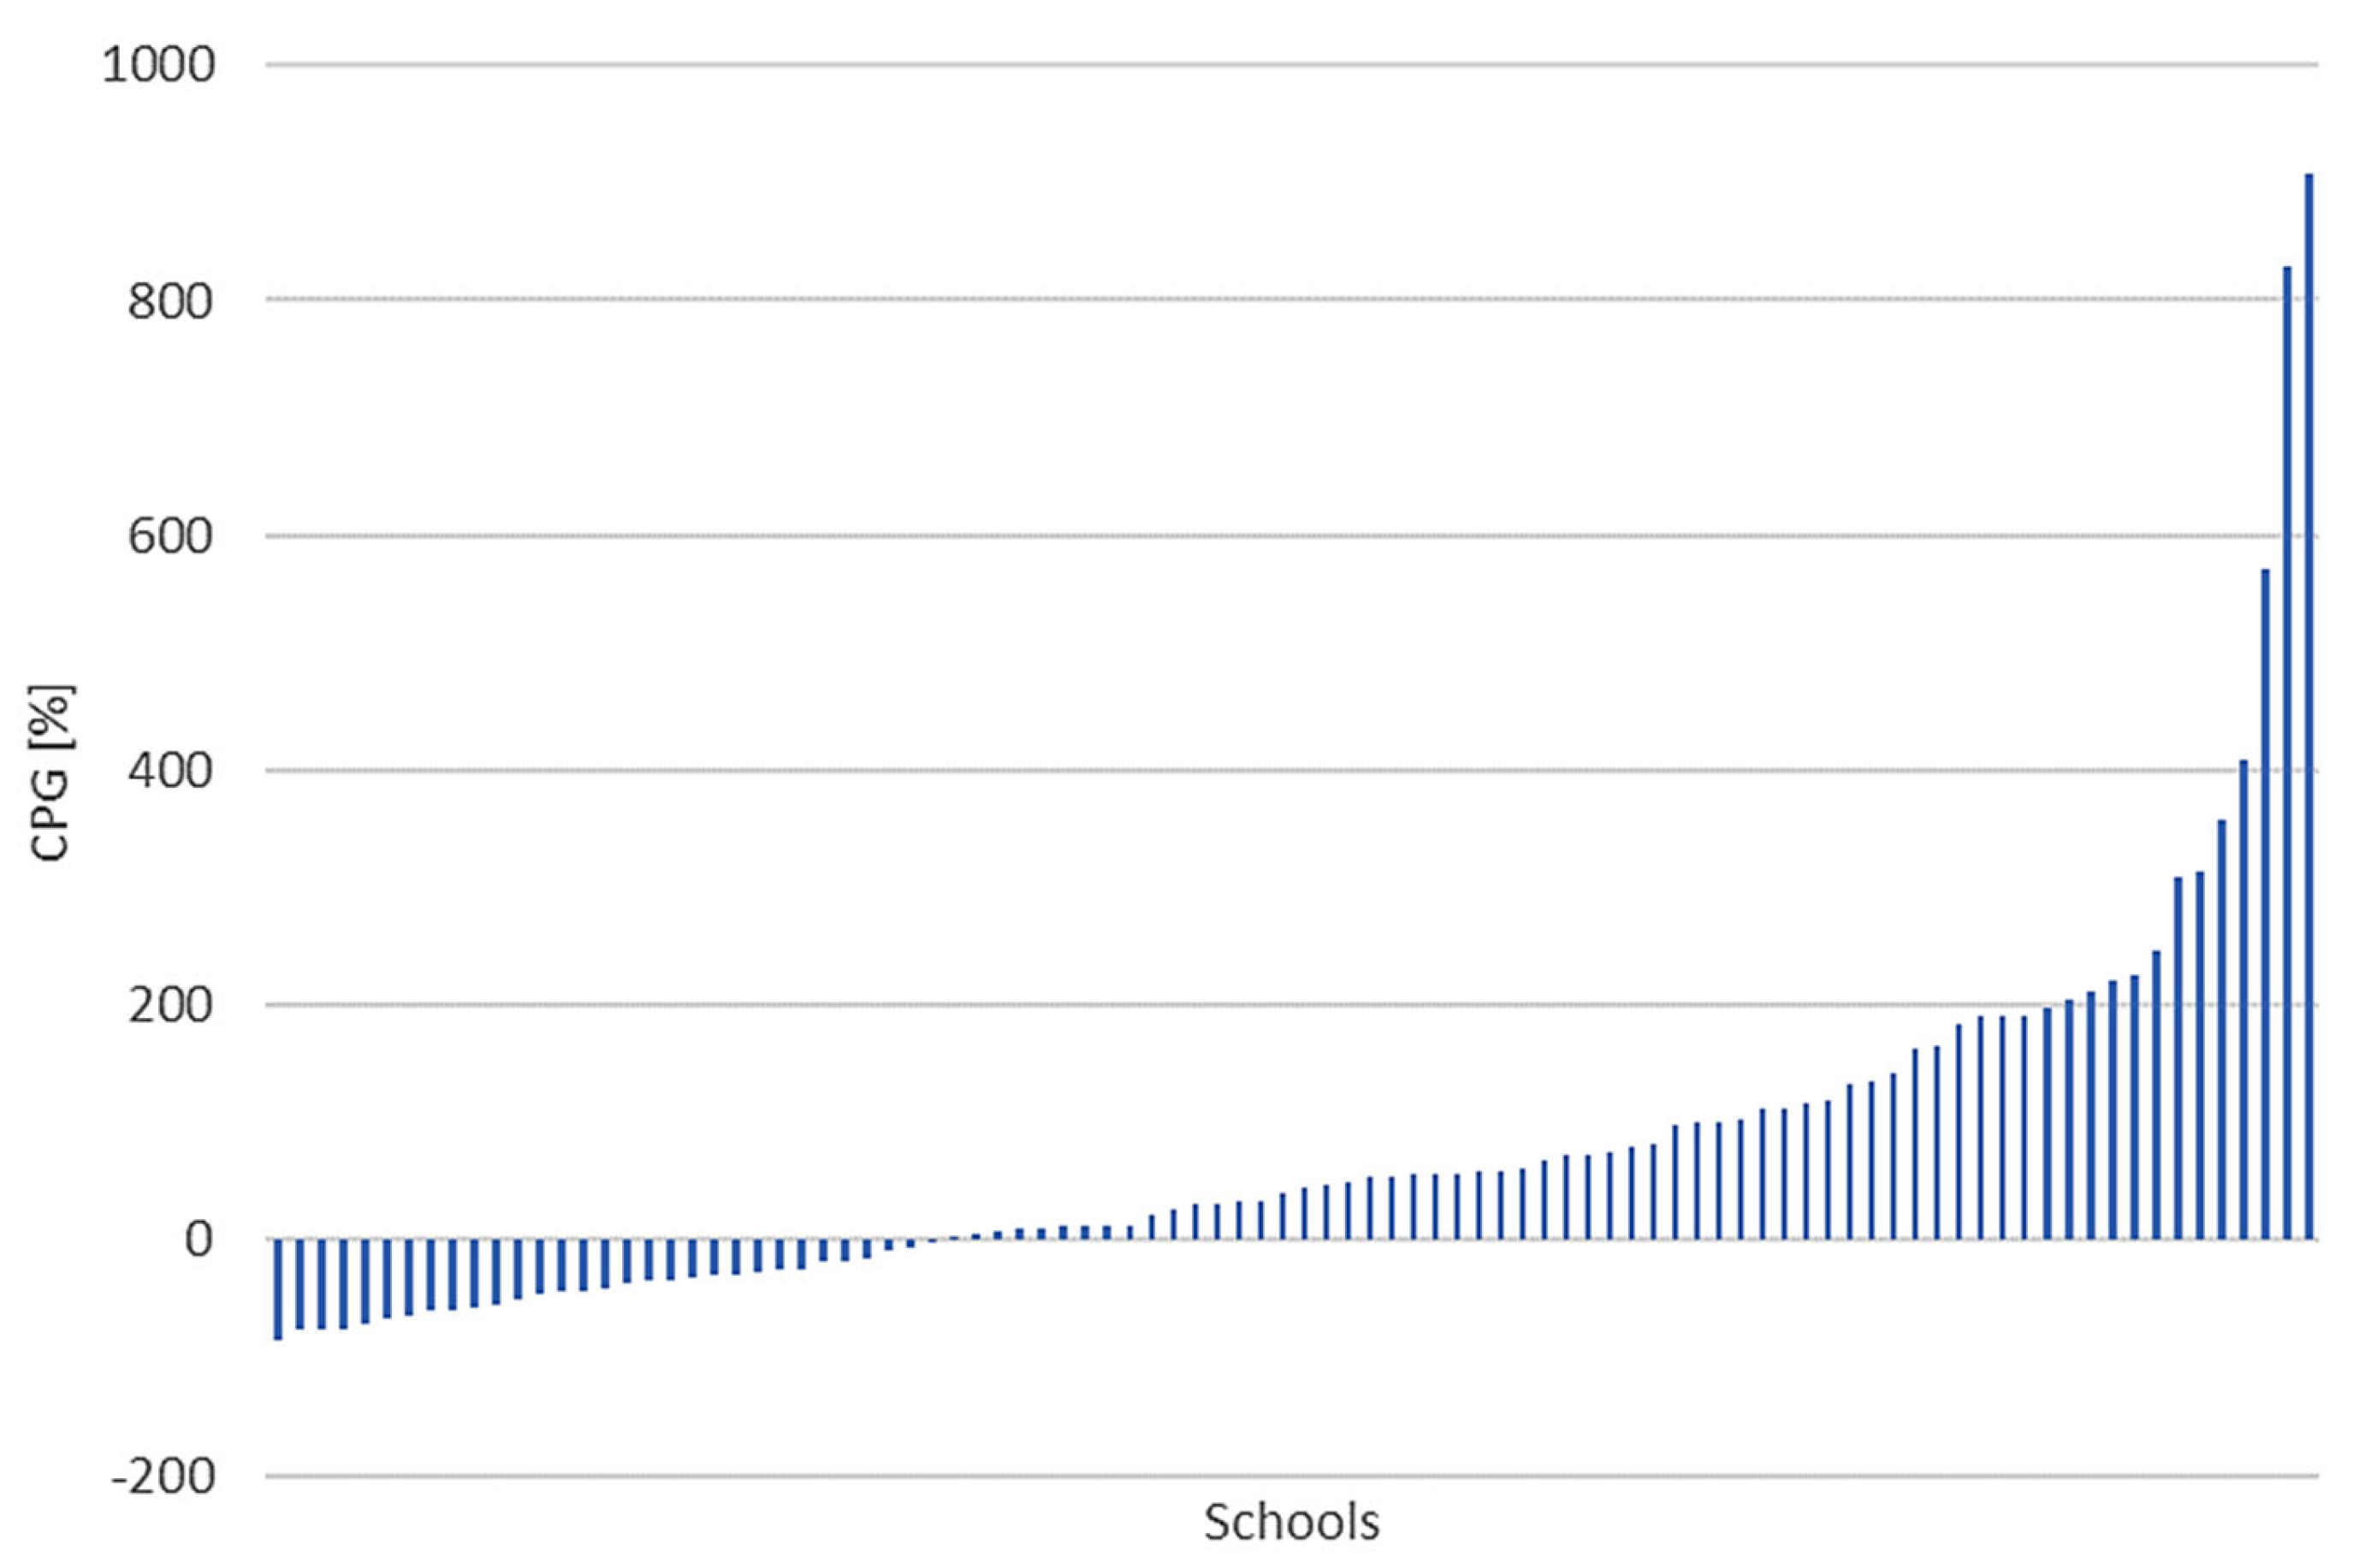
| EPG [%] | 94 | 71.73 | 42.11 | −99.67 | 384.69 | −14.96 | 136.40 |
| CPG [%] | 94 | 78.77 | 43.19 | −85.92 | 906.41 | −25.59 | 116.57 |
| Variable | School Type | N | Mean | Median | Min. | Max. | Lower Quartile | Upper Quartile |
|---|---|---|---|---|---|---|---|---|
| EPG [%] | Primary | 81 | 71.53 | 42.16 | −99.67 | 384.69 | −20.87 | 136.40 |
| Secondary | 13 | 72.93 | 22.56 | −2.66 | 226.95 | 6.96 | 110.65 | |
| CPG [%] | Primary | 81 | 84.95 | 50.43 | −85.92 | 906.41 | −26.27 | 118.32 |
| Secondary | 13 | 40.21 | 12.14 | −42.50 | 221.32 | −18.24 | 68.47 |
| Variable | Heating Type | N | Mean | Median | Min. | Max. | Lower Quartile | Upper Quartile |
|---|---|---|---|---|---|---|---|---|
| EPG [%] | District | 19 | 100.65 | 84.04 | −2.66 | 384.69 | 13.49 | 188.98 |
| Gas | 75 | 64.40 | 38.99 | −99.67 | 346.10 | −23.53 | 123.78 | |
| CPG [%] | District | 19 | 75.02 | 58.85 | −59.02 | 309.08 | −6.40 | 132.24 |
| Gas | 75 | 79.71 | 40.76 | −85.92 | 906.41 | −30.90 | 116.57 |
| Comparison | Metric | Group 1 | Group 2 | Mean Diff | p-Value |
|---|---|---|---|---|---|
| Heating Systems | EPG | District: 100.65% | Gas: 64.40% | +36.25 | 0.207 |
| (District vs. Gas) | CPG | District: 75.02% | Gas: 79.71% | −4.69 | 0.912 |
| School Types | EPG | Primary: 71.53% | Secondary: 72.93% | −1.40 | 0.967 |
| (Primary vs. Secondary) | CPG | Primary: 84.95% | Secondary: 40.21% | +44.74 | 0.366 |
| Variable | EPG | CPG |
|---|---|---|
| School Type | 0.004 | −0.094 |
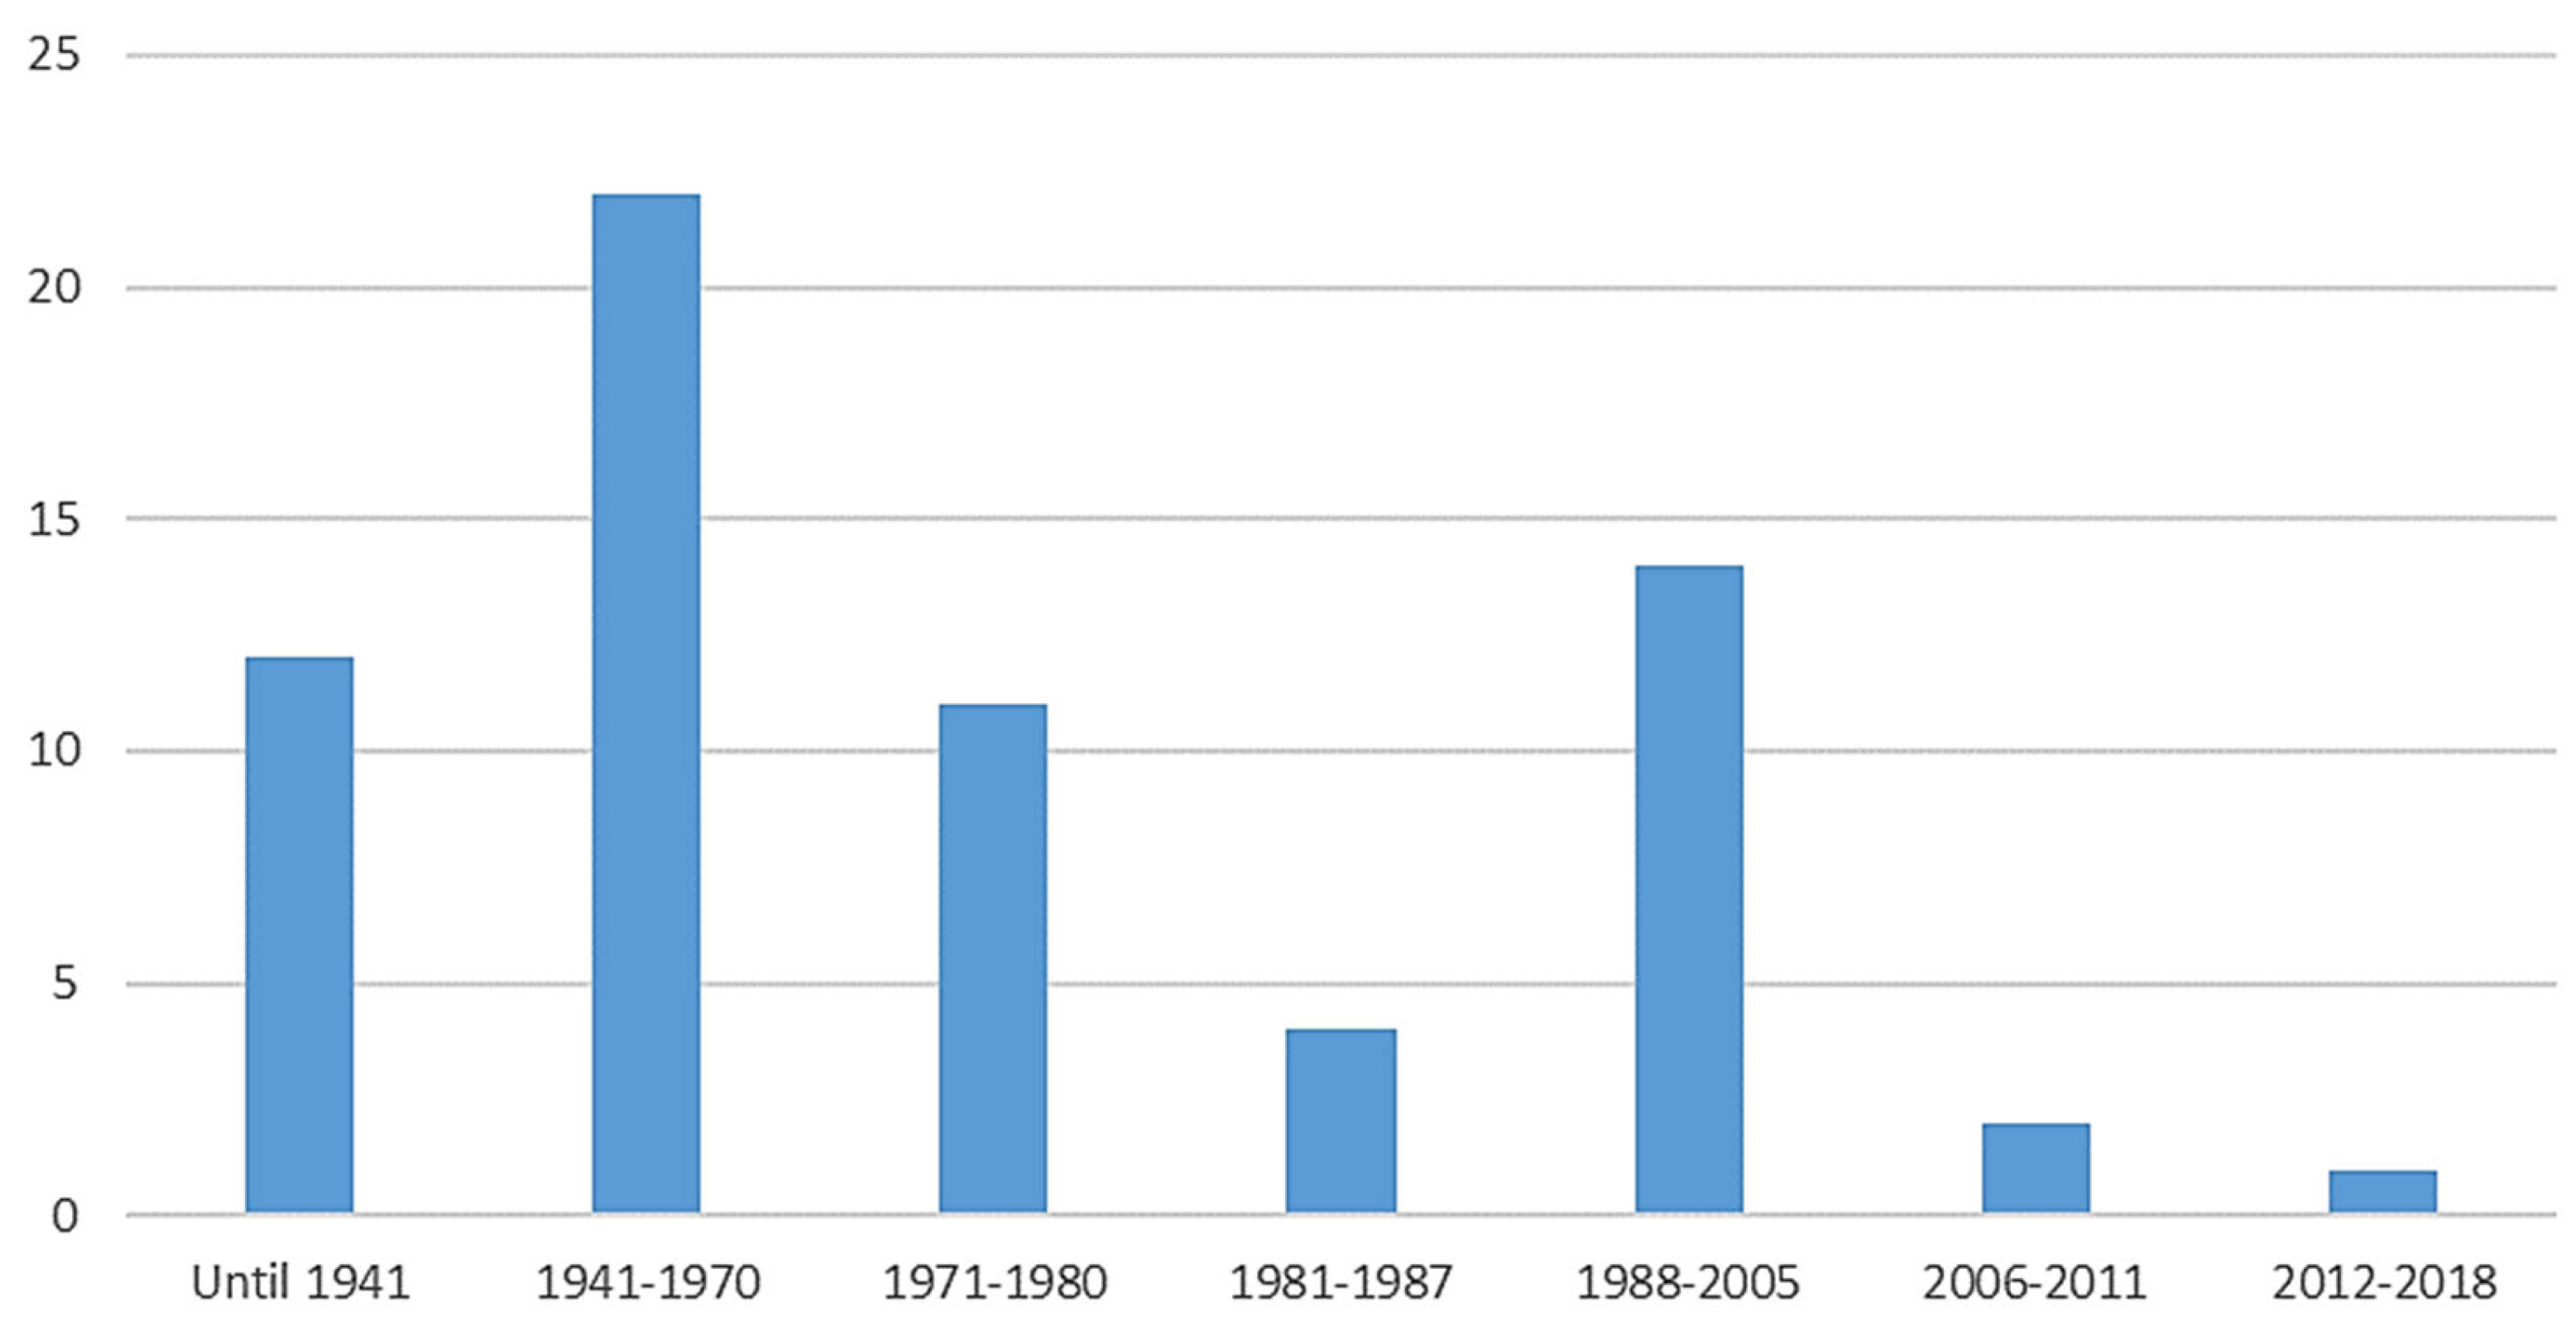
| Building Age | −0.016 | −0.047 |
| Energy Class | −0.301 | −0.130 |
| Heating Type | −0.131 | 0.012 |
Disclaimer/Publisher’s Note: The statements, opinions and data contained in all publications are solely those of the individual author(s) and contributor(s) and not of MDPI and/or the editor(s). MDPI and/or the editor(s) disclaim responsibility for any injury to people or property resulting from any ideas, methods, instructions or products referred to in the content. |
© 2025 by the authors. Licensee MDPI, Basel, Switzerland. This article is an open access article distributed under the terms and conditions of the Creative Commons Attribution (CC BY) license (https://creativecommons.org/licenses/by/4.0/).
Share and Cite
Begić Juričić, H.; Krstić, H.; Domazetović, M. Analyzing the Carbon Performance Gap and Thermal Energy Performance Gap of School Buildings in Osijek-Baranja County, Croatia. Energies 2025, 18, 1818. https://doi.org/10.3390/en18071818
Begić Juričić H, Krstić H, Domazetović M. Analyzing the Carbon Performance Gap and Thermal Energy Performance Gap of School Buildings in Osijek-Baranja County, Croatia. Energies. 2025; 18(7):1818. https://doi.org/10.3390/en18071818
Chicago/Turabian StyleBegić Juričić, Hana, Hrvoje Krstić, and Mihaela Domazetović. 2025. "Analyzing the Carbon Performance Gap and Thermal Energy Performance Gap of School Buildings in Osijek-Baranja County, Croatia" Energies 18, no. 7: 1818. https://doi.org/10.3390/en18071818
APA StyleBegić Juričić, H., Krstić, H., & Domazetović, M. (2025). Analyzing the Carbon Performance Gap and Thermal Energy Performance Gap of School Buildings in Osijek-Baranja County, Croatia. Energies, 18(7), 1818. https://doi.org/10.3390/en18071818