Abstract
Proton exchange membrane fuel cells (PEMFCs), recognized as promising sources of waste heat for space heating, domestic hot water supply, and industrial thermal applications, have garnered substantial interest owing to their environmentally benign operation and high energy conversion efficiency. Since the uniformity of oxygen diffusion toward catalytic layers critically governs electrochemical performance, this study establishes a three-dimensional, non-isothermal computational fluid dynamics (CFD) model to systematically optimize the cathode flow channel width distribution, targeting the maximization of power output through enhanced reactant homogeneity. Numerical results reveal that non-uniform flow channel geometries markedly improve oxygen distribution uniformity, reducing the flow inhomogeneity coefficient by 6.6% while elevating maximum power density and limiting current density by 9.1% and 7.8%, respectively, compared to conventional equal-width designs. There were improvements attributed to the establishment of longitudinal oxygen concentration gradients and we alleviated mass transfer limitations. Synergistic integration with gas diffusion layer (GDL) gradient porosity optimization further amplifies performance, yielding a 12.4% enhancement in maximum power density and a 10.4% increase in limiting current density. These findings validate the algorithm’s efficacy in resolving coupled transport constraints and underscore the necessity of multi-component optimization for advancing PEMFC design.
1. Introduction
The integration of proton exchange membrane fuel cells (PEMFCs) into combined heat and power (CHP) systems and other heat utilization systems [1] has emerged as a prominent research direction in recent years. By concurrently generating electricity and recovering waste heat for thermal applications, these hybrid systems attain higher total energy efficiencies compared to conventional systems. In district heating networks, decentralized PEMFC-CHP units offer carbon-neutral heating solutions that reduce reliance on centralized fossil fuel boilers, contributing to decarbonization objectives. To address energy security and environmental challenges associated with fossil fuel overuse, researchers have focused on developing clean energy conversion technologies. As electrochemical devices that directly convert chemical energy from hydrogen and oxygen into electrical energy, PEMFCs have been widely studied due to their advantages of high energy efficiency, high power density, low noise, and zero pollutant emissions [2,3,4,5,6]. However, there are inherent irreversibilities in the electrochemical reactions, especially concentration polarization, which limits the supply of reactant concentration to the catalyst layer, thus severely restricting the performance of the fuel cell. Thus, improving mass transfer efficiency becomes pivotal for ensuring high-efficiency, stable, and long-term fuel cell operation under dynamic conditions.
As a crucial component, the bipolar plate plays an essential role in providing structural support, facilitating electron conduction, and transporting reactants [7,8]. Its design dictates the configuration of gas flow channels, which directly impacts the mass transfer and output performance of the PEMFCs [9,10]. Current research on flow channel optimization mainly focuses on three aspects: the development of novel flow fields [11,12,13], the implementation of in-channel obstructions [14,15,16], and the optimization of flow field structural parameters [17,18,19]. Parallel-flow-channel fuel cells, which are commonly used flow field structures with relatively low pressure drops, are susceptible to liquid water accumulation and non-uniform reactant distributions [20]. The width of the flow channels, a key structural parameter, significantly influences heat and mass transfer capabilities as well as water removal efficiency and has been extensively investigated by numerous researchers. Zhang et al. [21] established an analogy between the transport of reactant gas in PEMFCs and grid current and optimized the channel width to enhance cell efficiency and the uniformity of the reactant distribution. Ahmed et al. [22] analyzed the impact of the channel–rib width ratio on the PEMFC’s output performance. Their results indicated that an optimal channel–rib width ratio can improve reactant distribution and reduce concentration losses. Xia et al. [23] explored the effects of the channel–rib width ratio on the cell performance and temperature distribution of high-temperature fuel cells. Shimpalee et al. [24] studied the influence of different channel–rib width ratios and flow directions on the PEMFC’s performance. Most existing studies on the flow channel widths of parallel-flow-channel PEMFCs have been restricted to equal-width flow channel structures. Nevertheless, the non-uniform distribution of reactants in PEMFCs implies that non-equal-width flow channels may offer an optimal configuration. Therefore, further research is necessary to investigate the effects of non-equal-width flow channels on the mass transfer and output performance of PEMFCs.
The gas diffusion layer (GDL) plays a crucial role in the mass transfer performance of PEMFCs. Consequently, a substantial amount of research has been dedicated to studying the geometry and physical properties of the GDL [25,26,27,28]. Specifically, the porosity of the GDL significantly affects the distribution of reactants and electron transport within the cell. A lower porosity means that a larger fraction of the GDL’s internal space is occupied by solid materials. This can enhance electron conduction but will also impede the diffusion of reactant gasses. On the contrary, a higher porosity is beneficial for the diffusion of reactant gasses but will notably reduce the effective conductivity of the GDL [29]. To improve the mass transfer capacity of the GDL without sacrificing its electron conduction ability, exploring the use of gradient porosity is a promising approach worthy of further in-depth study. Chu et al. [30] indicated that continuous variation in the GDL’s porosity is necessary because the oxygen mass fraction is non-uniform across the entire GDL. Guo et al. [31] put forward a pore-scale model based on the lattice Boltzmann method and probed into the influence of the GDL porosity distribution on liquid water saturation, oxygen concentration, and current density. Kanchan et al. [32] found that an exponentially decreasing porosity along the flow direction can achieve the best performance. Zhan et al. [25,33] showed that GDLs with a porosity gradient are more favorable for the discharge of liquid water from the catalytic layer into the flow channel. Ko et al. [34] experimentally investigated the impact of the GDL porosity gradient on the PEMFC performance. However, these studies all demonstrated that the highest porosity gradient does not definitely lead to the optimal output performance.
Recently, scholars have focused on exploring the implications of concurrently optimizing the flow channel structure and diffusion layer parameters, along with the intricate interactions between them within PEMFCs. Sun et al. [35] investigated the effects of channel–rib width ratio, the GDL thickness, and the electrical conductivity on cell output performance and water discharge capacity. Their results clearly indicated that a relatively higher channel–rib width ratio facilitates efficient water removal and can improve the reaction rate, while suitable GDL conductivity and thickness can improve the electron and reactant transport. Shi et al. [36] investigated the effects of assembly pressure and the width and depth of the flow channel on the comprehensive performance of PEMFCs. The findings from their research demonstrated that the assembly pressure can induce changes in the porosity of the GDL. These porosity variations, in turn, lead to a reduction in the mass transfer capacity of the cell. Nevertheless, it was discovered that this detrimental effect can be effectively mitigated through the optimization of the flow field design. Therefore, an integrated optimization approach considering the assembly force, flow channel width, and depth holds the potential to enhance the overall performance of PEMFCs. Zhang et al. [37] examined the impact of incorporating wedge fins into the cathode flow channel and the porosity of the GDL on the performance of PEMFCs. Their results showed that an appropriate combination of wedge fins and GDL porosity can enhance the water removal efficiency of the cell and improve the output performance of the PEMFC, suggesting a promising strategy for fuel cell performance improvement.
From the above literature, it can be seen that the flow channel structure and the porosity of the diffusion layer have a crucial influence on the output performance and mass transfer performance of the cell. However, most of the current studies only consider one of these aspects. Moreover, it is rare to simultaneously optimize the non-equal-width flow channel and the GDL gradient porosity. Therefore, this paper proposes a design method for non-equal-width flow channels based on computational fluid dynamics (CFD) and obtains the optimized flow channel structure. Then, we investigate the effects of this structure on the mass transfer capability, the uniformity of reactant distribution, and the output performance of the PEMFC. Finally, the synergistic effects of gradient GDL porosity and optimized flow channel geometry were systematically analyzed.
2. Model Development
2.1. Governing Equations
The proton exchange membrane fuel cell (PEMFC) is a complex system involving coupled multi-physics field interactions. Its computational model accounts for key physical quantities such as temperature, velocity, and pressure. Consequently, the governing equations not only incorporate the fundamental conservation laws (mass, momentum, energy, and species) but also integrate electrochemical reaction equations with water transport formulations.
The mass conservation equation for reactants is as follows:
where ε denotes the porosity of the porous medium. ρg and Ug represent the gas mixture density and superficial velocity, respectively, while Sm is the mass source term (present exclusively in CLs). This is defined as follows:
where Mi denotes the molar mass of species i (H2, O2 or H2O) and F corresponds to the Faraday constant. ja and jc represent the current densities at the anode and cathode, respectively, governed by the Butler–Volmer equations,
where Ci is the molar concentration of species i, with representing its reference concentration. and are reference exchange current densities at the anode and cathode, respectively. α is the charge transfer coefficient, R is the ideal gas constant, and T indicates temperature. The electrode overpotentials ηa (anode) and ηc (cathode) are governed by
where φsol and φmem denote the electric potentials of solid phase and membrane phase, respectively, while V0 represents the thermodynamic equilibrium potential, defined by temperature T and partial pressure Pi of gaseous reactants:
The momentum transport equation for reactant flow is as follows:
where Pg and μg are the pressure and dynamic viscosity of the gas phase mixture, respectively. The momentum source term Smom (present in GDLs and CLs) is defined by
where the permeability K of the porous medium is expressed as a function of the particle diameter dp and the local porosity ε.
The energy conservation equation is expressed as
where s indicates the liquid water saturation in porous media. ρl, Cp,l, Cp,g, Ul, and keff represent liquid water density, the isobaric heat capacities of liquid/gas phases, the liquid velocity vector, and effective thermal conductivity, respectively. The energy source item Sene encompasses Joule heating, activation polarization heat, electrochemical reaction heat, and phase-change latent heat:
where I is the average current density, Rohm is the ohmic resistance, hrea is the heat generated by electrochemical reactions, and hL is the latent heat of the phase change.
The conservation equation for reactant species is formulated as follows:
where Yi and denote mass fraction and effective diffusivity of species i, respectively. The source term Si (active exclusively in CLs) satisfies stoichiometric constraints:
The potential fields are governed by
where σsol and σmem are electronic and protonic conductivities. The volumetric current density source term for solid and membrane phases is determined by exchange current density:
The liquid water transport in flow channels is mainly dominated by convection, which can be expressed as
The liquid water saturation source term Sl is expressed as follows:
where cr is the condensation constant. Pwv and Psv are the water vapor pressure and saturated vapor pressure, respectively.
Owing to the micropores within the GDLs and CLs, the capillary diffusion term is employed to replace the convection term in Equation (21), as presented below:
where Pcap and μl represent capillary pressure and the dynamic viscosity of liquid water, respectively.
2.2. Physical Geometry and Operating Conditions
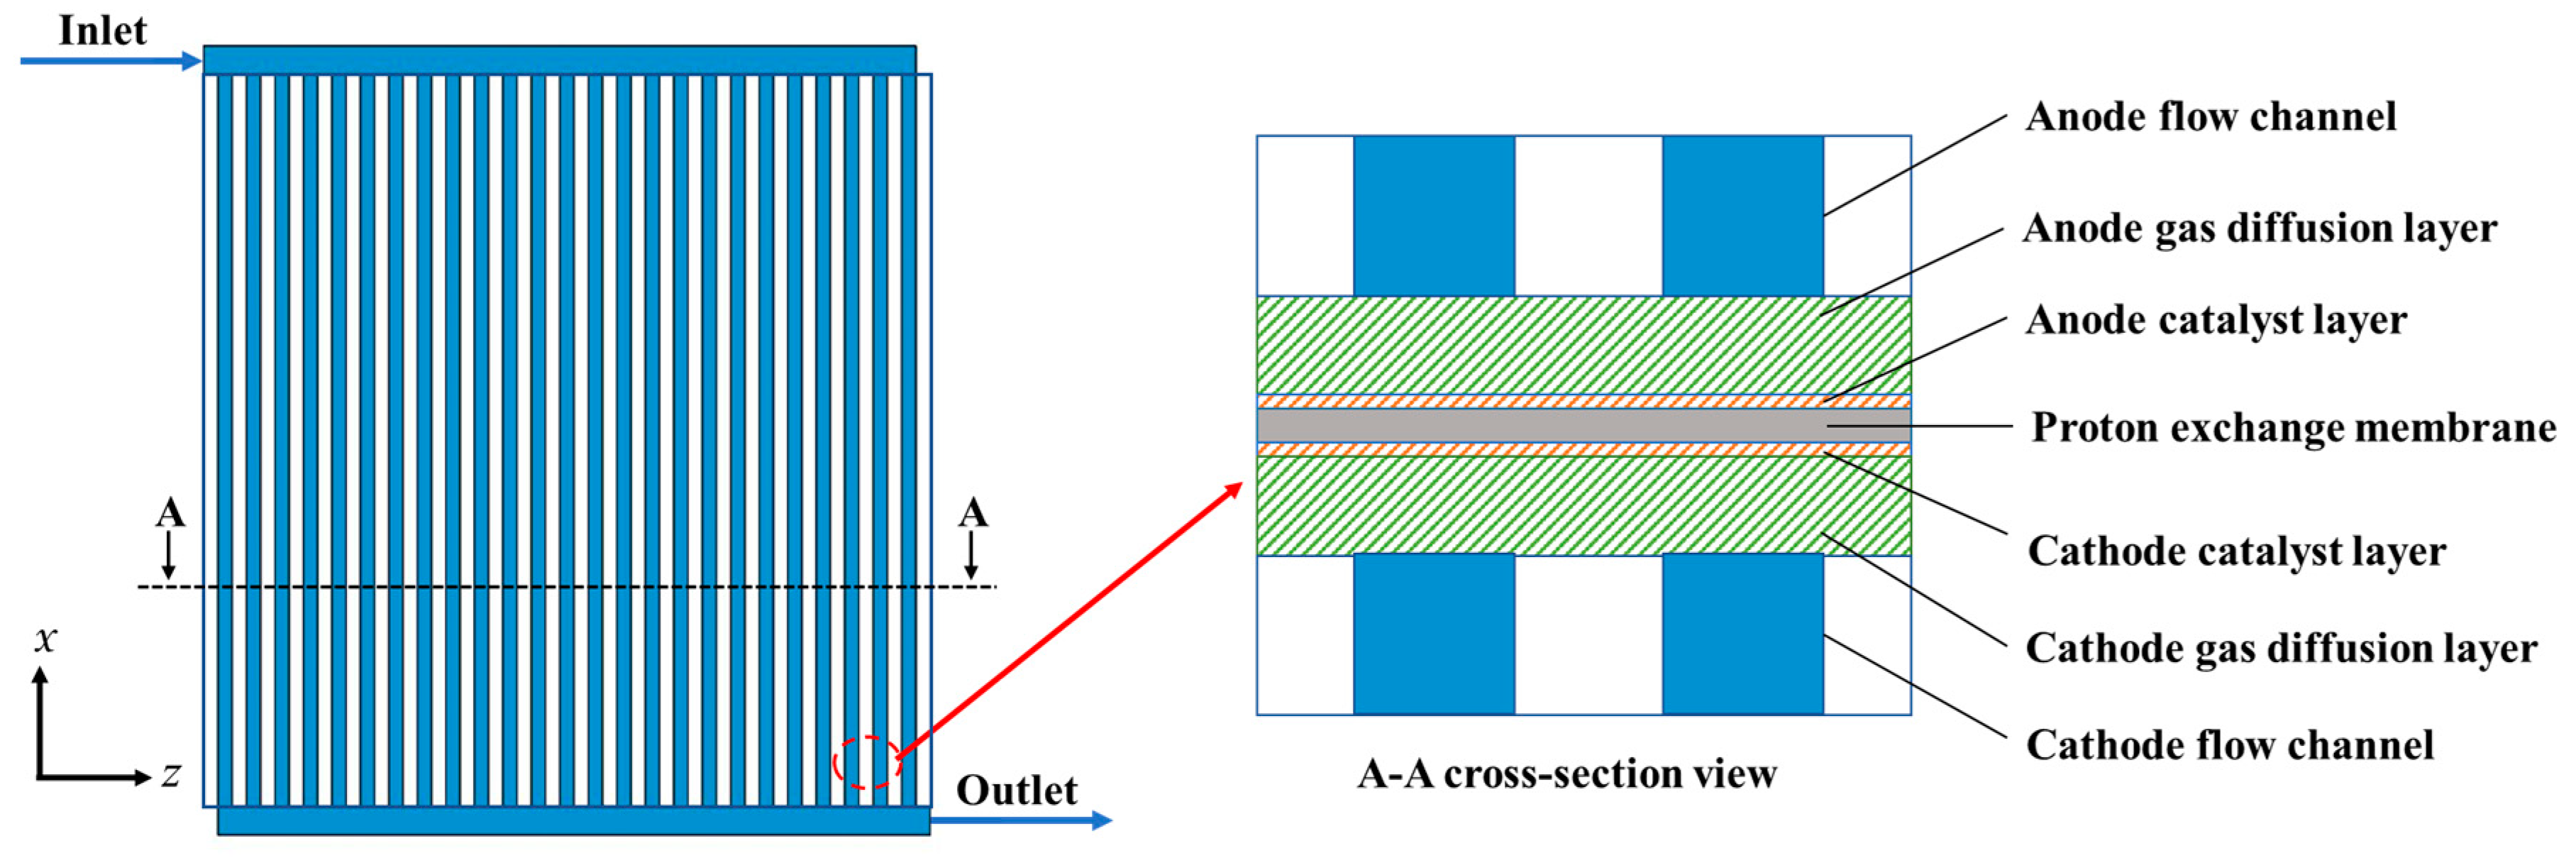
The three-dimensional computational domain depicting PEMFC assembly is illustrated in Figure 1, comprising sequentially stacked flow channels (FCs), gas diffusion layers (GDLs), catalyst layers (CLs), and proton exchange membranes (PEMs). Geometric parameters of each component are detailed in Table 1. The reactants are introduced through a single main inlet and subsequently branch into 25 tributary channels. All channels are characterized by a rectangular cross-section. After engaging in the electrochemical reaction, they are discharged from the main outlet. For the purpose of facilitating clear and concise description, these tributary channels are sequentially numbered from 1 to 25 along the direction of the primary flow path (z-axis positive direction). To simplify the modeling and calculation, the following assumptions, commonly used in existing studies, are made: (1) the PEMFC operates under steady-state conditions; (2) all the gasses participating in the reaction are considered ideal gasses; (3) the water within the flow channel exists in the form of extremely fine droplets, and its flow velocity is consistent with that of the gas; (4) the materials utilized in the gas diffusion layer and the catalyst layer are treated as isotropic porous media; (5) the flow is assumed to be an incompressible laminar flow.
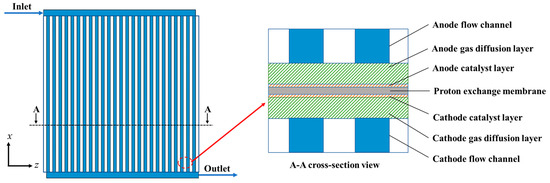
Figure 1.
Schematic diagrams of the physical model.

Table 1.
Geometric parameters used for simulation.
Both the anode and cathode gas inlets are configured as mass-flow inlets, and their specifications are determined as follows:
where ζ is the stoichiometric ratio, Aact stands for the activation area, and Iref represents the reference current density, set to 1 A/cm2. The outlet boundaries are set as pressure outlets, while the cathode and anode boundaries are assigned as operating voltage and zero, respectively. The remaining walls are defined as no-slip boundary conditions. The operating parameters and electrochemical parameters employed in the model are detailed in Table 2.
Table 2.
Physical and electrochemical parameters for simulation.
2.3. Grid Independency and Model Validation
In this study, the PEMFC add-on module of ANSYS Fluent 2022 R1 was employed to perform numerical simulations. The SIMPLE algorithm was adopted to handle the pressure–velocity coupling problem, while the F-cycle multigrid method was implemented to accelerate the convergence of iterative calculations. The momentum equation was discretized using a second-order central difference scheme, whereas the species conservation equation and charge conservation equation were discretized with a second-order upwind scheme. The calculated residuals are set to 1 × 10⁻⁶.
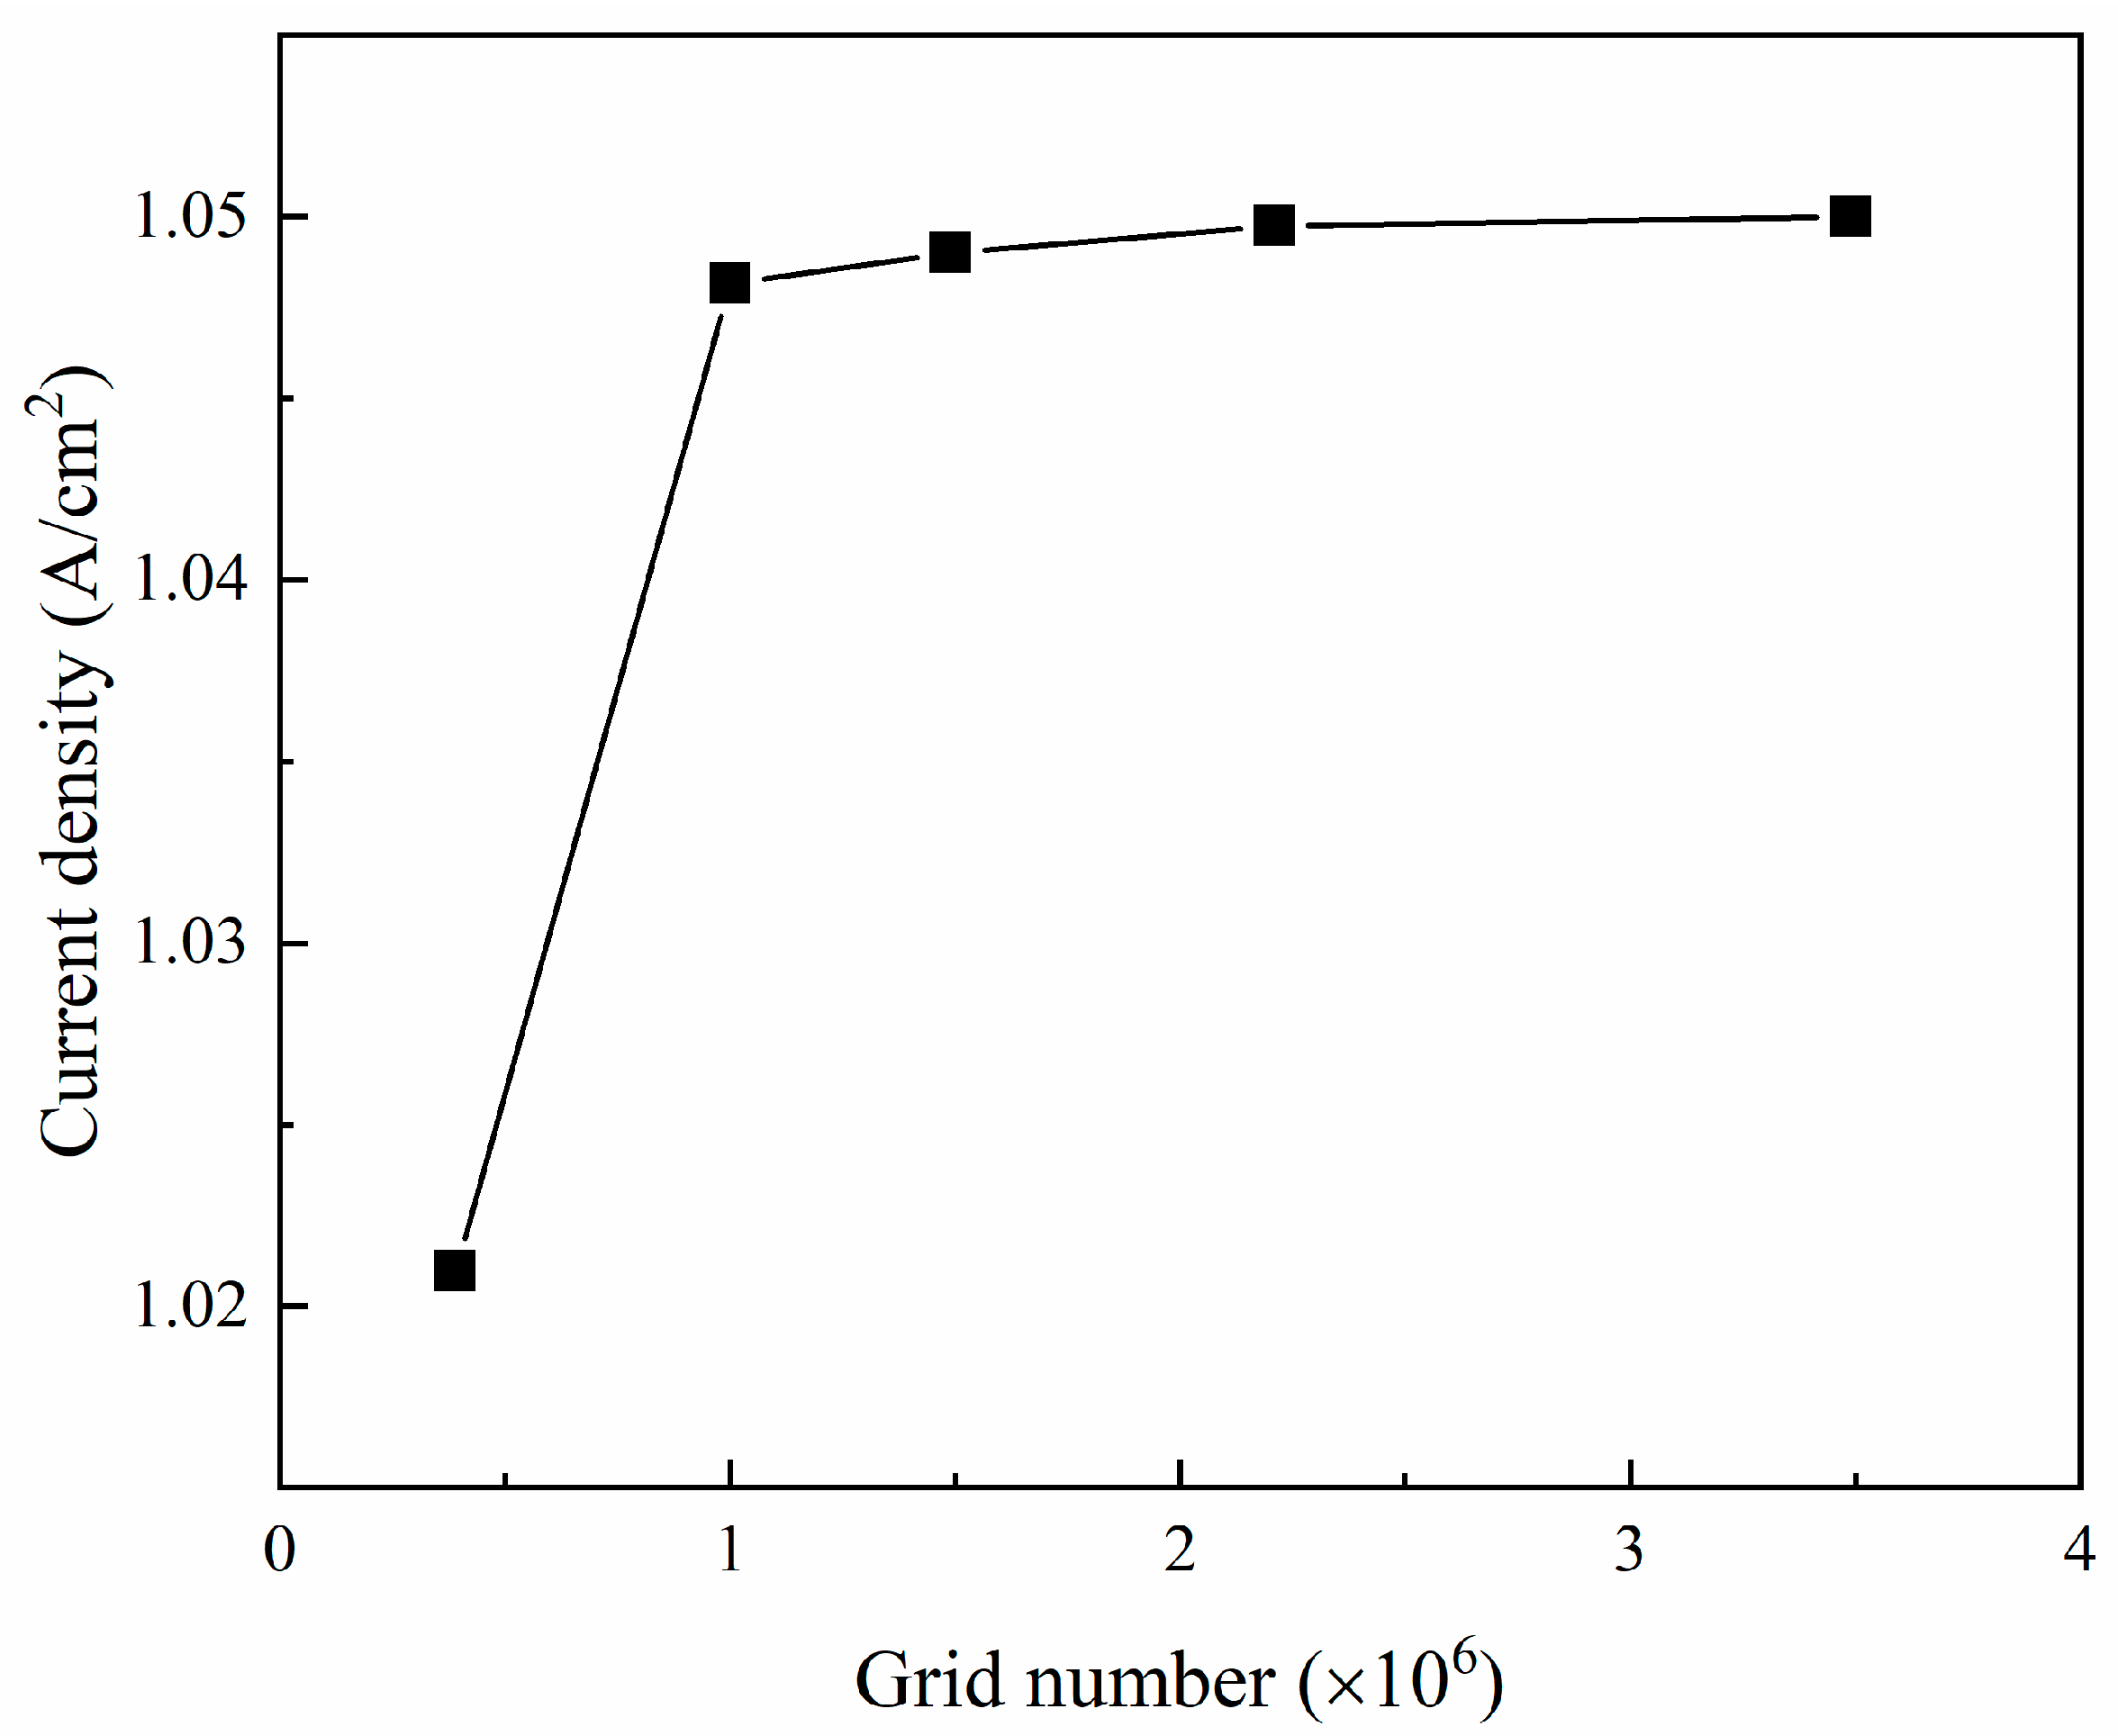
To verify the independence of the computational grids used in the numerical simulation, current densities were calculated for four distinct grid configurations at a voltage of 0.6 V. The results are presented in Figure 2. When the grid numbers were 2.2 million and 3.5 million, respectively, the relative error in the calculated current density at 0.6 V was below 0.01%. To balance computational accuracy and efficiency, the computational models in this study employed a grid count of 2.2 million.
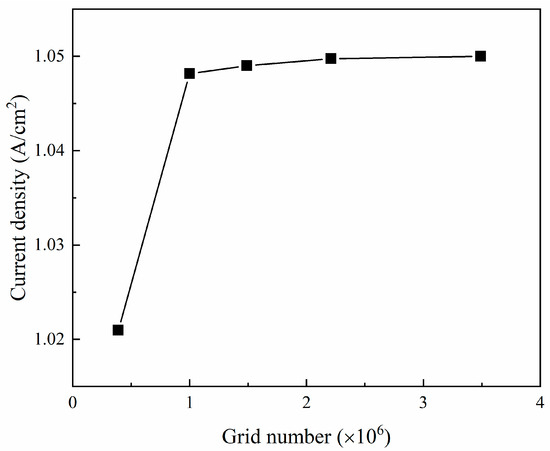
Figure 2.
Grid independent test.
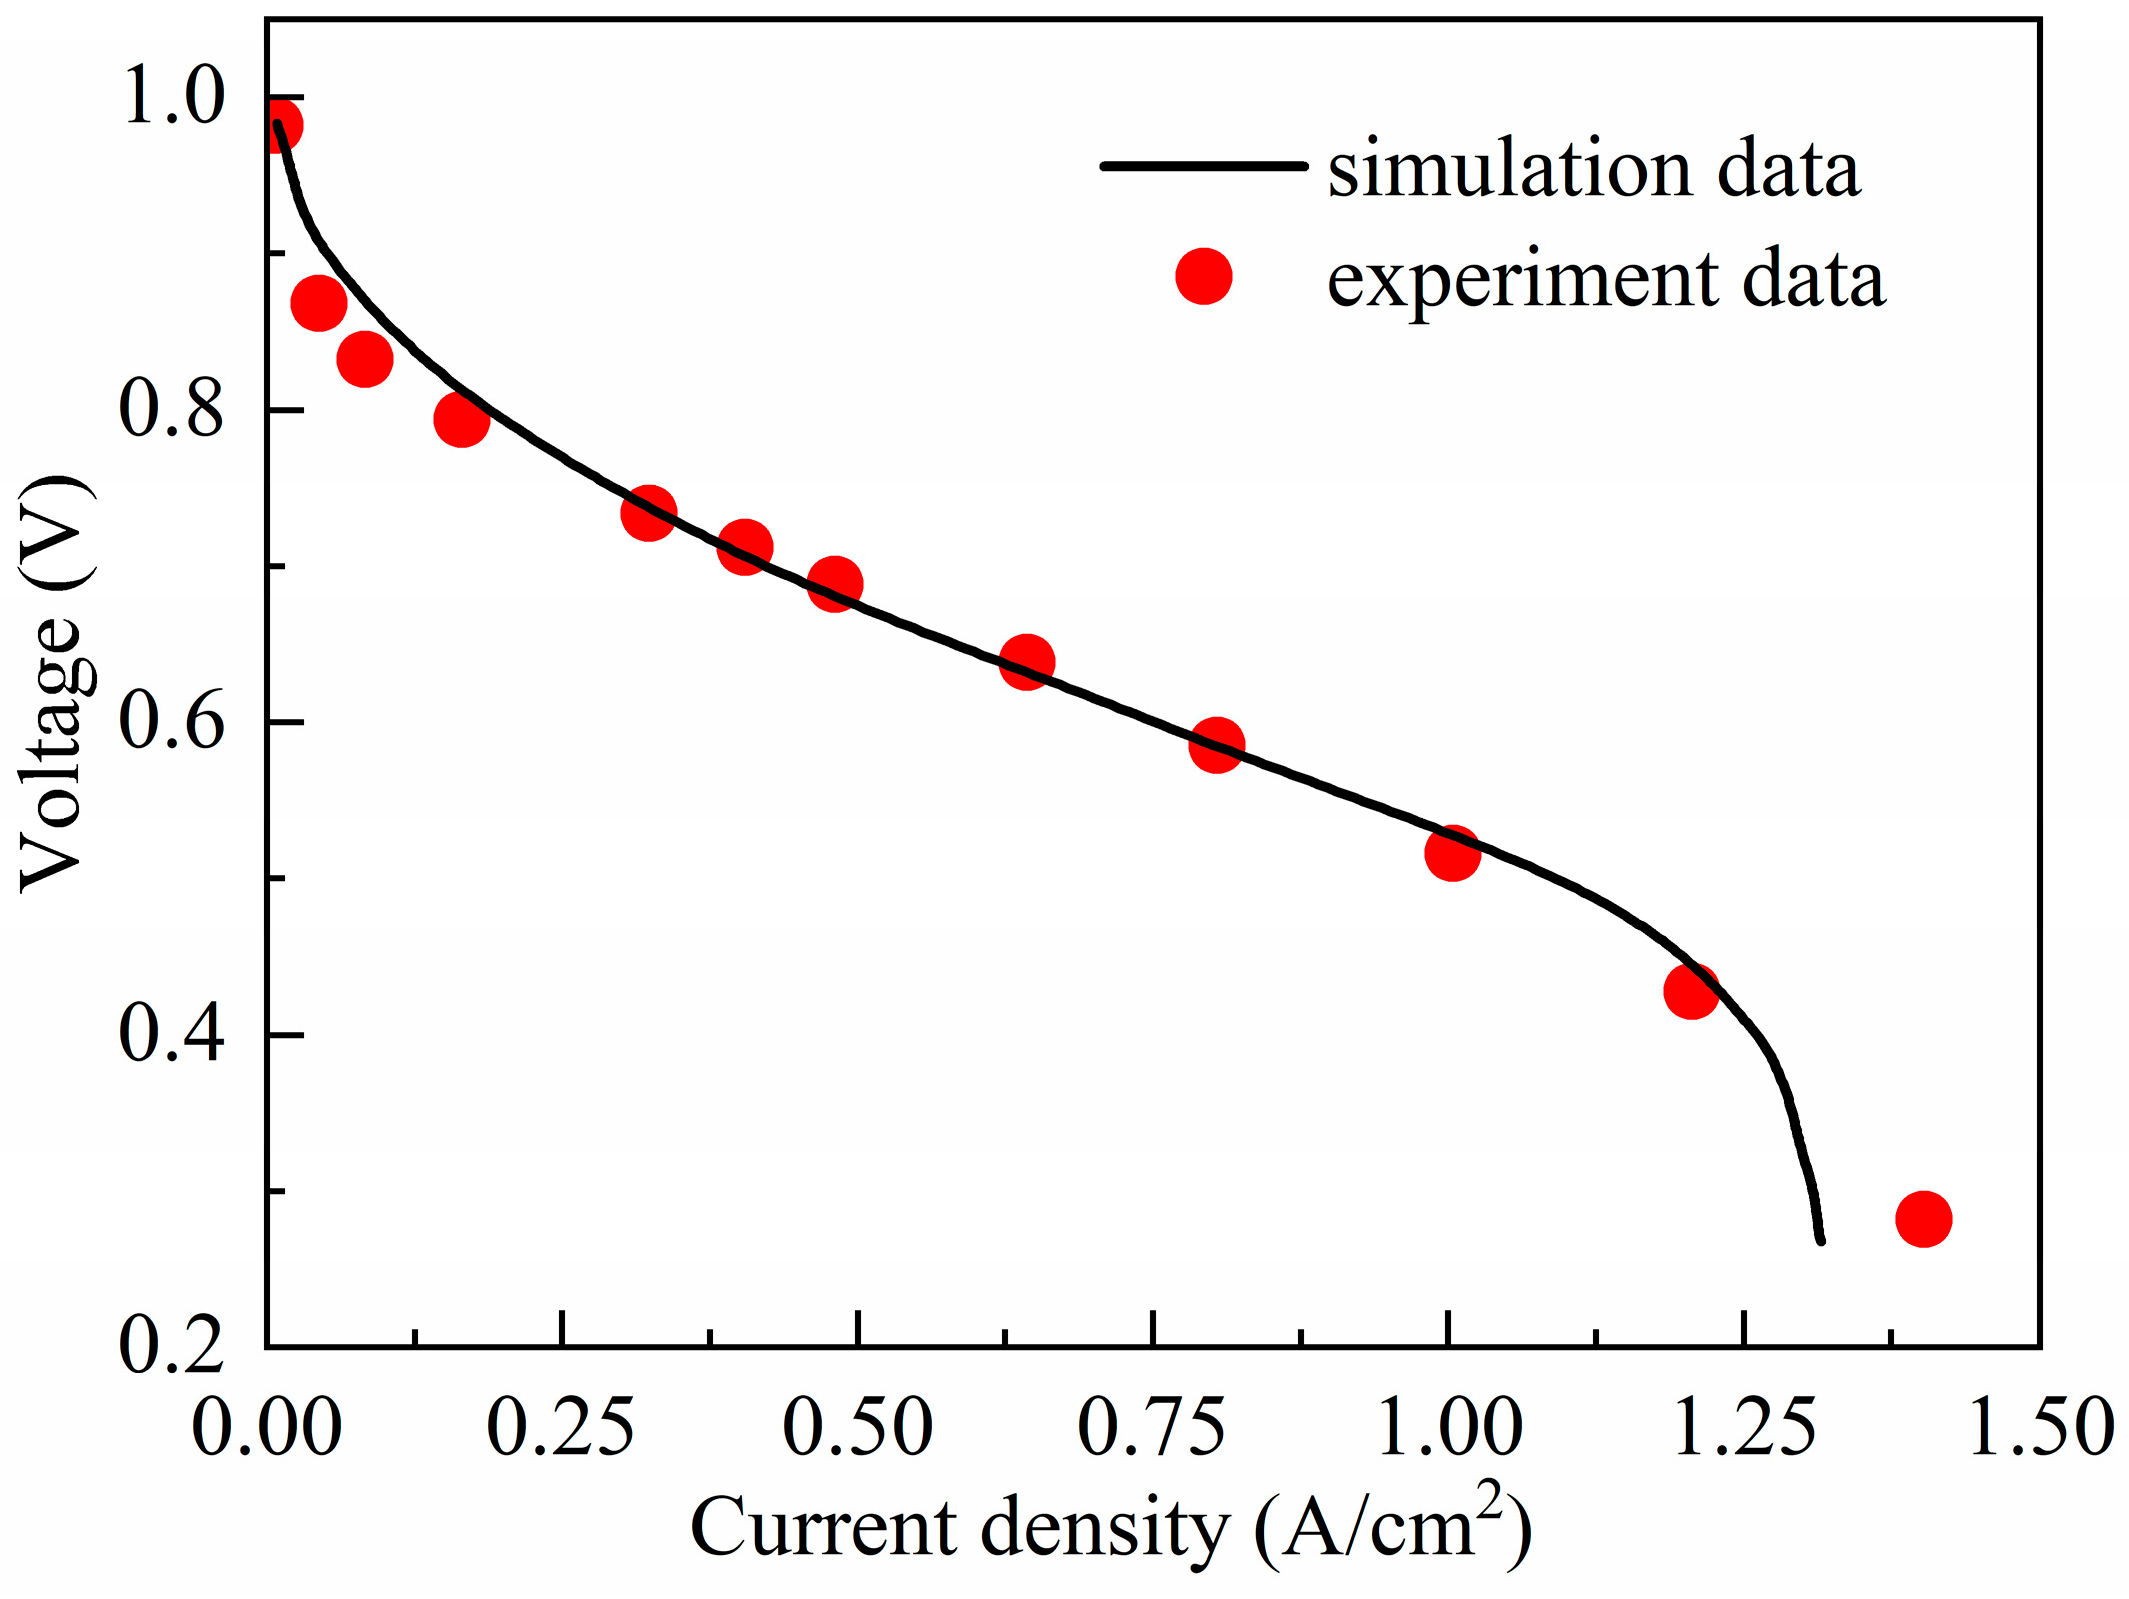
To further validate the effectiveness of the computational model, a single-channel PEMFC model was established according to Ref. [38]. The fuel cell operates under the following conditions: an operating temperature of 353.15 K, an ambient pressure of 1 atm, an anode stoichiometric coefficient of 2, a cathode stoichiometric coefficient of 1.5, an anode relative humidity of 84%, and a cathode relative humidity of 59%. As presented in Figure 3, the polarization curves exhibit strong consistency between numerical predictions and experimental data [38]. The maximum relative error is about 6%, which confirms the reliability of the simulation model developed.

Figure 3.
Polarization curves of the model developed and the reference [38].
3. Optimization Method of Flow Channel Width
The inhomogeneous reaction flow field generated by the equal-width flow channels used in conventional PEMFC usually results in the degradation of the mass transfer performance. Therefore, the development of non-equal-width flow fields to enhance flow field homogeneity is crucial to improving cell performance. Shen et al. [39] demonstrated that optimizing the cathode flow channel yields far superior results compared to optimizing the anode flow channel. Therefore, to minimize computational complexity, the present study focuses on optimizing cathode channel widths while maintaining a constant width for the anode channels.
To guarantee the requisite structural support and to eliminate the influence of the total cross-sectional area of the channels on the optimization outcomes, the total cross-sectional area of the ribs and channels is maintained at a constant level throughout this study. We assume that the PEMFC is effectively sealed and no leakage of the reaction gasses occurs during operation. The following equations can be derived from mass conservation:
where Q represents the mass flow rate; k denotes the tributary number; and Y is the average concentration of oxygen. The superscripts cos, in, and out signify the consumption of reactants, the inlet condition, and the outlet condition, respectively, while the subscript tot represents the sum of the values for all tributaries. Given that the inlet concentration of each tributary can be regarded as approximately identical, the average outlet concentration of all tributary channels can then be calculated using the following equation:
3.1. Evolutionary Algorithm Based on CFD
The cross-sectional area of each tributary channel directly influences the mass fraction of reactants at its exit, which further reflects the concentration uniformity of reactants diffusing to the catalyst layer and the output performance of the PEMFC. Therefore, the uniformity of reactant distribution and power output can be regarded as an optimization principle, and the oxygen flux at the outlet of each tributary channel can be regulated by adjusting the width distribution of these tributary channels. Specifically, if the outlet concentration of tributary channel k in the j-th iteration is lower than the average outlet concentration of all tributary outlets, the width of this tributary channel is increased to enhance its outlet concentration; conversely, if it is higher, the width needs to be decreased. This process continues until the reactant distribution reaches the highest level of uniformity achievable.
It is worth noting that, due to the flow characteristics of parallel flow channels, it is impossible to achieve complete uniformity in the outlet concentration of each tributary channel.
Ideally, to achieve the optimization principle, the difference in the flow channel width between two consecutive iterations should be minimized to the greatest extent possible. However, this approach would significantly elevate the computational cost. Therefore, in this paper, a relaxation factor γ is employed to regulate the magnitude of the width variation. From the j-th iteration to the (j + 1)-th iteration, the change in the width of tributary channel is calculated as follows:
where djk denotes the width of the k-th tributary channel at the j-th iteration. In other words, the adjustments of flow channel widths are determined by the difference between the oxygen fraction at the current tributary channel branch outlet and the average oxygen fraction of all tributary outlets. Specifically, if the oxygen fraction at a branch outlet exceeds the average value, this channel width should be reduced proportionally to the oxygen fraction difference to decrease its outlet oxygen concentration. Meanwhile, the initial value of relaxation factor γ is computed as follows:
where a flow channel model with equal widths is adopted in the initial case. For the first iteration, i.e., when j = 1, the width of the flow channel can be chosen arbitrarily.
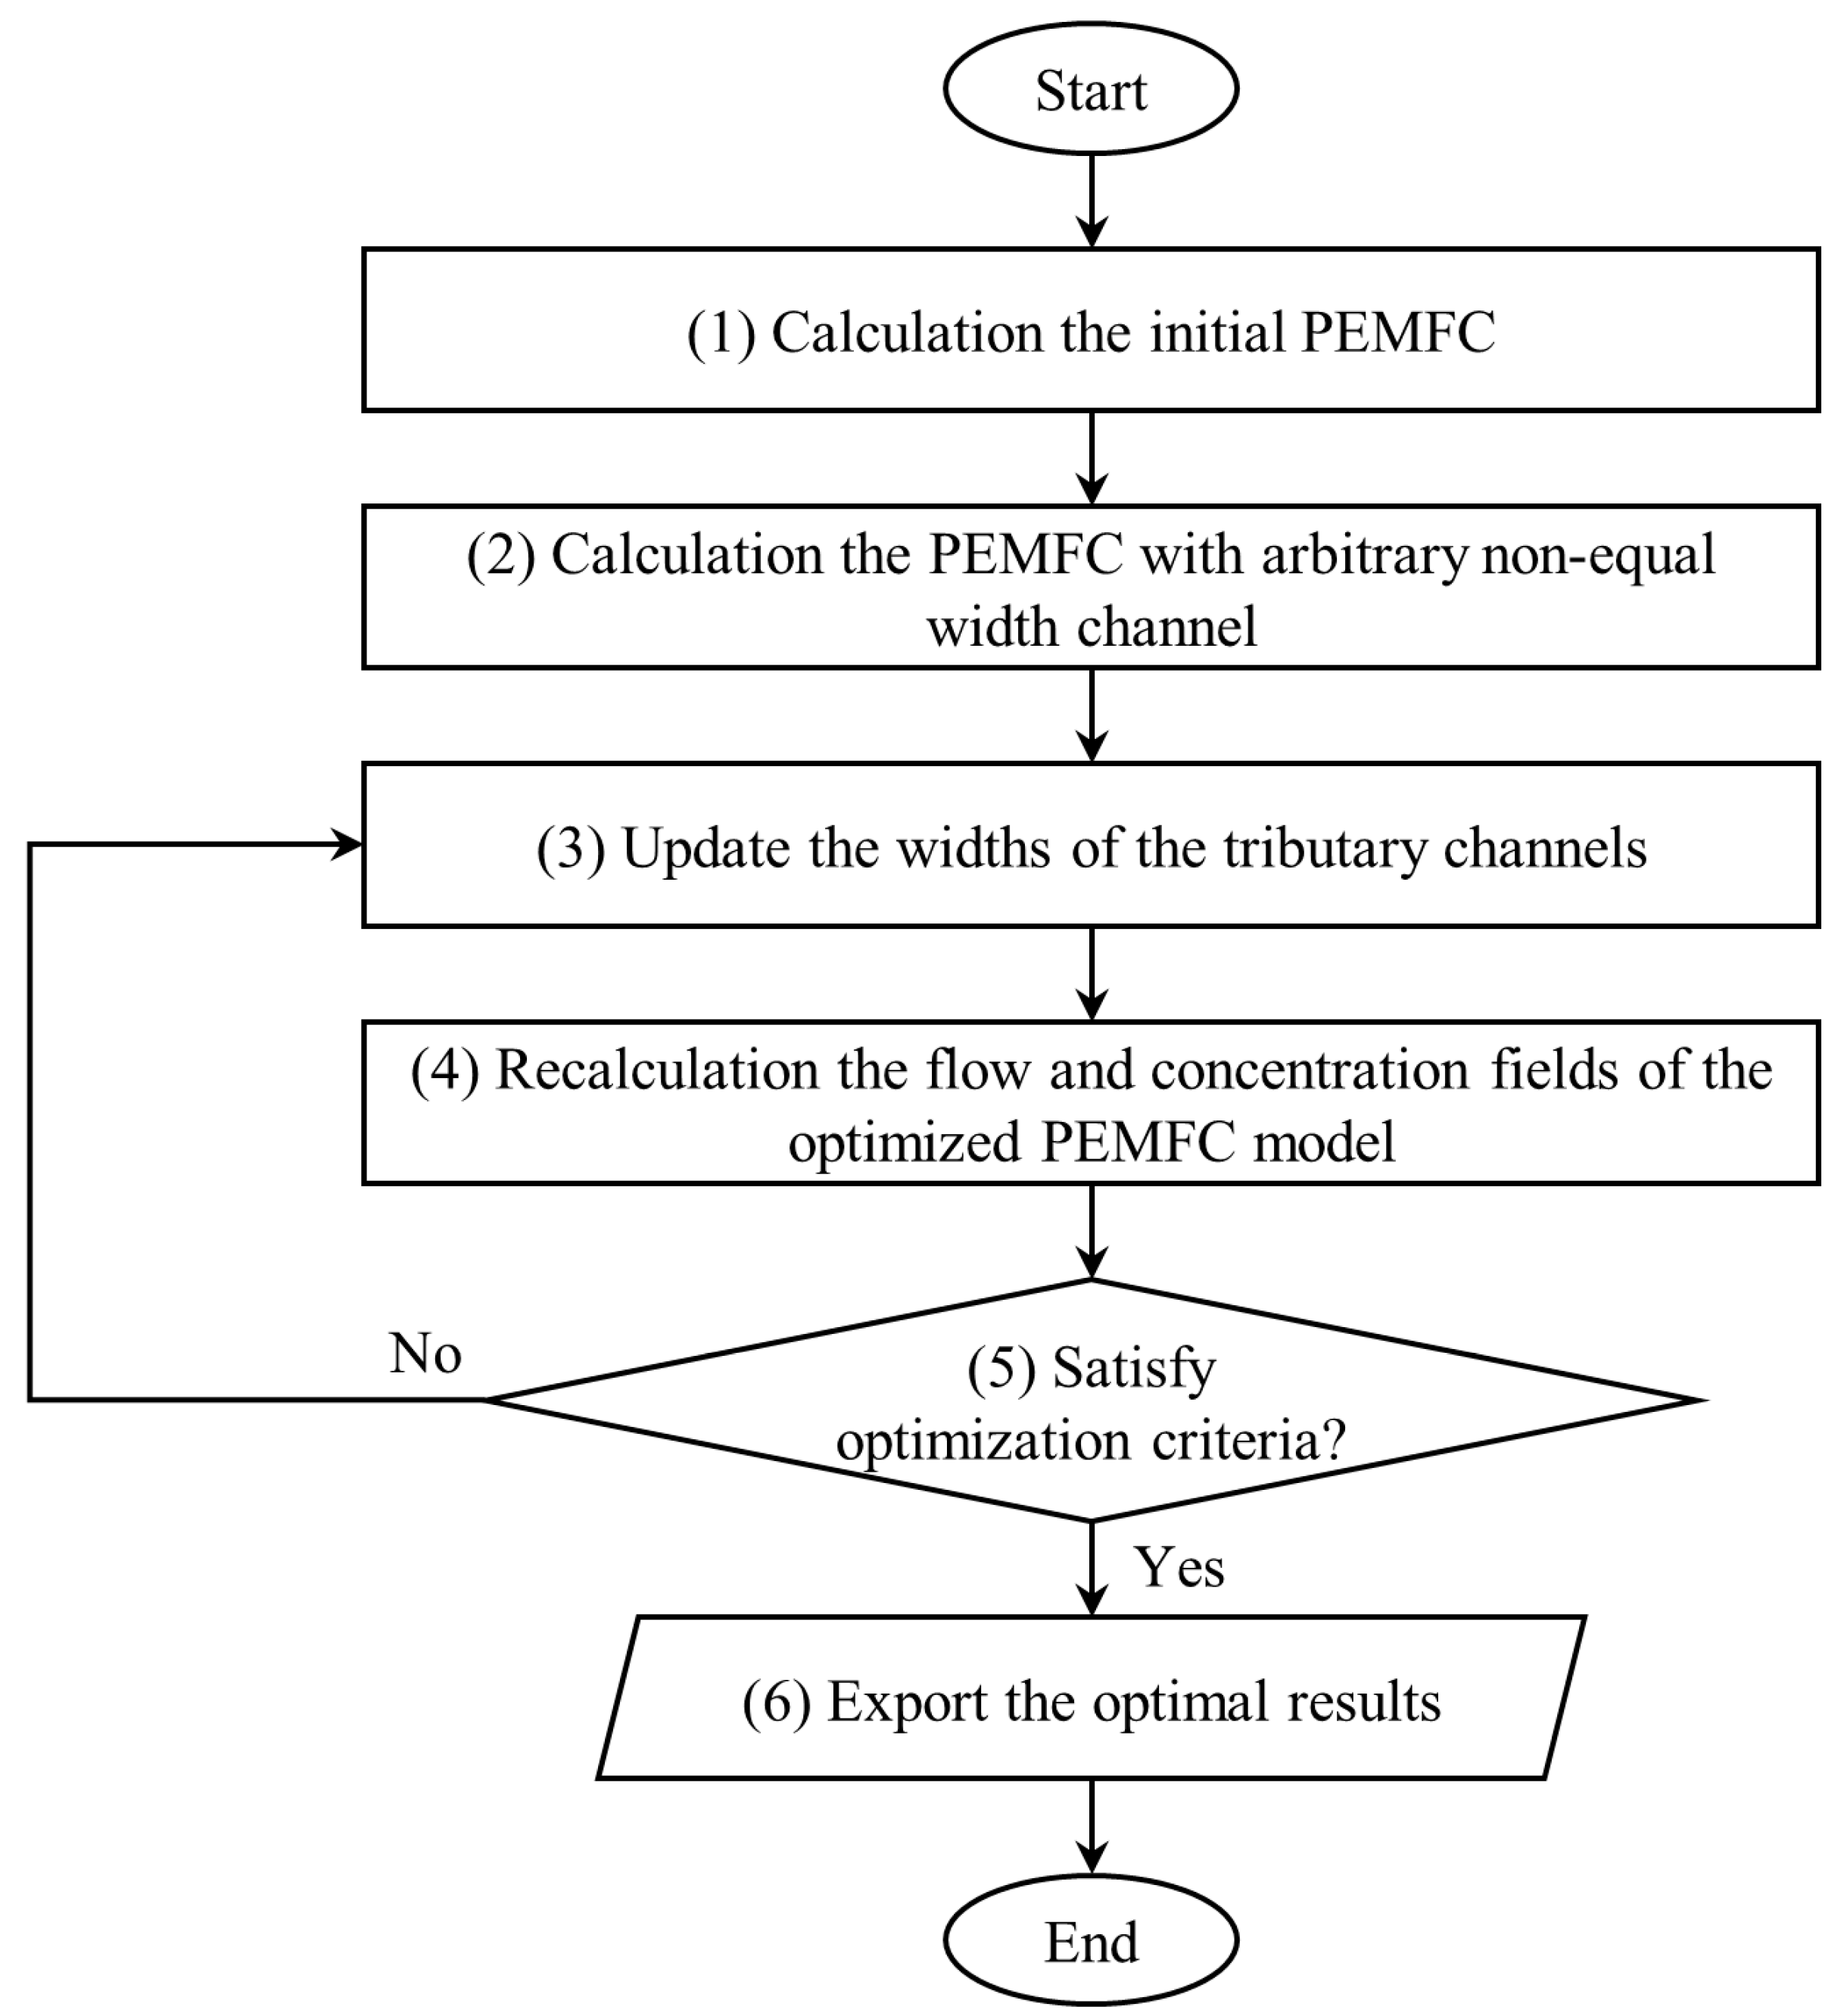
The optimization flow chart of the iterative approach employed in this paper is illustrated in Figure 4. Specifically, it includes the following steps:
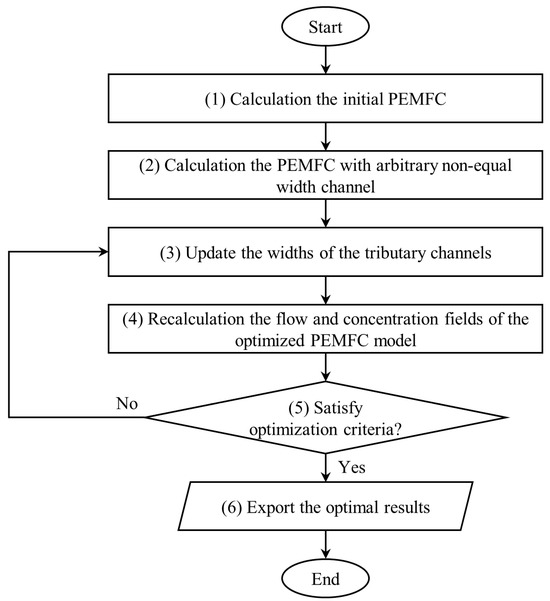
Figure 4.
A flow chart of the evolutionary algorithm based on CFD.
- (1)
- Calculate the PEMFC with equal-width flow channels, along with the operating conditions in the PEMFC add-on module of ANSYS Fluent.
- (2)
- Calculate the PEMFC with non-equal-width flow channels and obtain the corresponding flow and concentration fields.
- (3)
- Calculate the relaxation factor according to Equation (31). Update the widths of the tributary channels using Equation (30).
- (4)
- Recalculate the flow and concentration fields of the optimized PEMFC model with the updated tributary widths.
- (5)
- Determine the convergence condition of the evolutionary algorithm. If the tolerance is met, the evolutionary procedure ends. Otherwise, the algorithm reverts to Step 3 for another round of recursion.
- (6)
- Export the results of the optimal distribution of non-equal channel widths in the PEMFC.
3.2. The Effectiveness of Evolutionary Algorithms
For this CFD-based optimization algorithm, it is very important to choose a suitable optimization objective, and the following three are mainly applied in this study.
The most intuitive is to use the maximum power output:
Additionally, to quantitatively assess and compare the uniformity of the reactant concentration distribution, the inhomogeneity coefficient of the GDL, denoted as ωGDL, is defined as follows:
where A represents the cross-sectional area. A smaller ωs indicates a more uniform distribution of reactants across the cross-section. Additionally, the product of the velocity and the concentration gradient in a specific direction directly reflects the mass transfer capacity in that direction.
In addition, Shen et al. [40] introduced the effective mass transfer coefficient (EMTC) to quantify the mass transfer capacity of a PEMFC, and its expression is as follows:
where y and ν denote the oxygen diffusion direction and the oxygen velocity component in that direction, respectively. The larger the effective mass transfer coefficient, the stronger the reactive gas mass transfer ability and the better the cell’s performance.
When the output power reaches an extremum, we consider that the optimization result is achieved and the optimization algorithm stops. The following therefore holds:
To validate the efficacy of the evolutionary algorithm, Figure 5 depicts the variations in the maximum power density (Pmax), the inhomogeneity coefficient of the gas diffusion layer (ωGDL), and the effective mass transfer coefficient (EMTC) with respect to the number of iterations. The results reveal that, as the number of iterations increases, the maximum power density and the EMTC of the proton exchange membrane fuel cell (PEMFC) exhibit an upward trend, whereas the inhomogeneity coefficient shows a downward trend. This suggests that the evolutionary algorithm enables the PEMFC to achieve a more uniform reactant distribution, enhanced mass transfer capability, and higher output power. Based on the optimality principle established in the previous section, the model corresponding to the 7-th iteration is identified as the optimal model. When compared with the PEMFC featuring equal-width channels, the PEMFC with optimized-width channels demonstrates a 9.3% increase in the maximum output power, a 7.2% reduction in the inhomogeneity coefficient, and a 14.8% enhancement in the effective mass transfer coefficient.
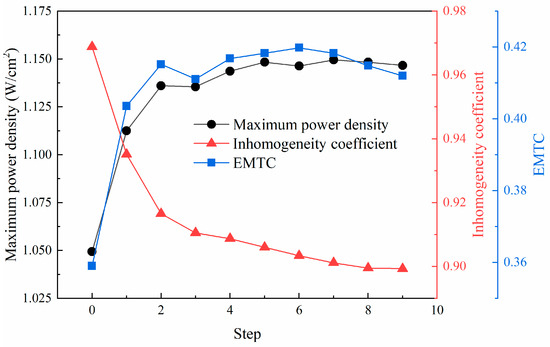
Figure 5.
Variation in Pmax, ωGDL and EMTCs with the number of iterations.
3.3. Analysis of Optimized Model
After obtaining the optimal non-equal-width channel distribution, we analyzed the performance before and after optimization. The polarization curves of the model with equal-width channels and the model with optimized channel widths are presented in Figure 6. The results indicate that, at low current densities, there is scarcely any difference in the output performance between the two models. Nevertheless, at medium to high current densities, the optimal distribution of channel widths leads to a remarkable improvement in the output performance of the PEMFC. Specifically, at a voltage of 0.3 V, the current density of the optimal model is 8.3% higher than that of the equal-width channel model.
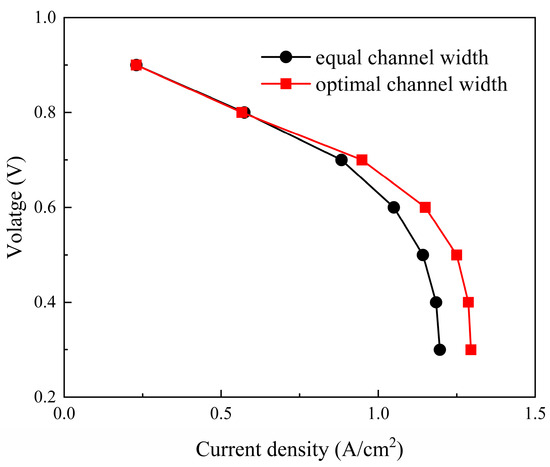
Figure 6.
Polarization curves of the PEMFC with equal and optimal channel widths.
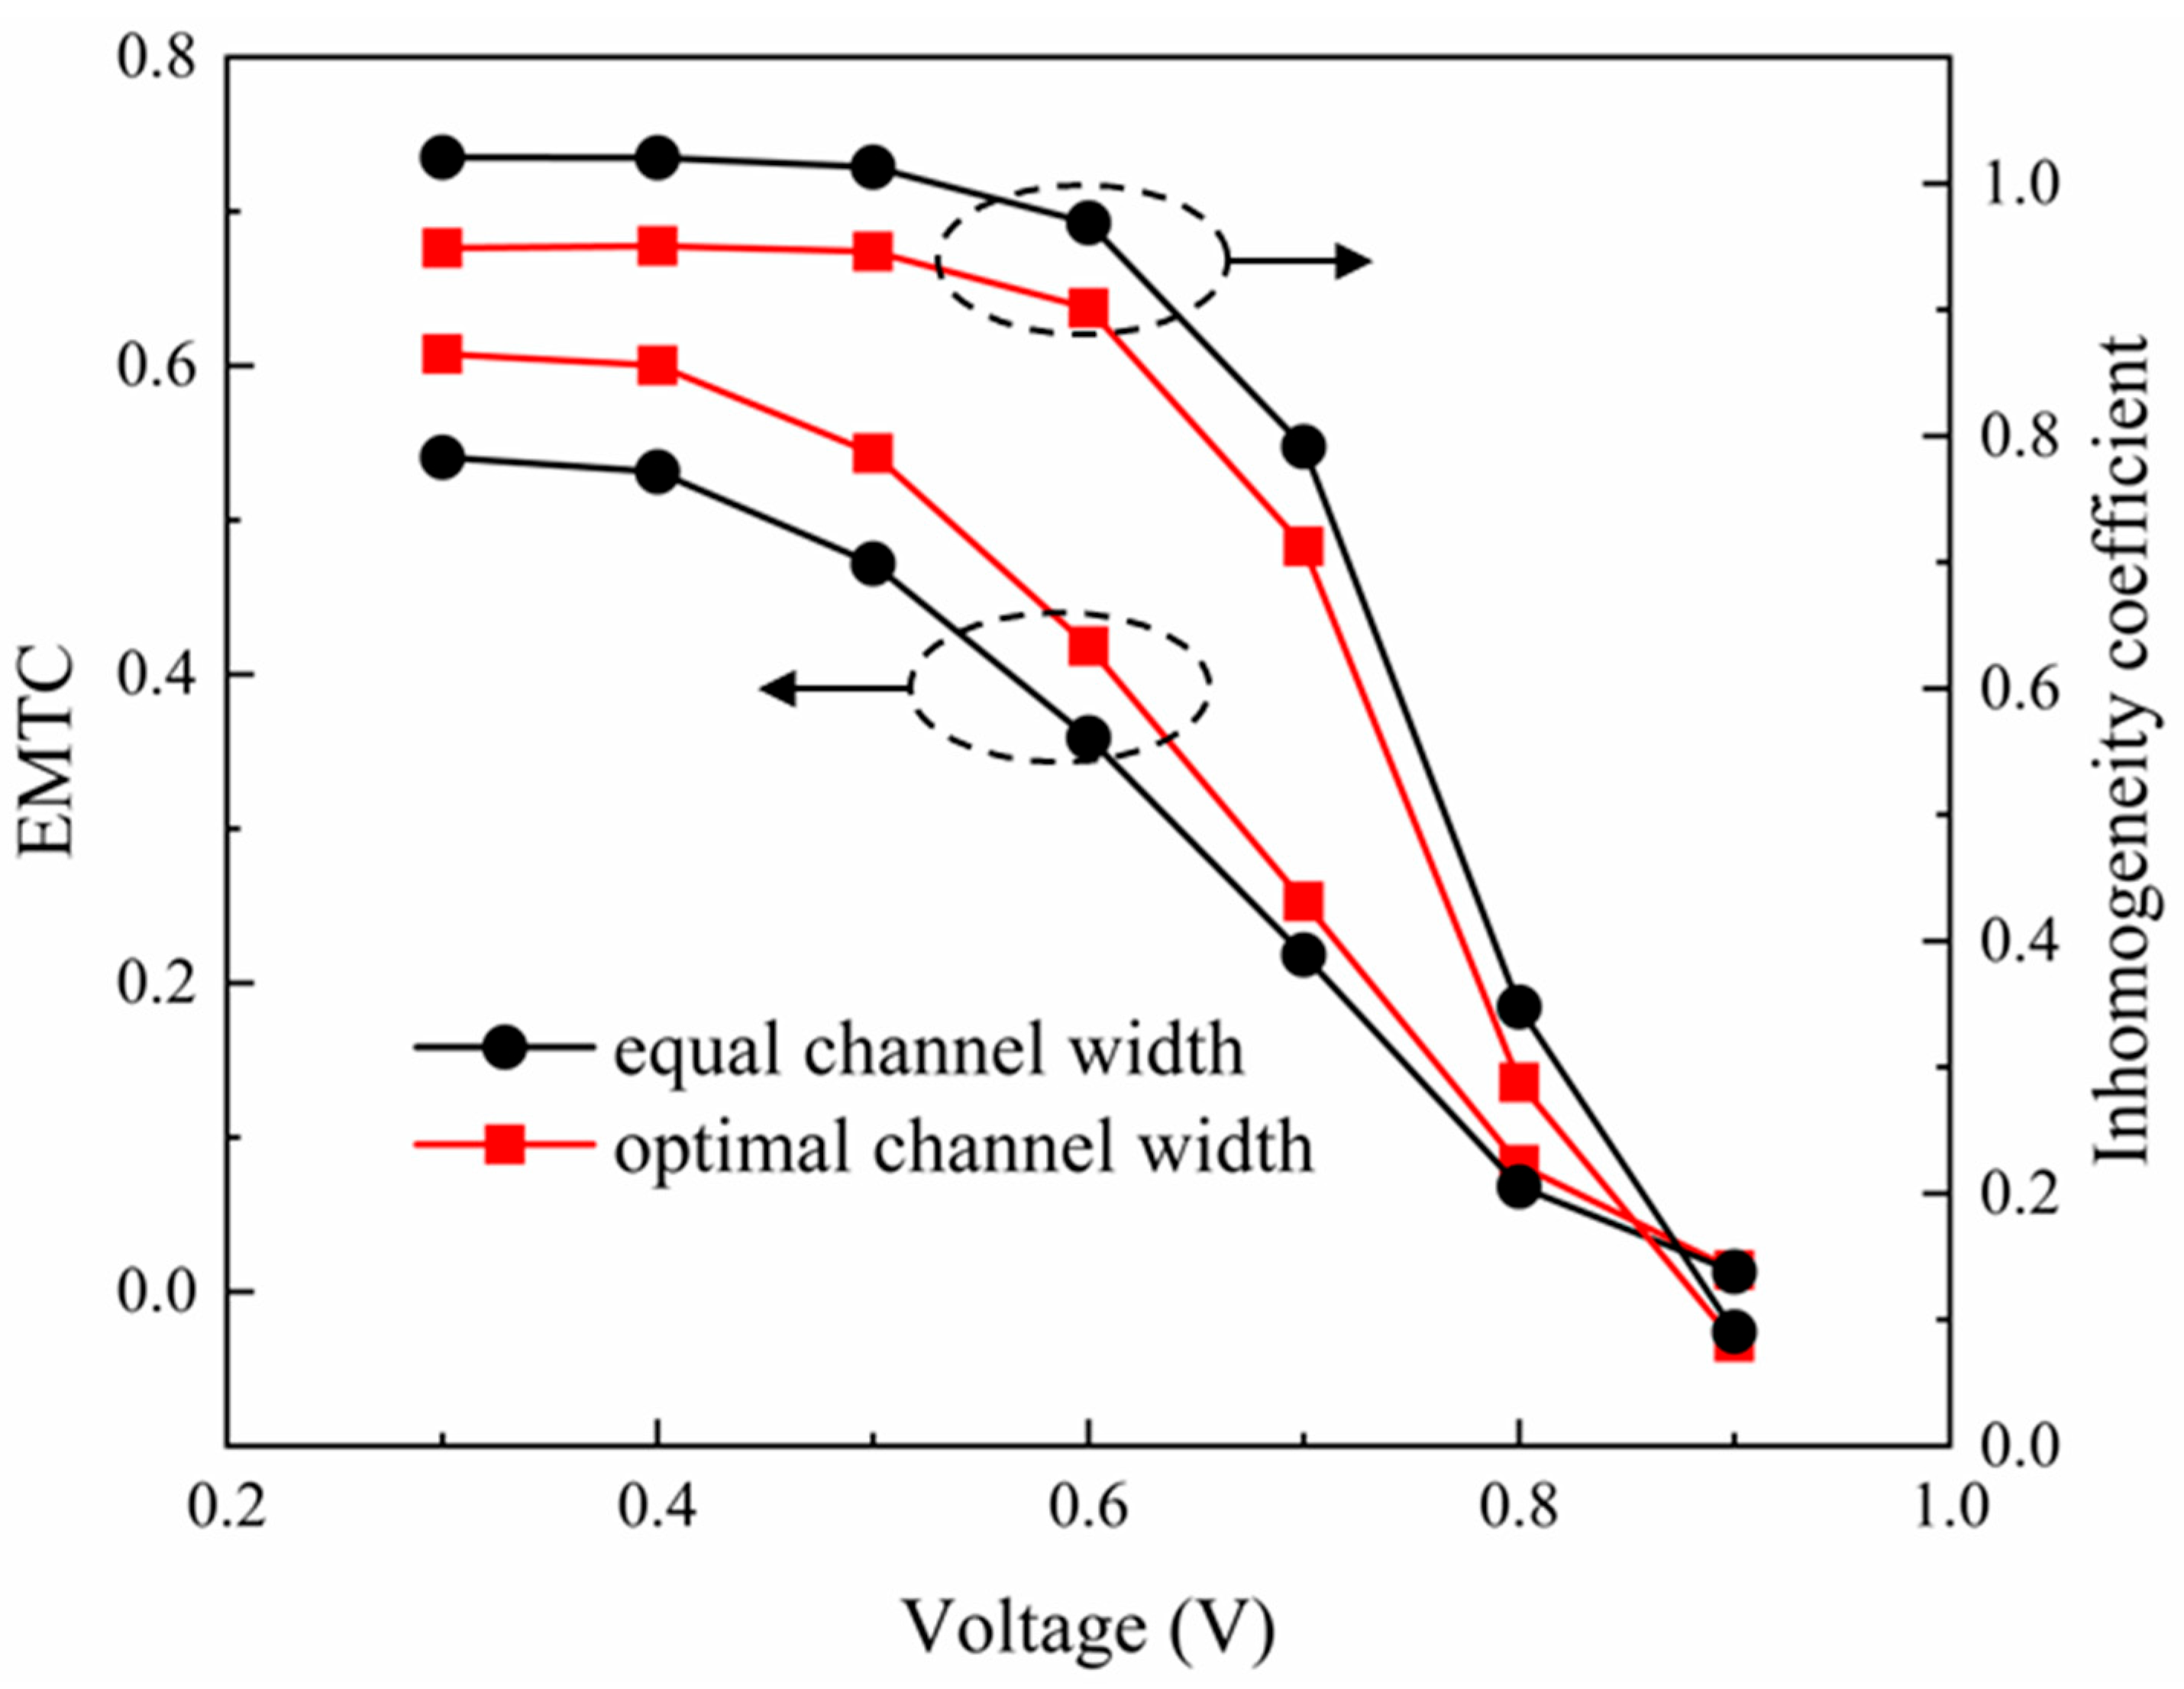
The curves of the inhomogeneity coefficient and the EMTC at various current densities are shown in Figure 7. From the graph, it can be observed that, at low and medium voltages, the EMTC of the optimal model is significantly higher, and the inhomogeneity coefficients are notably lower compared to those of the equal-width channel model. This suggests that the optimization of the channel widths substantially enhances the mass transfer capability of the PEMFC, improves the uniformity of the reactant distribution, and ultimately boosts the output performance.
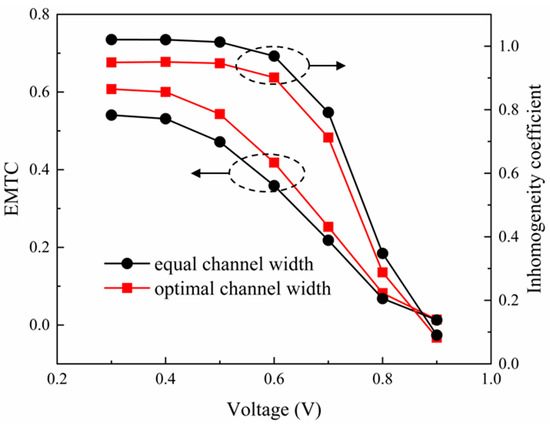
Figure 7.
EMTC and ωGDL versus cell voltage.
Figure 8 shows the optimal distribution of channel widths and the comparison with equal-width channels. It can be observed that the tributary channels near the reactant inlet section are relatively wide, while the widths of the last five tributary channels are significantly reduced. Notably, the optimized non-equal flow channels are not symmetric. This asymmetric design arises because the pressure drops and reactant concentration at the main inlet side are relatively large. As the reactant flows along the main channel direction, its concentration gradually decreases, leading to insufficient reactant supply to the downstream channels. Consequently, the reaction area required for these downstream channels is correspondingly reduced. In accordance with the established optimization principle, the allocated flow channel widths for these sections are therefore adjusted to be narrower.
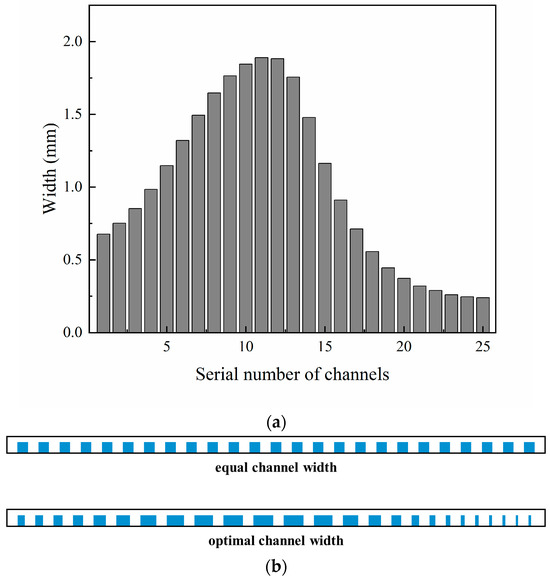
Figure 8.
The channel width distribution of the optimized model: (a) the widths of each tributary flow channel; (b) the comparison of the equal-width channel and the optimal channel.
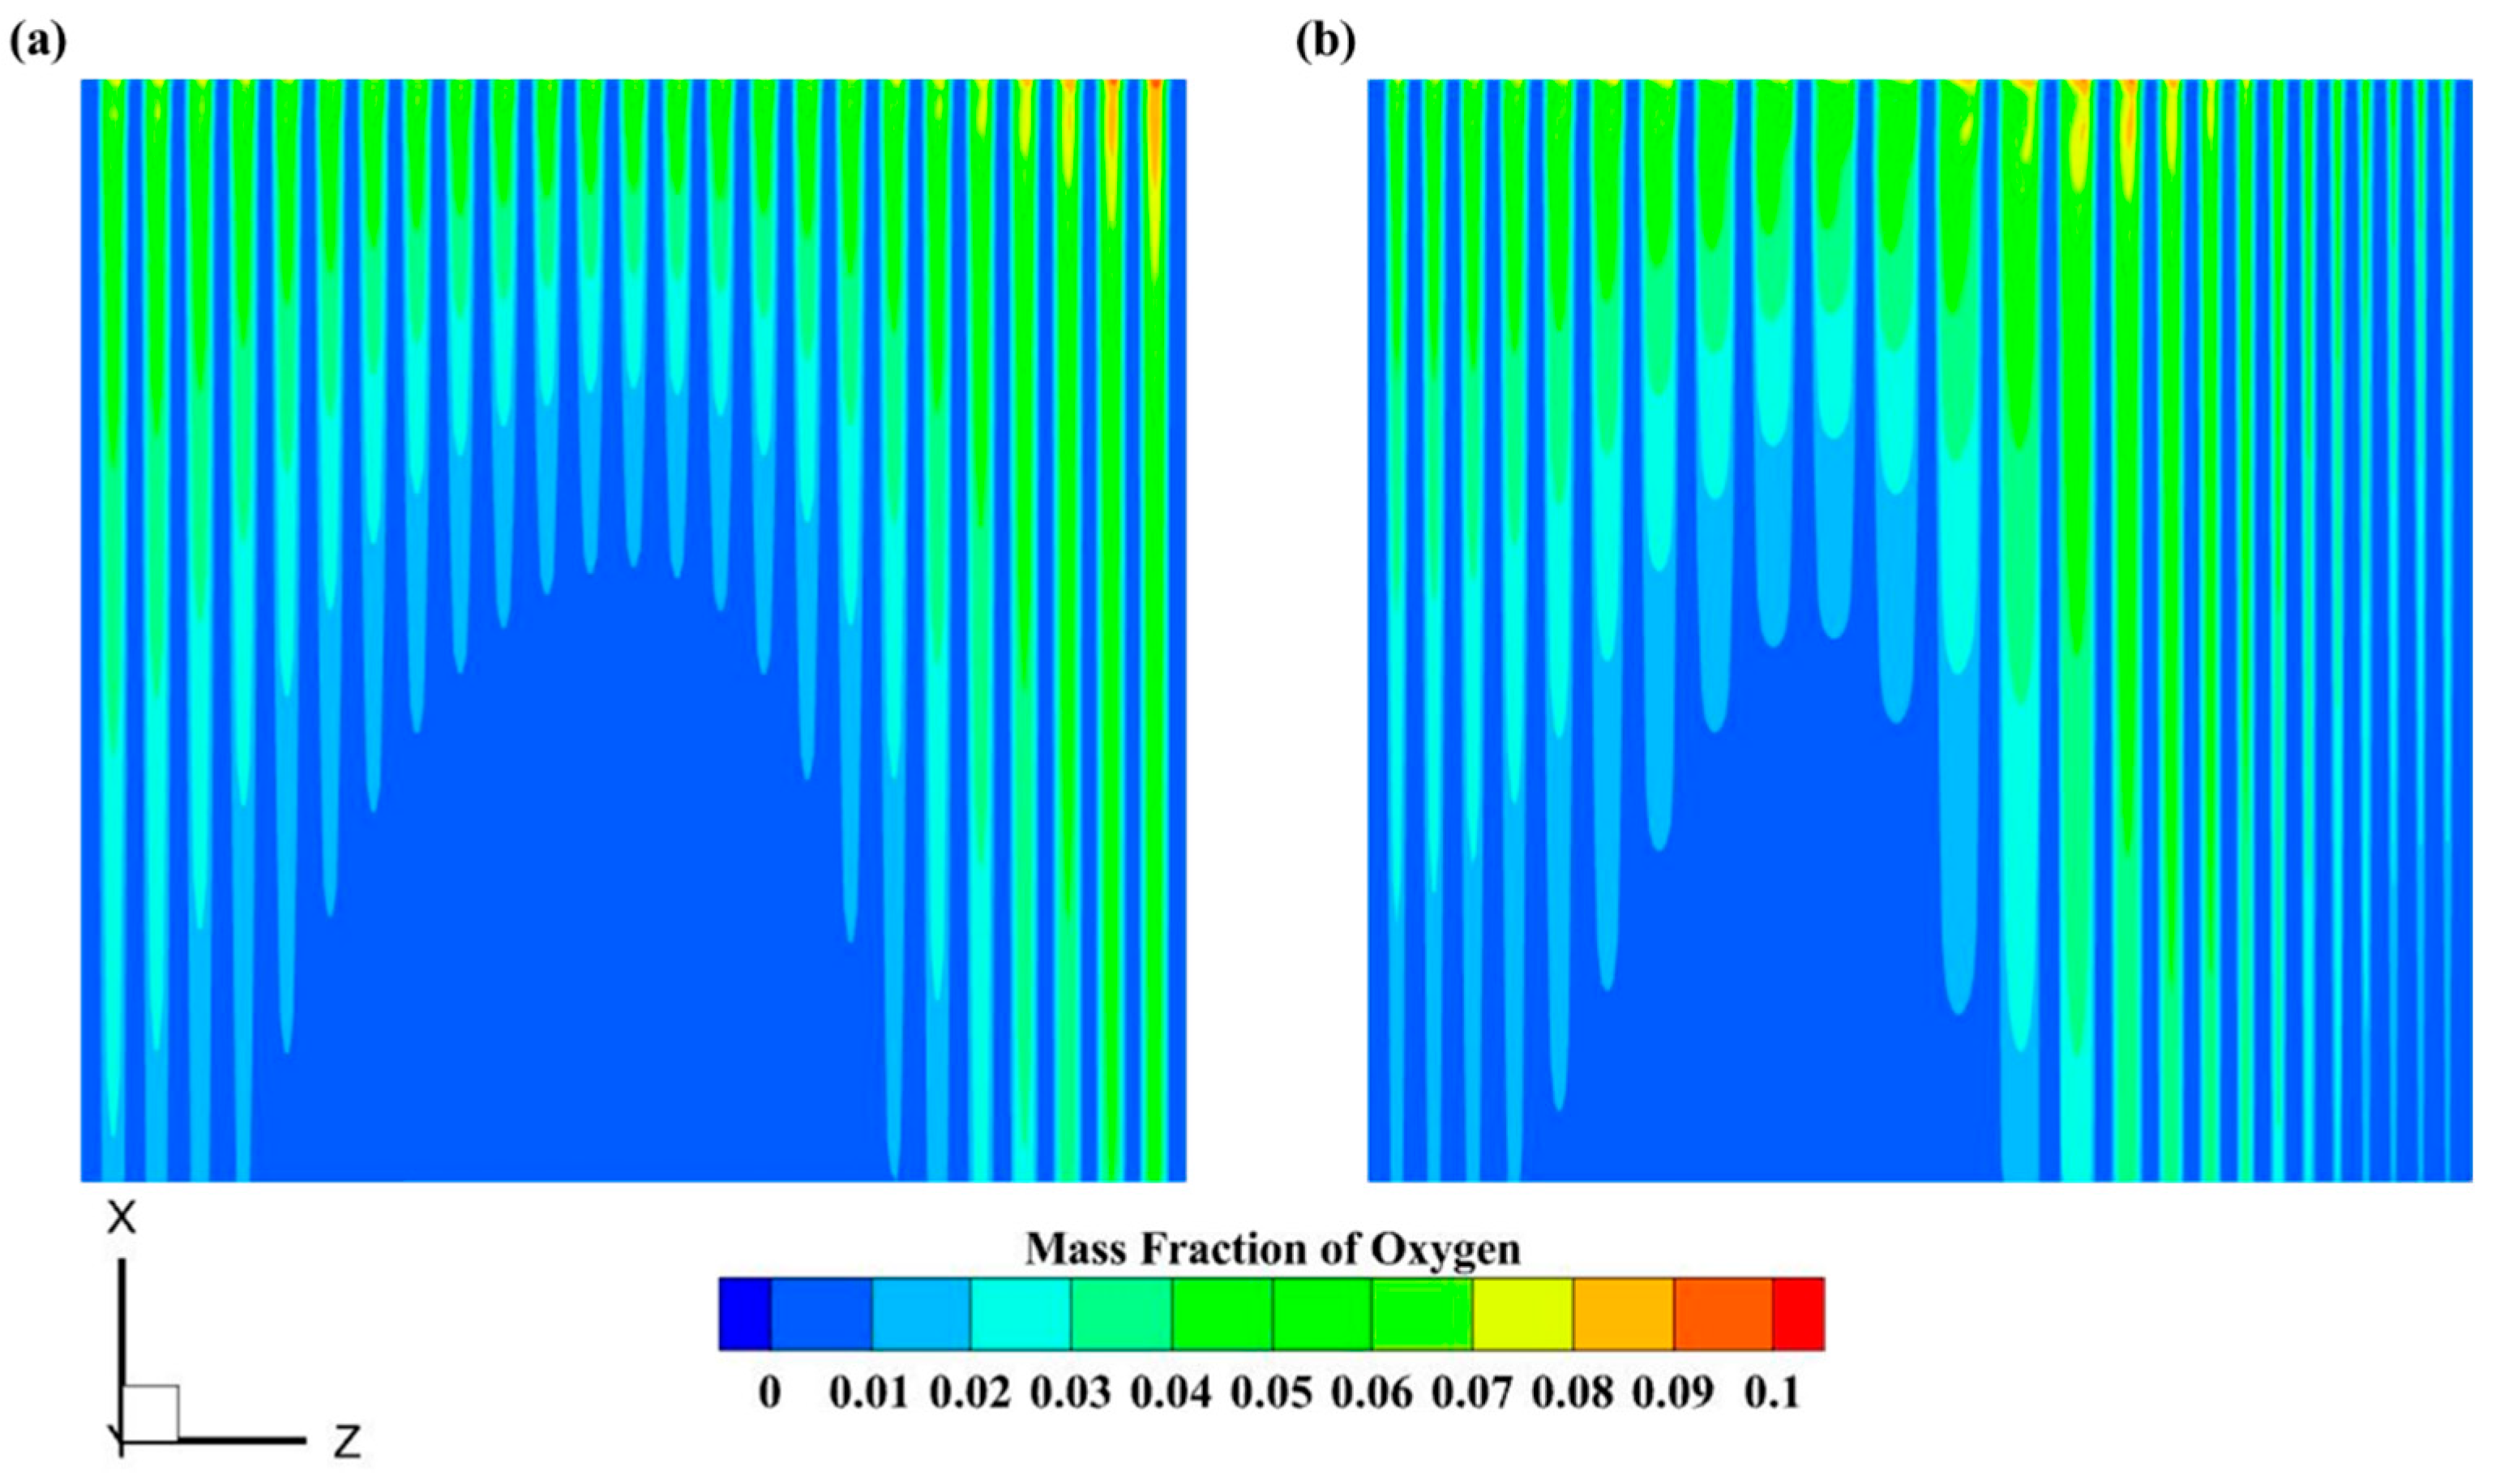
Meanwhile, Figure 9 depicts the mass fraction of oxygen at the intersection of the cathode diffusion layer and flow channels at a voltage of 0.3 V. In the optimal model, the width distribution of the flow channels exhibits a pattern of being wider in the middle and narrower on both sides. This phenomenon can be attributed to the large areas with low oxygen content at the ends of the middle flow channels. Therefore, widening the middle flow channels is necessary to enhance oxygen delivery. By widening the middle flow channels, the optimal model significantly reduces the area of the original low-oxygen regions. Although the low-oxygen regions on both sides are slightly enlarged, the overall mass transfer capacity and the uniformity of reactant distribution are improved, consequently leading to an enhancement in the output performance. Figure 10 shows the current density distributions of the catalyst layer before and after optimization at a voltage of 0.3 V, respectively. It is evident that the local current density is higher in regions with high oxygen content and lower in regions with low oxygen content. Moreover, the overall current density of the optimal model is higher than that of the equal-width channel model. This indicates that enhancing the oxygen transfer capability is an effective approach to improving the output performance of the PEMFC.

Figure 9.
The oxygen distribution at 0.3 V of the (a) equal-channel-width model and (b) the optimal model.
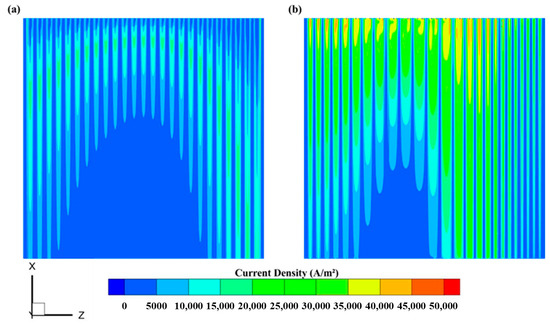
Figure 10.
The current density at 0.3 V of the (a) equal-channel-width model and (b) the optimal model.
4. Coupled Optimization of the GDL Porosity
When a PEMFC operates at high current densities, the primary contributor to irreversible losses is concentration polarization, which stems from inadequate mass transfer capacity. Employing a cathode diffusion layer with a gradient porosity is an effective strategy to enhance oxygen transport and thereby improve the cell performance. Therefore, the superimposed effect of the gradient porosity in the direction of the thickness of the cathode gas diffusion layer on the optimization was investigated for both the PEMFC with equal-width channels and the one with the optimized channel widths obtained previously.
4.1. Optimization Strategy for GDL Porosity
To guarantee the requisite structural strength and maintain a constant mass of the cathode GDL, the average porosity of the GDL is set as a constant throughout this optimization process.
where ε0 denotes the average porosity of the cathode GDL.
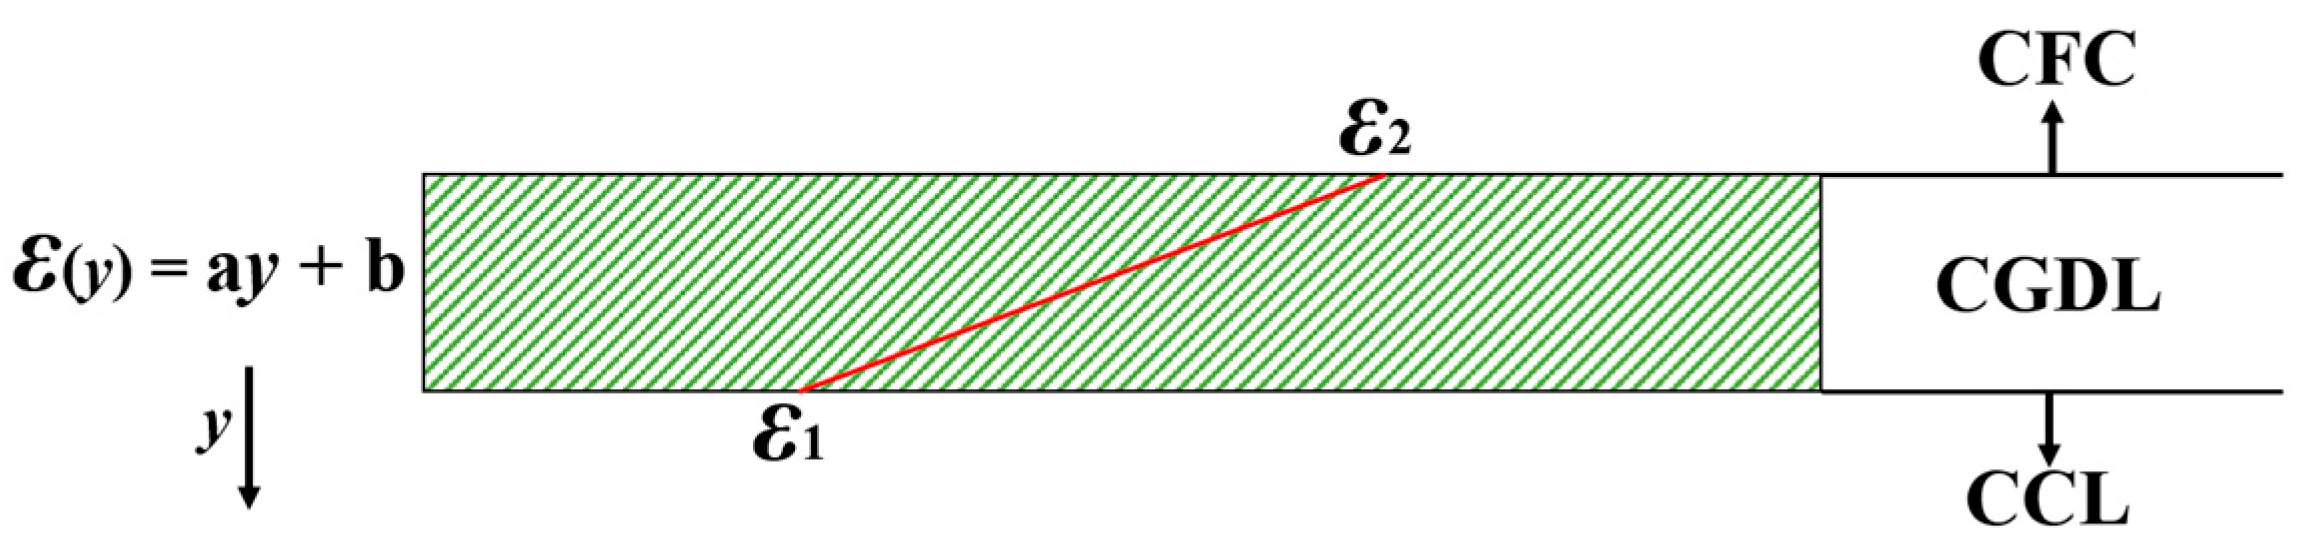
To simplify the model, it is assumed that the porosity of the CGDL varies linearly and continuously. The porosity distribution of the CGDL is presented in Figure 11, where ε1 represents the porosity at the interface between the CGDL and the cathode catalyst layer (CCL), and ε2 denotes the porosity at the intersection of the CGDL with the cathode flow channels (CFC) and the bipolar plate. The porosity schemes employed in this study are shown in Table 3. Specifically, AN (where N = 0, 1, 2, 3) cases all pertain to the models with equal-width channels, while BN cases correspond to the models with optimized channel widths.
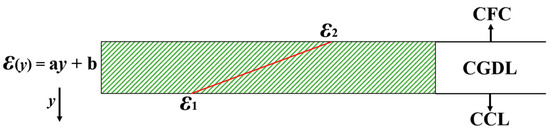
Figure 11.
A schematic diagram of the gradient porosity distribution of the CGDL.
Table 3.
CGDL porosity distribution scheme.
4.2. Results and Discussion
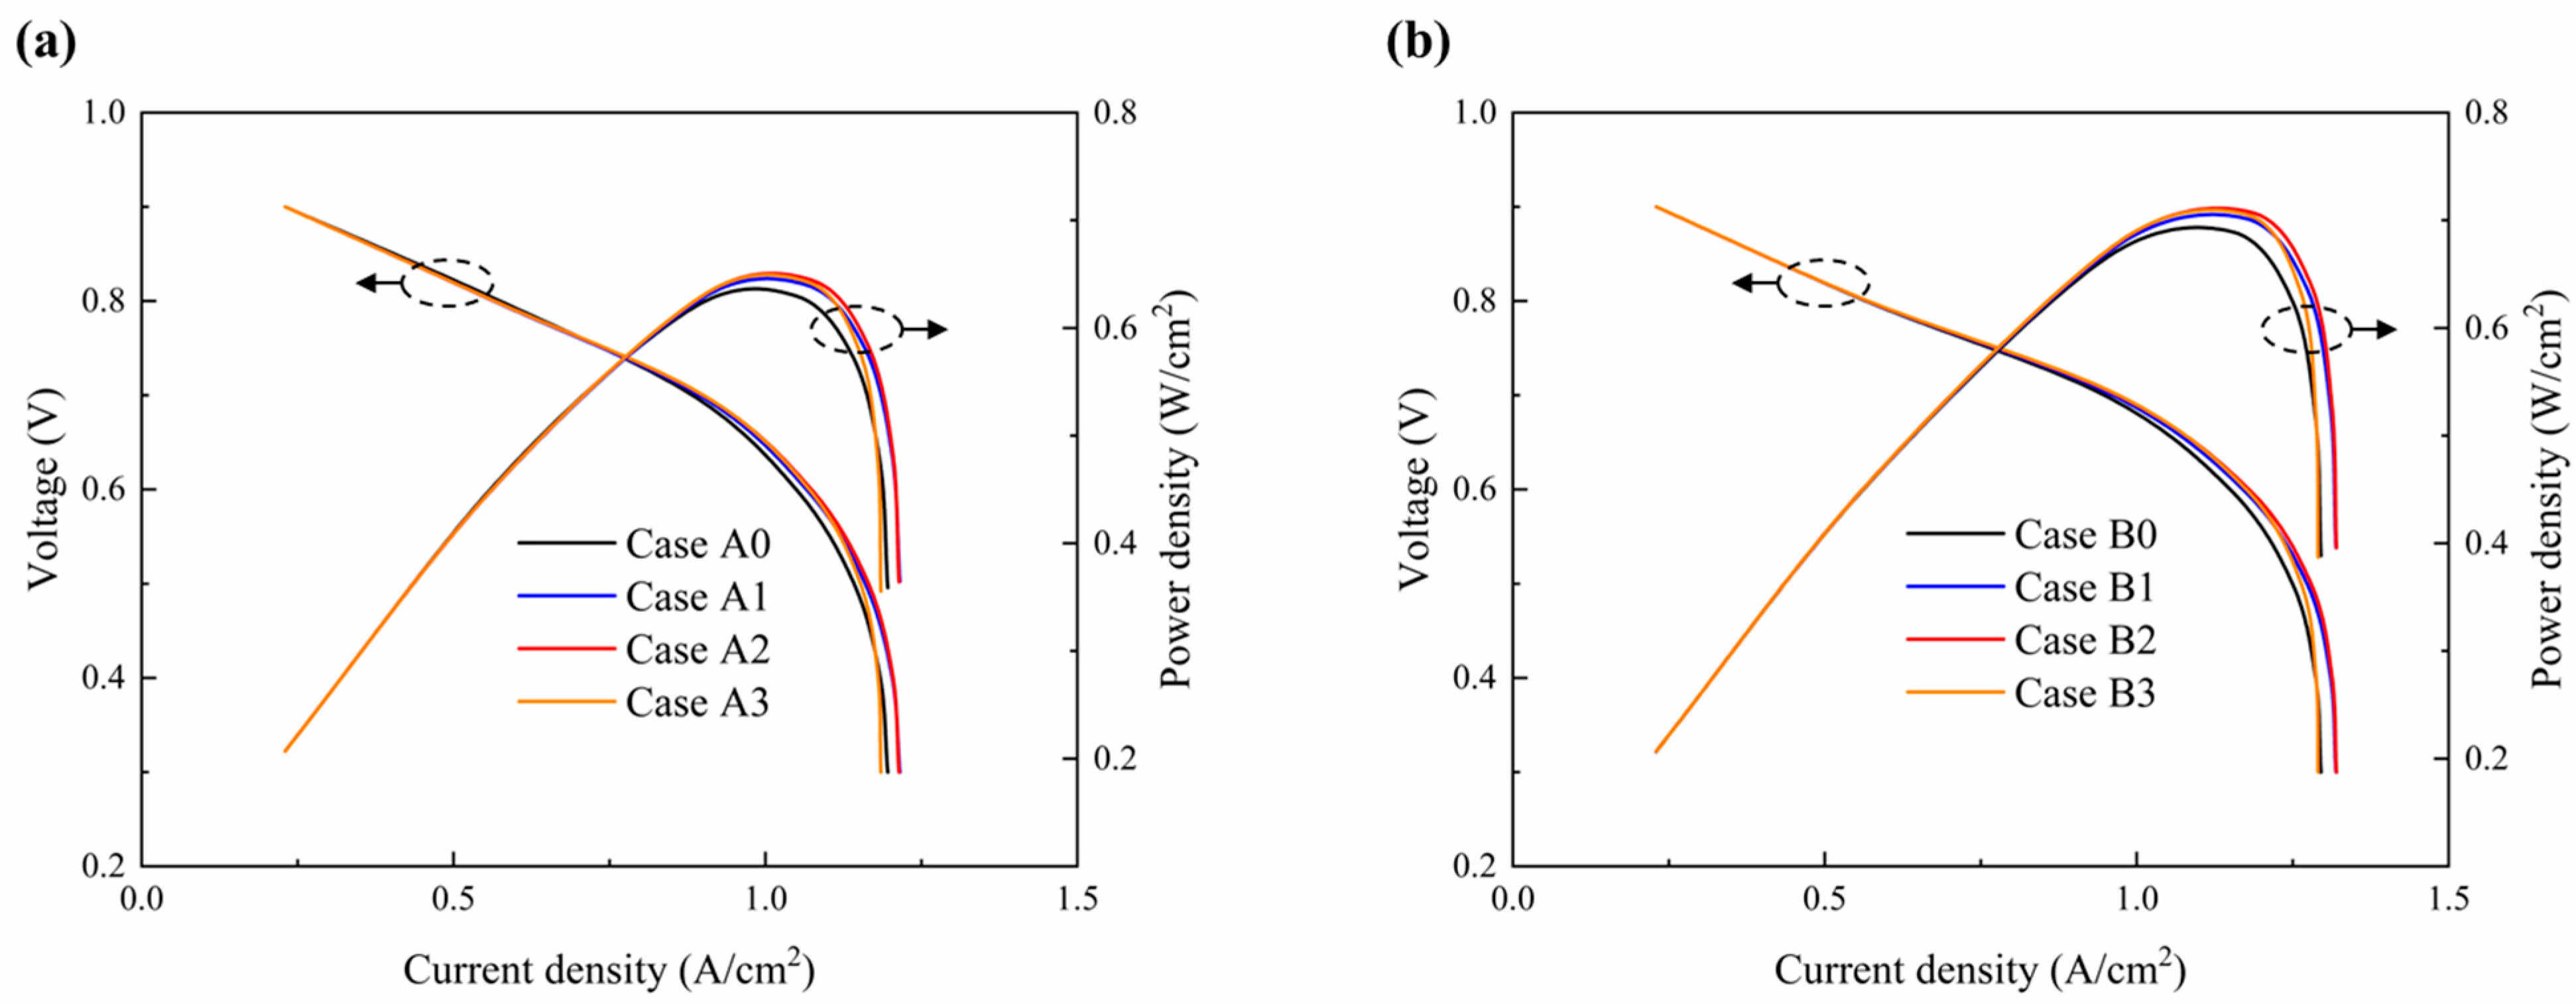
Figure 12 depicts the polarization curves and power density curves for the two flow channel models with different porosity gradients. From these curves, it can be discerned that an appropriate porosity gradient of the CGDL for both models can result in a certain enhancement of the cell maximum power density and can limit current density. Moreover, it is well established that the principle of designing the CGDL’s gradient porosity is to adopt a high porosity on the cathode flow channel (CFC) side and a low porosity on the cathode catalyst layer (CCL) side. This configuration facilitates the diffusion of liquid water, generated by the electrochemical reaction of the CCL, into the CFC. However, an excessively large porosity gradient also leads to reduced conductivity and oxygen concentration. The optimal porosity for both models is found to be (ε1, ε2)=(0.3, 0.7). Compared with the models with uniform porosities, the maximum power density and current density of the equal-width channel model increase by 2.3% and 1.7%, respectively, while those of the optimized channel model increase by 2.6% and 2.3%, respectively. When compared with the equal-width channel model with uniform porosity, the optimal model with gradient porosity exhibits a 12.4% higher maximum power density and a 10.4% higher limiting current density.
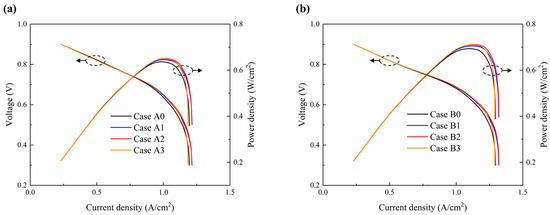
Figure 12.
Polarization curves and power density curves at different porosity gradients for (a) case AN and (b) case BN.
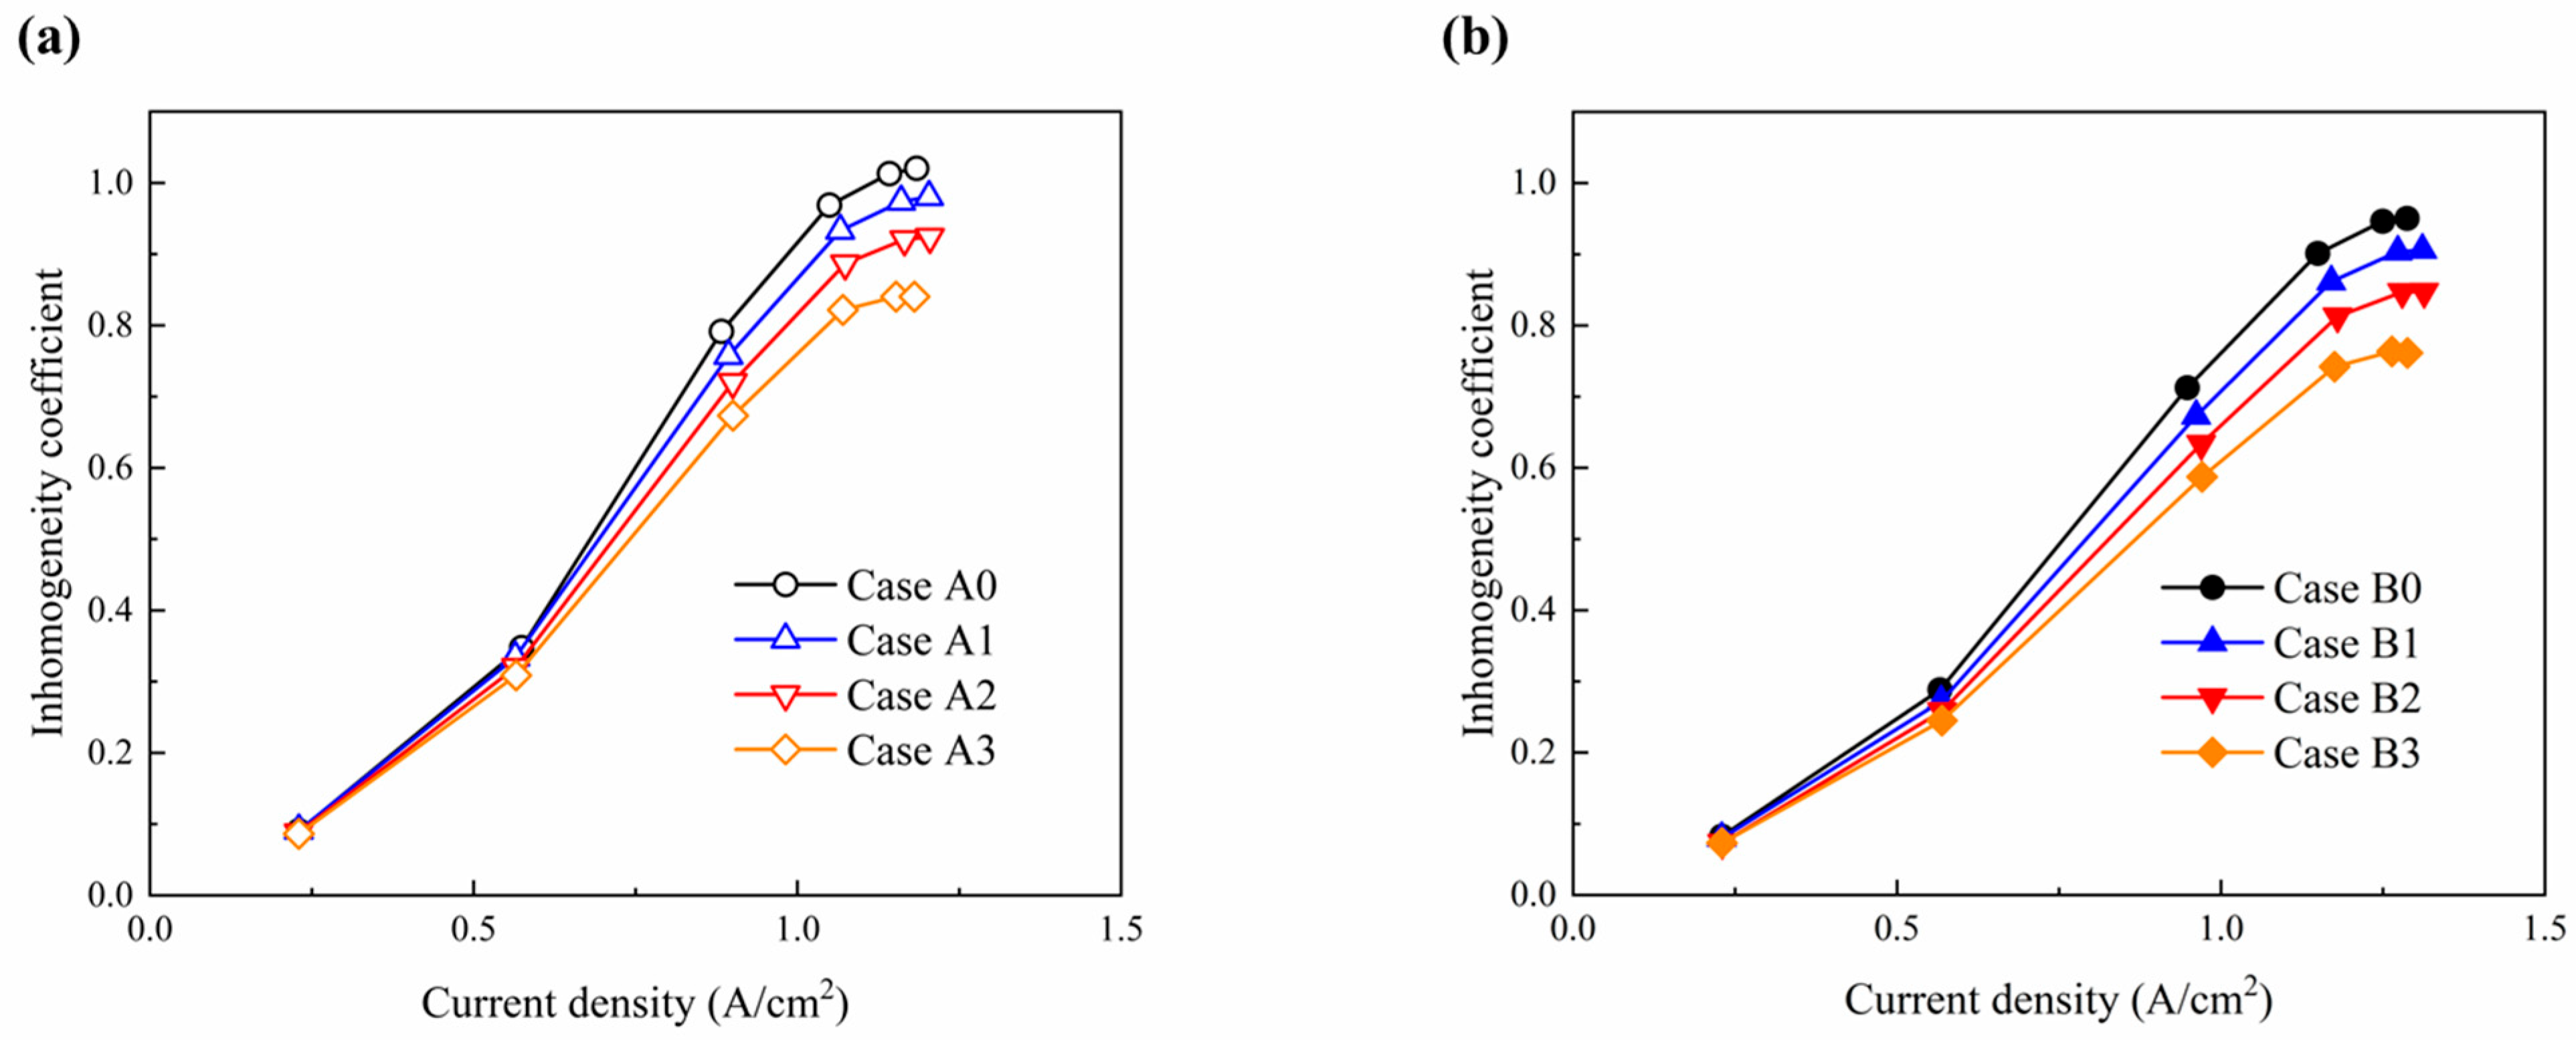
Figure 13 presents the inhomogeneity coefficient curves of oxygen at the CGDL-CFC intersections for different gradient porosities. The results indicate that as the current density increases, the oxygen consumption gradually rises, leading to a progressive increase in the inhomogeneity of oxygen distribution. At the same current density, the inhomogeneity coefficient of oxygen distribution gradually decreases as the porosity gradient increases. That is, a larger porosity gradient can achieve a more uniform oxygen distribution, and vice versa. However, the best uniformity of reactant distribution does not necessarily correspond to the best cell output performance. Therefore, in practical applications, the combined effects of both factors should be taken into account fully. Additionally, the gradient porosity has almost no impact on the performance of the PEMFC at low current densities. This verifies that the polarization losses of the cell at low current densities are primarily caused by activation polarization and ohmic polarization rather than concentration polarization.
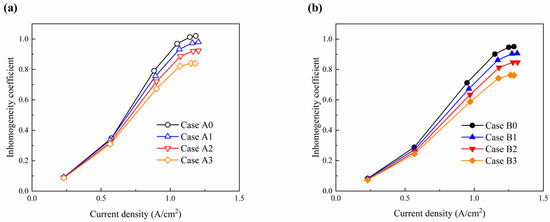
Figure 13.
Inhomogeneity coefficient at different porosity gradients for (a) case AN and (b) case BN.
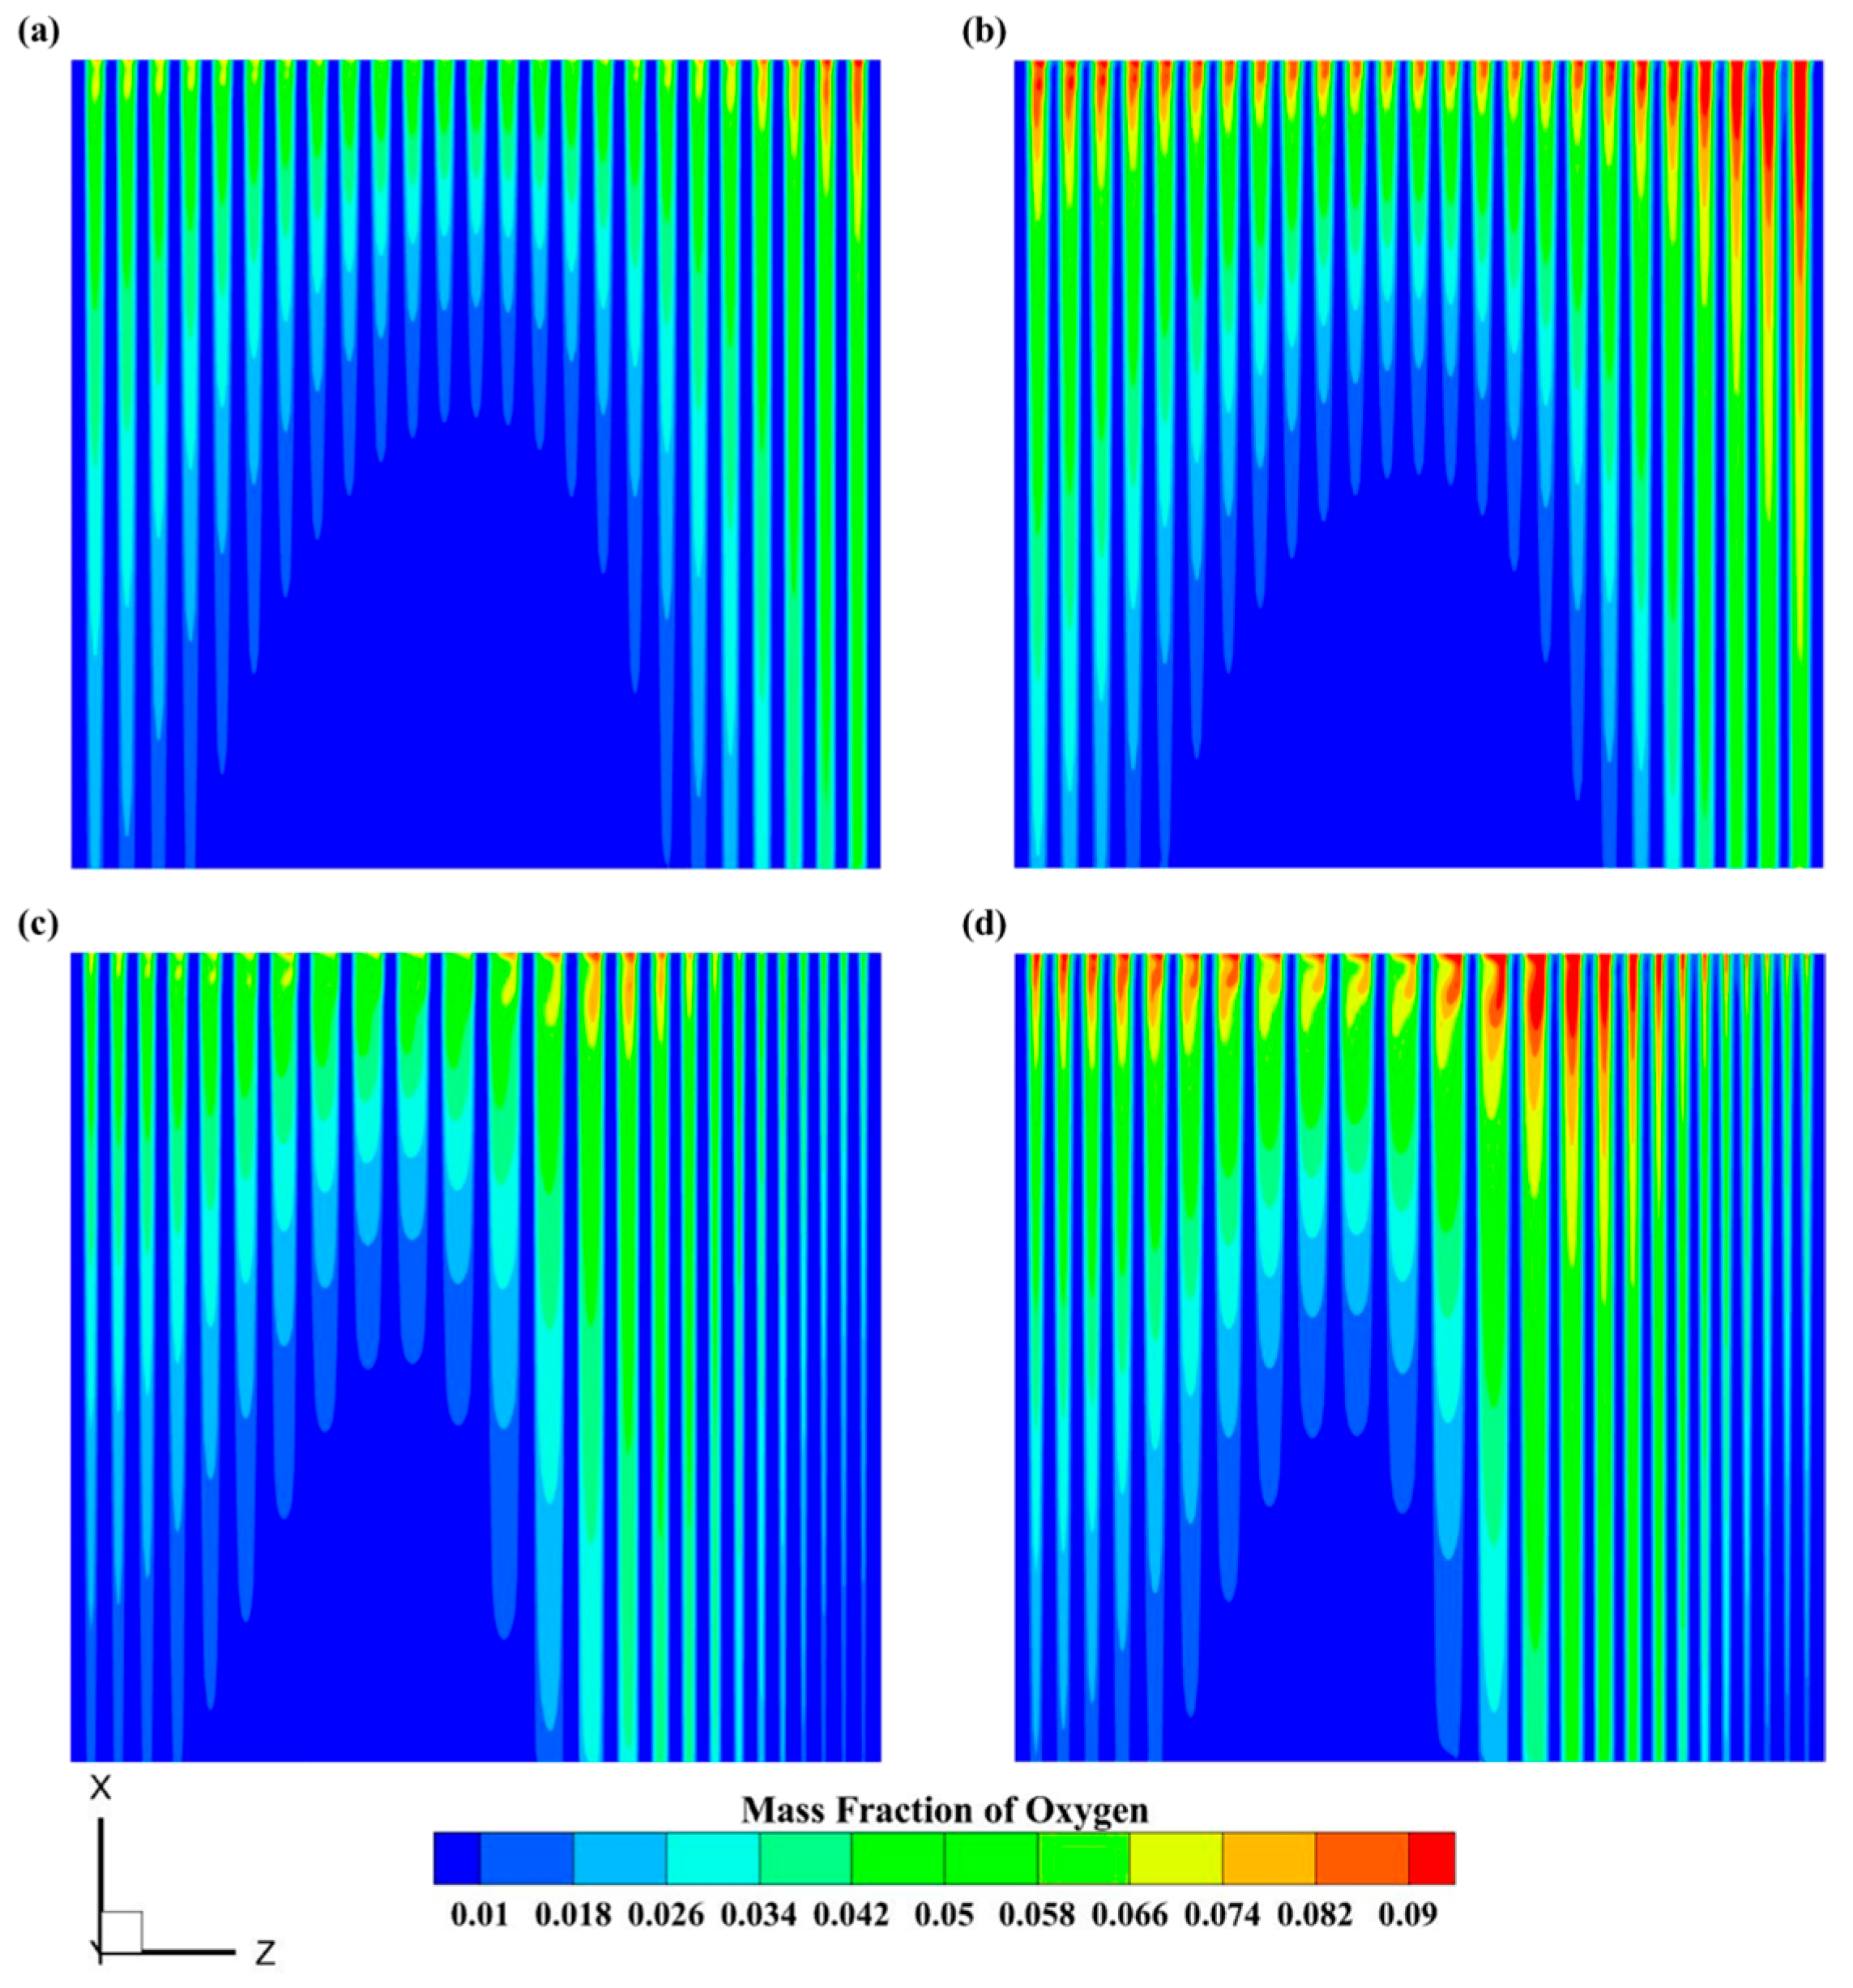
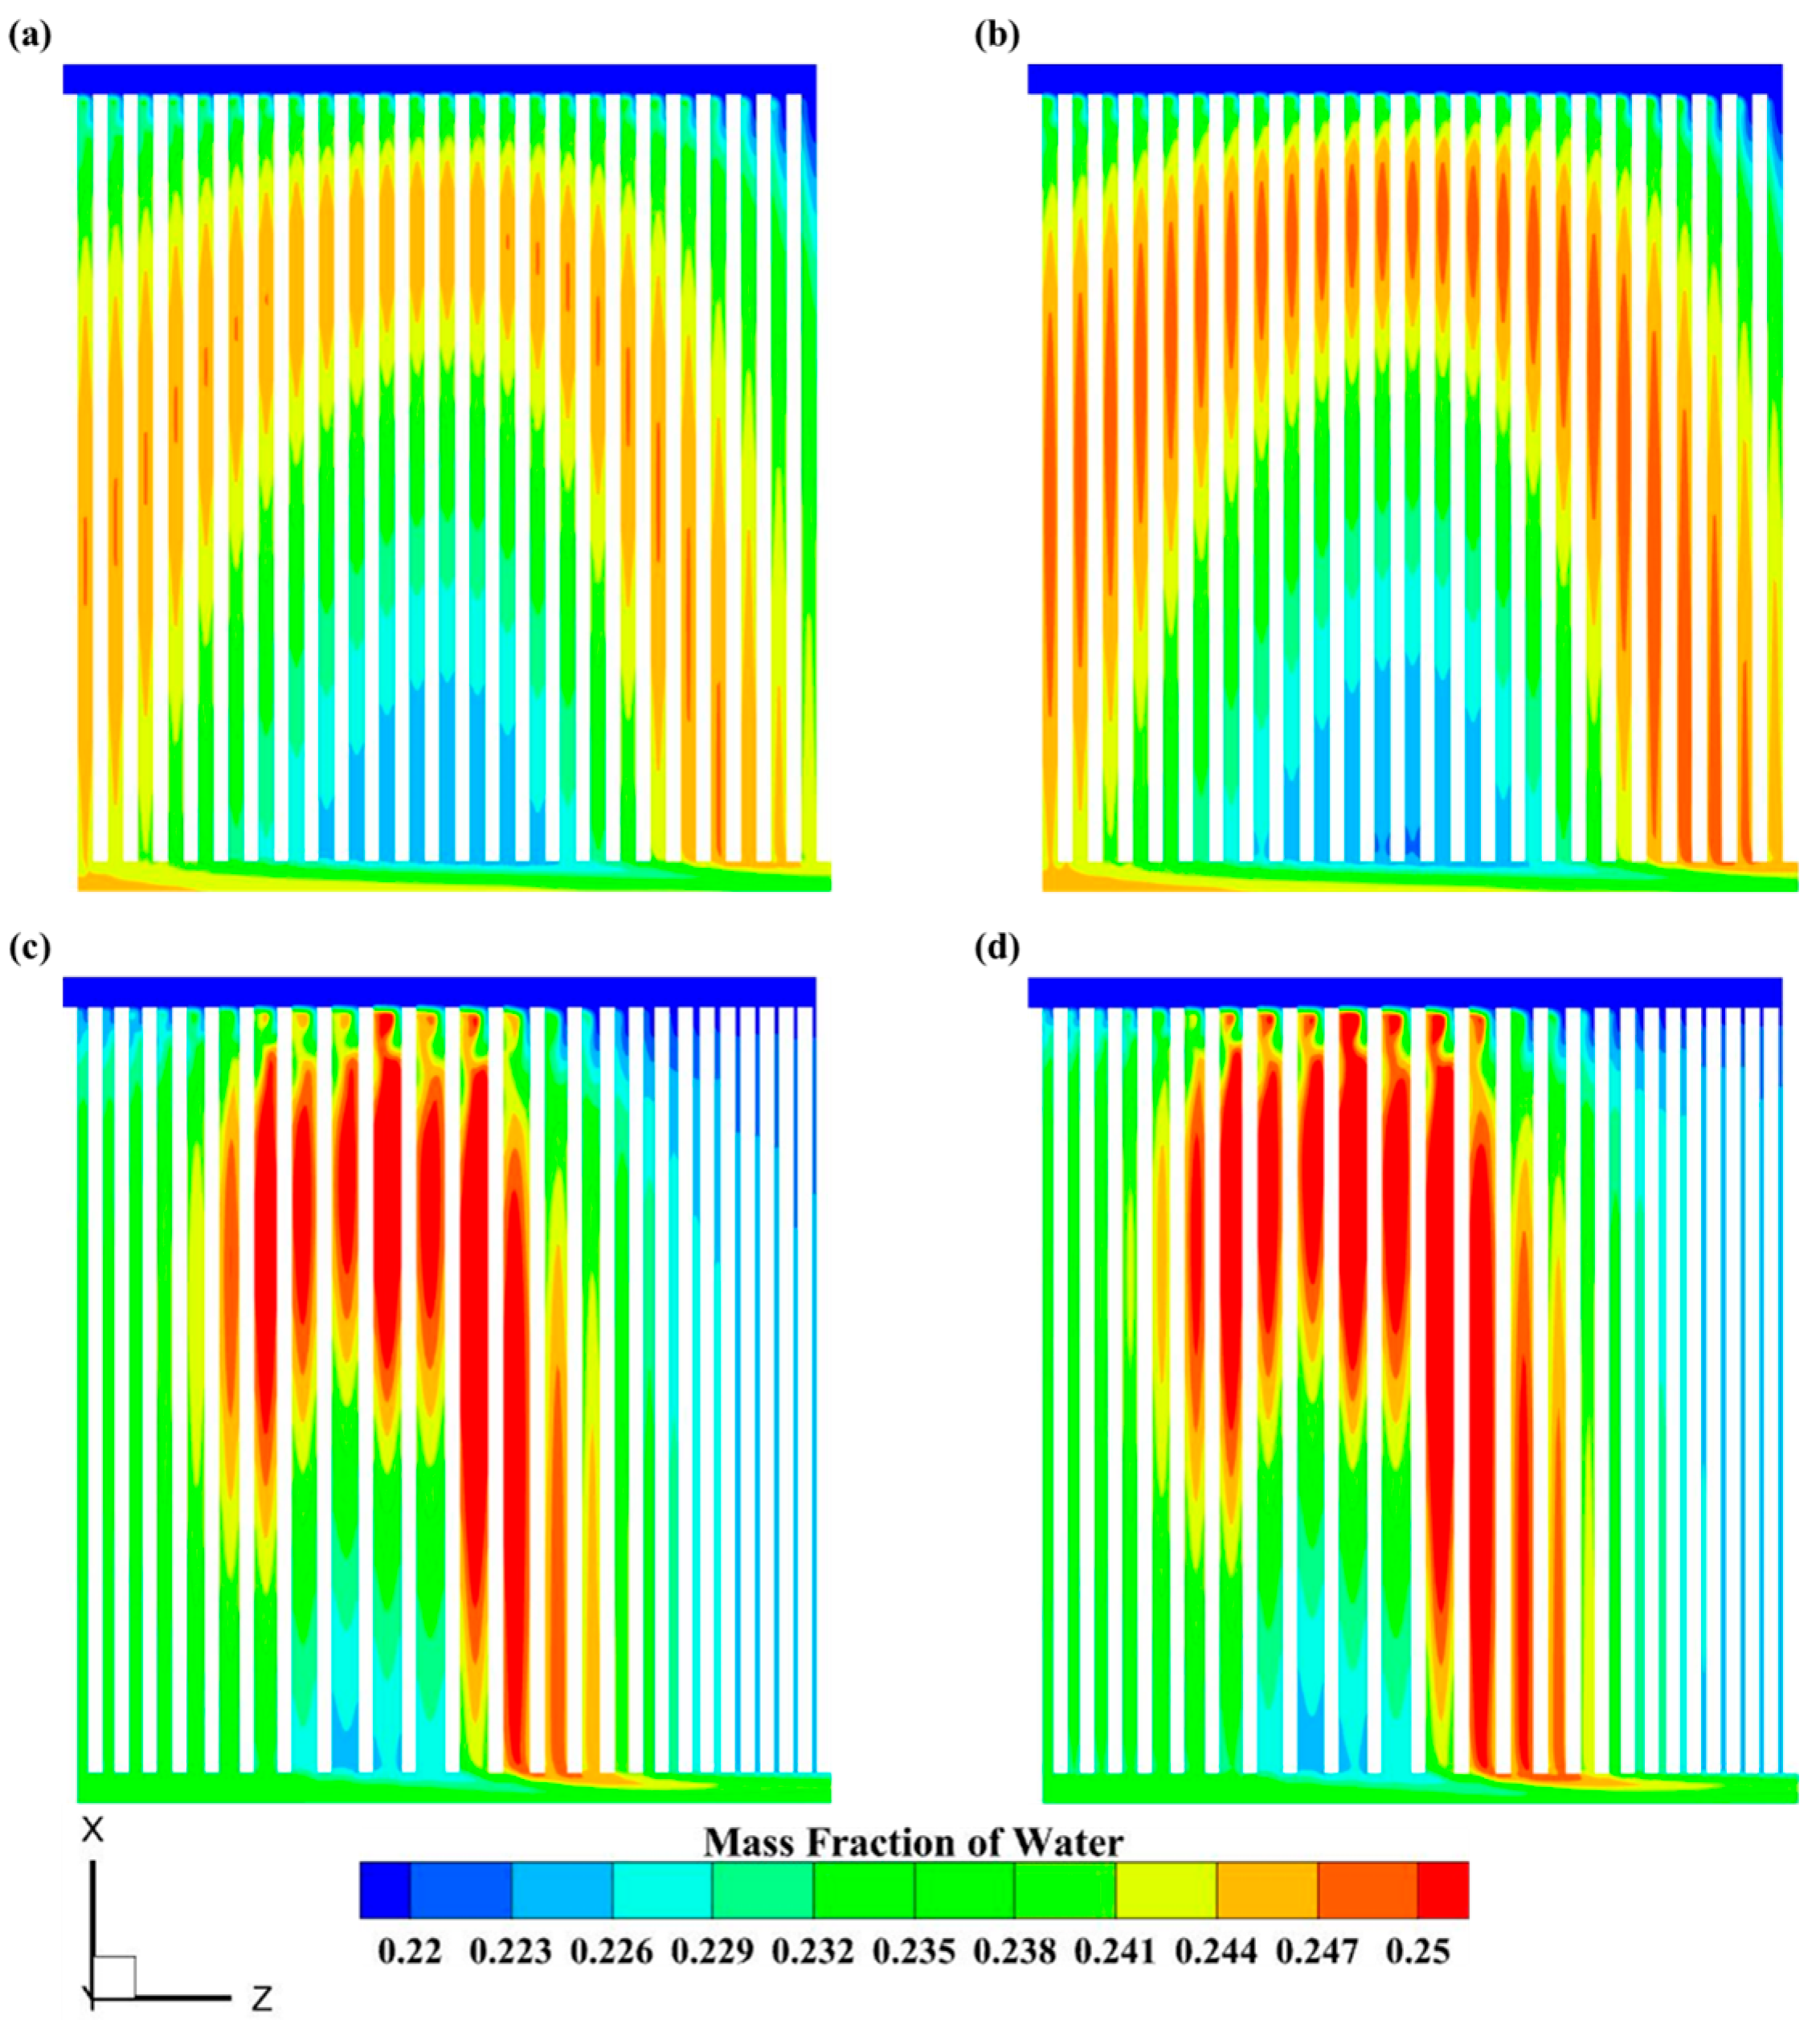
Figure 14 illustrates the oxygen distribution within the CGDL for different models with uniform porosity and optimal porosity at a voltage of 0.3 V. It is evident that the mass transfer capacity of the optimal model surpasses that of the equal-width channel model. In both models, the gradient porosity can enhance the mass transfer capacity of the CGDL, reduce the area of the low-oxygen region, and consequently improve the cell’s output performance. Figure 15 depicts the mass fraction of water in the cathode flow channels (CFCs) for different models with uniform porosity and optimal porosity. It can be noted that the gradient porosity leads to an increase in the water content in the CFC. This can be attributed to two factors. Firstly, the more intense chemical reaction generates a greater amount of water. Secondly, the gradient porosity enhances the water transport capacity of the CGDL. As a result, the water generated by the CCL can more easily reach the CFC and be discharged. Therefore, a larger pore area can be utilized for oxygen transport, which accounts for why the gradient porosity can improve the oxygen distribution in the CGDL.

Figure 14.
Mass fraction of oxygen in CGDL of (a) equal-channel-width model with uniform porosity, (b) equal-channel-width model with optimal porosity, (c) optimized-channel-width model with uniform porosity, and (d) optimized-channel-width model with optimal porosity.
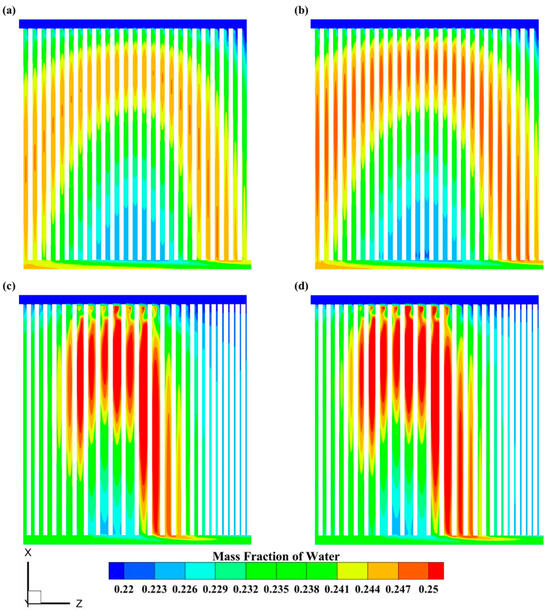
Figure 15.
Mass fraction of water in CFC of (a) equal-channel-width model with uniform porosity, (b) equal-channel-width model with optimal porosity, (c) optimized-channel-width model with uniform porosity and (d) optimized-channel-width model with optimal porosity.
5. Conclusions
In this paper, we propose a CFD-based evolutionary algorithm to determine the optimal width distribution of the cathode flow channels in a PEMFC according to the optimality principle of maximum output power. Subsequently, the influence of the gradient porosity on the mass transfer and output performance of the PEMFC is further investigated. Moreover, the coupled optimization of the flow channel structure and the porosity of the GDL is also explored.
The results validate that the CFD-based evolutionary algorithm proposed in this study effectively enhances reactant distribution uniformity, mass transfer capacity, and output power in proton exchange membrane fuel cells (PEMFCs). Compared to uniform flow channel configurations, the optimized PEMFC with non-uniform flow channels designed by the CFD-based algorithm exhibits a 6.6% reduction in flow inhomogeneity coefficient, a 9.1% increase in maximum power density, and a 7.8% improvement in limiting current density. Notably, integrating this optimization strategy with gradient porosity gas diffusion layers (GDLs) yields a synergistic enhancement: the combined design achieves a 12.4% improvement in maximum power density and a 10.4% increase in limiting current density. These improvements are attributed to the optimized reactant field caused by non-equal-width channels that balance reactant supply across channel branches while maintaining favorable electrochemical conditions.
The optimal-flow-channel-width configuration involves narrowing the downstream channels while widening the mid-front branch channels. This strategic adjustment allows for the efficient utilization of reactants in high-oxygen regions while improving mass transfer in low-oxygen areas. Regarding porosity distribution, a high-porosity design is implemented on the flow channel side, while a low-porosity design is adopted on the catalyst layer side. This arrangement effectively enhances the water removal capacity of the diffusion layer and promotes oxygen diffusion. Compared to single-component optimization strategies, the combined optimization of flow channel geometry and gas diffusion layer porosity yields synergistic improvements.
This paper mainly focuses on the numerical optimization of flow channels and gas diffusion layer porosity under steady-state conditions. Considering that the dynamic characteristics of fuel cells are also critical for performance evaluation and improvement, future research should prioritize experimental investigations under dynamic operating conditions.
Author Contributions
D.C.: investigation, data curation, visualization, writing—original draft. Q.C.: conceptualization, formal analysis, resources, writing—reviewing and editing. D.L.: validation, writing—reviewing and editing. P.Y.: validation, writing—reviewing and editing. J.L.: validation, writing—reviewing and editing. Z.Z.: methodology, writing—reviewing and editing. M.Z.: conceptualization, writing—reviewing and editing. F.Y.: writing—reviewing and editing. All authors have read and agreed to the published version of the manuscript.
Funding
The present work was funded by the State Grid Corporation of China Headquarters Management of Science and Technology Project (Grant No. 5108-202328050A-1-1-ZN).
Data Availability Statement
No data were used for the research described in the article.
Conflicts of Interest
The authors declare that they have no known competing financial interests or personal relationships that could have appeared to influence the work reported in this paper.
Nomenclature
| U | velocity, m s−1 |
| S | source term |
| M | molar mass, kg mol−1 |
| j | exchange current density, A m−3 |
| F | Faraday constant, A mol−1 |
| C | molar concentration, mol m−3 |
| R | ideal gas constant, J mol−1 K−1 |
| T | temperature, K |
| V0 | thermodynamic equilibrium potential, V |
| P | pressure, Pa |
| K | permeability, m−2 |
| s | liquid water saturation |
| Cp | constant pressure specific heat capacity, J kg−1 K−1 |
| k | thermal conductivity, W m−1 K−1 |
| I | current density, A m−2 |
| Y | mass fraction |
| D | diffusion coefficient |
| cr | condensation rate constant, s−1 |
| Q | mass flow rate, kg s−1 |
| A | area, m2 |
| dp | diameter of the porous particle, m |
| Rohm | ohmic resistance, Ω |
| hrea | heat production by electrochemical reaction, J |
| hL | latent heat of water phase transition, J |
| d | width of channels, m |
| x, y, z | Cartesian coordinates, m |
| v | velocity component in y directions, m s−1 |
| ε0 | average porosity of GDL |
| Greek Letters | |
| ε | porosity |
| ρ | density, kg m−3 |
| α | transfer coefficient |
| η | overpotential, V |
| φ | electric potential, V |
| μ | dynamic viscosity, Pa s |
| σ | proton conductivity, S m−1 |
| ζ | stoichiometric ratio |
| γ | relaxation factor |
| ω | inhomogeneity coefficient |
| β | effective mass transfer coefficient |
| Subscript | |
| g | gas |
| l | liquid |
| m | mass |
| i | species (H2, O2, H2O) |
| a | anode |
| c | cathode |
| ref | reference |
| eff | effective |
| sol | solid |
| mem | membrane |
| mom | momentum |
| ene | energy |
| wv | water vapor |
| sv | saturated vapor |
| cap | capillary |
| tot | total |
| cos | consumption |
| in | inlet |
| out | outlet |
| Abbreviations | |
| BP | bipolar plate |
| FC | flow channel |
| GDL | gas diffusion layer |
| CL | catalyst layer |
| PEM | proton exchange membrane |
| CFC | cathode flow channel |
| CGDL | cathode gas diffusion layer |
| CCL | cathode catalyst layer |
| PEMFC | proton exchange membrane fuel cell |
| EMTC | effective mass transfer coefficient |
References
- Kondratiev, V.V.; Sysoev, I.A.; Kolosov, A.D.; Galishnikova, V.V.; Gladkikh, V.A.; Karlina, A.I.; Karlina, Y.I. Development and Testing of the Thermoelectric Thermal Energy Conversion Device in the Conditions of Existing Aluminum Production. Materials 2022, 15, 8526. [Google Scholar] [CrossRef] [PubMed]
- Kandlikar, S.G.; Lu, Z. Thermal management issues in a PEMFC stack—A brief review of current status. Appl. Therm. Eng. 2009, 29, 1276–1280. [Google Scholar]
- Wang, Y.; Chen, K.S.; Mishler, J.; Cho, S.C.; Adroher, X.C. A review of polymer electrolyte membrane fuel cells: Technology, applications, and needs on fundamental research. Appl. Energy 2011, 88, 981–1007. [Google Scholar]
- Zhao, Y.; Mao, Y.; Zhang, W.; Tang, Y.; Wang, P. Reviews on the effects of contaminations and research methodologies for PEMFC. Int. J. Hydrogen Energy 2020, 45, 23174–23200. [Google Scholar]
- Abdi, H.; Messaoudene, N.A.; Kolsi, L.; Belazzoug, M. Multi-Objective Optimization of Operating Parameters of a PEMFC under Flooding Conditions Using the Non-Dominated Sorting Genetic Algorithm. Therm. Sci. 2019, 23, 3525–3537. [Google Scholar]
- Abdi, H.; Messaoudene, N.A.; Kolsi, L.; Naceur, M.W. Modeling and Optimization of a Proton Exchange Membrane Fuel Cell Using Particle Swarm Algorithm with Constriction Coefficient. J. Therm. Anal. Calorim. 2021, 144, 1749–1759. [Google Scholar]
- Li, X.; Sabir, I. Review of bipolar plates in PEM fuel cells: Flow-field designs. Int. J. Hydrogen Energy 2005, 30, 359–371. [Google Scholar]
- Song, Y.; Zhang, C.; Ling, C.Y.; Han, M.; Yong, R.Y.; Sun, D.; Chen, J. Review on current research of materials, fabrication and application for bipolar plate in proton exchange membrane fuel cell. Int. J. Hydrogen Energy 2020, 45, 29832–29847. [Google Scholar]
- Siegel, C. Review of computational heat and mass transfer modeling in polymer-electrolyte-membrane (PEM) fuel cells. Energy 2008, 33, 1331–1352. [Google Scholar]
- Wilberforce, T.; Ijaodola, O.; Ogungbemi, E.; Khatib, F.; Leslie, T.; El-Hassan, Z.; Thomposon, J.; Olabi, A. Technical evaluation of proton exchange membrane (PEM) fuel cell performance—A review of the effects of bipolar plates coating. Renew. Sustain. Energy Rev. 2019, 113, 109286. [Google Scholar] [CrossRef]
- Mancusi, E.; Fontana, É.; de Souza, A.A.U.; de Souza, S.M.G.U. Numerical study of two-phase flow patterns in the gas channel of PEM fuel cells with tapered flow field design. Int. J. Hydrogen Energy 2014, 39, 2261–2273. [Google Scholar] [CrossRef]
- Liu, S.; Chen, T.; Xie, Y.; Zhang, J.; Wu, C. Numerical simulation and experimental study on the effect of symmetric and asymmetric bionic flow channels on PEMFC performance under gravity. Int. J. Hydrogen Energy 2019, 44, 29618–29630. [Google Scholar] [CrossRef]
- Tan, Q.; Lei, H.; Liu, Z. Numerical simulation analysis of the performance on the PEMFC with a new flow field designed based on constructal-theory. Int. J. Hydrogen Energy 2022, 47, 11975–11990. [Google Scholar] [CrossRef]
- Kuo, J.K.; Chen, C. Evaluating the enhanced performance of a novel wave-like form gas flow channel in the PEMFC using the field synergy principle. J. Power Sources 2006, 162, 1122–1129. [Google Scholar] [CrossRef]
- Perng, S.-W.; Wu, H.-W. Non-isothermal transport phenomenon and cell performance of a cathodic PEM fuel cell with a baffle plate in a tapered channel. Appl. Energy 2011, 88, 52–67. [Google Scholar] [CrossRef]
- Min, C.; Li, F.; Gao, X.; Wang, K.; Rao, Z. Secondary flow on the performance of PEMFC with blocks in the serpentine flow field. Int. J. Hydrogen Energy 2022, 47, 28945–28955. [Google Scholar] [CrossRef]
- Yoon, Y.-G.; Lee, W.-Y.; Park, G.-G.; Yang, T.-H.; Kim, C.-S. Effects of channel rib widths of flow field plates on the performance of a PEMFC. Int. J. Hydrogen Energy 2005, 30, 1363–1366. [Google Scholar] [CrossRef]
- Santamaria, A.D.; Cooper, N.J.; Becton, M.K.; Park, J.W. Effect of channel length on interdigitated flow-field PEMFC performance: A computational and experimental study. Int. J. Hydrogen Energy 2013, 38, 16253–16263. [Google Scholar] [CrossRef]
- Freire, L.S.; Antolini, E.; Linardi, M.; Santiago, E.I.; Passos, R.R. Influence of operational parameters on the performance of PEMFCs with serpentine flow field channels having different (rectangular and trapezoidal) cross-section shape. Int. J. Hydrogen Energy 2014, 39, 12052–12060. [Google Scholar] [CrossRef]
- Sajid Hossain, M.; Shabani, B.; Cheung, C.P. Enhanced gas flow uniformity across parallel channel cathode flow field of Proton Exchange Membrane fuel cells. Int. J. Hydrogen Energy 2017, 42, 5272–5283. [Google Scholar] [CrossRef]
- Zhang, W.; Hu, P.; Lai, X.; Peng, L. Analysis and optimization of flow distribution in parallel-channel configurations for proton exchange membrane fuel cells. J. Power Sources 2009, 194, 931–940. [Google Scholar]
- Ahmed, D.H.; Sung, H.J. Effects of channel geometrical configuration and shoulder width on PEMFC performance at high current density. J. Power Sources 2006, 162, 327–339. [Google Scholar]
- Xia, L.; Xu, Q.; He, Q.; Ni, M.; Seng, M. Numerical study of high temperature proton exchange membrane fuel cell (HT-PEMFC) with a focus on rib design. Int. J. Hydrogen Energy 2021, 46, 21098–21111. [Google Scholar] [CrossRef]
- Shimpalee, S.; Vanzee, J. Numerical studies on rib & channel dimension of flow-field on PEMFC performance. Int. J. Hydrogen Energy 2007, 32, 842–856. [Google Scholar]
- Zhan, Z.; Xiao, J.; Li, D.; Pan, M.; Yuan, R. Effects of porosity distribution variation on the liquid water flux through gas diffusion layers of PEM fuel cells. J. Power Sources 2006, 160, 1041–1048. [Google Scholar]
- Chen, F.; Chang, M.; Hsieh, P. Two-phase transport in the cathode gas diffusion layer of PEM fuel cell with a gradient in porosity. Int. J. Hydrogen Energy 2008, 33, 2525–2529. [Google Scholar]
- Xia, L.; Ni, M.; He, Q.; Xu, Q.; Cheng, C. Optimization of gas diffusion layer in high temperature PEMFC with the focuses on thickness and porosity. Appl. Energy 2021, 300, 117357. [Google Scholar]
- Yin, B.; Xu, S.; Yang, S.; Dong, F. Influence of Microelliptical Groove Gas Diffusion Layer (GDL) on Transport Behavior of Proton Exchange Membrane Fuel Cell (PEMFC). Int. J. Heat Mass Transf. 2021, 180, 121793. [Google Scholar]
- Xing, L.; Shi, W.; Su, H.; Xu, Q.; Das, P.K.; Mao, B.; Scott, K. Membrane electrode assemblies for PEM fuel cells: A review of functional graded design and optimization. Energy 2019, 177, 445–464. [Google Scholar]
- Chu, H.-S.; Yeh, C.; Chen, F. Effects of porosity change of gas diffuser on performance of proton exchange membrane fuel cell. J. Power Sources 2003, 123, 1–9. [Google Scholar]
- Guo, L.; Chen, L.; Zhang, R.; Peng, M.; Tao, W.-Q. Pore-scale simulation of two-phase flow and oxygen reactive transport in gas diffusion layer of proton exchange membrane fuel cells: Effects of nonuniform wettability and porosity. Energy 2022, 253, 124101. [Google Scholar]
- Kanchan, B.K.; Randive, P.; Pati, S. Implications of non-uniform porosity distribution in gas diffusion layer on the performance of a high temperature PEM fuel cell. Int. J. Hydrogen Energy 2021, 46, 18571–18588. [Google Scholar]
- Zhan, Z.; Xiao, J.; Zhang, Y.; Pan, M.; Yuan, R. Gas diffusion through differently structured gas diffusion layers of PEM fuel cells. Int. J. Hydrogen Energy 2007, 32, 4443–4451. [Google Scholar]
- Ko, D.; Doh, S.; Park, H.S.; Kim, M.H. The effect of through plane pore gradient GDL on the water distribution of PEMFC. Int. J. Hydrogen Energy 2018, 43, 2369–2380. [Google Scholar] [CrossRef]
- Sun, W.; Peppley, B.A.; Karan, K. Modeling the Influence of GDL and flow-field plate parameters on the reaction distribution in the PEMFC cathode catalyst layer. J. Power Sources 2005, 144, 42–53. [Google Scholar]
- Shi, L.; Xu, S.; Liu, J. Influences of assembly pressure and flow channel size on performances of proton exchange membrane fuel cells based on a multi-model. Int. J. Hydrogen Energy 2022, 47, 7902–7914. [Google Scholar]
- Zhang, S.Y.; Qu, Z.G.; Xu, H.T.; Talkhoncheh, F.K.; Liu, S.; Gao, Q. A numerical study on the performance of PEMFC with wedge-shaped fins in the cathode channel. Int. J. Hydrogen Energy 2021, 46, 27700–27708. [Google Scholar] [CrossRef]
- Kim, K.H.; Lee, K.Y.; Lee, S.Y.; Cho, E.; Lim, T.H.; Kim, H.J.; Yoon, S.P.; Kim, S.H.; Lim, T.W.; Jang, J.H. The effects of relative humidity on the performances of PEMFC MEAs with various Nafion® ionomer contents. Int. J. Hydrogen Energy 2010, 35, 13104–13110. [Google Scholar]
- Shen, J.; Zeng, L.; Liu, Z.; Liu, W. Performance investigation of PEMFC with rectangle blockages in Gas Channel based on field synergy principle. Heat Mass Transf. 2018, 55, 811–822. [Google Scholar] [CrossRef]
- Shen, J.; Tu, Z.; Chan, S.H. Enhancement of mass transfer in a proton exchange membrane fuel cell with blockage in the flow channel. Appl. Therm. Eng. 2019, 149, 1408–1418. [Google Scholar]


Disclaimer/Publisher’s Note: The statements, opinions and data contained in all publications are solely those of the individual author(s) and contributor(s) and not of MDPI and/or the editor(s). MDPI and/or the editor(s) disclaim responsibility for any injury to people or property resulting from any ideas, methods, instructions or products referred to in the content. |
© 2025 by the authors. Licensee MDPI, Basel, Switzerland. This article is an open access article distributed under the terms and conditions of the Creative Commons Attribution (CC BY) license (https://creativecommons.org/licenses/by/4.0/).