Article

Economic Analysis of Biofuel Production in Agrophotovoltaic Systems Using Building-Integrated Photovoltaics in South Korea

Department of Industrial and Systems Engineering, Dongguk University-Seoul, Seoul 04620, Republic of Korea
*
Author to whom correspondence should be addressed.
Energies 2025, 18(8), 1949; https://doi.org/10.3390/en18081949
Submission received: 25 February 2025 / Revised: 23 March 2025 / Accepted: 9 April 2025 / Published: 11 April 2025
(This article belongs to the Section A: Sustainable Energy)

Abstract

:
Agrophotovoltaic (APV) systems represent innovative agricultural farms and solar power plants, capable of producing electricity and crops simultaneously. Since the solar radiation required to optimize harvests varies by crop type, traditional PV panels face challenges in efficiently adjusting the shading ratio of APV systems. This study evaluates the economic viability of APV systems integrated with building-integrated photovoltaic (BIPV) systems for biofuel production. Specifically, it assesses the production forecast for corn-based biofuel—demand for which is rising due to the mixed-fuel use policy of the Korean government—and the economic feasibility of production in the APV system enhanced by BIPV integration (i.e., the APV–BIPV system). To this end, LCOE (levelized cost of energy) and NPV (net present value) are employed as performance indicators. Additionally, yield data from corn and corn stover harvested in actual APV facilities are utilized to predict bioenergy production. Consequently, the study will analyze the impact of renewable energy production from the proposed APV–BIPV system on achieving the Korean government’s renewable energy production goals and will provide guidelines on the potential benefits for farmers involved in renewable energy production and energy crop harvesting.

1. Introduction

Worldwide attention is focused on renewable energy utilization for environmental protection. The usage of renewable energy is progressively becoming mandated. According to the Paris Agreement, each country is obligated to make efforts towards reducing greenhouse gas (GHG) emissions [1]. Renewable electricity capacity significantly increased, from 179.2 to 342 GW between 2016 and 2022, where the capacity from solar PV constituted 66.78%, or 228.4 GW of the 342 GW in 2022 [2]. Moreover, the global demand for solar power continues to rise, with the installation of solar power expected to reach 360 GW in 2023 [3]. This increase is largely due to substantial reductions in the manufacturing costs of solar modules, including the price of polysilicon. Polysilicon prices in China have dropped from US$ 70 to 6.99 per kg from 2008 to 2024 [4]. Despite a forecasted 15% decrease from 2022, the domestic solar power market in South Korea is estimated to have installed 2.7 GW of solar power plants in 2023 [5].
Globally, movements toward renewable energy use are evident in the construction industry, including the construction of net zero energy buildings (NZEBs). NZEBs aim to balance the energy delivered with the energy exported [6]. Essentially, an NZEB functions as a power plant, simultaneously consuming and generating renewable energy. This necessitates the installation of PV panels to generate energy and the reduction of excessive energy consumption in existing structures. For instance, utilizing a green roof can help reduce the operating costs of heating, ventilation, and air conditioning (HVAC) systems in buildings [7]. Additionally, the real-time management systems of smart buildings can further reduce overall maintenance costs. Given that buildings, globally, are responsible for 40% of primary energy consumption and 30% of carbon dioxide (CO2) emissions, it is imperative to expedite the construction of NZEBs to foster a cleaner environment [8].
To reduce CO2 emissions through the construction of NZEBs, building-integrated photovoltaics (BIPVs) have been identified as one of the optimal solutions [9]. BIPVs are innovative photovoltaic (PV) modules designed to be integrated into the building envelope, replacing conventional construction materials [10]. Martin et al. [11] classify BIPVs into three categories: roofing, façade, and external integrated devices. Conversely, the International Electrotechnical Commission (IEC) Standard 63092-1 [12] categorizes BIPVs based on three characteristics: (1) the level of integration of a BIPV into the building envelope, (2) the BIPV’s accessibility from inside the building, and (3) the tilt level of the BIPV. Additionally, BIPVs can be classified by their optical transparency as opaque, translucent, or transparent [13]. Among various types, semi-transparent systems are preferred for their minimal visual impact and aesthetic appeal [14]. An example would be the colored BIPV, which conceals PV cells behind aesthetically pleasing patterns while generating electricity [15].
BIPVs offer a valuable solution for countries with limited land for PV plant installations. For instance, the eastern region of South Korea features mountainous terrain, while the western region predominately consists of farmland, presenting challenges in expanding PV generation [16]. Attaching PV panels to buildings offers an alternative method for enhancing PV generation capacity, thus preserving the natural terrain of mountains and farmlands. Similarly, in the 13 Pacific Island Countries (PICs)—Cook Islands, Federated States of Micronesia, Fiji, Kiribati, Nauru, Niue, Palau, Republic of Marshall Islands, Samoa, Solomon Islands, Tonga, Tuvalu, and Vanuatu—implementing BIPVs presents an effective strategy for generating clean energy without requiring extensive land for power plant construction. Kim and Kim [17] demonstrated the feasibility of developing an agricultural research and development center equipped with BIPVs in Fiji.
Despite the usefulness of BIPVs, theoretical academic research predominates in South Korea, while empirical studies on actual installations remain insufficient. Consequently, there exists a risk of misallocated budgets due to policies that support PV installations without specifying PV types and targets. The objective of this study is to explore cutting edge research and recent market trends of semi-transparent BIPVs in South Korea. Specifically, this study aims to perform an economic analysis to assess the impact of government economic support policies on the proliferation and distribution of BIPVs in both urban and rural areas. To achieve this, the installation and operational status of semi-transparent BIPVs in these areas are examined. Moreover, to gauge the economic viability of semi-transparent BIPVs, the levelized cost of energy (LCOE) and net present value (NPV) are analyzed. Particularly, by conducting economic feasibility assessments of individual BIPV installations in South Korea, the study seeks to understand how governmental policies, such as solar power installation cost support, affect the actual LCOE and NPV. Ultimately, this study aims to inform the development of renewable energy support policies tailored to the evolving market trends of semi-transparent BIPVs.
The utility of BIPVs can also be applied to agrophotovoltaic (APV) systems that require crop harvesting underneath PV modules; however, economic feasibility studies on this novel APV system utilizing BIPV (APV–BIPV) have not yet been conducted. This study aims to perform an economic feasibility analysis on the installation and operation of an APV–BIPV system and the production of biofuel from crops grown within this facility. First, considering the Korean government’s economic support policies for promoting renewable energy supply, this study explores recent market trends for semi-transparent BIPV in both urban and rural settings. Moreover, to ascertain the economic viability of the APV–BIPV system, performance metrics such as LCOE (levelized cost of energy) and NPV (net present value) are employed, and the estimated bioenergy production quantities from corn and corn stover at the facility are utilized. Through this analysis, we can investigate the impact of renewable energy production from APV–BIPV systems on achieving the Korean government’s renewable energy production goals. This study contributes in the following ways: First, it provides examples of BIPV utilization by analyzing various cases of BIPV commercially used in urban and rural areas. Second, a novel APV–BIPV system is introduced, and its economic feasibility is analyzed in terms of construction and operation. Third, it predicts the production volumes of corn, an energy crop, and the potential ethanol production from the byproduct (corn stover) when corn is cultivated in the agricultural PV sub-module. Consequently, this study will aid in the development of new policies in countries seeking to increase renewable energy usage similar to the Korean government through economic feasibility studies, and will also help enhance farmers’ income through the economical operation of an APV–BIPV system.
The remaining sections are organized as follows: Section 2 discusses the materials and methods used in this study, Section 3 presents the findings from investigating semi-transparent BIPVs in urban and rural areas, Section 4 addresses market diffusion challenges of semi-transparent BIPV technologies, and Section 5 concludes the study and summarizes the findings.

2. Materials and Methods

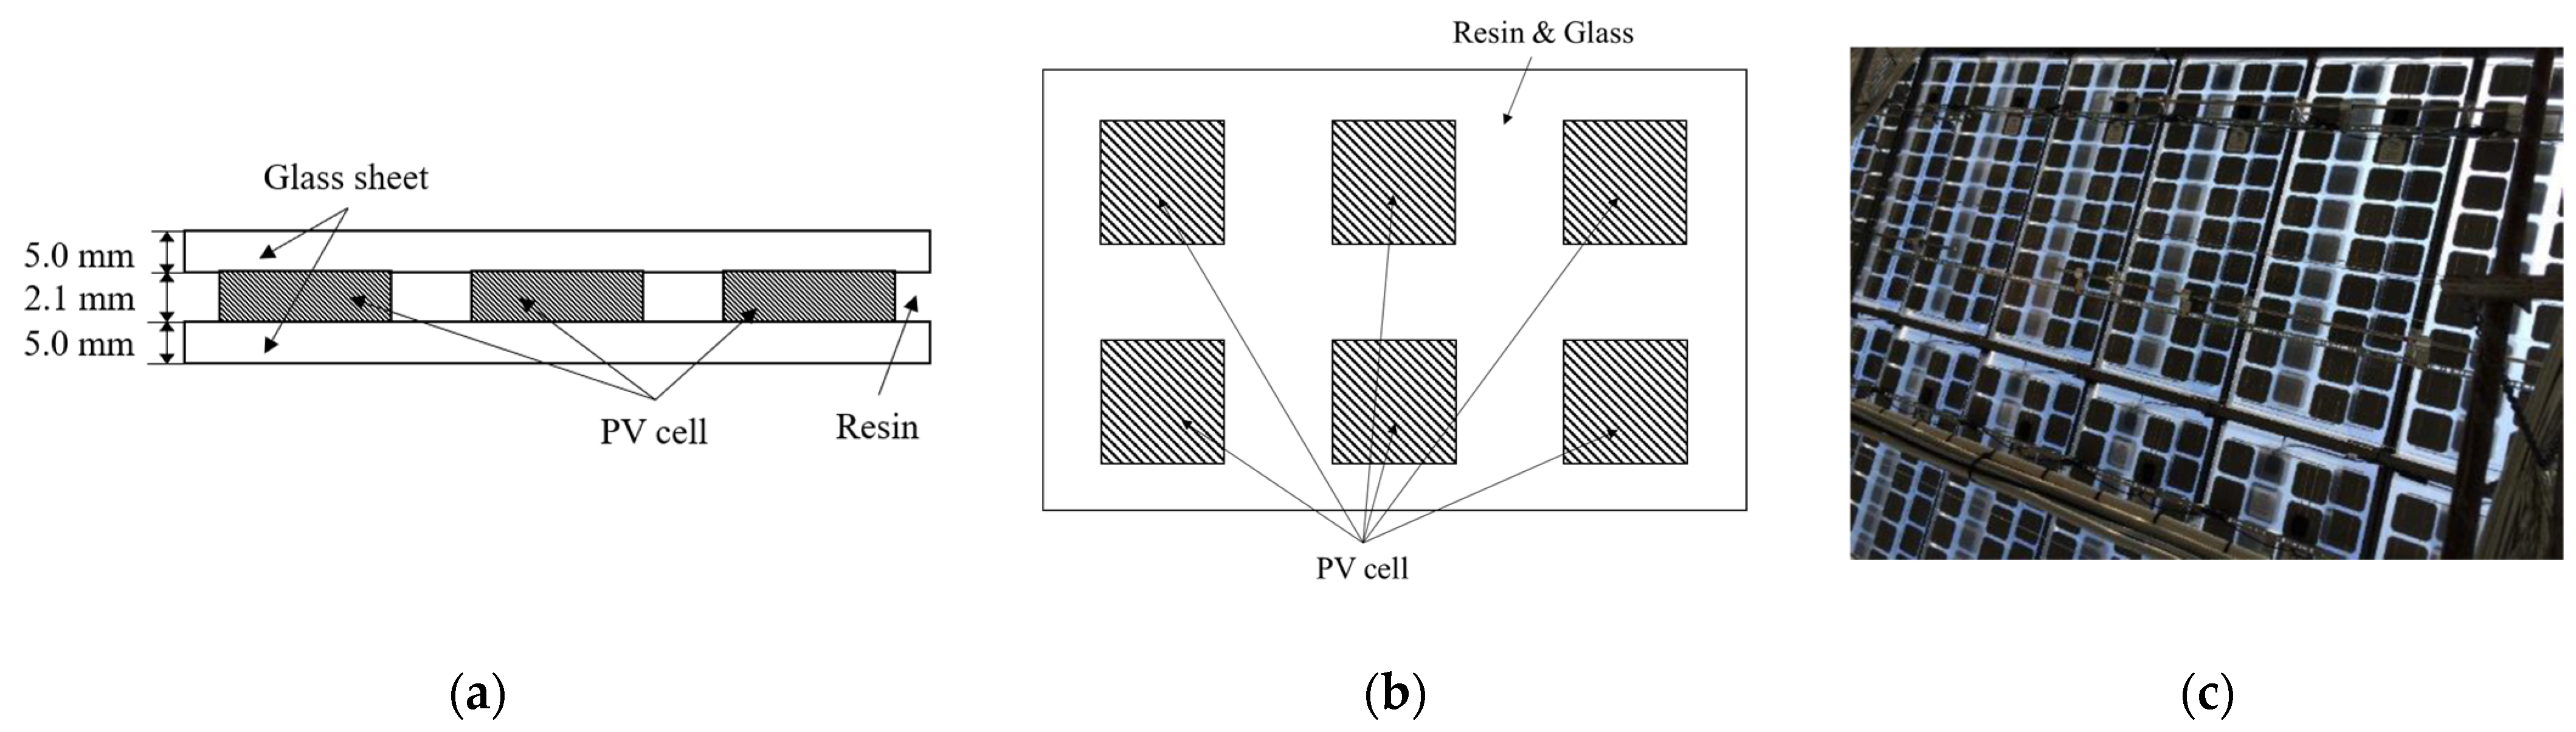
2.1. Use of Building-Integrated Photovoltaics in South Korea

As discussed in Section 1, the semi-transparent BIPV is a popular option among BIPVs because it can be adapted into various building material designs, such as roof-integrated, window, and rooftop BIPVs [17]. Figure 1 illustrates the structure of a semi-transparent BIPV, which is composed of resin, glass, and PV cells [18,19]. Since both glass and resin are transparent, the overall transparency of the semi-transparent BIPV can be regulated by modifying the spacing between PV cells. However, reducing the number of PV cells diminishes the electricity generation capacity, thereby posing a significant challenge in achieving the optimal design that meets the necessary electricity generation and aesthetic requirements for building materials.
The construction of NZEBs has played a vital role in promoting cleaner environments in urban areas across multiple countries. Kılkış [21] applied the Sustainable Development of Energy, Water, and Environment Systems (SDEWES) index to assess 120 cities worldwide, identifying Copenhagen, Stockholm, and Helsinki as the top three. These cities have effectively utilized residual energies, district heating and/or cooling (DH/C) networks, and the management of energy-efficient building clusters and eco-districts. Like other countries, South Korea aims to boost the number of NZEBs equipped with BIPVs, striving to achieve zero energy for all buildings by 2050. Particularly, solar power generation facilities are being installed in newly constructed public institution buildings [22]. There is policy support to promote the adoption of BIPVs. Seoul, the capital of Korea, will select eligible or prospective private building owners and support up to 80% of the installation costs for BIPVs. As the capital of South Korea, Seoul possesses numerous high-rise buildings and scarce idle land. Consequently, BIPVs in Seoul are predominantly window BIPVs or wall BIPVs. By implementing BIPVs in urban areas, Seoul not only addresses the scarcity of land but also enhances the cityscape.
Unlike the case in Seoul, most PV modules in China are installed on agricultural facilities in rural areas. In China, houses in rural areas are ideally suited for BIPV installations, as the roofs of old houses can be effectively reinforced with solar photovoltaic (PV) tiles using BIPV technology [23]. In October 2021, the National Energy Administration (NEA) in China announced a pilot project involving 676 counties for PV rooftop installation to rejuvenate the PV industry in rural regions [24]. Similarly, the South Korean Ministry of Trade, Industry and Energy initiated a renewable energy supply project in 2010 to rapidly expand BIPV installations on buildings [25]. With government support, the majority of industrial BIPV products are affixed to factory roofs and residential buildings (i.e., rooftop BIPVs) [26], and semi-transparent BIPVs are installed on house decks (i.e., roof-integrated BIPVs) [27].
The primary function of rooftop BIPVs in rural areas, similar to that in urban areas, involves generating electricity from the PV panels and reducing building maintenance costs. A study that monitored a house roof-integrated photovoltaic (PV) system in a rural South Korean area over a period of 2.5 years demonstrated that BIPV installation does not impact the temperature of the roofing system or the roof itself, thereby helping to lower building maintenance costs [28]. Hence, rooftop BIPVs present a viable solution in rural locales. It should be noted that rural buildings often have limited access to electricity [29], and the income level of rural residents generally falls below that of urban counterparts, making BIPV an effective strategy to alleviate financial strains caused by high electricity bills [30].

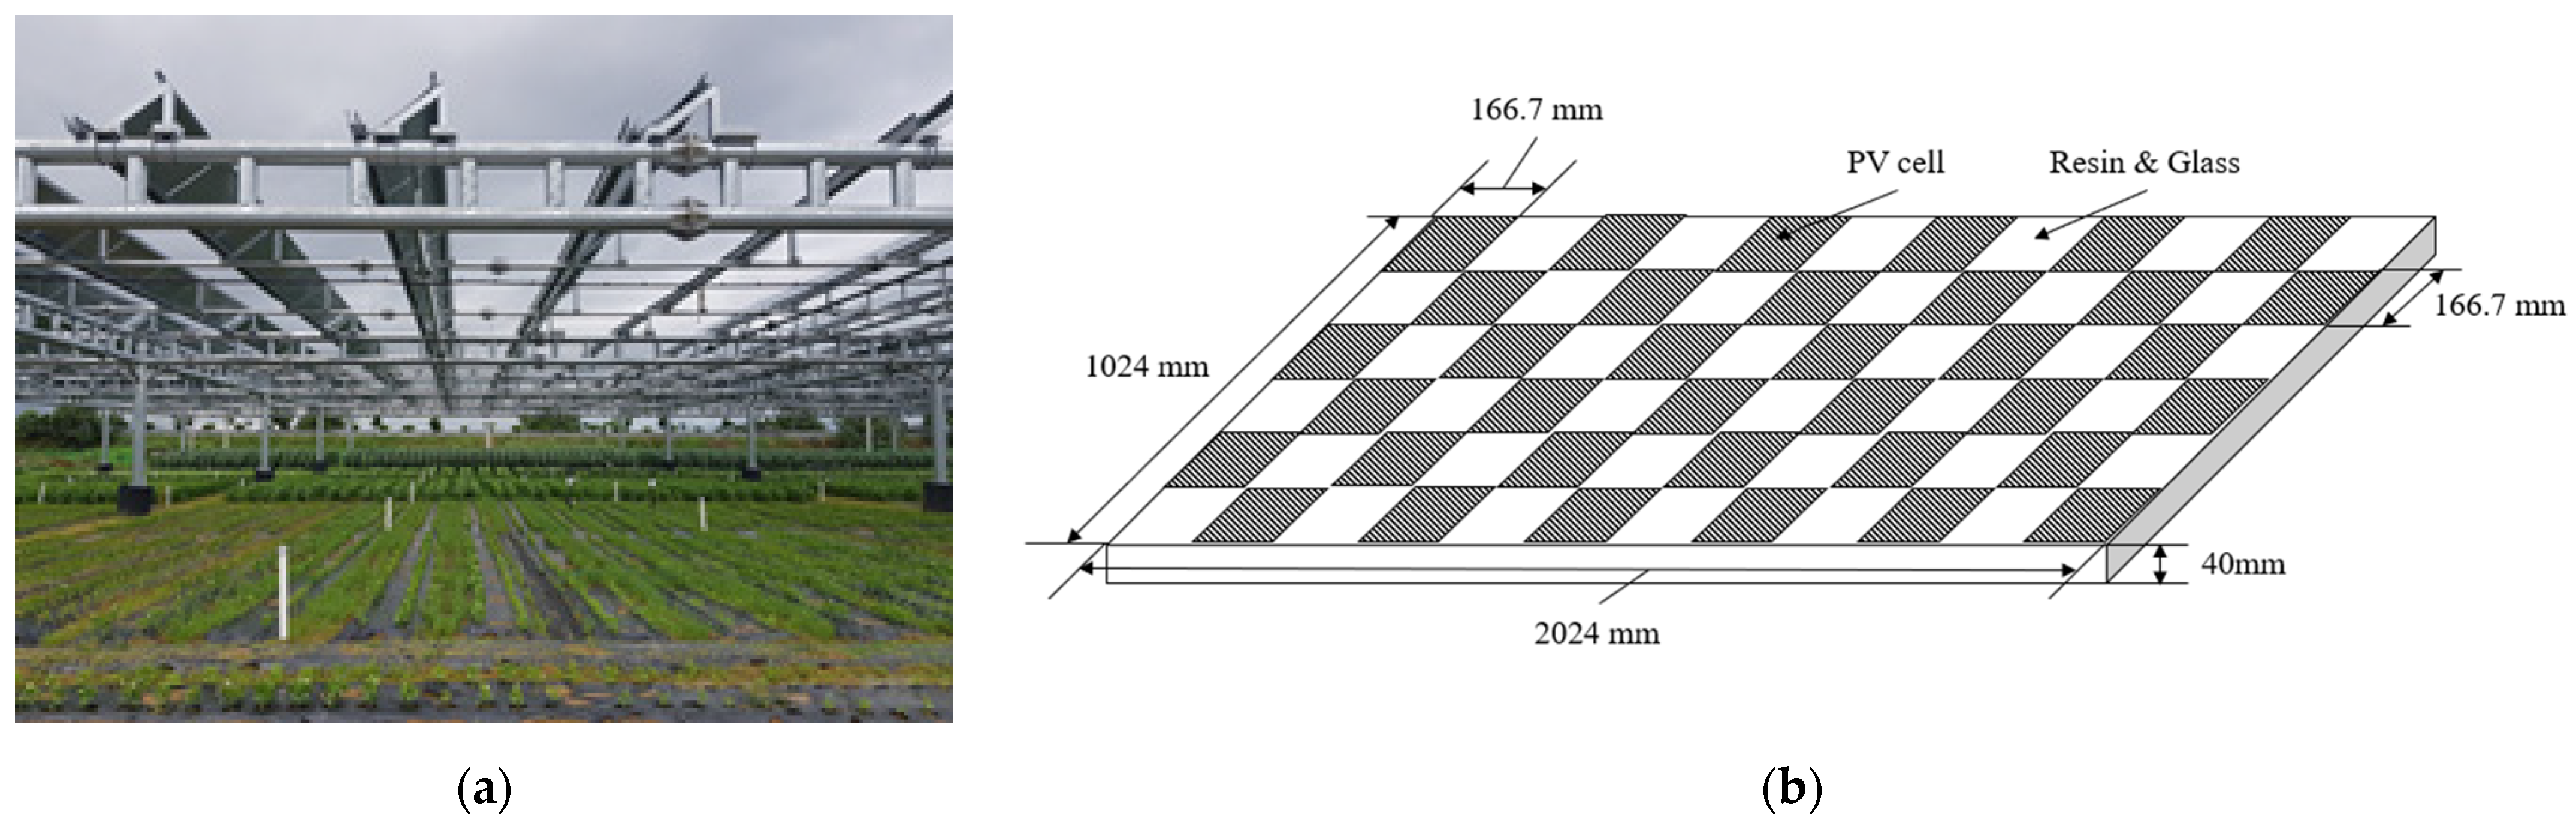
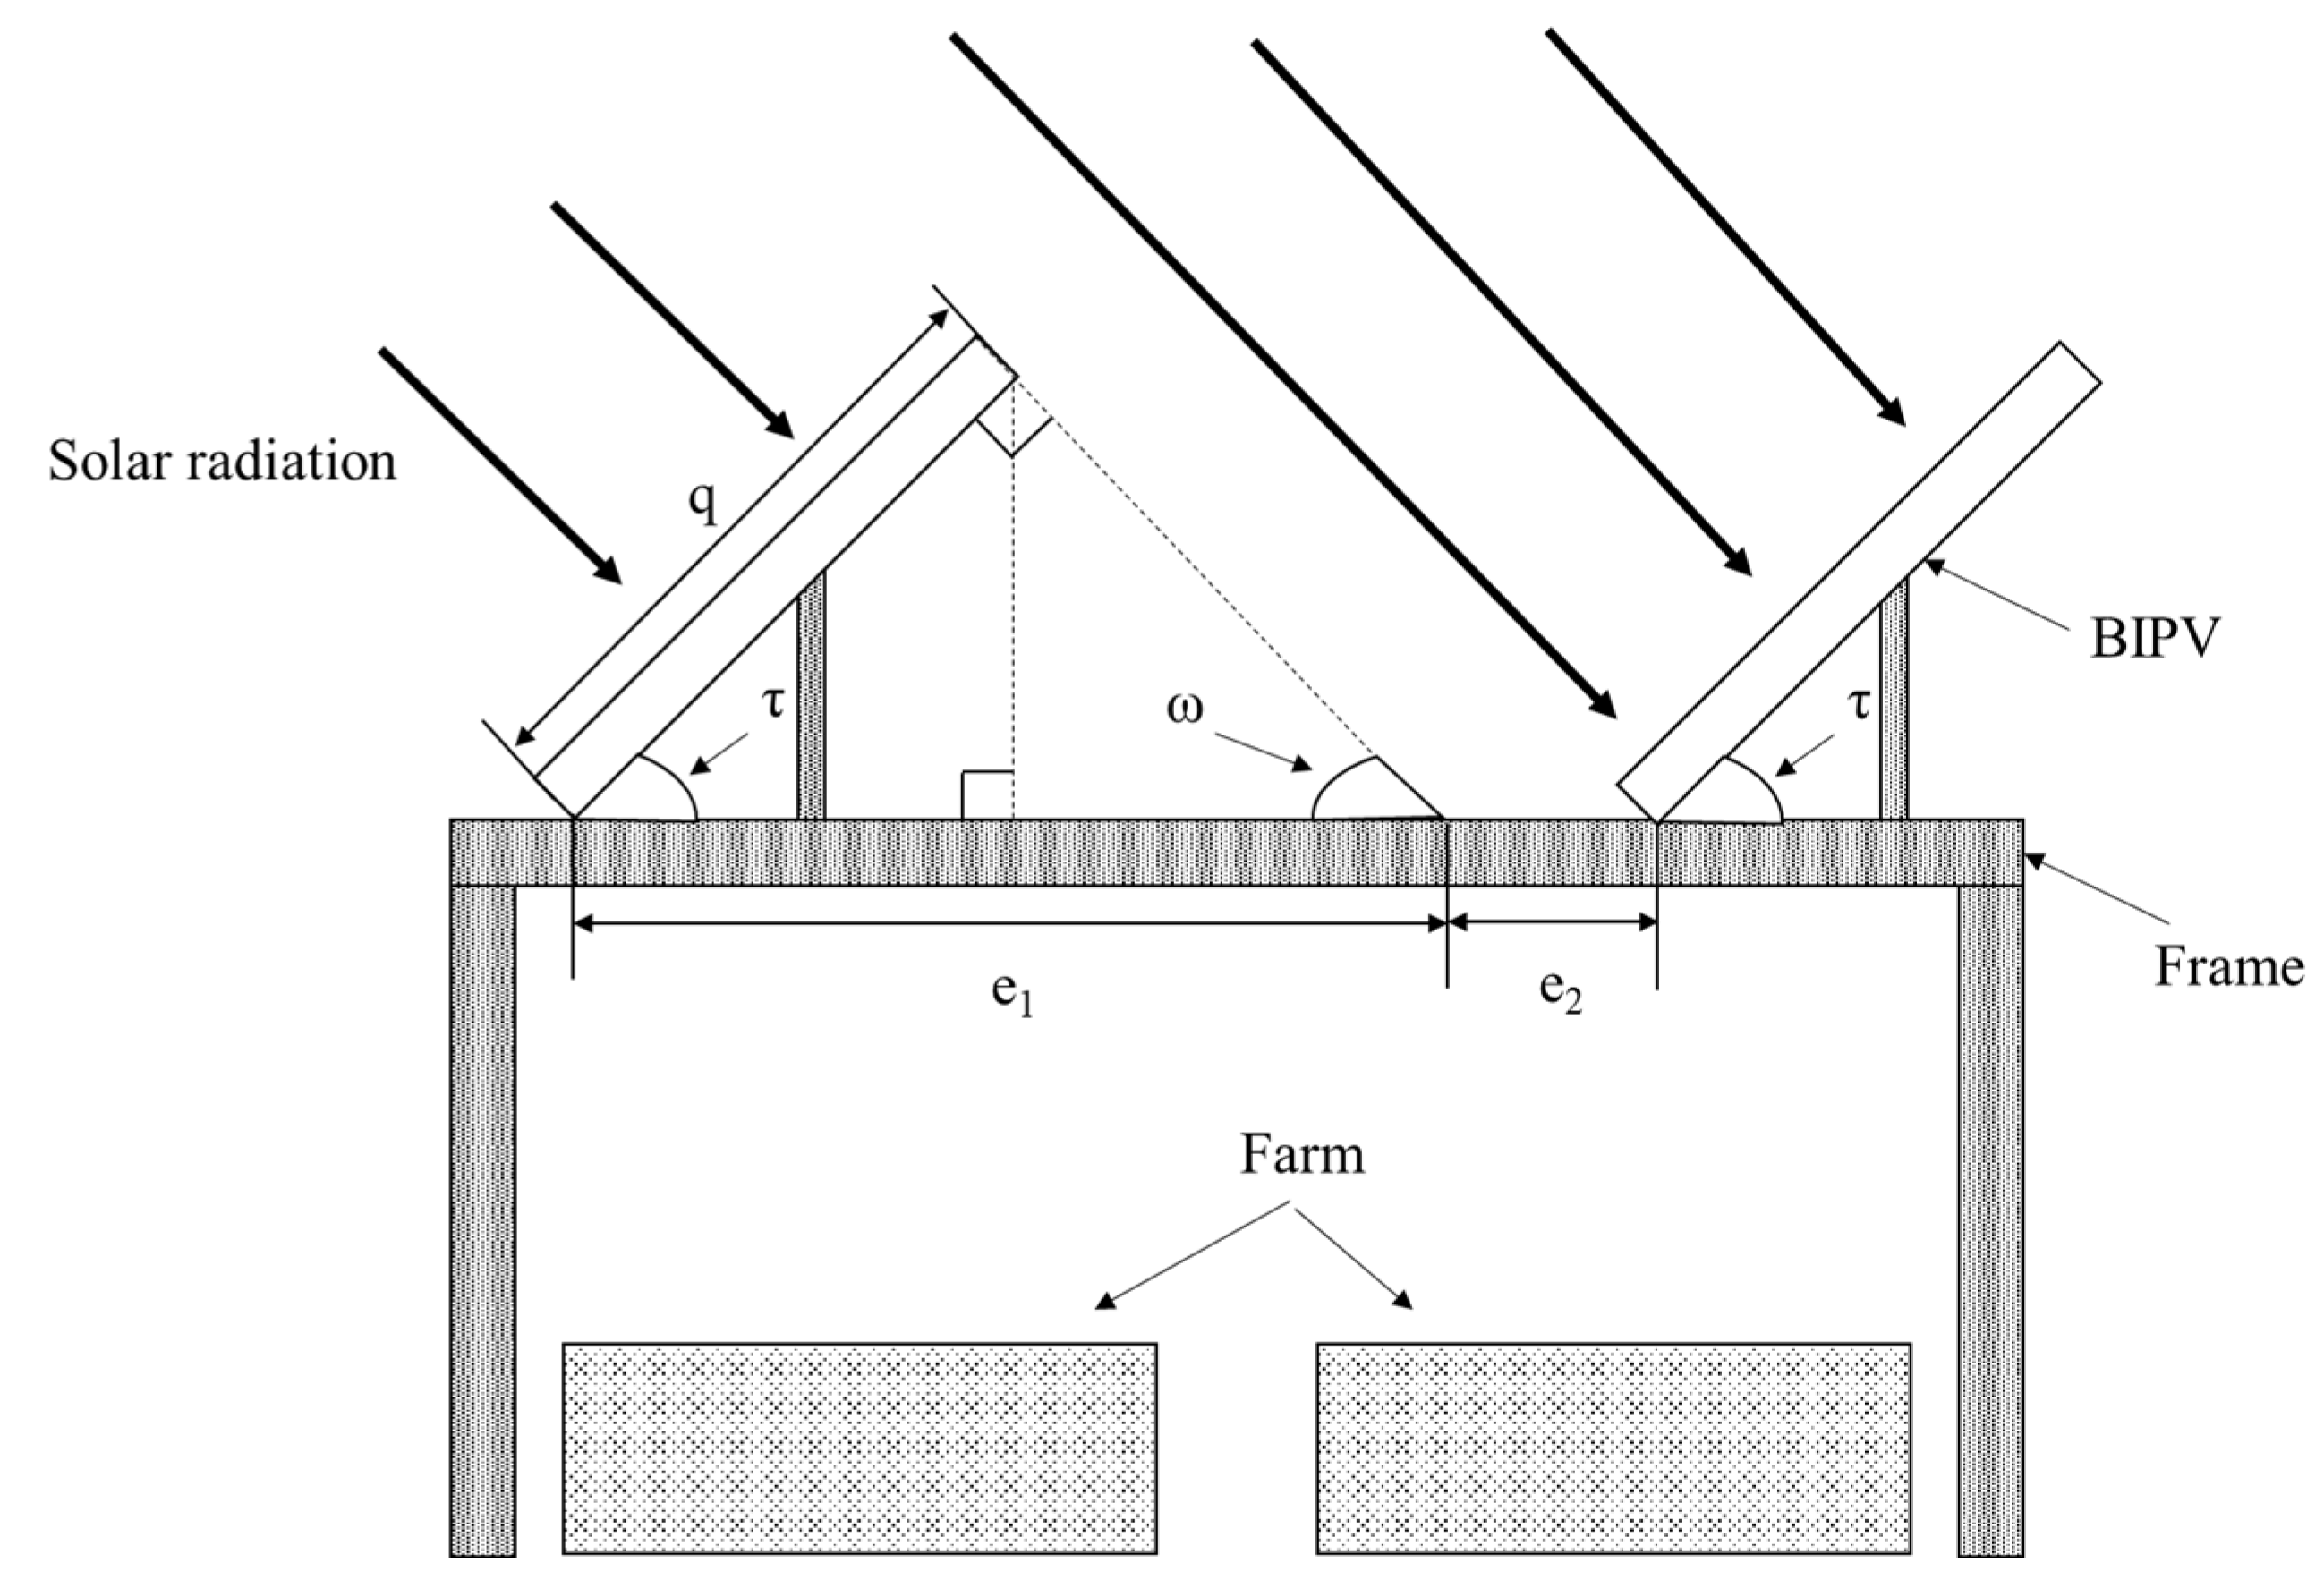
2.2. Agrophotovoltaic Systems with Building-Integrated Photovoltaics (APV–BIPV Systems)

The APV system was originally designed to utilize PV panels to generate electricity on existing farms [31]. Plants can grow by absorbing solar radiation from the open spaces between the BIPVs. As the APV system preserves the existing farm, it is deemed a sustainable alternative to traditional PV power plants. Figure 2a depicts a typical APV system at the Jeollanamdo Agricultural Research and Extension Services in Naju-si (35.0161° N, 126.7108° E), Jeollanam-do, South Korea. The system features three different shading ratios of 21.3%, 25.6%, and 32% [16]. BIPVs, instead of regular PV panels, can also be mounted on the frame of an APV system to generate electricity, with plants cultivated beneath the BIPVs. Kim and Kim [18] explored the feasibility of installing a semi-transparent BIPV as shown in Figure 2b on an APV system. As the area transmitted through resin and glass increases, so does the solar radiation absorption rate by plants beneath the BIPVs, potentially boosting crop production.
If a semi-transparent BIPV, such as the one illustrated in Figure 2b, is integrated into an APV system, it would resemble the design shown in Figure 3 [18]. This suggests that the light provision for the farm in the lower module of the APV–BIPV system requires a different computation method compared to the shading ratio calculation method used in an APV system, which accounts for the installation spacing and angle of existing PV modules and the height of the frame.
In Figure 3, e 1 represents the horizontal distance of the area shaded by a BIPV; e 2 denotes the horizontal distance of the open area between BIPVs; q is the length of a BIPV; ω is the solar altitude angle (°); and τ is the tilt angle of the BIPV (°). The shaded area ( e 1 ) is calculated using Equation (1).
e 1 = q cos τ
If the ratio of PV cells in the BIPV module is represented by ρ , the shaded area calculated through Equation (1) can be modified using Equation (2).
e 1 B I P V = ρ q cos τ
Equation (3) defines the shading ratio determined by the horizontal distance ( e 1 ) of the shaded area and the horizontal distance ( e 2 ) of the open area between BIPVs. Because ρ is between 0 and 1, e 1 B I P V is always less than or equal to e 1 . Note that most PV modules in South Korea are set to a tilt angle ( τ ) of 30 ° to maximize productivity [32].
S B I P V = e 1 B I P V / e 1 + e 2

2.3. Biofuel Production in APV–BIPV Systems

Kim et al. [16] determined that an optimal shading ratio of 32% is necessary for an agrophotovoltaic crop production system for various crops like sesame (Sesamum indicum), mung bean (Vigna radiata), red bean (Vigna angularis), corn (Zea mays), and soybean (Glycine max). Table 1 details the grain yields for these crops under different shading ratios in an APV system. The highest grain yields are recorded under unshaded conditions (shading ratio of 0%), followed by shading ratios of 21.3%, 25.6%, and 32%. Corn exhibits the highest yield at a 21.3% shading ratio, suggesting that farmers could increase their revenue through an APV system that generates both electricity and corn.
Figure 4 shows that corn yield under APV can be effectively modeled using polynomial regression (PR), which captures the non-linear relationship between independent and dependent variables [33] (see Equations (4) and (5)).
Y = g X 1 , , X n = β 0 + f 1 X 1 + + f n X n + ε ,   ε ~ N 0 , j = 1 n σ j 2
f j X j = β j 1 X j + β j 2 X j 2 + + β j L X j L , j = 1 , 2 , , n
where f j X j is the polynomial function of variable X j ; β 0 = j = 1 n β j 0 X j 0 ; X j 0 = 1 ; β j is a coefficient of X j ; and β 0 is the constant term. Using the least squares method to determine PR model parameters, corn yield (kg/m2/year) can be described by Equation (6) [31].
Y c o r n = 0.8208 + 84.456 × 10 4 S B I P V 5.2067 × 10 4 S B I P V 2 0
where S B I P V ranges from 0 to 0.32. The coefficient of determination (R2) of Equation (6) is 76.91%, indicating that the developed model can accurately predict corn yields under varying shading ratios in APV–BIPV systems. In Figure 4a, the yield decreases nonlinearly, following a quadratic function, as the shading ratio increases. Notice that the dotted line represents a trend of the estimated values by Equation (6), and the gray dots represent the observed values. Given that electricity production is enhanced by increasing the proportion of PV cells (i.e., the shading ratio) in the BIPV module, this reduction in yield is at odds with the goals of electricity production. Therefore, to optimize electricity generation while minimizing impact on farm productivity, an appropriate shading ratio needs to be determined. As the study seeks to enhance corn output for biofuel production, the optimal shading ratio can be derived by differentiating Equation (6), as illustrated in Equation (7).
d Y c o r n d S B I P V = 84.456 10.4134 S B I P V = 0 S B I P V = 8.1103  
According to [34], 0.4173 L of ethanol can be derived from 1 kg of corn. Given this, the ethanol production can be estimated based on yields under various shading ratios, as depicted in Figure 4b.

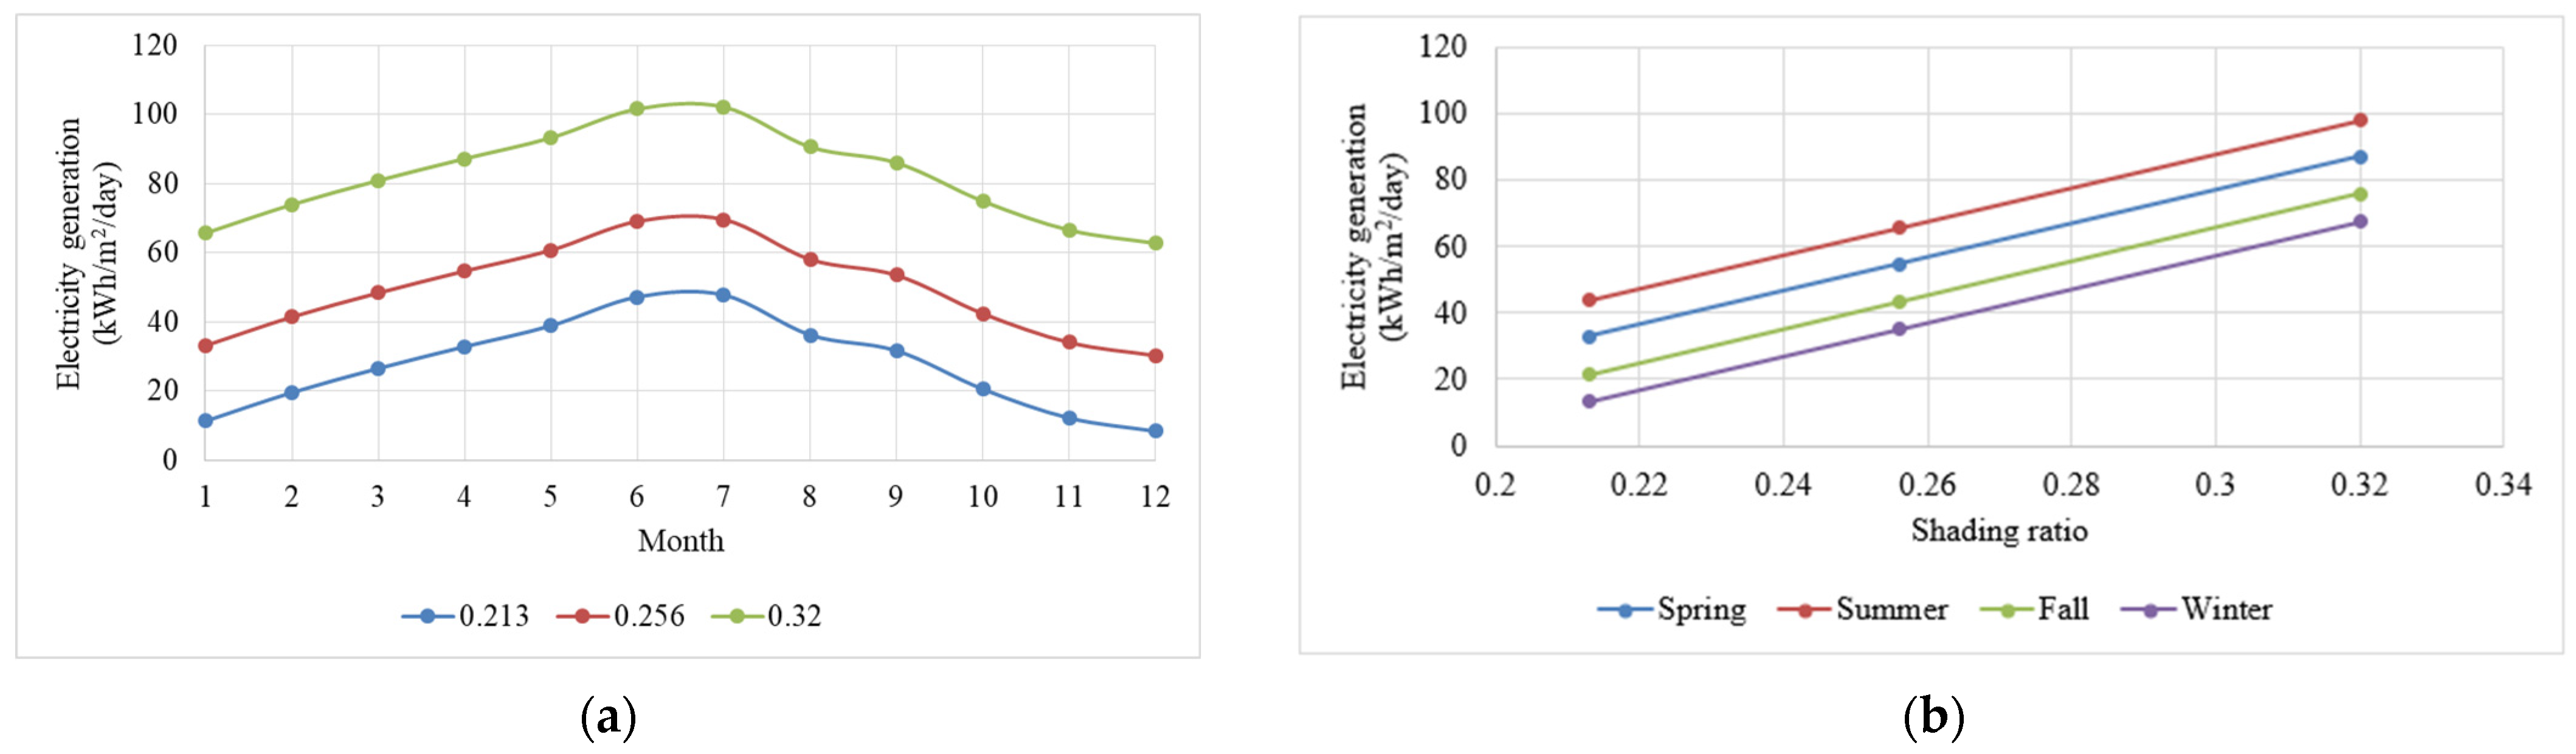
2.4. Electricity Generation in APV–BIPV Systems

Similar to the variation in corn harvest yield related to shading ratio discussed in Section 2.3, power generation from APV–BIPV also varies with changes in shading ratio. This occurs because the number of PV cells per unit area rises as the shading ratio ( S B I P V ) or the percentage of PV cells in the BIPV module ( ρ ) increases. In APV, the quantity of electricity generated ( E P V S , kWh/m2/day) is modeled using polynomial regression as shown in Equation (8) [16], and this model can be adapted to predict power generation in the APV–BIPV system as detailed in Equation (9). It should be noted that the APV–BIPV system utilizes monofacial PV modules (i.e., LG405N2W-V5, LG, Gumi-si, Republic of Korea). Technical data of monofacial PV module are described in Table A1.
E A P V S B I P V = 5.42 × 10 2 + 1.75 × 10 2 X 1 1.07 × 10 17 X 2 + 4.73 × 10 19 X 3 + 1.97 × 10 19 X 3 2 4.88 × 10 19 X 4 + 1.00 × 10 21 X 4 2 + 3.29 × 10 18 X 5 3.18 × 10 22 X 5 3 + 2.86 × 10 18 X 6 + 2.06 × 10 1 S B I P V 0
E B I P V S B I P V = ρ E A P V S B I P V 0
In Equations (8) and (9), X 1 represents daily solar radiation (MJ/m2); X 2 denotes the maximum daily temperature (°C); X 3 indicates the minimum daily temperature (°C); X 4 reflects the daily precipitation (mm); X 5 describes the daily humidity (%); X 6 measures the daily wind speed (m/s); and S defines a shading ratio ( 0.20 S 0.32 ).

2.5. Performance Metric

This study will assess the economic feasibility of the APV–BIPV system, using LCOE (levelized cost of energy) and NPV (net present value) as evaluation criteria. Equation (10) delineates the LCOE ($/kWh), facilitating its measurement.
L C O E = t = 0 T C t t = 0 T Q t
where C t represents the cost (US$) of the BIPV at time t; Q t denotes the quantity of energy produced at time t; and T symbolizes the lifetime of the BIPV. Specifically, Equation (10) describes the LCOE as quantifying the cost (US$) of the BIPV relative to the amount of electricity generated over its 25-year lifespan [17]. Equation (11) illustrates the net present value (NPV) of the cash flow.
N P V = R e l e c t r i c i t y , t C t 1 + r t
where r represents the discount rate (%). The discount rate considers future cash flows at the present value so that it makes possible to judge the appropriateness of investment.

3. Results

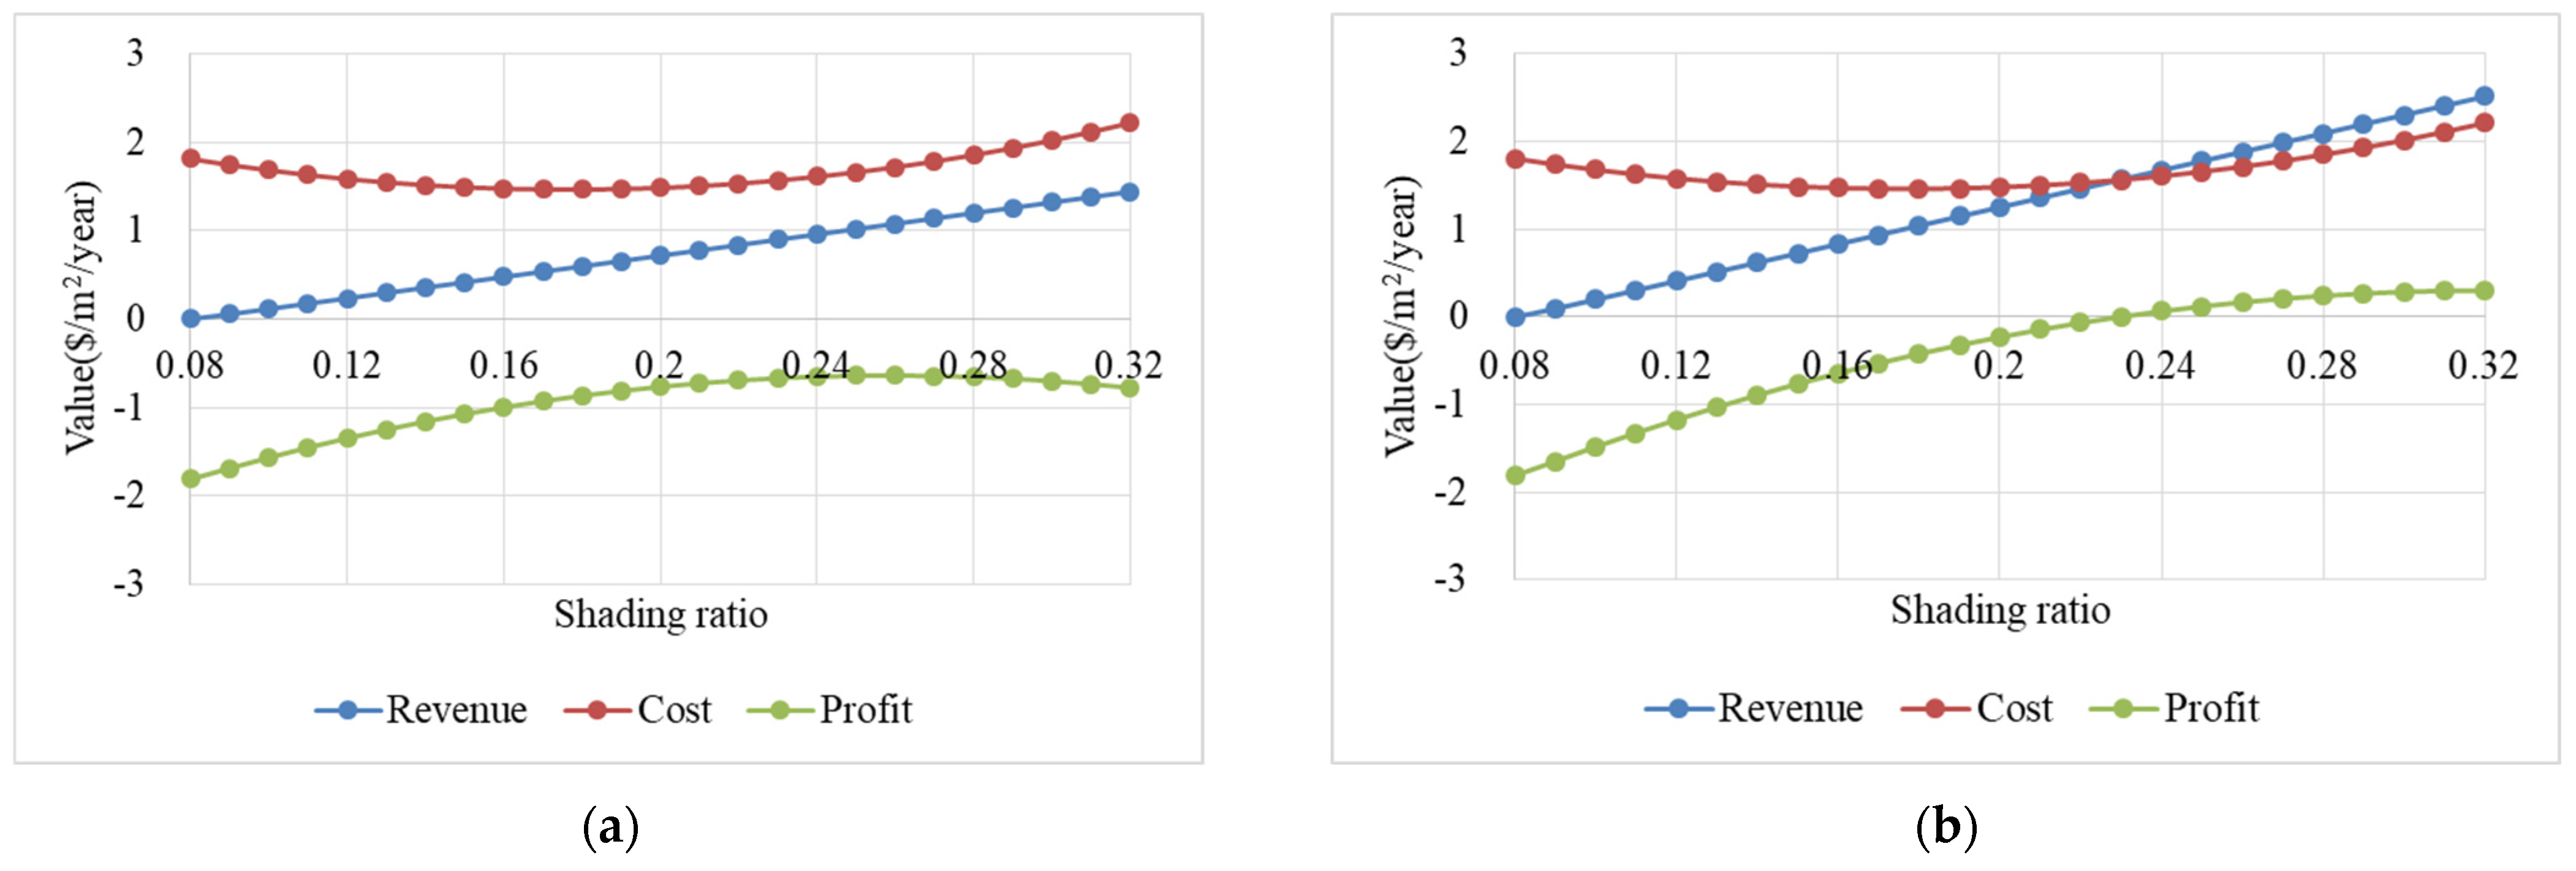
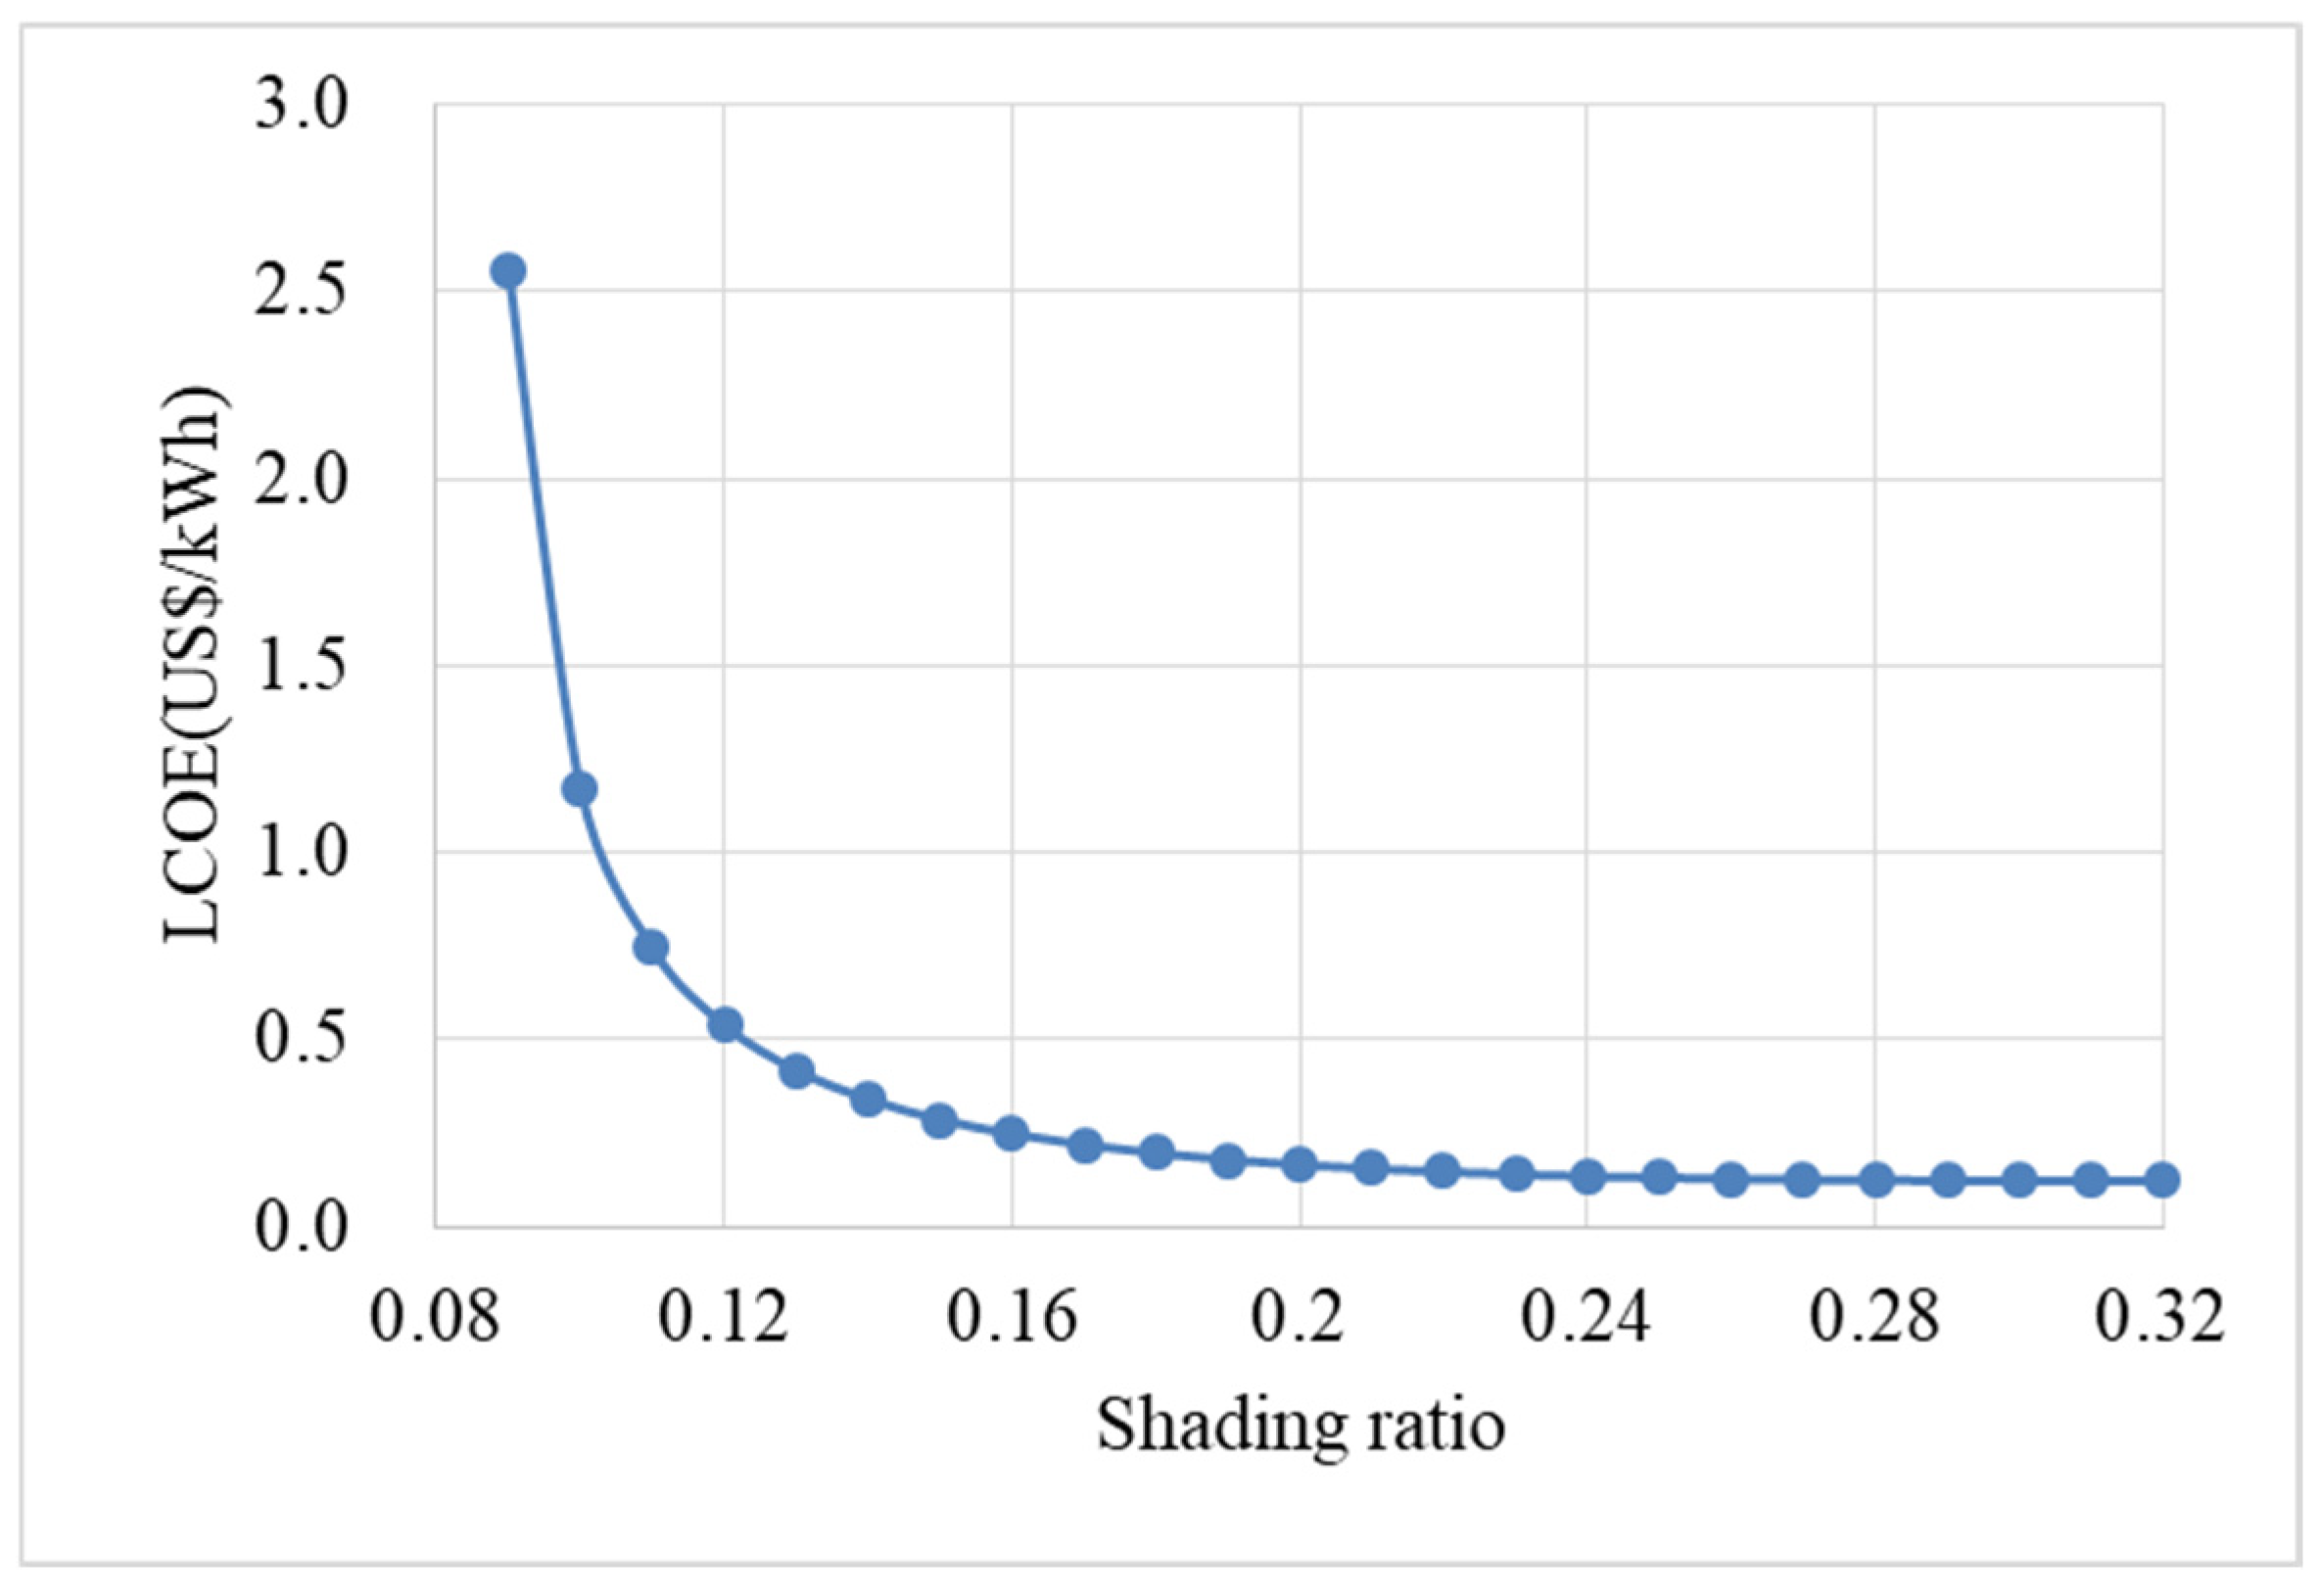
3.1. Feasibility Analysis on APV–BIPV Systems

Electricity generation quantities of an APV–BIPV system can be estimated, as shown in Figure 5, using the climate data from Naju-si, South Korea, spanning 2012 to 2022, presented in Table 2 [35]. Table 2 indicates that the crop growing season, from June to October, typically experiences higher solar radiation values compared to other months.
According to the climate characteristics presented in Table 2, the crop growing season demonstrates higher electricity productivity compared to other months, as evident from Figure 5a. The summer season generates electricity the most and the winter season shows the lowest electricity generation. Furthermore, Figure 5b illustrates that a higher shading ratio enables the installation of more PV modules per unit area (m2), which generally results in a linear increase in electricity generation as the shading ratio rises.
To conduct an economic analysis of the APV–BIPV system, costs associated with construction, operation, and maintenance were derived from the expenses of the existing APV system [18]. In this evaluation, the cost of the module escalated because the BIPV module is 1.46 times more costly than the typical PV module [36]. As the shading ratio increases, the necessary number of BIPV modules per unit area increases, raising the total installation costs (see Table 3). Annual operating and maintenance costs are calculated by considering life cycle cost, installed capacity, and PV module information.
Using the estimated electricity generation data from Figure 5, the annual revenue, cost, and profit from electricity generation can be projected (see Figure 6). When the system marginal price (SMP) is US$ 0.08/kWh [38] with a discount rate of 0.01, there are no profits under any shading ratio, necessitating a renewable energy certificate (REC) for profitability. With REC and SMP valued at US$ 0.14/kWh [38] and a discount rate of 0.01, a shading ratio of 0.23 becomes the minimum required for profit, suggesting that the optimal shading ratio for a cost-effective APV–BIPV system must be considered.
To see the profit change by the discount rate, sensitivity analysis is conducted. As shown in Table 4, the profit of electricity generation in the SMP case is always less than 0. In the REC and SMP case, a discount rate up to 0.02 generates profit with high shading ratio conditions. At over a 0.03 discount rate, the REC and SMP case also has no profit. As the discount rate increases, profit loss also increases. This indicates that appropriate electricity pricing policy should be considered for a profitable system.
Based on the cost data in Table 3, LCOE values under varying shading ratios can be determined as illustrated in Figure 7. As the shading ratio increases, the potential number of PV modules per unit area grows, leading to a reduction in the LCOE value. With additional modules installed, the cost per unit area decreases due to economy of scale principles. It should be noted that BIPV installation costs encompass not just the PV module expenses, but also structural, electric distribution system, and other shared costs. Similar to Figure 6, after reaching a shading ratio of 0.23, the LCOE values stabilize at approximately US$ 0.12/kWh.

3.2. Feasibility Analysis on Biofuel Production in APV–BIPV Systems

As mentioned in Section 2.3, corn yields can vary under different shading ratios, with an optimal shading ratio of 8.11% maximizing corn yield. Corn production, as detailed in Table 5, forms the basis for the feasibility analysis of biofuel production in the APV–BIPV system. The overall production cost, including materials, labor, and overhead, amounts to USD 1.07/m2/year.
According to [39], the selling price of corn in 2024 is estimated at USD 1.53/kg. Figure 8a illustrates the revenue, cost, and profit from corn sales within the APV–BIPV system. The production cost of corn remains fixed, irrespective of the corn yield, since the per unit area cost is constant, while sales vary with yield, which depends on the shading ratio. Consequently, a reduction in corn yield due to increased shading ratios leads to decreased profits. Though corn yields peak at a shading ratio of 8.11%, they diminish at higher ratios, suggesting that it is optimal to maintain a shading ratio of up to 26%. Notably, the production and sale of ethanol from harvested corn within the APV–BIPV system can enhance profits, as evidenced in Figure 8b, with ethanol sales yielding an average profit margin of 9% over production costs [40]. As profits from ethanol sales rise, profit generation continues, up to a shading ratio of 30%. Additionally, ethanol sales augment revenue from corn by approximately 4.25 times through a sophisticated refining process that adds value to the corn.
The overall revenue, cost, and profit of the APV–BIPV system are depicted in Figure 9. These figures utilize data from electricity and biofuel sales presented in Figure 6 and Figure 8. Figure 9a considers only corn sales in the SMP scenario, while Figure 9b examines court sales in both the SMP and REC scenarios. In these scenarios, the APV–BIPV system does not yield profits due to substantial losses in electricity sales. Although a profitable operation up to a shading ratio of 26% is feasible when selling only corn (refer to Figure 8), this outcome is compromised by significant deficits in electricity sales. Nonetheless, the highest profit of US$ 0.17/m2/year is recorded at a shading ratio of 27.47% in Figure 9c, attributed to peak crop profits at a shading ratio of 8.11%, despite increasing profits from electricity sales at higher shading ratios. Similarly, ethanol production using corn in Figure 9d can achieve a maximum profit of US$ 0.33/m2/year at a shading ratio of 26.95%, representing a 53.57% increase over the highest profit in the SMP and REC scenarios documented in Figure 9c.
Nevertheless, the APV–BIPV system can generate additional revenue through crop production, with corn achieving the highest yield at 8.11%, and thus the greatest biofuel production. However, as the shading ratio increases, corn yield decreases while electricity production increases. It was demonstrated that under REC and SMP policy conditions, at a shading ratio of 26.95%, it is possible to generate a revenue of US$ 0.33/m2/year by selling both corn and biofuel. This represents a 53.57% increase in profit compared to producing corn alone, attributed to the added value from the refining process of the biofuel.

4. Discussion

Using BIPVs, NZEBs can be constructed, not only to mitigate CO2 emissions, but also to enhance crop growth through additional solar radiation that penetrates the transparent part of BIPV. This study analyzed the economic feasibility of corn and biofuel production using APV–BIPV. In Section 2.1, examples of semi-transparent BIPVs installed in both urban and rural areas of South Korea are presented. Despite the constraints of urban locations, the city of Seoul strives to expand solar power generation from 346 MW in 2021 to an anticipated 800 MW by 2030, introducing more than 40 MW of generation capacity annually [40]. Section 2.2 introduces the structural characteristics of the APV–BIPV system. Predictions for corn and biofuel production were made using polynomial regression based on field data in Section 2.3, and electricity production forecasts were discussed in Section 2.4.
To ascertain the economic viability of the proposed APV–BIPV system, LCOE and NPV metrics were employed, and an in-depth analysis was conducted in Section 3. Since BIPV modules are 1.46 times more expensive than conventional PV modules [36], APV–BIPV incurs higher installation costs than traditional APV systems. Consequently, profitability from only the SMP policy is challenging. Therefore, both SMP and REC policies must be implemented. In Korea, the unit price for electricity is set at US$ 0.14/kWh [38]. It was determined that profitable electricity sales are feasible with shading ratios of 25% or higher. LCOE indicated that as the shading ratio increases, it converges to US$ 0.12/kWh, which is 81% higher than that of conventional PV power plants at US$ 0.066/kWh [41]. This increase is due to the design needs of the APV system, necessitating elevated structures and wider spacing between PV modules to ensure sufficient solar radiation for optimal crop growth.
Nevertheless, the APV–BIPV system can generate additional revenue through crop production, with corn showing the highest yield at 8.11%, thus leading to the greatest biofuel production. However, as the shading ratio increases, corn yield decreases while electricity production rises. It was demonstrated that selling corn and biofuel together at a shading ratio of 26.95% under REC and SMP policy conditions can yield a revenue of US$ 0.33/m2/year. This represents a 53.57% increase in profit compared to producing corn alone, with the profit boost stemming from the biofuel refining process, which adds value through crop processing. Nonetheless, under solely SMP policy conditions, it proved challenging to avoid a deficit even when selling corn and biofuel simultaneously, owing to the low electricity sales price (US$ 0.08/kWh). In such scenarios, it appears more pragmatic to generate and sell electricity through a dedicated PV power plant rather than employing APV or APV–BIPV systems for electricity production. However, considering the primary objective of APV, which is to generate electricity while protecting farms and sustainably producing renewable energy, the government should help promote APV and APV–BIPV activation through REC or subsidy support policies. Particularly, since BIPV systems can adjust shading ratios by replacing PV modules in existing APV frameworks, the government should explore additional strategies to lower BIPV costs.

5. Conclusions

In this study, we assessed the economic feasibility of integrating an APV system with a Building-Integrated Photovoltaic (BIPV) system for biofuel production. To accomplish this, we analyzed cases of BIPV installations in both urban and rural areas in Korea, and described the characteristics of the combined APV–BIPV system. We proposed a method to adjust the shading ratio, which is crucial for crop growth, through BIPV, and developed a polynomial regression model to predict power production, crop production, and biofuel production at various shading ratios. The advantage of APV–BIPV is that it can meet differing sunlight requirements for each crop by adjusting the shading ratio using BIPV, unlike the existing APV systems. Through the experiment, a shading ratio of 8.11% is optimal for producing corn and bioethanol in APV–BIPV systems. In the economic evaluation, data collected from a field study were utilized to analyze the feasibility of producing corn-based biofuel, which is increasingly in demand due to the Korean government’s mixed fuel use policy, based on the LCOE and NPV. Specifically, we considered the Korean government’s two electricity sales price policies, SMP and REC. We found that the SMP policy causes substantial losses in electricity sales due to excessively low electricity prices, making it unprofitable to sell corn and biofuel. However, with simultaneous support from SMP and REC, it becomes profitable, whether selling only corn or both corn and biofuel. With the 26.95% shading ratio, the revenue of selling both corn and biofuel is US$ 0.33/m2/year. It is more than 50% higher profit than producing corn only. This reveals that government support policies play a crucial role in the operation of the APV–BIPV system. Consequently, this study’s significance lies in its analysis of how renewable energy production in the proposed APV–BIPV system contributes to the Korean government’s renewable energy production goals and provides guidelines on the benefits that farmers can derive from renewable energy production and energy crop harvesting.
Although this study performed an economic feasibility analysis of the new APV–BIPV system using field study data, to generalize the analysis results, it is essential to gather more data through additional field studies and to perform further analyses on various cases in the future.

Author Contributions

Conceptualization, S.K. and Y.K.; methodology, S.K. and Y.K.; software, Y.K.; validation, S.K. and Y.K.; resources, S.K.; writing—original draft preparation, S.K. and Y.K.; writing—review and editing, S.K. and Y.K.; visualization, Y.K.; project administration, S.K.; funding acquisition, S.K. All authors have read and agreed to the published version of the manuscript.

Funding

This work was supported by a Basic Science Research Program through the National Research Foundation of Korea (NRF) funded by the Ministry of Education (No. RS-2023-00239448).

Data Availability Statement

The original contributions presented in this study are included in the article. Further inquiries can be directed to the corresponding author(s).

Acknowledgments

The authors gratefully acknowledge the support of the NRF of Korea, which is funded by the Ministry of Education.

Conflicts of Interest

The authors declare no conflicts of interest.

Appendix A

Table A1. Technical data of the monofacial PV module (LG405N2W-V5).
InformationValue
Cell Configuration72 Cells
Module Dimensions 2024   m m × 1024   m m × 40   m m
Weight20.3 kg
Operating Temperature−40~90 °C
Maximum Power405 W
MPP Voltage41.0 V
MPP Current9.89 A
Module Efficiency19.5%

References

  1. Kim, Y.; Kim, S.; Kim, S. An integrated agent-based simulation modeling framework for sustainable production of an Agrophotovoltaic system. J. Clean. Prod. 2023, 420, 138307. [Google Scholar] [CrossRef]
  2. IEA. Renwables 2023. International Energy Agency. 2023. Available online: https://www.iea.org/reports/renewables-2023/electricity (accessed on 8 April 2025).
  3. Erofeev, Y. Over 340 GW of Solar Power Plants Are to Be Installed This Year. Medium. 2023. Available online: https://medium.com/@erofeev.yury/over-340-gw-of-solar-power-plants-are-to-be-installed-this-year-3fda86bb2f44 (accessed on 8 April 2025).
  4. Bernreuter Research. Polysilicon Market Reports. 2024. Available online: https://www.bernreuter.com/polysilicon/price-trend/ (accessed on 8 April 2025).
  5. Kang, J.H. 2023 Semi-Annual Report. Export-Import Bank of Korea. 2023. Available online: https://www.ctis.re.kr/ko/downloadBbsFile.do?atchmnflNo=9673 (accessed on 8 April 2025).
  6. Sartori, I.; Napolitano, A.; Voss, K. Net zero energy buildings: A consistent definition framework. Energy Build. 2012, 48, 220–232. [Google Scholar] [CrossRef]
  7. Kim, S.; Aydin, B.; Kim, S. Simulation modeling of a photovoltaic-green roof system for energy cost reduction of a building: Texas case study. Energies 2021, 14, 5443. [Google Scholar] [CrossRef]
  8. Costa, A.; Keane, M.M.; Torrens, J.I.; Corry, E. Building operation and energy performance: Monitoring, analysis and optimisation toolkit. Appl. Energy 2013, 101, 310–316. [Google Scholar] [CrossRef]
  9. Kim, S.; Kim, S. Economic Feasibility Comparison between Building-Integrated Photovoltaics and Green Systems in Northeast Texas. Energies 2023, 16, 4672. [Google Scholar] [CrossRef]
  10. Biyik, E.; Araz, M.; Hepbasli, A.; Shahrestani, M.; Yao, R.; Shao, L.; Essah, E.; Oliveira, A.C.; del Caño, T.; Rico, E.; et al. A key review of building integrated photovoltaic (BIPV) systems. Eng. Sci. Technol. Int. J. 2017, 20, 833–858. [Google Scholar] [CrossRef]
  11. Martín-Chivelet, N.; Kapsis, K.; Wilson, H.R.; Delisle, V.; Yang, R.; Olivieri, L.; Polo, J.; Eisenlohr, J.; Roy, B.; Maturi, L.; et al. Building-Integrated Photovoltaic (BIPV) products and systems: A review of energy-related behavior. Energy Build. 2022, 262, 111998. [Google Scholar] [CrossRef]
  12. IEC 63092-1; Photovoltaics in Buildings—Part 1: Requirements for Building-Integrated Photovoltaic Modules. International Electrotechnical Commission: Geneva, Switzerland, 2020.
  13. Bonomo, P.; Eder, G.; Martín Chivelet, N.; Eisenlohr, J.; Frontini, F.; Kapsis, C.; Scognamiglio, A.; Wilson, H.R.; Yang, R. Categorization of BIPV Applications. 2021. Available online: https://iea-pvps.org/key-topics/categorization-of-bipv-applications/ (accessed on 24 May 2024).
  14. Shukla, A.K.; Sudhakar, K.; Baredar, P. Recent advancement in BIPV product technologies: A review. Energy Build. 2017, 140, 188–195. [Google Scholar] [CrossRef]
  15. Eder, G.; Peharz, G.; Trattnig, R.; Bonomo, P.; Saretta, E.; Frontini, F.; López, C.S.P.; Wilson, H.R.; Eisenlohr, J.; Chivelet, N.M.; et al. Coloured Bipv: Market, Research and Development. International Energy Agency. 2019. Available online: https://iea-pvps.org/wp-content/uploads/2020/01/IEA-PVPS_15_R07_Coloured_BIPV_report.pdf (accessed on 8 April 2025).
  16. Kim, S.; Kim, S.; Yoon, C.Y. An efficient structure of an agrophotovoltaic system in a temperate climate region. Agronomy 2021, 11, 1584. [Google Scholar] [CrossRef]
  17. Kim, S.; Kim, S. Agricultural Research and Development Center Design with Building Integrated Photovoltaics in Fiji. Energies 2023, 17, 207. [Google Scholar] [CrossRef]
  18. Kim, S.; Kim, S. Design of an Agrivoltaic System with Building Integrated Photovoltaic. Agronomy 2023, 13, 2140. [Google Scholar] [CrossRef]
  19. Romaní, J.; Ramos, A.; Salom, J. Review of transparent and semi-transparent building-integrated photovoltaics for fenestration application modeling in building simulations. Energies 2022, 15, 3286. [Google Scholar] [CrossRef]
  20. Colantoni, A.; Monarca, D.; Marucci, A.; Cecchini, M.; Zambon, I.; Di Battista, F.; Maccario, D.; Saporito, M.G.; Beruto, M. Solar radiation distribution inside a greenhouse prototypal with photovoltaic mobile plant and effects on flower growth. Sustainability 2018, 10, 855. [Google Scholar] [CrossRef]
  21. Kılkış, Ş. Benchmarking the sustainability of urban energy, water and environment systems and envisioning a cross-sectoral scenario for the future. Renew. Sustain. Energy Rev. 2023, 103, 529–545. [Google Scholar]
  22. Shim, H.; Lee, S. A Study on the Performance Increase in Building Energy Technology according to the Korea’s Zero Energy Building Policy. J. Korea Acad.-Ind. Coop. Soc. 2021, 22, 543–553. [Google Scholar]
  23. Li, L.; Dai, C. Internal and External Factors Influencing Rural Households’ Investment Intentions in Building Photovoltaic Integration Projects. Energies 2024, 17, 1071. [Google Scholar] [CrossRef]
  24. NEA. Notice on the Announcement of the Pilot List of Distributed Rooftop Photovoltaic Development in Whole Counties (Cities and Districts); NEA: Beijing, China, 2021. [Google Scholar]
  25. South Korean Ministry of Trade, Industry and Energy. Renewable Energy Supply Project (Building Support). 2010. Available online: https://www.aurum.re.kr/Policy/PolicyOffice.aspx?pcode=H06 (accessed on 24 May 2024).
  26. HS Solar Energy. BIPV/BAPV Solar Panel. Available online: https://www.solar-onestop.com/ (accessed on 24 May 2024).
  27. IAAN. Construction Case of Photovoltaics Sunroom. Available online: http://iaansunroom.com/index.php/sunroom_construction_case/?mod=document&uid=826 (accessed on 24 May 2024).
  28. Azhar, M.H.A.; Alhammadi, S.; Jang, S.; Kim, J.; Kim, J.; Kim, W.K. Long-Term Field Observation of the Power Generation and System Temperature of a Roof-Integrated Photovoltaic System in South Korea. Sustainability 2023, 15, 9493. [Google Scholar] [CrossRef]
  29. Kanagawa, M.; Nakata, T. Assessment of access to electricity and the socio-economic impacts in rural areas of developing countries. Energy Policy 2008, 36, 2016–2029. [Google Scholar]
  30. Lee, J.; Shepley, M.M. Benefits of solar photovoltaic systems for low-income families in social housing of Korea: Renewable energy applications as solutions to energy poverty. J. Build. Eng. 2020, 28, 101016. [Google Scholar]
  31. On, Y.; Kim, S.; Kim, S. Multi-Objective optimization for design of an Agrophotovoltaic system under Non-Dominated sorting Genetic algorithm II. Comput. Electron. Agric. 2024, 224, 109237. [Google Scholar]
  32. Bipvkorea. GIPV. Available online: https://bipvkorea.com/home/sub.php?menukey=466 (accessed on 24 May 2024).
  33. Lu, S.M.; Zainali, S.; Stridh, B.; Avelin, A.; Amaducci, S.; Colauzzi, M.; Campana, P.E. Photosynthetically active radiation decomposition models for agrivoltaic systems applications. Sol. Energy 2022, 244, 536–549. [Google Scholar] [CrossRef]
  34. U.S. Energy Information Administration. Rising Corn Prices and Oversupply Push Ethanol Operating Margins to Multiyear Lows. Available online: https://www.eia.gov/todayinenergy/detail.php?id=40813# (accessed on 16 December 2024).
  35. Korea Meteorological Administration. Automated Synoptic Observing System (ASOS) Data. Available online: https://data.kma.go.kr/data/grnd/selectAsosRltmList.do?pgmNo=36 (accessed on 24 May 2024).
  36. WEUP Power Co., Ltd. Products. Available online: https://www.weuppower.com/ (accessed on 16 February 2025).
  37. Walker, A.; Lockhart, E.; Desai, J.; Ardani, K.; Klise, G.; Lavrova, O.; Tansy, T.; Deot, J.; Fox, B.; Pochiraju, A. Model of Operation-and-Maintenance Costs for Photovoltaic Systems; Technical Report No. NREL/TP-5C00-74840; National Renewable Energy Laboratory: Golden, CO, USA, 2020. [Google Scholar]
  38. Korea Power Exchange. Today Power Information. Available online: https://www.kpx.or.kr/ (accessed on 16 February 2025).
  39. Korea Agro-Fisheries & Food Trade Corporation. Price Information. Available online: https://www.kamis.or.kr/customer/main/main.do (accessed on 16 February 2025).
  40. City of Seoul. Energy Information. Available online: https://energyinfo.seoul.go.kr/main/main (accessed on 25 May 2024).
  41. PVTech. Solar LCOE Continues to Decrease Globally–Wood Mackenzie. Available online: https://www.pv-tech.org/solar-lcoe-continues-to-decrease-globally-wood-mackenzie/ (accessed on 25 May 2024).
Figure 1. Semi-transparent building integrated photovoltaics: (a) cross-section, (b) plan view, and (c) application [20].
Energies 18 01949 g001
Figure 2. Examples of agrophotovoltaic systems: (a) agrophotovoltaic system in Naju, South Korea [16]; (b) a semi-transparent BIPV [18].
Energies 18 01949 g002
Figure 3. Sectional design of an APV–BIPV system.
Energies 18 01949 g003
Figure 4. Observed and estimated values under different shading ratios: (a) harvest yields; (b) production quantities of ethanol.
Energies 18 01949 g004
Figure 5. Electricity generation quantities under different shading ratios: (a) sorted by month; (b) sorted by shading ratio.
Energies 18 01949 g005
Figure 6. Revenue, cost, and profit of electricity generation: (a) SMP case; (b) REC and SMP case [18].
Energies 18 01949 g006
Figure 7. Levelized cost of electricity (LCOE) with different shading ratios.
Energies 18 01949 g007
Figure 8. Revenue, cost, and profit of corn and ethanol sales: (a) corn sales; (b) corn and ethanol sales.
Energies 18 01949 g008
Figure 9. Revenue, cost, and profit of APV–BIPV: (a) SMP case with corn sales; (b) SMP case with corn and ethanol sales; (c) SMP and REC case with corn sales; (d) SMP and REC case with corn and ethanol sales.
Energies 18 01949 g009
Table 1. Harvested grain yields of all five crops under four shading levels: 0%, 21.3%, 25.6%, and 32%. The parentheses indicate losses (−) or gains (+) in yield compared to unshaded conditions [16].
Crop TypeShading Ratios (%)
021.325.632
Total Grain Yield (Mg ha−1)
Sesame0.960.89 (−7%)0.83 (−14%)0.45 (−53%)
Mung Bean1.951.54 (−21%)1.1 (−44%)1.09 (−44%)
Red Bean2.351.75 (−26%)1.52 (−35%)1.47 (−37%)
Corn8.098.56 (+6%)6.4 (−21%)5.63 (−30%)
Soybean3.643.15 (−13%)2.88 (−21%)2.54 (−30%)
Table 2. Daily climatic data observed from 2012 to 2022.
MonthSolar Radiation (MJ/m2)Maximum Surface Temperature (°C) 1Minimum Surface Temperature (°C) 2Precipitation (mm)Humidity (%)Wind Speed (m/s)
January1.545.40−1.3132.9374.553.76
February1.846.75−0.6529.3172.644.06
March2.1212.183.4776.5474.273.76
April2.3417.378.7796.4673.643.45
May2.5222.6113.8983.6975.823.05
June2.8525.8619.15116.3883.002.67
July2.8928.9723.27213.8987.272.93
August2.4830.4524.26181.6584.182.90
September2.3026.2519.26153.3581.552.65
October1.8520.9513.1682.0775.363.21
November1.5614.347.0055.8274.803.51
December1.447.540.6545.4275.103.89
Average2.1418.2210.9197.2977.683.32
1 The highest air temperature; 2 the lowest air temperature.
Table 3. Construction, operating, and maintenance costs of an APV–BIPV system.
Data TypeShading Ratio
21.3%25.6%32%
BIPV Module Cost (US$/m2) 19.319.9413.41
Structural Cost (US$/m2)7.247.7210.43
Electrical Distribution System Cost (US$/m2)3.453.684.97
Additional Costs (US$/m2) 20.250.270.36
Total Construction Cost (US$/m2)20.2621.6129.17
Annual Operating and Maintenance Costs (US$/m2/year) 30.590.710.89
1 The cost is derived from the market price of BIPV [36]; 2 the costs include the building permit fee and the fee for linkage to the existing electric distribution system; 3 the cost estimates from [37].
Table 4. Electricity generation profit sensitivity analysis by discount rate.
Discount RateSMP CaseREC and SMP Case
0.010.050.100.010.050.10
Shading ratio of the highest electricity generation profit0.260.240.230.320.280.26
Electricity generation profit (US$/m2/year)−0.638−1.181−1.9920.302−0.362−1.248
Table 5. Production cost of corn.
Type of CropCost of Materials (USD)Cost of Labor (USD)Overhead Costs (USD)
SeedsFertilizersPesticidesMiscellaneous
Corn (USD/m2/year)0.670.040.020.020.031.07
Disclaimer/Publisher’s Note: The statements, opinions and data contained in all publications are solely those of the individual author(s) and contributor(s) and not of MDPI and/or the editor(s). MDPI and/or the editor(s) disclaim responsibility for any injury to people or property resulting from any ideas, methods, instructions or products referred to in the content.

