Abstract
Methanol/diesel hybrid−powered vessels represent a significant advancement in green and low−carbon innovation in the maritime transportation sector and have been widely adopted across various shipping markets. However, the dual−fuel power system modifies the fire load within the engine room compared to traditional vessels, thereby significantly influencing the fire safety of methanol/diesel−powered ships. In this study, anhydrous methanol and light−duty diesel (with 0 °C pour point) were used as fuels to investigate the mixed combustion characteristics of these immiscible fuels in circular pools with diameters of 6, 10, 14, and 20 cm at various mixing ratios. By analyzing the fuel mass loss rate, flame morphology, and heat transfer characteristics, it was determined that methanol and diesel exhibited distinct stratification during combustion, with the process comprising three phases: pure methanol combustion phase, transitional combustion phase, and pure diesel combustion phase. Slopover occurred during the transitional combustion phase, and its intensity decreased as the pool diameter or methanol fuel quantity increased. Based on this conclusion, a quantitative relationship was established between slopover intensity, pool diameter, and the methanol/diesel volume ratio. Additionally, during the transitional combustion phase, the average flame height exhibited an exponential coupling relationship with the pool diameter and the methanol/diesel volume ratio. Therefore, a modification was made to the classical flame height model to account for these effects. Moreover, a prediction model for the burning rate of methanol/diesel pool fires was established based on transient temperature variations within the fuel layer. This model incorporated a correction factor related to pool diameter and fuel mixture ratio. Additionally, the causes of slopover were analyzed from the perspectives of heat transfer and fire dynamics, further refining the physical interpretation of the correction factor.
1. Introduction
Maritime transportation has been recognized as a critical component of international trade, facilitating 80–90% of global trade through shipping [1]. However, the rapid expansion of the shipping industry has been accompanied by significant environmental challenges, particularly from pollutants and greenhouse gas emissions generated by internal combustion engines during voyages [2]. In 2018, approximately 1.056 billion tons of carbon dioxide were emitted by the shipping sector, representing approximately 3% of global anthropogenic emissions [3]. Specific contributions included sulfur dioxide (SO2) at 9%, nitrogen oxides (NOx) at 17%, PM2.5 at 4%, and non−methane volatile organic compounds (NMVOC) at 4% [4]. To mitigate these emission−related challenges, international organizations and national regulatory bodies have implemented a range of policies. For instance, the International Maritime Organization (IMO) introduced its Initial Strategy for the Reduction of GHGs in 2018, which aims to achieve at least a 50% reduction in annual greenhouse gas emissions from international shipping by 2050 relative to 2008 levels [5].
Methanol offers several advantages owing to its high octane number [6], high latent heat of vaporization [7], high laminar flame speed, high oxygen content [8], and ease of sourcing raw materials for production [9]. These properties enhance combustion efficiency while reducing greenhouse gas and harmful pollutant emissions. Methanol, recognized as a promising alternative fuel [10,11], has attracted significant attention from the shipping industry. However, methanol also has certain limitations, including its low calorific value, corrosive nature, high volatility, and flammability, which diminishes its suitability as a standalone fuel. Consequently, methanol is commonly blended with diesel for use in dual−fuel engines to optimize the propulsion performance. Recently, the commercialization of methanol/diesel hybrid−powered vessels has accelerated globally. For instance, 25 large container ships equipped with MAN B&W ME−LGIM methanol/diesel dual−fuel engines were reported to have been ordered by Maersk [12]. Similarly, the development of the Cat 3500E methanol dual−fuel engine, spearheaded by Caterpillar Marine and the Dutch Damen Shipyards Group, advanced with the first on−site demonstration engine anticipated to be deployed by 2026 [13].
The current commercial methanol/diesel dual−fuel engines most commonly adopt a combined combustion mode, wherein the low−reactivity fuel, methanol, is injected into the intake port and thoroughly premixed with air during the intake and compression strokes to form a homogeneous premixed charge. Subsequently, this premixed methanol–air mixture is ignited by direct in−cylinder injection of the high−reactivity fuel, diesel [14,15,16]. Although methanol/diesel dual−fuel vessels have significant potential, their fire−safety challenges warrant careful consideration [17]. The engine rooms of ships are complex confined spaces that contain large machinery, various electrical devices, and extensive fuel pipelines. These environments are exposed to high temperatures throughout the year, which leads to fire risk [18]. Factors such as ship vibrations, collisions, or improper human operation can lead to the loosening or rupture of fuel pipelines and their connections, resulting in methanol and diesel leakage. When the leaked fuel comes into contact with high−temperature surfaces, such as exhaust manifolds, exposed boiler surfaces, turbochargers, heater components in purifiers, or encounters electric sparks, it vaporizes into hydrocarbon vapor clouds owing to the elevated temperatures. These vapor clouds can ignite, leading to the formation of pool fires that can spread rapidly and escalate into intense, uncontrollable fires [19]. Recent studies have systematically studied ship engine room fires from various perspectives, including oxygen concentration [10,20], pressure [21,22], mass loss rate [23,24], temperature distribution [18], and heat transfer [19]. However, methanol/diesel dual−fuel vessels introduce fundamental changes to traditional engine room fire dynamics. Alterations in fire sources, fire loads, and fire behavior pose significant new challenges to the fire safety of hybrid−powered ships, necessitating further research and targeted safety measures.
In recent years, systematic studies have been conducted on pool fires [25,26,27]. Methanol pool fires under various boundary conditions were experimentally analyzed by Tian et al. [28]. Under natural ventilation, larger pool diameters resulted in lower burning rates, whereas higher initial temperatures increased the burning rates during the early development and stable combustion phases. Under mechanical ventilation, the burning rate of the methanol pools initially decreased and subsequently increased, with the inflection point of the burning rate shifting to higher airflow velocities as the pool characteristic length increased. The stable combustion characteristics of a 1−m diameter methanol pool fire in a well−ventilated, quiescent environment were studied by Sung et al. [29], where comprehensive measurements of the temperature, burning rate, and heat release rate were conducted, resulting in the establishment of a detailed experimental data system. Transport phenomena within the liquid phase of methanol pool fires were examined by Vali et al. [30] using a quartz burner with a diameter of 90 mm and a depth of 12 mm, whereas the bottom thermal boundary condition was varied from −5 °C to 50 °C. Their results demonstrated that an increase in the bottom temperature within this range led to a 15% increase in both the burning rate and flame height. In addition, a mathematical model for predicting the burning rate as a function of changes in the bottom boundary temperature was developed based on experimental data and the principle of energy conservation. For diesel pool fires, the combustion behavior of light−duty diesel pool fires was experimentally investigated by Yuan et al. [31]. Key fire risk parameters, including mass burning rate, flame height, and flame radiative heat flux, were identified, enriching the experimental dataset for diesel pool fires. The unsteady combustion behavior of emulsified diesel pool fires was analyzed by Yang et al. [32], and it was concluded that boilover occurred when the temperature at the fuel−water interface and within the fuel layer exceeded the boiling point of water. The boilover intensity initially increased and then decreased with increasing water content. Thin−layer boiling phenomena in large diesel pool fires under sub−atmospheric pressure were examined by Zhao et al. [33], with analyses focusing on the combustion process, boilover intensity, onset time, and interval, and corresponding models were developed. Despite the extensive research on pool fires, most studies have concentrated on the combustion of single fuels, whereas investigations of pool fires involving multicomponent fuels, particularly immiscible multicomponent fuel mixtures, remain relatively limited. Compared with single−fuel pool fires, multicomponent pool fires are characterized by compositional changes during combustion because more volatile compounds evaporate first. Therefore, key fire characteristics such as burning rate, flame temperature, flame height, and soot emissions are influenced by fuel composition. This variability introduces increased uncertainty in the combustion characteristics of fires, particularly for fuel mixtures with significant differences in boiling points, such as gasoline–ethanol blends [34].
Significant advancements have been made in the understanding of the combustion characteristics of methanol and diesel pool fires through studies on single−fuel pool fires. Research on multi−component fuel pool fires has been actively pursued by many scholars. Pool−fire experiments using binary fuel mixtures of ethanol–water, ethanol–isopropanol, and ethanol–hexane in a circular pool with a diameter of 0.3 m were conducted by Yip et al. [34]. It was revealed that the relationship between the burning rate and fuel composition largely depended on the vapor–liquid equilibrium and relative volatility of the mixtures. Additionally, Heskestad’s correlations for flame height and temperature remained applicable across the tested conditions. The combustion process of heptane–ethanol mixed fuels in a 30 cm × 30 cm square pool was investigated by Ding et al. [35], who reported that during the azeotropic combustion phase, the mixed fuel exhibited higher burning rates and centerline temperatures than the pure fuels. Furthermore, the flame eruption frequency adhered to the empirical relationship between the Strouhal and Froude numbers of pure fuels. Zhu et al. [36] explored the effects of low ambient pressure on the flame characteristics of ethanol–gasoline mixed pool fires. Their findings revealed that Heskestad’s correlations for the flame height and temperature were not applicable under low ambient pressure. A modified flame height model was proposed and a new predictive model based on the classical solid flame model was developed to estimate the radiation fraction. The combustion behavior of immiscible heptane–methanol mixtures with varying mixing ratios was examined by Gao et al. [37] using six square pools with side lengths ranging from 5 to 20 cm. They concluded that the azeotropic interaction between heptane and methanol weakened the combustion intensity of the mixed fuel.
These findings significantly advanced our understanding of multicomponent pool fires, providing valuable methodologies and insights for future research. Despite this progress, most studies focused on miscible or azeotropic fuel mixtures in pool fires. In contrast, limited attention has been paid to the mixed combustion characteristics of immiscible fuels such as methanol and diesel. To address this gap, this study focuses on the engine rooms of hybrid−powered vessels and examines the combustion of pool fires under different methanol/diesel mixing ratios and pool diameters. The key combustion characteristics, including flame morphology and fuel burning rate, were analyzed. In addition, a flame height model for unstable combustion states and a mathematical prediction model for the burning rate were developed.
2. Materials and Methods
2.1. Conditions Design
Anhydrous methanol and light−duty diesel (with 0 °C pour point) were used as fuels in this experiment, and their physical properties are listed in Table 1 [38,39]. Four circular fuel pool diameters (6, 10, 14, and 20 cm) were selected for the fuel containers, which were made of low−carbon channel steel with both wall and bottom thicknesses of 5 mm. This allowed the test conditions to be classified into four groups based on the pool diameter. The thickness of the diesel layer was maintained constant across all conditions, whereas that of the methanol layer was varied to distinguish each test scenario. When setting the thicknesses of methanol and diesel, a pool with a diameter of 10 cm was used as the reference. The diesel volume was fixed at 50 mL, corresponding to a height of 6.4 mm in the pool. The volume of methanol was increased from an initial 10 mL (height of 1.3 mm) in increments of 20 mL, up to a maximum of 150 mL (height of 19.1 mm). For pools of other diameters, the same thickness settings as those for the 10 cm−diameter pool were adopted to ensure a consistent methanol−to−diesel volume ratio. The specific fuel quantities for each condition are listed in Table 2.

Table 1.
Physical properties of anhydrous methanol and light−duty diesel (with 0 °C pour point) (20 °C, 1 atm).
Table 2.
Fuel quantity settings for experimental conditions.
To ensure experimental precision and eliminate the potential influence of random variations, each set of conditions was repeated three times.
2.2. Design of Experimental System
In this experiment, a confined space was used as the platform to study the pool fire behavior of immiscible methanol/diesel fuel. The experimental system comprises three main components: a confined space, combustion devices, and measuring instruments. The detailed arrangement of the experimental system is shown in Figure 1.
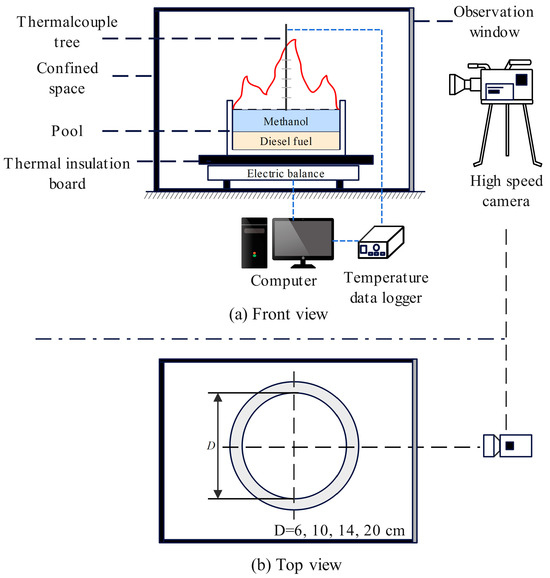
Figure 1.
Schematic diagram of pool fire experimental setup.
The confined space was a steel box with dimensions of 1.5 m × 1.5 m × 1 m. A transparent explosion−proof glass panel was installed at the front of the box, and a square observation window measuring 0.3 m × 0.2 m was positioned at the rear to facilitate observation and recording of changes in the pool fire combustion pattern. The combustion device consists of a fuel pool that serves as a container. The measuring instruments included a high−speed camera, mass measurement system, and temperature measurement system.
The mass measurement system used a high−precision electronic balance (model NX6000g, manufactured by Foshan Pengchang Construction Machinery Co., Ltd, Foshan, China, with capacity 6 kg, accuracy ± 0.01 g) to record the mass loss of fuel during combustion. The electronic balance was positioned inside the combustion chamber, with the fuel pool placed directly on top. Calibration was performed prior to each experiment using 500 g weights. Once calibrated, the fuel pool was positioned above the balance, and the balance was zeroed. Fuel was then added to the pool and the total mass of the fuel was measured. During the experiment, the change in the mass balance per unit of time was recorded as the mass loss of the fuel.
The temperature measurement system consists of a multi−channel temperature recorder (model EX6000, manufactured by Yili (Shenzhen) Technology Co., Ltd., Shenzhen, China, with 0.2 °C basic accuracy, 0.5 °C cold end compensation accuracy, and 0.1 °C resolution) and 17 K−type thermocouples. The diameter of the thermocouple measuring junction was 0.3 mm. The temperature measurement system was designed to monitor the temperature variations in both the centerline and outer wall surfaces of the fuel pool. The thermocouples were attached to the thermocouple tree and the measurement logging output port is linked to the temperature recorder with the objective of gathering and archiving data. The configuration of the thermocouples in terms of position is shown in Figure 2. Thermocouples T1–T5 were used to measure temperature changes within the fuel. Because methanol and diesel are immiscible, these thermocouples were strategically positioned at key locations: the base of the fuel pool, the midpoint of the diesel layer, the fuel separation interface, the midpoint of the methanol layer, and the surface of the methanol layer. Thermocouples T6–T10 were configured to measure the temperature along the outer wall surface of the pool in sequential order by height, whereas thermocouples T1–T5 were deployed in a parallel arrangement. To monitor the flame temperature above the fuel, thermocouples T11–T17 were used. Thermocouple T11 was positioned 10 cm above T5, with subsequent thermocouples placed at an additional 10 cm interval. In addition, thermocouples underwent a calibration process before use. This involved measuring water with a thermocouple that had been calibrated to 25 °C using a kerosene thermometer. The thermocouple could be used for subsequent measurements, provided that the resulting measurement error remained within the calibration range of 25 ± 0.2 °C.
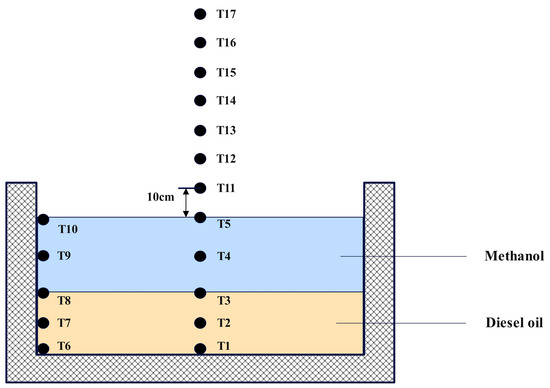
Figure 2.
Schematic diagram of the thermocouple arrangement.
Since each test condition was repeated three times, it was necessary to evaluate whether the measurement errors of various instruments remained within acceptable ranges. For example, Figure 3 presents the error curve of the burning rate at selected time points under the condition of a 10 cm pool diameter and a methanol layer thickness of 1.3 mm. The burning rate error ranged from 0.0032 to 0.0083 g/s, which confirms that the experimental data maintained a satisfactory level of accuracy.
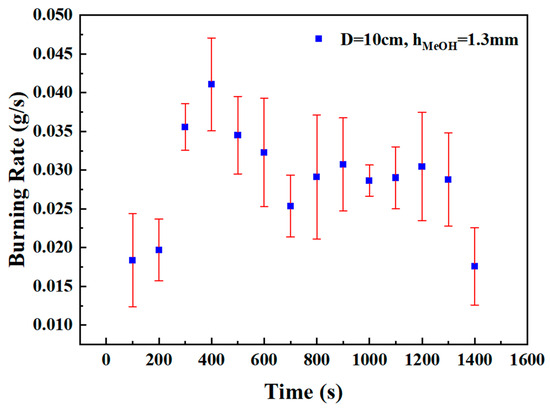
Figure 3.
Error curve of the burning rate at selected time points under the condition of a 10 cm pool diameter and a methanol layer thickness of 1.3 mm.
3. Results
3.1. Combustion Phenomenon
During the experimental process, a pool diameter of 6 cm (D = 6 cm) and methanol layer thickness of 1.3 mm (hMeOH = 1.3 mm) resulted in a methanol volume of only 4 mL. This volume was insufficient to provide the combustion heat necessary to evaporate the diesel and ignite the resulting diesel vapor–air mixture into a combustible state. The combustion process is shown in Figure 4, which shows the (a) initial growth stage, (b) fully developed stage, (c) decay stage, and (d) extinction stage. These stages correspond to the methanol ignition, full development, attenuation, and final extinction phases of the flame, respectively. In stage (d), the unignited diesel remained in the pool, marking the end of the combustion process when the methanol flame was fully extinguished.
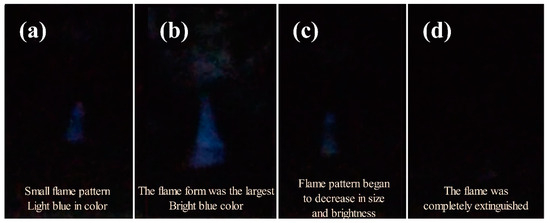
Figure 4.
Combustion stages of methanol fuel in condition D = 6 cm and hMeOH = 1.3 mm: (a) initial growth stage; (b) fully developed stage; (c) decay stage; (d) extinction stage.
With increased amounts of methanol fuel, the diesel in the pool was successfully ignited, resulting in complete combustion of all the fuel in the pool. Figure 4 shows the flame state during various combustion phases for the condition D = 10 cm and hMeOH = 9 mm. The combustion of the methanol and diesel mixture occurred in three distinct phases: pure methanol combustion, transition combustion, and pure diesel combustion.
- (I)
- Pure methanol combustion phase: As shown in Figure 5a, methanol, which has a lower density than diesel, floated on top of the fuel layer in the pool and ignited first. Upon ignition, methanol combustion exhibited a characteristic blue flame, primarily attributed to chemiluminescence from CO oxidation and the energy level transitions of free radical electrons, such as CH, C2, and CH2O [40]. This phase followed the initial combustion and fully developed stages commonly associated with methanol pool fires [41]. However, as the methanol flame continued to heat the underlying diesel layer, significant volumes of diesel vapor began to mix with the methanol flame during decay. Unlike the traditional methanol pool fire behavior, the decay and extinction stages in this experiment merged into a transitional combustion phase, leading to distinctive combustion phenomena.
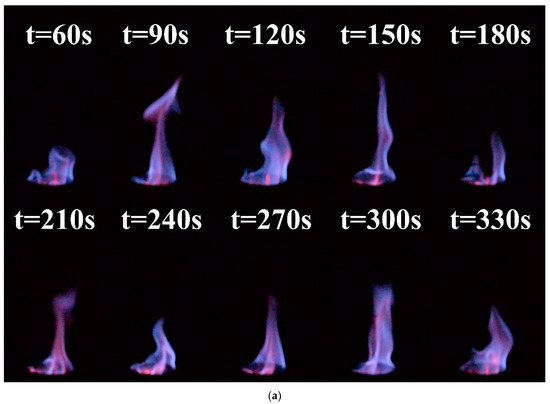
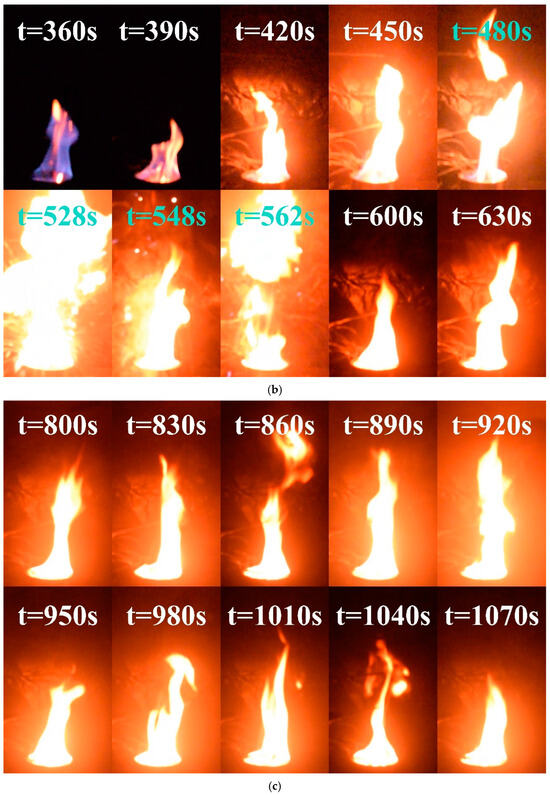 Figure 5. Images of condition D = 10 cm and hMeOH = 9.0 mm at various combustion phases: (a) Phase I: Pure methanol combustion phase; (b) Phase II: Fuel transitional combustion phase; (c) Phase III: Pure diesel combustion phase.
 - (II)
- Transitional combustion phase: As shown in Figure 5b, approximately 360 s into the experiment, the methanol layer approached depletion owing to continued combustion. At this stage, the heat generated is sufficient to evaporate the surface layer of the diesel, creating a combustible mixture with air. The pool fire temperature reached the point at which the mixture could ignite, leading to the emergence of fragmented yellow flames around and within the blue methanol flame. This phase marked the overlap between the decay stage of the methanol combustion and the initial growth stage of the diesel combustion. Over time, as the methanol supply diminished and more diesel vaporized, the yellow flame fragments became increasingly dominant within the blue flame, eventually resulting in the complete replacement of the blue flame with yellow or white flames.
The change in flame color did not signify the onset of a stable diesel combustion phase; however, it led the pool fire to extreme conditions. Beginning at approximately 420 s, the flame exhibited exceptional brightness, increased pulsation frequency, and a highly unstable combustion state. After 480 s, the flame begins to fragment, indicating a transitional combustion phase at its highest intensity. This period was characterized by further increases in brightness and a sudden acceleration in the oscillation frequency. At approximately 528 s, 548 s, and 562 s, the fuel droplets slopped over and ignited upon contact with the areas surrounding the fuel pool, intensifying the fire and producing muffled explosive sounds. This phenomenon closely resembles the slopover effect commonly observed in heavy−component fuel−pool fires [42]. Figure 6 shows the complete sequence of slopover events occurring at 528 s under these conditions. Following this intense unstable combustion phase, the pool fire enters a steady combustion state at approximately 600 s, transitioning to a pure diesel combustion phase.
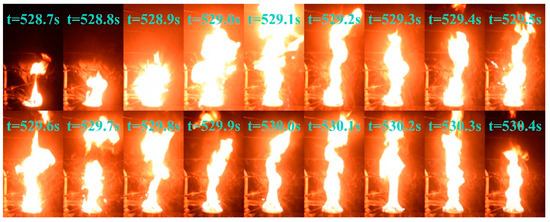
Figure 6.
Slopover phenomenon in condition D = 10 cm and hMeOH = 9.0 mm at approximately 528 s.
Analysis of the observed phenomena indicates that slopover and boilover share certain similarities but differ in their causes and combustion intensities. Figure 7 shows the mechanisms behind both the slopover and boilover. Boilover typically occurs during the stable combustion stage of the fuel, during which a boiling layer forms in the upper fuel layer [30]. Through thermal diffusion, substantial amounts of steam bubbles are generated at the fuel–water interface. During a boilover event, these bubbles transport fuel from the pool into the flames, leading to intense combustion. The enhanced convective heat transfer between the water and fuel layers disrupts the boiling layer [33]. In this experiment, slopover was triggered by the accumulation of liquid water produced by methanol combustion within the fuel pool. Based on the findings of Gülder et al. [43], a phase change process occurs during the unsteady burning of methanol pool fires, in which water vapor condenses into liquid and accumulates within the pool. Measurements of the water concentration in the liquid fuel indicate a significant increase in the liquid−phase water content as combustion progresses. This phenomenon is attributed to the transport of water vapor, which is produced during combustion, from the gas phase to the relatively cooler liquid surface, where it subsequently condenses into the pool. The heat released during condensation increases the thermal enthalpy of the liquid phase, thereby enhancing fuel evaporation from the pool. However, as the water fraction in the liquid phase rises, the equilibrium saturation temperature of the water–methanol mixture also increases. This implies that a portion of the enthalpy provided by condensation is consumed to offset the elevated saturation temperature. The vapor–liquid equilibrium composition of the methanol–water mixture exhibits nonlinear behavior, resulting in the mole fraction of water vapor above the liquid surface being lower than the mole fraction of water in the liquid. This leads to the phase change of water vapor from the gas phase to the liquid phase, returning liquid water to the pool. Slopover occurs when a liquid water layer exists above the fuel layer, forming a boiling region. Thermal diffusion causes boiling in the liquid water layer and surface boiling in the underlying fuel owing to heating. At this stage, bubbles form at the interface between the fuel and liquid water layers and within the liquid water layer. Droplets containing a mixture of fuel and water were ejected from the pool by steam, entering the flames and resulting in intense combustion. Although the distribution of liquid water and boiling locations limits the intensity of the slopover compared to that of the boilover, it remains a hazardous combustion phenomenon.
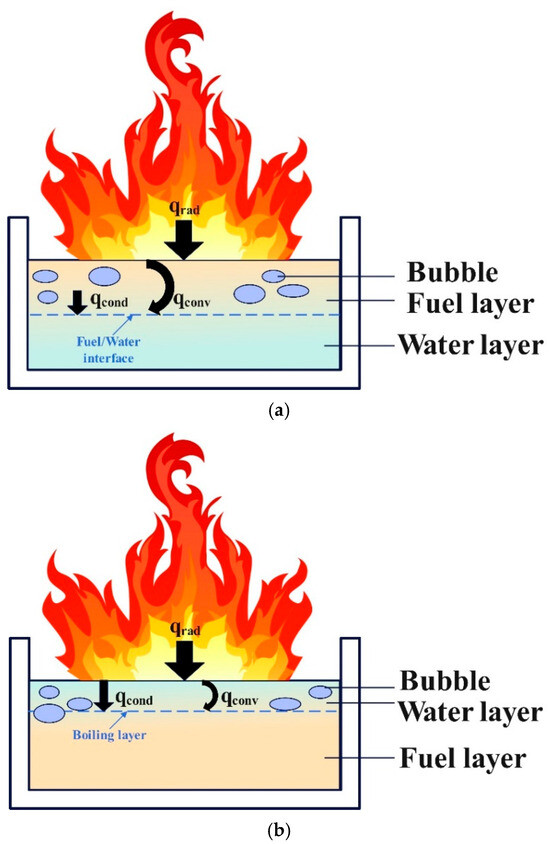
Figure 7.
Schematic diagram of boilover and slopover phenomena: (a) Boilover phenomenon; (b) Slopover phenomenon.
The observations across all conditions revealed that intense slopover phenomena were not present in every scenario. For conditions with the same methanol layer thickness, the intensity and frequency of slopover decreased as the pool diameter increased. Similarly, for conditions with the same pool diameter, an increase in the methanol volume resulted in a reduced slopover intensity and frequency. Slopovers were rarely observed in cases with larger methanol quantities. This suggests that under conditions with a small−scale, thin methanol layer, slopover occurs with high intensity and in multiple instances. This behavior can be attributed to the fact that, although a larger methanol volume generates more liquid water during combustion, it also produces greater heat, causing the liquid water to absorb heat and evaporate. Consequently, the amount of liquid water present during the transitional combustion phase decreases and may even be absent. Additionally, an increase in pool diameter enhanced the evaporation rate of liquid water, further reducing the slopover.
- (III)
- Pure diesel combustion phase: As shown in Figure 5c, the pure diesel combustion phase begins after the transitional combustion phase once methanol is fully consumed, leaving only diesel in the pool. Diesel pool fires typically exhibit three stages: initial growth, stable combustion, and decay [44]. However, in this case, the initial growth phase of diesel combustion was integrated into the transitional combustion phase, leaving only stable combustion and decay stages. In the early part of this phase, the flame color remained primarily yellow−white due to the relatively low initial temperature of the diesel combustion, which resulted in incomplete combustion. As the process continued, the temperature of the diesel increased, releasing substantial amounts of vaporized gases, leading to more complete combustion and the appearance of a predominantly orange−yellow flame [45]. Compared with the transitional combustion phase, the flame exhibited reduced brightness, and both the oscillation frequency and amplitude were significantly lower. Combustion remained stable until the diesel was fully consumed, at which point the flame was extinguished.
3.2. Mass Loss Rate
3.2.1. Mass and Mass Loss Rate Curves
To further study the intensity and frequency of slopover occurrence, the characteristics of mass loss and burning rate variations are studied in this section. Based on the combustion phenomena described previously, conditions with a pool diameter of 6 cm, where slopover was particularly intense, were selected for the analysis. However, condition hMeOH = 1.3 mm was excluded because of the failure of the diesel ignition, and condition hMeOH = 19.1 mm was omitted because it did not exhibit a distinct, unstable combustion phase.
As shown in Figure 8, the mass and mass loss rate (MLR) curves for a pool with a diameter of 6 cm under different conditions exhibited several distinct trends. Initially, the mass curve demonstrated a rapid decline, followed by a noticeable decrease in the rate of decline, resulting in flattening of the curve. During the early stages of slopover, minor fluctuations were observed in the curves for the thinner methanol layers.
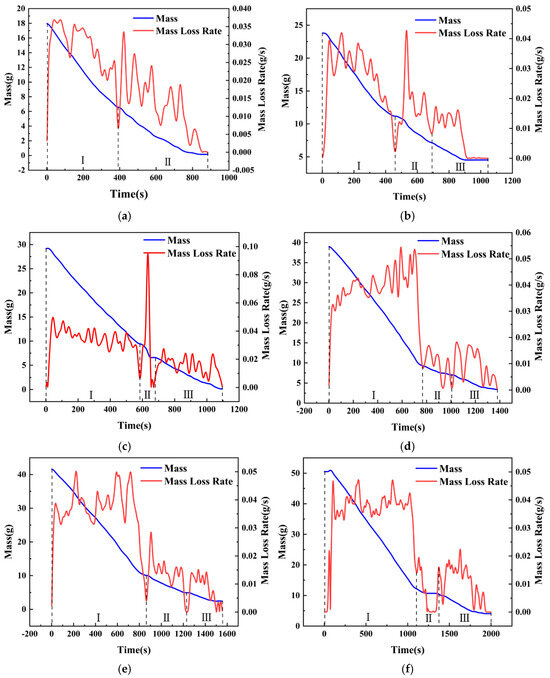
Figure 8.
Mass loss and burning rate curves for selected conditions with 6 cm pool diameter: (a) Condition hMeOH = 3.8 mm; (b) Condition hMeOH = 6.4 mm; (c) Condition hMeOH = 9.0 mm; (d) Condition hMeOH = 11.5 mm; (e) Condition hMeOH = 15.4 mm; (f) Condition hMeOH = 16.6 mm.
Analysis of the mass loss rate curve suggested that this pattern emerged because the mass loss rate of methanol exceeded that of diesel, leading to a steep initial mass curve that was later moderated. Furthermore, the slopover events that occurred during the early transitional combustion phase caused instantaneous spikes in the mass curve as the droplets were ejected from the pool. Minor vibrations induced by slopover within the fuel pool also resulted in momentary inaccuracies in the electronic balance, contributing to slight fluctuations at the onset of the curve plateau.
Notably, under hMeOH = 3.8 mm, the low fuel volume and intense slopover rendered the pure diesel combustion phase nearly undetectable in the MLR curve. Overall, the mass curves for both the pure methanol and pure diesel combustion phases were relatively smooth under all conditions. In contrast, the transitional combustion phase exhibits significant fluctuations. At low methanol volumes, a brief upward bump was observed in the curve, as shown in Figure 8b. However, as the methanol volume increased, this temporary increase disappeared, and the curve exhibited a downward trend.
This effect was even more pronounced in the MLR curves. Under the condition hMeOH = 3.8 mm, the mass loss rate curve during the transitional combustion phase exhibited several large fluctuations, with each peak nearly equal to or slightly exceeding the average methanol mass loss rate of 0.03 g/s. For conditions ranging from hMeOH = 1.3 mm to hMeOH = 9.0 mm, the peak values of these fluctuations gradually decreased and became more consistent, showing less pronounced variations compared to those observed at condition hMeOH = 3.8 mm. By condition hMeOH = 11.5 mm and hMeOH = 15.4 mm, a marked shift occurred. While fluctuations persisted during the transitional phase, each peak value was significantly lower than the average methanol MLR.
These observations indicate that as the methanol volume increased, the intensity of slopover progressively diminished, which is consistent with the conclusions drawn from the visual observations. Moreover, although a smaller methanol volume enhanced the transitional combustion phase, this effect weakened and ultimately disappeared as the methanol volume increased. This behavior can be attributed to the inherently intense nature of the slopover, which enhances fuel combustion efficiency. However, as discussed in Section 3.1, both the increased methanol volume and larger pool diameters reduced the slopover intensity; in some cases, the slopover was entirely prevented, thereby eliminating any combustion−enhancing effects. If slopover did not occur within the pool fire system, no enhancement in fuel combustion was observed.
To compare the mass loss rates under different pool diameters while maintaining the same methanol fuel thickness, conditions with hMeOH = 3.8 mm were selected for analysis. The influence of pool diameter on the MLR during the transitional combustion phase was examined, as shown in Figure 9.
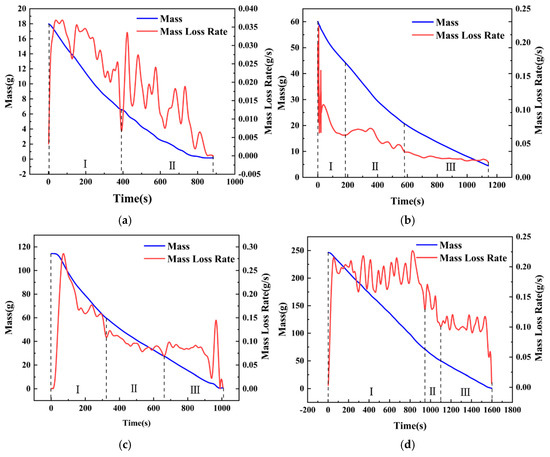
Figure 9.
The mass and mass loss rate variation curves of fuel under different conditions with a methanol thickness of 3.8 mm: (a) Condition D = 6 cm; (b) Condition D = 10 cm; (c) Condition D = 14 cm; (d) Condition D = 20 cm.
By comparing the different conditions shown in Figure 9, it was observed that in the scenario with the smallest pool diameter (D = 6 cm), the MLR curve during the transitional combustion phase exhibited significant fluctuations, indicating intense slopover behavior. However, when the pool diameter increased to D = 10 cm, the MLR curve during the transitional combustion phase became much smoother compared to the D = 6 cm case, displaying a distinct “three−step staircase” downward trend: the highest MLR occurred during the pure methanol combustion phase, followed by the transitional combustion phase, while the lowest occurred during the pure diesel combustion phase. This suggested that no significant slopover took place during the transitional combustion phase, allowing a smooth transition into the pure diesel combustion phase. The conditions at D = 14 cm and D = 20 cm continued to follow this trend. This observed pattern was consistent with the conclusions drawn from flame combustion morphology observations.
3.2.2. Quantitative Analysis of Slopover Intensity
In Section 3.2.1, the analysis revealed a strong correlation between slopover intensity, pool diameter, and the methanol fuel layer. This suggested that a quantitative relationship should have existed among these physical quantities. While the frequency, height, and extent of slopover intuitively reflected its intensity, the large number of parameters involved and the inevitable errors in their statistical measurements led to cumulative deviations from the actual mathematical laws. However, as established in Section 3.2.1, the mass loss rate (MLR) of the fuel served as a direct indicator of both slopover intensity and occurrence frequency: a greater slopover intensity corresponded to a larger instantaneous mass loss rate, while a higher slopover frequency resulted in more peaks in the mass loss rate curve. Therefore, a dimensionless parameter, based on the magnitude and occurrence frequency of MLR peaks, was introduced as a quantitative measure of slopover intensity and frequency. The expression for this parameter was as follows:
where Is represented the average mass loss rate during the transitional combustion phase and Isum denoted the cumulative sum of the differences between each peak mass loss rate Ii and Is (where Ii had to be greater than Is, otherwise it was not considered). The expression was given as follows:
To verify the accuracy of the quantitative relationship between slopover intensity and mass loss rate, the error range of slopover intensity across three repeated tests for each condition was analyzed. Figure 10 shows the dimensionless slopover intensity error for various methanol/diesel mixing ratios under a pool diameter of 10 cm. It can be observed that the error range for slopover intensity across repeated tests lies between 0.17 and 0.32. This range confirms that the experimental data remained within an acceptable accuracy margin.
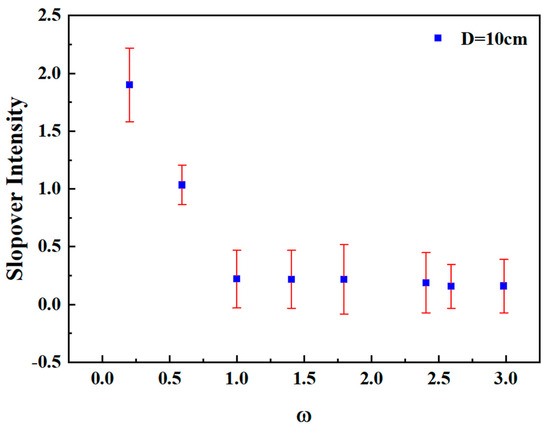
Figure 10.
Dimensionless slopover intensity error for various methanol/diesel mixing ratios under a pool diameter of 10 cm.
Additionally, the fuel volume fraction ω itself served as a dimensionless quantity, while the pool diameter D required nondimensionalization. This was achieved by defining the dimensionless oil pool diameter D′ as the ratio of the oil pool diameter to a constant diesel layer thickness. Based on these physical quantities, a dimensionless multivariable function for slopover intensity was formulated as follows:
By performing a nonlinear surface fitting on Equation (3), the following relationship was obtained as Equation (4). The fitted surface plot is shown in Figure 11:
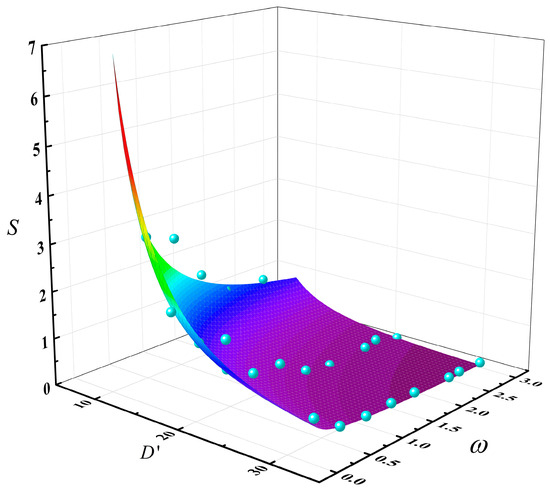
Figure 11.
The multivariable coupling relationship surface plot of slopover intensity S with the dimensionless pool diameter D’ and the methanol/diesel volume ratio ω (The blue points are data points and the colored surface is the result of the mathematical fitting).
To verify the accuracy of the fitted equation, the adjusted coefficient of determination R2 was calculated as a measure. The closer its value was to 1, the better the fit. The mathematical expression for R2 was given as follows:
where Yact is the actual value, Ypre is the predicted value of the fitted function, and Ymean is the average of the actual values. Therefore, the adjusted coefficient of determination of Equation (5) is R2 = 0.895, which is close to 1, indicating a relatively high degree of credibility for this equation.
Based on the comprehensive analysis of Equation (4) and Figure 9, the fitting results effectively confirmed the conclusion that an increase in methanol fuel thickness and pool diameter both led to a decrease in slopover intensity. Moreover, the influence of pool diameter was greater than that of methanol fuel quantity, indicating a stronger suppressive effect on slopover intensity. Therefore, in real−world methanol/diesel multicomponent fire scenarios, special attention should be given to small−scale early−stage fires. Once an intense slopover event occurred, it could rapidly escalate in scale or even trigger multiple fire sources, posing a severe threat to life and property safety.
3.3. Flame Height
The flame height is a critical geometric characteristic in the study of pool fire combustion properties. Because of the effects of air entrainment, the height of a pool fire flame does not remain constant; instead, it fluctuates continuously, with instantaneous heights alternating between contraction and expansion. Zukoski et al. [46] proposed that the flame height in diffusion flames is influenced by the heat release rate, whereas Maynard et al. [47] demonstrated a positive correlation between flame height and heat release. In addition, the flame height formula proposed by Heskestad [48] has been extensively validated and shown to be effective.
where H represents the flame height and is the heat release rate.
As previous conclusions by scholars were derived from studies on single fuels, this study focused on examining the flame height patterns of immiscible methanol–diesel pool fires during the transitional combustion phase. To establish a mathematical relationship between the methanol−to−diesel volume ratio and flame height, and to refine the calculation of the flame height formula, the Thomas classical flame height model [49] was used:
where represents the average burning rate of the pool fire during the transitional combustion phase, represents the fuel density, and g represents the gravitational acceleration.
Based on the Thomas classical model and considering the influence of methanol and diesel quantities, this study constructed a dimensionless multivariable function for flame height expressed as follows:
where is the density ratio of methanol to diesel with a value of 0.94. Additionally, to simplify the mathematical expression, was assumed constant.
In the experiment, the flame height H in Equations (6)–(8) is determined by the average flame height obtained from the average flame probability distribution. As shown in Figure 12, which presents the flame probability distribution under D = 10 cm and hMeOH = 6.4 mm, the height corresponding to a probability of I = 0.5 represents the average flame height. By performing a nonlinear surface fitting on Equation (8), the following relational expression was obtained:
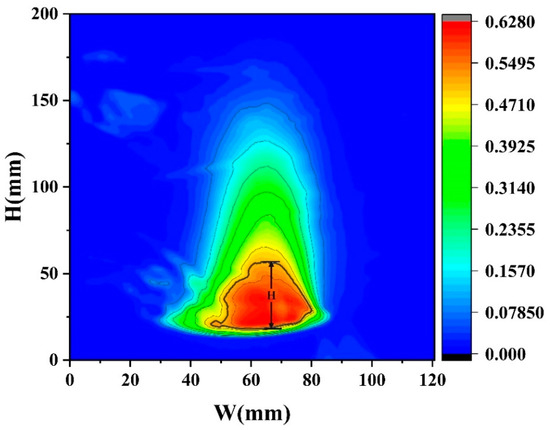
Figure 12.
The flame probability distribution under D = 10 cm and hMeOH = 6.4 mm.
According to Equation (5), the adjusted coefficient of determination of Equation (9) is 0.9212. This value is very close to 1. The preceding analysis, together with the conclusions derived from Equation (9) and Figure 13, demonstrated that the average flame height is contingent upon the combustion rate, pool diameter, and methanol/diesel volume ratio. At a constant pool diameter, the dimensionless number H/D increased exponentially with the dimensionless number M″, and the larger the pool diameter, the faster the growth rate. Similarly, the value of H/D increased with the increase of the dimensionless number , but the growth rate is much smaller. The aforementioned results indicated that the dimensionless number M″, which comprises the mean combustion rate and the diameter of the pool, exerted a more robust coupling effect on the mean flame height.
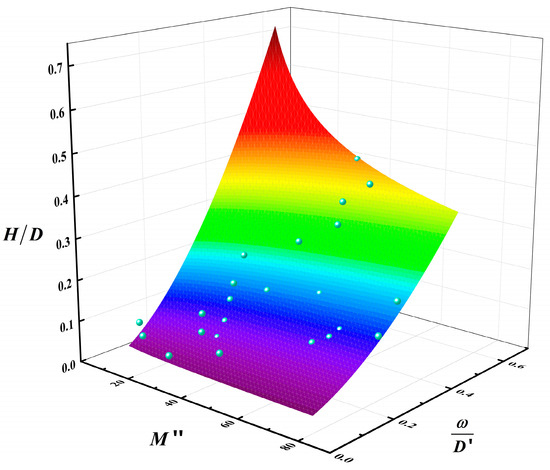
Figure 13.
Multivariable fitted surface of the relationship between , M″, and (The blue points are data points and the colored surface is the result of the mathematical fitting).
3.4. Heat Transfer Model
3.4.1. Centerline Temperature Within the Fuel Layer
Figure 14 shows the temperature variation curves at different positions within the fuel layer under various conditions in a 10 cm diameter pool. As shown in Figure 13, under the condition hMeOH = 1.3 mm, the thin methanol layer was rapidly consumed during the initial methanol combustion phase. As the fuel layer thinned, the temperatures recorded by thermocouples T3, T4, and T5 shifted rapidly from the methanol layer temperature to the flame base temperature, leading to a sharp temperature increase. During the transitional combustion phase, the thermocouples recorded a sudden temperature drop from 1120 K at the end of the pure methanol combustion phase to 350 K at the start of the transitional phase, where the temperature remained stable for approximately 100 s. This phase corresponded to intense slopover activity within the pool fire. Once the slopover event concluded, combustion did not immediately progress to the pure diesel combustion phase. Instead, the temperatures at each measurement point briefly returned to 800–900 K, exhibiting a noticeable oscillatory decrease. After this oscillatory phase, the pool fire transitioned to the diesel combustion phase. At this stage, the thermocouple measurement points moved from the inner zone of the flame to the outer flame, resulting in an initial rapid temperature drop, followed by a steady temperature period, and then a sharp increase until the flame was extinguished and the thermocouple readings returned to ambient levels. For thermocouples T1 and T2, located at the bottom and center of the diesel layer, respectively, the first two combustion phases had minimal impact, leading to a relatively smooth temperature increase. Only T2 exhibited minor fluctuations during the transitional combustion phase, whereas both thermocouples exhibited a steady increase during the third phase. In addition, the rates of temperature increase for T1 and T2 were slightly higher during the first two phases than during the third phase.
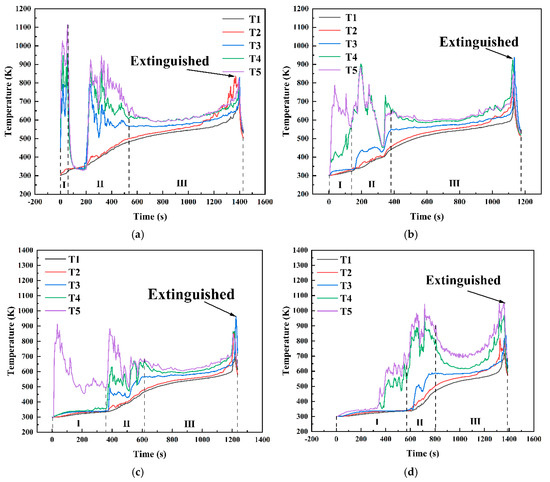
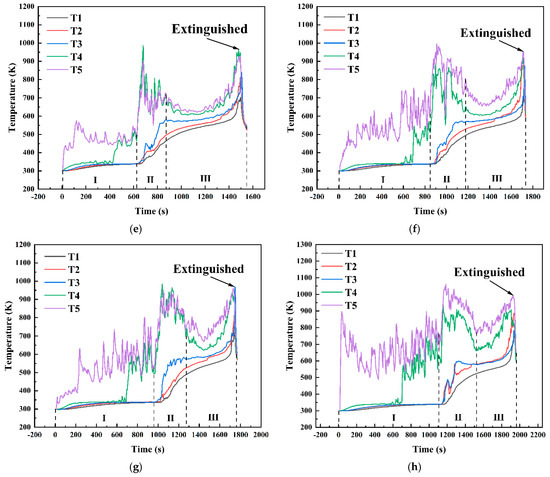
Figure 14.
Temperature variation curves at different positions within the fuel layer for various conditions in a 10 cm diameter pool: (a) hMeOH = 1.3 mm; (b) hMeOH = 3.8 mm; (c) hMeOH = 6.4 mm; (d) hMeOH = 9.0 mm; (e) hMeOH = 11.5 mm; (f) hMeOH = 15.4 mm; (g) hMeOH = 16.6 mm; (h) hMeOH = 19.1 mm.
Starting from hMeOH = 3.8 mm, significant changes were observed in the temperature variation trends at each measurement point. During the initial phase of methanol combustion, the increased methanol layer thickness prolonged the time required for the heat waves to transfer downward through the fuel layer. Consequently, the temperature rise recorded by thermocouples T3 and T4 was further delayed, with progressively longer intervals observed between the temperature increases for each thermocouple. During the transitional combustion phase, the temperature curves for thermocouples T4 and T5 under conditions ranging from hMeOH = 3.8 mm to hMeOH = 15.4 mm exhibited a downward trend. However, the magnitude of this decline decreased, and the duration shortened as the methanol thickness increased. The T3 curve also shows a slight decrease, occurring concurrently with decreases in T4 and T5, albeit with smaller magnitudes. For hMeOH = 16.6 mm and hMeOH = 19.1 mm, the temperature decreases in T4 and T5 became almost imperceptible, whereas T3 displayed mild oscillations or slight drops. Additionally, under hMeOH = 19.1 mm, a minor temperature drop was recorded in the T2 curve.
3.4.2. Heat Feedback
For thermal feedback analysis within the pool fire system, the net heat flux received by the liquid fuel in the pool is the balance of the heat fluxes incident on and lost by the fuel. This net flux comprised four components: conductive heat transfer from the pool wall to the fuel , convective heat transfer from the flame to the fuel surface , radiative heat transfer from the flame to the fuel surface , and reradiation from the fuel surface [44]. Based on the energy conservation equation outlined in the literature, the relationship can be expressed as follows:
where is the heat received by the liquid surface in the pool from the flame, and represent the heat transferred to the pool via conduction and convection, respectively, and are the radiative and re−radiative heat fluxes affecting the pool, respectively. According to the findings of Blinov and Hottel [26,50], in large−scale pool fire systems, where the combustion zone exists in a transitional regime between laminar and turbulent flow, convection and radiation dominate the heat transfer, whereas conduction contributes minimally to the thermal feedback. Therefore, conduction was neglected in the calculations.
According to Vali’s [51] calculation method, can be determined using Fourier’s law of heat conduction, depending on the wall and fuel temperatures. The formula is as follows:
where l is the liquid fuel thickness; Tf and Tl are the temperatures of the flame and liquid fuel in the pool, respectively; and Rw and Rl are the thermal resistances of the pool wall and fuel, respectively. The equations for calculating Rw and Rl are as follows:
where is the thickness of the pool wall and is the thermal conductivity of the pool.
The convective heat to the fuel from the vapor generated by high−temperature evaporation at the liquid surface of the pool is expressed as follows [52]:
where h is the convective heat transfer coefficient, A is the pool area, and Tb is the boiling temperature of the fuel.
For calculating the convective heat transfer coefficient h, the natural convection relation for a horizontal hot plate can be used:
where Nu is the Nusselt number, and Ra is the Rayleigh number, which is the product of the Prandtl number (Pr) and Grashof number (Gr).
where is the dynamic viscosity.
The flame can be approximated as a cylindrical shape to calculate its radiative and re−radiative heat [53], as shown in Figure 15.
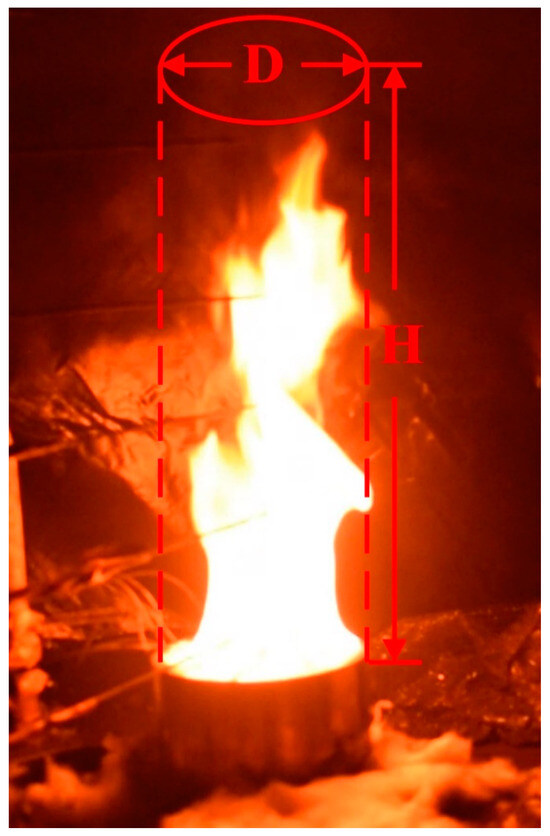
Figure 15.
Schematic diagram of the cylindrical flame model.
The net radiative heat from the flame was calculated as follows [54]:
where is the Stefan–Boltzmann constant (); Ts is the fuel surface temperature, typically considered the boiling point of the fuel [55]; is the ambient temperature; and k is the effective soot emission parameter, which can be calculated as follows:
where C1 is the dimensionless effective soot concentration parameter, C2 is Planck’s second constant with a value of 0.014388 m·K, and n = 3.49 and s = 2.17 are the infrared mean optical constants [56].
Lm is the beam mean length, which can be calculated as follows:
where Vf is the flame volume and Af is the flame cross−sectional area. For the cylindrical flame model, the formula for Vf and Af are expressed as follows:
F is the radiative view factor from the flame to the fuel surface and is calculated as follows [57]:
where hr represents the distance from the liquid surface to the flame base.
3.4.3. Prediction of Burning Rate
Thermal feedback significantly affects the fuel burning rate. Fundamentally, the burning rate of a pool fire is governed by the net heat flux absorbed by the fuel [44]. Accordingly, a mathematical prediction model for the burning rate of pool fires during the transitional combustion phase was developed using a thermal feedback model.
The net heat flux received by the fuel is the sum of the incident heat flux and loss heat flux, and comprises four components: conductive heat transfer , convective heat transfer , radiative heat transfer , and re−radiation . Based on the heat transfer model for pool fires proposed by Hamins [58,59], the following mathematical relationship can be established:
where and Cp represent the latent heat of vaporization and specific heat capacity at constant pressure for the fuel, respectively. As diesel combustion dominates the transitional combustion phase, these values can be approximated to those of diesel: and . Moreover, the proportion of the conductive heat transfer in the net heat flux decreased as the pool diameter increased. Typically, in pools with diameters smaller than 10 cm, the effect of heat conduction is often neglected. However, given that the pool diameters used in the experiment ranged from 6 cm to 20 cm, heat conduction still played a significant role within this range. To minimize calculation errors, it remained necessary to account for heat conduction in the analysis.
Figure 16 shows the experimental and theoretical burning rate curves during the transitional combustion phase for the condition D = 10 cm and hMeOH = 6.4 mm. As shown in Figure 16, the theoretical calculation curve closely aligns with the experimental measurement curve in terms of overall trend, though a consistent numerical discrepancy of approximately 0.06 g/s is observed. The lower theoretical values compared to the experimental measurements can be attributed to several factors. For instance, during the transitional combustion phase, unstable flame dynamics may induce external forces that cause vibrations in the thermocouples or displace them from their intended measurement positions. Furthermore, soot accumulation at the thermocouple measurement points may lower the recorded temperatures, introducing errors in the measurements. These factors ultimately affect the accuracy of the burning rate calculations. To reduce these discrepancies, modifications to the burning rate calculation model, specifically adjustments to Equation (24), are necessary to enhance its accuracy.
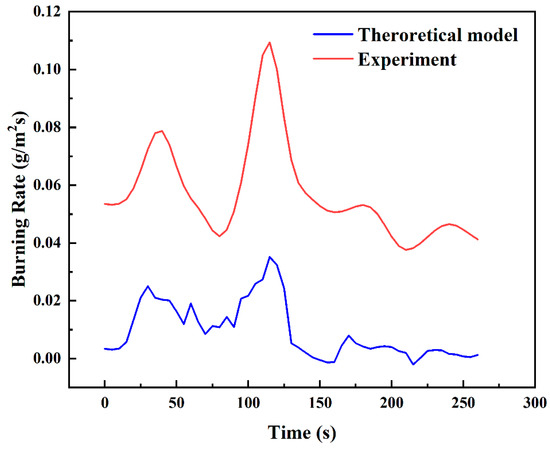
Figure 16.
Comparison of experimental and theoretical burning rate curves during the transitional combustion phase for D = 10 cm and hMeOH = 6.4 mm.
By multiplying Equation (26) by the correction factor K, the modified equation can be expressed as follows:
As the experiment involves two independent variables, dimensionless pool diameter D′ and the methanol/diesel volume ratio ω, K can be defined as a multivariable function of D′ and ω, analogous to the multivariable fitting function described in Section 3.3. Using the same fitting methodology, the relationship for K can be expressed as follows:
The value of K can be determined by applying the least−squares method to the theoretical and experimental burning rate data. For instance, Figure 17 shows the corrected burning rate curve during the transitional combustion phase under the condition D = 10 cm and hMeOH = 6.4 mm, comparing the experimental measurements with the theoretical calculations. The correction factor for this condition was calculated as K = 3.62, and the corrected curve closely aligned with the experimental data.
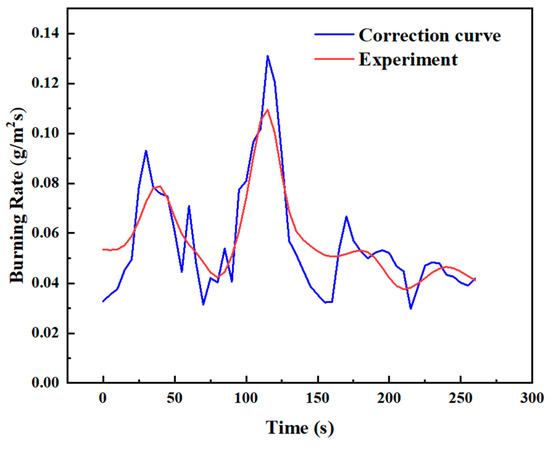
Figure 17.
Corrected curve of experimental and theoretical burning rates during the transitional combustion phase for D = 10 cm and hMeOH = 6.4 mm.
Figure 18 shows the multivariable relationship between the correction factor K, dimensionless pool diameter D′, and methanol/diesel volume ratio . As shown in Figure 18, for the same pool diameter, the value of K increases with the methanol/diesel volume ratio ω, although the upward trend is not pronounced. Conversely, for the same mixing ratio, the value of K decreased exponentially with a significant change in magnitude as the dimensionless pool diameter D′ increased. Based on these variations, a multivariable fitting surface was constructed. The specific relationship for the fitting surface is expressed by Equation (29):
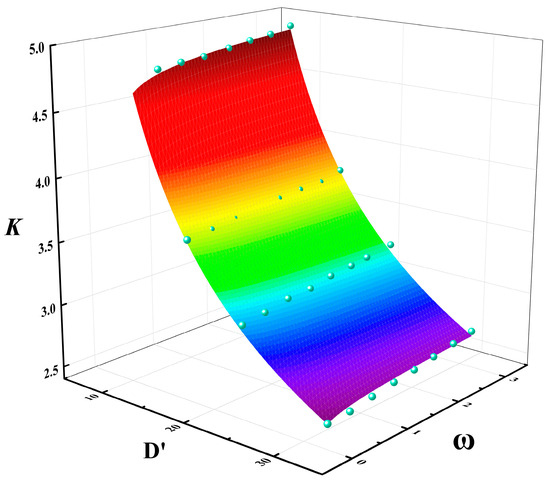
Figure 18.
Multivariable fitting relationship of correction factor K with dimensionless pool diameter D′ and methanol/diesel volume ratio ω ((The blue points are data points and the colored surface is the result of the mathematical fitting).
According to Equation (5), the adjusted coefficient of determination of Equation (29) is 0.9874. This value is very close to 1, which indicates that the equation has a relatively good fitting accuracy.
3.4.4. Causes of Slopover
In the previous sections, this study established the conclusion that “as the methanol fuel thickness increases or the pool diameter enlarges, slopover intensity decreases, and slopover may not occur at all”. Additionally, the combustion rate directly reflected the magnitude of slopover intensity. In Section 3.4.3, a combustion rate prediction model was developed, and the relationship between the correction factor K, the dimensionless pool diameter D′, and the fuel volume ratio ω was derived. To gain a deeper understanding of the mechanisms behind slopover in immiscible methanol/diesel pool fires, to explain the relationship between slopover intensity, pool diameter, and methanol thickness, and to refine the physical interpretation of the correction factor K, it is necessary to conduct an in−depth analysis from the perspectives of heat transfer and fire dynamics.
Under normal conditions, the combustion of a single−component pool fire begins when the fuel surface is exposed to an external heat source, causing the surface temperature to rise. As a result, the fuel at the surface starts to evaporate, generating a significant amount of vapor. The concentration of this vapor increases with rising temperature until it reaches the flash point—the temperature at which the liquid’s vapor pressure exceeds the ambient pressure—forming a flammable vapor–air mixture. This mixture undergoes chemical reactions, producing flames. The flames generate substantial heat, which not only radiates directly onto the liquid surface but also propagates downward through heat conduction. This leads to a further increase in surface temperature, forming a new evaporation layer and allowing more fuel to transition into the gaseous phase. This process continues over time, accelerating the vaporization rate and sustaining combustion until the fuel is entirely evaporated. When no more combustible mixture is available to sustain the reaction, the flames extinguish.
However, in the case of immiscible methanol/diesel pool fires, the combustion process differs. During methanol combustion, a portion of the heat generated by the flames is conducted through the methanol fuel layer and transferred to the diesel layer beneath it. Since the methanol fuel layer acts as a thermal resistance, heat accumulates within it, causing the diesel temperature to rise until it reaches its flash point and ignites. The combustion of diesel, which has a higher calorific value, results in a localized temperature surge, leading to rapid diesel evaporation and a sharp increase in vapor pressure. When this vapor pressure exceeds the combined forces of the diesel column’s hydrostatic pressure and surface tension, the high−pressure vapor breaks through the liquid surface constraint, ejecting ignited droplets from the pool and causing fuel slopover. Essentially, this phenomenon is the result of both heat accumulation and transient vapor overpressure. Figure 19 provides a concise analysis of the causes of slopover in pool fires.
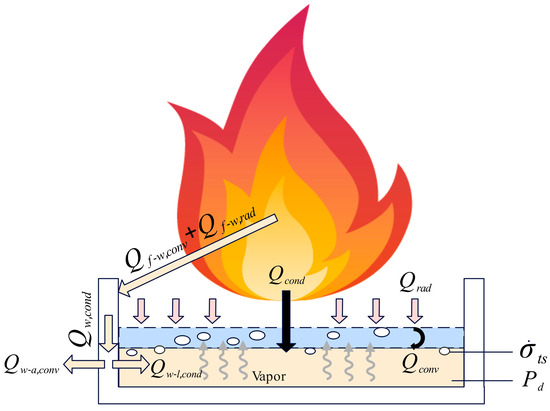
Figure 19.
Analysis of the causes of slopover in pool fires.
Based on the preceding analysis and Figure 19, it can be concluded that two conditions must be simultaneously met for slopover to occur in a pool fire. First, the surface of the diesel layer must receive a significant amount of heat before the complete evaporation of the liquid methanol layer, raising its temperature beyond the diesel flash point or even its supercritical evaporation temperature, leading to rapid evaporation and the generation of a large volume of vapor. Second, a sudden surge in the diesel evaporation rate must occur, creating a transient overpressure where the vapor cannot diffuse in time. This results in the vapor pressure exceeding the combined forces of the hydrostatic pressure of the diesel column and the surface tension of the vapor bubbles, ultimately triggering slopover. It should be noted that heat transfer from the flame to the pool wall occurs through convection and radiation, with the total heat received by the wall denoted as . This heat is subsequently conducted downward through the wall as , which is then divided into two components: convective heat transfer from the wall to the surrounding air , and conductive heat transfer from the wall to the liquid fuel . On one hand, due to the high thermal conductivity and heat capacity of the pool wall, it primarily functions as a thermal buffer during the early stage of the fire. The heat flux delivered from the wall to the fuel is spatially confined to regions near the sidewall and is significantly lower in magnitude compared to the radiative and convective heat fluxes directly from the flame. On the other hand, the heat transfer path through the wall is relatively long and subject to substantial thermal dissipation, resulting in a very small . Therefore, although thermal conduction from the wall to the fuel theoretically has the potential to influence the intensity of slopover, its effect can be considered negligible due to its minimal magnitude.
- (I).
- Regarding heat transfer, the heat transferred to diesel through both heat conduction and thermal radiation directly influenced the intensity of slopover. From the perspective of heat conduction, liquid methanol could be regarded as a thermal resistance, expressed as:
From Equation (31), it can be observed that a lower temperature gradient reduces the amount of heat transferred to the diesel layer per unit of time, expressed as:
Based on the above analysis, a thicker methanol fuel layer extends the heat conduction pathway, resulting in a slower temperature rise at the diesel layer surface. Consequently, within a short period, insufficient heat accumulates to raise the diesel temperature to its flash point or supercritical evaporation point. This suppresses the diesel evaporation rate and vapor pressure buildup, thereby reducing the likelihood of slopover occurrence.
From the perspective of thermal radiation, as discussed in Section 3.4.2, the proportion of thermal radiation in the overall heat transfer system increased with the pool diameter, ultimately making the pool fire predominantly driven by radiation. However, under the same methanol fuel thickness, a larger pool diameter made slopover less likely to occur. This was because, as indicated by the equation, when the pool diameter increased, the flame radiation area expanded significantly, while the liquid surface area increased simultaneously:
In smaller−diameter pools, the contact area between the flame base and the liquid surface was concentrated, resulting in a high radiative heat flux density and the formation of localized high−temperature regions (e.g., the temperature at the pool center was significantly higher than at the edges). In contrast, in larger−diameter pools, the radiative heat flux density per unit area decreased inversely with the square of the pool diameter. As a result, the radiative heat flux was distributed over a larger surface area, significantly reducing the temperature gradient. This led to a more uniform liquid surface temperature distribution, preventing excessive localized heating.
- (II).
- From the perspective of evaporation rate and vapor pressure dynamics, the diesel vapor pressure needs to overcome both the hydrostatic pressure of the diesel column and the surface tension of the vapor bubble itself to propel ignited droplets out of the pool, expressed as:
On the other hand, by treating diesel vapor as an ideal gas, the ideal gas equation of state can be used to establish that the diesel vapor pressure Pv is directly related to the diesel evaporation rate , expressed as:
where R represents the universal gas constant with a value of 8.314, is the temperature of saturated diesel vapor, and is the average molar mass of diesel. Moreover, the evaporation rate is functionally related to the interfacial temperature of the fuel , expressed as:
where represents the convective heat transfer coefficient at the fuel interface and denotes the latent heat of evaporation of diesel.
Based on the above analysis, and were positively correlated. During pool fire combustion, a thicker methanol layer delayed the heating of the diesel layer, leading to a decrease in diesel evaporation rate and a slower accumulation of vapor pressure. As a result, the vapor pressure could not reach the critical threshold required to trigger slopover.
- (III).
- From the perspective of turbulent combustion, based on the ideal gas equation of state, can be expressed in an alternative form different from Equation (35), given as:
Based on the above analysis, both an increase in methanol fuel layer thickness and an enlargement of the pool diameter suppressed slopover intensity from the perspectives of heat transfer and fire dynamics. This also explained why, in the combustion rate prediction model for the transitional combustion phase, the correction factor K exhibited a strong correlation with the dimensionless pool diameter D′ and the fuel volume ratio ω. This correlation stemmed from their regulation of the heat transfer pathway and the evaporation–combustion coupling effect.
Therefore, the slopover mechanism in immiscible methanol/diesel pool fires involves a multiphysics coupling of heat transfer, evaporation, vapor pressure, and turbulent combustion, rather than being driven by a single factor. To establish a more comprehensive and precise multiscale model, further investigation into the complex causes of slopover in pool fires would require computational methods such as Computational Fluid Dynamics (CFD).
4. Conclusions
This study aims to provide a more comprehensive analysis of the combustion characteristics associated with pool fire in methanol/diesel hybrid ships. The combustion characteristics of immiscible methanol/diesel pool fires were studied by using a series of controlled experiments. The combustion process, burning rate, flame height, temperature variations, and heat transfer analysis in the pool fire system were studied. The main conclusions are as follows:
- (I).
- The combustion process of a pool fire was divided into three phases: the pure methanol combustion phase, the transitional combustion phase, and the pure diesel combustion phase, with slopover most likely occurring during the transitional combustion phase. The frequency and intensity of slopover were directly related to the pool diameter and the amount of methanol fuel. Under the same methanol thickness, an increase in pool diameter significantly reduced both the occurrence and intensity of slopover, while under the same pool diameter, a greater methanol fuel amount also led to a noticeable decrease in slopover events. When the methanol layer reached a certain thickness, slopover did not occur at all. Based on this conclusion, a quantitative analysis was conducted to establish the mathematical relationship between slopover intensity, pool diameter, and the methanol/diesel volume ratio. Quantitative relationships have indicated a coupled effect between the pool diameter and the methanol/diesel volume ratio on slopover intensity, with the influence of pool diameter being more significant than that of the volume ratio.
- (II).
- During the transitional combustion phase, the flame height was influenced by multiple variables rather than a single factor. By applying the Thomas method to predict the flame height based on the mass burning rate, a multivariable function model was developed to establish a correlation between the average flame height, fuel volume ratio, and pool diameter.
- (III).
- Through thermal feedback analysis, a multivariable correction function incorporating the pool diameter and methanol/diesel volume ratio was integrated into the burning rate model for the transitional combustion phase. The correction function assists in more precisely forecasting the burning rate of methanol/diesel pool fire during the transitional combustion phase.
- (IV).
- From the perspective of internal heat transfer and fire dynamics, slopover in immiscible methanol/diesel pool fires results from the coupling of multiple physical fields rather than a single factor. A thicker methanol layer increases the internal thermal resistance, delaying heat transfer to the diesel and reducing the surface temperature gradient, which inhibits diesel evaporation and suppresses slopover. Dynamically, slopover occurs only when the transient vapor overpressure exceeds the combined hydrostatic pressure and surface tension. Thicker methanol slows diesel heating and vapor accumulation, making this threshold harder to reach. Additionally, the turbulent environment in large−diameter pool fires enhances vapor diffusion, further lowering local vapor pressure. Thus, both increased methanol thickness and larger pool diameter reduce slopover intensity by altering heat transfer and evaporation–combustion coupling. This also explains the strong correlation between the correction factor K in the transitional burning rate model and the dimensionless pool diameter and fuel volume ratio.
Author Contributions
Conceptualization, investigation, writing—original draft preparation, J.D.; conceptualization, resources, Z.W.; methodology, funding acquisition, writing—review and editing, J.H.; resources, supervision, Y.Y., J.L. (Jianghao Li), and J.L. (Jiacheng Liu); supervision, L.W. All authors have read and agreed to the published version of the manuscript.
Funding
This work is supported by the National Science Foundation of China (52106157) and the Jiangsu Province Postgraduate Practice and Innovation Program Project (SJCX23_2200).
Data Availability Statement
The original contributions presented in this study are included in the article. Further inquiries can be directed to the corresponding author.
Conflicts of Interest
The authors declare no conflicts of interest.
References
- Zincir, B.; Deniz, C.; Tunér, M. Investigation of environmental, operational and economic performance of methanol partially premixed combustion at slow speed operation of a marine engine. J. Clean. Prod. 2019, 235, 1006–1019. [Google Scholar] [CrossRef]
- Toscano, D.; Murena, F. Atmospheric ship emissions in ports: A review. Correlation with data of ship traffic. Atmos. Environ. X 2019, 4, 100050. [Google Scholar] [CrossRef]
- Fourth Greenhouse Gas Study 2020. Available online: https://www.imo.org/en/ourwork/Environment/Pages/Fourth-IMO-Greenhouse-Gas-Study-2020.aspx (accessed on 9 April 2025).
- Shi, Z.; Endres, S.; Rutgersson, A.; Al-Hajjaji, S.; Brynolf, S.; Booge, D.; Hassellöv, I.-M.; Kontovas, C.; Kumar, R.; Liu, H.; et al. Perspectives on shipping emissions and their impacts on the surface ocean and lower atmosphere: An environmental-social-economic dimension. Elem. Sci. Anth. 2023, 11, 00052. [Google Scholar] [CrossRef]
- Joung, T.-H.; Kang, S.-G.; Lee, J.-K.; Ahn, J. The IMO initial strategy for reducing Greenhouse Gas (GHG) emissions, and its follow-up actions towards 2050. J. Int. Marit. Saf. Environ. Aff. Shipp. 2020, 4, 1–7. [Google Scholar] [CrossRef]
- Çelik, M.B.; Özdalyan, B.; Alkan, F. The use of pure methanol as fuel at high compression ratio in a single cylinder gasoline engine. Fuel 2011, 90, 1591–1598. [Google Scholar] [CrossRef]
- Zhen, X.; Wang, Y. Numerical analysis on original emissions for a spark ignition methanol engine based on detailed chemical kinetics. Renew. Energy 2015, 81, 43–51. [Google Scholar] [CrossRef]
- Tanaka, T.; Tabata, M. Effect of Equivalence Ratio on NO Distribution Inside a Spark Ignition Engine by Using Laser-Induced-Fluorescence Method. JSME Int. J. Ser. B 1999, 42, 262–267. [Google Scholar] [CrossRef][Green Version]
- Gong, C.; Yi, L.; Zhang, Z.; Sun, J.; Liu, F. Assessment of ultra-lean burn characteristics for a stratified-charge direct-injection spark-ignition methanol engine under different high compression ratios. Appl. Energy 2020, 261, 114478. [Google Scholar] [CrossRef]
- Chen, Z.; He, J.; Chen, H.; Geng, L.; Zhang, P. Experimental study on cycle-to-cycle variations in natural gas/methanol bi-fueled engine under excess air/fuel ratio at 1.6. Energy 2021, 224, 120233. [Google Scholar] [CrossRef]
- Zheng, F.; Cho, H.M. Exploring the Effects of Synergistic Combustion of Alcohols and Biodiesel on Combustion Performance and Emissions of Diesel Engines: A Review. Energies 2024, 17, 6274. [Google Scholar] [CrossRef]
- Methanol Dual-Fuel Two-Stroke Engine. Available online: https://www.man-es.com/discover/antonia-maersk-methanol-ship (accessed on 25 November 2024).
- Habibic, A. Caterpillar Marine Aims to Deploy Methanol Dual-Fuel Marine Engines in 2026; Offshore Energy: Schiedam, The Netherlands, 2024. [Google Scholar]
- Jin, Y.; Zhang, Y.; Dong, P.; Zhai, C.; Nishida, K.; Wang, Y.; Leng, X. Diesel spray characteristics of multi-hole injectors under geometrical similarity condition. At. Sprays 2025, 35, 19–45. [Google Scholar] [CrossRef]
- Chu, W.; Li, H.; Liu, Y.; Zhou, B.; Luo, H.; Kim, W. Three-dimensional simulation analysis of in-cylinder combustion in space in-orbit hydrogen–oxygen internal combustion engine. Appl. Therm. Eng. 2025, 263, 125391. [Google Scholar] [CrossRef]
- Chang, F.; Luo, H.; Zhai, C.; Jin, Y.; Xiong, P.; Wang, J.; Song, B.; Zhang, J.; Nishida, K. Experimental investigation of fuel adhesion from wall-impinging spray with various injection mass ratios. Exp. Therm. Fluid Sci. 2025, 163, 111403. [Google Scholar] [CrossRef]
- Liang, J.; Wang, A.; Feng, Y.; Li, X.; Hu, Y.; Dong, S.; Zhang, Y.; Zhao, F. An Experimental and Kinetic Modeling Study of the Laminar Burning Velocities of Ammonia/n-Heptane Blends. Energies 2024, 17, 4874. [Google Scholar] [CrossRef]
- Díaz-Secades, L.A.; González, R.; Rivera, N. Waste heat recovery from marine main medium speed engine block. Energy, exergy, economic and environmental (4E) assessment—Case study. Ocean Eng. 2022, 264, 112493. [Google Scholar] [CrossRef]
- Miao, Z.; Wenhua, S.; Ji, W.; Zhen, C. Accident Consequence Simulation Analysis of Pool Fire in Fire Dike. Procedia Eng. 2014, 84, 565–577. [Google Scholar] [CrossRef]
- Bonte, F.; Noterman, N.; Merci, B. Computer simulations to study interaction between burning rates and pressure variations in confined enclosure fires. Fire Saf. J. 2013, 62, 125–143. [Google Scholar] [CrossRef]
- Chen, J.; Bi, Y.; Zhao, Y.; Tam, W.C.; Li, C.; Lu, S. Effect of pressure on the heat transfer of pool fire in a closed chamber. J. Therm. Anal. Calorim. 2020, 142, 2163–2171. [Google Scholar] [CrossRef]
- Hostikka, S.; Janardhan, R.K.; Riaz, U.; Sikanen, T. Fire-induced pressure and smoke spreading in mechanically ventilated buildings with air-tight envelopes. Fire Saf. J. 2017, 91, 380–388. [Google Scholar] [CrossRef]
- He, Q.; Li, C.; Lu, S.; Huang, S. Experimental Study of Pool Fire Burning Behaviors in Ceiling Vented Ship Cabins. Procedia Eng. 2014, 71, 462–469. [Google Scholar] [CrossRef]
- Kota, S.B.; Subramani, A.; Jayanti, S. Auto-ignition temperature and burning rate of potassium pool fire in a confined enclosure. Combust. Flame 2016, 168, 286–295. [Google Scholar] [CrossRef]
- Babrauskas, V. Estimating large pool fire burning rates. Fire Technol. 1983, 19, 251–261. [Google Scholar] [CrossRef]
- Diffusion Burning of Liquids. Available online: https://apps.dtic.mil/sti/citations/tr/AD0296762 (accessed on 11 May 2024).
- Hamins, A.P.; Kashiwagi, T.; Buch, R. Characteristics of Pool Fire Burning; NIST: Gaithersburg, MD, USA, 1995.
- Tian, X.; Liu, C.; Zhong, M.; Shi, C. Experimental study and theoretical analysis on influencing factors of burning rate of methanol pool fire. Fuel 2020, 269, 117467. [Google Scholar] [CrossRef]
- Sung, K.; Chen, J.; Bundy, M.; Hamins, A. The characteristics of a 1 m methanol pool fire. Fire Saf. J. 2021, 120, 103121. [Google Scholar] [CrossRef]
- Vali, A.; Nobes, D.S.; Kostiuk, L.W. Transport phenomena within the liquid phase of a laboratory-scale circular methanol pool fire. Combust. Flame 2014, 161, 1076–1084. [Google Scholar] [CrossRef]
- Yuan, J.; Zhao, J.; Wang, W.; Yang, R.; Chen, C.; Fu, M. The study of burning behaviors and quantitative risk assessment for 0# diesel oil pool fires. J. Loss Prev. Process Ind. 2021, 72, 104568. [Google Scholar] [CrossRef]
- Yang, S.; Pu, F.; Zhang, L.; Li, M.; Li, J. Experimental study on combustion characteristics of water-in-oil emulsified diesel pool fire with water sublayer. Appl. Therm. Eng. 2024, 238, 121932. [Google Scholar] [CrossRef]
- Zhao, J.; Zhang, Q.; Hu, Z.; Kang, R.; Jomaas, G.; Yang, R. Thin-layer boilover of large-scale diesel pool fires at sub-atmospheric pressure. Fuel 2024, 360, 130482. [Google Scholar] [CrossRef]
- Yip, A.; Haelssig, J.B.; Pegg, M.J. Multicomponent pool fires: Trends in burning rate, flame height, and flame temperature. Fuel 2021, 284, 118913. [Google Scholar] [CrossRef]
- Ding, Y.; Wang, C.; Lu, S. The effect of azeotropism on combustion characteristics of blended fuel pool fire. J. Hazard. Mater. 2014, 271, 82–88. [Google Scholar] [CrossRef]
- Zhu, P.; Huang, S.P.; Liu, Q.Y.; Zhu, X.L.; Shao, Q. Effects of low ambient pressure on the flame characteristics of ethanol-gasoline blended pool fire. Fuel 2024, 362, 130809. [Google Scholar] [CrossRef]
- Gao, Z.; Wan, H.; Ji, J. The effect of blend ratio on the combustion process of mutually stratified blended fuels pool fire. Proc. Combust. Inst. 2021, 38, 4995–5003. [Google Scholar] [CrossRef]
- Richards, P.; Baker, J. Automotive Fuels Reference Book, 4th ed.; SAE International: Warrendale, PA, USA, 2023; ISBN 978-1-4686-0578-5. [Google Scholar]
- Yaws, C.L. Thermophysical Properties of Chemicals and Hydrocarbons; William Andrew: Norwich, NY, USA, 2008; ISBN 978-0-8155-1990-4. [Google Scholar]
- Hwang, W.; Dec, J.; Sjöberg, M. Spectroscopic and chemical-kinetic analysis of the phases of HCCI autoignition and combustion for single- and two-stage ignition fuels. Combust. Flame 2008, 154, 387–409. [Google Scholar] [CrossRef]
- Vali, A.; Nobes, D.S.; Kostiuk, L.W. Quantifying the Conduction Pathways in a Laboratory-Scale Methanol Pool Fire. Combust. Sci. Technol. 2015, 187, 765–779. [Google Scholar] [CrossRef]
- Jarosz, W. Boilover and slopover phenomena during a fire of storage tanks containing crude oil. Zesz. Nauk. SGSP/Szkoła Główna Służby Pożarniczej 2011, 42, 15–22. [Google Scholar]
- Gülder, Ö.L. Transport of water vapor from combustion gases into liquid-phase in unsteady methanol pool flames. Exp. Therm. Fluid Sci. 2000, 23, 51–57. [Google Scholar] [CrossRef]
- Wang, J.; Cui, X.; Zhang, R.; Xie, Q.; Zhang, S.; Shi, L. Study on the mass loss rate of liquid pool fire in a well-confined ship cabin. Int. J. Therm. Sci. 2021, 166, 106984. [Google Scholar] [CrossRef]
- Ferrero, F.; Muñoz, M.; Arnaldos, J. Thin-layer boilover in diesel-oil fires: Determining the increase of thermal hazards and safety distances. J. Hazard. Mater. 2007, 140, 361–368. [Google Scholar] [CrossRef]
- Zukoski, E.E. Visible structure of buoyant diffusion flames. Symp. Combust. 1985, 20, 361–366. [Google Scholar] [CrossRef]
- Maynard, T.B.; Butta, J.W. A Physical Model for Flame Height Intermittency. Fire Technol. 2018, 54, 135–161. [Google Scholar] [CrossRef]
- Heskestad, G. Fire plumes, flame height, and air entrainment. In SFPE Handbook of Fire Protection Engineering; Hurley, M.J., Gottuk, D., Hall, J.R., Harada, K., Kuligowski, E., Puchovsky, M., Eds.; Springer: New York, NY, USA, 2016; pp. 396–428. [Google Scholar]
- Thomas, P.H. The size of flames from natural fires. Symp. Int. Combust. 1963, 9, 844–859. [Google Scholar] [CrossRef]
- Hottel, H.C. Certain laws governing the diffusive burning of liquids–A review. Fire Res. Abs. Rev. 1959, 1, 41–44. [Google Scholar]
- Vali, A. Investigation of the Transport Phenomena within the Liquid Phase of a Methanol Pool Fire. Available online: https://era.library.ualberta.ca/items/946cf7b5-28d8-4ef4-819f-7961d8b0192a (accessed on 28 September 2024).
- Baranova, T.; Zhukova, Y.V.; Chorny, A.D.; Trekh, A.; Rudenko, A.I. Convective heat transfer of heat sinks with partially cut plate fins and turning of their cut sections. Heat Transf. Res. 2023, 54, 17–28. [Google Scholar] [CrossRef]
- Modak, A.T.; Croce, P.A. Plastic Pool Fires. Combust Flame 1977, 30, 251–265. [Google Scholar] [CrossRef]
- Wang, X.; Zhou, K.; Mebarki, A.; Jiang, J. Numerical simulation of thermal response behavior of floating-roof tanks exposed to pool fire. Appl. Therm. Eng. 2020, 179, 115692. [Google Scholar] [CrossRef]
- Hu, L.; Tang, F.; Wang, Q.; Qiu, Z. Burning characteristics of conduction-controlled rectangular hydrocarbon pool fires in a reduced pressure atmosphere at high altitude in Tibet. Fuel 2013, 111, 298–304. [Google Scholar] [CrossRef]
- Tien, C.; Sc, L. Flame radiation. Prog. Energy Combust Sci. 1982, 8, 41–59. [Google Scholar] [CrossRef]
- Yi, L.; Wang, X.; Bu, R.; Zhang, S.; Zhou, Y. A Methodology for Predicting Temperature Distribution inside Concrete Pavement under A Pool Fire. Combust. Sci. Technol. 2021, 193, 911–930. [Google Scholar] [CrossRef]
- Hamins, A.P.; Yang, J.C.; Kashiwagi, T. Global Model for Predicting the Burning Rates of Liquid Pool Fires (NISTIR 6381); NIST: Gaithersburg, MD, USA, 1999.
- Hamins, A.; Fischer, S.J.; Kashiwagi, T.; Klassen, M.E.; Gore, J.P. Heat Feedback to the Fuel Surface in Pool Fires. Combust. Sci. Technol. 1994, 97, 37–62. [Google Scholar] [CrossRef]


Disclaimer/Publisher’s Note: The statements, opinions and data contained in all publications are solely those of the individual author(s) and contributor(s) and not of MDPI and/or the editor(s). MDPI and/or the editor(s) disclaim responsibility for any injury to people or property resulting from any ideas, methods, instructions or products referred to in the content. |
© 2025 by the authors. Licensee MDPI, Basel, Switzerland. This article is an open access article distributed under the terms and conditions of the Creative Commons Attribution (CC BY) license (https://creativecommons.org/licenses/by/4.0/).