Abstract
Due to the fracture caverns in fractured-vuggy reservoirs, channeling frequently occurs during water injection or gas injection. The stability of the oil–water/oil–gas interface during water injection or gas injection in fractured-vuggy reservoirs significantly affects the displacement efficiency. However, there is a lack of in-depth understanding of the stability of the gas–water interface migration during water injection or gas injection in such reservoirs. In order to deal with this problem, this study combines indoor 3D visualization physical simulation experiment and fracture-cavity reservoir flow simulation. The law of interface transport and oil recovery in the process of injection of gas/water considering the degree of filling of fracture holes was studied and the influence of formation on crude oil viscosity, gas injection speed, inclination angle and other factors on the stability of the interface was compared. Results show that, under the influence of gravity differentiation, the oil–water interface of high-viscosity crude oil fluctuates obviously after water breakthrough, and the oil–water interface tends to be unstable, forming uneven oil cones. By reducing the gas drive speed, water invasion can be effectively inhibited to achieve a stable interface which accordingly improves the oil recovery.
1. Introduction
Carbonate reservoirs constitute approximately 60% of global hydrocarbon reserves [1], with fractured-vuggy systems exhibiting extensive distribution worldwide. Recently, large oil and gas fields have been discovered, including the Yates Oilfield and Puckette Oilfield in the United States, the Huangjin Port Oilfield in Mexico, the Kirkuk Oilfield in Iraq, the Natih Oilfield in Oman and the Tahe Oilfield in Tarim Basin in Xinjiang [2,3]. Fractured-vuggy carbonate reservoirs account for a large proportion of the marine carbonate rocks in China’s total oil reserves (~150 × 108 tons), such as the largest fractured-vuggy carbonate rock salt reservoir in China’s Tahe Oilfield in the Tarim Basin, Xinjiang, with a scale of 6.12 × 10⁸ tons. Fractured-vuggy carbonate reservoir is a kind of important carbonate reservoir. In the production of carbonate reservoir, the production of fracture-cave carbonate rock accounts for about 30%. The substantial development potential of these reservoirs underscores the critical importance of their efficient exploitation for sustainable hydrocarbon resource management in China [4,5].
Current development strategies for fractured-vuggy carbonate reservoirs primarily involve natural energy depletion during initial production phases, transitioning to water injection for energy replenishment when reservoir pressure declines [2,6]. Many scholars have carried out corresponding research on water injection through indoor experimental simulation. Cruz-Hernandez [7] employed plexiglass fracture-vuggy etching models for water flooding experiments, interpreting results through dual-porosity theoretical modeling. Similarly, Kang [8] implemented photoetched glass plate technology to construct two-dimensional fracture-vuggy models, demonstrating through water-oil displacement experiments that fractures serve as primary flow conduits with negligible capillary effects. Further, Wang Lei et al. [9] found that once the water flow channel is continuous in the process of water injection displacement, the remaining oil in the karst cave is difficult to be used again. Changing the water injection mode (such as periodic water injection and reversing water injection) is an effective means to further use the remaining oil in the karst cave. Building on this, Zhang et al. [10] adopt the method of two-dimensional etching and a superposition combination of glass plates to simulate and optimize the injection-production position and injection-production speed of fractured-vuggy reservoirs. Because the fractured-vuggy reservoir is composed of multi-scale dissolution pores and fractures, and the storage space and seepage space are various, the method of carving the two-dimensional plane model is very time-consuming, and the transparency of the etched cave is seriously reduced, which makes it impossible to observe the experimental phenomena well. In addition, some two-dimensional plane models cannot change the inclination of the model, and there is no three-dimensional physical model intuitive. On this basis, Wang et al. [11] integrated CT scanning technology and 3D printing technology to fabricate three-dimensional visual physical models incorporating diverse fracture-vuggy architectures, conducting systematic waterflooding and inverse injection simulations. The same study shows that the formation mechanism of residual oil in water flooding includes the influence of gravity difference between oil and water. Similarly, Yang Xuewen, Qian Zhen and Juan He designed a three-dimensional physical simulation experiment that analyzed the water drive law and also confirmed that the oil–water movement is mainly dominated by gravity [12,13,14]. For the physical simulation experiments of fracture-cave media, most of the research objects are large-scale cracks and karst caves, and the filling medium and its physical properties in the karst caves are rarely considered. Although a few scholars have considered the filling medium, they have not considered the physical properties of the filling medium, nor have they deeply studied the influence of the filling medium on the stability of the interface. Therefore, they have accurately described the karst cave structure, visually observed the fluid distribution, carefully analyzed the development characteristics presented by the experiment, and constructed a three-dimensional physical fracture-vuggy reservoir model considering variable water energy, inclination angle, edge and bottom water and different filling degrees, further deepening the multi-factor water injection effect experiment is the key to the study.
When the fractured-vuggy carbonate reservoir enters the later stage of water injection development, the water content is usually very high, which can reach more than 90%, and the gas injection development is widely recognized as the most important way to reduce the water content and restore the oil recovery capacity of oil wells. Field applications, such as in the Yates [15], Buena Vista [16], and Hungary’s Ngaylengyel oilfields [17], have validated its efficacy under high water-cut and rapid pressure decline conditions. Cantarell oilfield in Mexico is an offshore fractured-vuggy carbonate oilfield. In the experiment of nitrogen-assisted gravity displacement, the recovery rate was significantly improved by optimizing injection-production parameters, the technology has been successfully applied in the FAHUD Oilfield in Oman [18]. While gas injection is recognized as an effective enhanced oil recovery (EOR) method, its mechanisms—primarily attributed to gas-liquid gravity segregation and energy replenishment—require further clarification, with variations observed across gas types. Guo et al. [19] using microscopic fracture-vuggy models with upward and downward openings respectively, and conducted displacement experiments with different development methods. It was found that alternate gas–water injection is superior to single-water injection and gas injection, and it can effectively displace the oil in the upper and lower caves of the fracture. Hui et al. [20] systematically characterized nitrogen huff-puff mechanisms, including gravity differentiation, viscosity reduction via gas-oil mixing, and energy supplementation. Qin’s [21] high-pressure experiments highlighted delayed gas-liquid interface advancement in filled cavities, emphasizing fracture-vuggy connectivity in displacement efficiency. Similarly, Hou et al. [22] used a two-dimensional visual profile model to carry out N2 flooding research and made it clear that N2 flooding can effectively increase formation energy and that gas injection velocity has a great influence on sweep efficiency, gas–water alternation is the best injection method. Further, Yang et al. [23] designed a similarity-based 2D model for Tahe Oilfield, observing consistent oil–water interface behavior at 20 and 5 mL/min injection rates, with gas coning and synergistic effects during nitrogen displacement. Chen’s [24] study on the Ying Mai 2 reservoir integrated interface stability analysis with physical simulations, confirming gas–water alternation’s superiority through optimized gas injection strategies. Despite these advances, physical simulations remain limited in fully capturing injection-production parameter impacts on interface stability and recovery due to experimental complexity and multivariate constraints, necessitating multifactorial analysis of critical parameters governing gas injection processes.
Gas injection-enhanced oil recovery (GI-EOR) technology has been extensively tested in China’s Tahe Oilfield, where early-stage nitrogen injection trials demonstrated promising outcomes. However, critical gaps persist in understanding the gravity segregation of injected gases and interfacial interaction mechanisms between nitrogen and oil phases. To address these challenges, we investigate three-phase flow dynamics and interface stabilization processes through (1) 3D physical modeling replicating fracture-vuggy fill degrees, (2) interface stability analysis evaluating various injection parameters, and (3) numerical simulation for extended experimental parameter analysis. These mechanisms are quantified via sensitivity analysis of oil–gas–water interface stability, ultimately providing actionable guidelines for synergizing waterflood and gas injection strategies in carbonate reservoirs.
2. Experimental Materials and Procedure
2.1. Visual Physical Model of Cracks and Holes
The visualization model established by Mahmoud and Rao primarily considers the influence of oil–gas interface changes and gas injection velocity on recovery factor during gas cap gravity drainage processes, but neglects the effects of edge/bottom water and gas cap stability characteristics. Their study investigated only a limited number of sensitive factors [25]. To systematically elucidate the key controlling factors and their operational mechanisms in gas cap gravity drainage for fractured-vuggy reservoirs, this research focuses on four sensitivity parameters: formation dip angle, gas injection pressure, crude oil viscosity, and fracture-cavity filling degree. We have developed an innovative three-dimensional visualized physical simulation device with multifactorial collaborative control functions, which exhibits the following technical features:
- (1)
- System Integration: capable of synchronously simulating gas injection-water injection (edge/bottom water) collaborative displacement processes and conducting simulation experiments for different fracture-cavity filling degrees;
- (2)
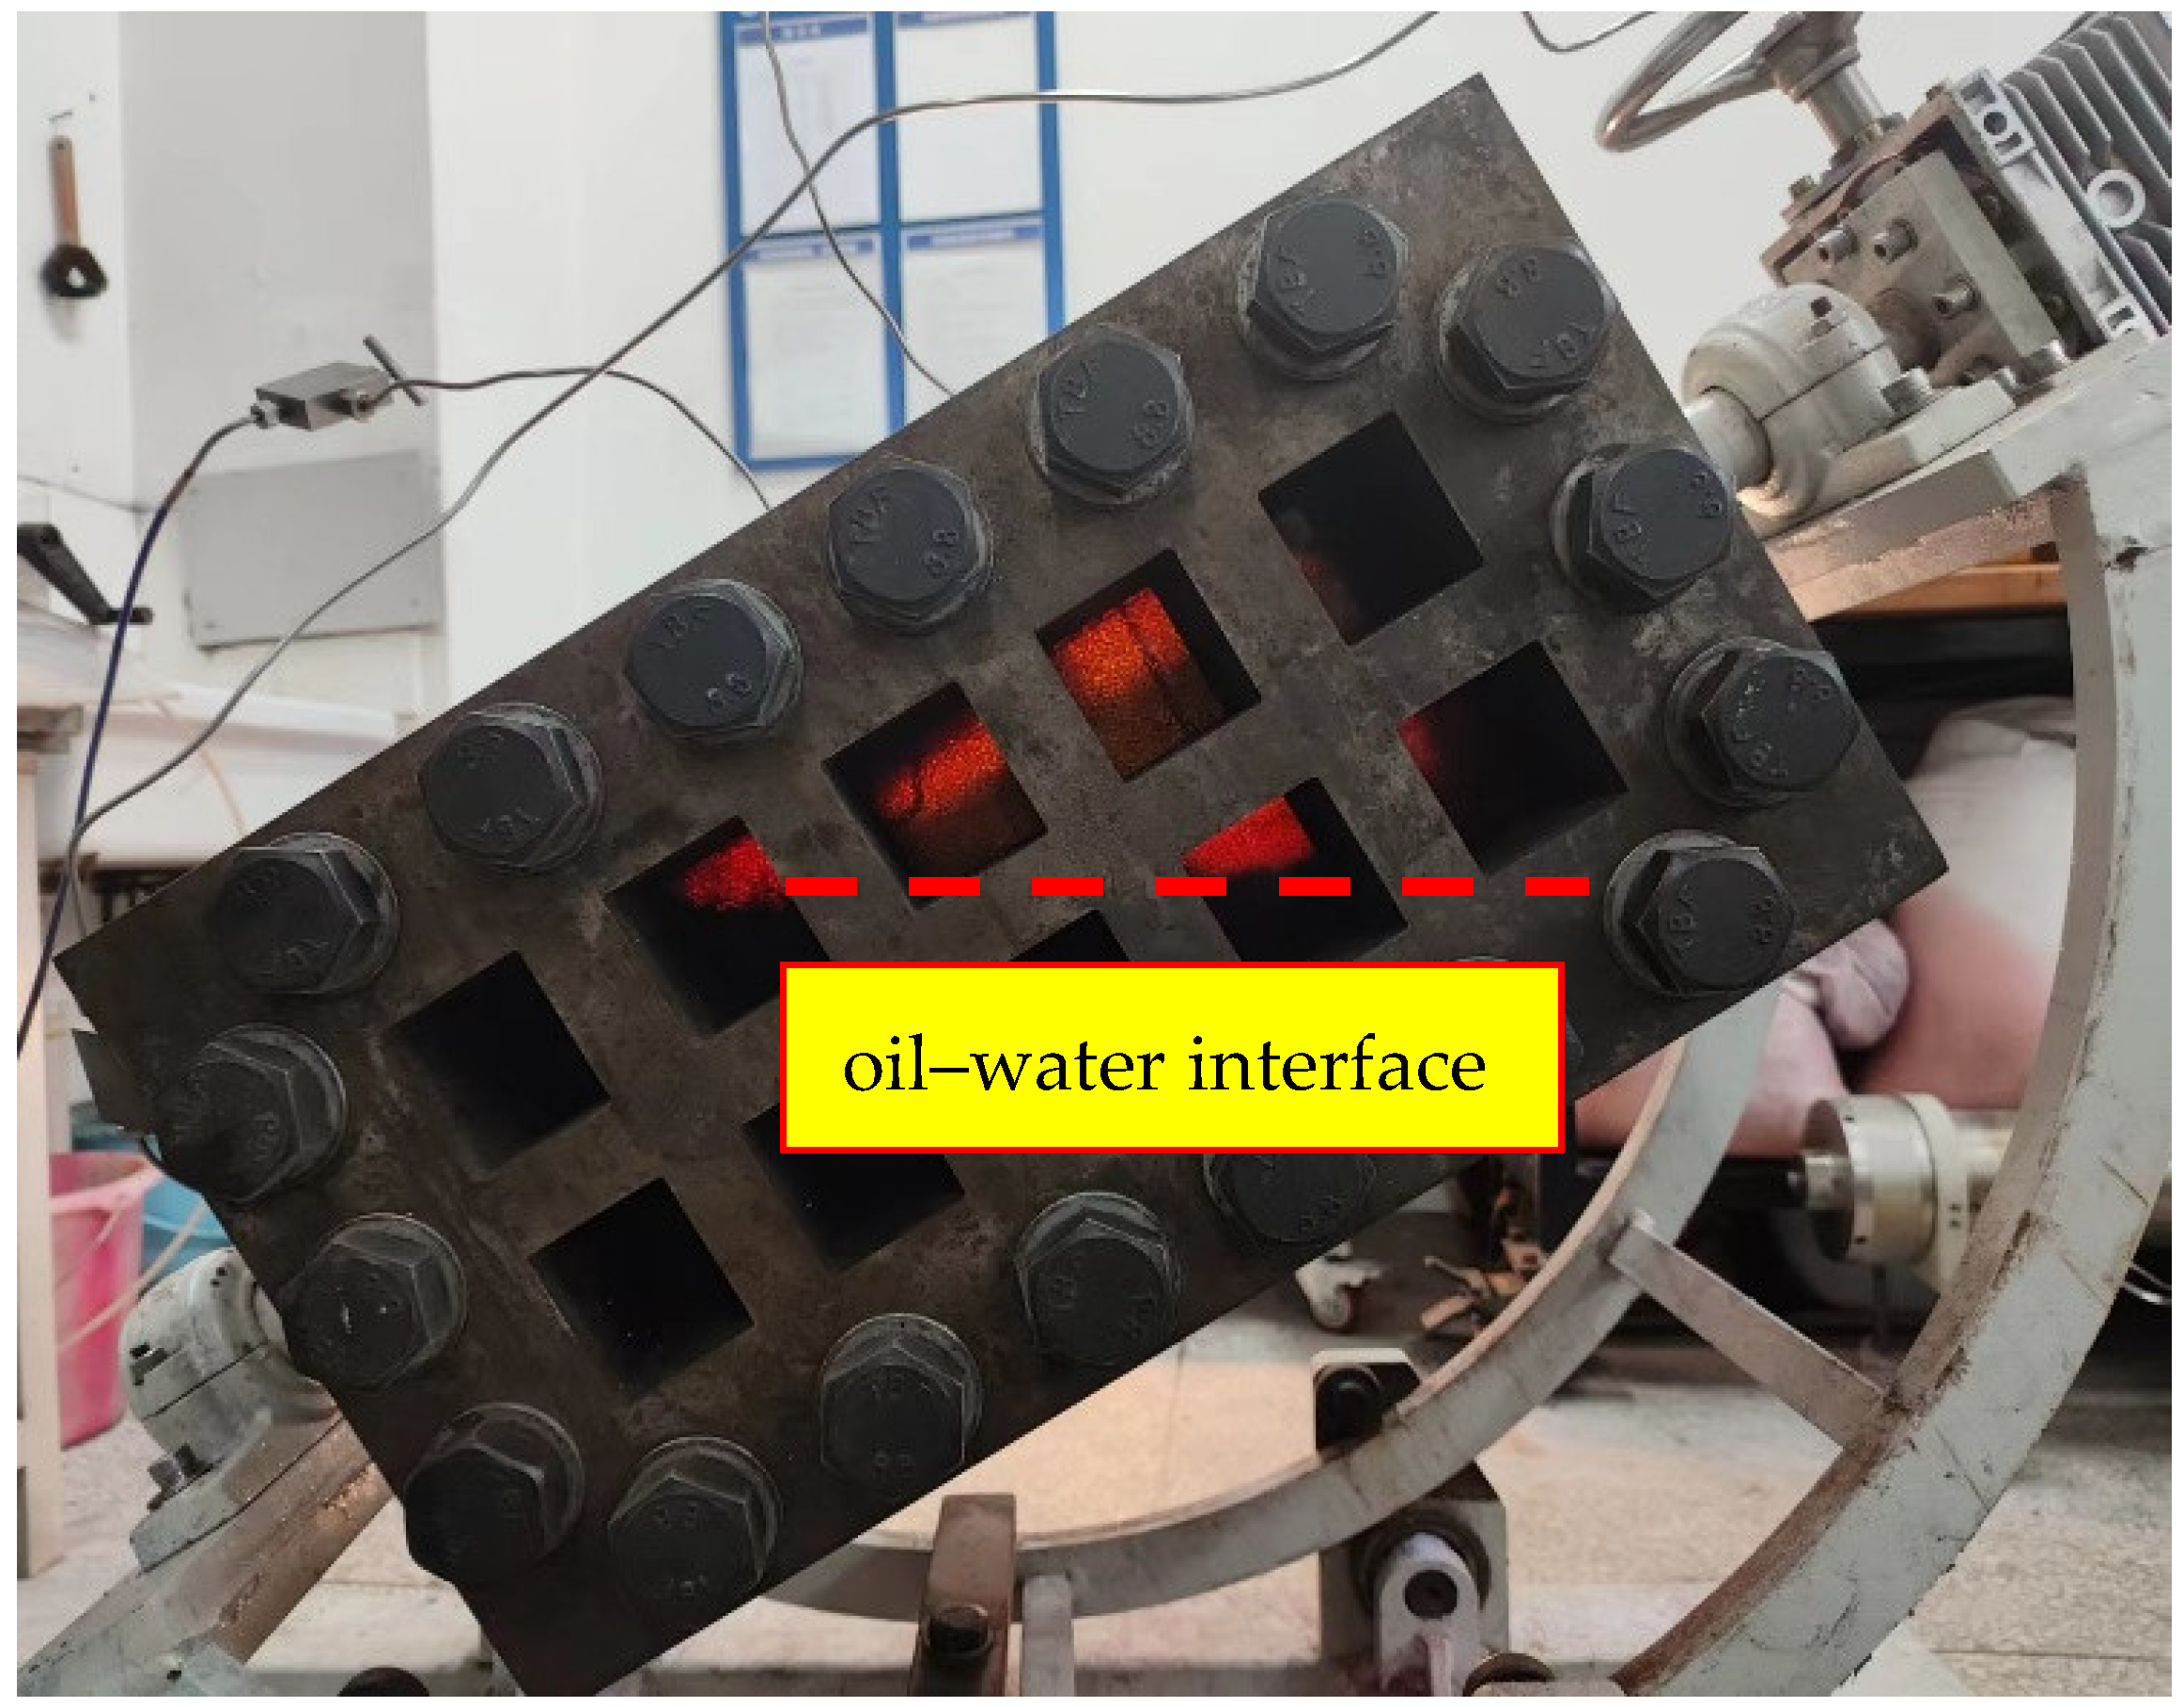
- Advanced Observation: through 10 visualization observation windows symmetrically distributed on both sides, real-time capture of dynamic migration characteristics of oil–gas–water three-phase interfaces is enabled;
- (3)
- Parameter Controllability: equipped with a precision temperature-pressure control system to accurately regulate parameters such as formation dip angle, water intrusion position, and water intrusion multiples;
- (4)
- Detection Reliability: utilizing a dual-color tracer system (Sudan Red for crude oil staining and Methylene Blue for injected water staining) combined with high-resolution image acquisition technology, ensuring three-phase interface recognition accuracy at the millimeter level.
The main body of the experimental device is constructed using high-strength alloy steel, with overall dimensions of 40 cm (length) × 15 cm (width) × 10 cm (height). Injection/production wellbores are reserved on both upper/lower surfaces and ends of the device, allowing flexible configuration of injection/production well positions according to experimental protocols. As shown in Figure 1. This apparatus overcomes the bottleneck of traditional two-dimensional models in simulating complex fracture-cavity structures, providing a key technical means for in-depth research on the relationship between multiphase interface stability and displacement efficiency.
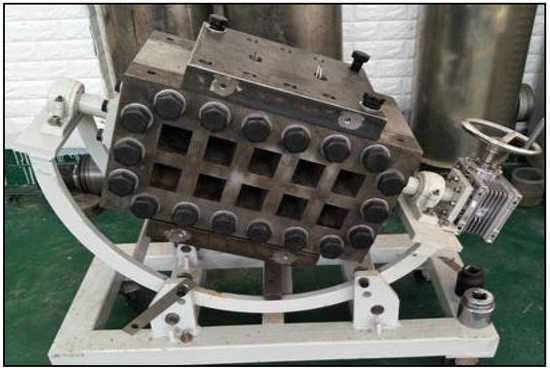
Figure 1.
Visual physical model of cracks and holes.
2.2. Filling Medium
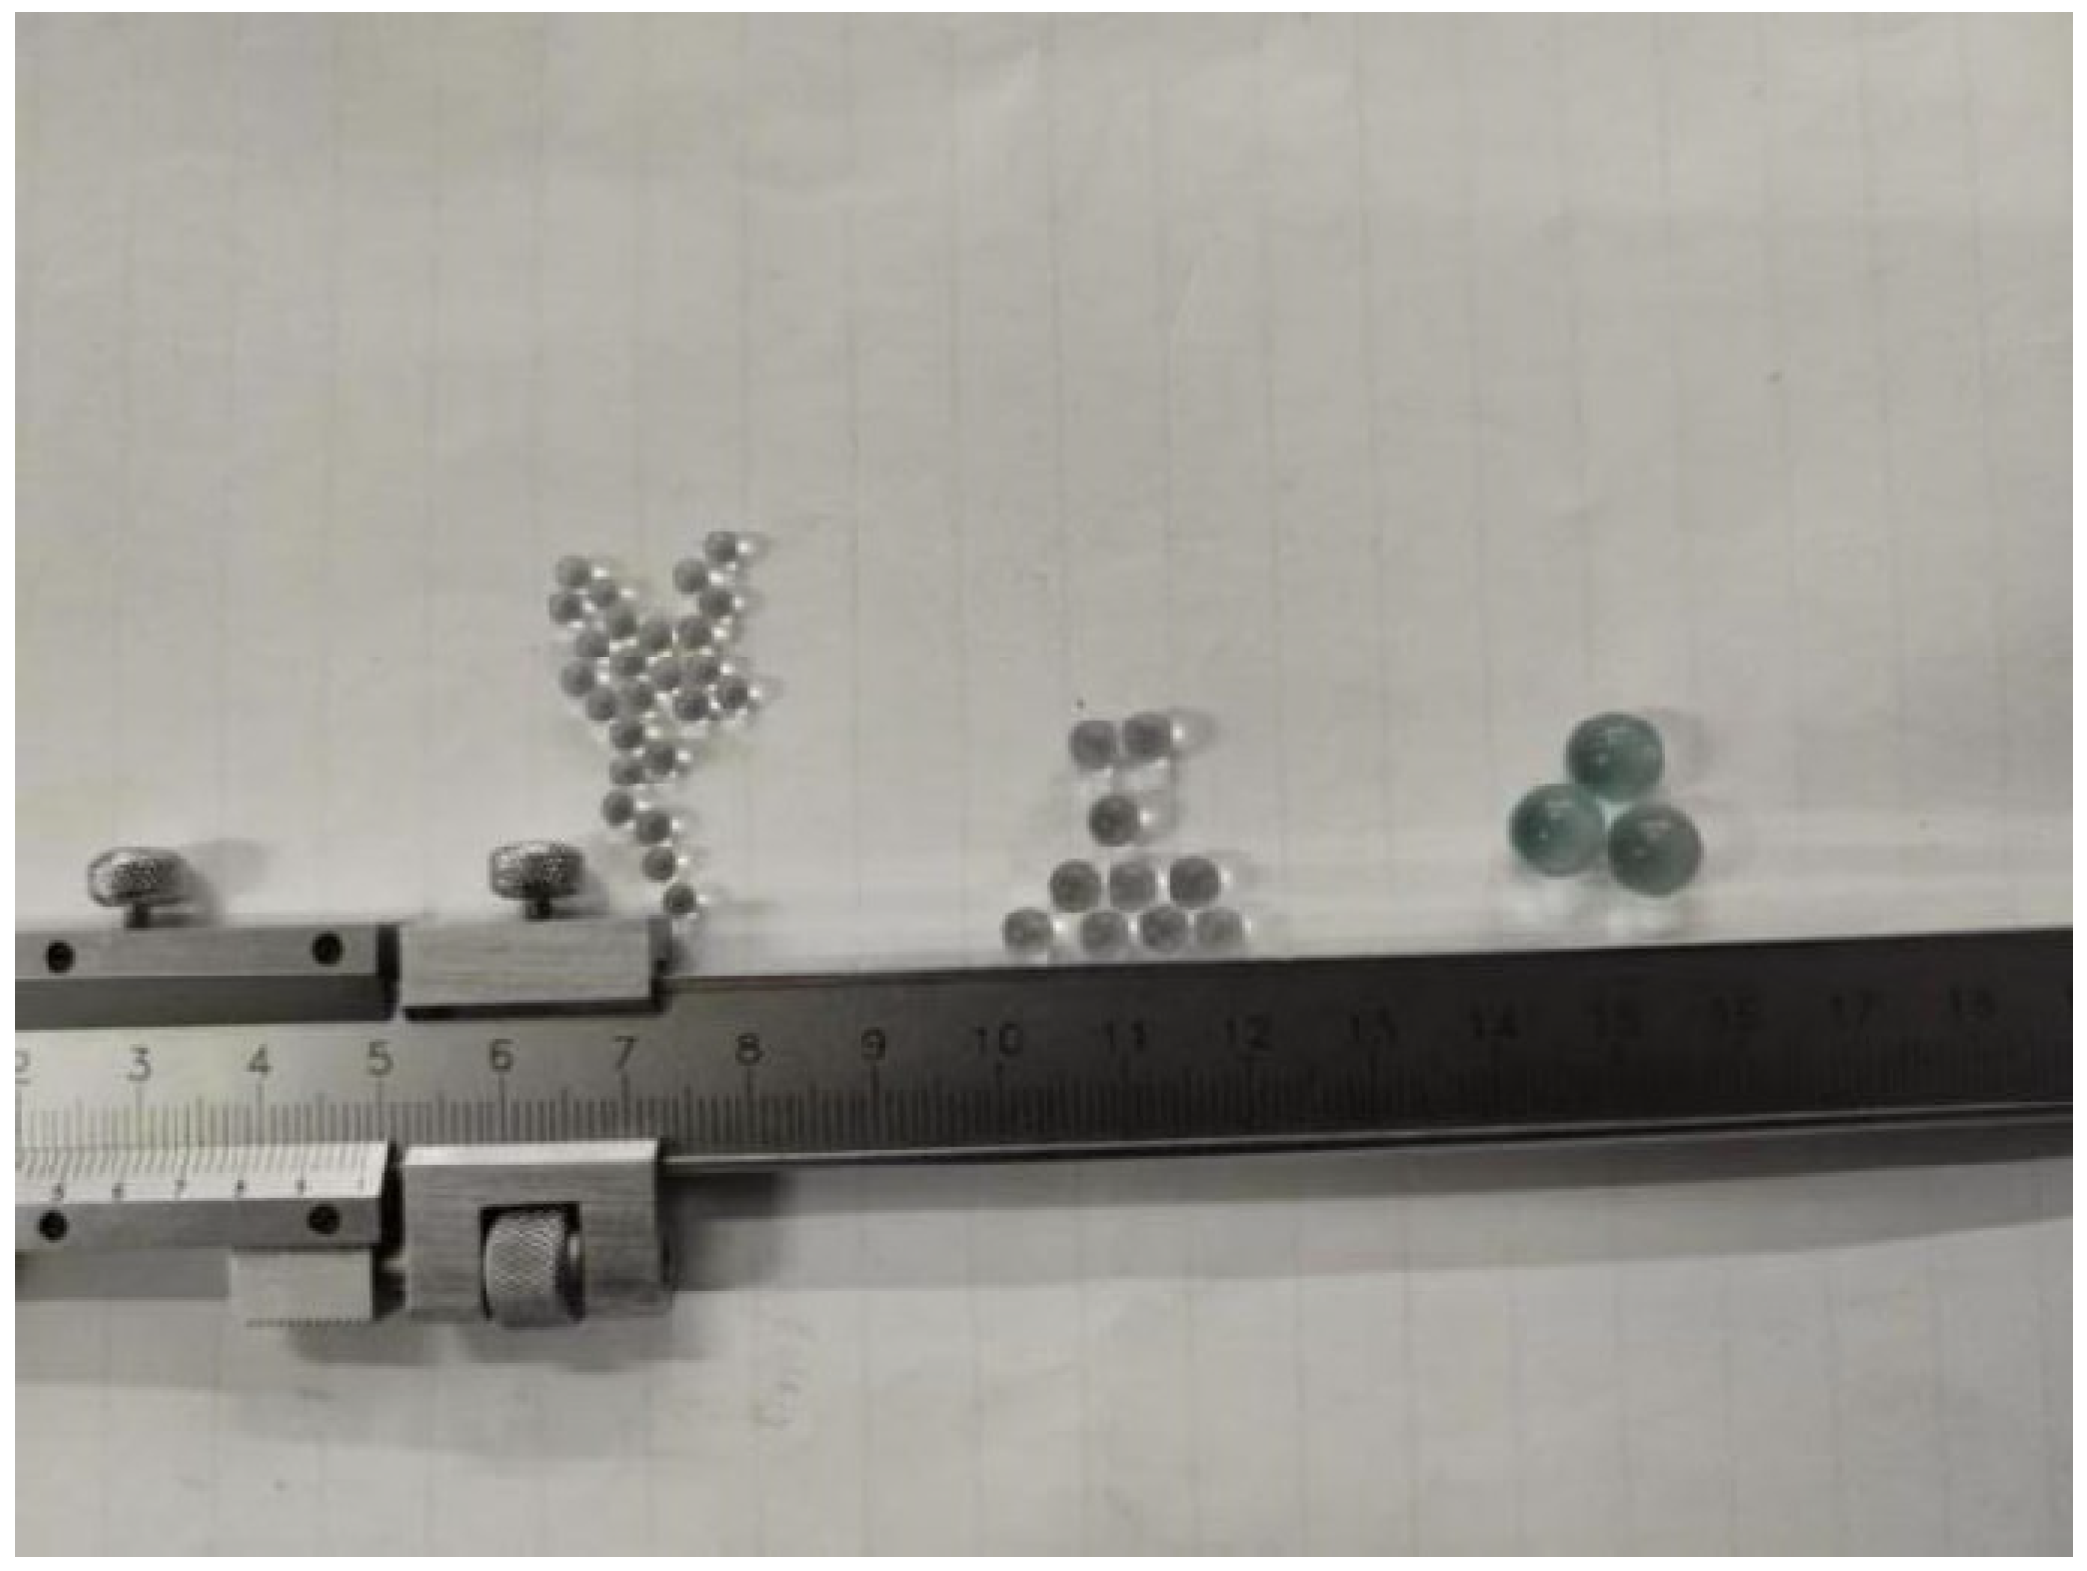
In this experiment, the experimental fluids were: simulated oil, formation water, and nitrogen. The viscosity of the crude oil dyed with Sudan red was 90 cP, 50 cP, and 5 cP, and the density was 0.970 g/cm3, 0.961 g/cm3, and 0.852 g/cm3, respectively. The formation water was dyed with methylene blue, and the mineralization of the mixture was 80 g/L according to NaCI: CaCl2: MgCI2.6H2O = 7:0.6:0.4. Nitrogen uses high purity nitrogen with a purity greater than 99.99%. Due to the difficulty of controlling the gas drive rate, different gas drive pressures (0.1 MPa and 0.25 MPa) are used instead, and most of the caves are full of sediments, debris, breccia, etc. Therefore, we ignored the non-uniformity of the filling medium and used glass beads with different particle sizes (1 mm, 2 mm, 5 mm) to characterize the different permeability sizes shown in the Figure 2.
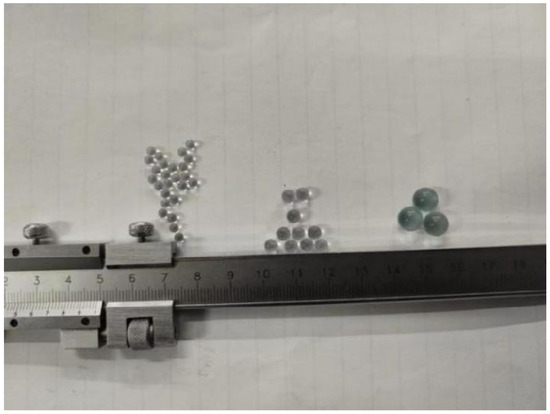
Figure 2.
Filling medium.
2.3. Experimental Procedure
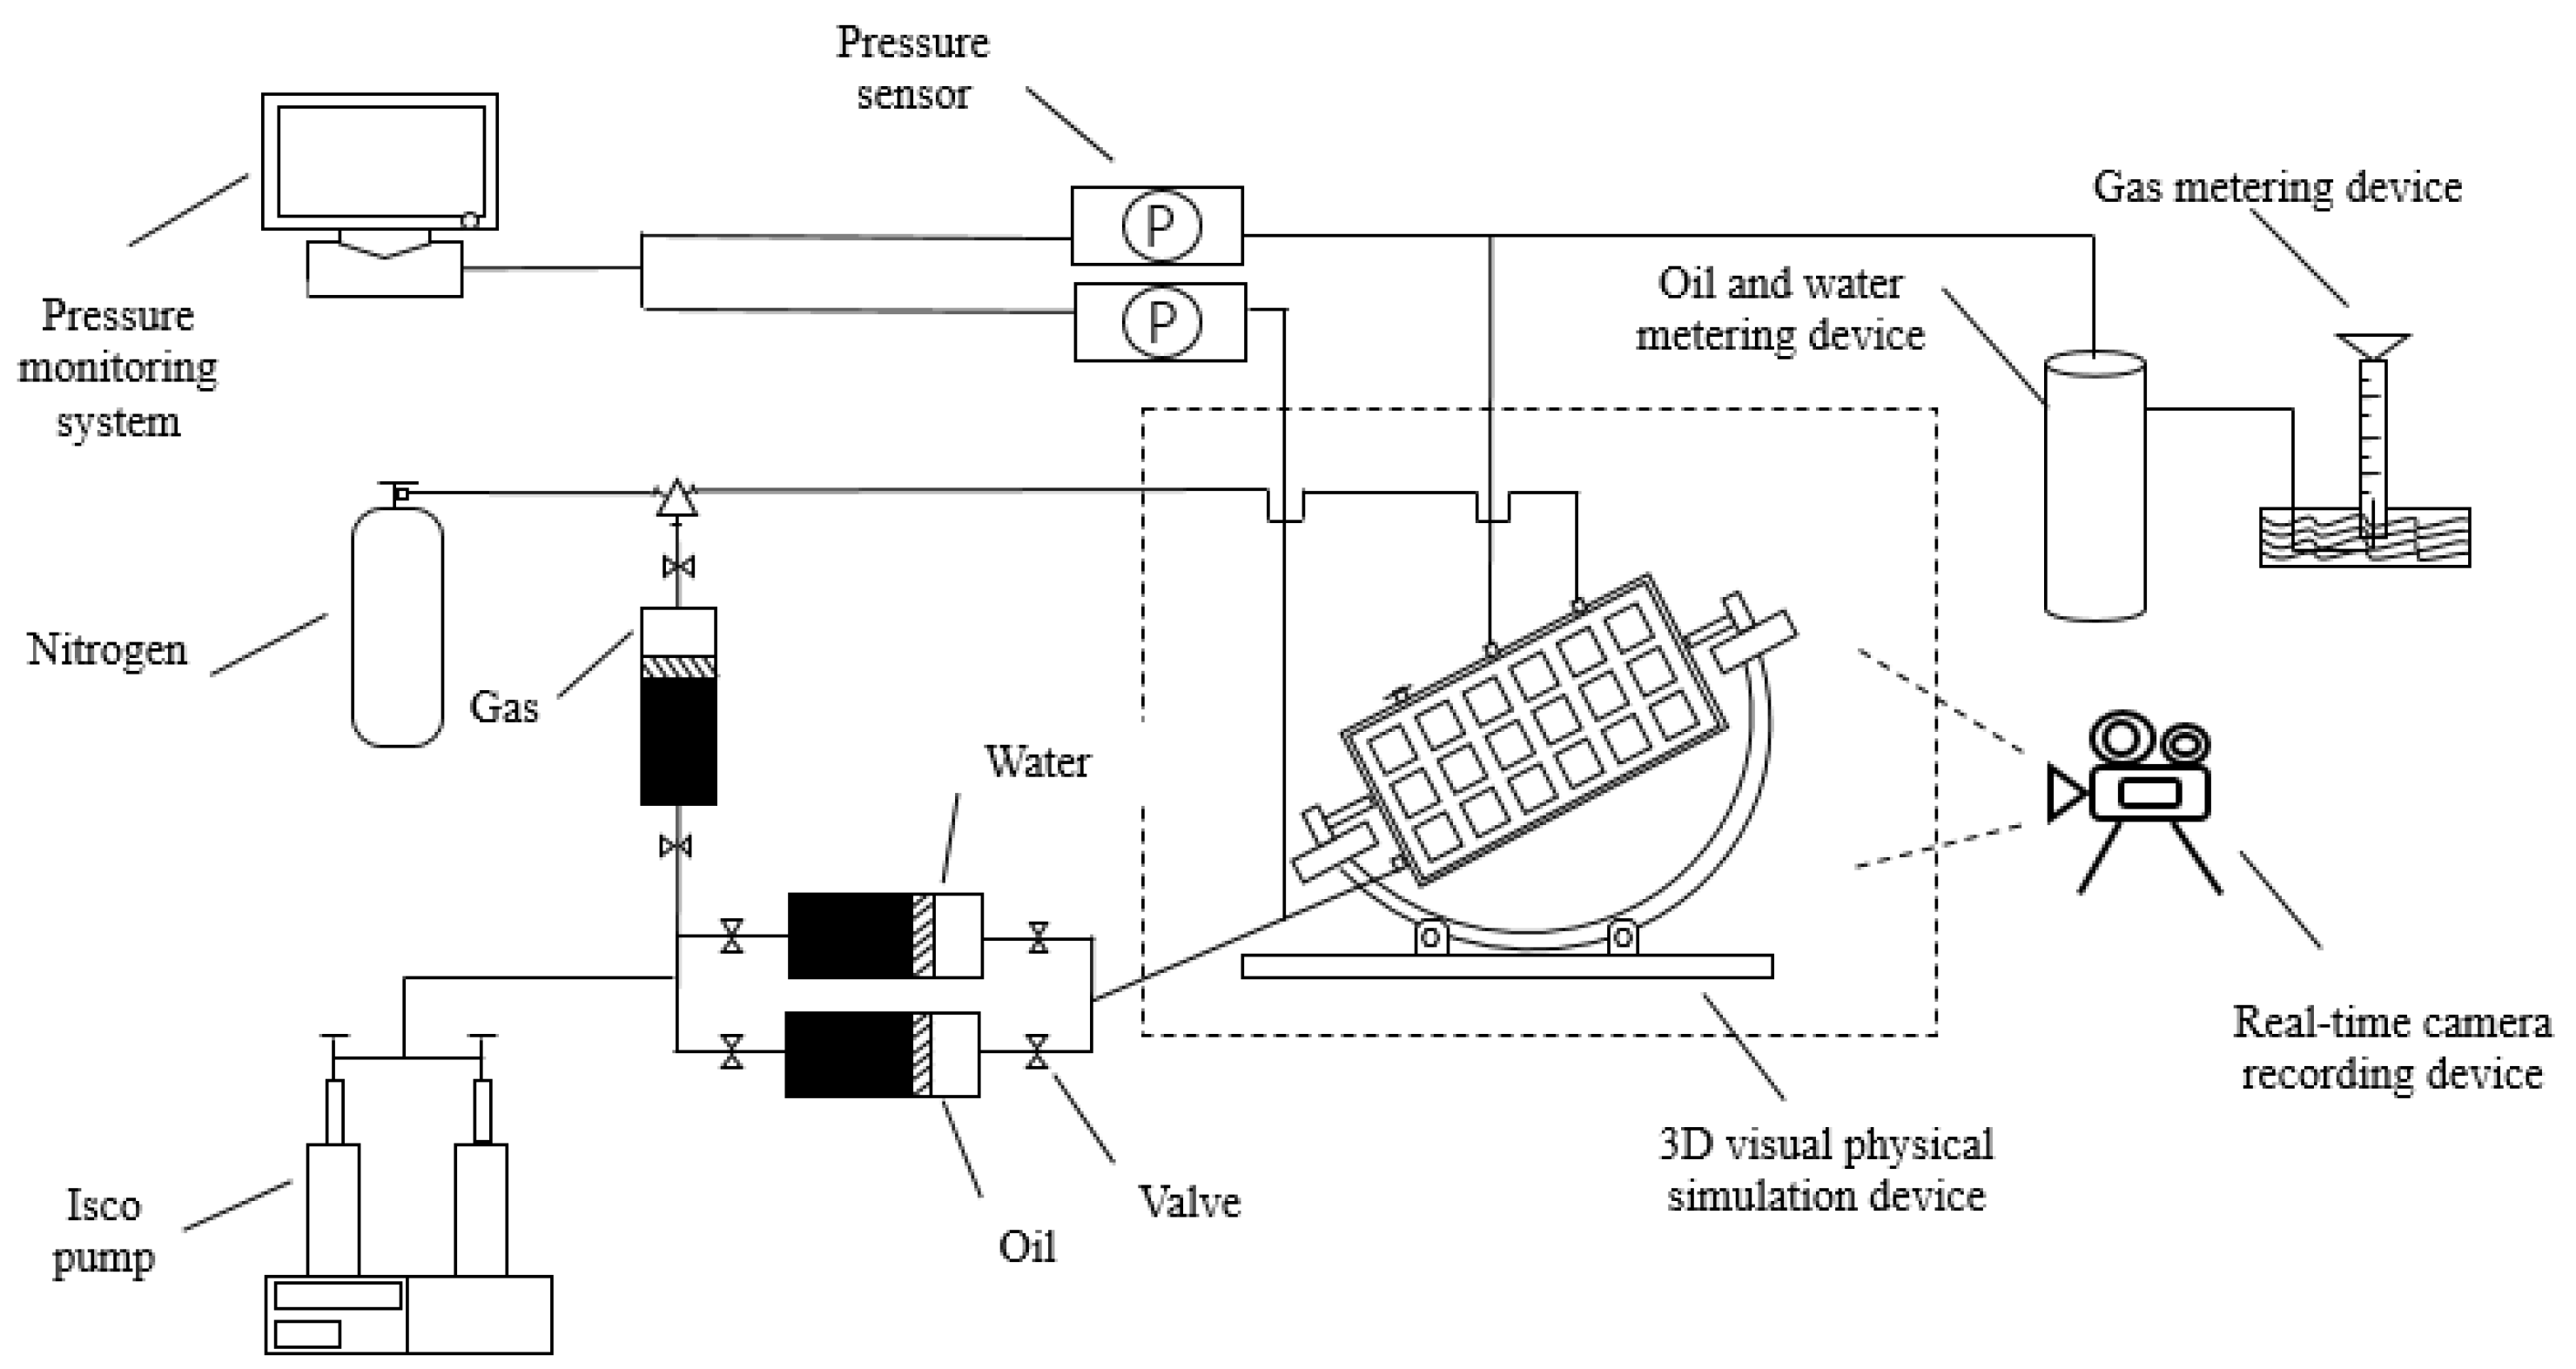
The experimental Schematic diagram is shown in Figure 3, and the experimental steps are described as follows:
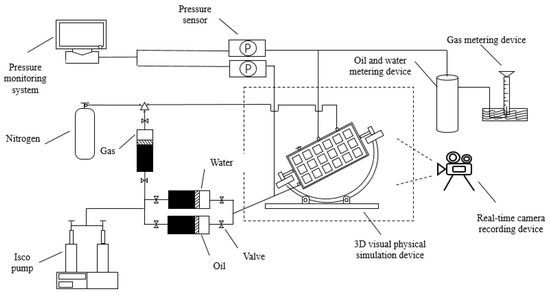
Figure 3.
Schematic diagram of the experimental setup.
- (1)
- The experiments were carried out at 20 °C and atmospheric pressure.
- (2)
- After the glass ball is loaded into the 3D visual fracture and hole physical model, change the inclination of the model, and then wholly saturate the oil.
- (3)
- Slow water flooding was carried out from the bottom at a displacement pressure of 150 psi. When the water cut of the fluid at the outlet end was close to 99%, nitrogen gas injection was started from the top, and a video camera was used to take pictures and record the interface changes.
- (4)
- The experiment is stopped when the production well no longer produces oil.
2.4. Comparison of Experimental Schemes
Operational experience in production indicates that significant disparities exist in both the development efficiency and water category of fractured-vuggy reservoirs [26]. For a specific fracture-cavity unit, there is an optimal matching value for the amount of water injected. Too large amounts of water injected will lead to too high pressure in the karst cave and excessive equipment load. Appropriate gas injection pressure is conducive to the stability of the oil and gas interface [27]. This experimental scheme I first uses 2-mm glass beads as the filling medium, changes the inclination angle of the three-dimensional physical model to 30, then uses oil with a viscosity of 5 cP as the filling medium for filling, saturates the simulated oil, then carries out slow water injection at the bottom, stop the water injection when the water content reaches 98%, and finally carry out gas injection at the top at a pressure of 0.1 MPa, so as to clearly observe the distribution of oil, gas–water interface. The experimental scheme is shown in Table 1.

Table 1.
Basic parameters of experimental cores.
2.5. Fracture-Vuggy Reservoir Simulation
To address the constraints of physical experimentation, we developed a finite element-based multiphase flow model for fracture-vug networks with heterogeneous filling patterns. By coupling phase-field modeling with laminar flow theory, this framework validated experimental observations and extended parametric analysis beyond laboratory conditions. The continuity equation, a fundamental principle in fluid dynamics, is mathematically expressed as [28,29]:
Laminar flow continuity equation:
Momentum equation:
where: ρ is the density, kg/m3; u is the speed, m/s; t is time, s; p is pressure, Pa; I is the identity matrix, no identity; K is the viscous stress tensor, Pa; F is the volume force vector, N/m3; g is the acceleration of gravity, m/s2; μ is viscosity, Pa.s; T is the absolute temperature, K; S is the strain rate tensor.
The Navier–Stokes equation for the conservation of momentum and the continuity equation for the conservation of mass are then solved through the interface of the three-phase flow, and the location of the interface for separating the liquid phase is tracked by solving four additional transport equations: two equations governing the phase field variables and two equations corresponding to the generalized chemical potential. The movement of the interface is determined by the minimization of free energy. Phase field variables A, B, and C of the three-phase flow should satisfy Equation (3):
Assuming the density of each phase is constant, which implies that phase field variables directly correspond to the volume fractions of the phases under consideration, the free energy of a three-phase system is defined as a function of the phase field variables in a manner that:
where Λ is a function or parameter specifying additional free energy, and Λ is 0 by default. σij represents the surface tension coefficients of phases i and j, and the capillary parameter ∑i is defined as Equation (5):
For each phase, P = A, B, C, the Cahn–Hilliard equation to be solved is:
where Λ is a function or parameter specifying additional free energy, and Λ is 0 by default. σij represents the surface tension coefficients of phases i and j, and the capillary parameter ∑i is defined as Equation (7).
To satisfy Equation (4), solve Equations (6) and (7), that is, the equations of phase A and phase B, and calculate the phase field variable of fluid C and the corresponding mass fraction, an additional dependent variable generalized potential η is introduced into the Cahn-Hilliard equation. In Equation (7), ε is the parameter that controls the thickness of the interface, 1/m; M0 is the molecular mobility parameter, m3/s. The parameter ΣT is defined by Equation (8):
Coupled three-phase flow, laminar flow model, make:
Equations (1)–(9) are mathematical models of coupled laminar flow and three-phase flow.
Fracture-vuggy reservoirs exhibit significant heterogeneity owing to diverse reservoir spaces, large-scale dimensions, and irregular spatial distribution, compounded by highly complex pore connectivity architectures. Therefore, simplifying the fracture-vuggy configuration and connectivity structure is conducive to the convergence of the finite element model constructed during the study. The two-dimensional model of the fracture-cavity grid established by COMSOL 6.1 is used to construct fillings in the seepage zone, and the gaps between the fillings simulate cracks and karst caves. As shown in the following Table 2, the model is divided by free quadrilateral mesh and the parameters of the model are established.
Table 2.
Model parameters.
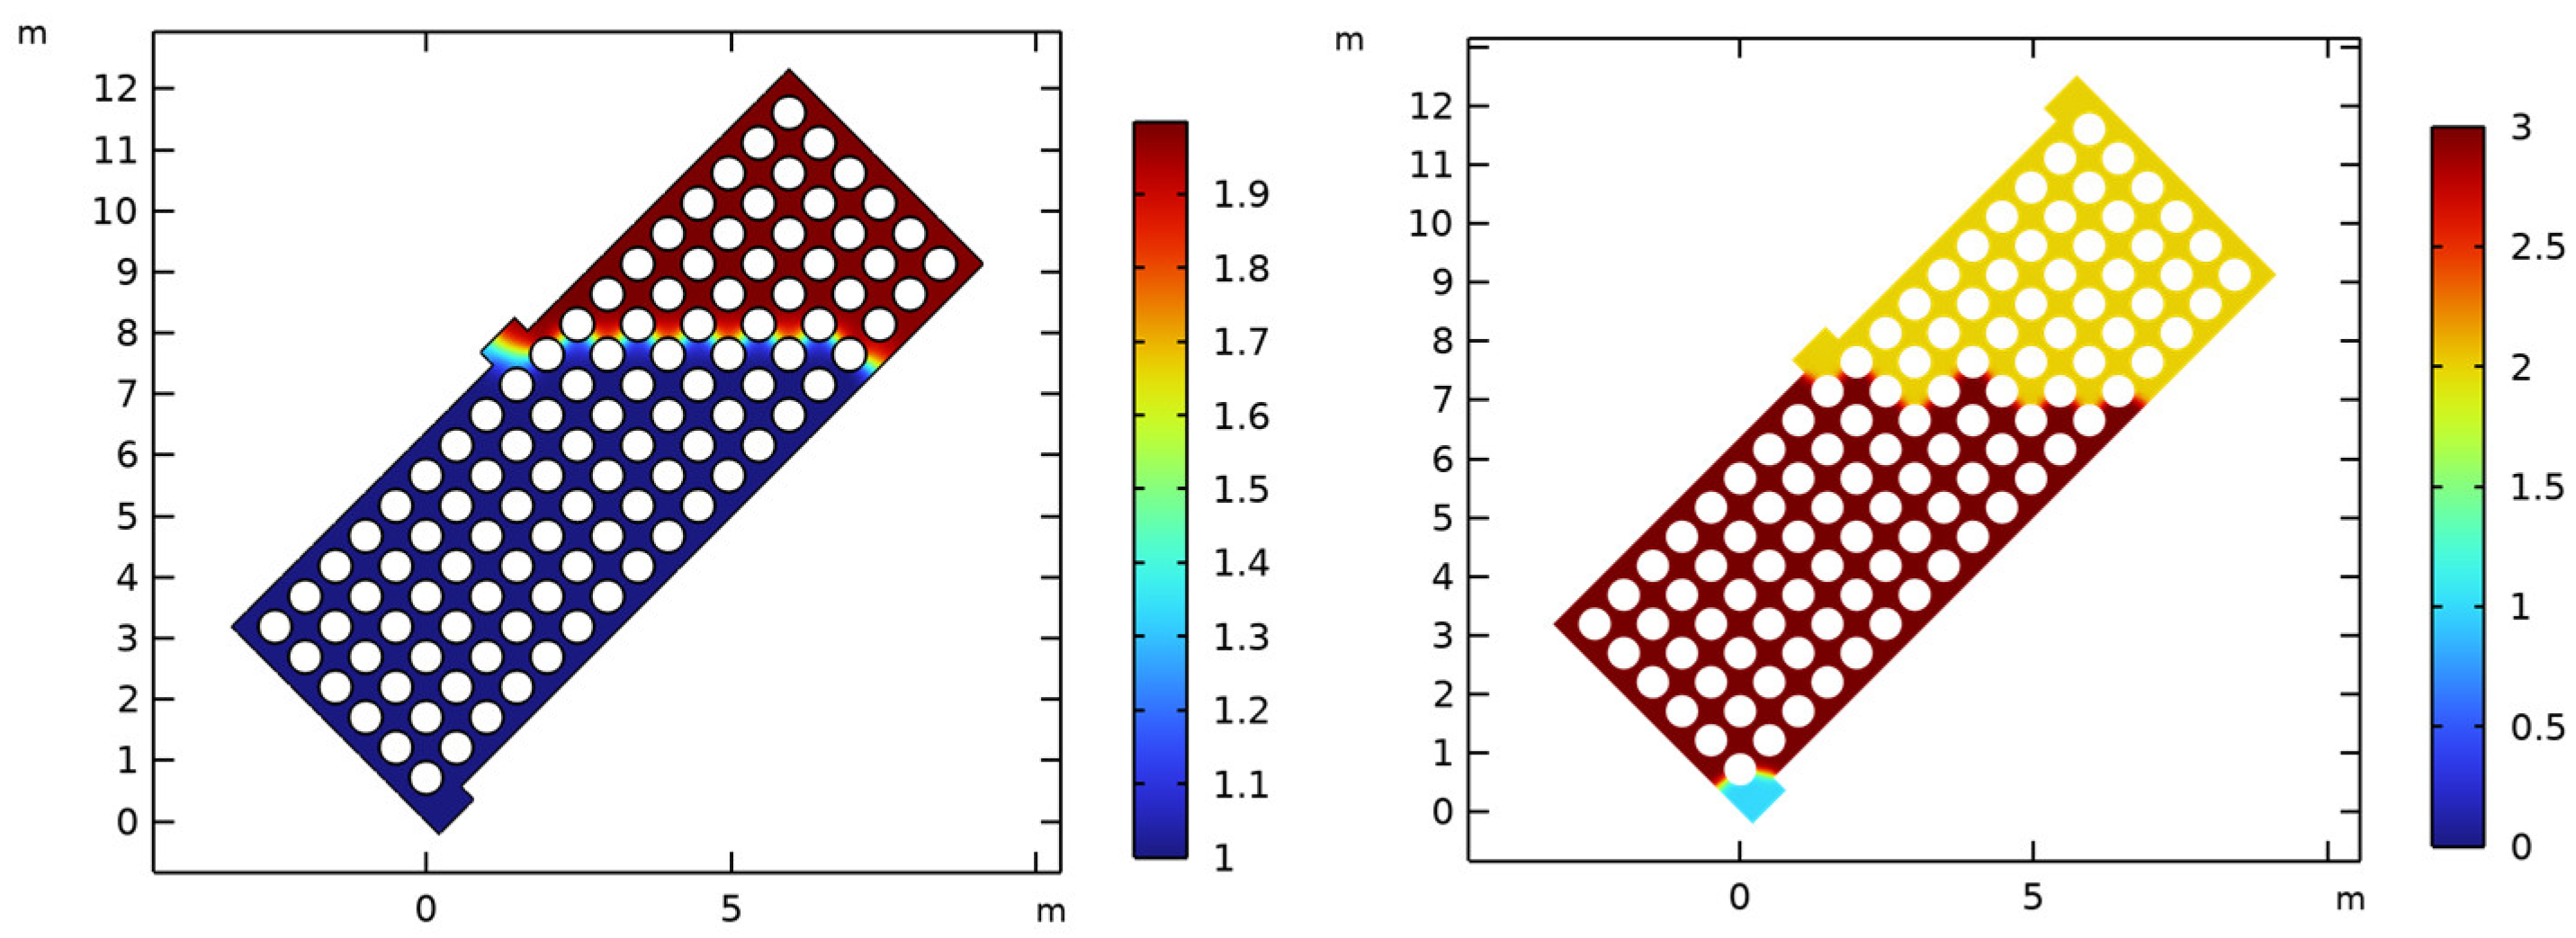
Based on the established finite element model, the stability measures of gas injection for enhancing oil recovery on oil/gas/water three-phase fluid interfaces were studied. By setting a non-injection control group and comparing simulation results (Figure 4 and Figure 5), where: yellow represents the gas phase, red represents the oil phase, and blue represents the water phase.
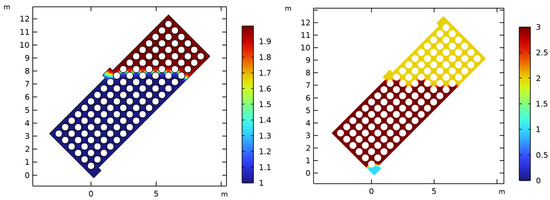
Figure 4.
Comparison of non-insufflation (left) and gas insufflation (right).

Figure 5.
Oil–water interface under 50 cP oil viscosity and 0.25 MPa gas injection pressure.
3. Results and Discussion
3.1. Oil–Water Interface Characteristics of Fractured-Vuggy Reservoirs
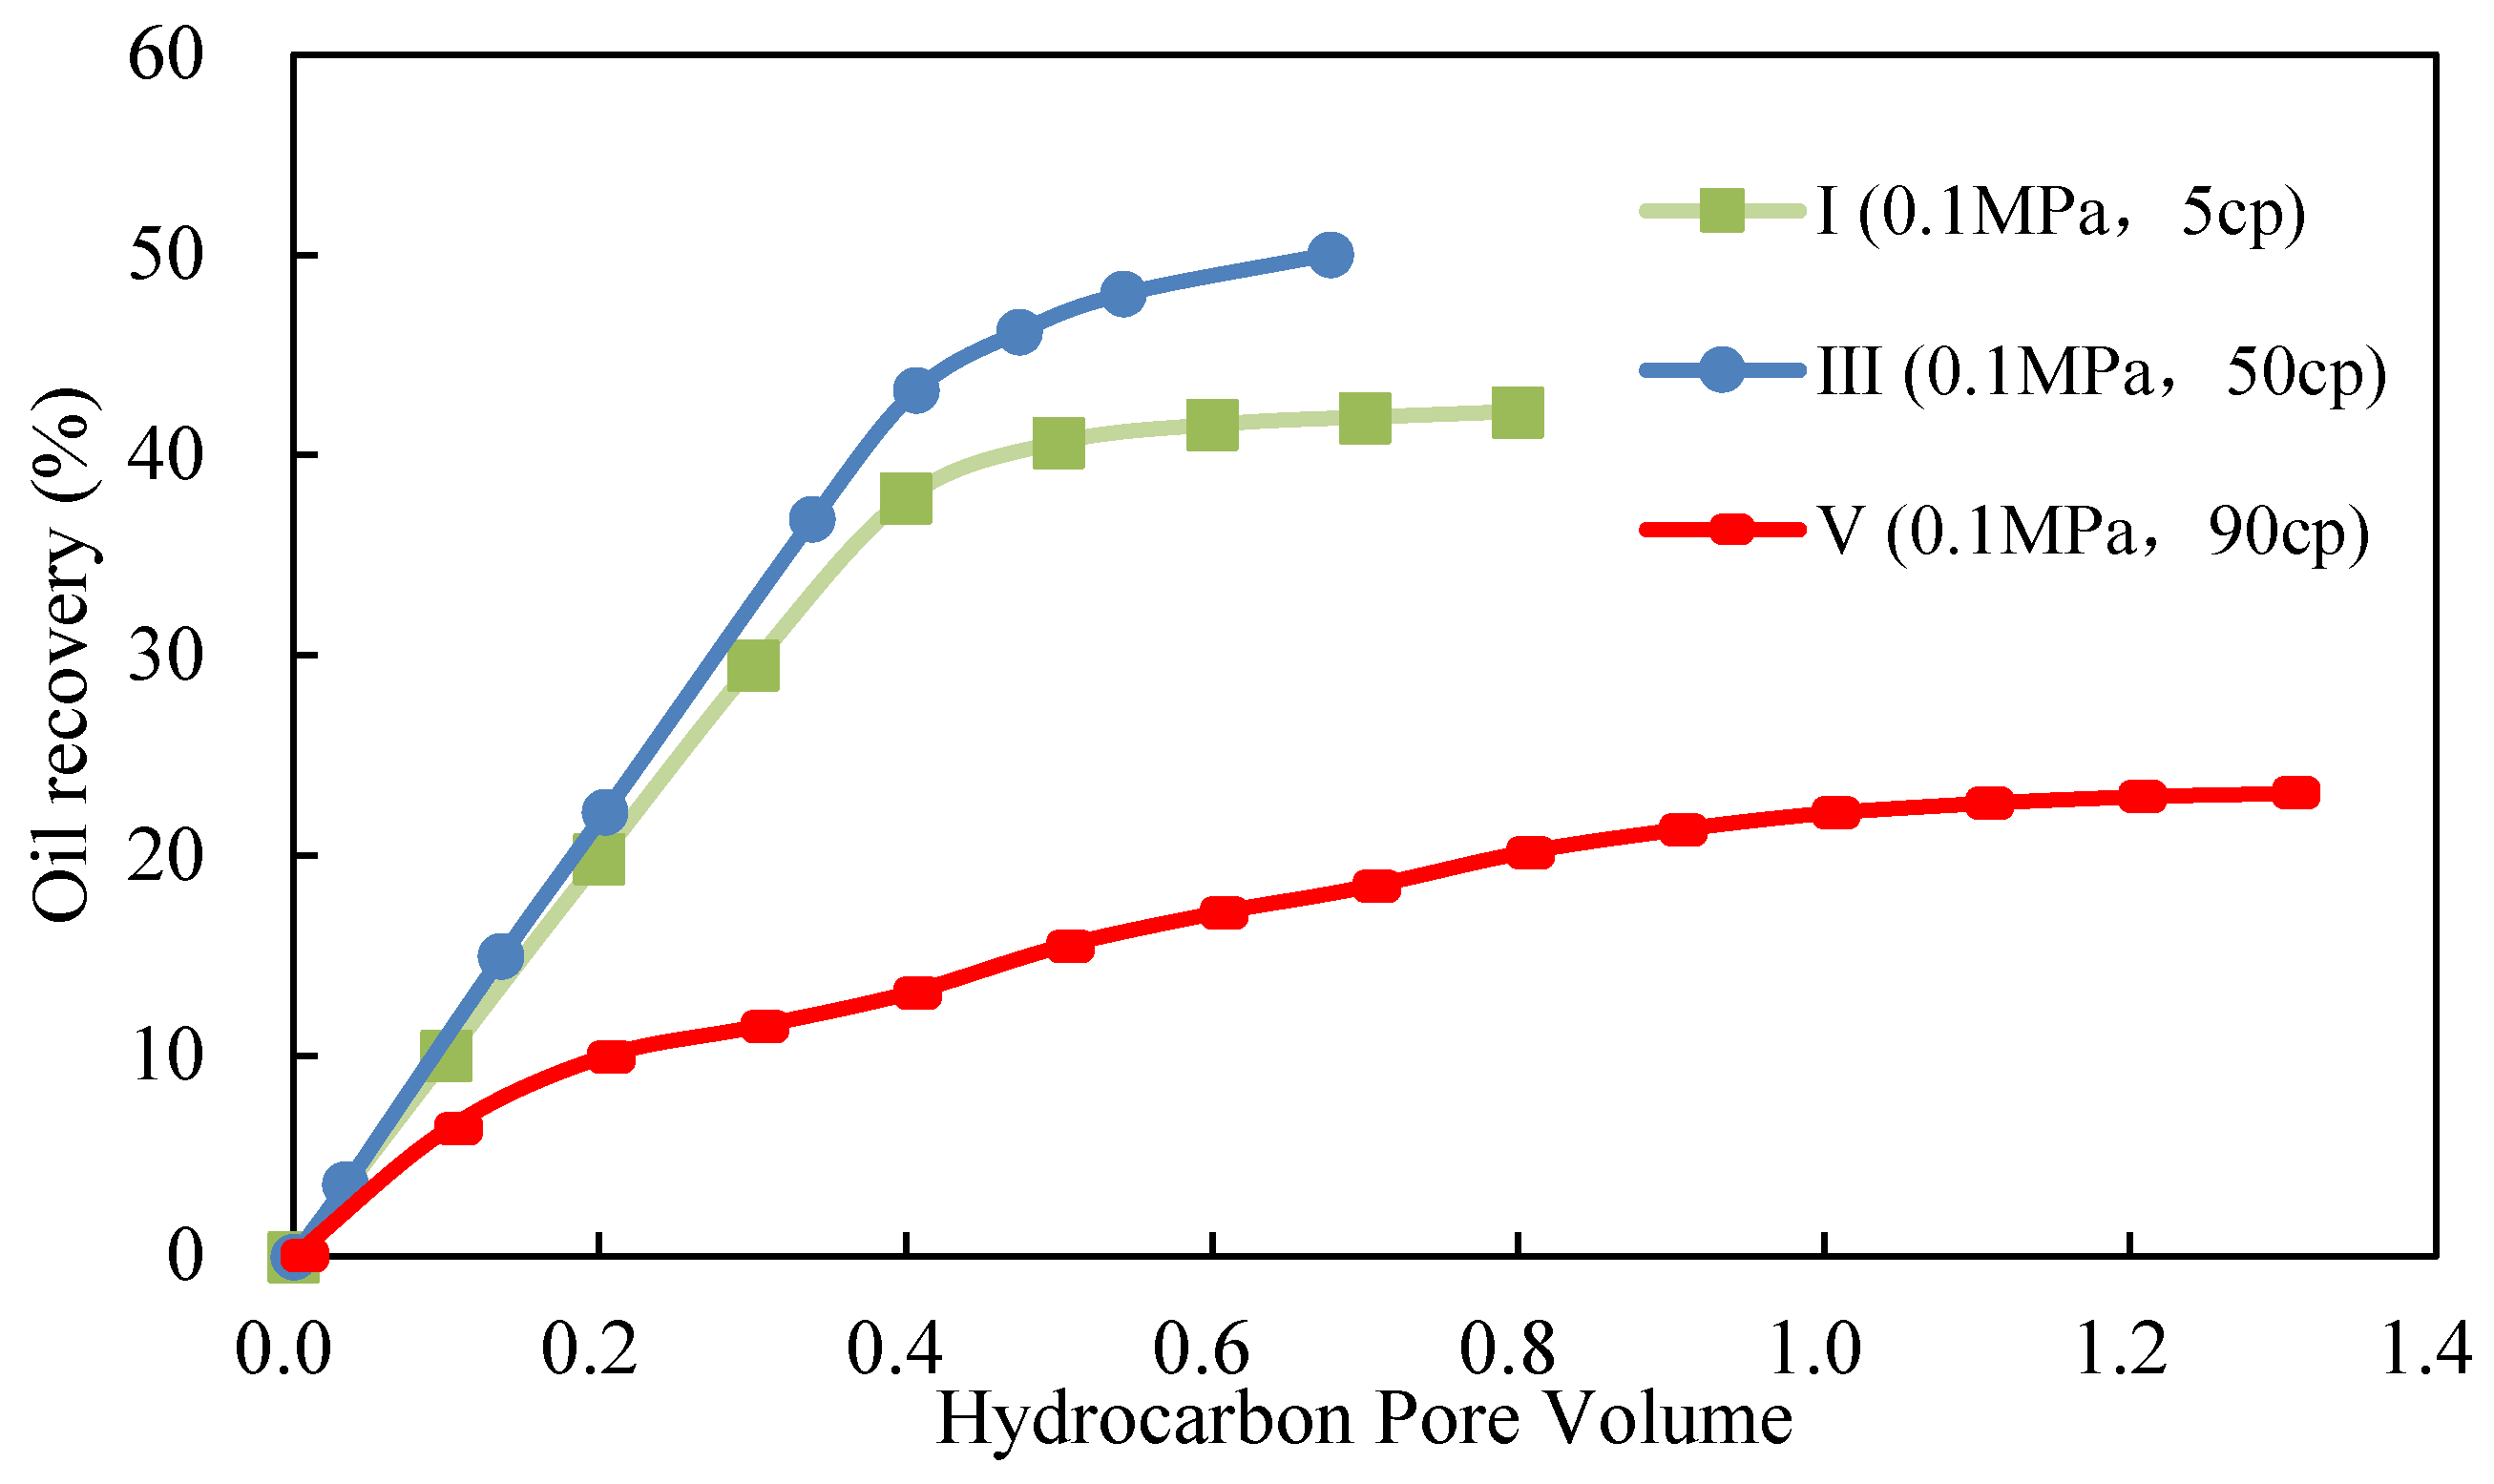
In the early stage of displacement, when the bottom layer water enters the fracture hole, there is no obvious jet and vortex phenomenon, and the change of the oil–water interface is more intuitive. Due to the gravity differentiation of oil and water, the oil–water interface in the seam hole rises steadily, basically on the same horizontal line, and the oil–water interface does not change much (see Figure 5). Under the effect of gravity differentiation, the water in the seam hole collects on the surface of the filling area. Since the flow resistance of the filling is greater than that of the unfilled area, the water mainly flows along the boundary between the two areas in the fracture cavity. At the same time, as the water slowly submerges the filling area, the crude oil filled in the filling medium is also passively used, and the recovery factor of the 3 scheme is increasing (see Figure 6). The water content of scheme V reaches 98.33%, and the recovery rate is stable at about 23.10%. When the water content of scheme III reaches 91.83%, the recovery rate tends to be flat and the recovery degree is 37.33%. When the water content of scheme I reaches 97.71%, the recovery rate tends to be flat and stable at about 50.03%. Obviously, the recovery rate of scheme I is higher than that of the III and scheme V. Due to the large water injection pressure V the scheme is I with the scheme, the more serious the viscous finger phenomenon is, the water breaks through in advance, resulting in a lower recovery rate than the scheme I. These findings underscore the critical role of controlled injection pressure in mitigating interfacial instability and enhancing sweep efficiency within heterogeneous fracture-vuggy reservoirs.

Figure 6.
Comparison of oil recovery under various viscosity conditions.
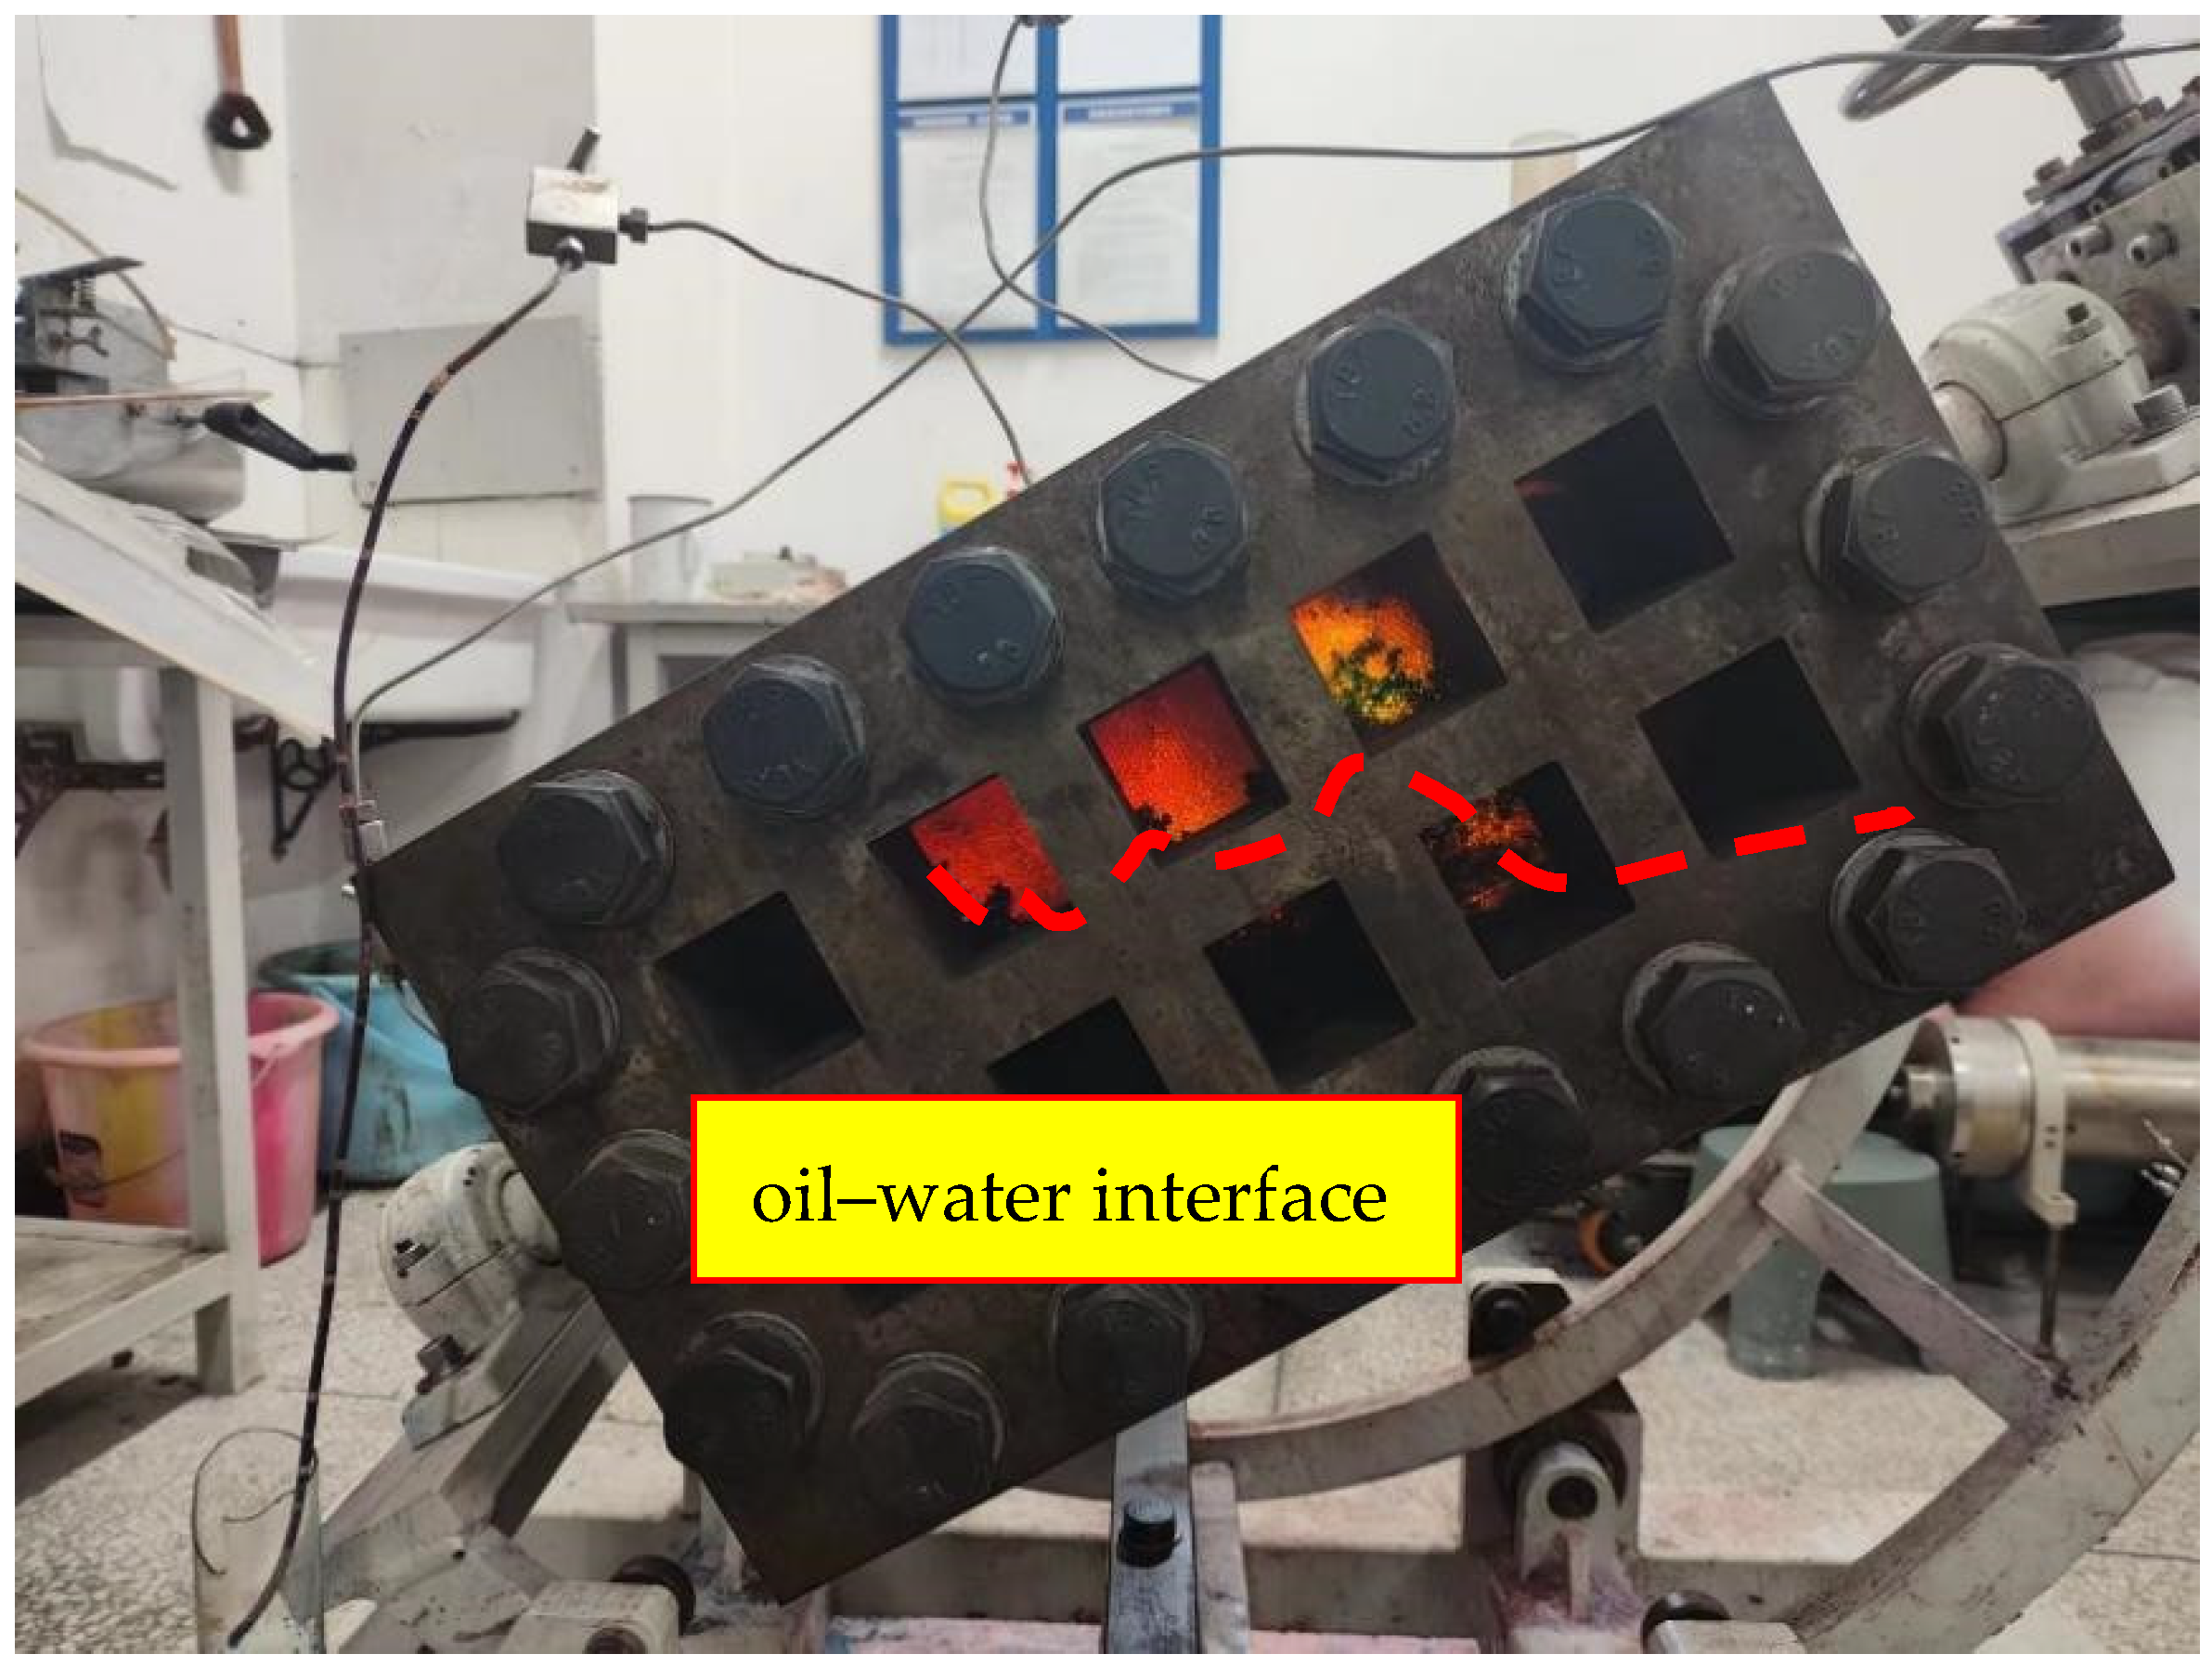
In the experiment, scheme V has the same displacement pressure as scheme III, the crude oil adopts higher viscosity, and the water starts to break through at 0.15 Pore Volume, which is earlier than scheme V. After the water breaks through, the oil–water interface of high-viscosity crude oil fluctuates obviously and is no longer located in the same plane. The oil–water interface tends to be unstable and forms uneven oil cones. At this time, the production degree no longer increases and stabilizes at a certain level, as shown in Figure 7 and Figure 8. This is because the greater the oil viscosity, the more obvious the gravity differentiation, the earlier the water breakthrough time, the lower the degree of recovery, and the worse the interfacial stability can be found when the oil viscosity is increased through the profile change.
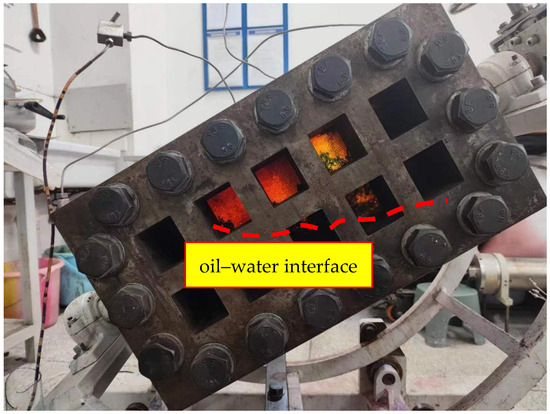
Figure 7.
Scheme III oil–water interface 50 cP oil viscosity and 150 psi water injection pressure.

Figure 8.
Scheme V oil–water under 90 cP oil viscosity and 150 psi water injection pressure.
Fracture-vuggy reservoirs have complicated reservoir space and oil–water distribution relationships. Fluid flow in the reservoir follows pipe-flow dynamics, with capillary forces exerting negligible influence. This distinctive characteristic determines that the waterflood development mode of the carbonate fracture-cavern reservoir in Tahe Oilfield is obviously different from that of conventional sandstone and fractured carbonate reservoirs, and its waterflood development mechanism is fundamentally different from that of conventional waterflood. Whether it is a single-well fracture-cavern unit waterflood or multi-well fracture-cavern unit waterflood, its development mechanism is mainly to supplement energy and gravity segregation. Variations in viscosity modulate gravity-driven segregation, triggering oil–water interface instability that reduces recovery efficiency and impedes reservoir development.
3.2. Gas Injection from the Top After Water Flooding
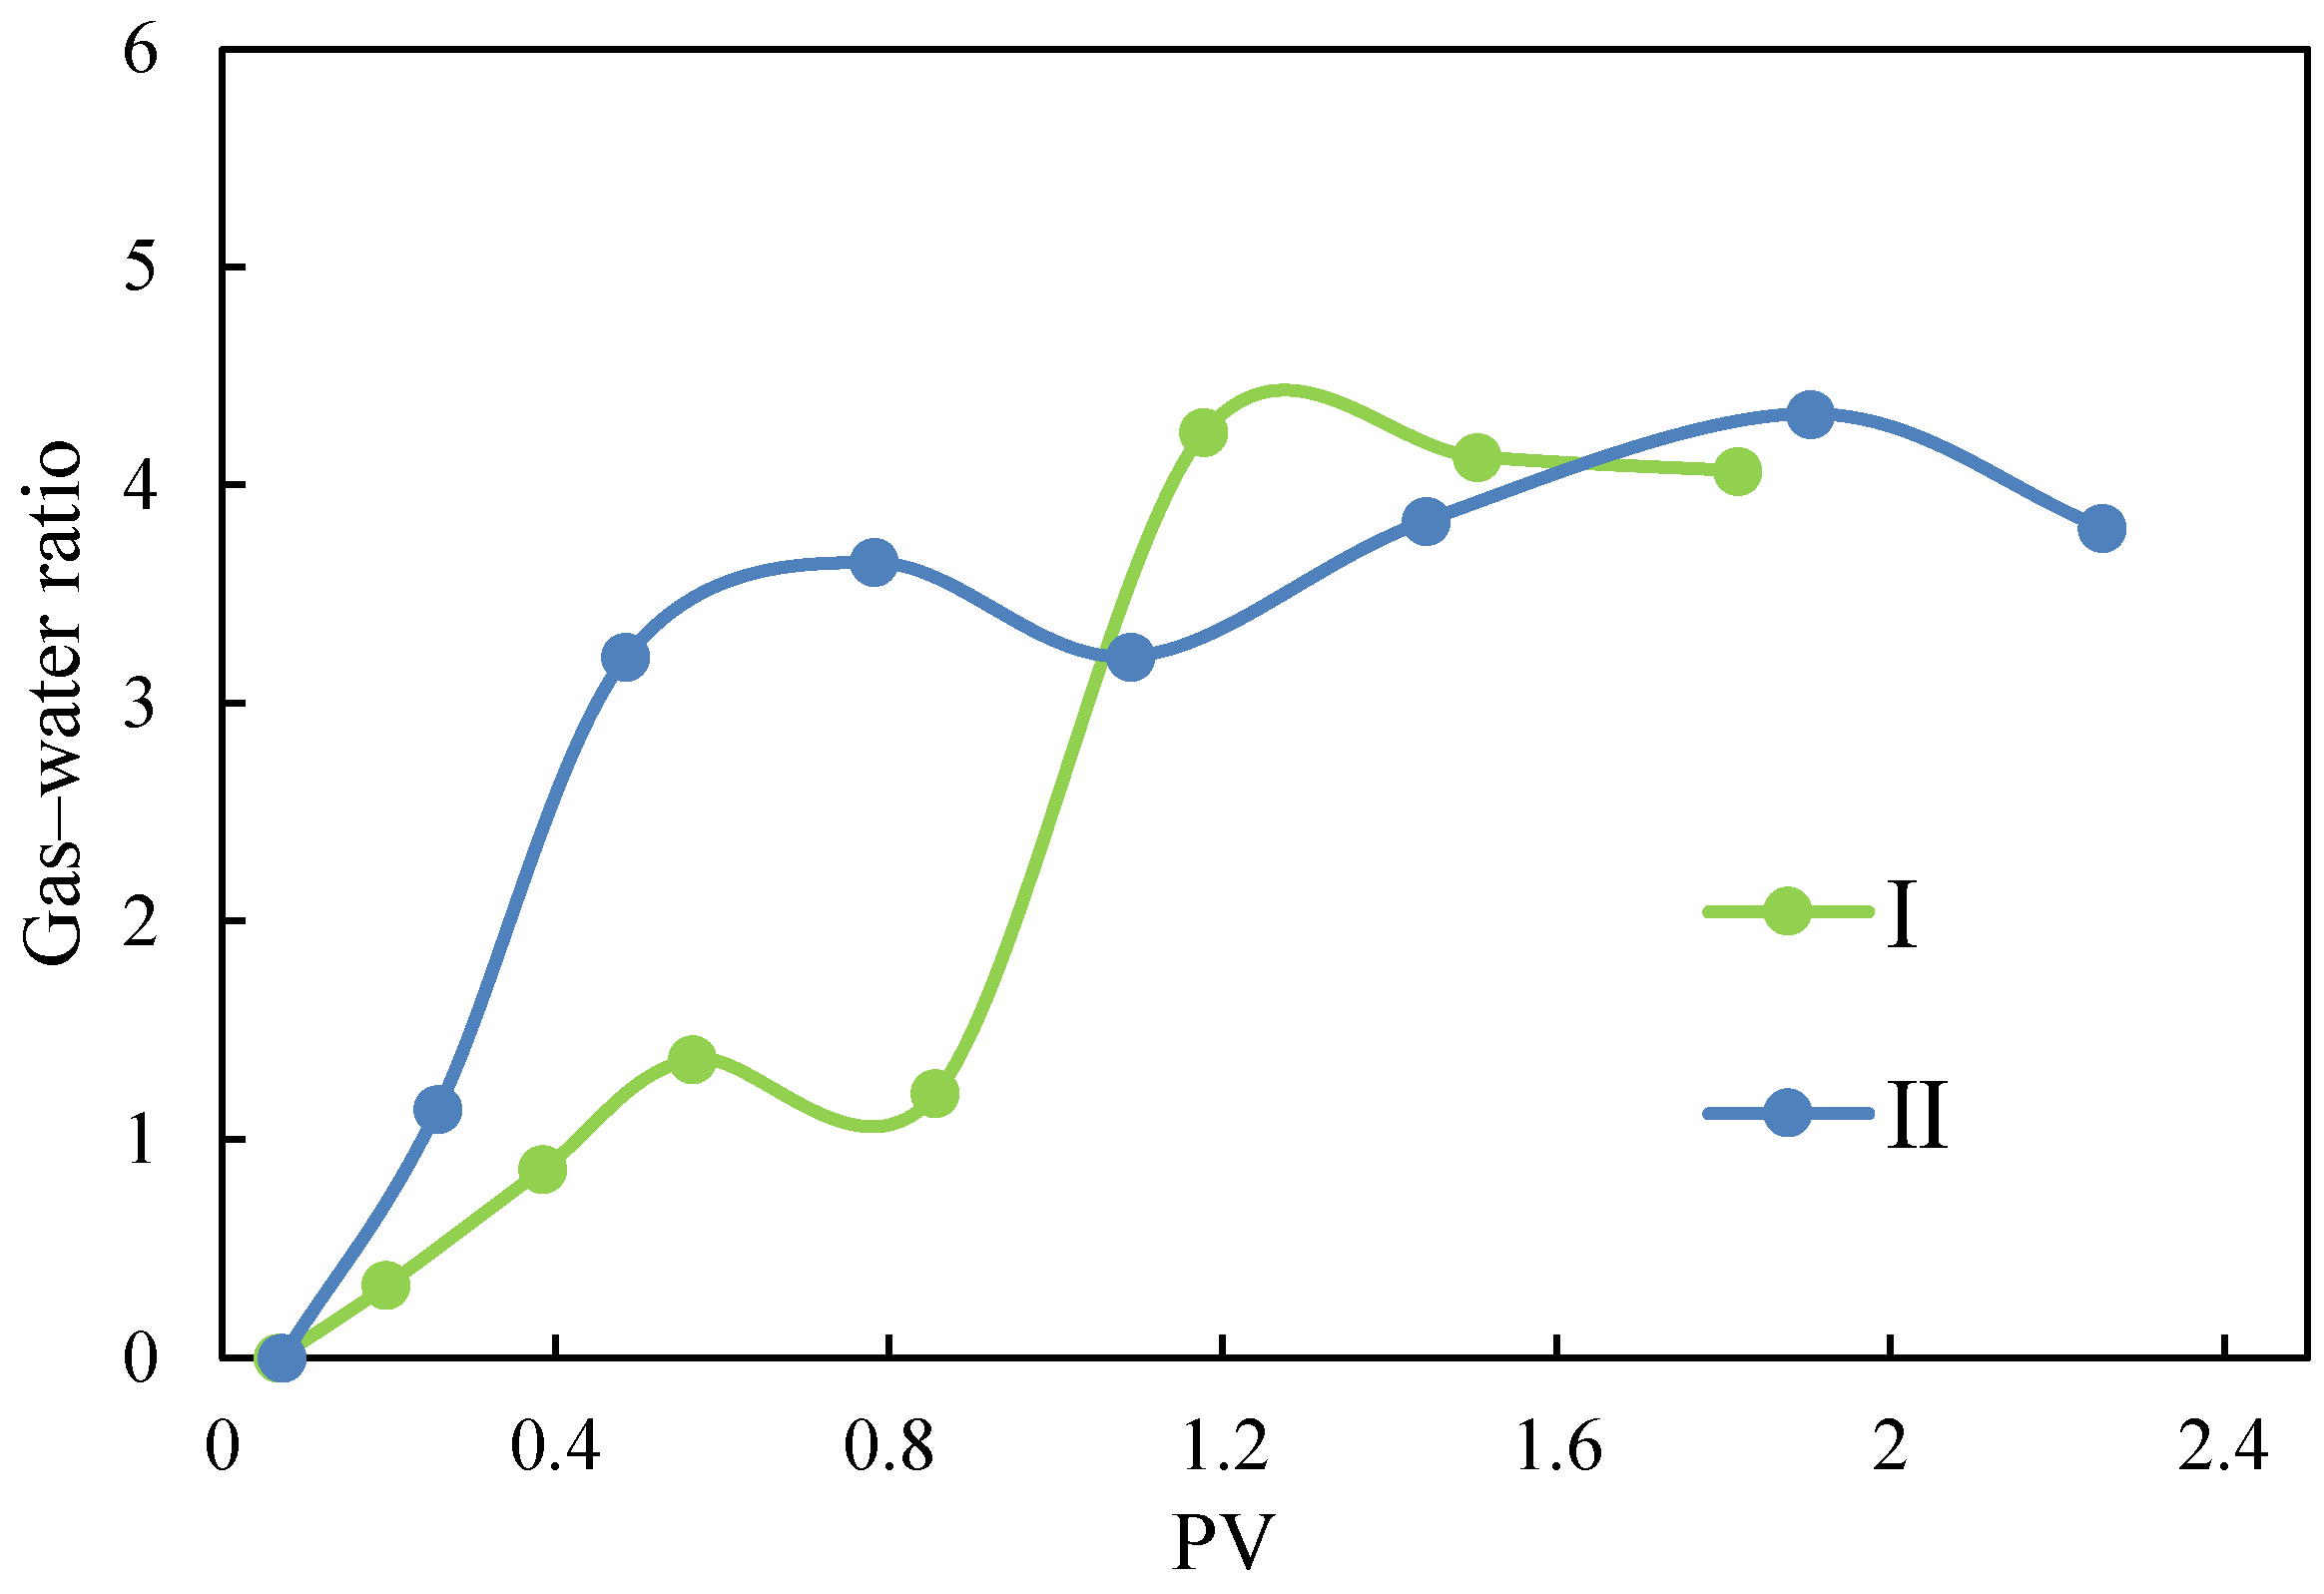
Top gas injection experiments were conducted after water flooding. In the gas injection stage, the water cut curve exhibited significant fluctuations. With nitrogen injection in Scheme I and Scheme II, the water cut first exhibits a downward trend and then an upward trend (Figure 9), a phenomenon attributed to water–oil–gas gravity separation. During simultaneous water and nitrogen injection, crude oil recovery was continuously improved. In Scheme I, the water cut was reduced to 58.13%, with recovery increasing significantly to 50.22%. This resulted from gravity segregation between oil, N2, and water, which rapidly separated after co-injection, driving oil along distinct flow channels toward the production well bottom. Nitrogen breakthrough occurred at 0.2 PV in Scheme I, compared to 0.15 PV in Scheme II. Scheme II exhibited the fastest water-gas ratio (gas-to-water volumetric ratio under standard conditions) escalation. When nitrogen and water co-injected into the core, a gas–water mixing zone formed, enhancing oil displacement efficiency. As the mixing zone advanced, gravity segregation caused gas to occupy upper channels (forming a gas cap) while water dominated lower channels. In Scheme II, high gas–water ratios accelerated gas channeling, triggering premature three-phase co-production and reduced recovery. The larger oil–gas density contrast intensified gravity segregation compared to oil–water systems. The top “attic oil” accumulates into a new leading-edge rich oil zone, which gradually forms a secondary gas cap with the increase of injected gas. The gas cap pushes the oil–gas interface down in the process of continuous expansion, and then pushes the oil–water interface down, and the crude oil enters the production well and is extracted.

Figure 9.
The gas–water ratio in subsequent gas displacement.
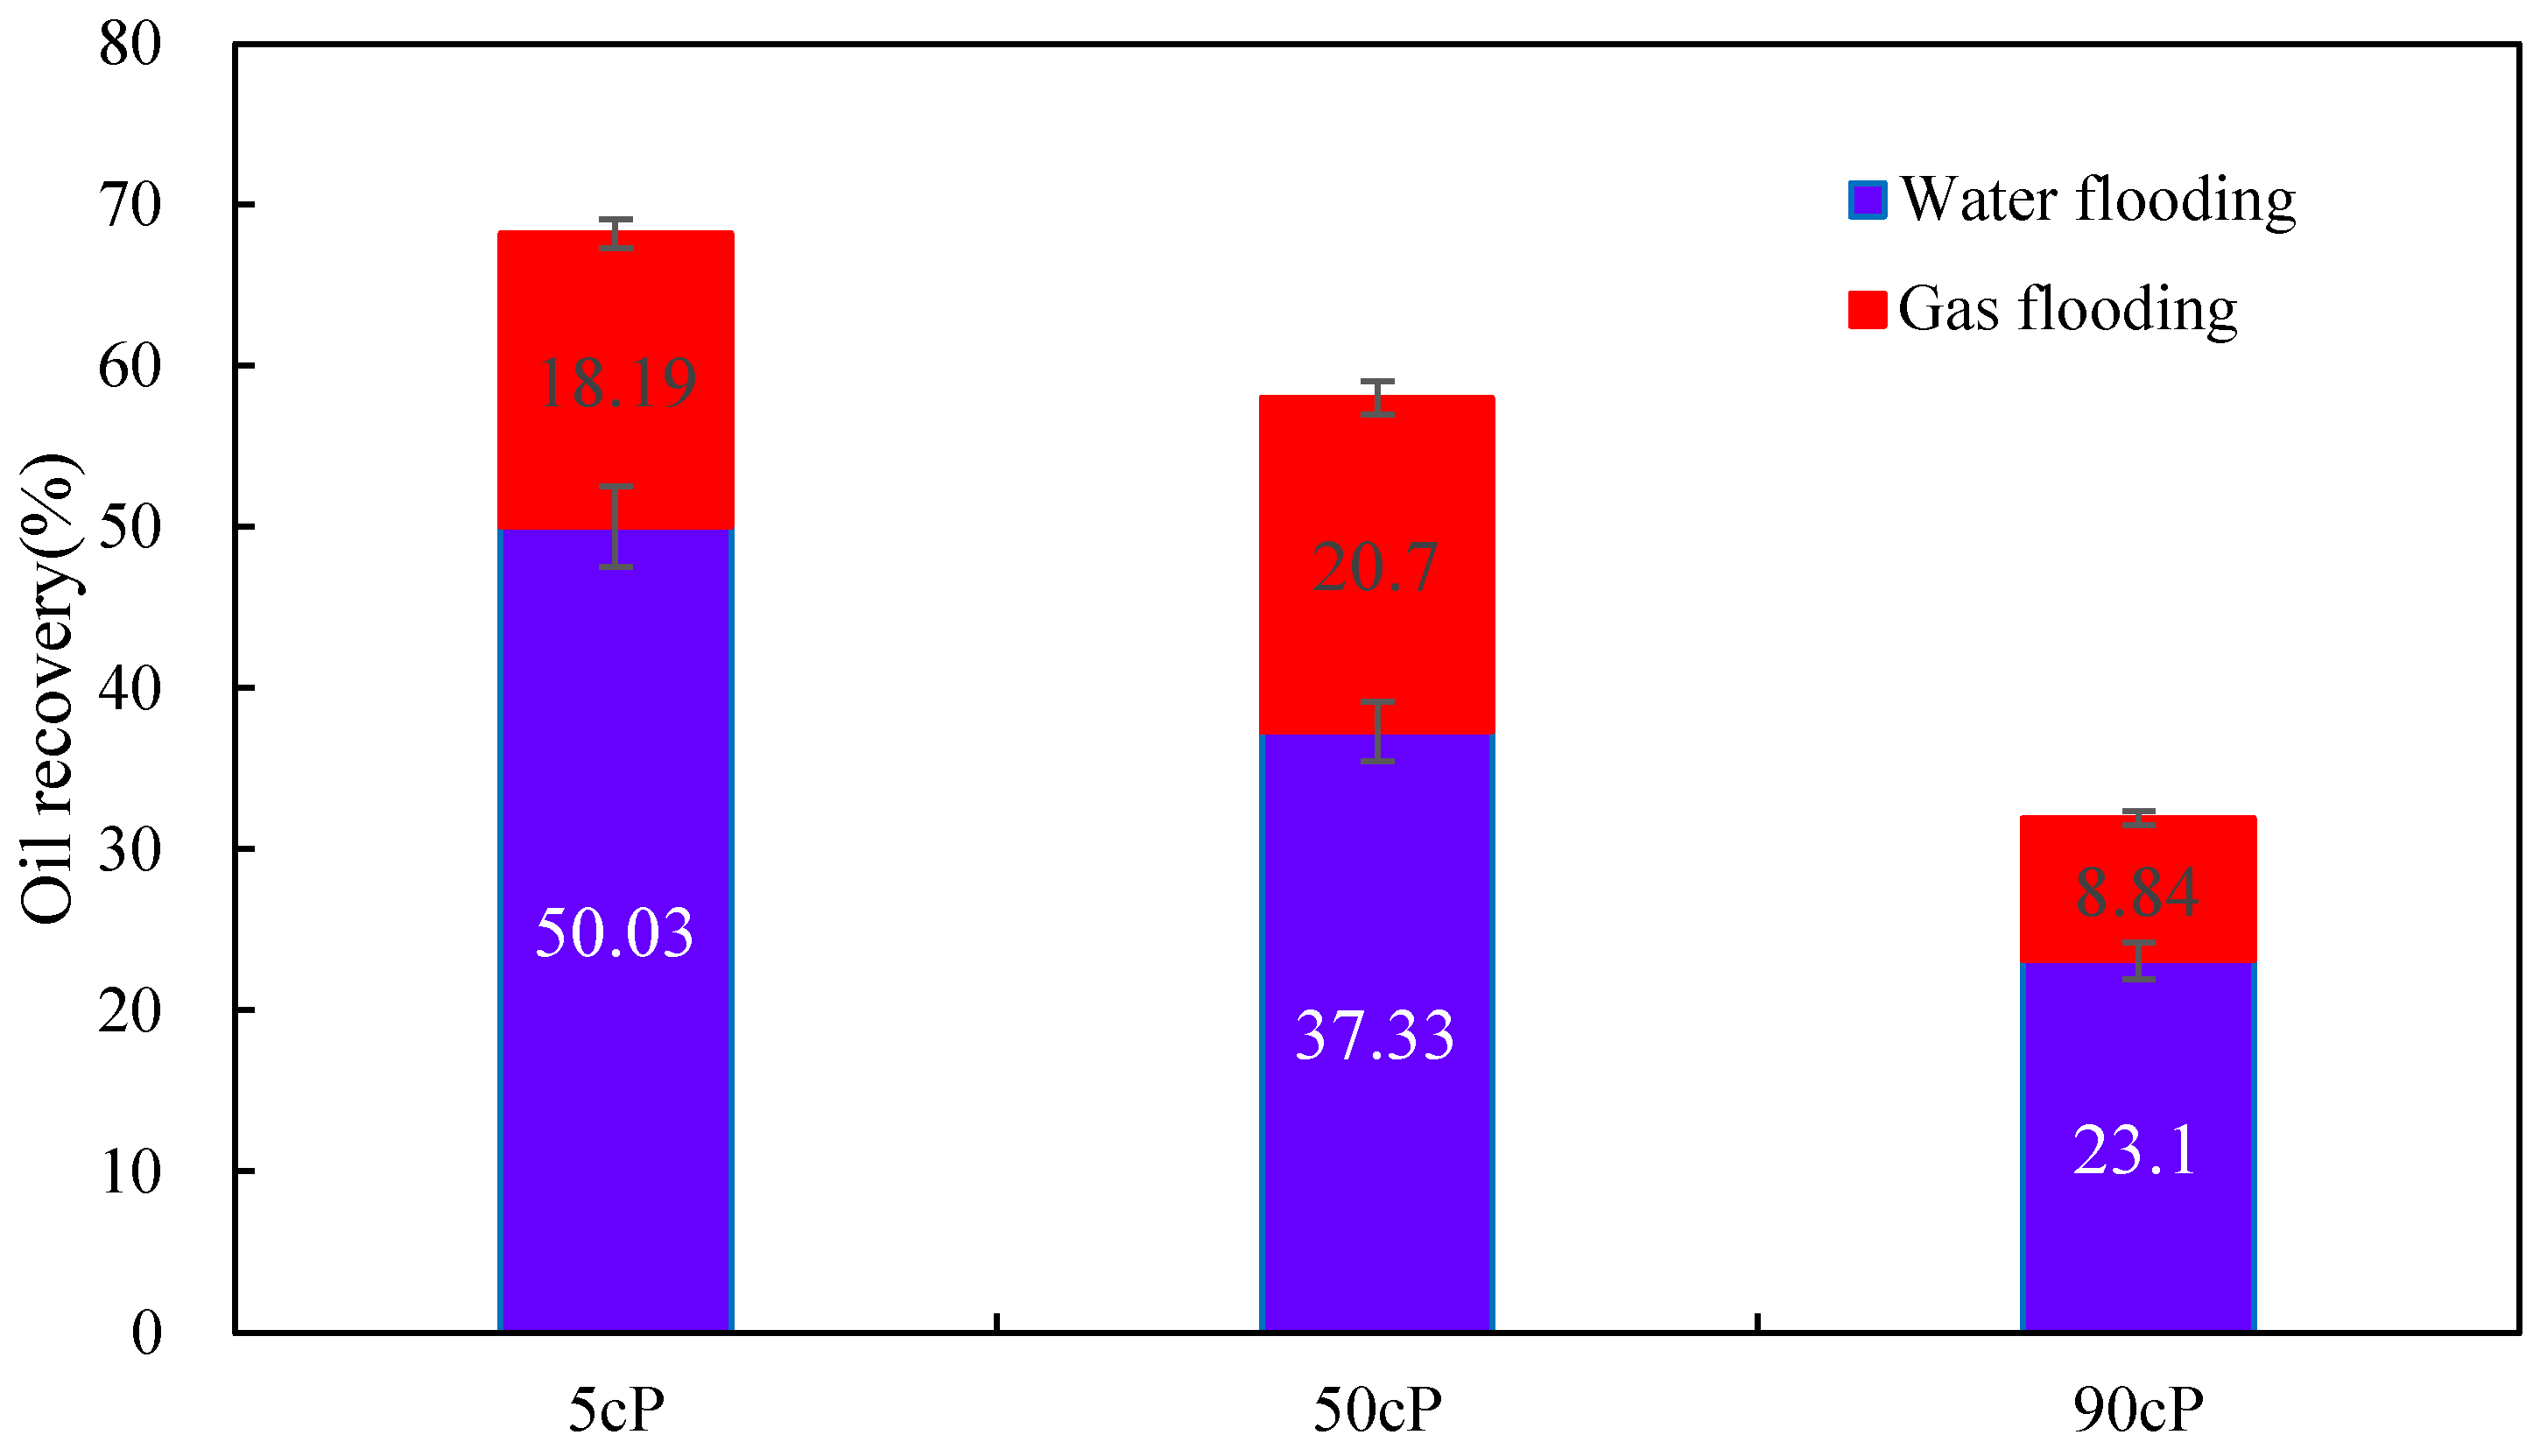
In the process of gas drive, the recovery rate increased by 18.19% for 5 cP viscosity crude oil, 20.7% for 50 cP, and 8.84% for 90 cP, as shown in Figure 10. This is because, under low viscosity, the viscosity difference between gas and crude oil is small, which can reduce the phenomenon of finger-in. At this time, the oil and gas interface presents stable characteristics, and the gas continuously drives the crude oil to the production well. In addition, under low viscosity, the gas has good fluidity and high ripple efficiency and can effectively enter the micro-fractures in the fractured-vuggy reservoir and continuously drive the crude oil out.

Figure 10.
Oil recovery for experiments with different oil viscosities.
The comparative analysis of multiple schemes in Figure 11 demonstrates that excessively high gas injection rates reduce crude oil recovery. This is because at low speed, the oil–gas interface under 5 cP viscosity is stable, and the relative flow of crude oil is reduced under the drive of gas so that the flow ratio is optimized, which helps to stabilize the displacement front and reduces the flow ratio. The viscous finger phenomenon is caused by the imbalance of the ratio. When the gas injection rate is increased, the stability of the oil–gas interface will be destroyed, and the viscous finger-in phenomenon will be more obvious, thus, the recovery rate will decrease. In the process of fractured-vuggy reservoir exploitation, in order to maintain a stable oil and gas interface, the oil recovery rate is improved by reducing the gas injection rate.
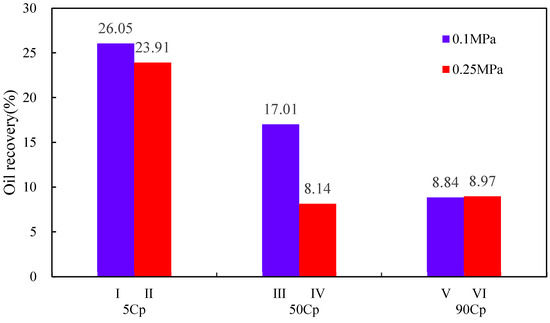
Figure 11.
Oil recovery for gas injection with different gas injection speeds.
3.3. Stability Characterization of the Gas Injection Interface
The experiment carried out 6 groups of two-dimensional plane model top gas injection tests after water flooding. The experimental scheme and results are shown in Table 3 and Figure 12. Compared with the experimental results of experiment scheme I and experiment scheme III, the viscosity of crude oil greatly influences the degree of recovery. Under the condition of strong edge water, top gas injection can effectively inhibit the edge water energy and achieve the effect of bidirectional flooding. Meanwhile, increasing the viscosity of crude oil will make the stability of the fluid interface worse. Compared with the experimental results of experiment scheme I and experiment scheme II, the effect of gas drive speed on the recovery degree and fluid interface stability is relatively small.
Table 3.
Results of different experimental schemes.
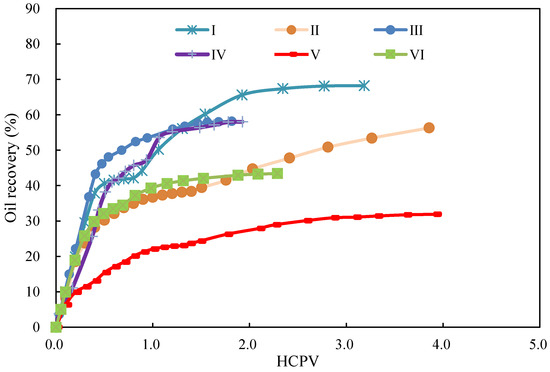
Figure 12.
Oil recovery for gas injection with different gas injection speeds.
On the whole, the final recovery degree of the stable interface is basically above 60%, while the final recovery degree of the non-stable interface is below 50%. recovery rates between 50–60% are considered relatively stable interfaces.
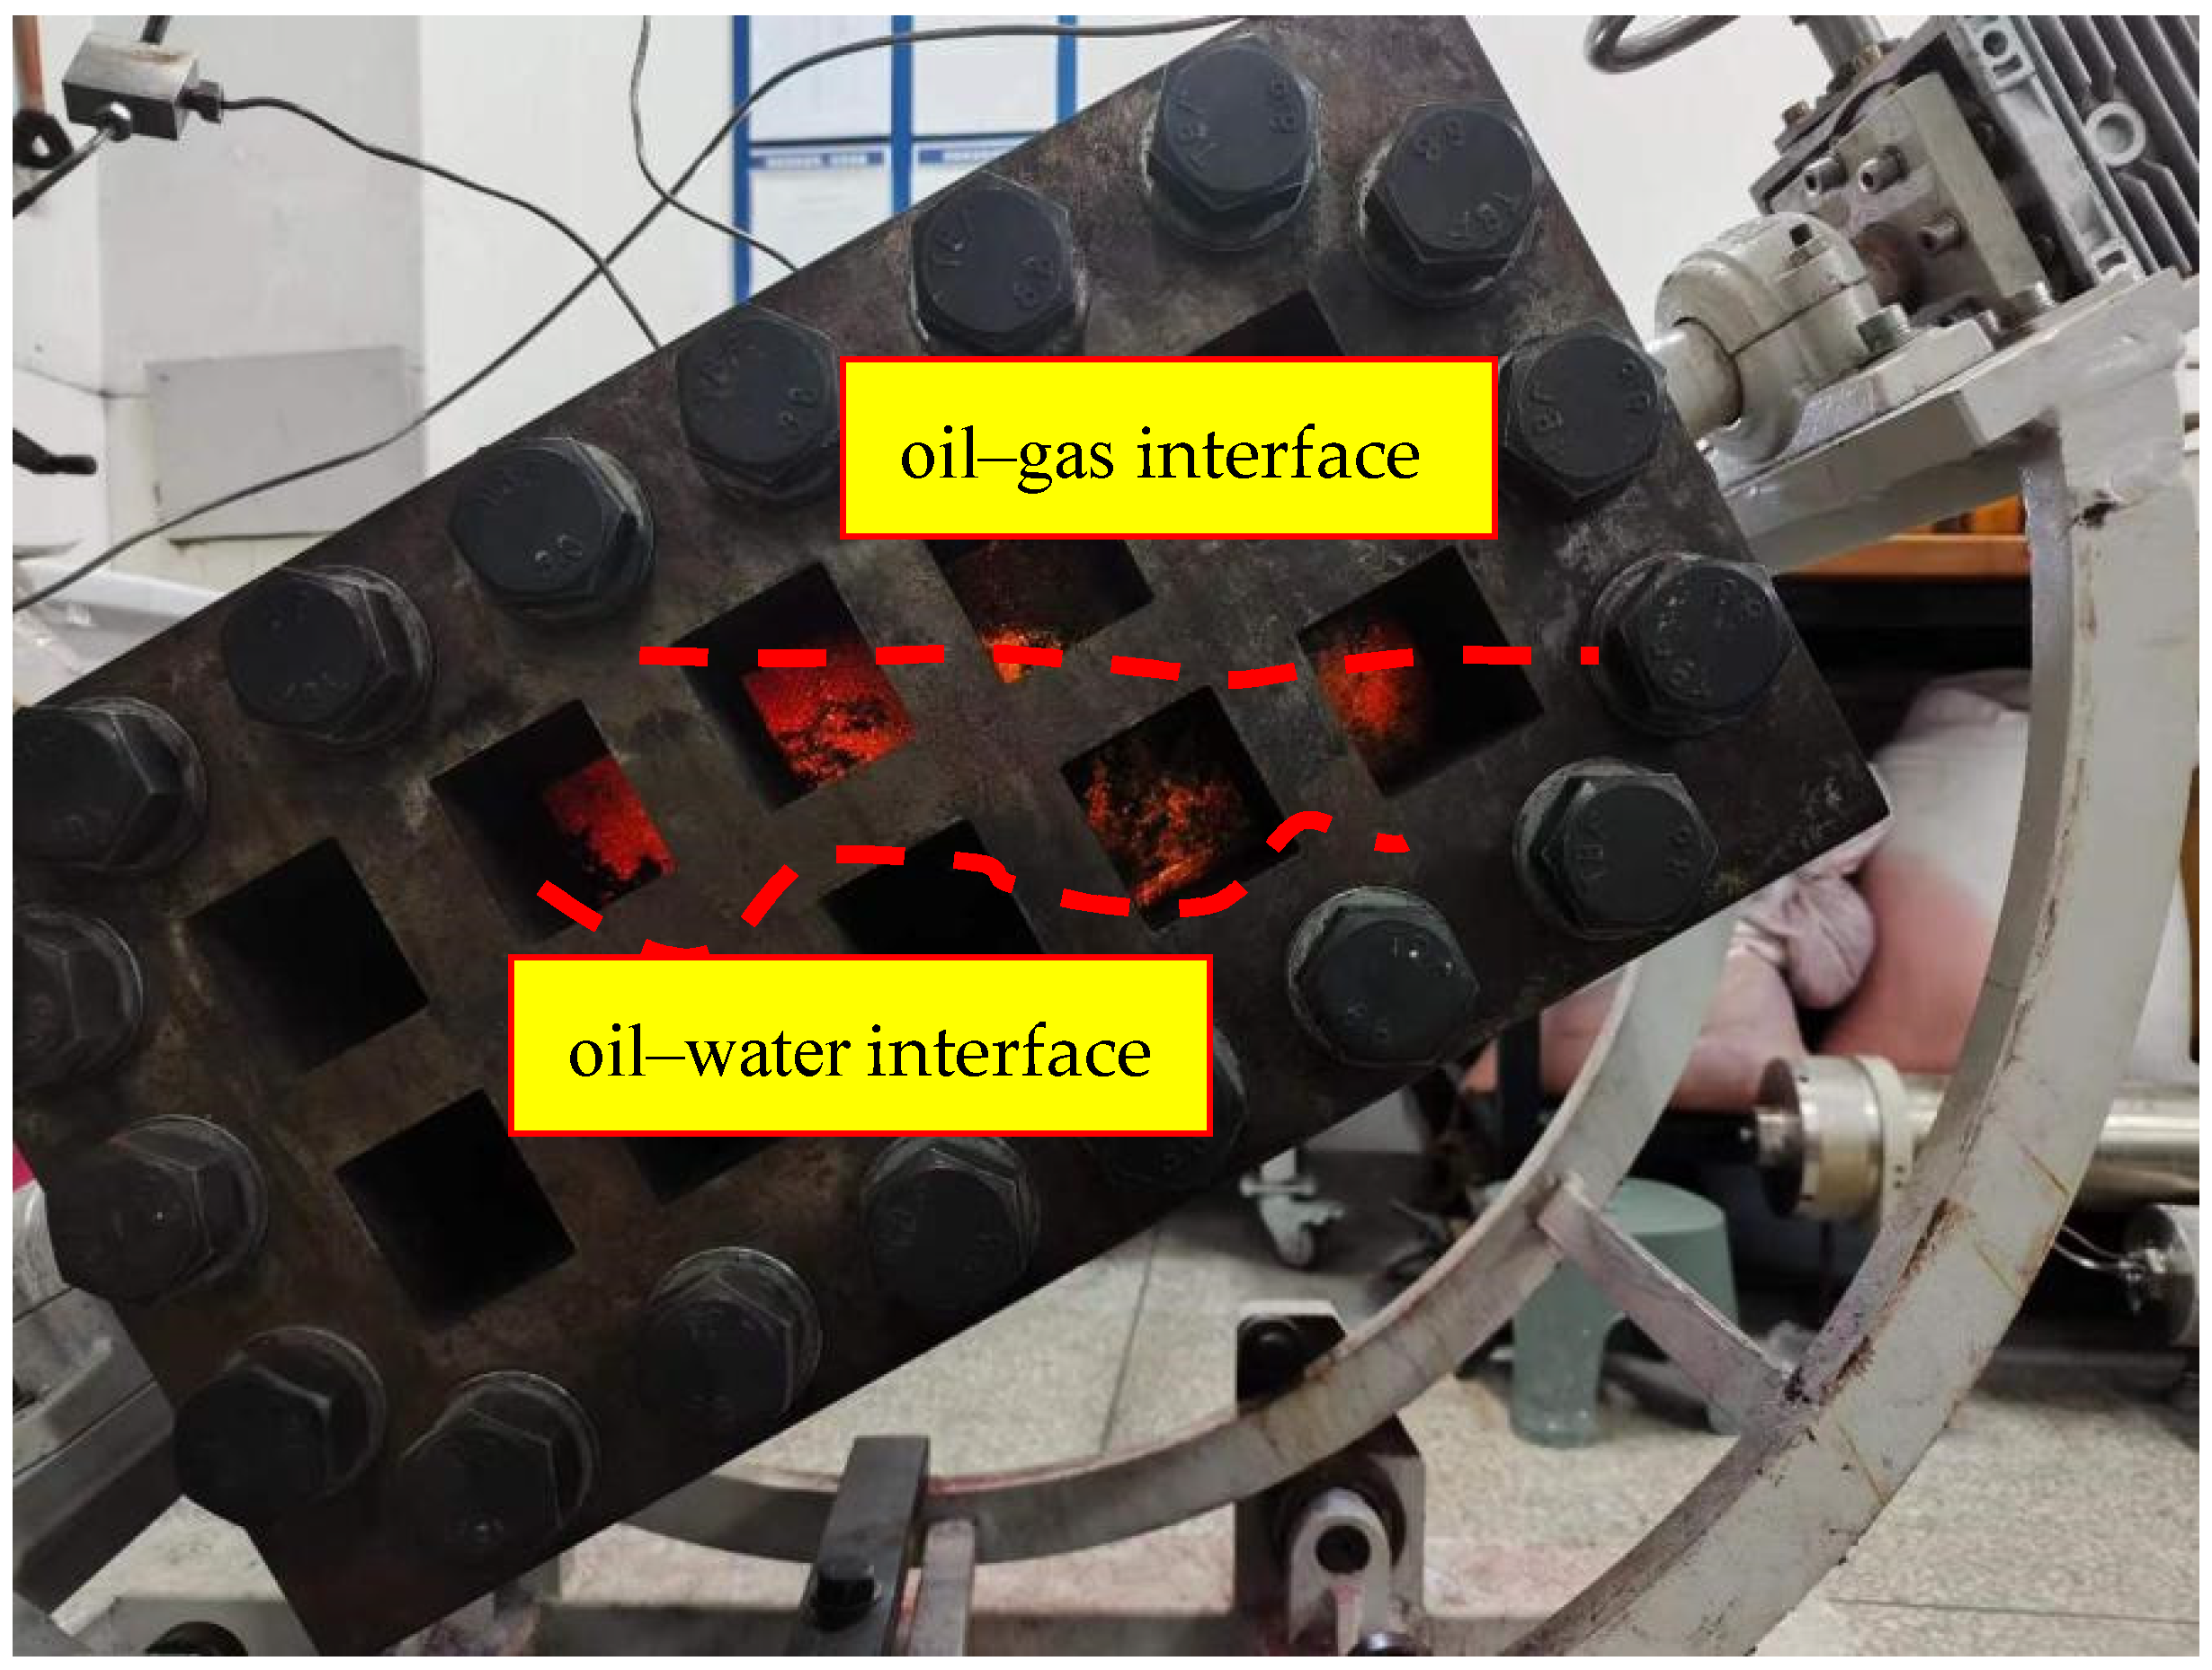
The change of gas injection velocity and the effect of gravity differentiation will cause the difference in the vertical flow rate of the fluid, resulting in the deformation of the oil–water interface and the oil–gas interface. With the continuous extraction of oil in the fracture-hole reservoir model, the oil–water and oil–gas interface will gradually change from the original horizontal plane to uneven, resulting in an unstable interface phenomenon. During the displacement process of the fracture-hole reservoir model, the fluctuation of the oil–water interface and the oil–gas interface is clearly observed, resulting in unstable water and gas convex phenomena, Figure 13, Figure 14 and Figure 15 reveal that unstable water and gas cones are formed after the oil–water interface and oil–gas interface arrive at the wellhead of the production well. The study shows that the height of the gas cone is smaller than the height of the water cone, and a stable cone will be formed only when the production well output is less than the critical production. This is due to the finger-in phenomenon caused by the difference in oil–water density, the difference in oil–gas density, and the gas injection speed, resulting in an unstable interface and reduced oil recovery.
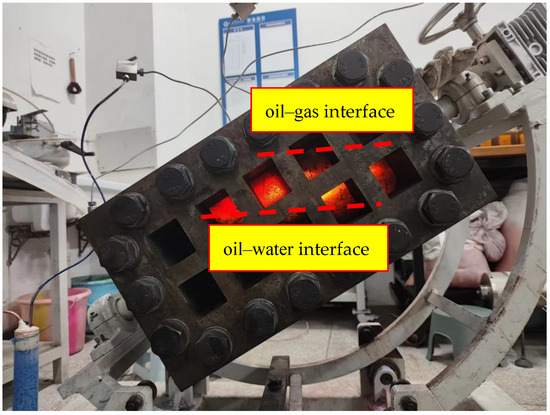
Figure 13.
Scheme I oil–gas oil–water interface under 0.1 MPa gas injection pressure.

Figure 14.
Scheme III oil–gas oil–water interface under 0.1 MPa gas injection pressure.
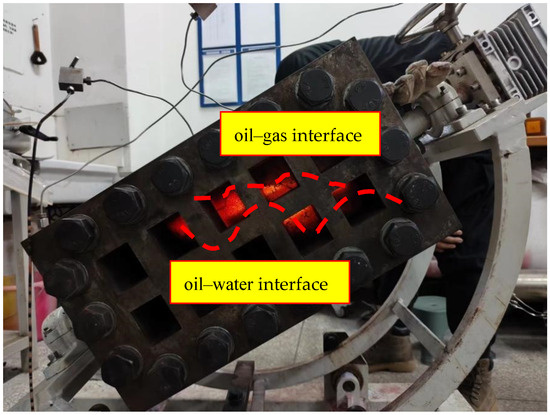
Figure 15.
Scheme IV oil–gas oil–water interface under 0.1 MPa gas injection pressure.
After top gas injection, too high a gas injection speed will cause the instability of the oil–gas interface. Through the analysis of experimental phenomena, when the oil–gas interface is stable, the formed gas cap can be approximated to the top-down displacement of crude oil through the piston displacement, which can effectively improve the recovery of crude oil. Because nitrogen has a stronger flow ability than water, it can overcome capillary force and viscous resistance and can enter a position where water is difficult to enter under pressure. N2 occupies the crack space originally occupied by oil so that low-permeability crack oil flows into karst caves with high permeability, redistributing oil, gas, and water in the reservoir and further increasing the swept volume. Under the formation conditions, nitrogen will be partially dissolved in the crude oil after contact with the crude oil, so that the crude oil volume expansion, overflows from its retention space and flows into the fracture channel to become flowable oil, and the viscosity of the crude oil is reduced to a certain extent, improving the mobility ratio and increasing the flow capacity of the crude oil. The mechanism of action is that the fluid gravity differentiation inhibits the viscous finger movement, realizes the two-way displacement of the gas top and the edge water, and at the same time realizes the improvement of the macro-wave and efficiency.
3.4. Numerical Simulation Analysis of Interface Stability Factors
Due to the limited characteristic parameters studied in the indoor 3D model, more parameters are further expanded by finite element simulation. Based on the finite element simulation, the control mechanism of the interface stability was further analyzed from the aspects of the inclination, filling area, particle diameter, production speed and oil–water viscosity ratio. By setting the control group before and after gas injection, various field map results are output. According to the simulation results, during gas injection and extraction, nitrogen gas cap energy slowly forms, and then relies on gas cap energy to displace the surrounding crude oil, while the oil–gas interface continues to move down. Under the action of gravity differentiation, nitrogen displaces the remainder in more areas through cracks and holes, and can inhibit the bottom water intrusion rate to a certain extent.
3.4.1. Dip Angle
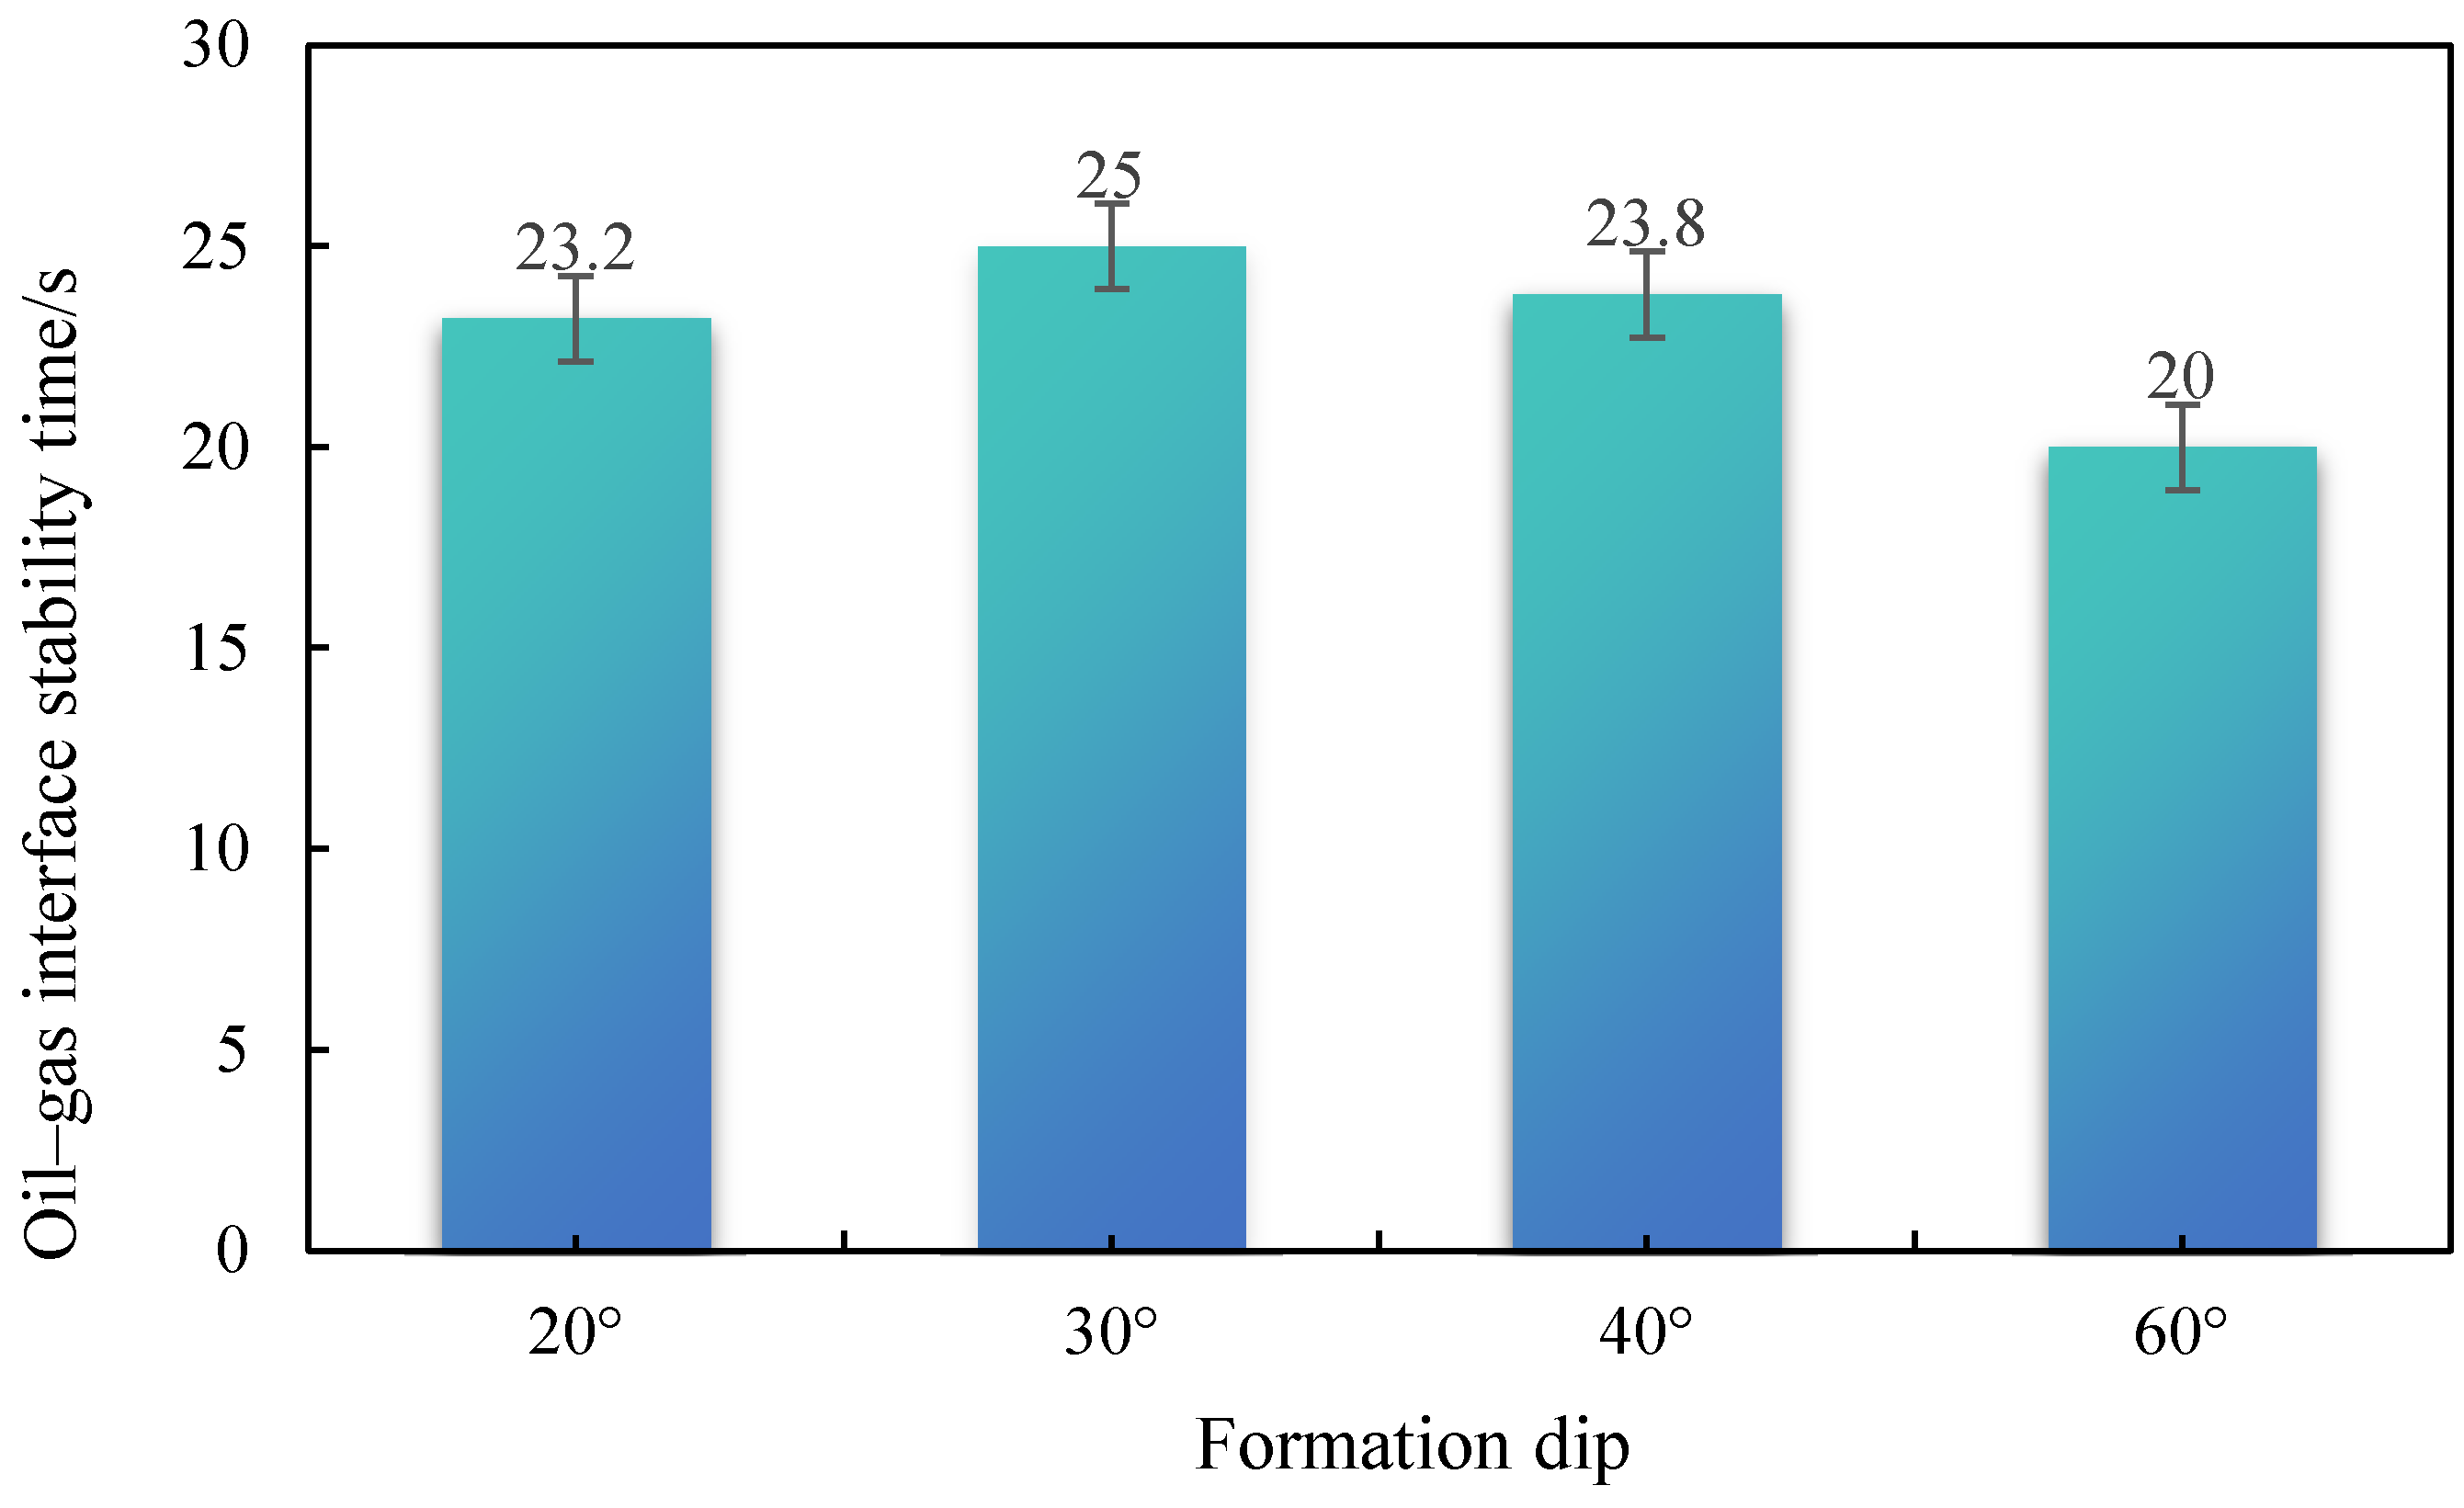
Due to the limited dip angle variations in 3D physical experimental models and the critical role of dip angles in oil–gas–water interface stability, numerical simulations were conducted to further investigate the impact of dip angles on interface stability. Simulations with four dip angles (20°, 30°, 40°, and 60°) reveal that when the formation dip exceeds a critical threshold of 20°, the interface stability duration decreases significantly with increasing dip angles: 23.2 s (20°), 25 s (30°), 23.8 s (40°), and 20 s (60°), as shown in Figure 16. This phenomenon arises from enhanced gravitational segregation along the structural direction, which suppresses gas fingering while reducing vertical sweep efficiency.

Figure 16.
Stability time of hydrocarbon interface under different dip angles.
Although large dip angles accelerate interface instability, they enhance ultimate recovery by 24% through delayed gas breakthrough and improved sweep efficiency, as shown in Figure 17. Theoretical validation identifies an optimal dip angle range of 30–40°, balancing interface stability and displacement efficiency. These findings provide critical guidance for hydrocarbon reservoir development: low-dip gas injection stabilizes gas caps in high-permeability reservoirs, whereas increasing dip angles with mobility ratio control coordinates interface stability and recovery performance in low-permeability reservoirs.
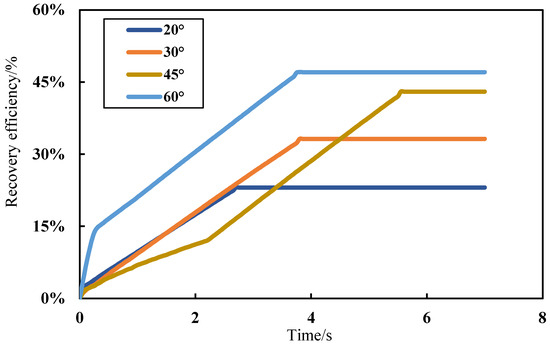
Figure 17.
Oil recovery by gas drive under different formation dip conditions.
3.4.2. Oil/Water Viscosity Ratio
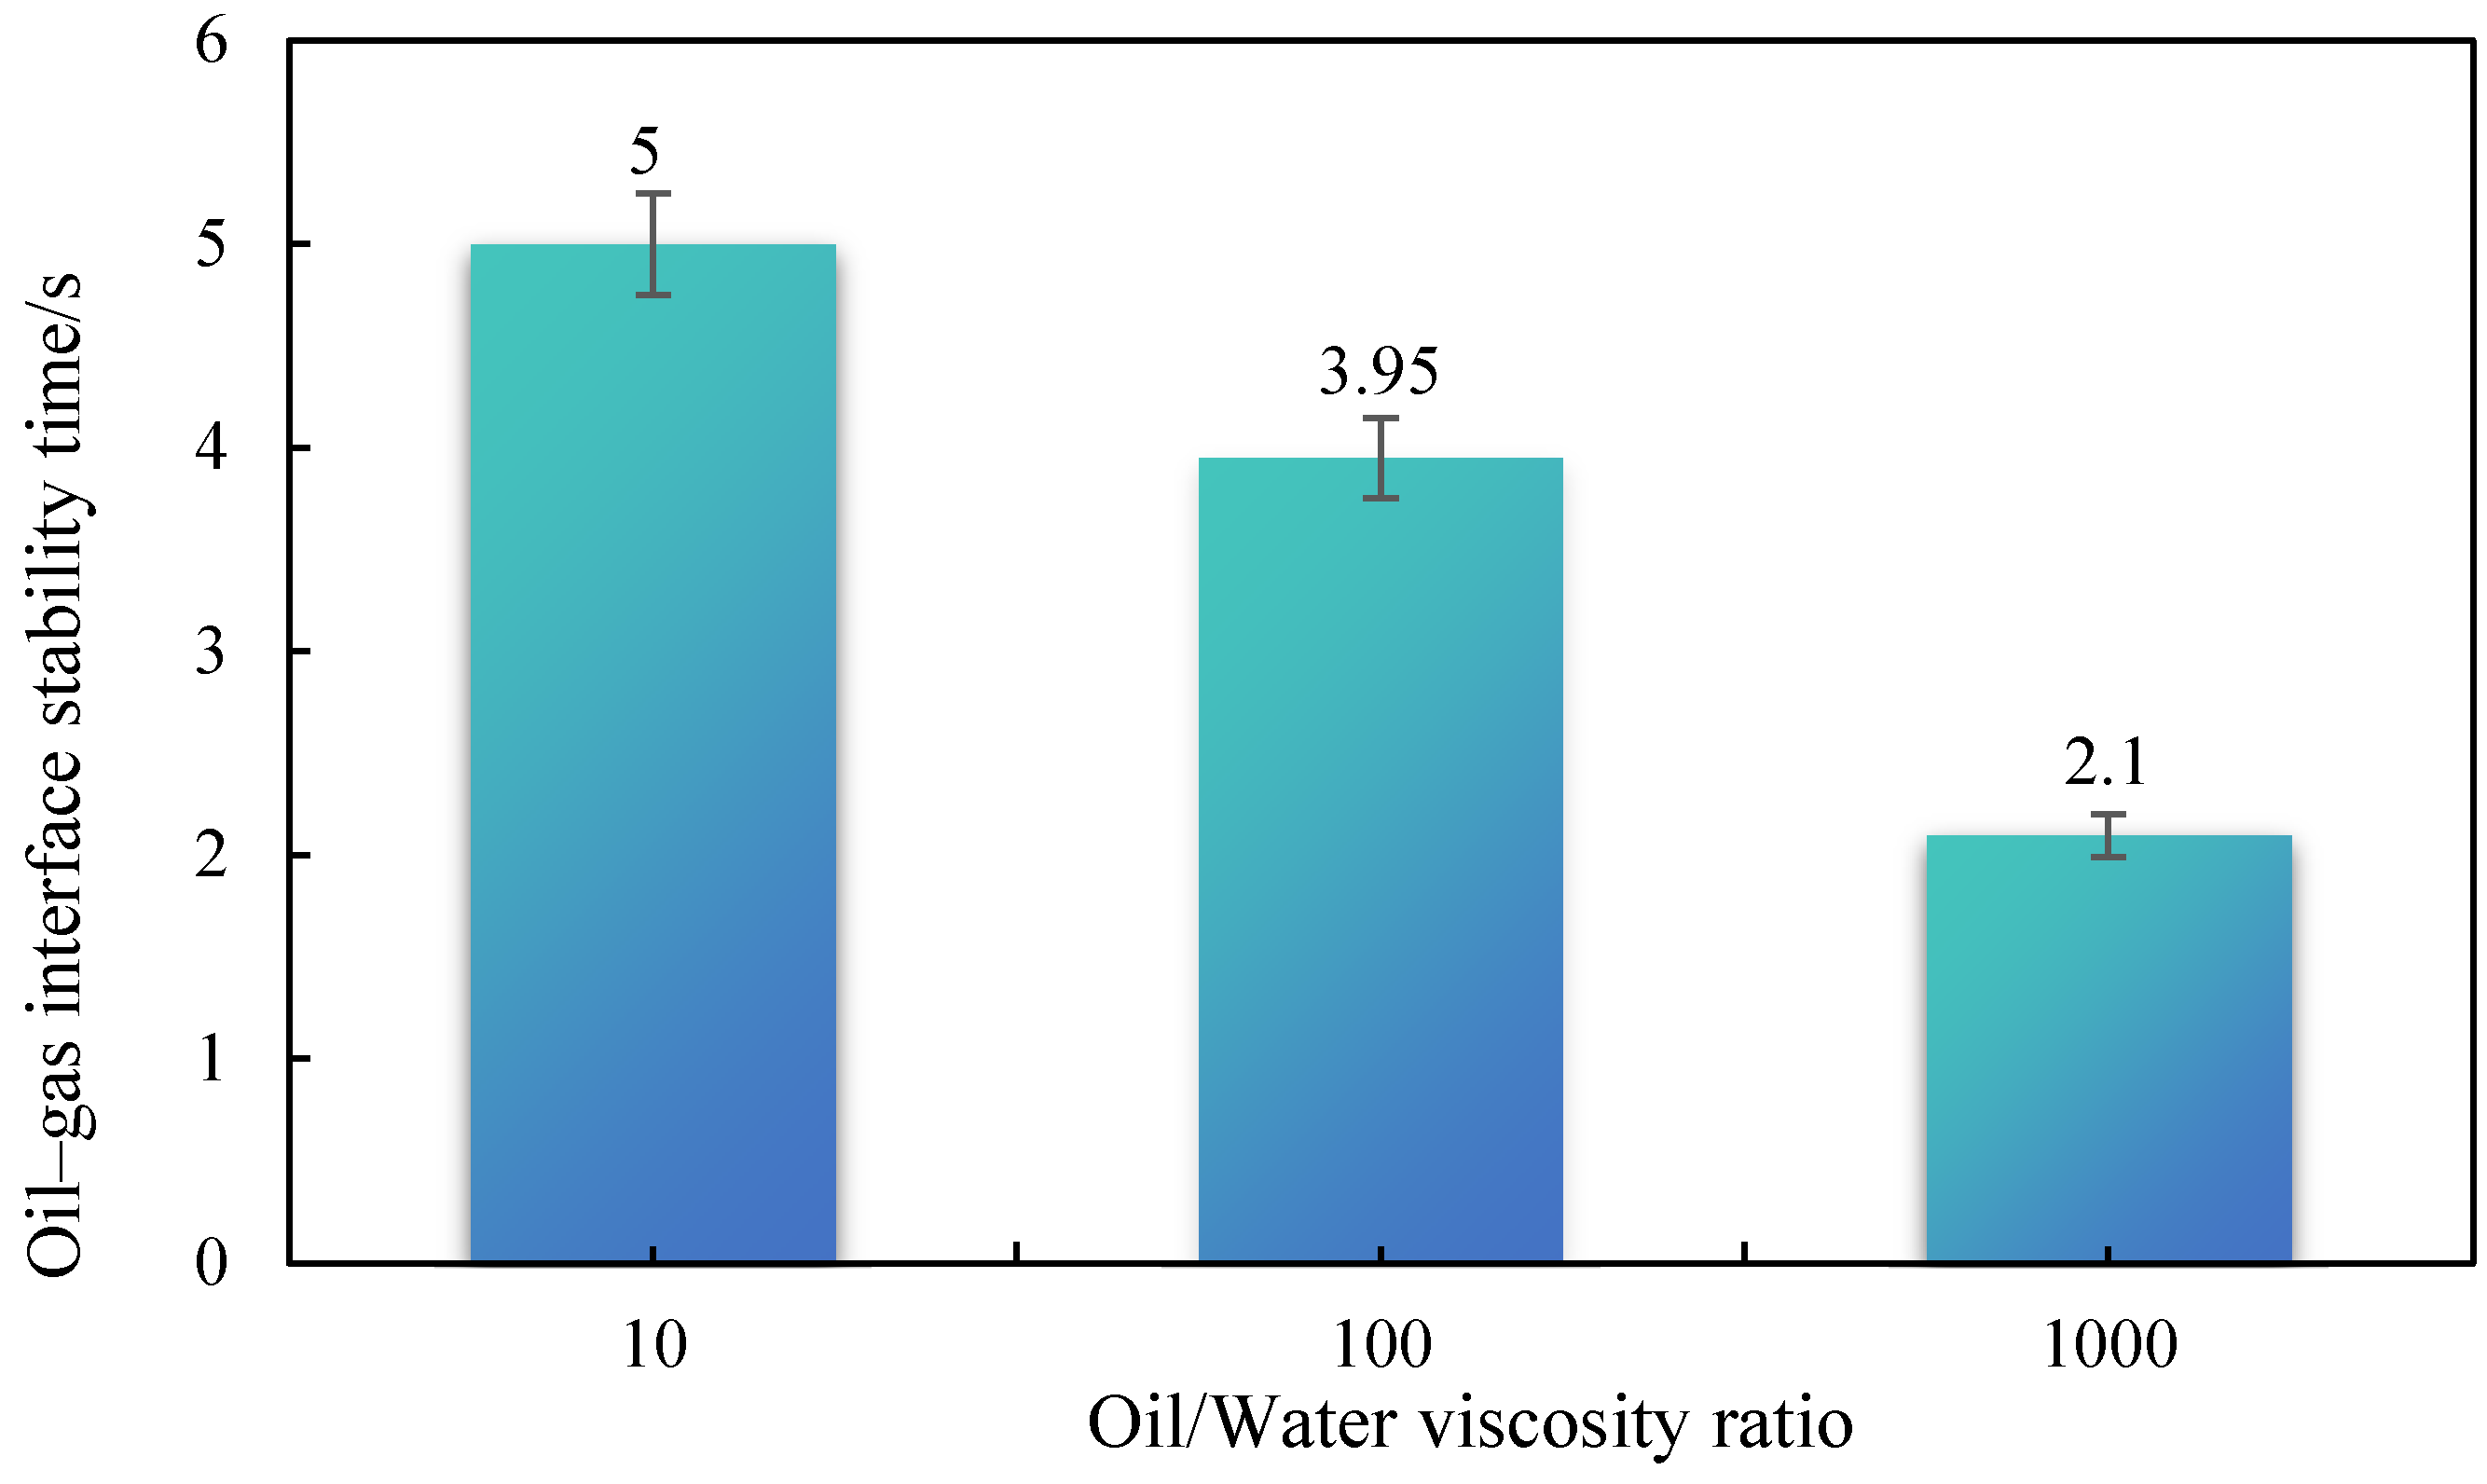
With the formation dip angle fixed at 30° and the gas viscosity remaining constant, oil/gas viscosity ratios of 10, 100, and 1000 were set by changing the crude oil viscosity to study the performance of gas injection and the stability of the oil–gas interface. The results show that both the duration of interface stability and the oil recovery efficiency decrease as the viscosity ratio increases. When the viscosity ratio is 10, the interface stability reaches the longest time of 5 s and the oil recovery rate reaches the highest level of 43%, as shown in Figure 18 and Figure 19. Lower oil/gas viscosity ratios reduce the viscosity difference between the injected gas and the formation oil, suppress gas fingering, stabilize the displacement front, and increase the gas sweep volume, thus achieving a better oil recovery effect. On the contrary, higher viscosity ratios intensify gas channeling, causing rapid breakthrough through preferential pathways. Due to the early stabilization of the gas migration path, the interface stability is significantly shortened. This study further validates the experimental results.
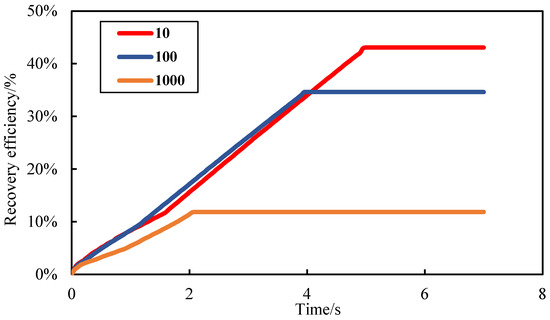
Figure 18.
Oil recovery from gas flooding under different oil/gas viscosity ratios.
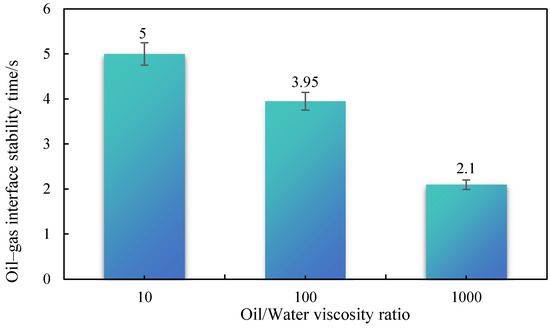
Figure 19.
Stability time of oil–gas interface under different oil/gas viscosity ratios.
3.4.3. Gas Injection Pressure Gradient
Considering model convergence and maintaining constant aquifer energy, this study investigates gas injection-driven oil displacement efficiency and oil–gas interface stability under varying injection velocities by controlling the injection pressure at the gas injection end. Pressure gradients from the injection to production ends are designed as 1.55 × 10⁻6 MPa/m, 3.88 × 10⁻6 MPa/m, 5.43 × 10⁻6 MPa/m, 7.75 × 10⁻6 MPa/m, 9.30 × 10⁻6 MPa/m, and 1.16 × 10⁻⁵ MPa/m to simulate different gas injection rates. Observations from Figure 20 and Figure 21 reveal the following insights:
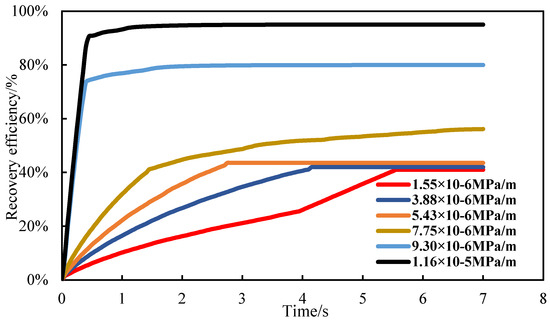
Figure 20.
Oil recovery from gas flooding under different gas injection pressures.
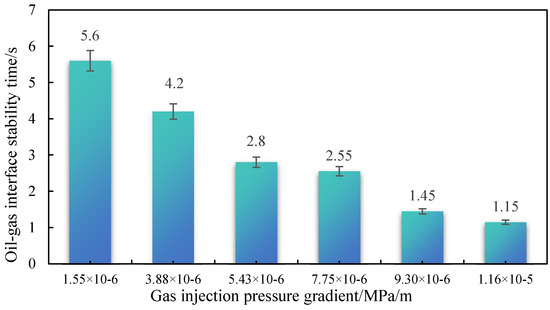
Figure 21.
Stability time of oil–gas interface under different gas injection pressures.
Lower gas injection rates (achieved by reduced injection pressure) favor the formation of stable oil–gas interfaces but prolong the gas-driven response time. Conversely, higher injection rates significantly increase the inclination angle between the advancing gas front and the horizontal plane, leading to gas breakthrough at the reservoir top and severe interface instability. When the injection pressure exceeds a critical threshold, gas breakthrough at the production end still enables the gas phase to sweep regions below the production outlet due to substantial kinetic energy, partially improving recovery efficiency. Controlling injection velocity within a rational range is essential to balance interface stability and displacement dynamics. These findings highlight the necessity of tailoring injection parameters to reservoir conditions for maximizing both stability and recovery performance.
3.4.4. Particle Diameter
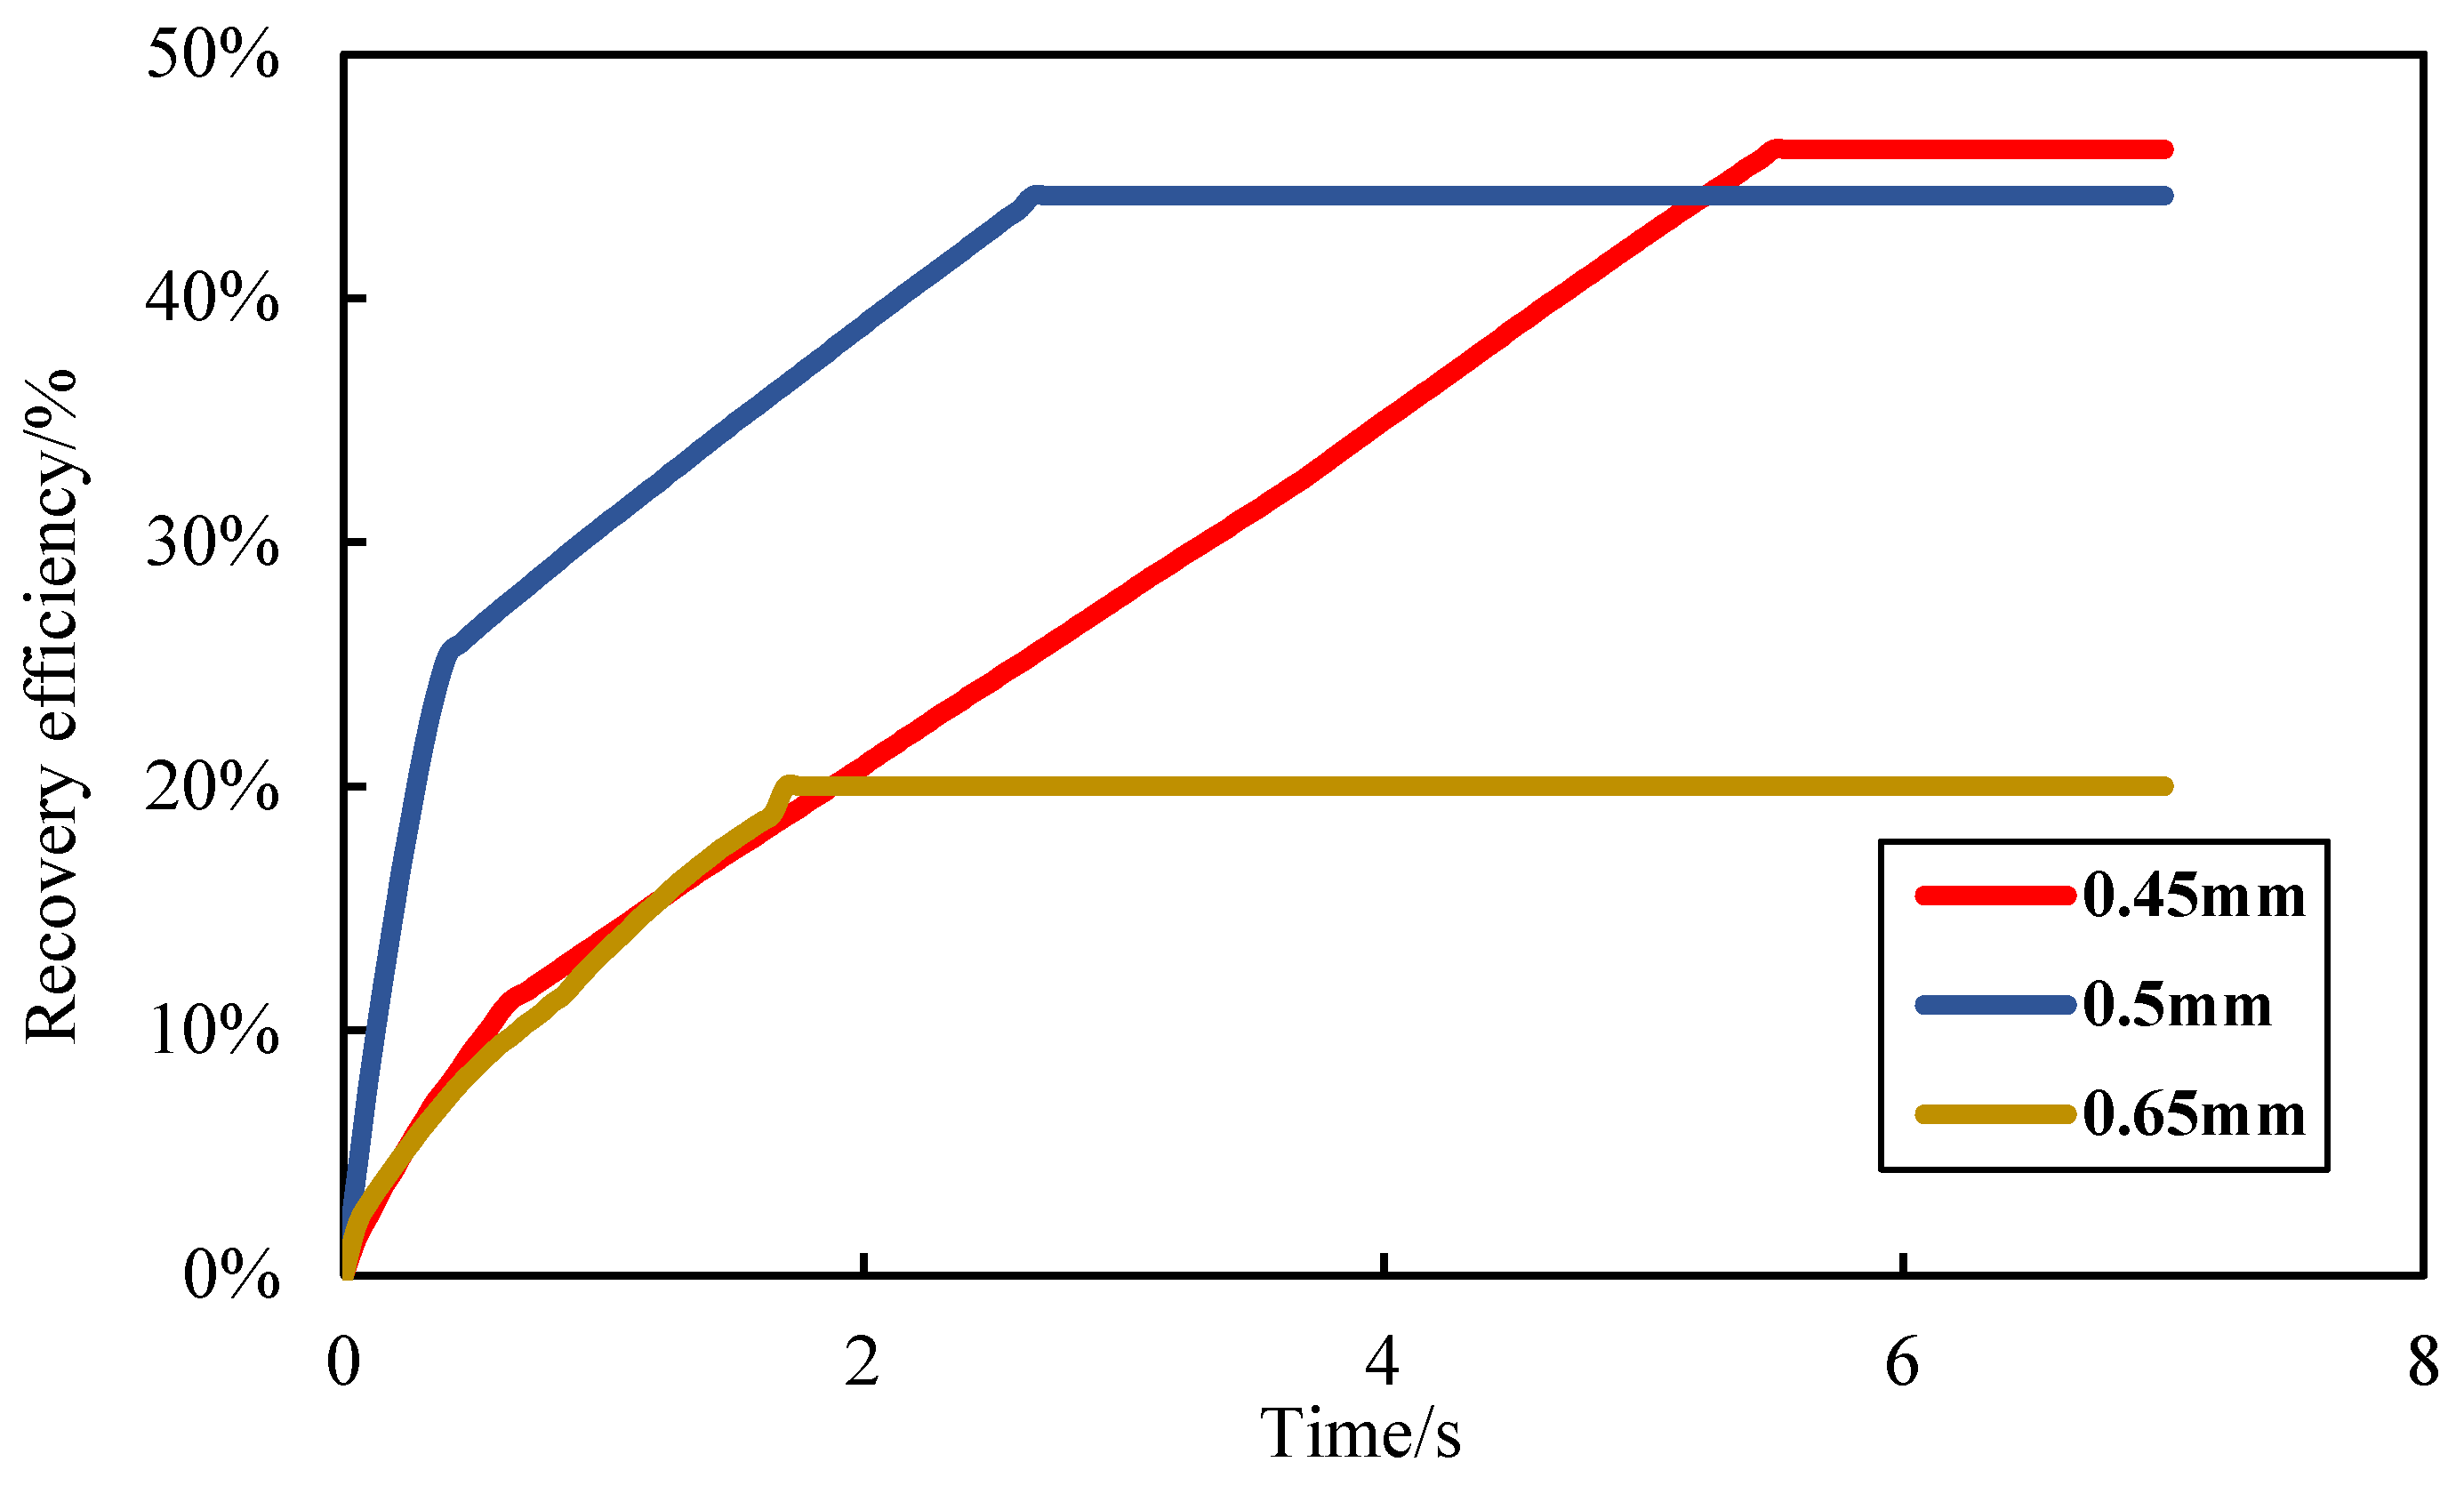
By adjusting packing particle diameters (0.45 mm, 0.5 mm, 0.65 mm) to simulate different permeability levels, gas injection performance and oil–gas interface stability were systematically investigated under heterogeneous packing conditions. An analysis of Figure 22 and Figure 23 indicates that the significant impact of filling media heterogeneity on fluid migration pathways was experimentally validated. Specifically, larger particle diameters (0.65 mm) promoted preferential flow channels, leading to earlier gas breakthrough and reduced interfacial stability, this phenomenon restricted gas sweep volume, resulting in more unstable fluid interfaces and lower oil recovery efficiency. Conversely, smaller particles (0.45 mm) increased flow resistance and improved sweep efficiency by mitigating channeling effects, thus improving oil recovery.

Figure 22.
Oil recovery from gas flooding under different particle diameters.
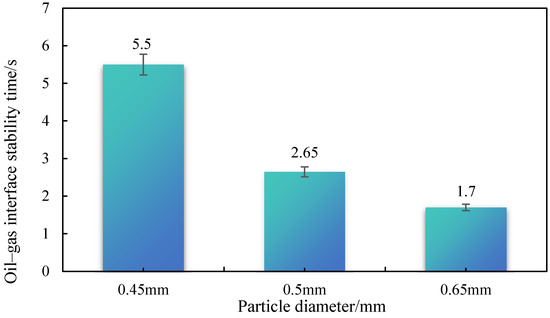
Figure 23.
Stability time of oil–gas interface under different particle diameters.
4. Conclusions
This study combines indoor 3D visualization physical simulation experiment and fracture-vuggy reservoir flow simulation. The interfacial migration law during oil/gas/water injection was studied considering the degree of fracture and hole filling, and the influence of formation crude oil viscosity, gas injection velocity, inclination angle, filling area and interfacial stability was studied. The main findings can be summarized as follows:
- The viscosity of crude oil has a great influence on the degree of recovery. Under the condition of strong edge water, top gas injection can effectively inhibit the edge water energy and achieve the effect of bidirectional flooding. Meanwhile, increasing the viscosity of crude oil will make the stability of the fluid interface worse. When crude oil viscosity increased from 5 cP to 90 cP, the oil recovery decreased by 36.28%.
- Gas drive speed has little influence on the gas–water drive process at low viscosity, but with the increase of viscosity, the influence of gas drive speed on the recovery degree becomes more obvious: gas and water break earlier, and the corresponding oil phase recovery degree is lower.
- The finite element simulation reveals the key mechanisms affecting the stability of the oil–gas–water interface: the increase of the formation dip promotes the formation of a stable gas cap at the high part of the structure by strengthening the gravitational differentiation, inhibits the viscous finger-in caused by the difference in oil-temperament, and drives the attic oil to accumulate in the direction of the production well. Comprehensive optimization of the inclination angle, viscosity ratio and gas injection speed can achieve the synergistic improvement of the stability of the gas drive front and the recovery efficiency.
Author Contributions
Conceptualization, Y.S.; methodology, X.L. and C.C.; validation, Z.Y.; formal analysis, C.C. and Y.S.; investigation, Y.S. and X.L.; resources, Y.P. and L.S.; data curation, X.L.; writing—original draft preparation, Y.P. and X.L.; writing—review and editing, X.L. and L.S.; visualization, Y.P.; supervision, and L.S.; project administration, L.S. and Z.Y.; funding acquisition, Y.P. and L.S. All authors have read and agreed to the published version of the manuscript.
Funding
This research received no external funding.
Data Availability Statement
The original contributions presented in this study are included in the article. Further inquiries can be directed to the corresponding author.
Acknowledgments
The authors are grateful to the anonymous reviewers whose valuable suggestions helped to improve the quality of the manuscript.
Conflicts of Interest
Author Zhicheng Yang was employed by the Tianjin Branch of CNOOC Co., Ltd. The remaining authors declare that the research was conducted in the absence of any commercial or financial relationships that could be construed as a potential conflict of interest.
Abbreviations
The following abbreviations are used in this manuscript:
| PV | Pore volume |
| N2 | Nitrogen |
| CP | Centipoise viscosity |
References
- Meng, Q.; Xu, S.; Cai, J. Microscopic studies of immiscible displacement behavior in interconnected fractures and cavities. ASME J. Energy Resour. Technol. 2019, 141, 092901. [Google Scholar] [CrossRef]
- Li, M.; Wang, Q.; Yao, C.; Chen, F.; Wang, Q.; Zhang, J. Optimization of development strategies and injection-production parameters in a fractured-vuggy carbonate reservoir by considering the effect of karst patterns: Taking c oilfield in the tarim basin as an example. Energies 2025, 18, 319. [Google Scholar] [CrossRef]
- Chen, L.; Jiang, Z.; Sun, C.; Ma, B.; Su, Z.; Wan, X.; Han, J.; Wu, G. An overview of the differential carbonate reservoir characteristic and exploitation challenge in the Tarim Basin (NW China). Energies 2023, 16, 5586. [Google Scholar] [CrossRef]
- Ma, X. Research on Well Failure Management of Water Injection Replacement Wells in Seam-Hole Carbonate Reservoirs. Master’s Thesis, Southwest Petroleum University, Chengdu, China, 2015. [Google Scholar]
- Fang, B.; Jiao, Y.; Zhang, Q.; Tian, Y.; Li, B.; Yu, W. New method for calculating rock compressibility, dynamic reserves, and aquifer size for fractured–vuggy reservoirs with bottom aquifer. Processes 2025, 13, 684. [Google Scholar] [CrossRef]
- Geng, J.; Xiao, L.; Yue, P.; Xiao, Y.; Yang, H.; Qu, S.; Wang, X. Evaluation method of water injection development effects in fractured vuggy carbonate reservoirs: Case study of fi7 strike-slip fault zone. Energies 2024, 17, 5611. [Google Scholar] [CrossRef]
- Cruz, H.J.; Islas, J.R.; Perez, R.C. Oil displacement by water in vuggy fractured porous media. In Proceedings of the SPE Latin American and Caribbean Petroleum Engineering Conference, Buenos Aires, Argentina, 1–3 April 2001. [Google Scholar]
- Kang, Z.H. Simulation and experimental study on the mechanism of water-driven oil in slit-hole carbonate reservoirs. Oil. Gas. Geol. 2006, 2, 87–90. [Google Scholar]
- Wang, L.; Do, Z.; Lin, T. Physical simulation study on visualization of water injection and oil drive in seam-hole reservoirs. J. Southwest Pet. Univ. Sci. Technol. Ed. 2011, 121, 15–16. [Google Scholar]
- Zhang, D.; Yao, J.; Gao, C.H. Physical simulation of water injection development in a seam-hole unit. J. China Univ. Pet. Ed. Nat. Sci. 2012, 36, 130–135. [Google Scholar]
- Wang, J.; Qi, X.; Liu, X.Q. Mechanism of residual oil formation in water-driven slit-hole type reservoirs and mechanism of oil enhancement by switching water injection. Pet. Explor. Dev. 2022, 49, 965–976. [Google Scholar]
- Yang, X.W.; Wang, R.J.; Deng, X.L.; Yao, C. Theoretical exploration of water injection and gravity oil drive in ultra-deep fracture-controlled seam-hole carbonate reservoirs. Pet. Explor. Dev. 2022, 49, 116–124. [Google Scholar] [CrossRef]
- Qian, Z.; Mao, Z. Experiment on water plugging by rubber particles regulating dissection in a single set of seam-hole type reservoir between wells. Lithol. Reserv. 2023, 35, 161–168. [Google Scholar]
- He, J.; Li, A.; Wu, S.; Tang, R.; Lv, D.; Li, Y.; Li, X. Experimental investigation on injection and production pattern in fractured-vuggy carbonate reservoirs. Energies 2020, 13, 603. [Google Scholar] [CrossRef]
- Chen, H.L.; Lucas, L.R. Laboratory monitoring of surfactant imbibition using computerized tomography. In Proceedings of the SPE International Petroleum Conference and Exhibition, International Petroleum Conference and Exhibition, Villahermosa, Mexico, 17–19 February 2020. [Google Scholar]
- Gillespie, J.M.; Stephens, M.J.; Chang, W. Mapping aquifer salinity gradients and effects of oil field produced water disposal using geophysical logs: Elk Hills, Buena Vista and Coles Levee Oil Fields, San Joaquin Valley, California. PLoS ONE 2022, 17, e0263477. [Google Scholar] [CrossRef] [PubMed]
- Zhang, Y.H.; Wang, X. Feasibility study and parameter optimization of co2 injection technology in heavy oil field. In Proceedings of the 16th International Conference on Applied Energy (ICAE 2024), Singapore, 1–5 January 2025. [Google Scholar]
- Brown, G.; Carvalho, V.; Wray, A.; Sanchez, A.; Gutierrez, G. Lickline with fiber-optic distributed temperature monitoring for water-injection and gas lift systems optimization in Mexico. In Proceedings of the 9th Latin American and Caribbean Petroleum Engineering Conference, Rio de Janeiro, Brazil, 10–13 April 2005. [Google Scholar]
- Guo, P.; Yuan, H.; Li, X.H. Micro-visualization modeling of the gas drive mechanism in carbonate reservoirs. J. China Univ. Pet. Ed. Nat. Sci. 2012, 36, 89–93. [Google Scholar]
- Hui, J.; Liu, X.L.; Wang, Y. Study on the mechanism of gas injection and oil replacement in Tahe oilfield seam-hole type reservoir. Oil Drill. Prod. Technol. 2013, 36, 55–57. [Google Scholar]
- Qin, S.Y. Study on the Mechanism of N2 Replacement Oil Injection for Enhanced Recovery in Tahe Oilfield Seam Hole Reservoir. Master’s Thesis, Southwest Petroleum University, Chengdu, China, 2014. [Google Scholar]
- Hou, J.; Zhang, L.; Li, H. Influencing factors of nitrogen drive for enhanced recovery in carbonate slit-hole type reservoirs. Oil. Gas. Geol. 2015, 22, 64–68. [Google Scholar]
- Yang, J.B.; Hou, J.R. Experiment of nitrogen injection for enhanced recovery in karst reservoirs of slit-hole carbonate reservoirs. Oil. Gas. Geol. 2019, 26, 107–114. [Google Scholar]
- Chen, F.F.; Peng, D.B.; Wang, N.; Wang, Z.Z.; Zeng, Q.X. Water Injection and Gas Injection to Enhance Oil Recovery in Yingmai 2 Fracture-Vuggy Reservoir. J. Southwest Pet. Univ. 2024, 46, 149–158. [Google Scholar]
- Fu, Q.L.; Qun, Y.W. Establishment of stability evaluation criteria for the oil–oil-gas interface during gas-cap gravity flooding in oil reservoirs with strong edge-water drive. ACS Omega 2023, 8, 14915–14925. [Google Scholar]
- Su, Z.; Lin, J.; Bai, M.X.; Wu, D.S.; Liu, L.; Zhu, J.H. Inter-well connectivity analysis in carbonate fracture-vuggy reservoir in natural energy development stage. J. Shenzhen Univ. Sci. Eng. 2020, 37, 645–652. [Google Scholar] [CrossRef]
- Wang, Y.Z.; Cao, R.Y.; Jia, P. Prediction method of oil-water interface between injection and extraction wells in fracture-controlled seam-hole type reservoir. J. Shenzhen Univ. Sci. Eng. 2024, 41, 152–162. [Google Scholar]
- Yang, T.; Zhong, H.; Xia, H.; Zhao, X. Mechanism of residual oil mobilization after water flooding based on microscopic flow characteristics. Reserv. Eval. Dev. 2020, 10, 46–52. [Google Scholar]
- Zhu, G.; Yao, J.; Zhang, L.; Sun, H.; Li, A.; Zhang, K. Pore-scale investigation of residual oil distributions and formation mechanisms at the extra-high water-cut stage. Chin. Sci. Bull. 2017, 62, 2553–2563. [Google Scholar]


Disclaimer/Publisher’s Note: The statements, opinions and data contained in all publications are solely those of the individual author(s) and contributor(s) and not of MDPI and/or the editor(s). MDPI and/or the editor(s) disclaim responsibility for any injury to people or property resulting from any ideas, methods, instructions or products referred to in the content. |
© 2025 by the authors. Licensee MDPI, Basel, Switzerland. This article is an open access article distributed under the terms and conditions of the Creative Commons Attribution (CC BY) license (https://creativecommons.org/licenses/by/4.0/).