Article

Study on Outdoor Thermal Comfort of Commercial and Residential Mixed-Use Blocks in Hot and Humid Climates: Taking Guangzhou, China as an Example

School of Art and Design, Guangdong University of Technology, Guangzhou 510090, China
*
Author to whom correspondence should be addressed.
Energies 2025, 18(8), 2015; https://doi.org/10.3390/en18082015
Submission received: 15 February 2025 / Revised: 7 April 2025 / Accepted: 9 April 2025 / Published: 14 April 2025
(This article belongs to the Section G: Energy and Buildings)

Abstract

:
This study evaluated outdoor thermal comfort in commercial and residential mixed-use blocks in hot and humid climates. A subjective survey questionnaire examined thermal environment metrics, individual data, and 141 pedestrian responses. The findings indicated that the average air temperature (31.8 °C) and relative humidity (65.8%) of the four mixed-use blocks were considerably high. The thermal environment differed between each block owing to the influence of block texture and building form. In addition, subjective sensation scores differed among the blocks, aligning with subjective preferences, though subjective acceptability remained largely within a “neutral” range across all blocks. The relationship between thermal environment and subjective perception was intricate, as their patterns of variation were not merely characterized by simple positive or negative correlations but were influenced by a multitude of factors. Multiple linear regression analysis indicated that air temperature, relative humidity, and mean radiant temperature were crucial factors affecting subjective acceptability, all demonstrating statistical significance at p-value < 0.05. Furthermore, this study examined the effect of morphological features on thermal comfort, identifying texture density, street height-to-width ratio (D/H), and orientation strategy as significant factors. The research provides valuable insights into outdoor thermal comfort in mixed-use blocks and provides recommendations for enhancing thermal environment management.

1. Introduction

The spatial proximity of residential, workplace, and service facilities in commercial and residential mixed-use blocks has become a popular approach in modern urban planning and design. With the growing advocacy for diversified urban forms, commercial–residential mixed-use developments that integrate environmental and economic benefits have emerged as an effective solution for sustainable urban planning [1]. They contribute positively to the “three Es” of sustainability (economy, equity, and environment) [2], urban aesthetics, social equity, and public safety (Jane Jacobs’ famous “eyes on the street” theory) [3,4]. Furthermore, creating a healthy environment in commercial and residential blocks can improve the well-being and comfort of citizens. Studies have shown that improving the environmental quality of urban streets is crucial for attracting pedestrians to spend time outdoors and meeting the citizens’ need for physical and psychological comfort [5,6,7]. Therefore, studying the healthy environment of commercial and residential mixed-use blocks is an important basis for high-quality urban development and public health.
Previous research has demonstrated a link between a healthy and an outdoor thermal environment in commercial and residential mixed-use blocks. They have proven that a well-maintained outdoor thermal environment can increase the usage of outdoor spaces, lower building energy consumption, and optimize urban liveability [8,9,10]. Conversely, a poor thermal environment increases the likelihood of health issues such as cardiovascular, respiratory, and cerebrovascular illnesses, acute kidney failure, diabetes, and other related health issues in outdoor spaces [11,12]. Therefore, evaluating the healthy environment of commercial and residential mixed-use blocks from the perspective of an outdoor thermal environment is reasonable and applicable. The outdoor thermal environment is an objective environmental indicator, encompassing factors like air temperature, relative humidity, wind speed, and mean radiant temperature, typically evaluated in conjunction with individual factors (such as metabolic rate and clothing insulation) and subjective measures (like subjective sensation, satisfaction, and preference) [13]. Outdoor thermal comfort evaluation, which is among the most critical metrics for gauging a healthy environment, has been widely used in various outdoor spaces, such as campuses [14,15,16], parks [17,18,19], and urban squares [20,21].
In addition, the impact of outdoor spatial characteristics of the built environment on thermal comfort is increasingly valued. Jamei et al. [22] assessed how urban greenery and building design affect outdoor thermal comfort, confirming their crucial role in regulating micro-climates and formulating mitigation strategies to improve pedestrian-level thermal comfort. Lai et al. [23] discovered that changing the shape of buildings, squares, green spaces, and water bodies can improve outdoor thermal comfort, proposing a comfort strategy tailored for hot and humid climates. Lin et al. [24] created thermal comfort standards for outdoor spaces in landscape architecture by reviewing existing strategies and guidelines for the thermal environment. Although extensive research has been conducted on urban outdoor thermal comfort, existing studies are mainly focused on single-functional areas (e.g., commercial or residential blocks). Systemic investigations into mixed-use blocks remain conspicuously underrepresented. According to a Web of Science search using the keywords “mixed-use district and thermal comfort”, only 23 relevant studies were identified globally between 1900 and 2025. To our knowledge, the building forms, district types, and citizens’ activity patterns in commercial and residential mixed-use blocks are more diverse and complex than those in residential or commercial blocks, resulting in different evaluation methods and results for outdoor thermal comfort [25,26,27]. Moreover, the commercial and residential mixed-use blocks are divided into modern and contemporary according to their construction years. Differences in these blocks’ spatial scale, texture, and building materials are substantial [28,29,30]. Therefore, evaluating and comparing the outdoor thermal comfort of modern and contemporary commercial and residential mixed-use blocks is particularly important.
This study evaluated outdoor thermal comfort across four commercial and residential mixed-use blocks with different morphological textures in Guangzhou, China. Using field investigations and a questionnaire survey, key thermal environment indicators (such as air temperature, relative humidity, air velocity, and mean radiant temperature), individual indicators (metabolic rate and clothing insulation), and subjective perception indicators (sensation, preference, and acceptability) were investigated. The association between the thermal environment and subjective perception was also analyzed, while the effects of climatic factors and morphological elements on outdoor thermal comfort were also explored.

2. Materials and Methods

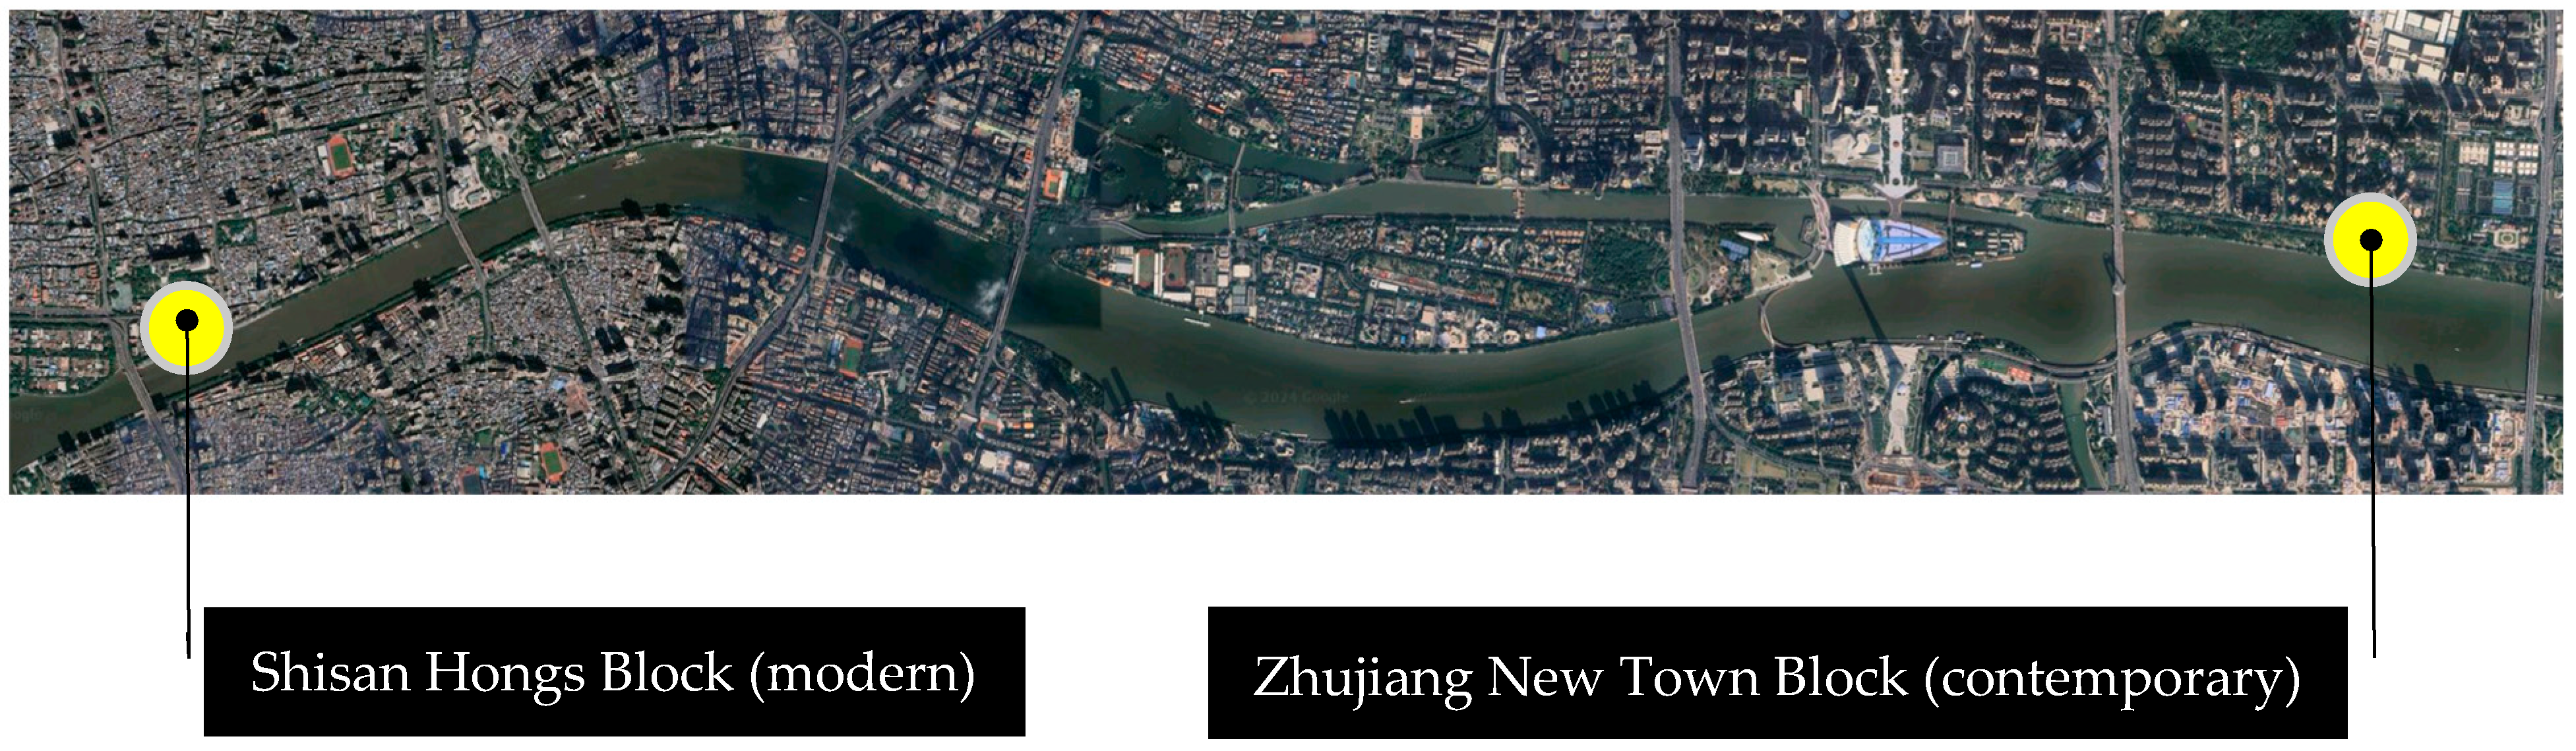
2.1. Climate and Location

This study selected four commercial and residential mixed-use blocks at the center of Guangzhou, China, a subtropical city characterized by high temperatures and humidity. As depicted in Figure 1, which illustrates Guangzhou’s climate data (based on meteorological records from 1991 to 2020 [31]), the maximum monthly average temperature (28.9 °C) occurs in July, while the lowest (13.8 °C) is recorded in January. The average precipitation in May and June exceeded 300 mm. Overall, Guangzhou experiences prolonged periods of high temperature and humidity. When selecting the locations of the commercial and residential mixed-use blocks, this study comprehensively considered the environmental factor, block shape, and building features. The locations are distributed in two representative blocks in the urban area of Guangzhou, namely, the Shisanhang Block (modern) and the Zhujiang New Town Block (contemporary), as shown in Figure 2.

2.2. Block Conditions

Figure 3 presents the locations, textures, and building features of the four mixed-use blocks (A, B, C, and D), all of which integrate commercial and residential functions. Blocks A and B are located in the historical and cultural Shisan Hongs Block in Guangzhou. Both blocks were constructed between the late 19th century and early 20th century as modern commercial and residential blocks. Block A exhibits a total street width of 13 m, comprising a 5 m vehicular lane flanked by 4 m sidewalks on each side. Developed in the early 20th century as standardized multi-story row houses, the buildings integrate ground-floor commercial spaces with upper-level residential units. Most street-facing structures maintain a modest scale, typically not exceeding four stories. In contrast, block B is characterized by densely arranged Zhutongwu (“bamboo tube houses”), known for their narrow facades, deep interiors, and low-rise profiles (generally fewer than three stories, with street-facing elevations under 5 m in height). These structures typically adopt a “shop in front and residence in back” configuration, with primary commercial frontages lining streets under 10 m wide and rear service alleys constrained to a narrow 2–3 m. The resulting urban fabric is a tightly woven, crisscrossing network of streets and alleys. Blocks C and D, situated within Zhujiang New Town, represent contemporary urban development from the early 2000s. These blocks feature modern street systems and mixed-use typologies. Block C has a total right-of-way width of 56 m, including a 24 m roadway, a 6 m central greenbelt, and asymmetrical sidewalks (16 m on the left, 10 m on the right). Block D features a 9 m roadway with sidewalks of 9 m (left) and 5 m (right). Both blocks follow a “ground-floor commercial + residential upper floors” model, with individual retail units occupying at least 80 square meters. The streetscapes are dominated by high-rise buildings ranging from 25 to 35 stories. Therefore, the four blocks in this study comprehensively encompass typical modern and contemporary urban fabrics from southern China in terms of textures [32], traditional dense alleyways, and modern multifunctional composite roads, and include both low-rise and high-rise buildings regarding street-front building heights, thereby ensuring the methodological integrity and representativeness of this study.

2.3. Survey Plan

In this study, outdoor thermal comfort was evaluated through thermal environment measurement, individual data collection, and a subjective questionnaire survey. The fieldwork was conducted in pedestrian areas on the ground floor of the mixed-use block. Given the region’s hot and humid climate, the survey took place between June and July 2024. Data collection occurred on four days each month: 18, 19, 24, 25 June and 2, 3, 6, 8 July, with the survey times from 8:30 to 12:00. The questionnaire was administered while participants walked or stood in the outdoor spaces. To ensure stable and consistent physical and psychological responses, participants were required to maintain their usual activities while verbally completing the questionnaire, ensuring the authenticity and reliability of the data collected.

2.3.1. Determination of Thermal Comfort Indicators

Overall, the criteria for assessing outdoor thermal comfort in mixed-use blocks include thermal environment conditions, individual information, and subjective perceptions according to the features of this study and the current standards of thermal comfort [11,33]. The thermal environment involves air temperature, relative humidity, air velocity and mean radiant temperature. Individual data primarily focus on metabolic rate and clothing insulation, while subjective perceptions cover subjective sensation, subjective preference, and subjective acceptability. This study selected four indicators of the thermal environment, two indicators of individual factors, and three indicators of subjective perception, as detailed in Table 1.

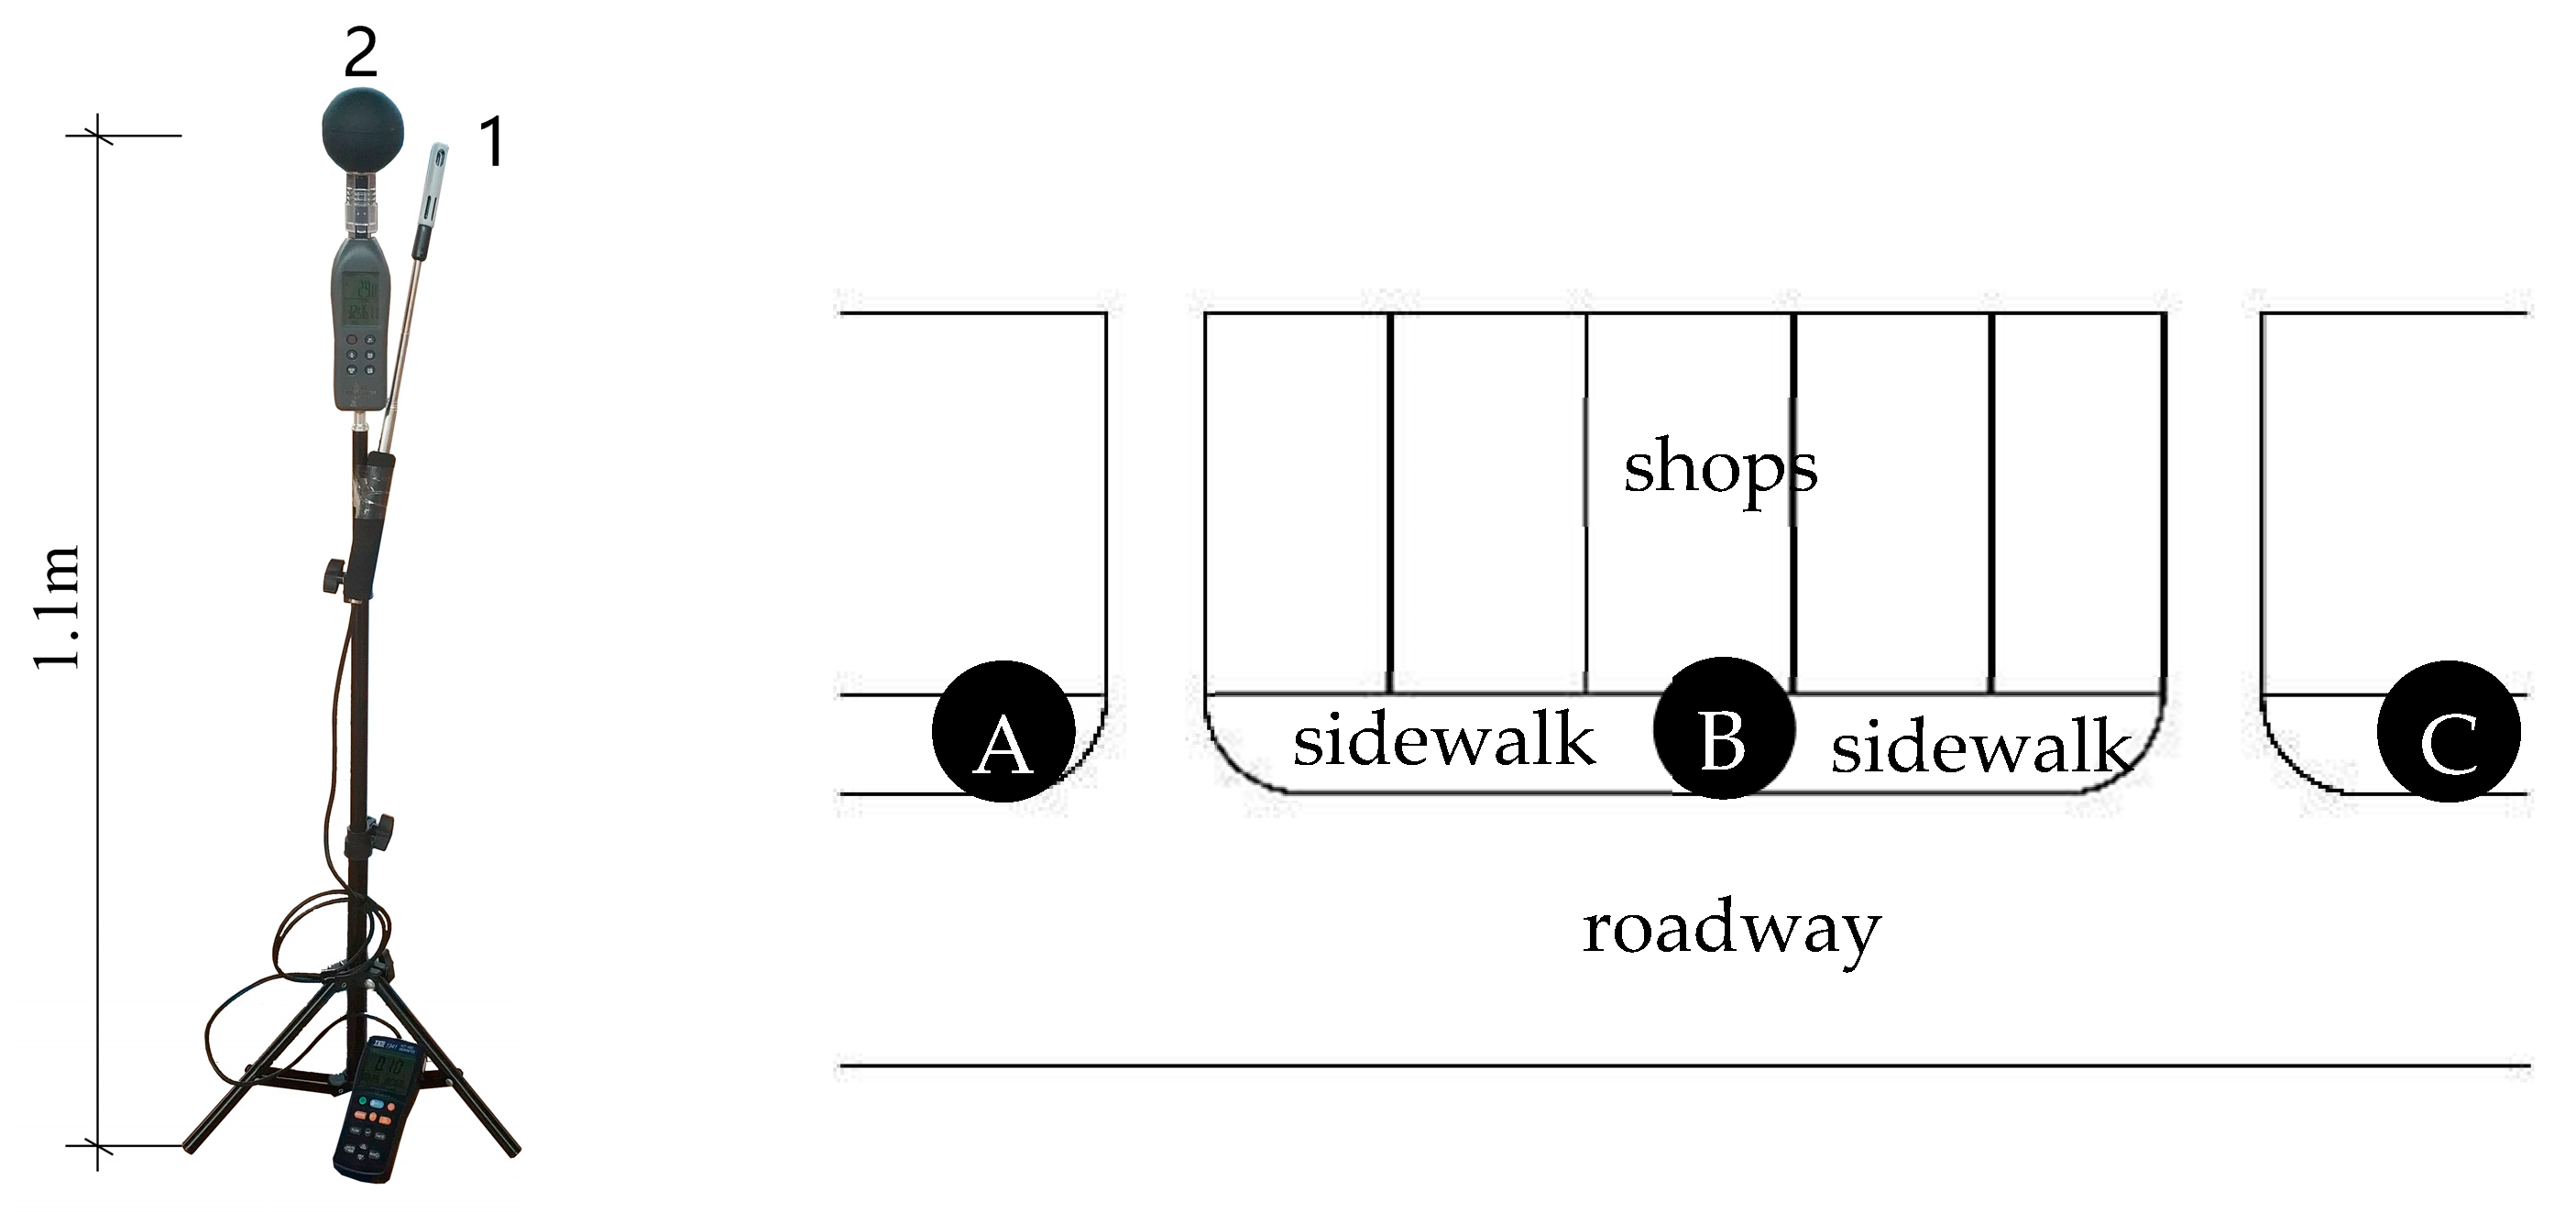
2.3.2. Measurement of Thermal Environment

The thermal environmental metrics consist of air temperature, relative humidity, air velocity, and globe temperature. The measurement devices, which were positioned at three positions (A–C) along the configuration of each mixed-use block (see Figure 4), are listed in Table 2. As most participants were either standing or walking, the measurement devices were set at a height of 1.1 m in line with the Chinese standard “Standard of test methods for the thermal environment in buildings” [34]. Data from each device were recorded and stored automatically in 5 min intervals during the survey. In addition, the globe temperature data in this study were obtained through measurements using a 50 mm diameter globe thermometer under outdoor environmental conditions, from which the mean radiant temperature was calculated. The use of a globe smaller than the one typically used for WBGT measurements is primarily due to its lower response times [35], which enables real-time monitoring of climatic conditions. Considering the natural convection characteristics of the measurement environment, we strictly adhered to ISO 7726 Standard [36] and employed the calculation formula for natural convection conditions, as shown in Equation (1):
T r = T g + 273 4 + 0.25 × 10 8 ε g T g T a D 1 4 × T g T a 1 4 273
where T g is the temperature of the black globe in °C. ε g is the emissivity of the black globe (without dimension); under the ideal blackbody assumption, the standard value of 1 is adopted for calculation. T a is the air temperature in °C. D is the diameter of the globe in meters.

2.3.3. Collection of Individual Data

In this study, an individual data point includes metabolic rate and clothing insulation. The participant’s activities and attire were documented through observations and a questionnaire, with estimates based on reference values from the ASHRAE Standard 55-2023 [13].

2.3.4. Survey of Subjective Questionnaire

A subjective questionnaire survey was conducted with participants in the four mixed-use blocks, gathering personal details such as gender, age, and duration of local residence, as shown in Table 3, along with their subjective perception. The scale of subjective perception is shown in Table 4 [37]. The subjective sensations were conducted by a seven-point scale [13], including a thermal sensation scale for temperature ranging from “hot” to “cold”, a humidity sensation scale for moisture levels ranging from “very wet” to “very dry”, and a draft sensation scale for an air velocity ranging from “very strong” to “very weak”. Subjective preferences were measured using a three-point scale for temperature from “warmer” to “cooler”, for humidity from “wetter” to “drier”, and for air velocity from “more” to “less”. The subjective acceptability was investigated using a seven-point range from “very unacceptable” to “very acceptable” [33]. For statistical analysis, the range demarcation method recommended by ASHRAE Standard [13] was adopted, which involves defining the boundaries of scale ranges with ±0.5 intervals. For instance, in the subjective acceptability scale, “neutral” was between −0.5 and 0.5, “slightly acceptable” was between 0.5 and 1.5, “acceptable” was between 1.5 and 2.5, and “very acceptable” was above 2.5.
A total of 155 individuals (93 males and 62 females) took part in the survey evenly distributed across the four mixed-use blocks. The age distribution of participants was broad, with males ranging from 16 to 78 years old and females ranging from 16 to 83 years old. However, the average age for both male and female participants was 36 years. During the survey, all participants had resided in the area for at least one year. Moreover, male participants mainly wore shorts or trousers, whereas some female participants wore skirts. Due to the exceptionally narrow streets in blocks A and B, transportation modes other than pedestrian traffic were rarely observed, and mobile street vendors were scarcely seen in these areas. To ensure sample consistency, all surveyed individuals were documented in either standing or walking postures during the investigation.

2.4. Data Analysis

In this study, each data point of the thermal environment (air temperature, relative humidity, air velocity, and mean radiant temperature) and the corresponding data point of individual information (metabolic rate and clothing insulation) and subjective perception (subjective sensation, subjective acceptability, and subjective preference) were considered as a data sample. In total, 141 valid samples were gathered (32 for mixed-use block A, 36 from block B, 33 from block C, and 40 from block D). To address the issue of uneven distribution of neighborhood sample sizes, the independent samples t-test was employed. The statistical results revealed significant differences between neighborhoods (p < 0.05), demonstrating not only distinct thermal environmental characteristics but also significant spatial variations in subjective thermal perception. In addition, statistical analysis was performed using SPSS v22.0, and diagrams were created with Excel 2016. The connection between subjective perception and the thermal environment factors was analyzed, with the significance of the thermal environment indicators determined through multiple linear regression. The statistical tests used a significance level of 0.05.

3. Results

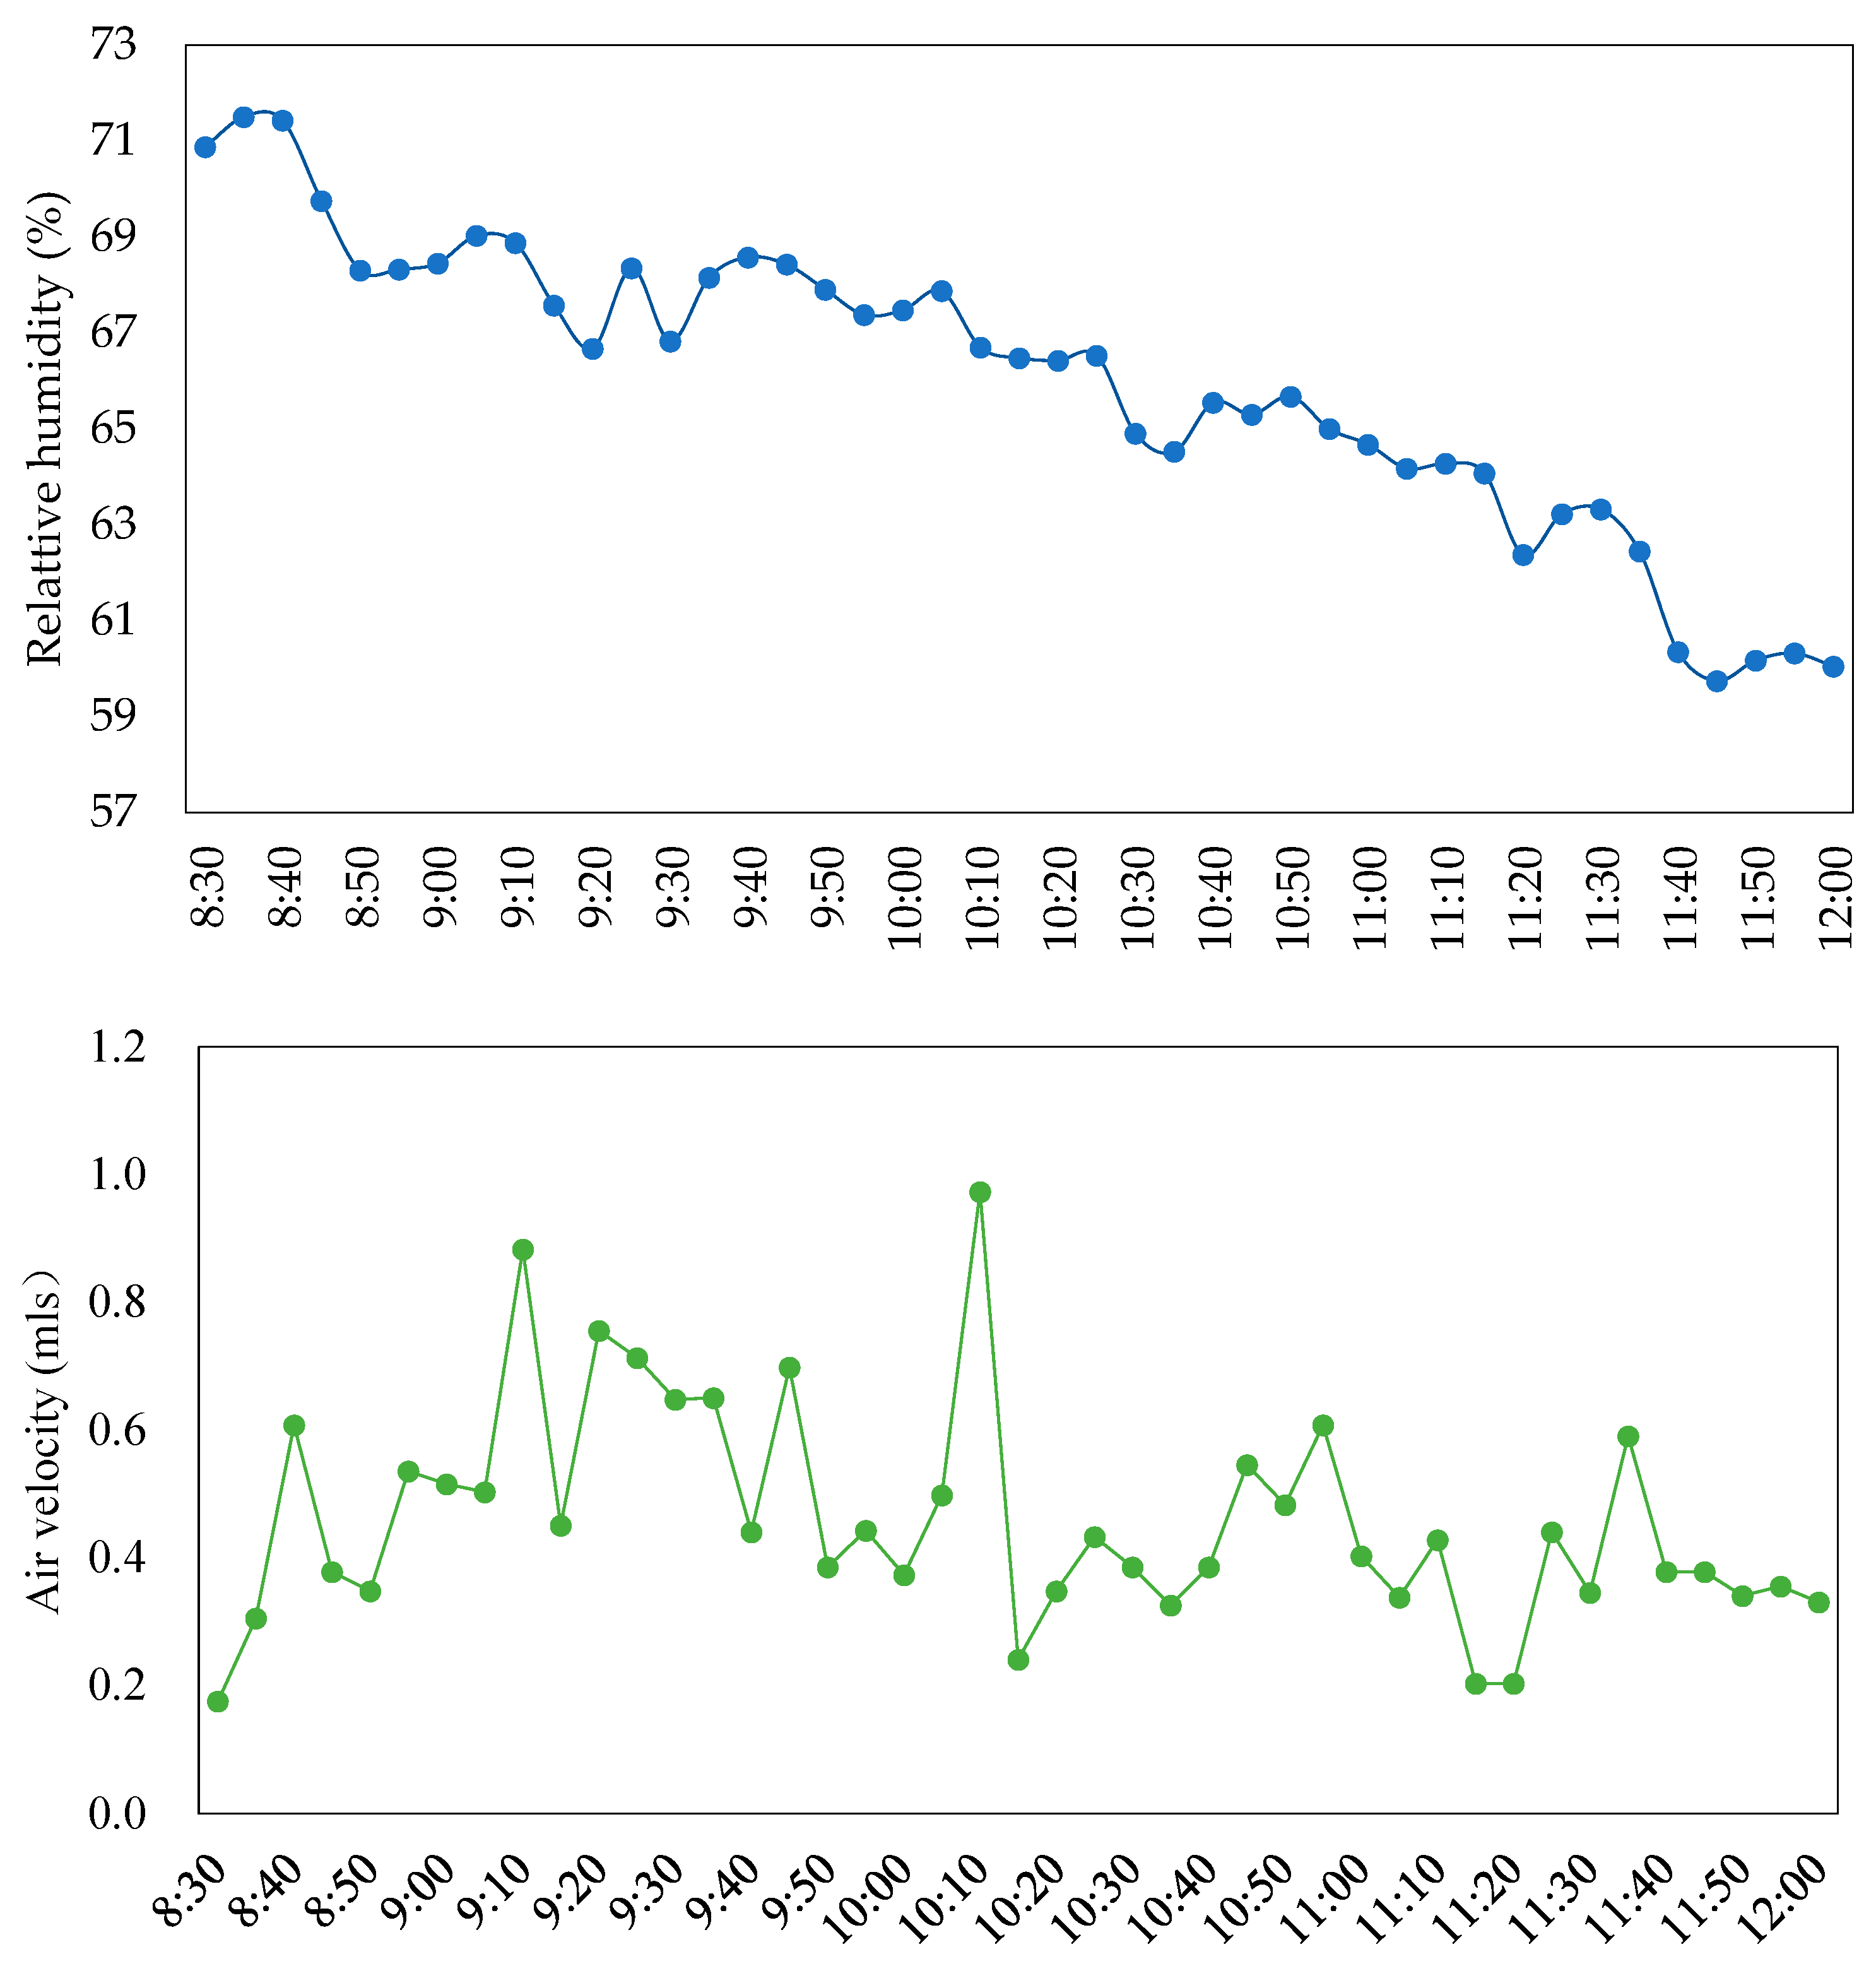
3.1. Values of Thermal Environment

Table 5 provides the highest values, lowest values, mean values, and standard deviation values for the indicators of the thermal environment. Throughout the survey, the air temperatures fluctuated between 29.6 °C to 37.5 °C, and the mean radiant temperature spanned a broader range, from 29.8 °C to 43.5 °C. The upper limit of mean radiant temperature was significantly higher than that of air temperature, primarily attributable to the outdoor environmental characteristics of the study site. Under open space conditions, direct solar radiation on building surfaces and ground elements leads to rapid surface temperature increases through radiate heat transfer mechanisms, consequently resulting in significantly elevated mean radiant temperatures. The temperature differential pattern effectively demonstrates the dominant role of radiate heat transfer in outdoor thermal environments and provides important empirical evidence for understanding urban heat island effects. In addition, the average relative humidity was recorded at 65.8%, peaking at 81.8%. Regarding the air velocity, the average value was 0.48 m/s and it ranged from 0.01 to 2.29 m/s.
Figure 5 displays the variations in the average thermal environment values from 8:30 a.m. to 12:00 a.m. The air temperature and mean radiant temperature gradually increased over time, while the relative humidity decreased over time. In addition, the changes in air temperature, mean radiant temperature, and relative humidity were consistent, while the shifts in air velocity were irregular, likely influenced by the wind direction and frequency in the outdoor areas.

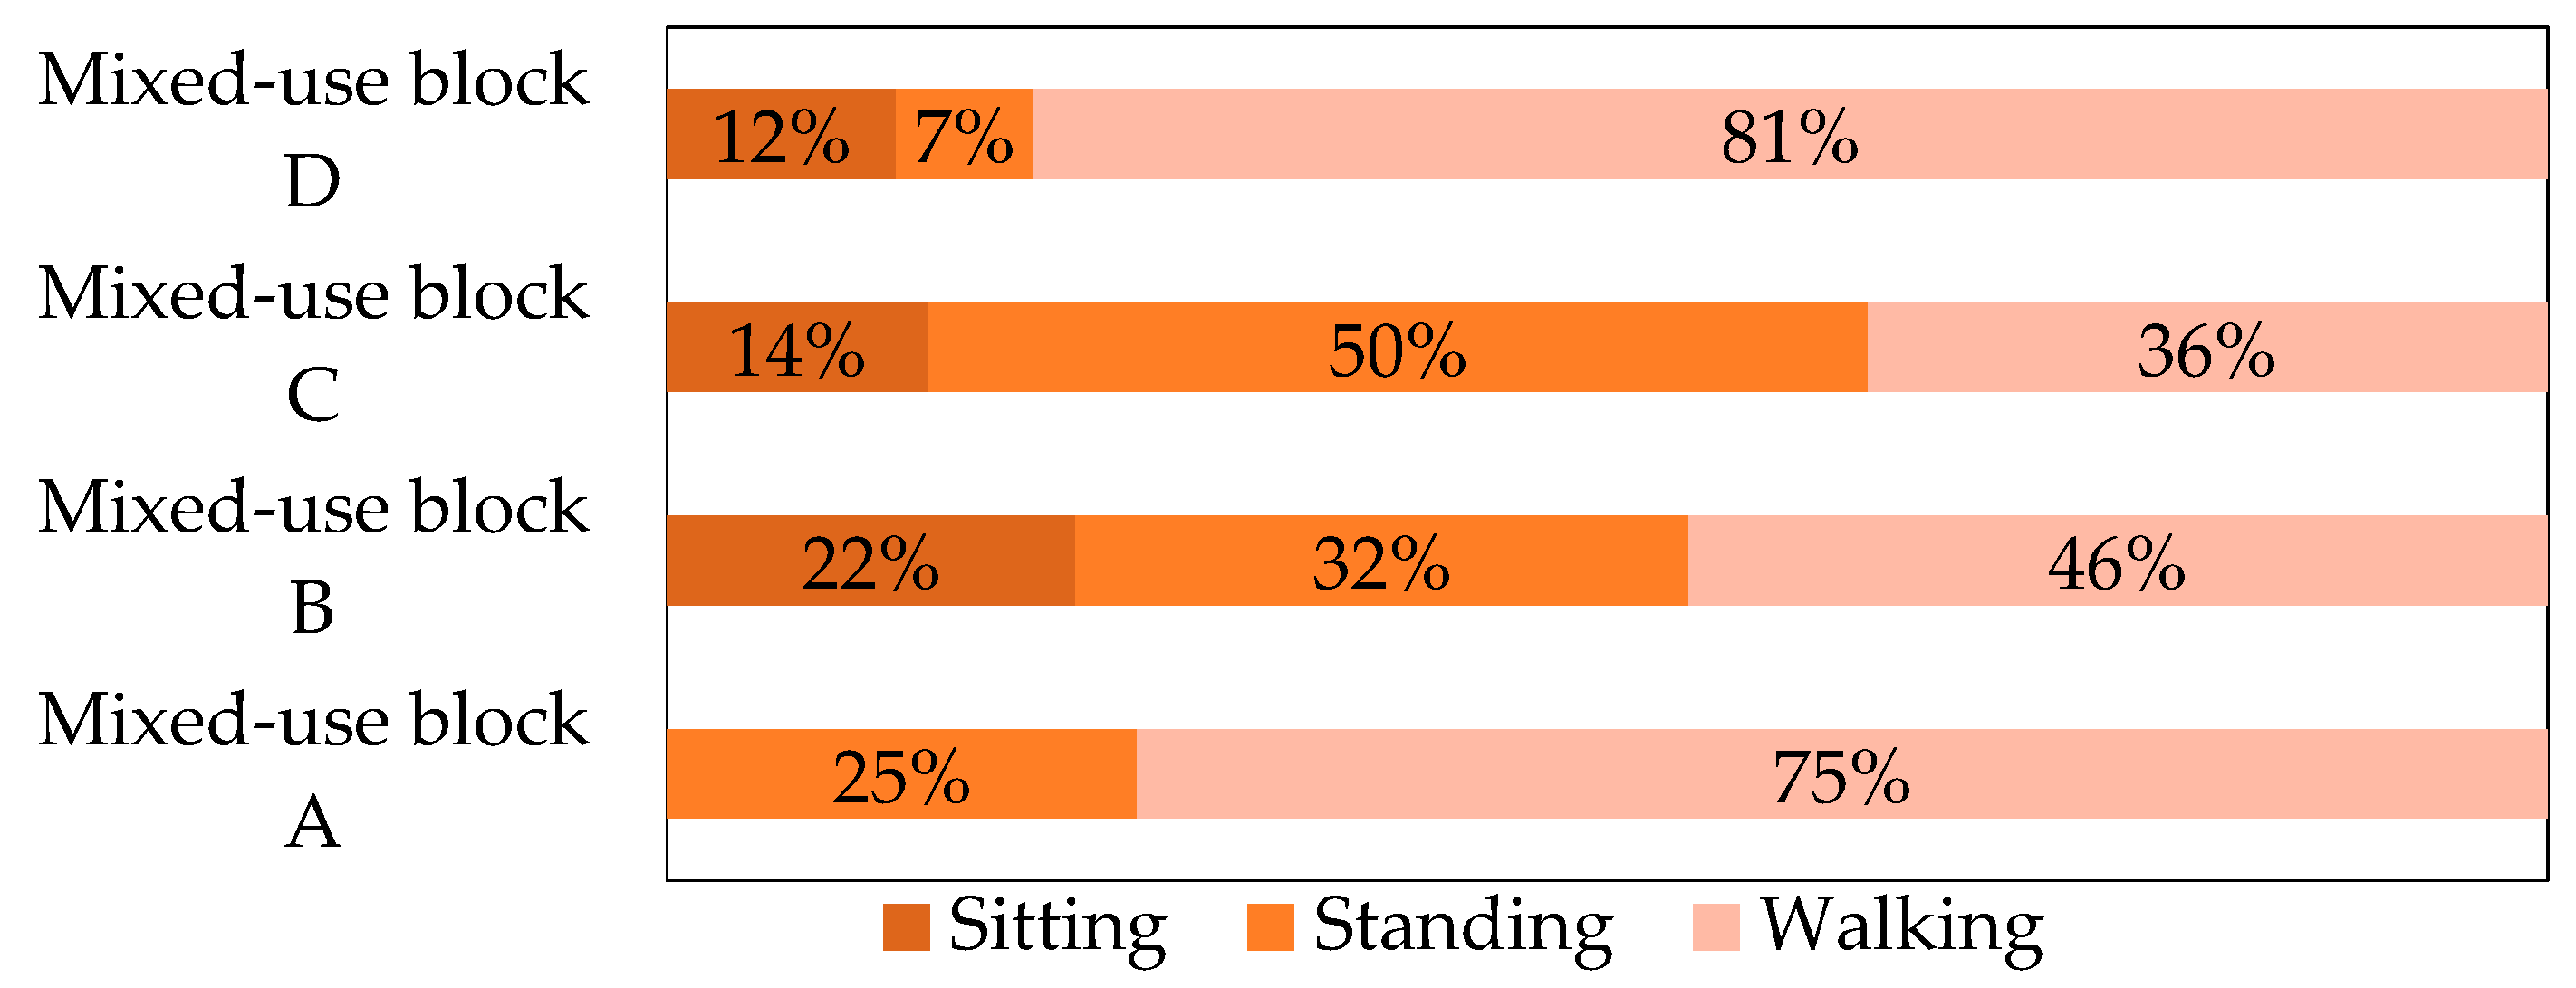
3.2. Values of Individual Data

Figure 6 illustrates the behavior proportion of participants in mixed-use blocks A–D. The behaviors of participants in the four mixed-use blocks were sitting, standing, and walking. Mixed-use blocks A, B, and D had the highest proportion of walking participants, accounting for 75%, 46%, and 80%, respectively, and mixed-use block C had the highest proportion of standing participants, accounting for 50%. All in all, the metabolic rates of participants in the four surveyed blocks were 1.0 met (60 W/m2) for sitting, 1.2 met (70 W/m2) for standing, and 2.0–2.6 met (115–150 W/m2) for walking according to the comparison table of the metabolic rates and behaviors in the ASHRAE Standard 55 [13].
Figure 7 shows the clothing ratio of participants in mixed-use blocks A–D. The attire in the four blocks included shorts (walking shorts and short-sleeve shirts), trousers (trousers with short-sleeve or long-sleeve shirts), and skirts (knee-length skirts with short-sleeve shirts). Most participants wore trousers and short-sleeve shirts, with mixed-use block C having the highest proportion at 67%, followed by the proportion of participants wearing walking shorts and short-sleeve shirts, with mixed-use block B having the highest proportion at 43%. In addition, only three participants were dressed in trousers and long-sleeve shirts in mixed-use block B (2%) and D (5%), and four participants were dressed in knee-length skirts and short-sleeve shirts in mixed-use block B (9%). The clothing insulation of participants in the four surveyed blocks was 0.36 clo for walking shorts with short-sleeve shirts, 0.57 clo for trousers with short-sleeve shirts, 0.61 clo for trousers with long-sleeve shirts, and 0.54 clo for knee-length skirts with short-sleeve shirts, based on insulation values for typical ensembles outlined in ASHRAE Standard 55 [13].

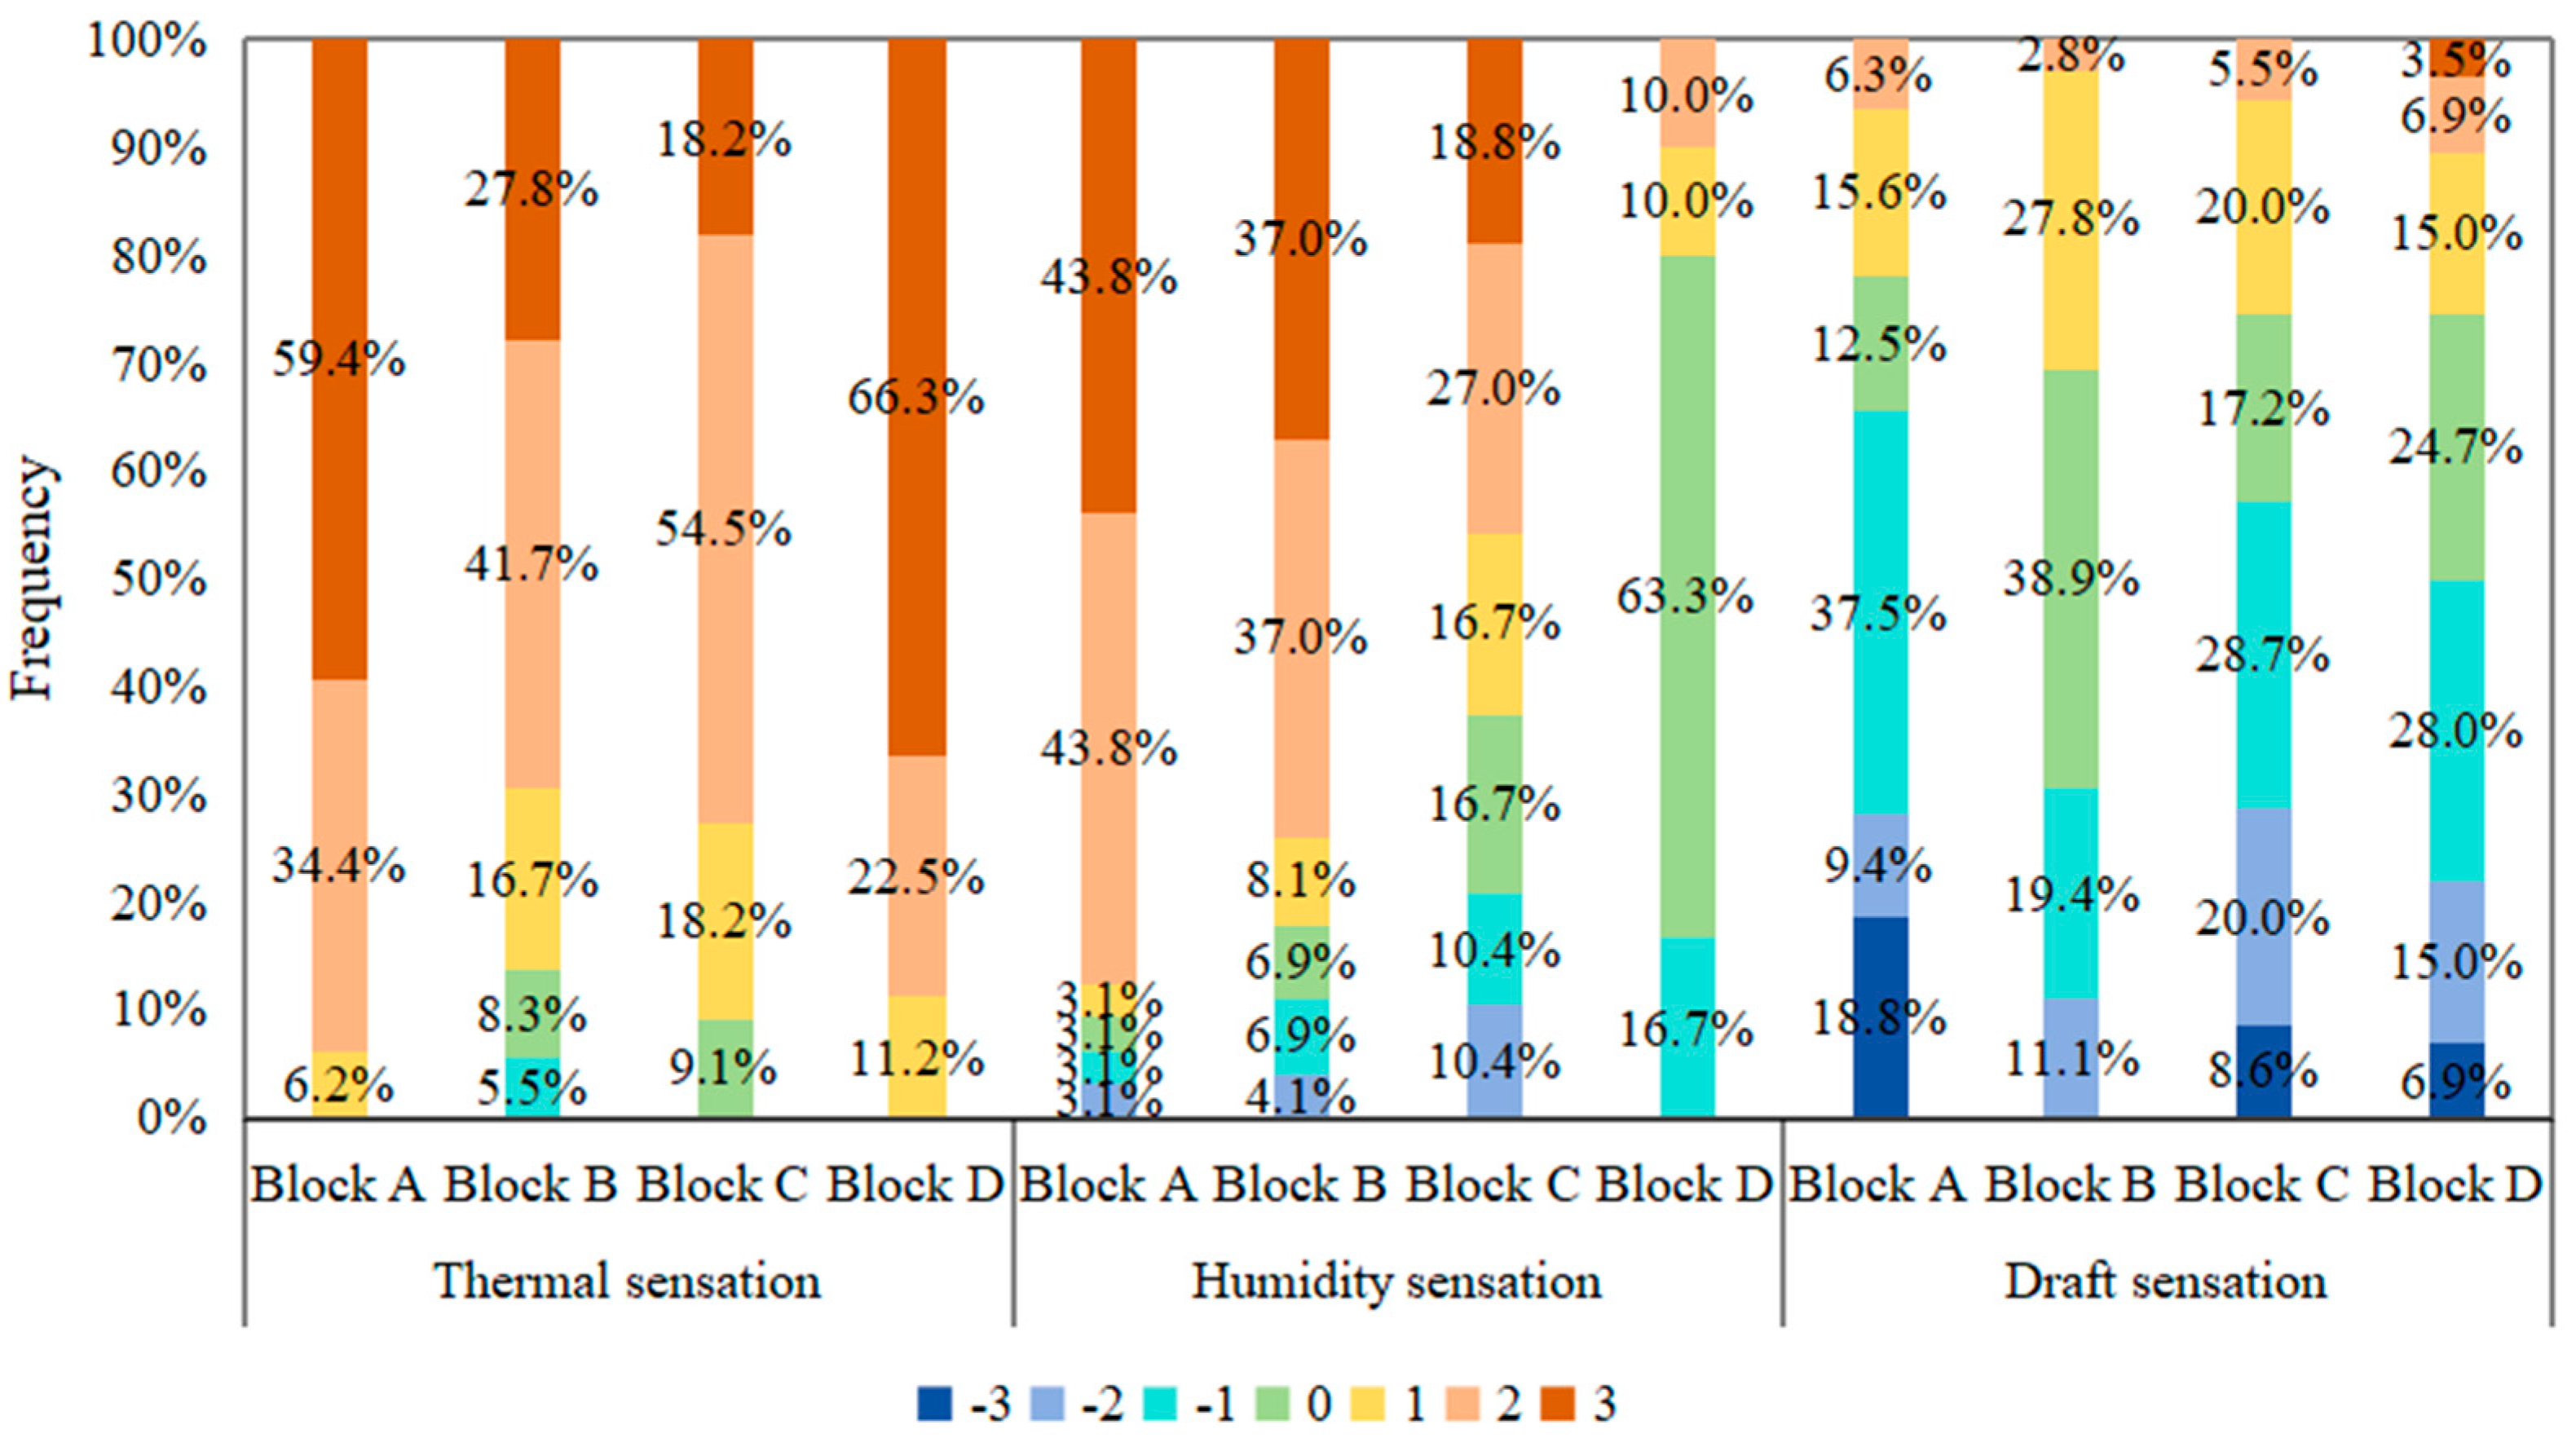
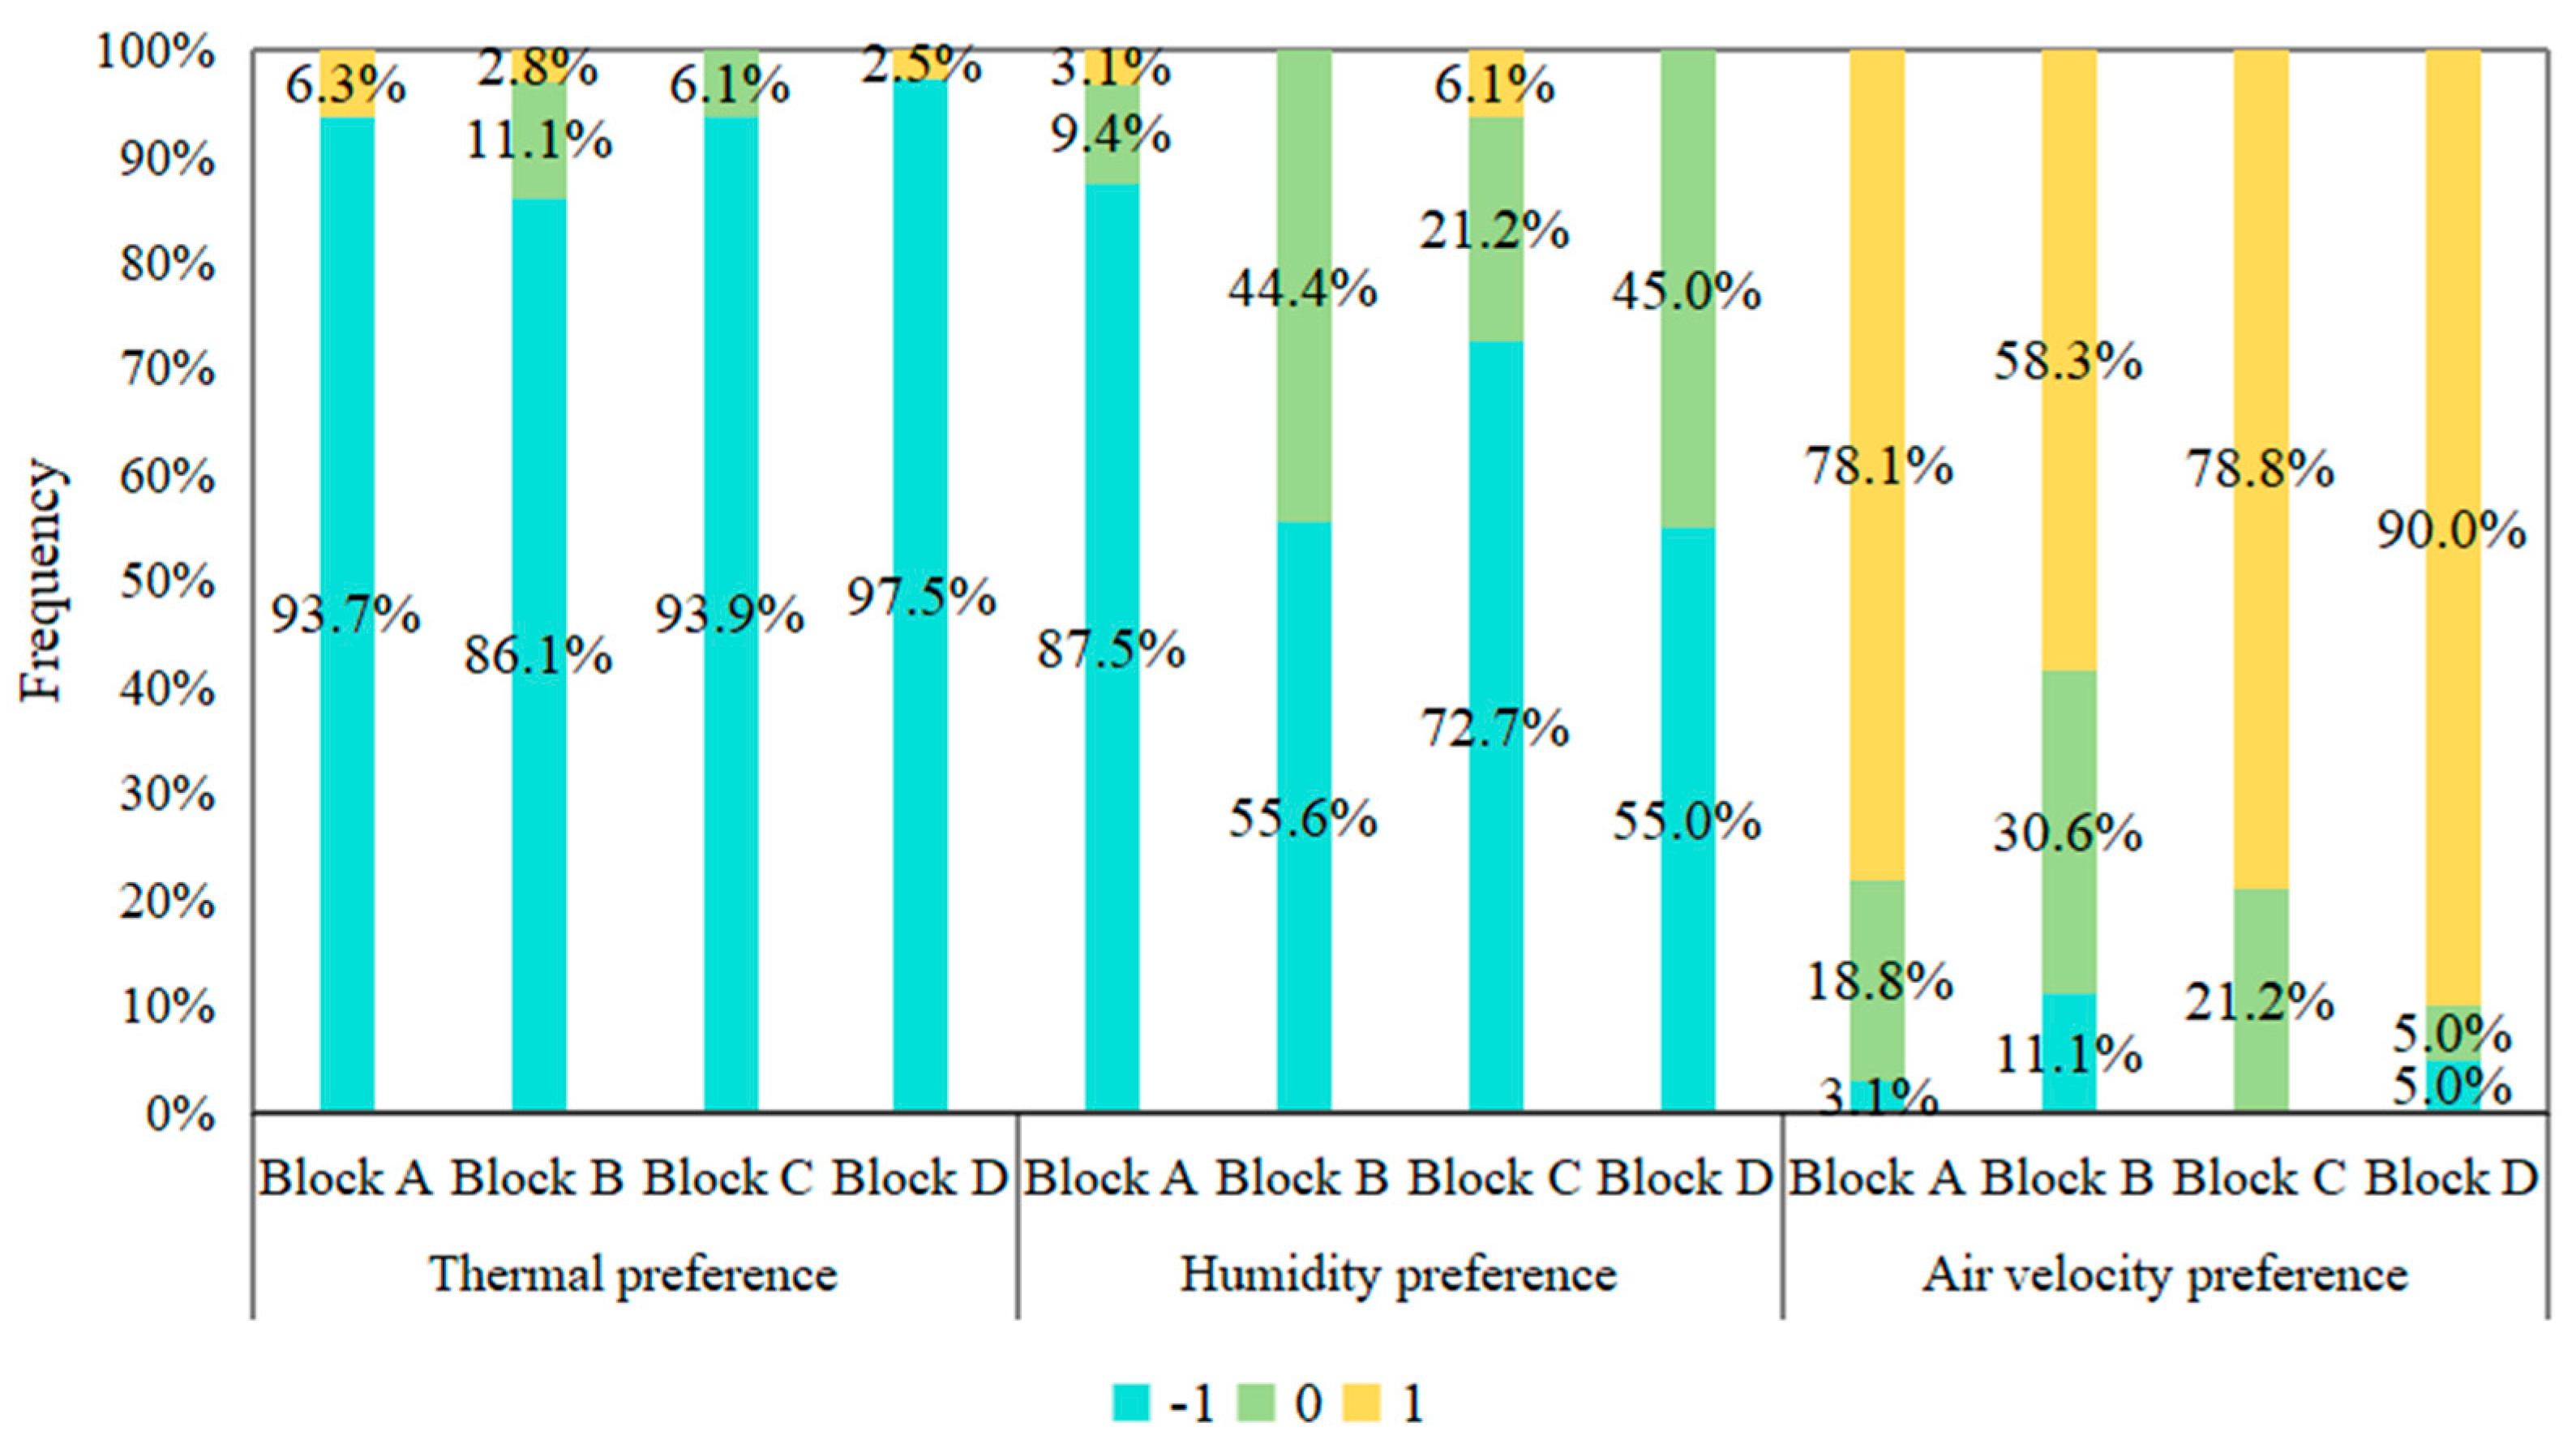
3.3. Values of Subjective Questionnaire

Table 6 presents the average values of the subjective questionnaire for participants in the outdoor areas of the four mixed-use blocks, involving subjective sensation, subjective acceptability, and subjective preference. In terms of subjective sensation, owing to the high air temperature during the survey, the thermal sensation scores were elevated with participants in blocks A and D reporting feeling “hot” (average value of 2.5), while those in blocks B and C described feeling “warm” (average value of 1.8). For humidity sensation, participants in block D reported a “neutral” sensation, while those in blocks A–C felt “slightly wet” to “wet”, with block A having the highest average value at 2.1. In addition, participants in mixed-use blocks A, C, and D perceived a “slightly weak” draft sensation, whereas those in block B reported a “neutral” draft sensation.
Regarding subjective acceptability, the participants in the four mixed-use blocks had consistent thermal acceptability, although their subjective sensations varied. Except for the participants in mixed-use block D who felt “slightly acceptable”, those in the other mixed-use blocks felt “neutral”. It can be seen that participants’ acceptance of their environment was much more “tolerant” than their subjective sensations of the environment. This finding reveals the complex relationship between thermal perception and thermal adaptation: participants’ thresholds for subjective acceptability were significantly higher than their subjective sensation ratings, clearly demonstrating fundamental differences in the evaluation scales between subjective acceptability and sensation. This discrepancy may stem from psychological adaptation mechanisms and long-term thermal exposure tolerance, a finding that holds significant implications for understanding human thermal comfort evaluation mechanisms.
Figure 8 shows the frequency distributions of the participants’ sensations (thermal, humidity, and draft sensations) in mixed-use blocks A–D. In terms of thermal sensation, most participants felt “warm” and “hot”. Block A has the highest proportion at 93.8%, followed by blocks D (88.8%), C (72.7%), and B (69.5%). In addition, only a few participants felt “neutral” in blocks B and C, at 8.3% and 9.1%, respectively. Furthermore, 5.5% of participants felt “slightly cool” in block B, which may be related to the psychological effects of narrow alleys and shaded trees. Regarding humidity sensation, the proportion of the two modern mixed-use blocks A and B was mainly concentrated in “wet” and “very wet”, accounting for 87.6% and 74%, respectively. However, for the two modern mixed-use blocks C and D, humidity sensation was considerably reduced between “wet” and “very wet”, whereas that in mixed-use block D was mainly “neutral”, accounting for 63.3%. Notably, the block form and environment have a substantial impact on the participants’ humidity sensation. However, the relative humidity difference between the four blocks was insignificant. In terms of draft sensation, most participants in blocks A, C, and D felt that the air velocity was “slightly weak”, accounting for 37.5%, 28.7%, and 28%, respectively. However, in block B with dense texture and narrow alleys, 38.9% of participants felt “neutral” and 27.8% felt “strong”, indicating that the air pressure generated by narrow alleys increases airflow and affects participants’ draft sensation.
Figure 9 shows the frequency distributions of participants’ subjective preferences in the four mixed-use blocks. Owing to the high temperature during the summer, participants in the four mixed-use blocks preferred to be cooler, accounting for 93.7%, 86.1%, 93.9%, and 97.5% in mixed-use blocks A–D, respectively. In terms of humidity preference, most participants preferred to be drier in the four mixed-use blocks. The humidity preference accounted for 87.5% in mixed-use block A, which was the highest, followed by mixed-use blocks C, B, and D (72.7%, 55.6%, and 55%, respectively). However, almost half of the participants in mixed-use block D (45%) preferred no change in relative humidity, although their humidity sensation was high, likely owing to the residents’ high tolerance towards the thermal environment. As for air velocity preference, more than half of the participants across all four mixed-use blocks preferred strong air velocity, with as many as 90% of those in block D expressing this preference, likely due to the hot and humid climate. In addition, 30.6% of participants in block B preferred constant air velocity, the highest percentage among the blocks, echoing aligning with their “neutral” draft sensation.
Figure 10 shows the frequency distributions of participants’ acceptability in the four mixed-use blocks. More than half of the participants in mixed-use blocks A, B, and D believed that the thermal environment was above “neutral” acceptance, accounting for 68.8% in mixed-use block A, 58.4% in block B, and 85% in block D. Furthermore, 65% of the participants in block D felt that the thermal environment was “acceptable”. In addition, 66.7% of the participants in block C had a thermal acceptance level below “neutral”, and the majority were at “slightly unacceptable”, accounting for 54.5%.

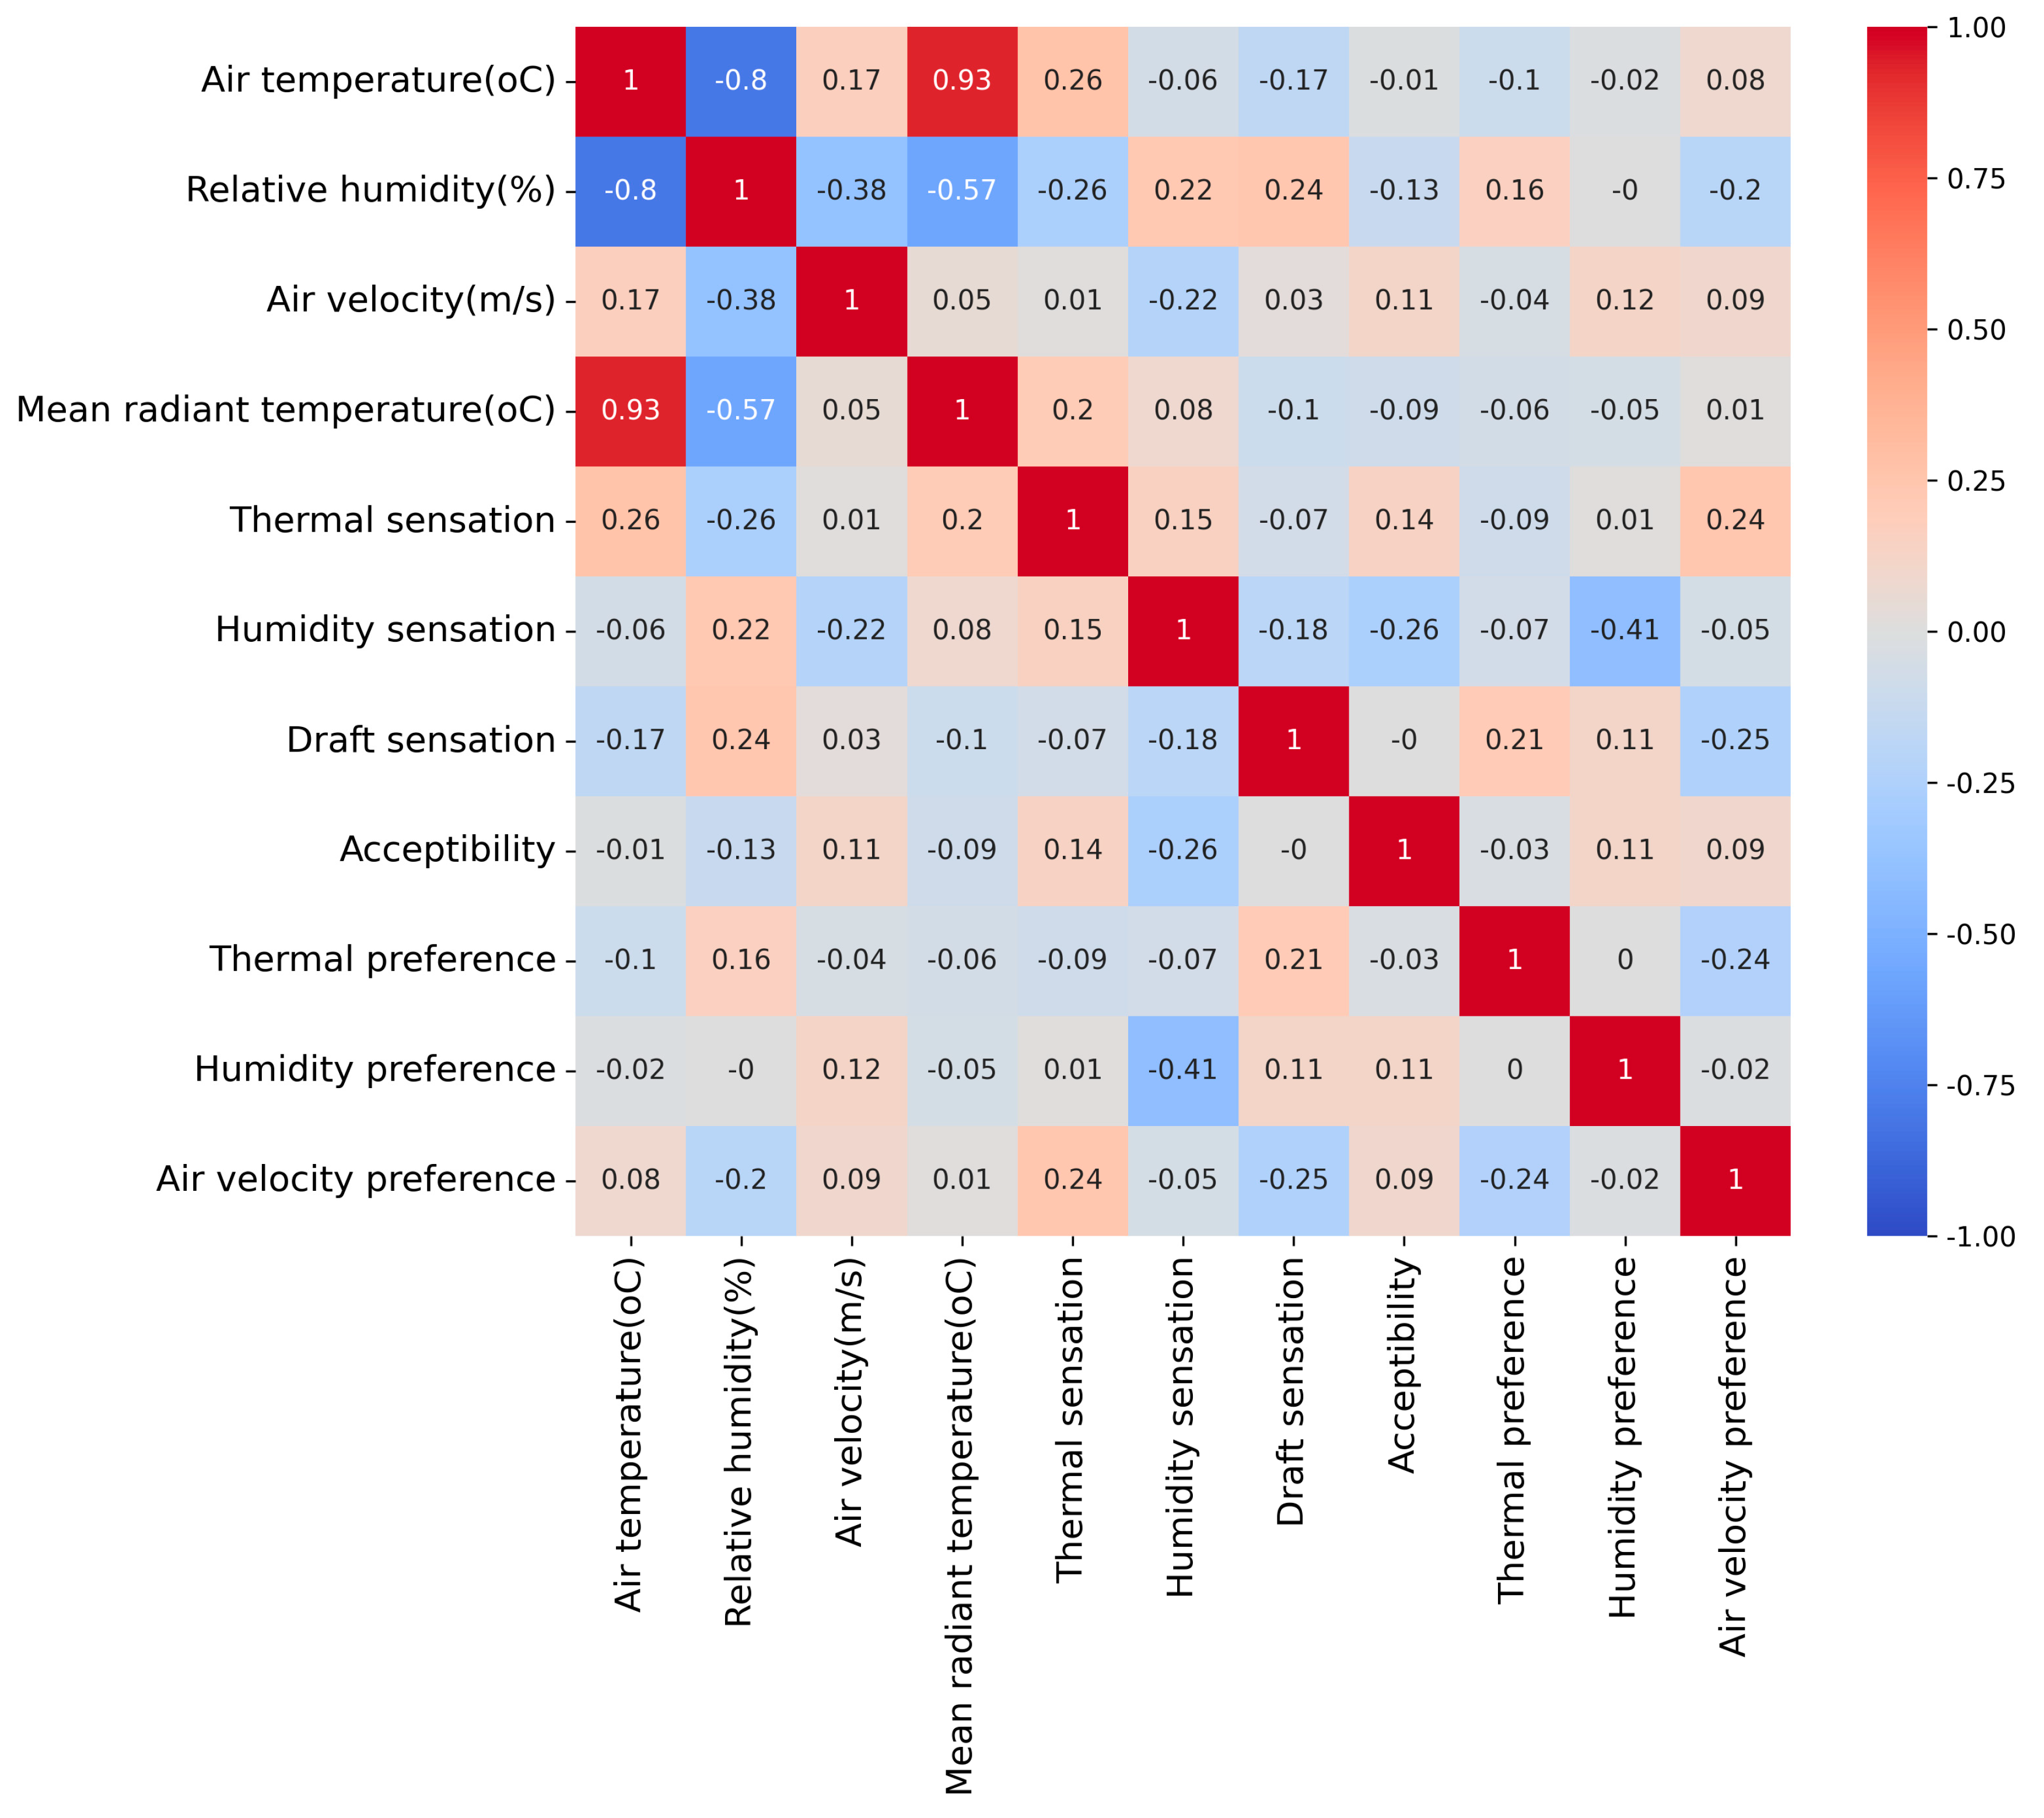
3.4. The Relationship Between Indicators of Thermal Environment and Subjective Perception

Figure 11 visually presents the correlation matrix between thermal environment indicators and subjective perception indicators through a heatmap. It reveals a strong positive correlation between air temperature and mean radiant temperature (r2 = 0.93, p < 0.01), confirming their synergistic variation pattern in outdoor thermal environments. Simultaneously, a significant negative correlation exists between air temperature and relative humidity (r2 = −0.80, p < 0.01), consistent with the inverse temperature-humidity relationship principle in thermodynamics. In addition, thermal environment indicators show weak correlations with their directly corresponding subjective perception dimensions, such as air temperature vs. thermal sensation (r2 = 0.26) and relative humidity vs. humidity sensation (r2 = 0.22). However, cross-dimensional analysis indicates potential interactive effects between environmental parameters and non-corresponding perception indicators, exemplified by relative humidity vs. air movement sensation (r2 = 0.24) and air temperature vs. air movement sensation (r2 = −0.17). These findings demonstrate the nonlinear characteristics of human thermal perception systems, suggesting that the relationship between thermal environmental stimuli and subjective perception is not a simple one-to-one mapping. Rather, it may be mediated by multiple factors including psychological adaptation and behavioral adjustment mechanisms.

3.5. The Connection Between Thermal Environment, Subjective Sensation, and Subjective Preference

Using data from 141 questionnaire responses, Figure 12 displays the correlation between thermal environmental indicators and subjective sensation and preference, revealing the threshold values for subjective reactions to objective parameters.
Figure 12a illustrates the connection between air temperature/mean radiant temperature and both thermal sensation and preference. Due to the high air temperature and mean radiant temperature in the four mixed-use blocks, the corresponding thermal sensation values were in the range of “warm” (TSV > 1.5). Among them, block A with the highest air temperature and mean radiant temperature (32.3 °C and 33.9 °C) had the highest thermal sensation value of 2.5. In contrast, block B, which had the lowest air temperature and mean radiant temperature (31.2 °C and 32.3 °C) corresponded to the lowest thermal sensation value of 1.7, reflecting the conventional correspondence between temperatures and thermal sensation. However, block D had a thermal sensation 0.8 higher than block B, reaching 2.5, despite similar temperature, indicating that thermal sensation is influenced not only by temperature but also by other factors, such as additional thermal environmental elements and block morphology. As a contemporary block, the street width and building height of block D were several times higher than that of modern block B, which may be a factor affecting the differences in participants’ thermal sensations. In terms of thermal preference, the values for the four mixed-use blocks were between −0.8 and −1, indicating that participants preferred cool temperatures, which corresponded to the high temperatures and thermal sensation values.
Figure 12b presents the connection between relative humidity, humidity sensation, and humidity preference. Block A recorded the highest humidity sensation value at 2.1 (wet), followed by block B (1.0), block C (0.8), and block D (0.4). In addition, the relative humidity of block A was 66.7%, ranking second among the four blocks, whereas block B had the highest relative humidity, reaching 73.8%. No complete correspondence was observed between the relative humidity and humidity sensation, which means that the humidity sensation may be influenced by other factors and result in sensory bias. For example, the high temperature in block A created a high-temperature and highly humid environment, which may affect the participants’ sensation of relative humidity. In addition, sweating during walking in such an environment could also lead to incorrect judgment of humidity sensations. Minimal difference was observed in humidity preference values among the four blocks, and participants preferred to be dry, which corresponded to high relative humidity and humidity sensation values.
Figure 12c illustrates the connection between draft sensation and air velocity preference. Regarding draft sensation, block B with the lowest wind speed (0.25 m/s) had the highest draft sensation value, which was −0.1 (neutral). By contrast, the air velocities in other mixed-use blocks were higher than that in block B, but their draft sensations were only between −0.8 and −0.9 (slightly weak). This indicated that the connection between air velocity and draft sensation was inconsistent, with several factors at play, including the walking speed and direction of the participants, as well as wind speed, direction, and the spatial perception of the alley. For example, block B gave people a sense of openness and quiet space, which was consistent with the perception given by a space with low air velocity. Therefore, participants felt that the air velocity in block B was moderate although low. By contrast, blocks C and D were contemporary blocks with towering buildings, giving people a sense of closure and noise, which was consistent with the perception given by a space with high air velocity. However, the actual air velocity did not reach the value perceived by the participants, resulting in low draft sensation. Regarding air velocity preference, participants in all four blocks preferred strong air velocity, and their values were negatively correlated with draft sensation.

3.6. Connection Between Thermal Environment and Subjective Acceptability

The previous analysis indicates that subjective perception was affected by the thermal environment. To investigate the specific factors and their impact further, a multiple linear regression analysis was performed on the indicators between the thermal environment and subjective acceptability. In this study, SPSS v22.0 software was utilized to analyze the influence and weight of the indicators. Thermal environmental factors such as air temperature, relative humidity, air velocity, and mean radiant temperature were treated as independent variables, while subjective acceptability was considered the dependent variable.
The linear regression analysis between the subjective acceptability indicators and the thermal environment is presented in Table 7, with the linear regression model outlined in Equation (2). Based on the adjusted R2 evaluation criteria, the connection between subjective acceptability and the thermal environment (air temperature, relative humidity, air velocity, and mean radiant temperature) demonstrated a good fit (adjusted R2 = 0.720). Additionally, the F-test yielded a significant result (F = 58.711, p < 0.001), indicating that the thermal environment affects subjective acceptability. Moreover, the variance inflation factor values for all indicators, which assess multicollinearity among variables, were below 5, confirming that the linear regression model is solid and free from multicollinearity issues. The p-value (significance analysis), which, for air temperature, relative humidity, and mean radiant temperature were below 0.05, indicated their relevance to subjective acceptability. Thus, a multiple linear regression model correlating subjective acceptability indicators and the thermal environment was established, as described in Equation (2). In addition, the coefficient B value denotes the weight of the indicators, with the positive or negative sign indicating the trend of their impact on overall satisfaction [38]. The model illustrates that air temperature and mean radiant temperature carry a greater weight with a B value of −0.182 and 0.210, respectively, while relative humidity has a lower weight of −0.061. Furthermore, the influences of air temperature and relative humidity are negative, indicating that higher values correspond to lower subjective acceptability.
Sa = 2.543 − 0.182Ta − 0.061RH + 0.091Va + 0.210Tr
Dependent variable: Sa, subjective acceptability; independent variable: Ta, air temperature; RH, relative humidity; Va, air velocity; Tr, mean radiant temperature.

4. Discussion

4.1. Impact of Climatic Factors on Thermal Comfort

This study was carried out in a region characterized by consistently hot–humid conditions throughout the year. As a result, participants in such climates developed a strong tolerance for high temperatures and relative humidity, contributing to their generally high levels of satisfaction and acceptance of the thermal environment [33]. This observation aligns with findings from various studies conducted in similar hot–humid climates [39,40,41,42]. Regarding climatic factors, air temperature and mean radiant temperature had a prominent impact on thermal comfort, and the changes in thermal sensation and thermal preference were closely related to the variations in them, as depicted in Figure 12a. Additionally, the linear regression analysis showed that air temperature and mean radiant temperature remarkably influenced subjective acceptability, as shown in Table 7. This viewpoint is supported by the thermal comfort study in residential areas from Adunola [43], who proposed that the temperature was a critical factor in determining respondents’ comfort levels. Similarly, Humphreys [44] noted that in most thermal comfort studies, temperature accounts for a larger portion of the variation in responses compared to changes in other climatic factors. Regarding the effect of relative humidity on thermal comfort, high humidity often coincides with high temperatures, leading to moisture-saturated air and a rise in temperature, which worsens thermal comfort. Additionally, high humidity hinders the body’s ability to dissipate metabolic by inhibiting evaporation, particularly in hot and humid conditions, where heat storage builds up during physical activity. As a result, reduced evaporate cooling intensifies thermal strain and heat retention, making it difficult for sweat to evaporate from the skin, which leads participants to mistakenly believe that the environmental humidity has increased, thereby distorting their judgment of humidity perception. This discrepancy highlights the difference between skin humidity and environmental humidity, and similar findings have been supported by other research [45,46,47]. These findings necessitate a multidimensional evaluation framework for future thermal comfort studies, advocating synchronized monitoring of physiological indicators (e.g., skin conductance, sweat evaporation rate) and environmental parameters to better decipher the interaction between objective measurements and subjective humidity perception. The influence of air velocity on thermal comfort follows a similar pattern. The interaction between air movement caused by walking and the surrounding air velocity leads to reduced perception ability of air velocity, as shown in Figure 11. Some studies have shown the influences of air movement on outdoor thermal comfort, incorporating these findings into thermal comfort optimization and thermal environment regulation [48,49,50,51,52].

4.2. Effect of Urban Morphology on Thermal Comfort

This study identified discrepancies between thermal environments and subjective perceptions across four mixed-use blocks. For instance, block D had an air temperature of only 0.6 °C higher than block B, yet 66.3% of respondents in block D reported “hot” thermal sensations—nearly three times higher than block B. Excluding climatic influences, these thermal comfort disparities correlated with urban form characteristics, including block texture and street height-to-width ratios. It should be noted that this analysis excludes radiant temperature considerations for two key reasons: First, this study focuses on comparing modern vs. contemporary street configurations’ impacts on outdoor comfort. Radiant temperature is highly variable due to solar radiation and surface reflectivity (building facades and ground materials), making it unsuitable for the stable characterization of inherent thermal properties in urban forms. Second, air temperature demonstrates greater spatial and temporal stability due to environmental buffering effects, providing a more reliable indicator of systematic thermal impacts from street dimensions (e.g., height-to-width ratios, and orientations). Thus, this analysis emphasizes air temperature, relative humidity, and air velocity while excluding transient radiative interference to highlight essential relationships between urban form and thermal comfort.
Using the classic method by Yoshinobu Ashihara, the street height-to-width ratios (D/H) were calculated by measuring building heights (H) and street widths (D) in the four blocks. Results showed D/H of 2.0:1, 1.4:1, 0.6:1, and 0.3:1 for blocks A–D, respectively. Ashihara’s spatial perception experiments [53,54] indicate that D/H > 1 enhances perceived openness significantly, while a lower ratio increases enclosure perception. Topological analysis reveals modern blocks A and B exhibited higher street network density (≥12 primary intersections/km2) compared to contemporary blocks C and D (≥8 intersections/km2), as shown in Figure 13. Correlating height-to-width ratios with thermal data (as shown in Table 8) confirmed that block D (D/H < 1) recorded the highest average thermal sensation value despite an average air temperature of only 31.8 °C. Conversely, traditional block B (D/H > 1) showed higher relative humidity but lower humidity sensation scores, along with the highest draft sensation value despite an average air velocity of 0.25 m/s. These findings align with Niachou K’s research [55] on canyon-like streets, which demonstrated that D/H between 0.5 and 0.65 creates wake interference reducing air velocity and draft sensation, while D/H > 0.65 enables stable airflow recirculation enhancing draft sensation. This confirms that street height-to-width ratios significantly influence thermal comfort, with D/H > 1 configurations demonstrating superior heat mitigation potential in hot and humid climates.

4.3. Suggestion for Improving Thermal Comfort in Mixed-Use Blocks

Based on the analysis of outdoor thermal comfort across the four mixed-use blocks, this study proposes the following recommendations for enhancing outdoor thermal comfort:
(1)
Street height-to-width ratio optimization: A desirable thermal environment and enhanced user comfort can be achieved when the street height-to-width ratio exceeds 0.65. Therefore, the street width should be appropriately increased while reducing the height of buildings on both sides. Based on the analysis of the relationship between block height-to-width ratio and thermal comfort in this study, the optimal ratio for vehicle lanes is 0.65–1.4. This range reduces wake interference according to Niachou K’s research, enhances airflow stability, and improves subjective comfort. Additionally, pedestrian walkways should maintain a ratio greater than 0.65 to facilitate stable air circulation and increase wind speed perception. As demonstrated in this study, block B with a 1.4:1 ratio (exceeding 0.65) provided significantly higher comfort levels compared to block D with a 0.3:1 ratio.
(2)
Street network density enhancement: High-density street networks improve ventilation efficiency and alleviate subjective thermal stress. According to this study, contemporary blocks should aim to increase their road network density to modern block levels. Statistical results show that modern blocks A and B had densities exceeding 12 streets/km2, while contemporary blocks C and D had densities between 8 and 12 streets/km2. Block B with high-density streets demonstrated optimal ventilation performance: despite high relative humidity (up to 73.8%), its wet sensation index remained low (1.0), as shown in Figure 13.
(3)
Strategic street orientation planning: Street orientation significantly affects air velocity and thermal comfort by interacting with prevailing wind directions. Streets should preferably align with dominant winds (e.g., east-west orientation for easterly winds), especially in areas with height-to-width ratios exceeding 0.65. Avoiding north–south orientations conflicting with dominant winds is crucial. The orientation design of modern block B in this study promoted air penetration, effectively improving perceived wind comfort.

4.4. Study Limitations and Suggestions for Future Research

First, the thermal environment indicators and participants’ information obtained from the on-site study were uncontrollable, resulting in irregularities and deficiencies in the variables used in this study. Second, the limitations of commercial and residential mixed-use block areas, study periods, as well as the number of measuring instruments available, influenced the sample size and distribution, which introduced sample bias and somewhat affected the precision and general applicability of the findings. In addition, the experimental instruments employed in this study, such as the globe thermometer, feature reduced dimensions compared to standard specifications. While it enhances response time, making the instruments more suitable for real-time monitoring scenarios, it inevitably results in a systematic underestimation of the radiative heat low as demonstrated experimentally in [56], with the consequent uncertainties in the evaluation of thermal discomfort and heat stress for pedestrians as demonstrated in [57]. Last, the participants in this study were all pedestrians, effectively supporting the subjective evaluation data of the study. However, detailed and targeted participant types, such as profession, age, and gender, were lacking, resulting in insufficient study granularity. To further enhance the precision and generalization of the study, critical parameters such as sample size, regional distribution, and survey period should be systematically accounted for in future studies. Meanwhile, the measurement protocols, instrument precision, and computational methodologies should be optimized and refined. Additionally, the diversity and quantity of participants during the sampling process are recommended to further expand, as well as to achieve data comparison and verification by multi-dimensional cross-analysis.

5. Conclusions

An outdoor thermal comfort evaluation of four mixed-use blocks in hot–humid climates was investigated between June and July. This study examined the thermal environment, individual information, and subjective perceptions, analyzing the correlation between these perceptions and environmental conditions. It also explored how climatic factors and morphological elements impacted outdoor thermal comfort. The key findings include the following:
(1)
The mean value of air temperature was 31.8 °C and the relative humidity was 65.8% in four mixed-use blocks, displaying the climate feature of high temperature and high humidity, highlighting challenges in achieving thermal comfort standards.
(2)
Although the subjective sensation and subjective preference differed among the four mixed-use blocks, they exhibited corresponding patterns. However, the average subjective acceptability was not affected by subjective sensations and preferences, presenting a “neutral” value in most blocks.
(3)
The indicators of thermal environment and subjective perception did not indicate simple linear relationships, as they were influenced by the interplay of various environmental factors, spatial layout, and psychological cognition. For instance, blocks B and D had comparable average temperatures but showed notable differences in thermal sensation.
(4)
Multiple linear regression analysis revealed that air temperature, mean radiant temperature, and relative humidity were the critical factors affecting subjective acceptability across the four blocks.
(5)
Urban morphology impacted outdoor thermal comfort substantially, where three critical morphological determinants—texture density, street height-to-width ratio (D/H), and orientation strategy—played pivotal regulatory roles.

Author Contributions

Conceptualization, Y.X. and X.H.; Data Curation, Y.X. and X.H.; Funding Acquisition, X.H.; Investigation, Y.X., X.H., Q.Z., M.Y. and Y.G.; Methodology, Y.X., X.H., Q.Z. and M.Y.; Software, Y.X. and Q.Z.; Writing—Original Draft, Y.X. and X.H.; Writing—Review and Editing, Y.X., X.H., Q.Z., M.Y. and Y.G. All authors have read and agreed to the published version of the manuscript.

Funding

This research was funded by the Ministry of Education Humanities and Social Science Project (No. 24YJC760044), the Guangdong Philosophy and Social Science Planning Project (No. GD21YYS03), and the Science and Technology Projects in Guangzhou (No. 2024A04J3741).

Data Availability Statement

The original contributions presented in this study are included in the article. Further inquiries can be directed to the corresponding author.

Acknowledgments

We sincerely thank the participants who volunteered for this survey.

Conflicts of Interest

The authors declare no conflicts of interest.

References

  1. Hirt, S.A. Rooting out mixed use: Revisiting the original rationales. Land Use Policy 2016, 50, 134–147. [Google Scholar] [CrossRef]
  2. Campbell, S. Green cities, growing cities, just cities? Urban planning and the contradictions of sustainable development. J. Am. Plan. Assoc. 1996, 62, 296–312. [Google Scholar] [CrossRef]
  3. Jacobs, J. The Death and Life of Great American Cities; Random House: New York, NY, USA, 1961. [Google Scholar]
  4. Wickersham, J. Jane Jacobs’s Critique of Zoning: From Euclid to Portland and Beyond. Boston Coll. Environ. Aff. Law Rev. 2001, 28, 547–563. [Google Scholar]
  5. Javadi, R.; Nasrollahi, N. Urban green space and health: The role of thermal comfort on the health benefits from the urban green space: A review study. Build. Environ. 2021, 202, 108039. [Google Scholar] [CrossRef]
  6. Liu, W.; Zhang, Y.; Deng, Q. The effects of urban microclimate on outdoor thermal sensation and neutral temperature in hot-summer and cold-winter climate. Energy Build. 2016, 128, 190–197. [Google Scholar] [CrossRef]
  7. Zheng, X.; Chen, L.; Yang, J. Simulation framework for early design guidance of urban streets to improve outdoor thermal comfort and building energy efficiency in summer. Build. Environ. 2023, 228, 109815. [Google Scholar] [CrossRef]
  8. Chen, L. Studies of thermal comfort and space use in an urban park square in cool and cold seasons in Shanghai. Build. Environ. 2015, 94, 644–653. [Google Scholar] [CrossRef]
  9. Huang, K.T. Impact of street canyon typology on building’s peak cooling energy demand: A parametric analysis using orthogonal experiment. Energy Build. 2017, 154, 448–464. [Google Scholar] [CrossRef]
  10. Alijani, S.; Pourahmad, A.; Nejad, H.H.; Ziari, K.; Sodoudi, S. A new approach of urban livability in Tehran: Thermal comfort as a primitive indicator. Case study, district 22. Urban Clim. 2020, 33, 100656. [Google Scholar] [CrossRef]
  11. Rundell, K.W. Effect of air pollution on athlete health and performance. Br. J. Sports Med. 2012, 46, 407–412. [Google Scholar] [CrossRef]
  12. Kenney, W.L.; Wolf, S.T.; Dillon, G.A.; Berry, C.W.; Alexander, L.M. Temperature regulation during exercise in the heat: Insights for the aging athlete. J. Sci. Med. Sport 2020, 24, 739–746. [Google Scholar] [CrossRef] [PubMed]
  13. ANSI/ASHRAE Standard 55-2023; Thermal Environmental Conditions for Human Occupancy. American Society of Heating, Refrigerating and Air Conditioning Engineers, Inc.: Atlanta, GA, USA, 2023.
  14. Guo, T.; Lin, Z.; Zhao, Y.; Fang, Z.; Fan, Y.; Zhang, X.; Yang, J.; Li, Y. Investigation and optimization of outdoor thermal comfort in elementary school campuses: Example from a humid-hot area in China. Build. Environ. 2024, 248, 111055. [Google Scholar] [CrossRef]
  15. Khalili, S.; Fayaz, R.; Zolfaghari, S.A. Analyzing outdoor thermal comfort conditions in a university campus in hot-arid climate: A case study in Birjand, Iran. Urban Clim. 2022, 43, 101128. [Google Scholar] [CrossRef]
  16. Huang, Z.; Cheng, B.; Gou, Z.; Zhang, F. Outdoor thermal comfort and adaptive behaviors in a university campus in China’s hot summer-cold winter climate region. Build. Environ. 2019, 165, 106414. [Google Scholar] [CrossRef]
  17. Li, Z.; Zhou, L.; Hong, X.; Qiu, S. Outdoor thermal comfort and activities in urban parks: An experiment study in humid subtropical climates. Build. Environ. 2024, 253, 111361. [Google Scholar] [CrossRef]
  18. Bian, G.; Gao, X.; Zou, Q.; Cheng, Q.; Sun, T.; Sha, S.; Zhen, M. Effects of thermal environment and air quality on outdoor thermal comfort in urban parks of Tianjin, China. Environ. Sci. Pollut. Res. 2023, 30, 97363–97376. [Google Scholar] [CrossRef]
  19. Wei, D.; Yang, L.; Bao, Z.; Lu, Y.; Yang, H. Variations in outdoor thermal comfort in an urban park in the hot-summer and cold-winter region of China. Sustain. Cities Soc. 2022, 77, 103535. [Google Scholar] [CrossRef]
  20. Su, Y.; Wang, C.; Li, Z.; Meng, Q.; Gong, A.; Wu, Z.; Zhao, Q. Summer outdoor thermal comfort assessment in city squares-A case study of cold dry winter, hot summer climate zone. Sustain. Cities Soc. 2024, 101, 105062. [Google Scholar] [CrossRef]
  21. Manavvi, S.; Rajasekar, E. Assessing thermal comfort in urban squares in humid subtropical climate: A structural equation modelling approach. Build. Environ. 2023, 229, 109931. [Google Scholar] [CrossRef]
  22. Jamei, E.; Rajagopalan, P.; Seyedmahmoudian, M.; Jamei, Y. Review on the impact of urban geometry and pedestrian level greening on outdoor thermal comfort. Renew. Sustain. Energy Rev. 2016, 54, 1002–1017. [Google Scholar] [CrossRef]
  23. Lai, D.; Liu, W.; Gan, T.; Liu, K.; Chen, Q. A review of mitigating strategies to improve the thermal environment and thermal comfort in urban outdoor spaces. Sci. Total Environ. 2019, 661, 337–353. [Google Scholar] [CrossRef]
  24. Lin, J.; Brown, R.D. Integrating microclimate into landscape architecture for outdoor thermal comfort: A systematic review. Land 2021, 10, 196. [Google Scholar] [CrossRef]
  25. Shui, X.; Xiao, Y.; Chen, X.; Lei, Y. Study on the Function System of Internal Roads in Commercial and Residential Blocks in Urban Centers. Archit. Cult. 2019, 4, 153–154. [Google Scholar]
  26. Zhou, L.; Wang, C.; Zhen, F. Exploring and evaluating the spatial association between commercial and residential spaces using Baidu trajectory data. Cities 2023, 141, 104514. [Google Scholar] [CrossRef]
  27. Zhou, L.; Liu, M.; Zheng, Z.; Wang, W. Quantification of spatial association between commercial and residential spaces in Beijing using urban big data. Int. J. Geo-Inf. 2022, 11, 249. [Google Scholar] [CrossRef]
  28. Ma, J.; Gao, Y.; Lv, X. Renewal and Activation Strategy of Traditional Commercial and Residential Blocks in Old Town Regeneration: Taking Beimen Block of Yuncheng County as an Example. Archit. Cult. 2021, 2, 218–221. [Google Scholar]
  29. Zheng, W.; Huang, Y. A Study on the Functional Mixing Types and Distribution of Blocks Based on MXI Measures: The Case of Nanjing Old City Area. New Archit. 2024, 3, 136–141. [Google Scholar]
  30. Dai, M.; Wang, W.; Hu, C. Characteristics of Particulate Matter Distribution in Business and Residence Mixed Blocks and Influence on Building Layout-Taking Binhu Block in Hefei City as an Example. Hous. Sci. 2023, 43, 44–56. [Google Scholar]
  31. Monthly Element Statistics of Compilation for 30 Years (1991–2020). 2021. Guangzhou Weather. Available online: http://www.tqyb.com.cn/gz/climaticprediction/static (accessed on 23 March 2025).
  32. Zheng, L. Research on the Influence of Urban Geometric Morphological Factors on the Heat Island Effect in Guangzhou City. Master’s Thesis, Jinan University, Guangzhou, China, 2020. [Google Scholar]
  33. Huang, X.; Xun, Y.; Zhao, C.; Chen, G.; Guo, W. Comparative study on thermal comfort of sports buildings in hot and humid climates from the perspective of exercisers and non-exercisers. Build. Environ. 2023, 246, 110980. [Google Scholar] [CrossRef]
  34. JGJ/T347-2014; Standard of Test Methods for Thermal Environment of Building. Architecture & Building Press: Beijing, China, 2014.
  35. Nikolopoulou, M.; Baker, N.; Steemers, K. Improvements to the globe thermometer for outdoor use. Archit. Sci. Rev. 1999, 42, 27–34. [Google Scholar] [CrossRef]
  36. ISO 7726: 1998; Ergonomics of the Thermal Environment—Instruments for Measuring Physical Quantities. International Organization for Standardization: Geneva, Switzerland, 1998.
  37. ISO 7730: 2005; Ergonomics of the Thermal Environment-Analytical Determination and Interpretation of Thermal Comfort Using Calculation of the PMV and PPD Indices and Local Thermal Comfort Criteria. International Organization for Standardization: Geneva, Switzerland, 2005.
  38. Huang, X.; Chen, G.; Zhao, C.; Peng, Y.; Guo, W. Post occupancy evaluation of indoor environmental quality of sports buildings at hot and humid climate from the perspective of exercisers. Build. Environ. 2022, 226, 109760. [Google Scholar] [CrossRef]
  39. Talukdar, M.S.J.; Talukdar, T.H.; Singh, M.K.; Baten, M.A.; Hossen, M.S. Status of thermal comfort in naturally ventilated university classrooms of Bangladesh in hot and humid summer season. J. Build. Eng. 2020, 32, 101700. [Google Scholar] [CrossRef]
  40. Damiati, S.A.; Zaki, S.A.; Rijal, H.B.; Wonorahardjo, S. Field study on adaptive thermal comfort in office buildings in Malaysia, Indonesia, Singapore, and Japan during hot and humid season. Build. Environ. 2016, 109, 208–223. [Google Scholar] [CrossRef]
  41. Deevi, B.; Chundeli, F.A. Quantitative outdoor thermal comfort assessment of street: A case in a warm and humid climate of India. Urban Clim. 2020, 34, 100718. [Google Scholar] [CrossRef]
  42. Elnabawi, M.H.; Hamza, N.; Dudek, S. Thermal perception of outdoor urban spaces in the hot arid region of Cairo, Egypt. Sustain. Cities Soc. 2016, 22, 136–145. [Google Scholar] [CrossRef]
  43. Adunola, A.O. Evaluation of urban residential thermal comfort in relation to indoor and outdoor air temperatures in Ibadan, Nigeria. Build. Environ. 2014, 75, 190–205. [Google Scholar] [CrossRef]
  44. Humphreys, M. Field studies of thermal comfort compared and applied. Build. Serv. Eng. 1976, 44, 5–27. [Google Scholar]
  45. Lei, T.H.; Wang, F. Looking ahead of 2021 Tokyo Summer Olympic Games: How Does Humid Heat Affect Endurance Performance? Insight into physiological mechanism and heat-related illness prevention strategies. J. Therm. Biol. 2021, 99, 102975. [Google Scholar] [CrossRef]
  46. Vargas, N.T.; Chapman, C.L.; Johnson, B.D.; Gathercole, R.; Schlader, Z.J. Skin wettedness is an important contributor to thermal behavior during exercise and recovery. Am. J. Physiol. Soc. 2018, 315, 925–933. [Google Scholar] [CrossRef]
  47. Hayes, M.; Castle, P.C.; Ross, E.Z.; Maxwell, N.S. The influence of hot humid and hot dry environments on intermittent-sprint exercise performance. Int. J. Sports Physiol. Perform. 2014, 9, 387–396. [Google Scholar] [CrossRef]
  48. Jia, X.; Wang, J.; Zhu, Y.; Ji, W.; Cao, B. Climate chamber study on thermal comfort of walking passengers at different moving speeds. Build. Environ. 2022, 224, 109540. [Google Scholar] [CrossRef]
  49. Zhou, J.; Zhang, X.; Xie, J.; Liu, J. Effects of elevated air speed on thermal comfort in hot-humid climate and the extended summer comfort zone. Energy Build. 2023, 287, 112953. [Google Scholar] [CrossRef]
  50. Zhou, J.; Zhang, X.; Xie, J.; Liu, J. Occupant’s preferred indoor air speed in hot-humid climate and its influence on thermal comfort. Build. Environ. 2023, 229, 109933. [Google Scholar] [CrossRef]
  51. Jia, X.; Wang, J.; Zhu, Y.; Ji, W.; Cao, B. Cooling effect of elevated ambient air velocity on thermal comfort when sitting after walking. Build. Environ. 2022, 225, 109664. [Google Scholar] [CrossRef]
  52. Mihara, K.; Sekhar, C.; Tham, K.W.; Takemasa, Y.; Lasternas, B. Effects of temperature, air movement and initial metabolic rate on thermal sensation during transient state in the tropics. Build. Environ. 2019, 155, 70–82. [Google Scholar] [CrossRef]
  53. Ashihara, Y. The Aesthetic Townscape; The MIT Press: Cambridge, MA, USA, 1986. [Google Scholar]
  54. Fazia, A.; Helmut, M. Numerical Study on the Effects of Aspect Ratio and Orientation of an Urban Street Canyon on Outdoor Thermal Comfort in Hot and Dry Climate. Build. Environ. 2006, 41, 94–108. [Google Scholar]
  55. Niachou, K.; Livada, I.; Santamouris, M. Experimental Study of Temperature and Airflow Distribution inside an Urban Street Canyon during Hot Summer Weather Conditions. Part I: Air and surface temperature. Build. Environ. 2008, 43, 1383–1392. [Google Scholar] [CrossRef]
  56. Alfano, F.R.D.; Dell’Isola, M.; Ficco, G.; Palella, B.I.; Riccio, G. Small globes and pocket heat stress meters for WBGT and PHS evaluations. A critical analysis under controlled conditions. Build. Environ. 2022, 226, 109781. [Google Scholar] [CrossRef]
  57. Alfano, F.R.D.; Palella, B.I.; Riccio, G. The Role Of Measurement Accuracy On The Heat Stress Assessment According To ISO 7933: 2004. Environ. Health Risk IV 2007, 11, 115–124. [Google Scholar]
Figure 1. Climate conditions of Guangzhou, China.
Energies 18 02015 g001
Figure 2. Locations of the surveyed mixed-use blocks.
Energies 18 02015 g002
Figure 3. Block conditions of the four mixed-use blocks.
Energies 18 02015 g003
Figure 4. Measurement devices and their distribution in the mixed-use blocks.
Energies 18 02015 g004
Figure 5. Average value of thermal environment over time.
Energies 18 02015 g005aEnergies 18 02015 g005b
Figure 6. Behaviour proportion of participants in mixed-use blocks A–D.
Energies 18 02015 g006
Figure 7. Clothing ratio of participants in mixed-use blocks A–D.
Energies 18 02015 g007
Figure 8. Frequency distributions of participants’ sensation in mixed-use blocks A–D.
Energies 18 02015 g008
Figure 9. Frequency distributions of participants’ subjective preferences in mixed-use blocks A–D.
Energies 18 02015 g009
Figure 10. Frequency distributions of participants’ acceptability in mixed-use blocks A–D.
Energies 18 02015 g010
Figure 11. Relationship among indicators of thermal environment and subjective perception.
Energies 18 02015 g011
Figure 12. Connection between thermal environment and subjective sensation and preference: (a) air temperature and mean radiant temperature vs. thermal sensation and thermal preference; (b) relative humidity vs. humidity sensation and humidity preference; (c) air velocity vs. draft sensation and air velocity preference.
Energies 18 02015 g012
Figure 13. Block morphology analysis diagrams of the four mixed-use blocks.
Energies 18 02015 g013
Table 1. Outdoor thermal comfort indicators for the mixed-use blocks.
Thermal EnvironmentSubjective PerceptionIndividual Data
SensationPreferenceAcceptability
Air temperature (°C)Thermal sensationThermal preferenceSubjective
acceptability
Metabolic rate
Clothing insulation
Mean radiant temperature (°C)
Relative humidity (%)Humidity sensationHumidity preference
Air velocity (m/s)Draft sensationAir velocity preference
Table 2. Measurement devices information.
No.DeviceModelTesting ContentTitle 3
1Hot-wire anemometerTES-1341(TES Electrical Electronic Corp., Taiwan, China)Air temperature
Relative humidity
Air velocity
±0.4 °C
±3%RH
±3%rdg ± 1%FS
2Globe thermometerAZ-87786(AZ Instrument Corp., Taiwan, China)Globe temperature±0.6 °C
Table 3. Participants’ information.
MaleFemale
Number9362
Age16–78 (Average: 36)16–83 (Average: 36)
Duration of local residence (years)≥1≥1
ClothingShorts and trousersShorts, trousers and skirts
BehaviorSitting, standing, and walkingSitting, standing, and walking
Table 4. Subjective perception scale.
Thermal SensationHumidity SensationDraft SensationThermal PreferenceHumidity PreferenceAir Velocity PreferenceSubjective Acceptability
3HotVery wetVery strong Very acceptable
2WarmWetStrong Acceptable
1Slightly warmSlightly wetSlightly strongWarmerWetterMoreSlightly acceptable
0NeutralNeutralNeutralNo changeNo changeNo changeNeutral
−1Slightly coolSlightly drySlightly weakCoolerDrierLessSlightly unacceptable
−2CoolDryWeak Unacceptable
−3ColdVery dryVery weak Very unacceptable
Table 5. Values of thermal environment.
MaximumMinimumMeanStandard
Deviation
Air temperature (°C)37.529.631.81.7
Mean radiant temperature (°C)43.529.832.62.0
Relative humidity (%)81.848.865.87.4
Air velocity (m/s)2.290.010.480.41
Table 6. Average values of subjective perception in the four mixed-use blocks.
Subjective PerceptionAverage Value
Block ABlock BBlock CBlock D
SensationThermal sensation2.5 (Hot)1.7 (Warm)1.8 (Warm)2.5 (Hot)
Humidity sensation2.1 (Wet)1.0 (Slightly wet)0.8 (Slightly wet)0.4 (Neutral)
Draft sensation−0.8 (Slightly weak)−0.1 (Neutral)−0.8 (Slightly weak)−0.9 (Slightly weak)
PreferenceThermal preference−0.9 (Cooler)−0.8 (Cooler)−0.9 (Cooler)−1.0 (Cooler)
Humidity preference−0.8 (Drier)−0.6 (Drier)−0.7 (Drier)−0.6 (Drier)
Air velocity preference0.8 (Stronger)0.5 (Stronger)0.8 (Stronger)0.9 (Stronger)
AcceptabilitySubjective acceptability0.3 (Neutral)−0.3 (Neutral)−0.4 (Neutral)1.3 (Slightly acceptable)
Table 7. Multiple linear regression analysis between subjective acceptability and thermal environment.
IndicatorBpVIFAdjusted R2F
Air temperature−0.1820.001 *3.2610.72058.711 (p < 0.001)
Relative humidity−0.0610.004 *2.680
Air velocity0.0910.2101.351
Mean radiant temperature0.2100.001 *3.812
Constant2.5430.012-
* p < 0.05.
Table 8. Comparative analysis of street height-to-width ratios and thermal environment indicators.
BlockD/HTemperature AspectHumidity AspectAir Velocity Aspect
Air TemperatureThermal SensationRelative HumidityHumidity SensationAir
Velocity
Draft
Sensation
A2.0:133.42.566.72.10.38−0.8
B1.4:131.91.773.81.00.25−0.1
C0.6:132.41.861.40.80.72−0.8
D0.3:1322.561.60.40.58−0.9
Disclaimer/Publisher’s Note: The statements, opinions and data contained in all publications are solely those of the individual author(s) and contributor(s) and not of MDPI and/or the editor(s). MDPI and/or the editor(s) disclaim responsibility for any injury to people or property resulting from any ideas, methods, instructions or products referred to in the content.

