Abstract
Coalbed methane (CBM), a highly efficient and clean energy source with substantial reserves, holds significant development potential. Permeability is a crucial factor in CBM recovery in underground coal mines. Hydraulic fracturing technology causes water to enter the coal reservoir, which will change mechanical properties, affecting permeability changes and gas depletion trends. This study combines theoretical analysis with numerical simulation techniques to create a coupling model for fluid flow and reservoir deformation. The numerical model is established by referring to the geological conditions of the Wangpo coal mine, Shanxi province. Specifically, the impact of water immersion-induced softening and changes in the anisotropic mechanical properties on the directional permeability and gas flow rate is examined through parametric analysis. The dominant role in controlling the evolution of permeability varies depending on the orientation. Horizontal deformation primarily affects vertical permeability, which is subsequently influenced by the gas adsorption effect. In contrast, horizontal permeability is mainly determined by vertical deformation. Water immersion-induced softening significantly reduces the permeability and gas flow rate. Young’s modulus, which is dependent on water saturation, alters the permeability trend under water-rich conditions. Vertical permeability evolution is more sensitive to water-induced softening and changes in the anisotropic mechanical properties. When Sw0 is 0.7, the vertical permeability decreases by 60%, while the horizontal permeability decreases by 43%. Ultimately, the vertical permeability ratio stabilizes between 0.9 and 1.0, while the horizontal permeability ratio stabilizes in the range of 0.6 to 0.7. The influence of permeability on gas production characteristics is dependent on the water saturation conditions. In water-scarce conditions, variations in the fracture permeability greatly influence production flow rates. Conversely, in water-rich conditions, a higher permeability facilitates a quicker return to original levels and also enhances gas production flow rates. The research findings from this study provide important insights for fully understanding the mechanical properties of coal and ensuring the sustainable production of CBM.
1. Introduction
As the global energy structure transforms and the demand for clean energy increases, coalbed methane (CBM), which is regarded as an efficient and clean energy source, is receiving increasing attention. CBM is a distinctive gas resource linked to coal, primarily consisting of methane, which is categorized as an unconventional natural gas. Global CBM reserves are substantial, with the total amount of resources exceeding 260 trillion cubic meters [1]. Notably, ninety percent of these resources are concentrated in twelve principal coal-producing nations, including Russia, Canada, and China [2]. Developing CBM resources and using them on a large scale is of great significance to solving global energy shortages, improving the energy consumption structure, and improving environmental quality.
Permeability is a crucial factor in regulating the enrichment and optimal production of CBM. Coal permeability indicates the ability of a fluid to pass through any cracks and pores in the coal. Numerous researchers have extensively studied models of coal permeability, some of which are widely recognized [3,4]. Certain permeability models rely on porosity [5,6,7], others depend on stress [8], while there are models that may be either porosity-dependent or stress-dependent, influenced by varying stress–pore strain relationships, e.g., the Cui–Bustin model [9]. In addition, some scholars have proposed effective strain-based permeability models considering the interaction between the matrix and the fracture system [10]. However, permeability anisotropy is not taken into account in the above model. The coal reservoir exhibits significant heterogeneity due to the effects of sedimentary environments, diagenesis, and late structural changes, leading to prominent anisotropic permeability (i.e., permeability varies with direction) [11]. In recent years, a few permeability models have taken anisotropic characteristics into account; for example, Yang et al. [12] created an anisotropic permeability model using the poro-elastic approach, integrating it into finite element software to study its effect on gas transport in coal. Zhou et al. [13] introduced a novel anisotropic permeability model that considers the directional strain influenced by 3D formation stress. Li et al. [14] formulated an anisotropic permeability model, focusing on how coal responds to stress and how its fractures interact with the surrounding matrix. Li et al. [15] proposed a coal permeability model that incorporates the effects of stress compression and gas adsorption, allowing for the simulation of gas flow behavior in all directions within the coal.
The permeability of the coal reservoir also has strong stress sensitivity [16]. The mechanical properties of coal reservoirs influence the stress state of rocks [17], deeming the impact of coal’s mechanical properties on permeability characteristics a critical factor in the effective development of CBM [18]. Furthermore, coal is a type of sedimentary rock that is characterized by various structural planes, including bedding, foliation, and a random arrangement of natural fractures [19]. The degree of cementation between rock particles varies significantly, leading to pronounced anisotropic characteristics in the mechanical properties of coal [20]. These complex mechanical properties present substantial challenges for the development of coal gas resources. Currently, extensive research on the anisotropy of coal’s mechanical properties has been conducted using experimental methods such as rock triaxial macroscopic experiments, nano-indentation microscopic experiments, and acoustic experiments [21,22]. Nevertheless, a theoretical model of coal permeability that accounts for the anisotropy of the coal’s mechanical properties is lacking.
Coal reservoirs typically have an ultra-low permeability, low gas saturation, and high heterogeneity [23,24], impeding efficient gas depletion processes. Hydraulic methods, including fracturing and cutting, are commonly used to improve mine safety and CBM extraction [25]. Among these methods, hydraulic fracturing has been extensively adopted, pumping the high-pressure fluid into the reservoir to create a fracture network. In addition to the hydraulic fluid, formation water also exists in the coalbed reservoir. During the gas depletion process, the injected fluid first flows out; then, the gas is extracted [26]. The injected water can change the mechanical and transport properties of the coal reservoir. Currently, few permeability models consider the impact of water immersion-induced softening and anisotropy. Additionally, the influence of water on the efficiency of CBM production needs further investigation. To evaluate the effects of water on permeability, it is necessary to integrate water into the coal permeability model.
As mentioned above, the existence of water in the reservoir has the ability to change the mechanical properties of the coal, reducing its strength and altering its anisotropic properties. Meanwhile, its impact on the gas flow characteristics in the three directions is seldom addressed. As a result, the gas flow rate in underground coal mines cannot be predicted accurately. In summary, a theoretical model of coal permeability, which covers the impact of changing water-immersed mechanical properties, is urgently needed. To understand the influence of mechanical anisotropy in coal reservoirs on coal permeability, we first introduce a gas flow-reservoir deformation coupling model in Section 2 and Section 3 of this paper, considering the impact of the presence of water in the permeability model. Then, in Section 4, the coupled model is incorporated into a numerical model, which is established based on the geological conditions of Wangpo coal mine and solved using COMSOL Multiphysics (Version 5.4). Furthermore, the effect of coal mechanical anisotropy on coalbed methane production is displayed in Section 5, followed by the discussion part of this work, which is presented in Section 6. Finally, the conclusion is given in Section 7.
2. Conceptual Model
Long borehole technology (Figure 1a,b) is extensively employed to extract CBM in underground coal mines to guarantee safety and improve the utilization rate of greenhouse gas. CBM is typically stored in reservoirs that have a low porosity and low permeability. Hydraulic techniques, including hydraulic fracturing and cutting, are widely used to improve the efficiency of CBM production from coal reservoirs. This approach requires a large amount of water to crack the reservoir, creating new fractures or reactivating pre-existing natural fractures [27,28]. During this process, large amounts of hydraulic fluid are retained in the reservoir [29,30]. In addition to the hydraulic fluid, which is usually specified as water, the reservoir intrinsically contains some primitive water. Both the retained and formation water have the ability to change the transport and mechanical properties of the reservoir.
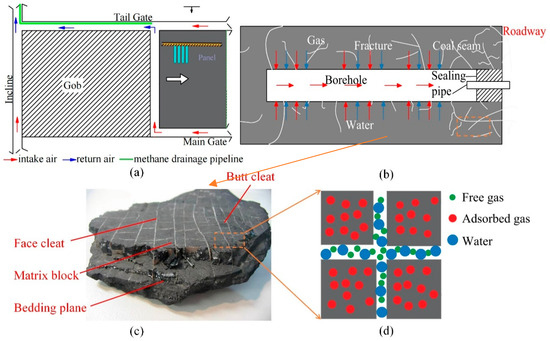
Figure 1.
Schematic illustration of the extraction of CBM in an underground coal mine. (a) The distribution of the work face, tunnel, and borehole; (b) the structure of the borehole; (c) the components of coal; (d) the water and gas storage state in the coal.
Additionally, coal reservoirs exhibit a diverse range of pore structures and gas storage characteristics [31]. The dual-porosity medium concept involves both fracture and matrix systems (as illustrated in Figure 1c,d); it is widely employed to describe the coupling process of poro-elastic behavior and multi-scaled fluid flow [32,33]. The gas stores are the free term in the fracture systems and the adsorption term in the matrix system. Linear Darcy flow characterizes the fracture system, while effective diffusion describes the gas transport within the matrix system. In addition to its heterogeneity, the coal reservoir also exhibits anisotropy in relation to both gas seepage efficiency and deformation characteristics. It is mutually agreed that the transport ability in the horizontal plane is significantly larger than that in the vertical plane [34]. Additionally, the modulus of elasticity in the horizontal direction exceeds that in the vertical direction [35].
2.1. The Impact of Water Presence on Transport and Mechanical Properties
Due to the complex pore topology, CBM reservoirs feature a totally different flow regime compared to conventional reservoirs. Darcy flow characterizes the direct relationship between seepage velocity and the pressure gradient, outlining the fluid dynamics within the fracture system. The gas slippage effect [36] or the Forchheimer [37] effect should be taken into consideration when the flow channel is much smaller or larger. Adsorption and desorption refer to the interactions between gaseous or aqueous molecules and the pore surface. There are some truly fascinating models for monolayer adsorption, such as the Langmuir model [38], as well as some multimolecule layer adsorption models such as the Brunauer–Emmett–Teller (BET) model [39]. For gas that is adsorbed within the matrix, the flow mechanism is described using effective diffusion, which typically combines Knudsen diffusion and bulk diffusion. As stated previously, both water and gas are present in the CBM reservoir, filling the gas flow channel. Therefore, the gas permeability when water and gas co-exist is dramatically smaller than when only gas is present. In this work, the relative permeability model is employed to describe the relationship between the relative permeabilities of both gas and water and water saturation.
As previously stated, water presence greatly diminishes Young’s modulus value, which has an inverse relationship with water content [40]. In reservoirs with minimal or no water, Young’s modulus is higher horizontally than vertically. This behavior stems from the distinct properties of coal, which contrast with those of well-cemented sedimentary rocks, owing to their discontinuous, uneven, anisotropic, and nonlinear elastic properties. Coal shows an enhanced deformation capacity when loads are applied perpendicular to the bedding plane. As moisture levels rise, the anisotropy ratios for Young’s modulus and hardness steadily decrease [41].
2.2. Gas Production Process
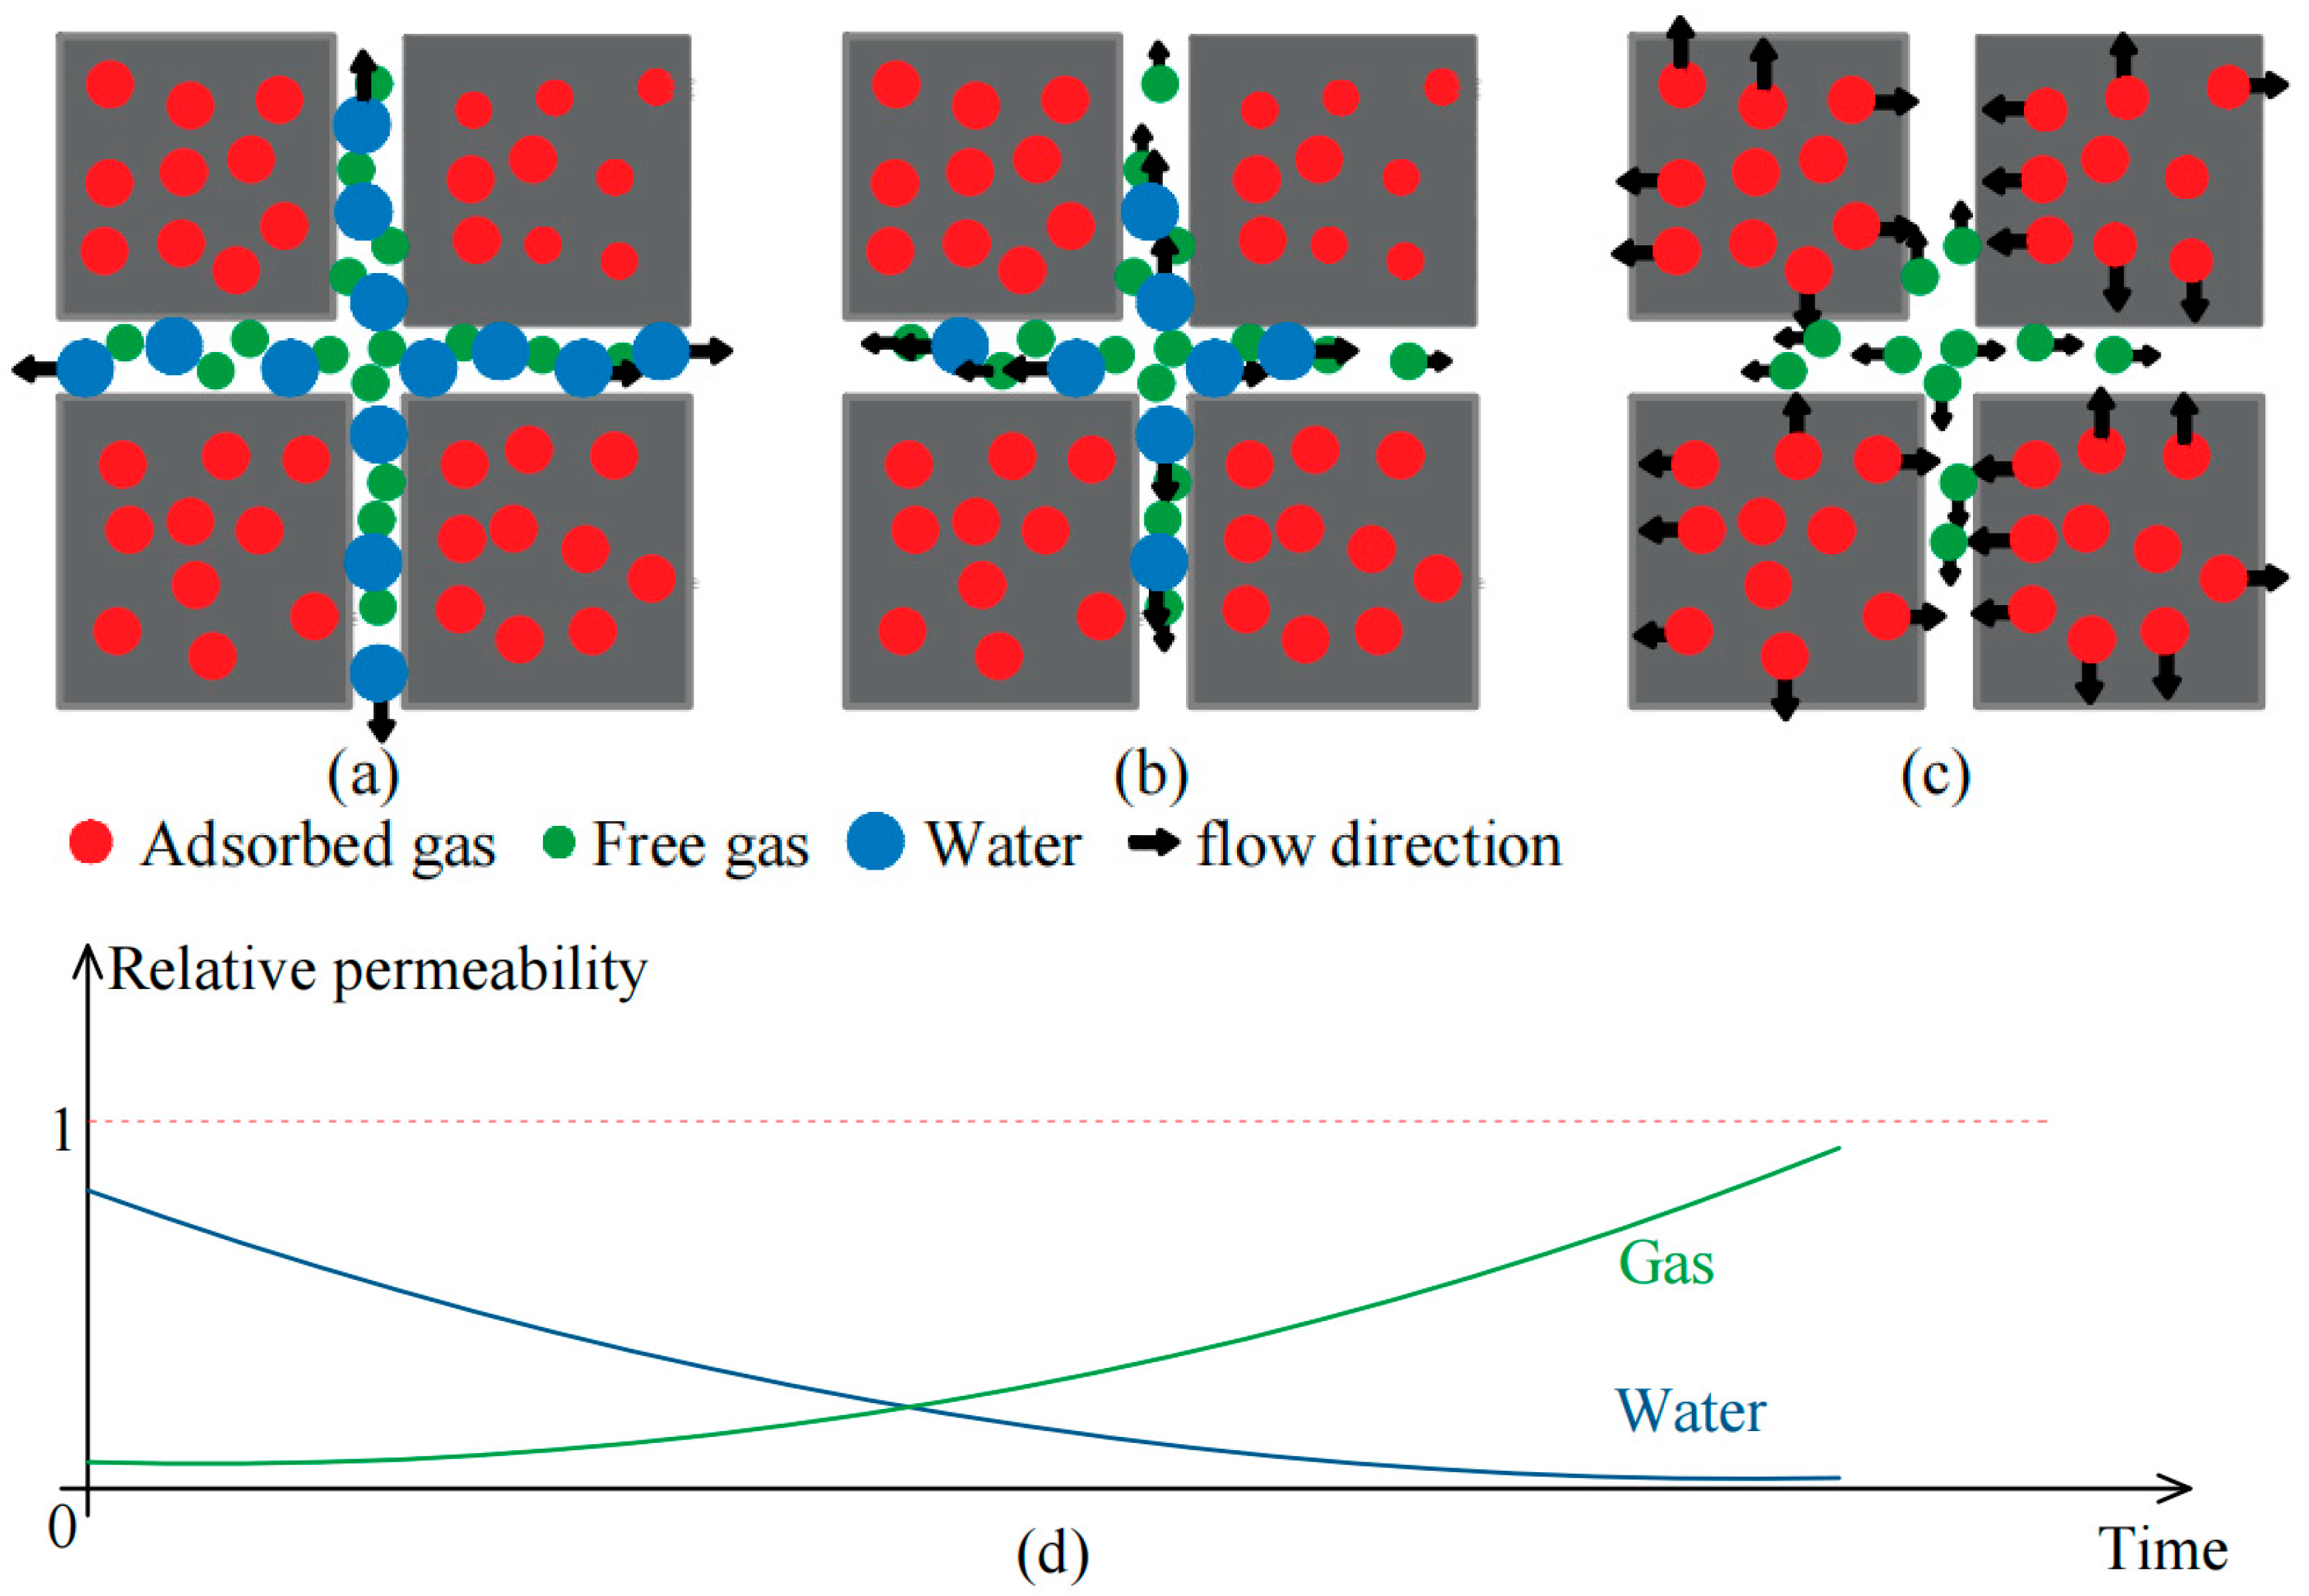
The gas depletion process can be divided into three stages based on the relative proportion of gas and water. The first stage involves the depletion pressure being above the gas desorption pressure; as a result, most gases remain in their original state and the water in the fracture network flows out (Figure 2a), forming the water single-phase flow. At the end of this stage, some of the free gas is dissolved in water and begins to move (Figure 2b) in a process known as bubble flow. Then, the fluid pressure continues to drop and is equal to or below the critical desorption pressure. The adsorbed gas begins to desorb and diffuses into the fracture (Figure 2c); additionally, some of the free gas depletes out due to the gas pressure gradient. At this stage, water flow remains predominant since water saturation exceeds gas saturation, resulting in a higher water relative permeability (Figure 2d). Throughout the depletion process, a significant amount of water is extracted, leading to decreased water saturation, diminished water relative permeability, and enhanced gas relative permeability (Figure 2d). This behavior also contributes to the rise in gas production. In this stage, the water flow changes from continuous flow to moisture transport. On the contrary, the gas content plays a dominant role. This stage comprises a significant portion of the overall depletion process.
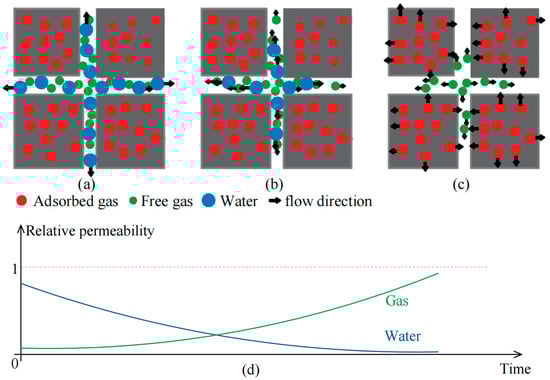
Figure 2.
Schematic illustration of the gas production process. (a) Stage I—bubble flow; (b) Stage II—water-dominant two-phase flow; (c) Stage III—gas-dominant two-phase flow; (d) relative permeabilities of gas and water.
3. Mathematical Model Governing Reservoir Deformation and Two-Phase Flow Processes
3.1. Governing Equation of the Mechanical Process
Coal is typically categorized into matrix and fracture systems; this is usually described as a dual-porosity model [42,43,44]. The body force in the coal reservoir should include the pore pressure and adsorption stress in both the fracture and matrix systems, and both of the forces swell the coal body. Referring to poro-elasticity theory, the constitutive relationship of the coal reservoir follows the Navier type, as follows [45,46]:
where G and K define the shear and bulk modulus of the coal reservoir, Pa; α signifies the Biot coefficient; p refers to the pore pressure, Pa; f represents the body force of the rock, Pa; u stands for the coal displacement, m; and ε indicates the adsorption strain. The subscripts f and m denote the fracture and matrix, respectively. The subscribed i represents three directions, the x-, y-, and z- directions. The following internal relationship exists: G = E/2(1 + v), K = E/3(1 − 2v), αm = 1 − Km/Ks, α = 1 − K/Km. v is Poisson’s ratio of coal; Km is the bulk modulus of the matrix, Pa; and Ks is the bulk modulus of grains, Pa.
The Langmuir isotherm equation illustrates the strain in the matrix due to the gas sorption system:
where εmL denotes the Langmuir strain constant, and PmL denotes the Langmuir pressure constant, Pa.
3.2. Two-Phase Flow Model
3.2.1. Two-Phase Flow in the Fracture System
As previously noted, both gas and water exit the coal reservoir, necessitating a two-phase flow model for the gas drainage process. The equation for mass conservation in gas–water flow is typically described as follows:
where m represents the flow mass, kg/m3; t denotes time, s; Q denotes the source term, kg/m3; and the subscripted α denotes either water (w) or gas (g), respectively.
Darcy’s law is used to characterize velocity uα [47], as follows:
In the above equation, the symbol k represents intrinsic permeability, m2; and kr represents relative permeability. The symbol μ denotes the dynamic viscosity, Pa·s; and p denotes the pore pressure, Pa. In this study, we assume that water is stored solely within the fracture system; thus, we obtain the following equation:
where Sw denotes the water saturation; ρw represents water density, kg/m3; and φf is the porosity of the fracture system. The density of water (ρw) is not a constant but varies with pore pressure and is defined as ρα = −1/Cα(dρα/dpα), where Cα is the fluid compressibility.
Additionally, we assume that the coal reservoir exhibits a dual-porosity system, comprising both a fracture and a matrix system. The gas is specified as a free term in the fracture system and is classified as an adsorption term in the matrix system; a desorption time lag exists between the two systems. Therefore, the mass in the fracture system is expressed as follows:
where ρc is the density of the coal seams, kg/m3; Sg is the gas saturation; ρga is the gas density under a standard atmosphere, kg/m3; and ρg is the density of the gas, kg/m3.
3.2.2. Gas Diffusion Within the Matrix System
mb represents the mass transfer occurring between the fracture and matrix system, constrained by the diffusion time, as follows [48]:
where me represents the gas content, m3/kg, which is in equilibrium with the fracture gas pressure, pf. This is described using the Langmuir isotherm, as follows:
The time taken for diffusion in a matrix block is typically described as follows:
where De is the gas effective diffusion coefficient in the matrix, m2/s; and a represents a shape factor.
This study employs the effective diffusion model, which encompasses both Knudsen diffusion and self-diffusion, to elucidate the diffusion process in the coal matrix. The diffusion coefficient of Knudsen diffusion is related to the pore diameter (dm) and the arithmetic average of gas velocity (um); it is expressed as follows [49,50]:
When examining the coal reservoir, it is important to take into account porosity, tortuosity, and roughness. Consequently, the equation presented above transforms into the following equation [51,52]:
where φm and τm denote the porosity and tortuosity of the coal matrix, respectively. Df and δ are two dimensionless constant numbers, and the first term reflects the fractal dimension of the pore wall, while the second term signifies the ratio of the gas molecule’s diameter to the local average pore diameter.
Based on the theory of molecule kinetics, the bulk diffusion coefficient can be written as follows [49]:
where λ denotes the mean free path, m; and Knm represents the Knudsen number. With the incorporation of the impact of porosity and tortuosity, it can also be written as follows [51,52]:
Several approaches have been proposed to effectively combine Knudsen diffusion and bulk diffusion. Geng and Li [50] suggested a technique for calculating the effective diffusion coefficient, ensuring a seamless transition from bulk diffusion to Knudsen diffusion. This method calculates the effective diffusion coefficient as follows:
When Kn → 0, this represents bulk diffusion, while when Kn → ∞, this indicates Knudsen diffusion. Furthermore, α is not constant; it depends on the Knudsen number (α = Knmb, where b is known as the ratio coefficient and b > 0).
3.2.3. Supplement Equations
Four variables (Sg, Sw, ρg, and pw) need to be solved in the two-phase flow model, while only two equations are presented. Therefore, the following supplementary equations are needed [53]:
where pc represents the capillary pressure, Pa, which is dependent on water effective saturation; this is defined as follows [54,55]:
where pe refers to the entry pressure, Pa; and c represents a coefficient linked to pore size distribution. Se is the effective saturation, which is defined as follows [56]:
where Swr and Sgr indicate the residual water and gas saturations, respectively; these vary based on porosity, as follows:
where nwr and ngr are parameters determined through experimental calculation data. Swr0 and Sgr0 represent the initial values of residual saturation in both the water and gas phases.
3.3. Coal Porosity and Permeability Model
3.3.1. Relative Permeability Model
In Darcy’s law, two permeability terms are presented, which are employed for the two-phase flow model. The relative permeability is related to the effective saturation; it is specified as follows [55]:
krg and krw are the relative permeabilities of gas and water, respectively. m is an empirical parameter. As mentioned above, the effective saturation is related to the variation in the porosity of the fracture system.
3.3.2. Intrinsic Porosity Model for the Fracture System
Fracture porosity is described as a function of effective strain [57]:
Here, the subscript 0 denotes the initial state. εfe represents the effective strain of the fracture system and is composed of global strain and fracture local strain, as follows:
The local strain encompasses the mechanical interaction strain between the matrix and fracture systems, as well as the strain induced by gas adsorption, as follows:
In this work, we assume that part of the adsorption strain (fΔεms) contributes to the local strain, narrowing fracture apertures. Meanwhile, the remaining part ((1 − f)Δεms) belongs to the global strain, increasing fracture apertures. Therefore, the global strain is defined as follows:
Therefore, the effective strain of fractures is written as follows:
The first term represents the coal reservoir’s volumetric strain from the mechanical deformation equation; the second and fourth terms represent the strain caused by adsorption, according to the Langmuir isotherm equation. The third term illustrates the compressive strain in matrix blocks that results from the interaction between the matrix and the fractures. As mentioned, the mechanical properties of coal show great anisotropy with the Young’s modulus in the horizontal direction, significantly more than that in the vertical direction. Therefore, the permeability evolution also varies with direction. Therefore, the above equation can be written as follows:
In the above equation, the subscripts ho and ve represent the horizontal and vertical directions. The attribution factor 2/3 is employed as the strain induced by the adsorption effect, and pore pressure is uniformly distributed along three directions (i.e., the x-, y-, and z-directions). The evolution of porosity or permeability in one direction is controlled by the other two directions. For instance, the porosity or permeability in the z-direction is co-dominated by the deformation in the x- and y-directions.
The cubic law is widely used to explain the connection between porosity and permeability [34,58]:
Here, kf is the fracture permeability, m2.
3.3.3. Porosity Model for the Matrix System
Similarly to the porosity model for fracture systems, the development of the matrix system’s porosity model is influenced by changes in the effective strain, as follows:
where m represents the matrix system, and αm is the Biot coefficient of the matrix system. Similarly, the effective strain Δεme is composed of the global strain (εmg) and the local strain (εml) of the matrix system, as follows:
The local strain in the matrix system contrasts with that in the fracture system, which leads us to conclude the following:
The global strain of the matrix system is the same as that of the fracture system; it can be written as follows:
Therefore, the effective strain of fractures is written as follows:
3.4. Coupling Process in the Mathematical Model
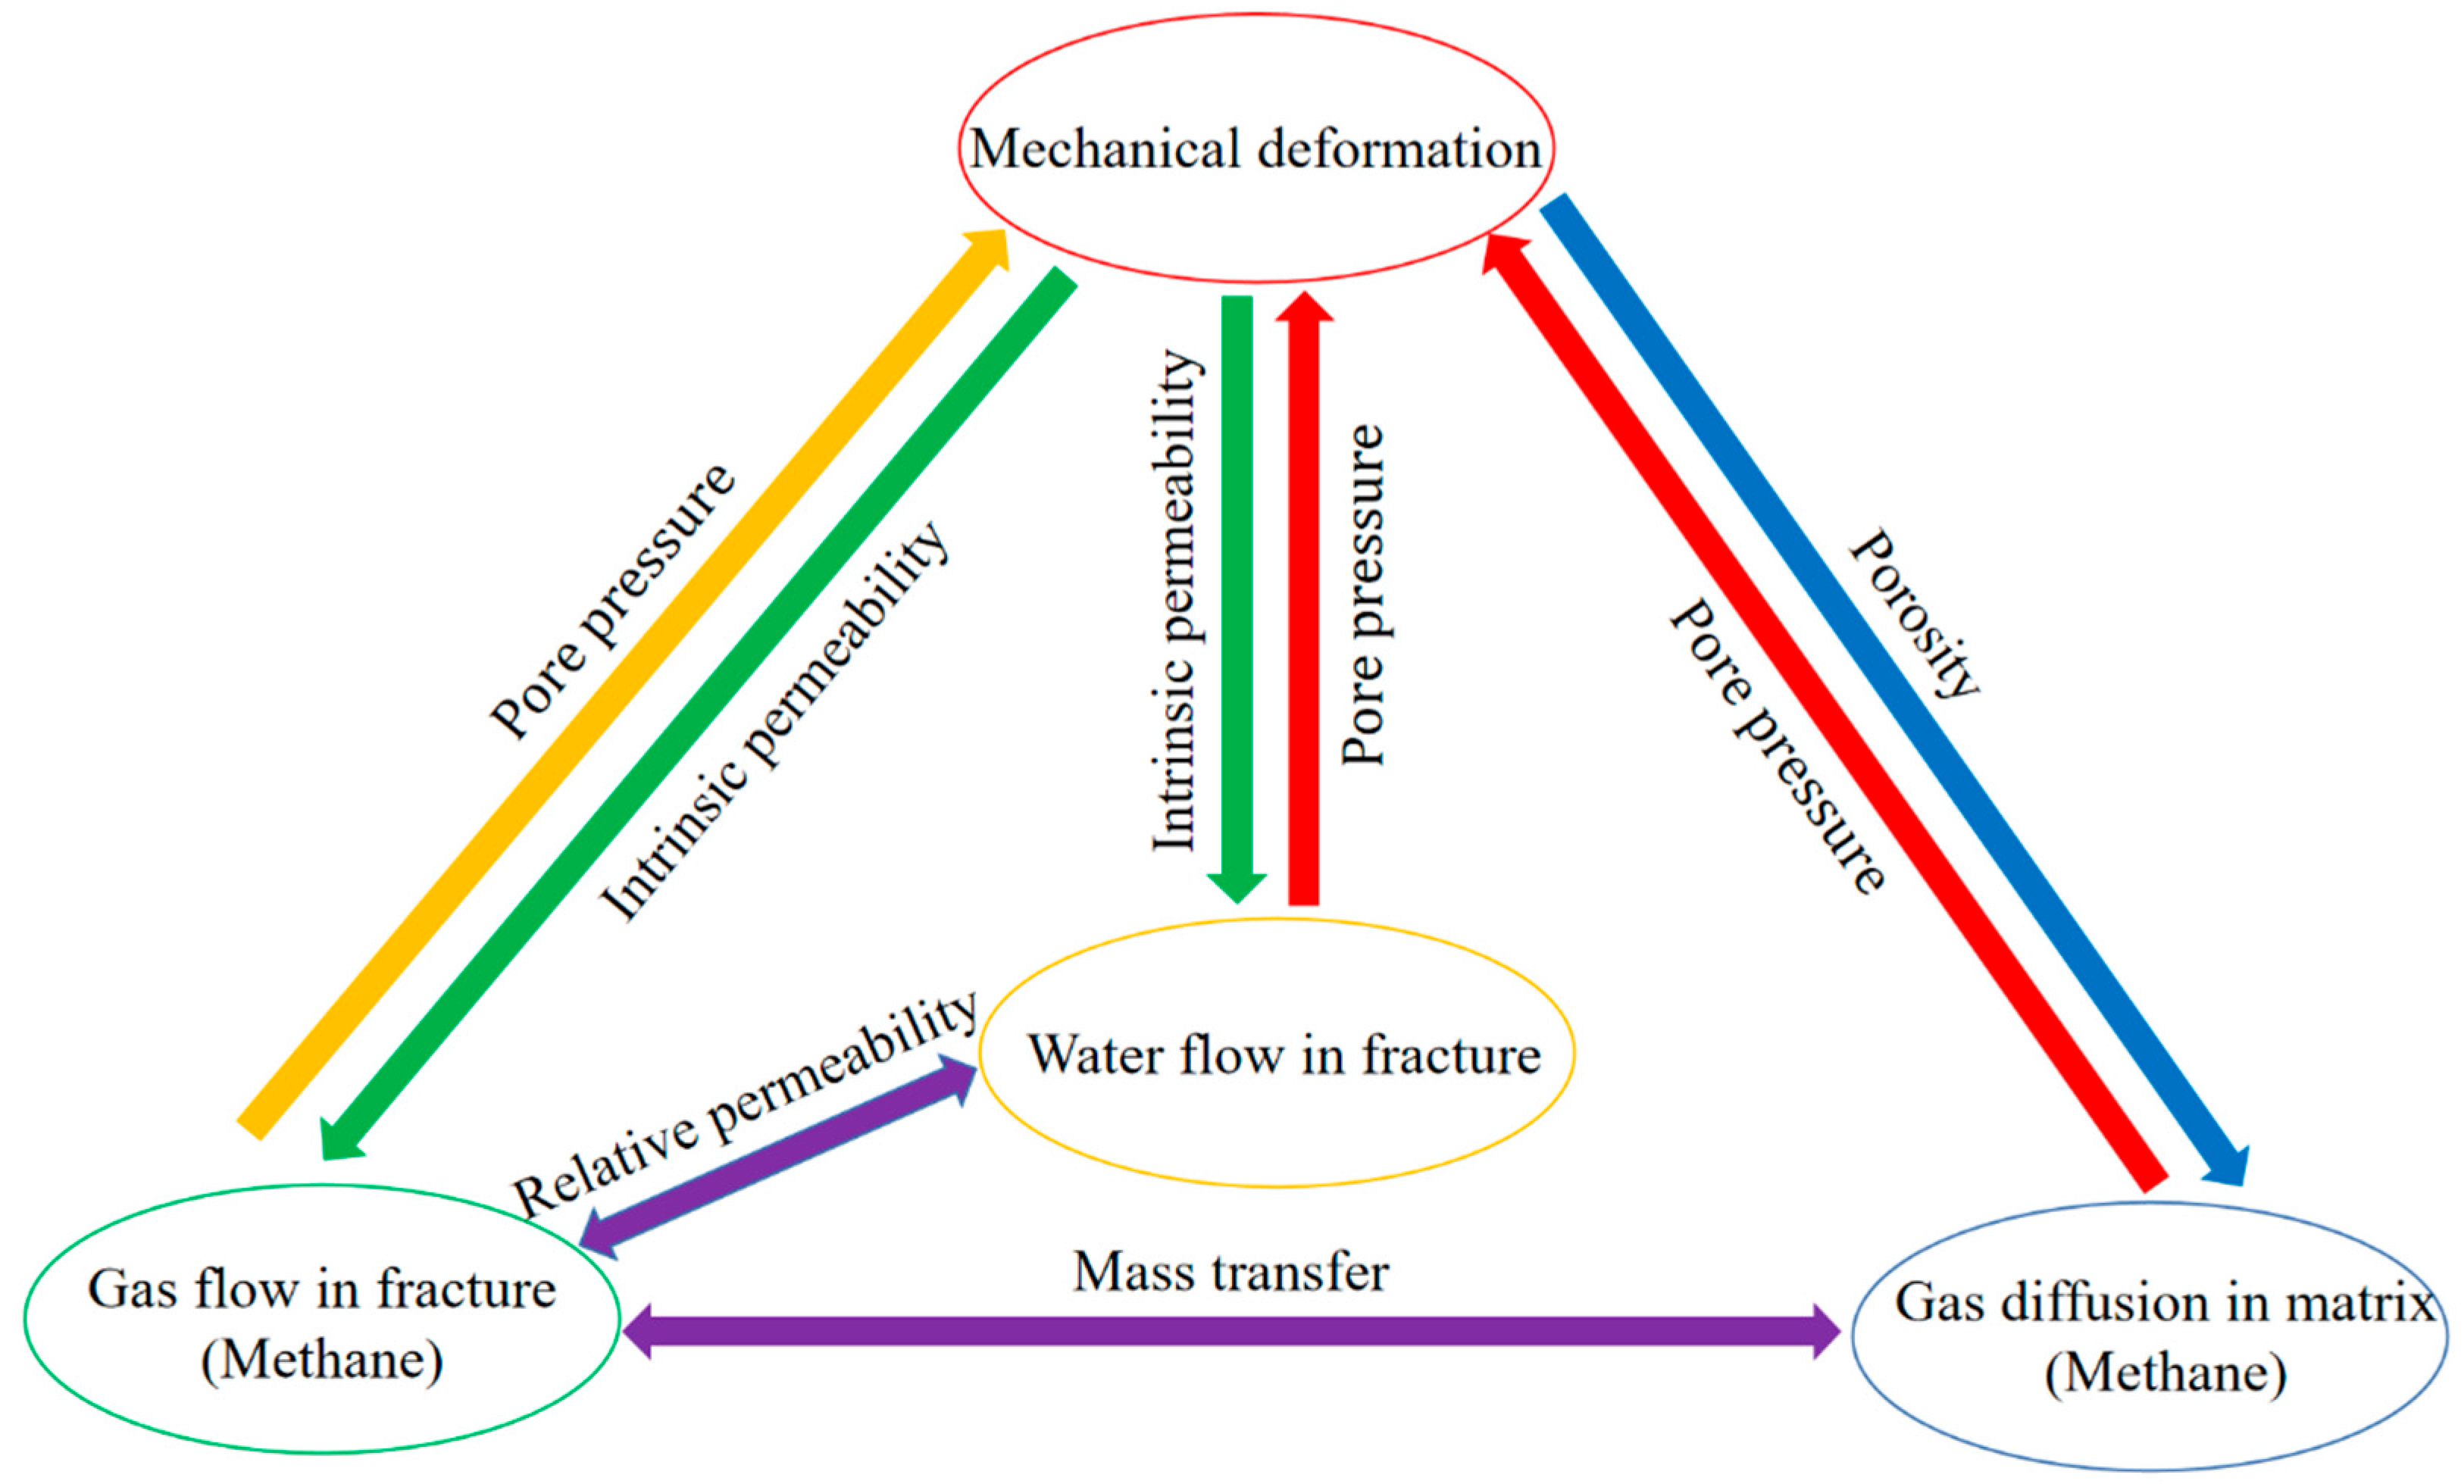
Several coupling processes are involved in the proposed model; the details are listed in the ensuing section and are schematically shown in Figure 3. (i) The effects of mechanical deformation on dual-phase flow within coal reservoirs: coal reservoir deformation has the ability to change the pore topology of both the fracture and matrix systems and, subsequently, the fluid flow properties, including the intrinsic permeability in the fracture system and the effective diffusion coefficient in the matrix system. (ii) The impact of fluid flow on mechanical properties: the gas drainage process has the ability to change the pore pressure and subsequently induce volume strain in the coal reservoir. Furthermore, the existence of water softens the coal reservoir, thus lowering the Young’s modulus of the coal seam. In summary, Young’s modulus varies with water saturation. Additionally, water saturation influences the relative permeability of the gas and water phases, which aligns with the relative permeability principles curve. There is gas mass transfer between the matrix and fracture systems.
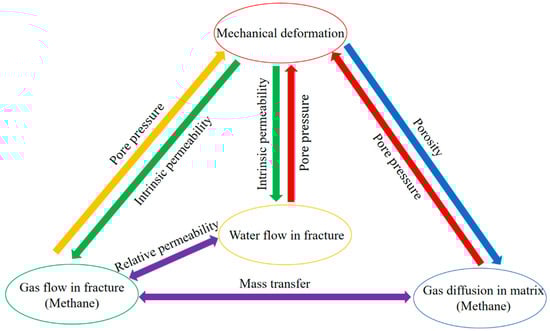
Figure 3.
Fluid flow-reservoir deformation coupling relationship diagram.
4. Numerical Model
4.1. Geometrical Model
This study involved creating a three-dimensional geometrical model to simulate the impact of water saturation and induced mechanical anisotropy on the gas extraction efficiency via layer drilling holes. The model is established by referring to the geological conditions in the Wangpo coal mine, Shanxi province. The model features three strata groups, which are depicted in Figure 4. The upper and lower strata act as surrounding rock, measuring 140 m in length, 80 m in width, and 10 m in height. Positioned in the center of the model, the coal seam matches the dimensions of the surrounding rock. Meanwhile, a transportation roadway—10 m in height and 80 m in length—was inserted into the coal seam on the left-hand side. The excavation of a borehole with a diameter of 100 mm was conducted. The borehole measured 110 m in length and was perpendicular to the right-hand wall of the roadway. It is noteworthy that the initial 15 m of the section was sealed.
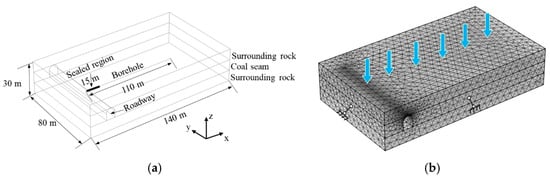
Figure 4.
Numerical model of gas extraction and grid sections. (a) Geometry of the simulation model; (b) grid discretization.
To guarantee the model’s accuracy and convergence, the model was suitably meshed, using free tetrahedral elements, while refinements were conducted at the boreholes. Finally, a total of 106,984 domain elements were generated, with an average grid quality of 0.83.
4.2. Boundary Conditions
Due to the intrinsic interrelationships in the proposed model, it is imperative to employ a robust numerical calculation software to fulfill the objectives of this work. COMSOL Multiphysics [59] is a finite element-based simulation software that is designed to simulate the coupling process of multiple physics. In this study, the solid mechanic module in COMSOL Multiphysics (version 5.4) [59] was utilized to delineate the deformation and damage of the surrounding rock and coal seam. Figure 4 illustrates the established numerical model, with detailed grid discretization, for simulating the gas extraction process. The partial differential equation modulus was employed to describe the two-component flow of gas and water, as well as the diffusion of gas in the matrix. Finally, the pipe flow module was used to describe the mixed flow of methane and water in the borehole.
Three major procedures should be considered to analyze the full effect of water saturation on the gas drainage process. (i) The original in situ formation stress should be calculated first, and the initial strain should be zero, while the initial stress should be non-zero. (ii) Then, the transport roadway is excavated, and the borehole is drilled under original in situ formation stress conditions. (iii) Finally, negative pressure is applied to the drill hole to simulate gas extraction.
The boundary conditions for both the deformation and two-component flow of the coal reservoir should be specified in order to solve the above equations. For the mechanical deformation module, a value of 27 MPa is applied to the top surface of the model to replicate the in situ formation stress at a burial depth of 2000 m; the gravity effect is taken into account. The model is horizontally surrounded by a roller support that constrains the normal displacement, with a fixed constraint employed at the base. For the gas seepage module, the borehole wall is designated as the pressure boundary condition, and the right wall of the roadway is also set as the pressure boundary condition, with a value of 100 kPa. The model is surrounded by the zero-flux boundary condition. The pipe flow module describes the gas flow within the borehole, utilizing pressure boundary conditions at both ends. Points close to the roadway side are set at 70 kPa, simulating a negative pumping pressure of 30 kPa. For the gas diffusion model, all boundaries are designated as zero flux boundary conditions. The initial gas pressure magnitude of the model was set to 1.2 MPa.
4.3. Parameter Settings
The Wangpo coal mine, which provides the geological background for the model, was selected as the comparison object. The specific input parameters of the model are shown in Table 1. The burial depth, thickness of coal seam, and the size and length of the borehole are determined from the field. Meanwhile, other parameters, such as permeability and diffusion coefficients, are taken from previous work [60] since they are difficult to obtain in the field.

Table 1.
Input parameters of the gas extraction model.
As mentioned above, the water immersion-induced softening and anisotropy of the mechanical properties should be considered in the model. To achieve this goal, two parameters are employed to represent the impact of water immersion-induced softening and anisotropy. Previous work has pointed out that the presence of water has the ability to significantly reduce the Young’s modulus in the horizontal direction while having little effect in the vertical direction [61]. In this work, the softening parameters are chosen to be exponential function and softening; they range from 1 to 0.1 in the horizontal direction and from 1 to 0.7 in the vertical direction when water saturation increases from 0 to 1. Similarly, the anisotropy parameter also exhibits an exponential relationship with water saturation [62]; the value ranges from 1 to 0.1 and from 1 to 0.8 in the horizontal and vertical directions, respectively.
5. Results
5.1. Results of the Benchmark Model
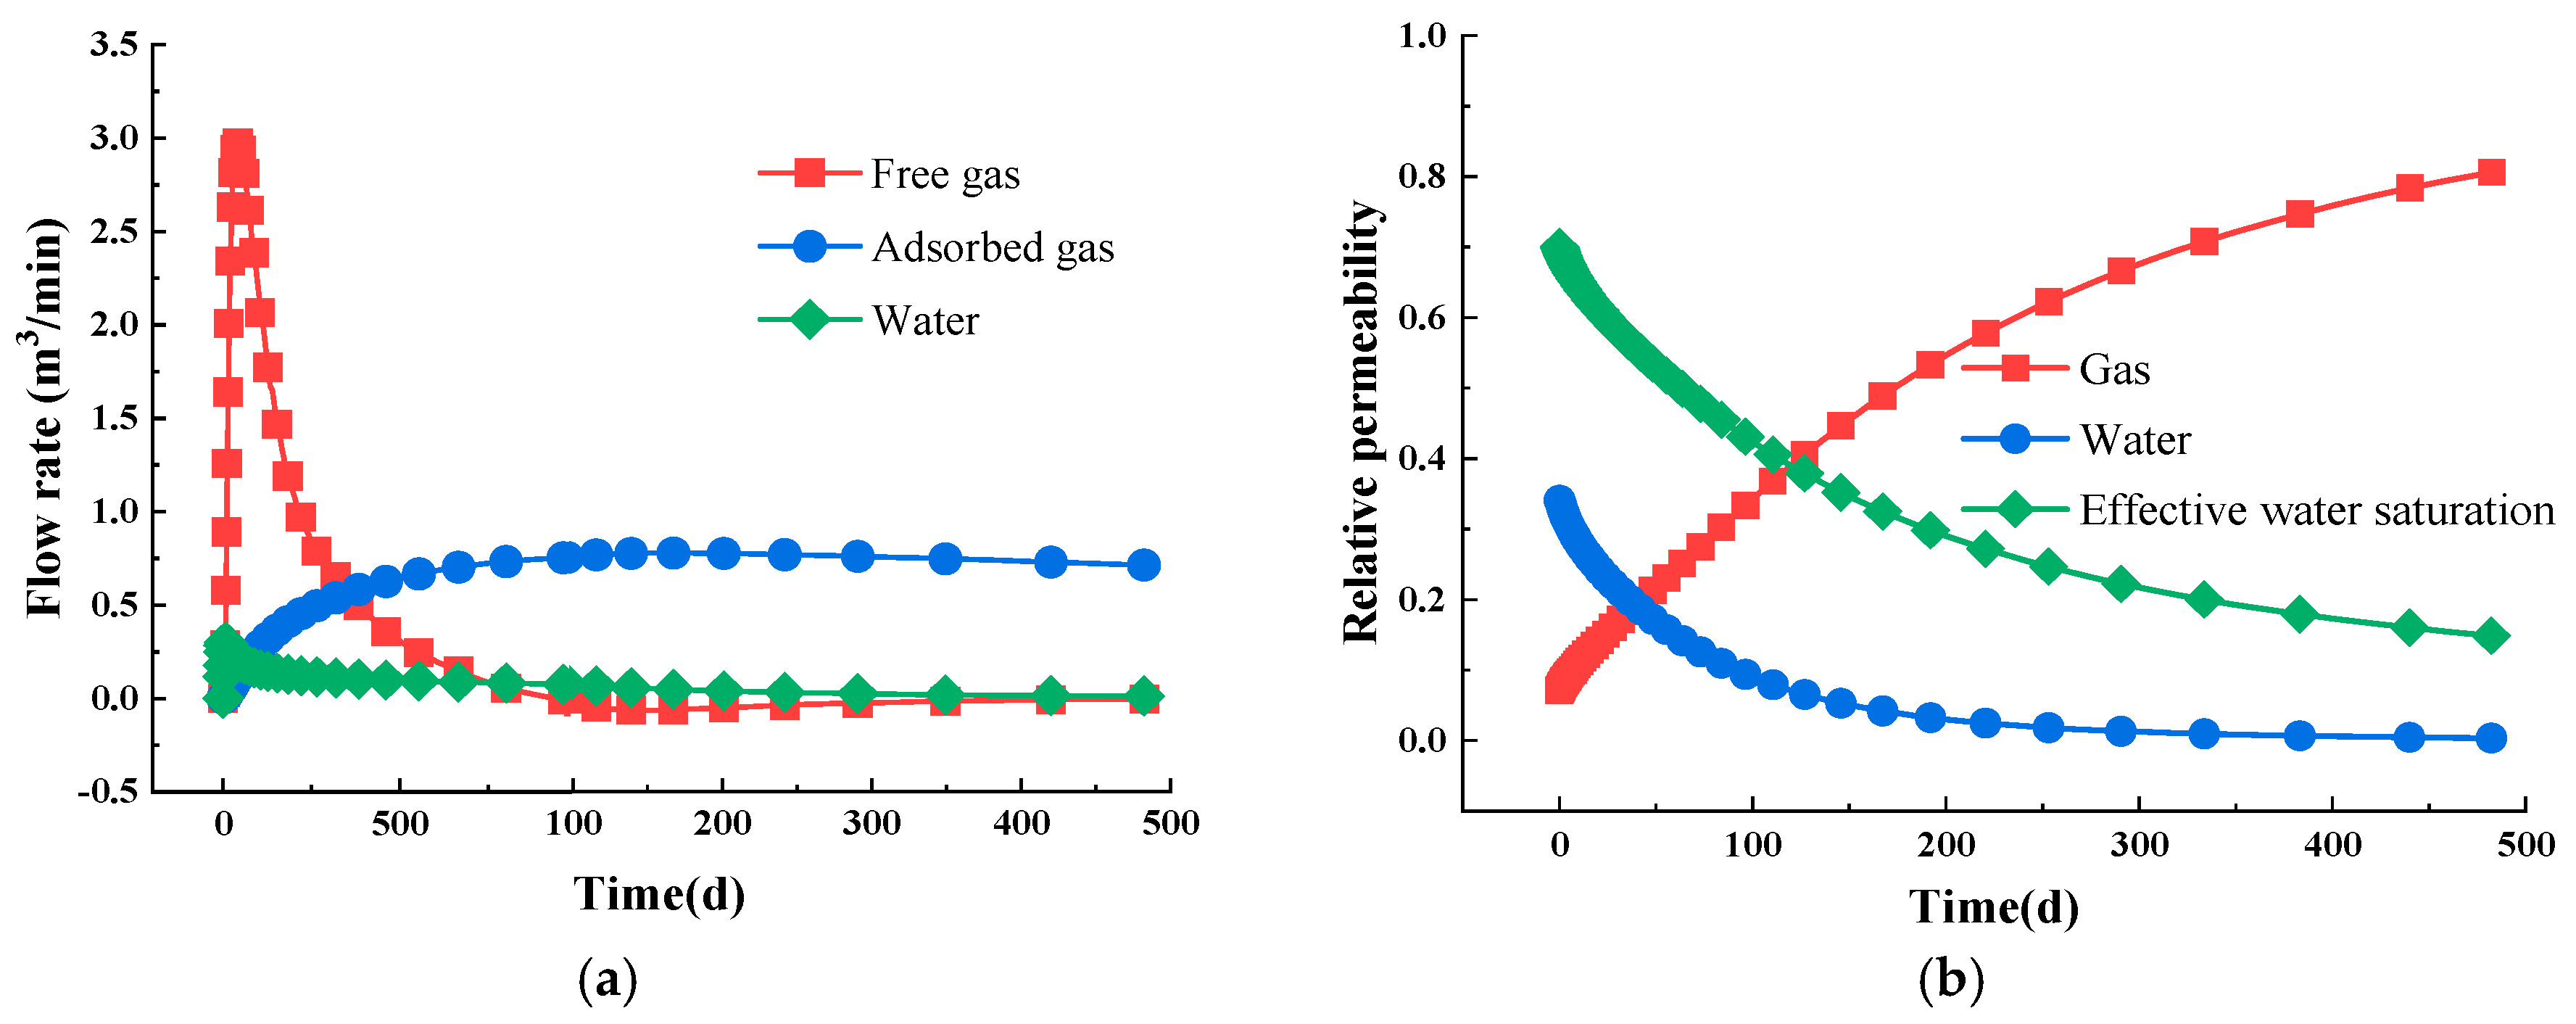
The simulation results reveal that during the gas extraction process, immersed water is initially produced, followed by the release of free gas and ultimately the desorption of adsorbed gas [63,64]. In the early stage, the production predominantly comprises water and free gas, while in the later stage, adsorbed gas becomes the primary output, as illustrated in Figure 5a. Throughout the evolution of the gas–water two-phase permeability, the effective water saturation progressively declines. This results in a corresponding decrease in the relative permeability of the water phase, as well as a concurrent increase in the gas relative permeability, as illustrated in Figure 5b. These results are not verified as an ideal conceptual model is established, aiming to produce some general conclusions rather than specific ones; for real mines, the geological conditions are extremely complex, which are difficult to truly replicate. Additionally, obtaining parameters can be challenging. Although the results have not been verified, the model remains applicable since the gas flow rate falls within a reasonable range.
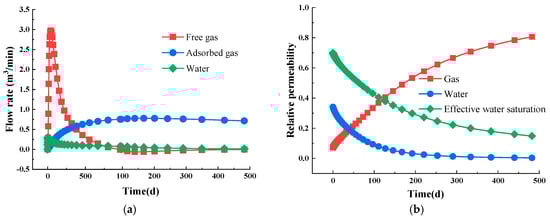
Figure 5.
Gas–water two-phase flow. (a) Gas–water two-phase flow rate; (b) relative permeability evolution with effective water saturation.
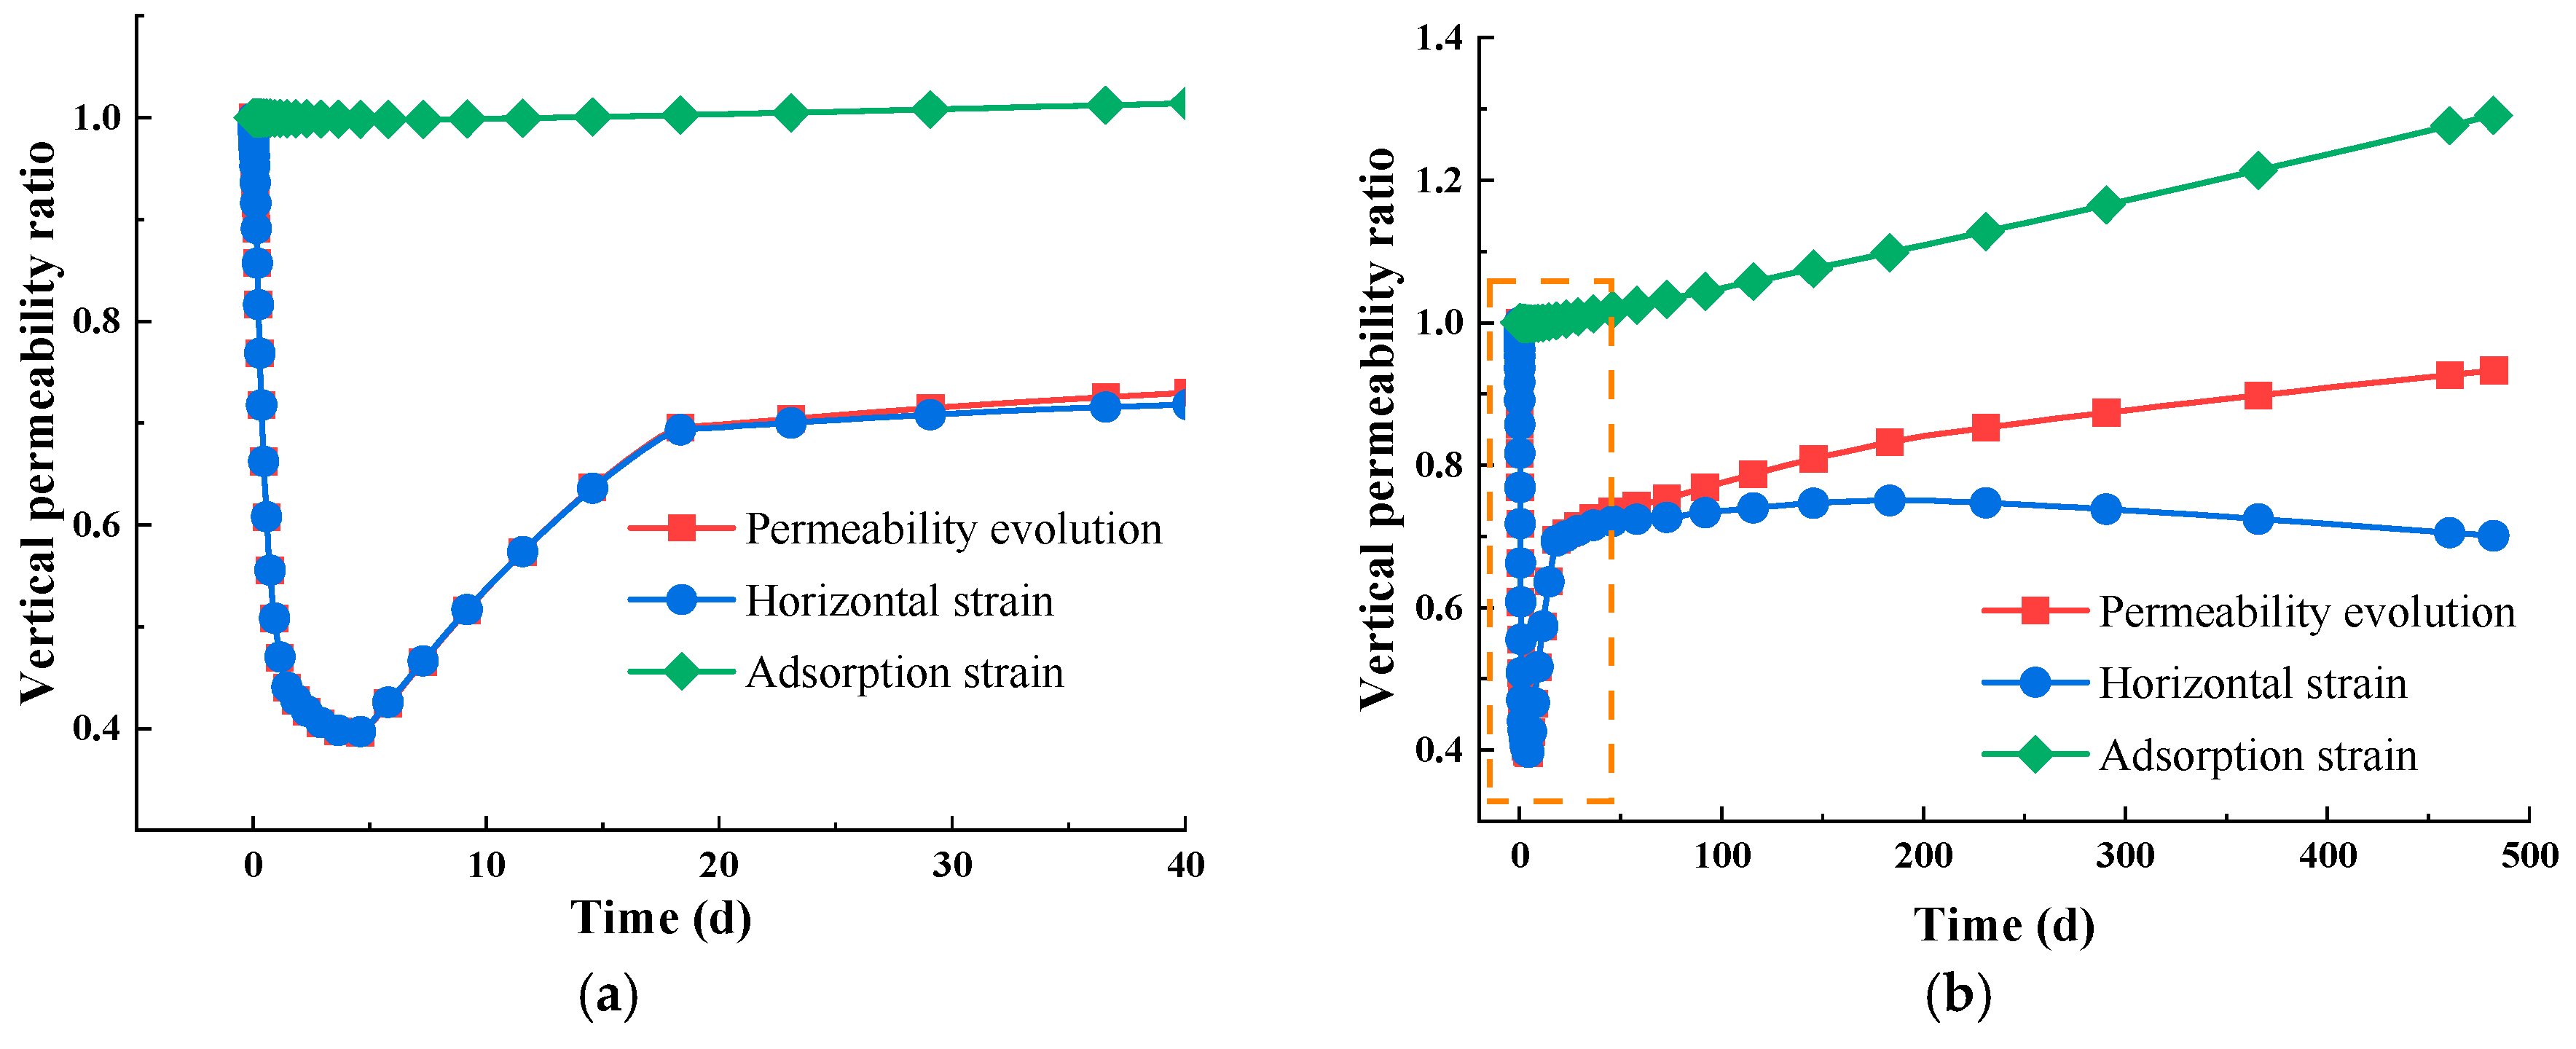
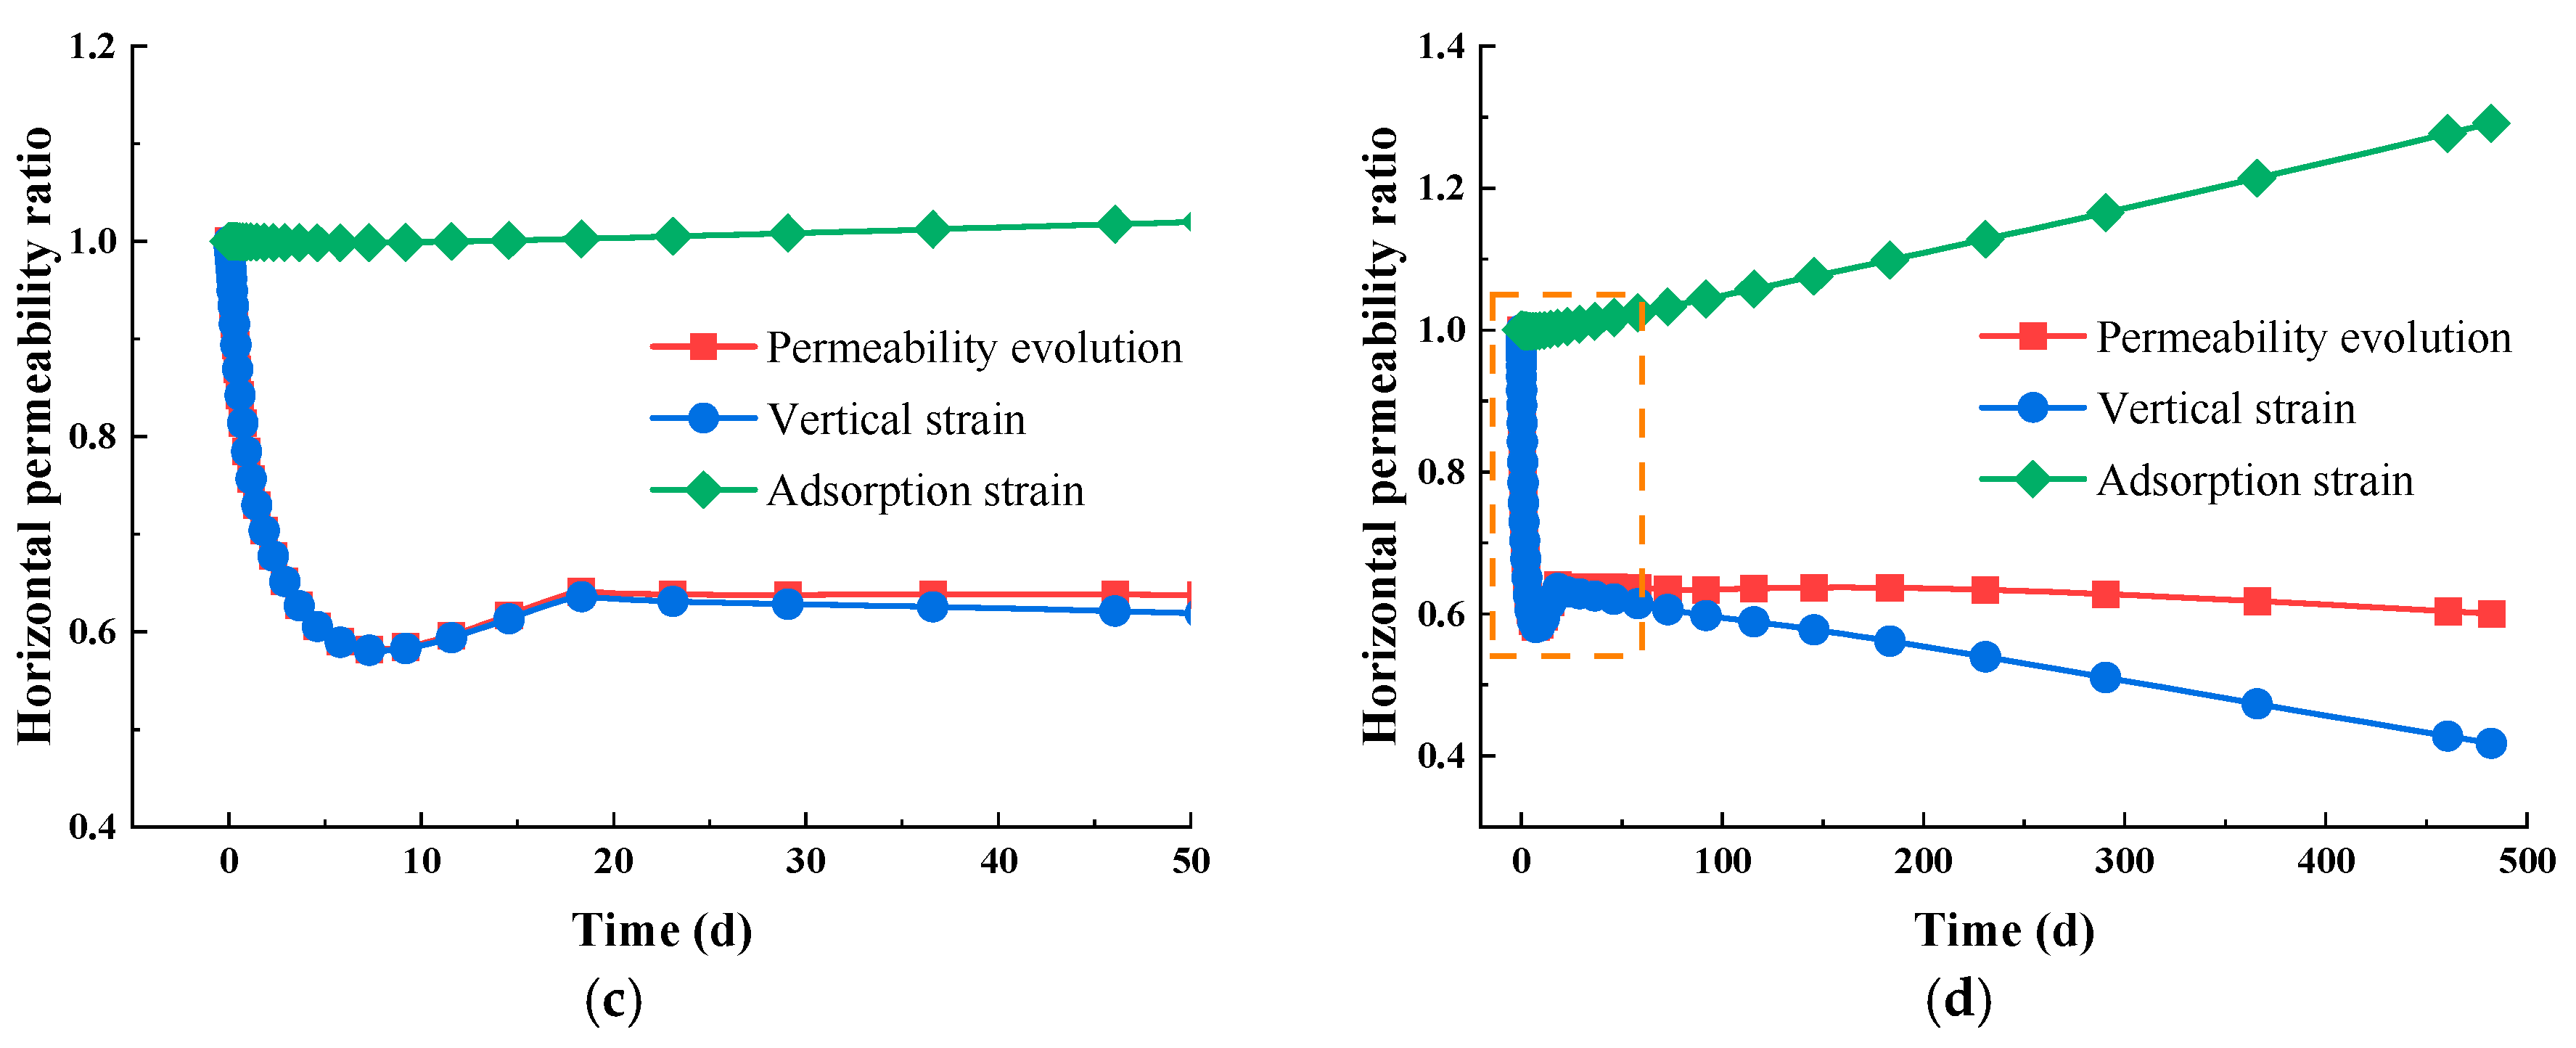
As illustrated in Figure 6a,b, the permeability in the vertical direction decreases first and then increases. During the early stage, permeability is primarily influenced by horizontal strain, while during the later stage, permeability is primarily impacted by adsorption strain [63]. In the initial stage, the high water saturation level significantly reduces Young’s modulus due to the weakening effect of the water. As the water is expelled, the fluid pressure decreases and the effective stress increases, resulting in a decrease in permeability. In the intermediate stage, as water continues to be discharged, the water saturation gradually decreases, leading to a gradual increase in Young’s modulus and, consequently, an increase in permeability. In the later stage, the water saturation levels off at a low value and Young’s modulus stays mostly unchanged. As gas is released, the fluid pressure drops and the effective stress increases, while the adsorption strain surpasses the horizontal strain, resulting in a higher permeability [65,66].
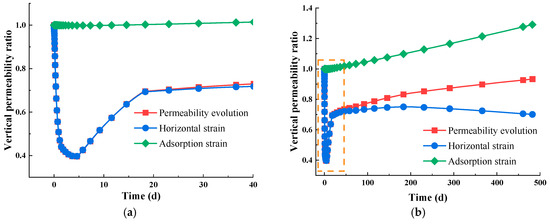

Figure 6.
Intrinsic permeability evolution in varied directions. (a) Vertical permeability evolution in the short term; (b) vertical permeability evolution in the long term; (c) horizontal permeability evolution in the short term; (d) horizontal permeability evolution in the long term.
The permeability in the horizontal direction remains consistent with vertical deformation, as shown in Figure 6c,d. The early decrease and increase in permeability are also observed in the horizontal direction, which can also be explained by the dependence of Young’s module with water saturation. In the long period, the vertical strain exceeds the adsorption strain because of the lower Young’s modulus in perpendicular direction, leading to a decline in permeability.
5.2. Impact of Initial Water Saturation
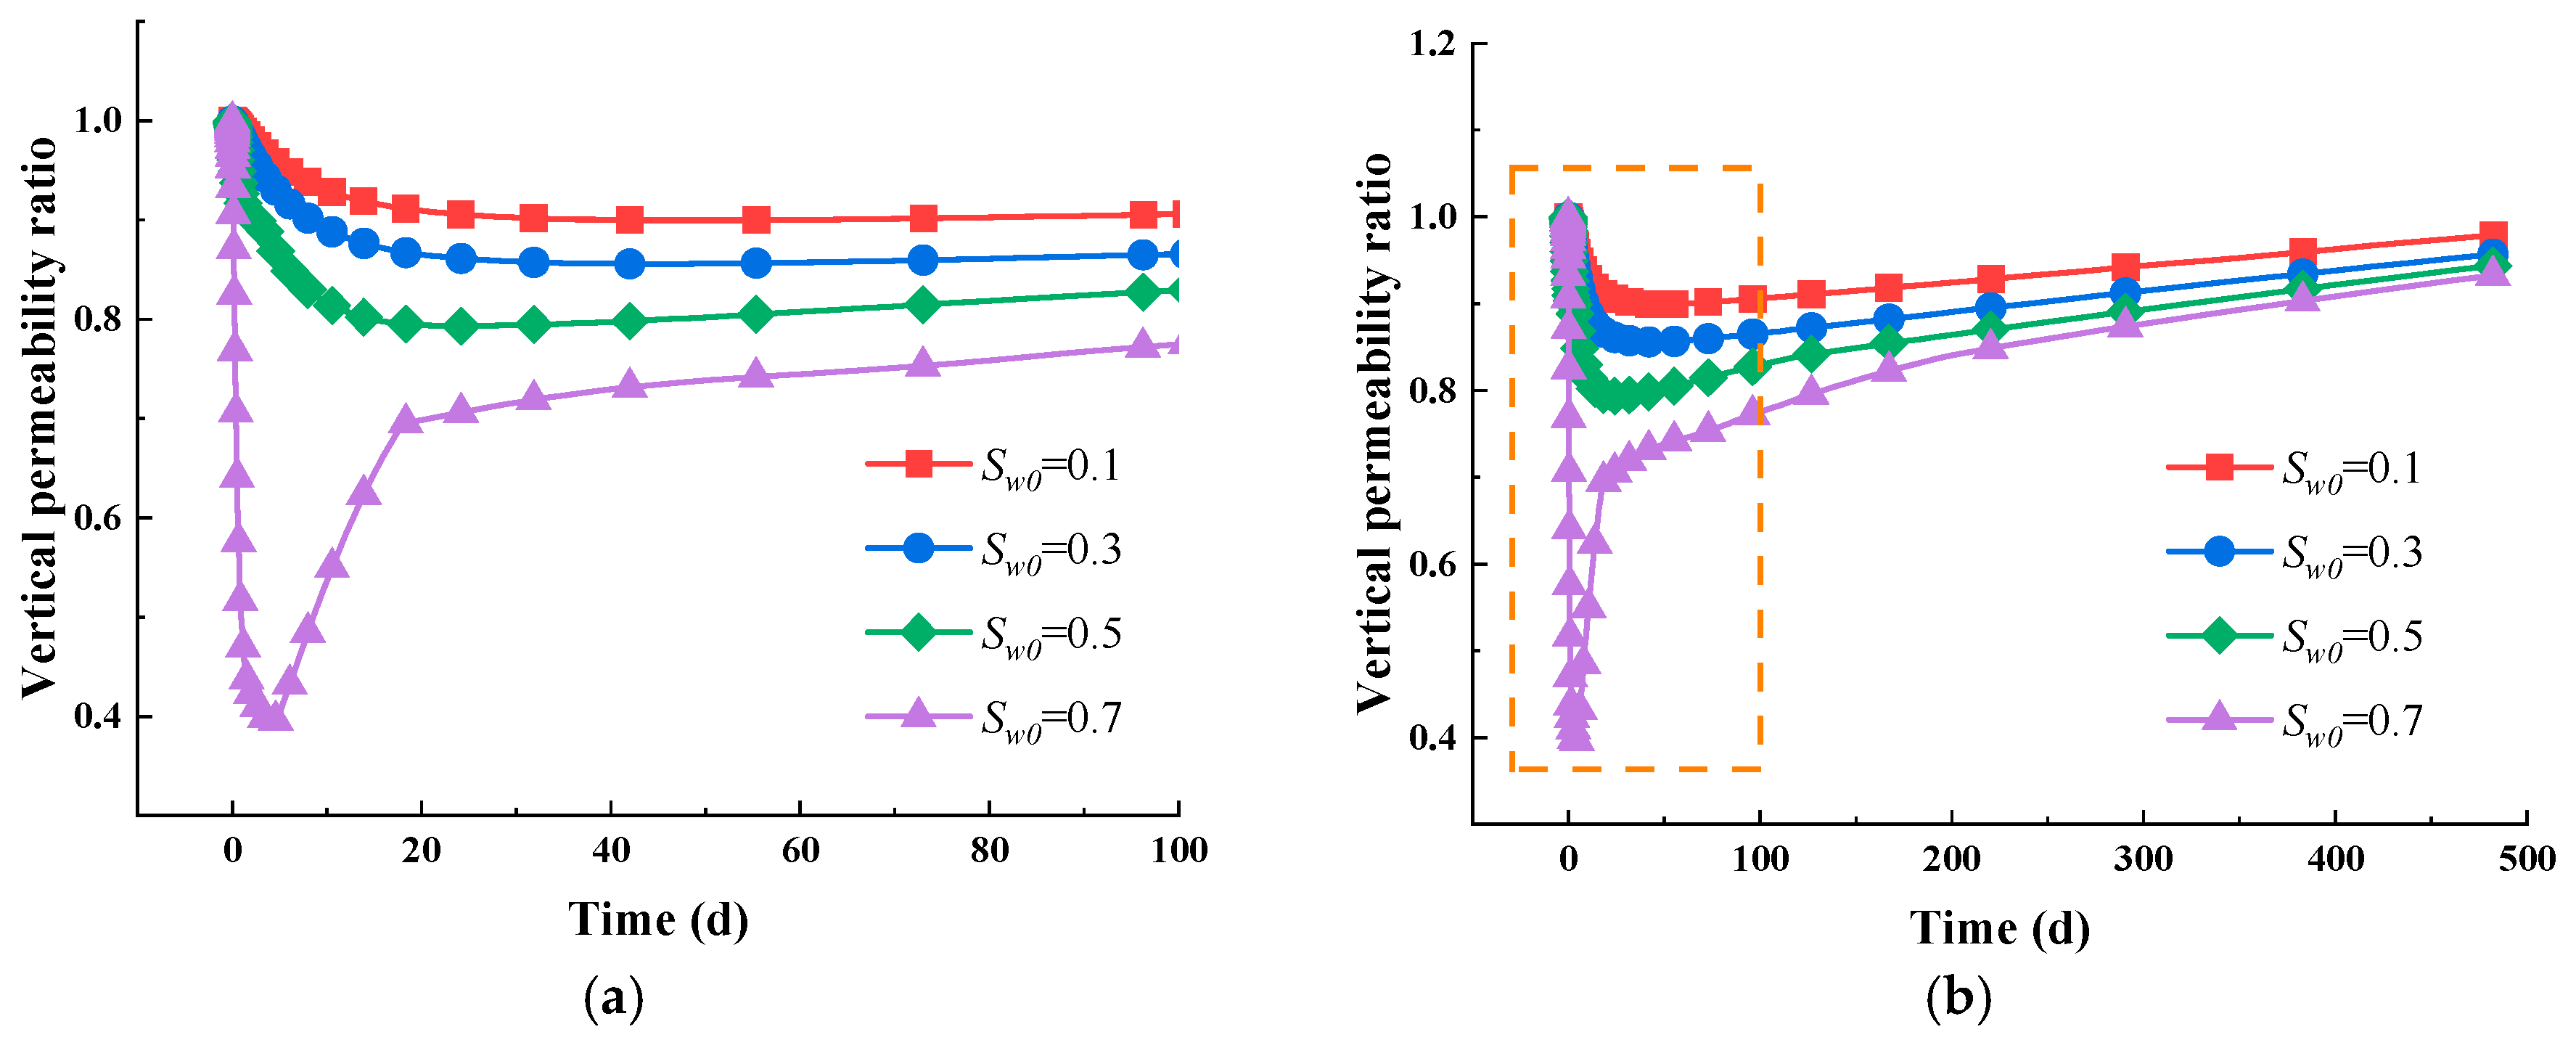
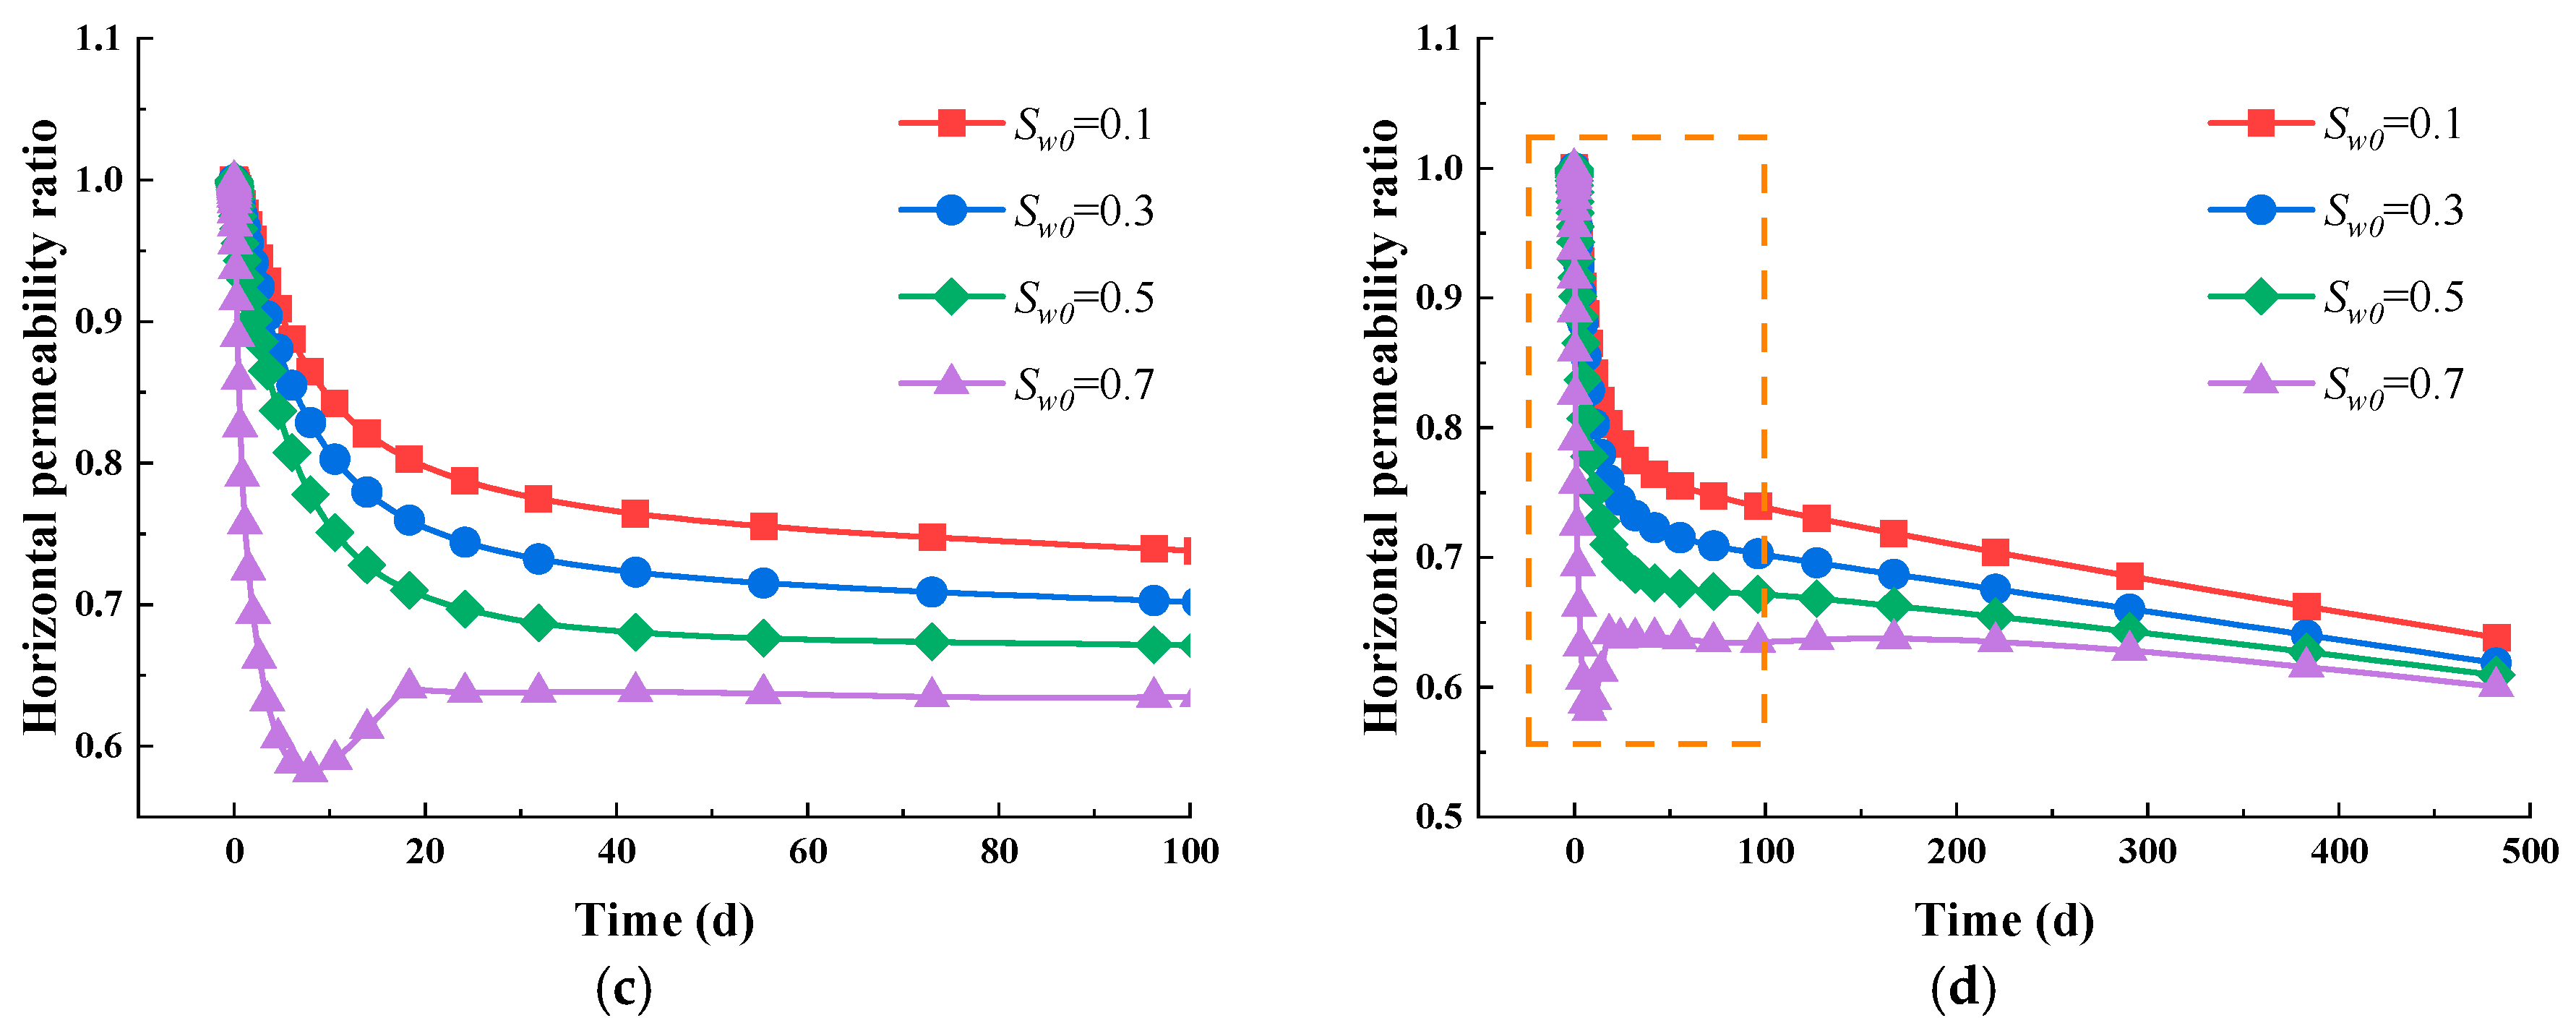
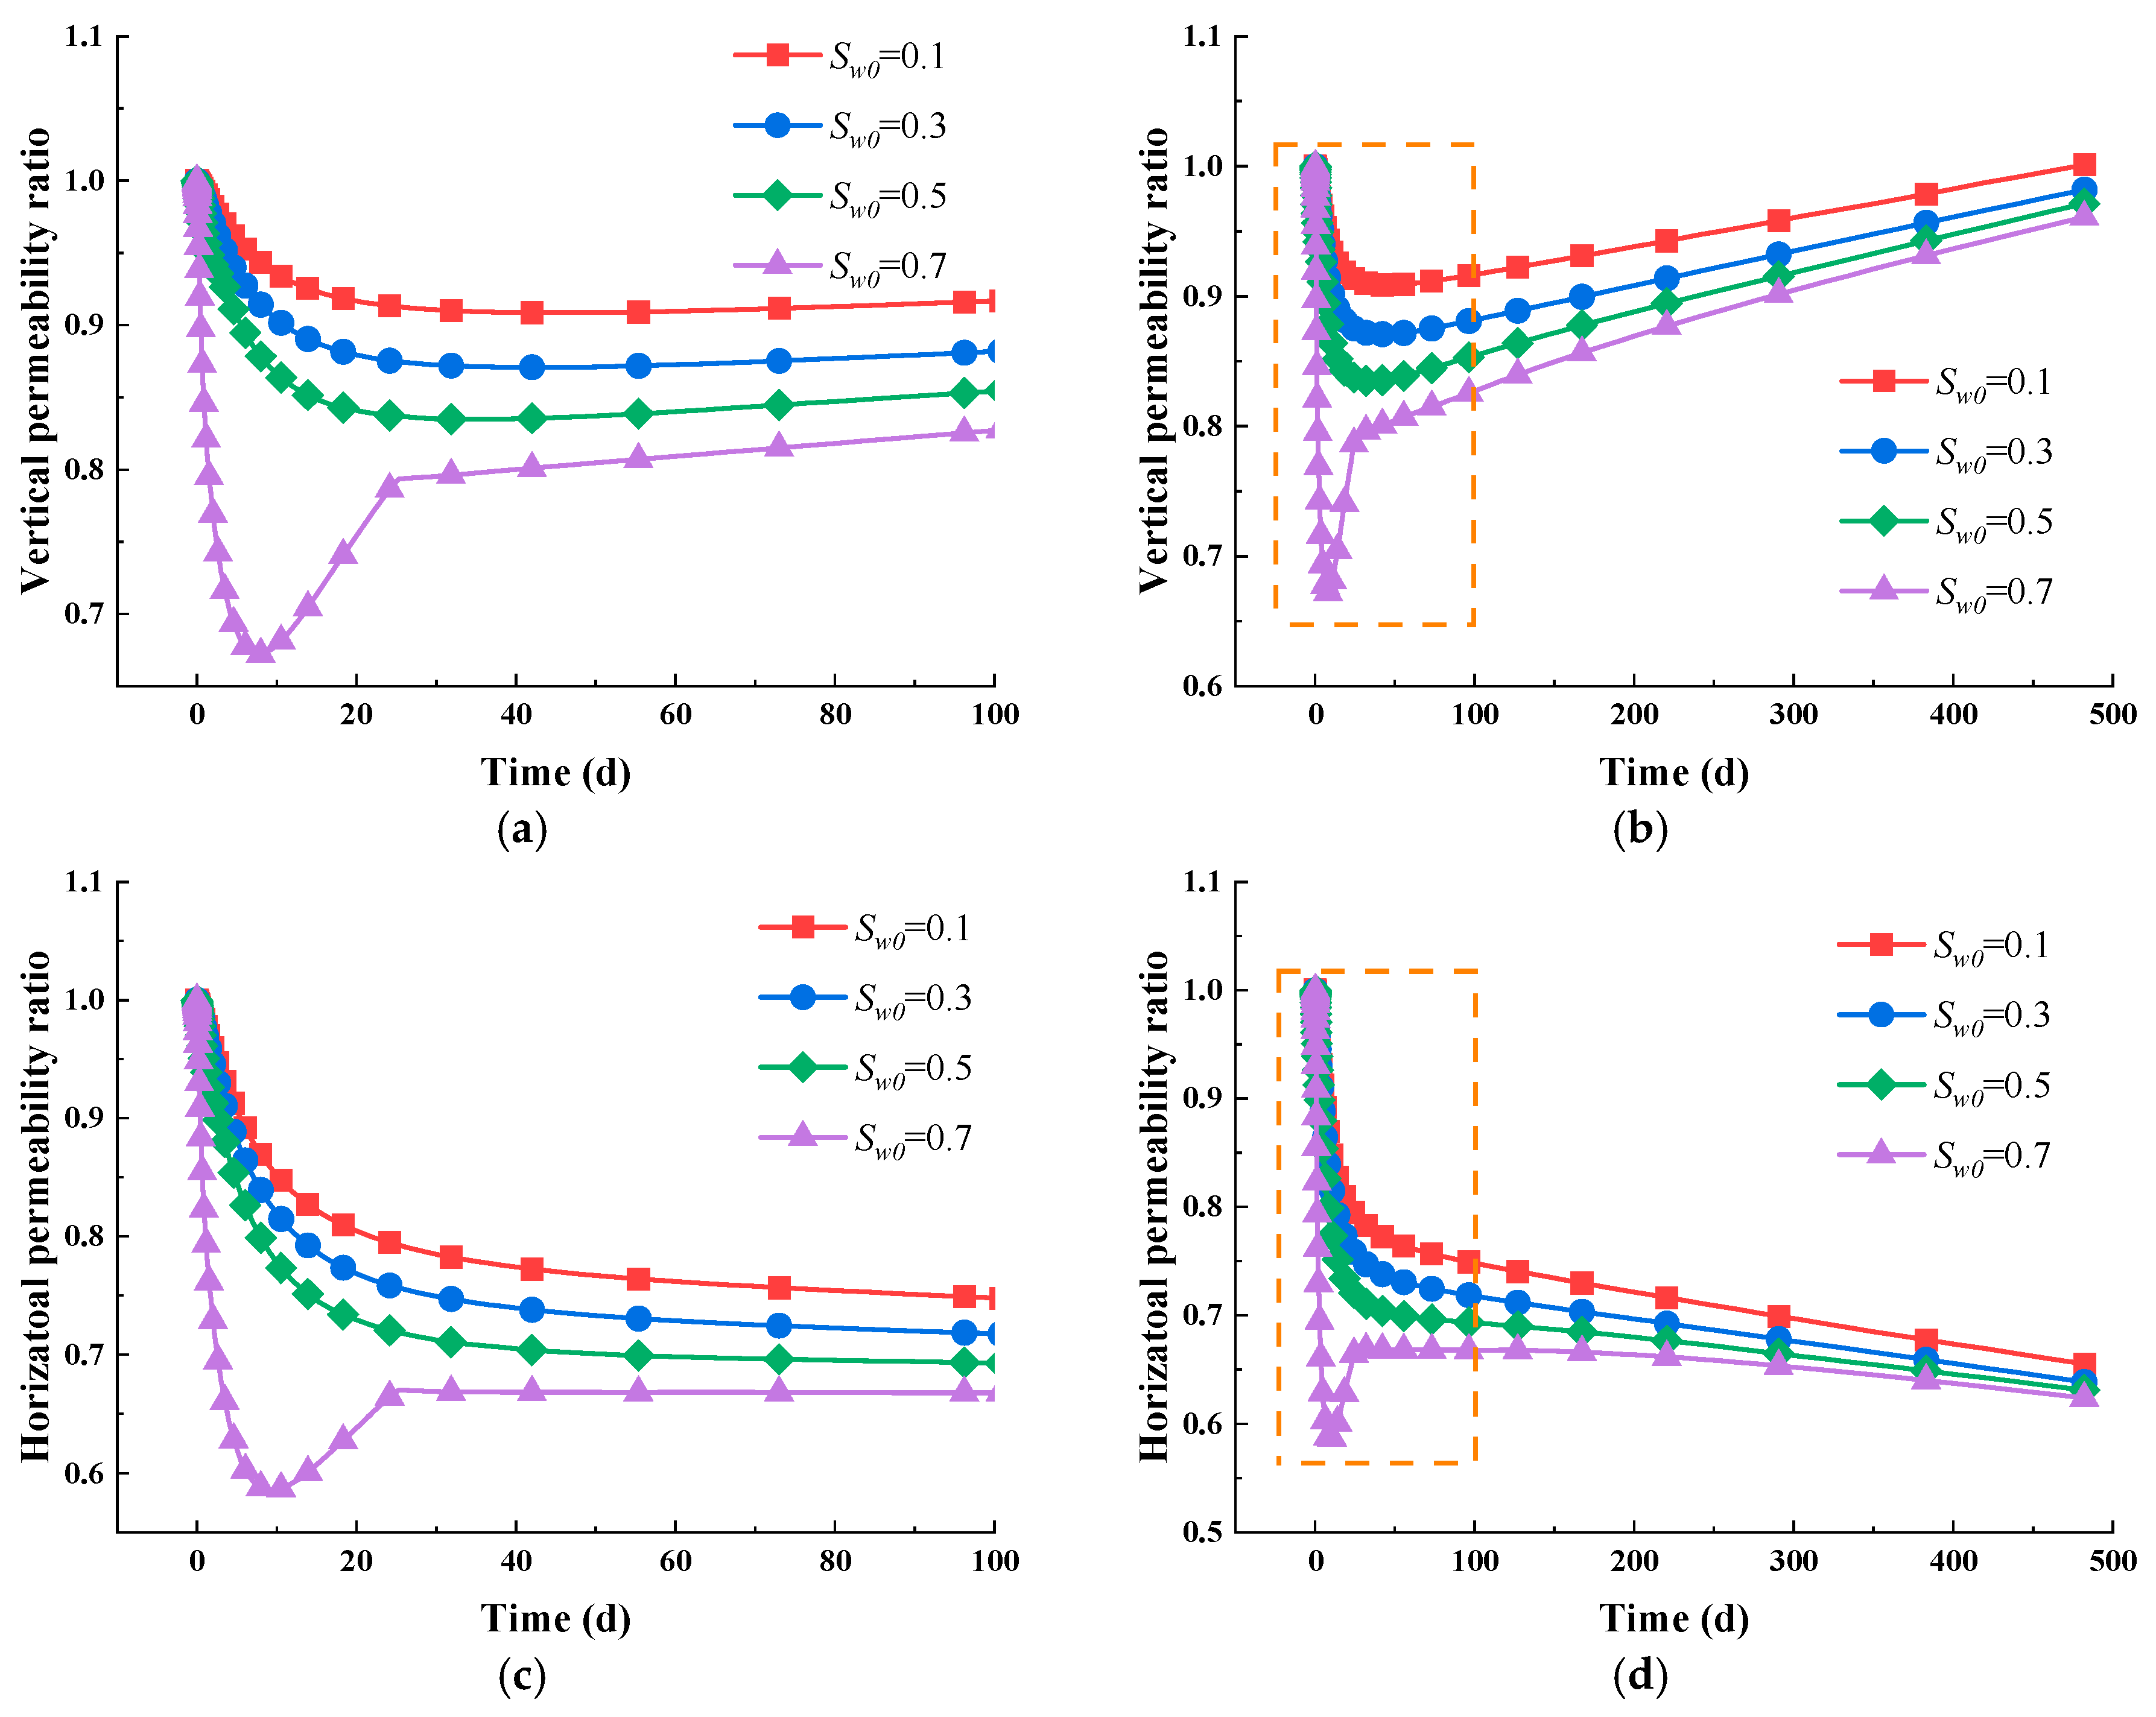
As illustrated in Figure 7, it is clear that higher initial water saturation results in a lower permeability ratio in both the vertical and the horizontal directions. This is due to the higher initial water saturation leading to a more obvious softening phenomenon. Figure 7a,b show that the vertical permeability ratio experiences two stages, including a rapidly decreasing stage followed by a slowly increasing stage when Sw0 is 0.1, 0.3, and 0.5. However, when Sw0 is 0.7, the vertical permeability ratio experiences three stages, including a rapidly decreasing stage, a rapidly increasing stage, and a slowly increasing stage. Figure 7c,d show that the horizontal permeability ratio experiences two stages, including a rapidly decreasing stage and a slowly decreasing stage when Sw0 is 0.1, 0.3, and 0.5. However, when Sw0 is 0.7, the horizontal permeability ratio experiences three stages, including a rapidly decreasing stage, a rapidly increasing stage, and then a slowly increasing stage. Notably, increased water saturation leads to a more pronounced decline in the vertical permeability ratio during the initial stage. When Sw0 is 0.7, the vertical permeability decreases by 60%, while the horizontal permeability decreases by 43%. In the long term, at varying levels of water saturation, the permeability ratio is consistently higher in the vertical direction than in the horizontal direction. Ultimately, the vertical permeability ratio stabilizes between 0.9 and 1.0, while the horizontal permeability ratio stabilizes in the range of 0.6 to 0.7.


Figure 7.
Evolution of intrinsic permeability at various water saturation levels. (a) Vertical permeability evolution in the short term; (b) vertical permeability evolution in the long term; (c) horizontal permeability evolution in the short term; (d) horizontal permeability evolution in the long term.
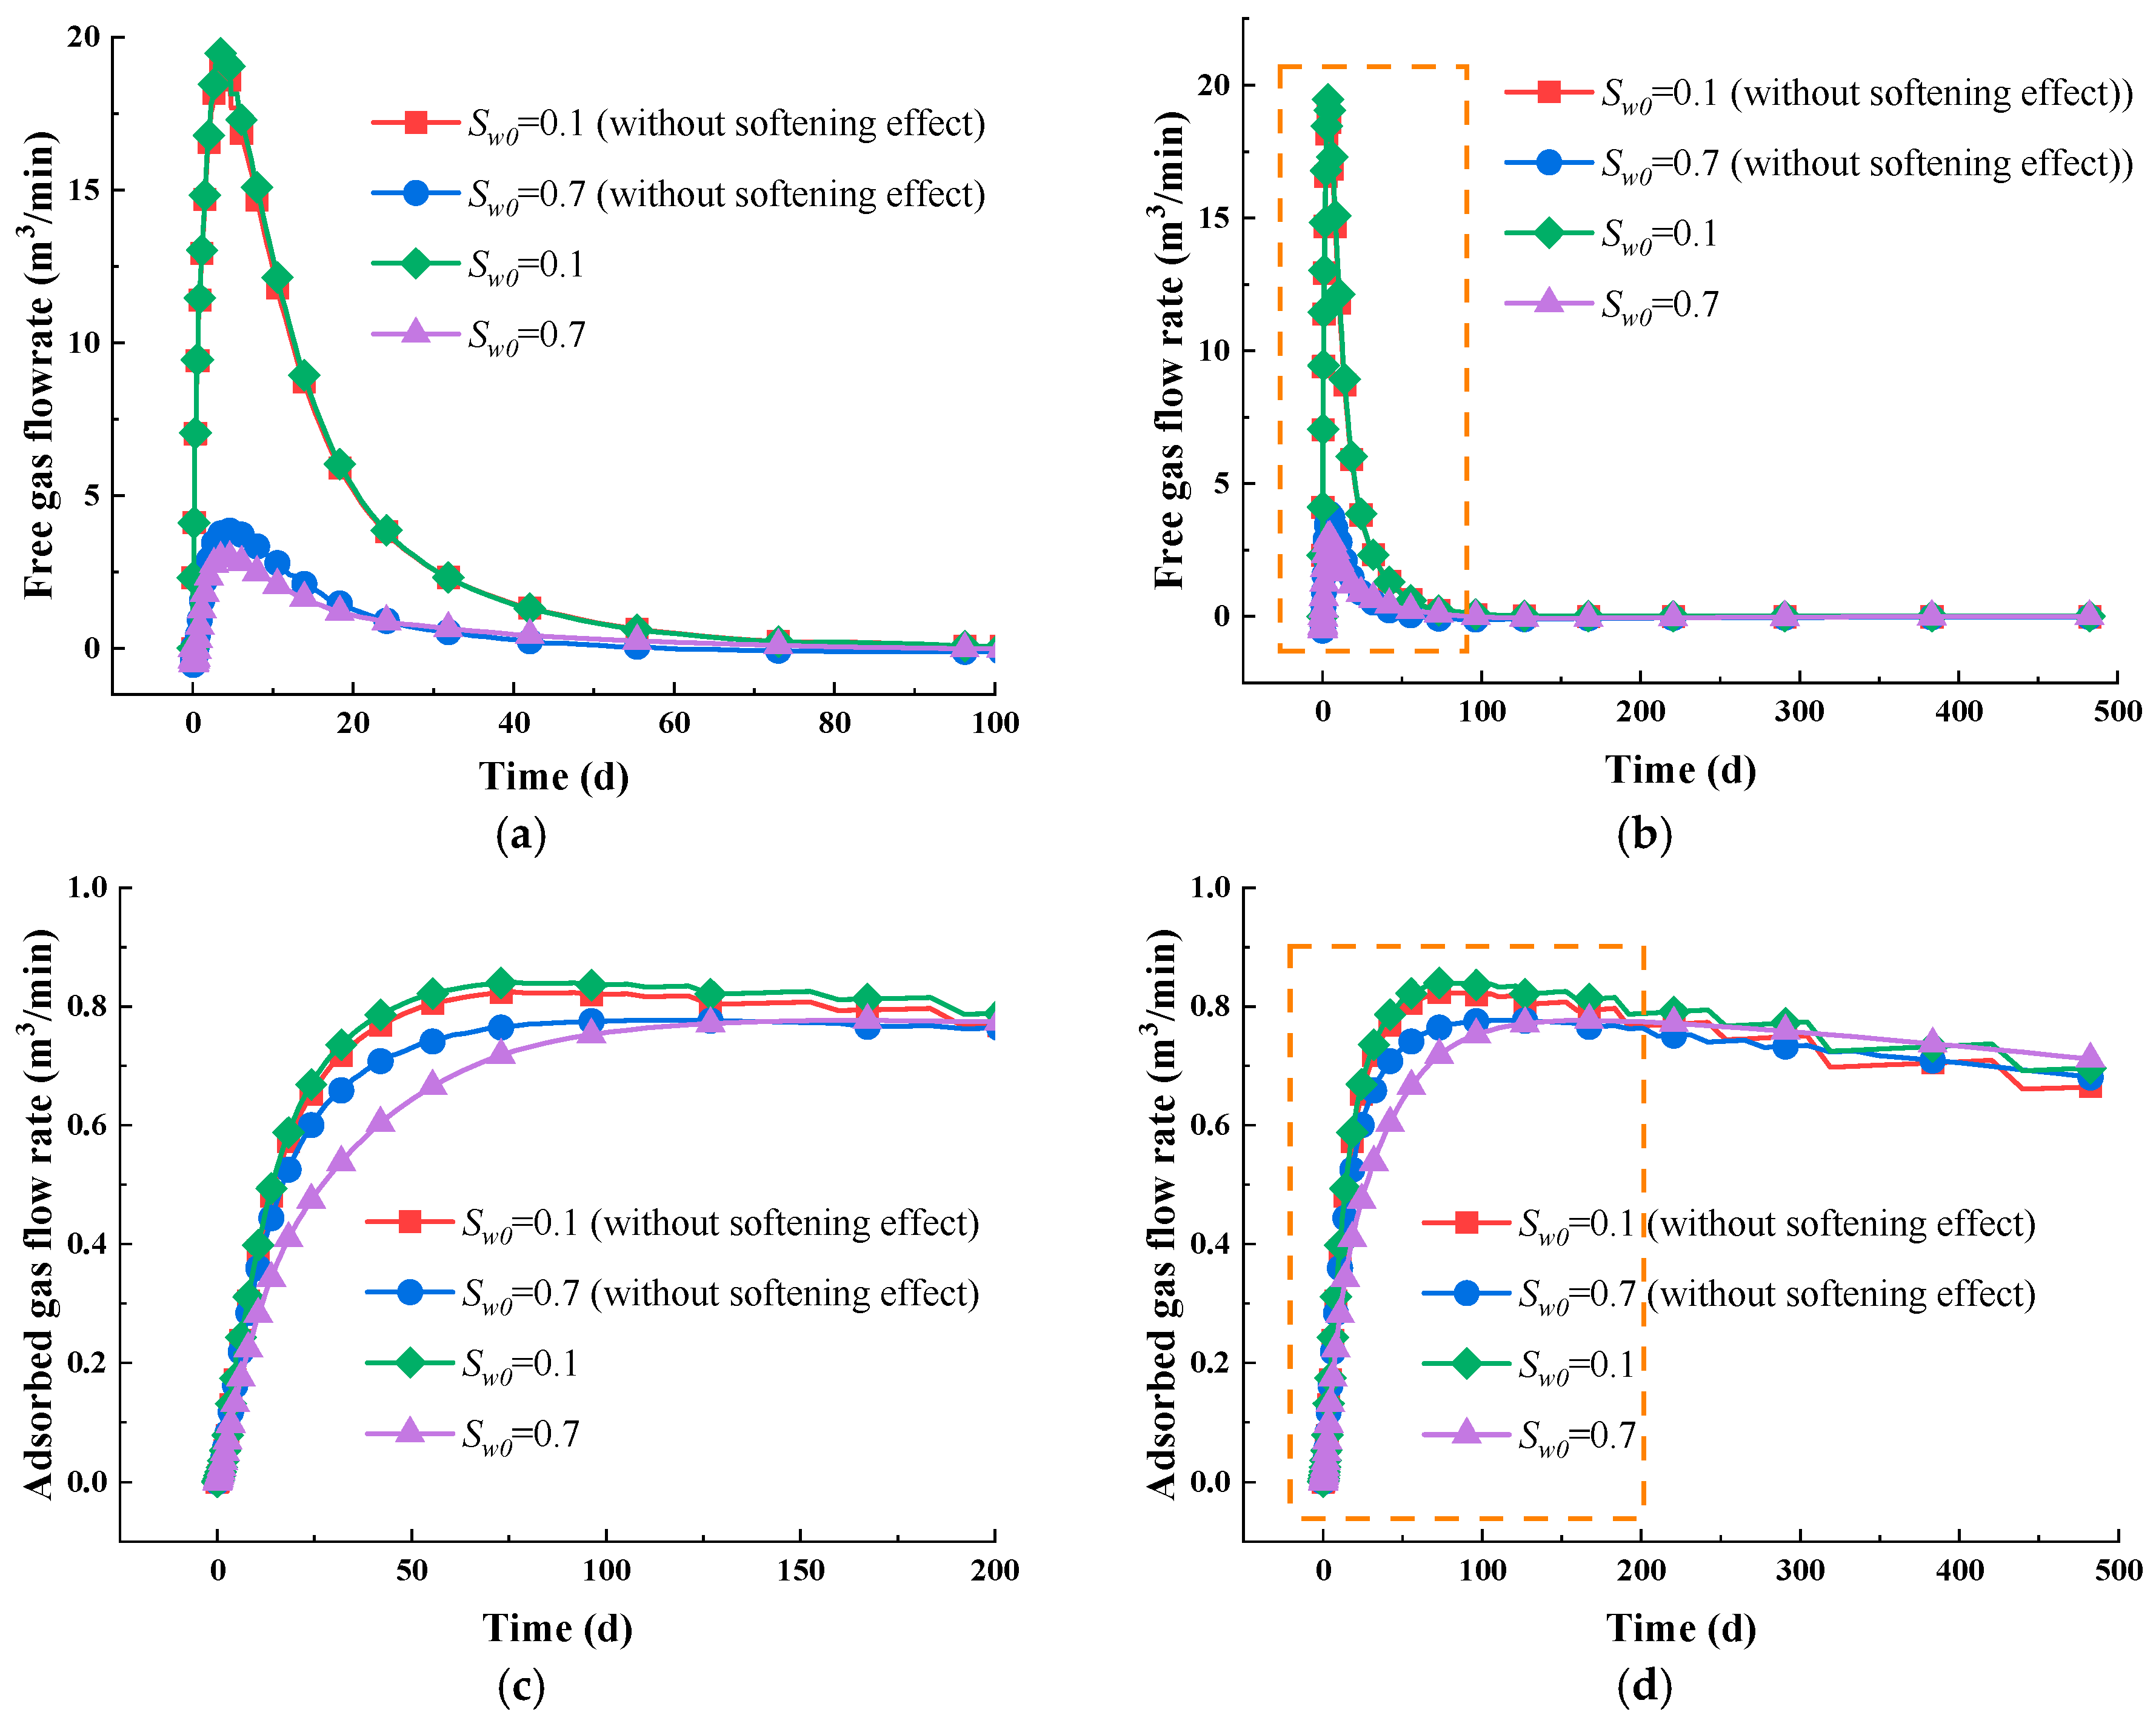
Figure 8 shows that higher water saturation reduces the gas production rates. At different water saturation levels, the gas flow rate of free gas quickly increased before gradually declining to a near-zero value, as illustrated in Figure 8a,b. In contrast, under varying water saturation conditions, the adsorbed gas flow rate initially experienced a brief and rapid increase before gradually stabilizing, ultimately reaching an equilibrium of about 0.7 m3/min, as displayed in Figure 8c,d. Notably, the production rate of free gas significantly surpassed that of adsorbed gas at an early time, with the peak of free gas production rate being roughly 20 times higher than that of adsorbed gas production rate. Under varying water saturation conditions, the free gas production rate neared zero after approximately 100 days, indicating that the gas produced in the later stages is mainly adsorbed gas.

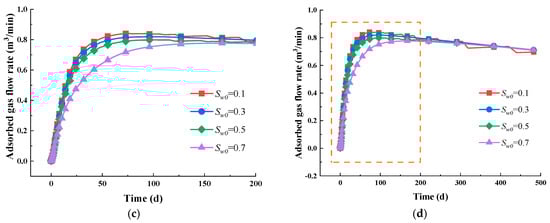
Figure 8.
Flow rates of free gas and adsorbed gas at different water saturation levels. (a) Free gas in the short term; (b) free gas in the long term; (c) adsorbed gas in the short term; (d) adsorbed gas in the long term.
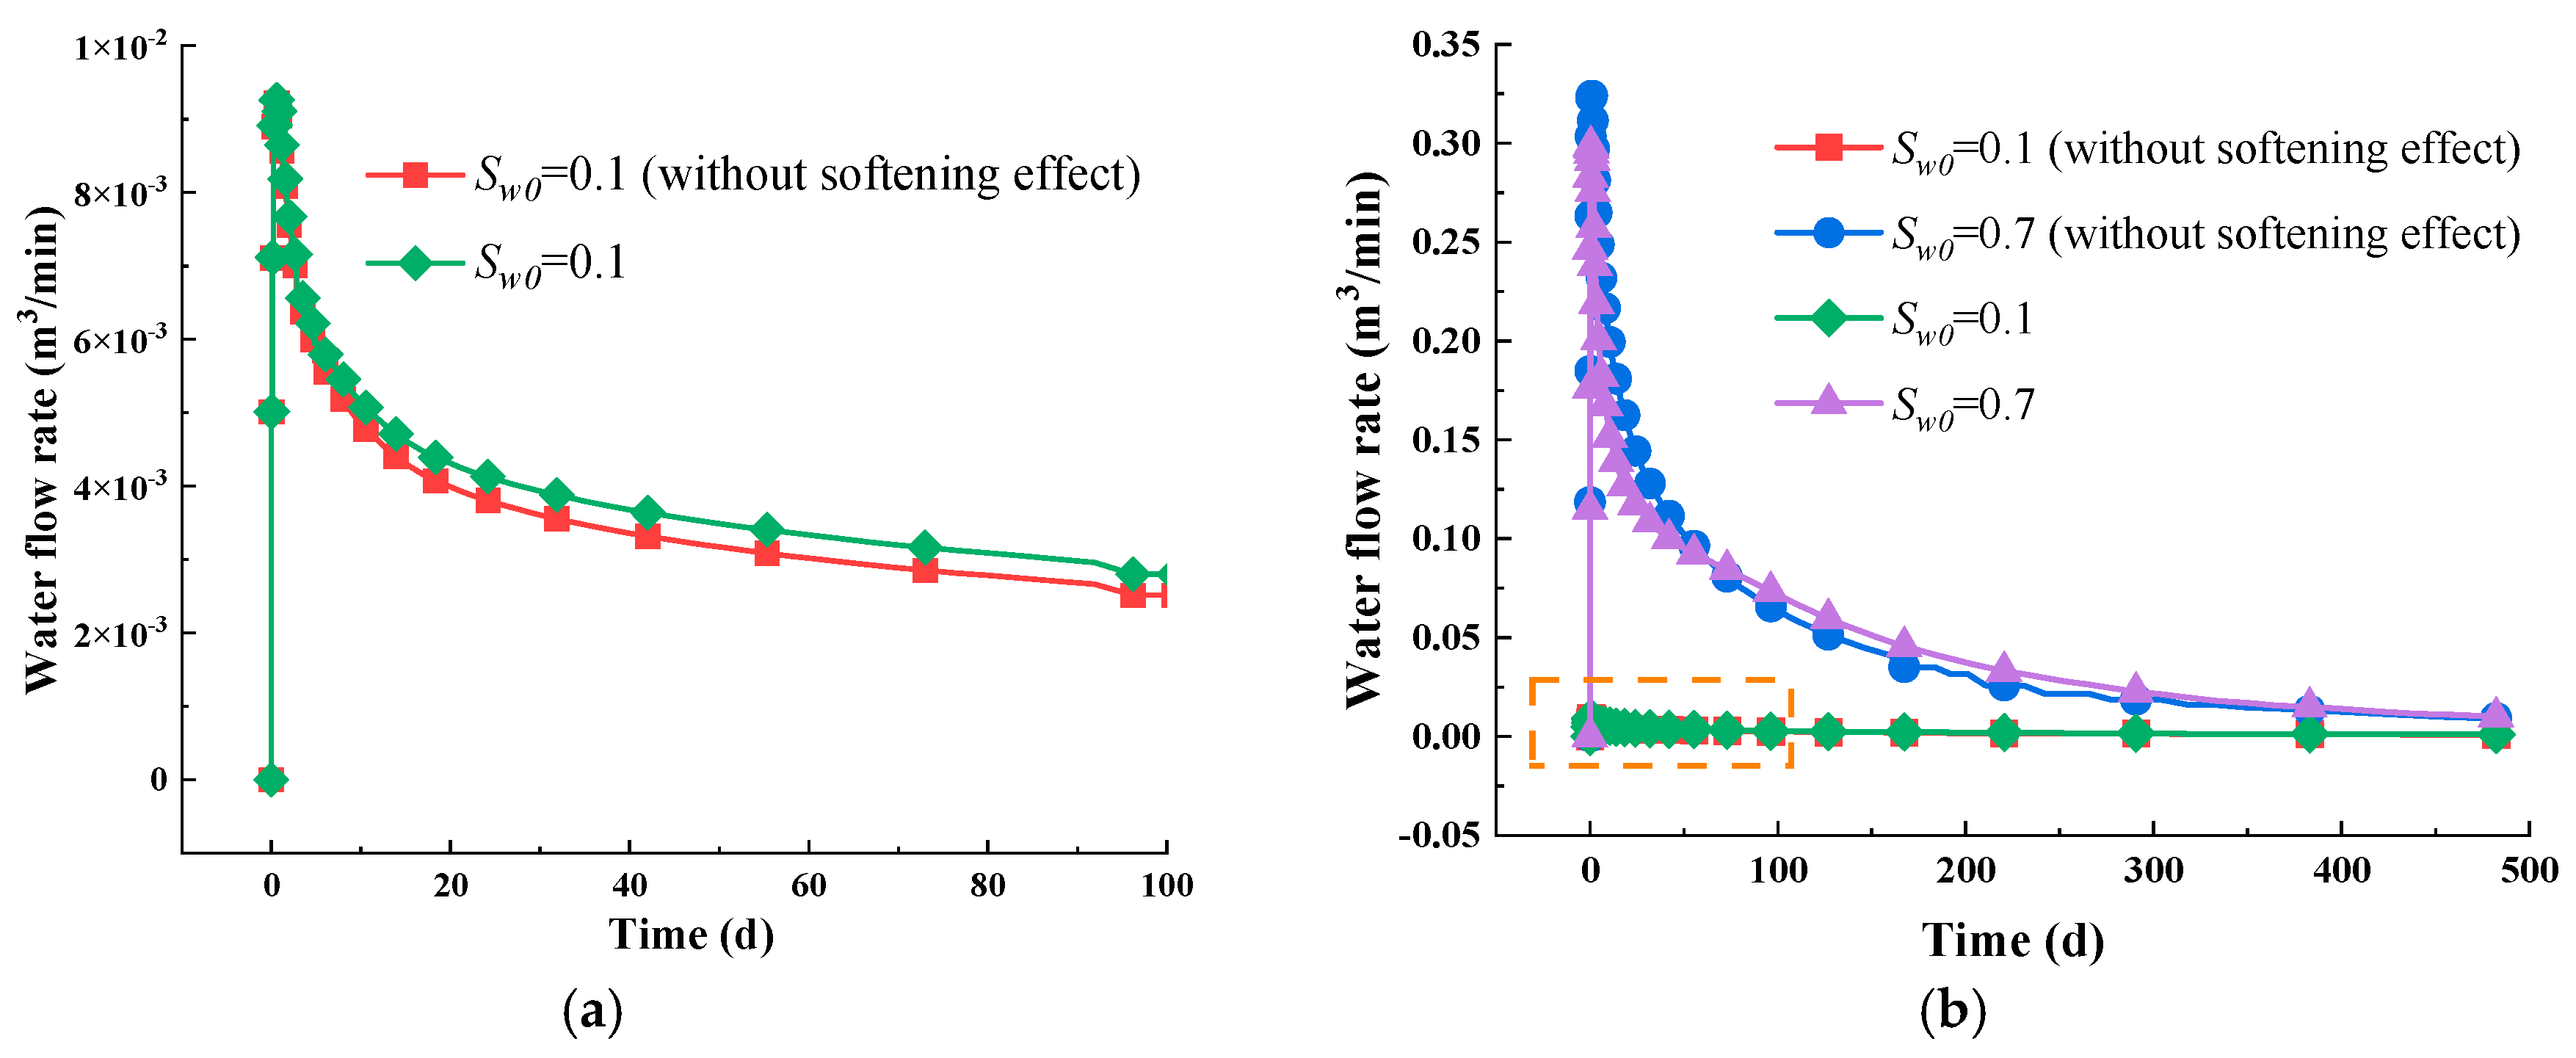
Figure 9 clearly shows that higher water saturation leads to an increased water flow rate. At a saturation level of 0.1, the water outflow is almost negligible. As water saturation changes, the flow rate first experiences a swift rise before gradually tapering off until it nears zero.
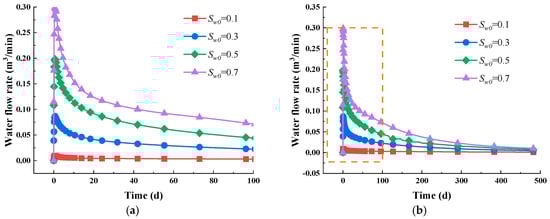
Figure 9.
Flow rate of water at different water saturation levels. (a) Water flow in the short term; (b) water flow in the long term.
5.3. Impact of the Water Immersion-Induced Softening Effect
Comparing Figure 10 with Figure 7, it is clear that the permeability in both the vertical and horizontal directions is significantly affected by the softening effect, especially in the former. When accounting for the softening effect, the intrinsic permeability ratio in the vertical direction stabilizes at about 0.9~1.0 (refer to Figure 7a,b), while it stabilizes at around 0.7 without the softening effect (refer to Figure 10a,b). Ignoring the softening effect of water, the intrinsic permeability in the vertical direction (Sw0 = 0.1, 0.3, 0.5) shows a quick initial drop under different water saturation conditions before exhibiting a slower decrease, as illustrated in Figure 10a,b. When Sw0 = 0.7, the intrinsic permeability ratio in the vertical direction first rapidly declines, then gradually increases, and finally slowly decreases. The reason is the same as that discussed in Section 5.2. Likewise, in the horizontal direction, intrinsic permeability first drops quickly and then decreases more gradually, as presented in Figure 10c,d. The horizontal direction is less influenced by the softening effect, and the intrinsic permeability ratio curves under varying water saturation levels display similar trends. At different water saturation levels, the ratio of intrinsic permeability in the vertical direction usually exceeds that in the horizontal direction. Ultimately, the permeability ratio stabilizes in the vertical direction within the range of 0.7 to 0.75, while in the horizontal direction, it stabilizes between 0.4 and 0.5.
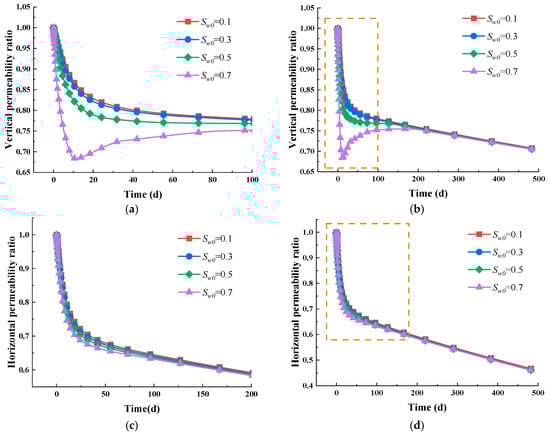
Figure 10.
Anisotropy permeability evolution without considering water immersion-induced softening. (a) Vertical permeability evolution in the short term; (b) vertical permeability evolution in the long term; (c) horizontal permeability evolution in the short term; (d) horizontal permeability evolution in the long term.
Figure 11a,b show that at water saturation of 0.1, the softening effect is minimal, leading to nearly identical curves for free gas flow rates in the scenarios both with and without this effect. At water saturation of 0.7, the softening effect greatly diminishes the gas flow rate. Conversely, as shown in Figure 11c,d, at water saturation of 0.1, the softening effect barely influences the gas depletion characteristics, making the curves of the adsorbed gas flow rates—both with and without the softening effect—nearly identical. The reduction in gas flow rate due to the softening effect becomes more noticeable at higher water saturation levels; adsorbed gas shows a more significant response compared to free gas.
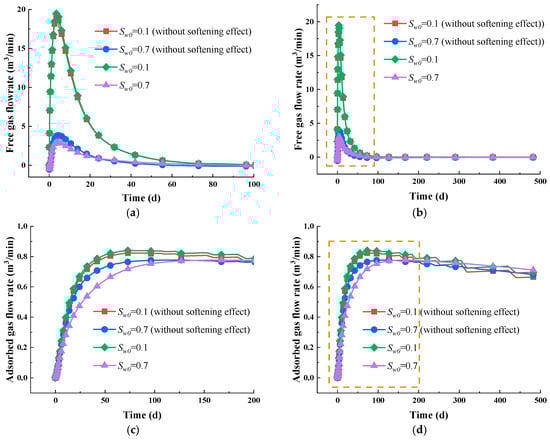
Figure 11.
Flow rates of free gas and adsorbed gas with and without considering water immersion-induced softening effect. (a) Free gas flow rate in the short term; (b) free gas flow rate in the long term; (c) adsorbed gas flow rate in the short term; (d) adsorbed gas flow rate in the long term.
Figure 12 illustrates that the softening effect considerably impacts the water flow rate. At water saturation of 0.1, the impact of this effect is minimal, leading to nearly identical water flow rate curves for both scenarios. However, a closer look reveals that the flow rate curve with the softening effect is slightly higher than that without. At water saturation of 0.7, the water flow rate curve without the softening effect starts off higher, but the curve that accounts for the softening effect eventually overtakes it in the later stage. This suggests that the softening effect significantly influences water flow dynamics, especially under conditions of high water saturation.
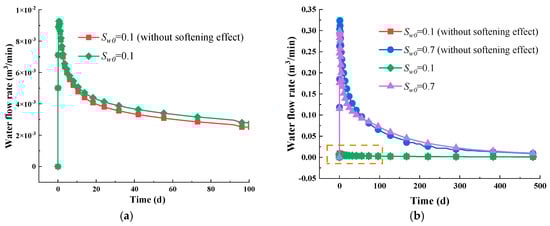
Figure 12.
Flow rates of water with and without considering water immersion-induced softening effect. (a) Water flow rate in the short term; (b) water flow rate in the long term.
5.4. Impact of the Water Immersion-Induced Anisotropy Effect
As depicted in Figure 13, it is clear that water immersion causes anisotropy, significantly affecting permeability in both directions, especially in the vertical direction. Considering induced anisotropy, the intrinsic permeability ratio in the vertical direction reaches its lowest value at about 0.4 (Figure 7a,b), while without anisotropy, this value is around 0.65 (Figure 13a,b). The changes in permeability in the horizontal direction show no significant differences with and without induced anisotropy when comparing Figure 7c,d with Figure 13c,d. Therefore, we can conclude that water immersion-induced anisotropy decreases the permeability value in the vertical direction. In line with the situation discussed in Section 5.2, under different water saturation conditions (Sw0 = 0.1, 0.3, 0.5), the intrinsic permeability in the vertical direction first experiences a quick and brief drop, which is then succeeded by a gradual increase (Figure 13a,b). Likewise, in the horizontal direction (Sw0 = 0.1, 0.3, 0.5), the permeability initially displays a sharp and short decline, followed by a slow and gradual decrease, as illustrated in Figure 13c,d. For the case of Sw0 = 0.7, the intrinsic permeability in the vertical direction quickly drops, then sharply increases, followed by a more gradual increase; in the horizontal direction, the permeability initially declines rapidly, ascends, and finally decreases gradually. The reasons have been discussed in Section 5.2. Additionally, we can deduce that the water immersion-induced anisotropy effect mainly causes a sharp decrease in early permeability evolution.
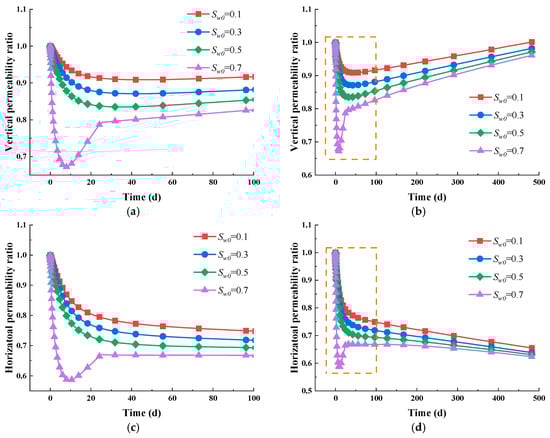
Figure 13.
Anisotropy permeability evolution without considering water immersion-induced anisotropy effect. (a) Vertical permeability evolution in the short term; (b) vertical permeability evolution in the long term; (c) horizontal permeability evolution in the short term; (d) Hhrizontal permeability evolution in the long term.
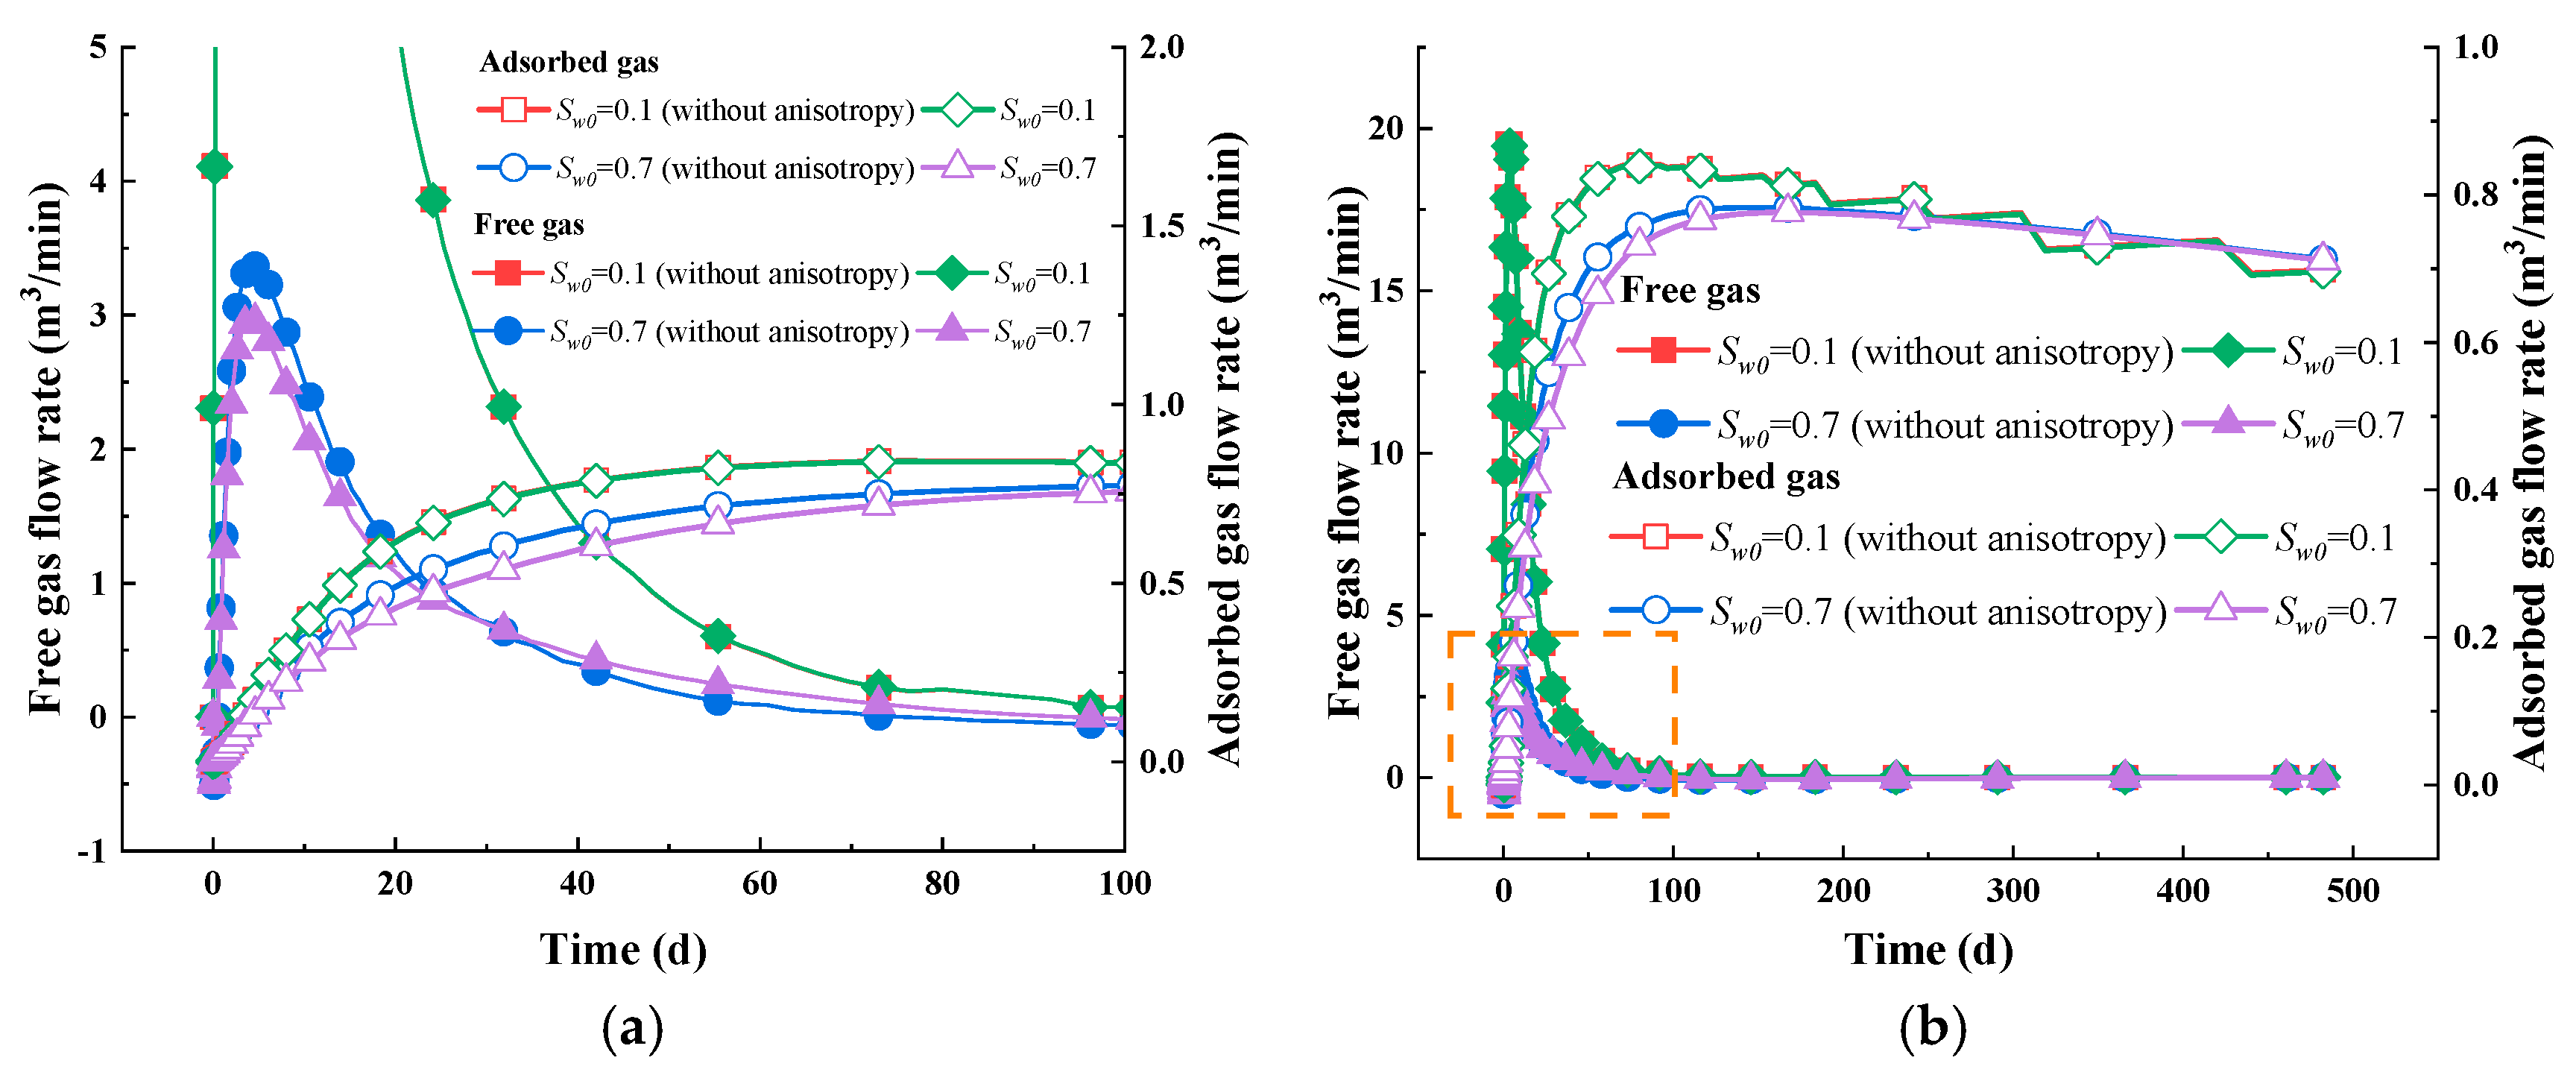
The gas production flow rate decreases with increasing water saturation. Figure 14 shows that at water saturation of 0.1, the effect of anisotropy is negligible, leading to nearly identical free gas flow rate curves for both scenarios with and without the consideration of water immersion-induced anisotropy. Meanwhile, anisotropy effects become clear, resulting in a decrease in the gas flow rate in the case of water-rich conditions (Sw0 = 0.7). At water saturation of 0.1, the impact of anisotropy is minimal, making the curves for adsorbed gas flow rates—both considering and ignoring anisotropy—nearly identical. However, anisotropy considerably decreases the adsorbed gas flow rate in the case of Sw0 = 0.7.
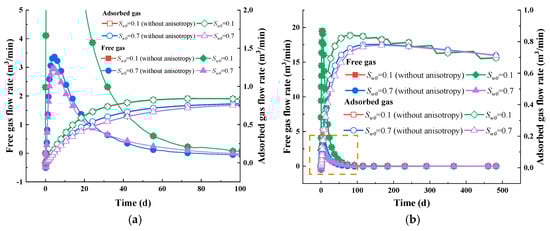
Figure 14.
Flow rates of free gas and adsorbed gas with and without considering water immersion-induced anisotropy. (a) Free gas and adsorbed gas flow rate in the short term; (b) free gas and adsorbed gas flow rate in the long term.
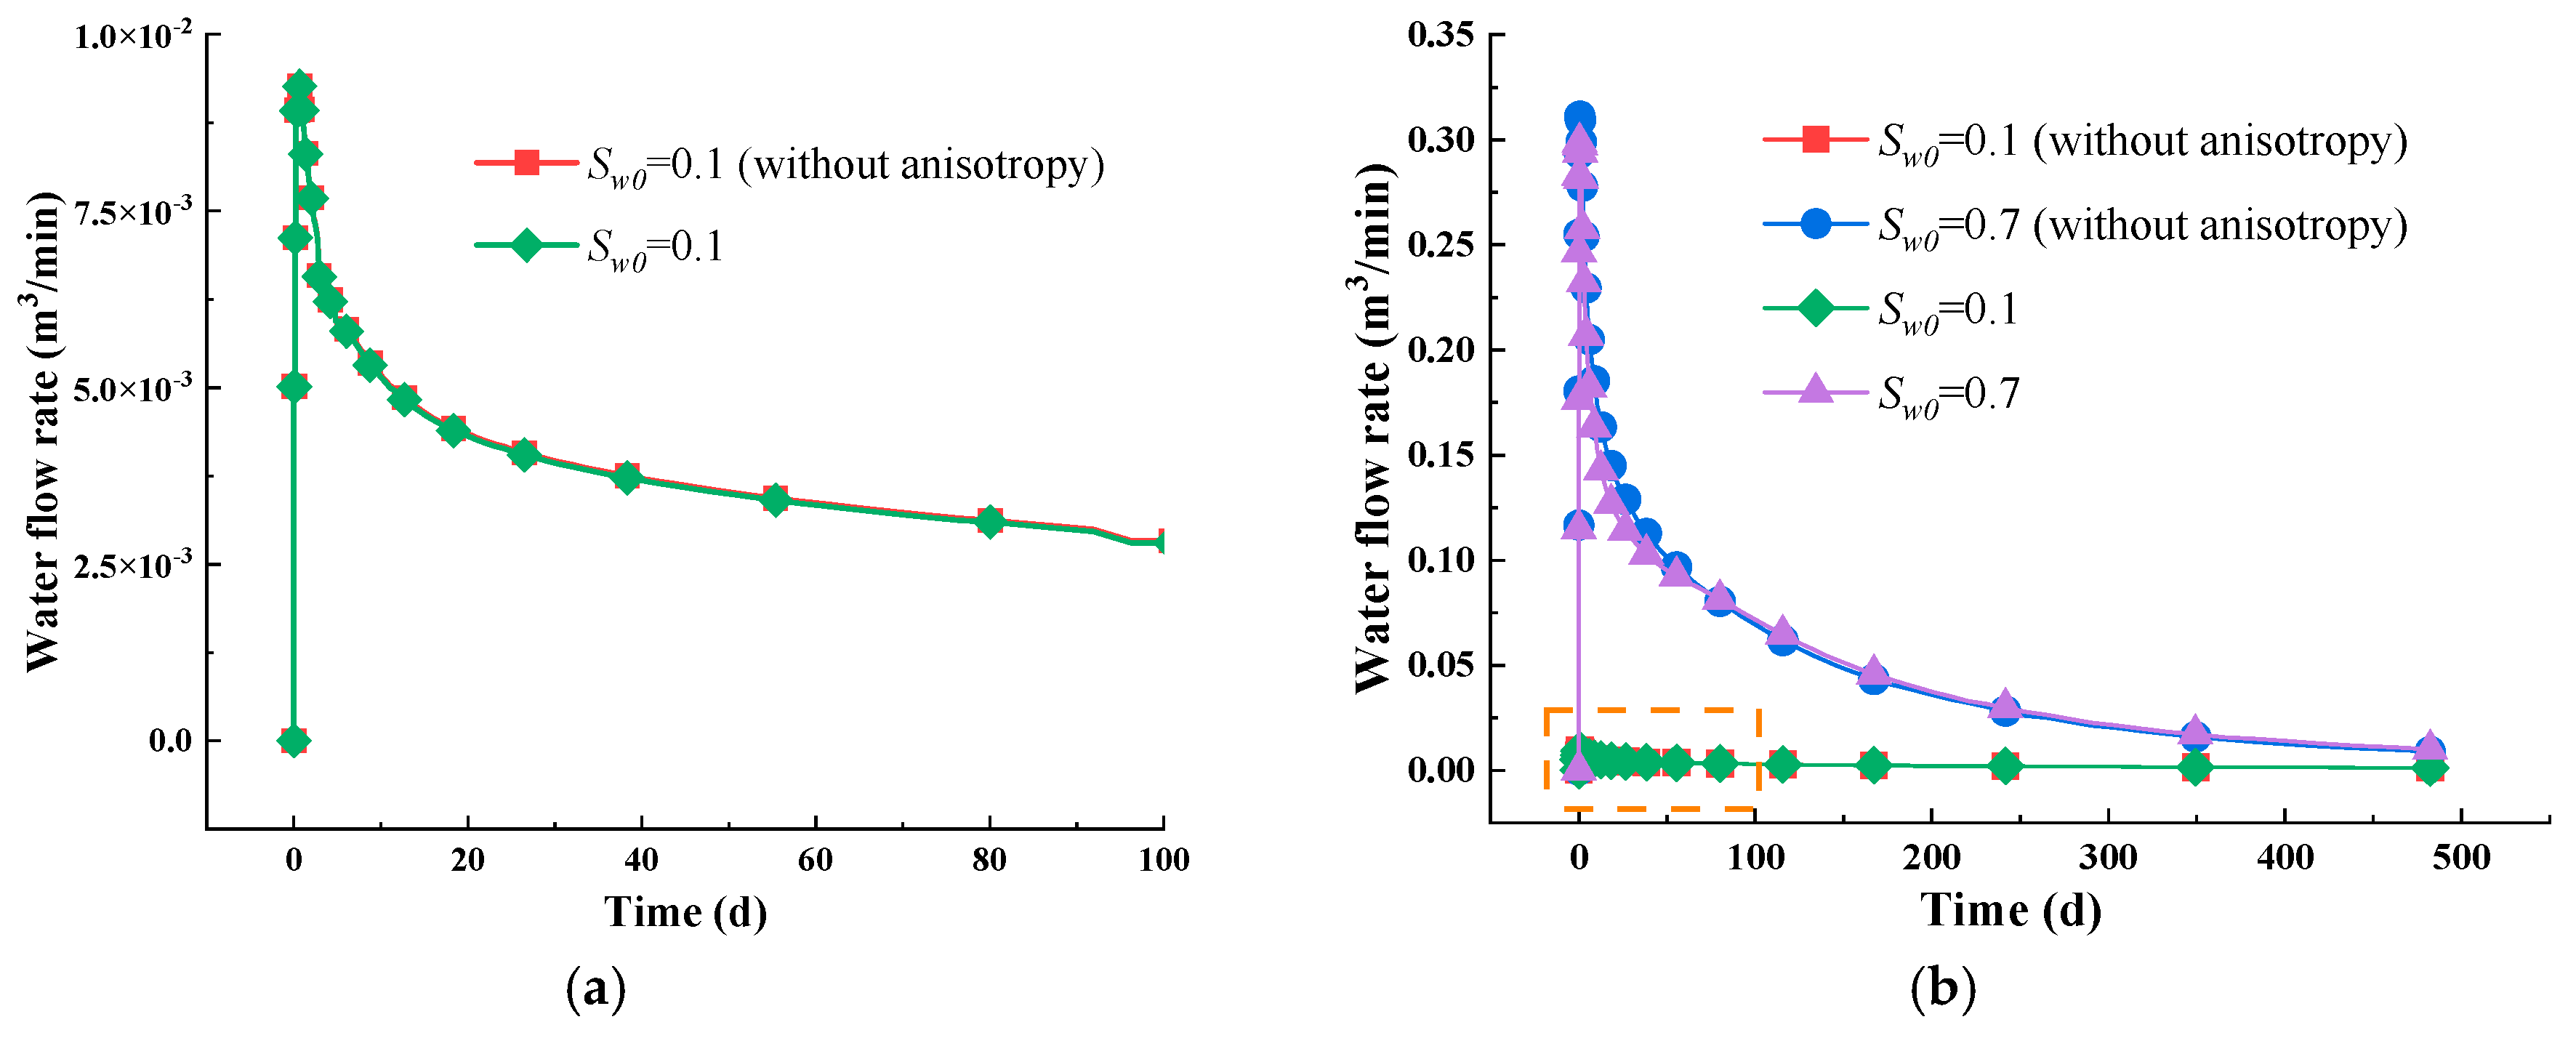
Figure 15 clearly shows that anisotropy slightly impacts the water flow rate. At water saturation of 0.1, anisotropy has a negligible effect, leading to similar water flow rate curves in both anisotropic and isotropic scenarios. However, in the case of a high water saturation level of 0.7, the water flow rate curve that does not account for anisotropy is moderately elevated. This suggests that the effects of anisotropy on water flow dynamics become gradually evident at higher water saturation levels.
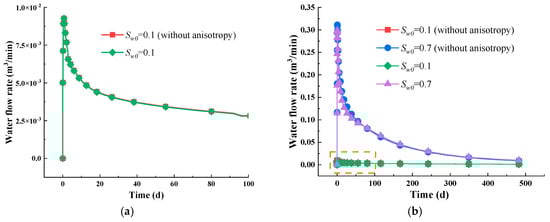
Figure 15.
Flow rates of water with and without considering water immersion-induced anisotropy effect. (a) Water flow rate in the short term; (b) water flow rate in the long term.
5.5. Impact of Initial Fracture Permeability
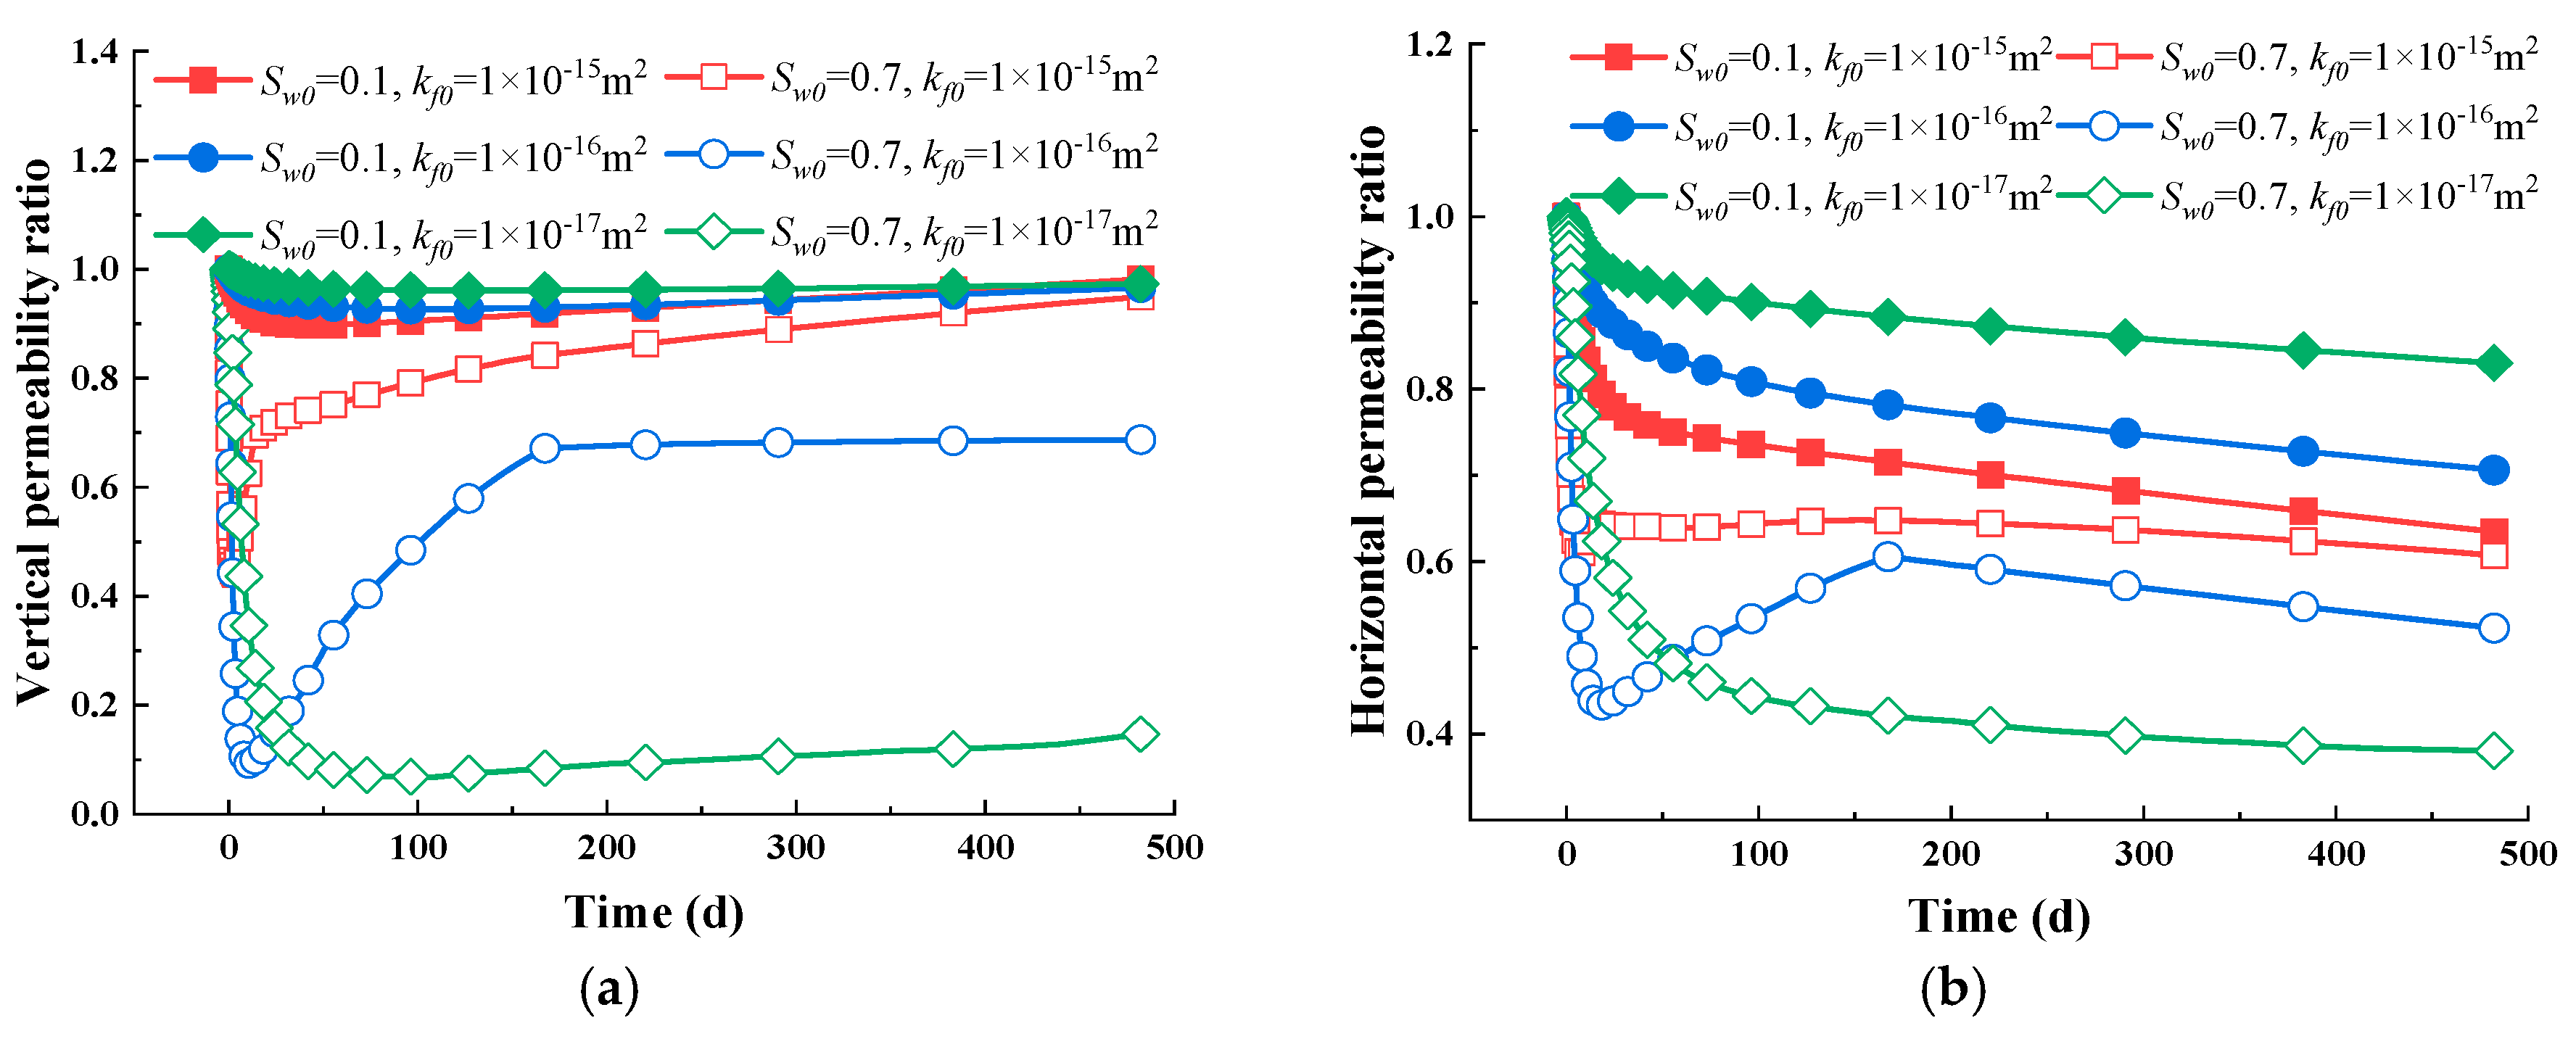
Figure 16a demonstrates that under water-scarce conditions (Sw0 = 0.1), differing initial permeability values have a minimal effect on the evolution of intrinsic permeability in the vertical direction. However, in water-rich conditions (Sw0 = 0.7), these varying initial permeability values significantly impact intrinsic permeability in the vertical direction. The computing scenarios show a similar pattern, where the case with higher permeability values returns to the initial value more swiftly. At the outset, the Young modulus in the horizontal direction is significantly affected by water induced-softening effects under high water saturation. As water exits, the fluid pressure drops, leading to an increase in effective stress. This results in a rapid initial decrease in intrinsic permeability in the vertical direction. During the intermediate stage, as water continues to exit, water saturation progressively diminishes, anisotropy becomes more evident, Young’s modulus increases, and permeability slowly increases. In the later stages, the water saturation level stays low and relatively constant. As gas escapes, the fluid pressure drops, while Young’s modulus largely remains stable and permeability gradually increases due to the adsorption effect.
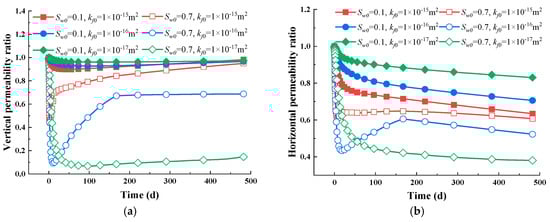
Figure 16.
Anisotropy permeability evolution with different initial permeability values under varied water saturation levels. (a) Vertical permeability evolution; (b) horizontal permeability evolution.
In the horizontal direction (Figure 16b), under conditions of low water saturation, a higher initial permeability value corresponds to reduced intrinsic permeability. In a water-saturated environment, lower initial permeability values lead to a smaller intrinsic permeability in the horizontal direction. As permeability values increase, water saturation has a diminished effect, allowing for quicker attainment of consistent permeability values. In water-scarce conditions, the horizontal permeability profile initially undergoes a sharp and rapid decline, followed by a more gradual decrease. Conversely, the horizontal permeability curve starts with a swift dip and then increases gradually, ultimately, decreasing slowly when the water saturation level is high.
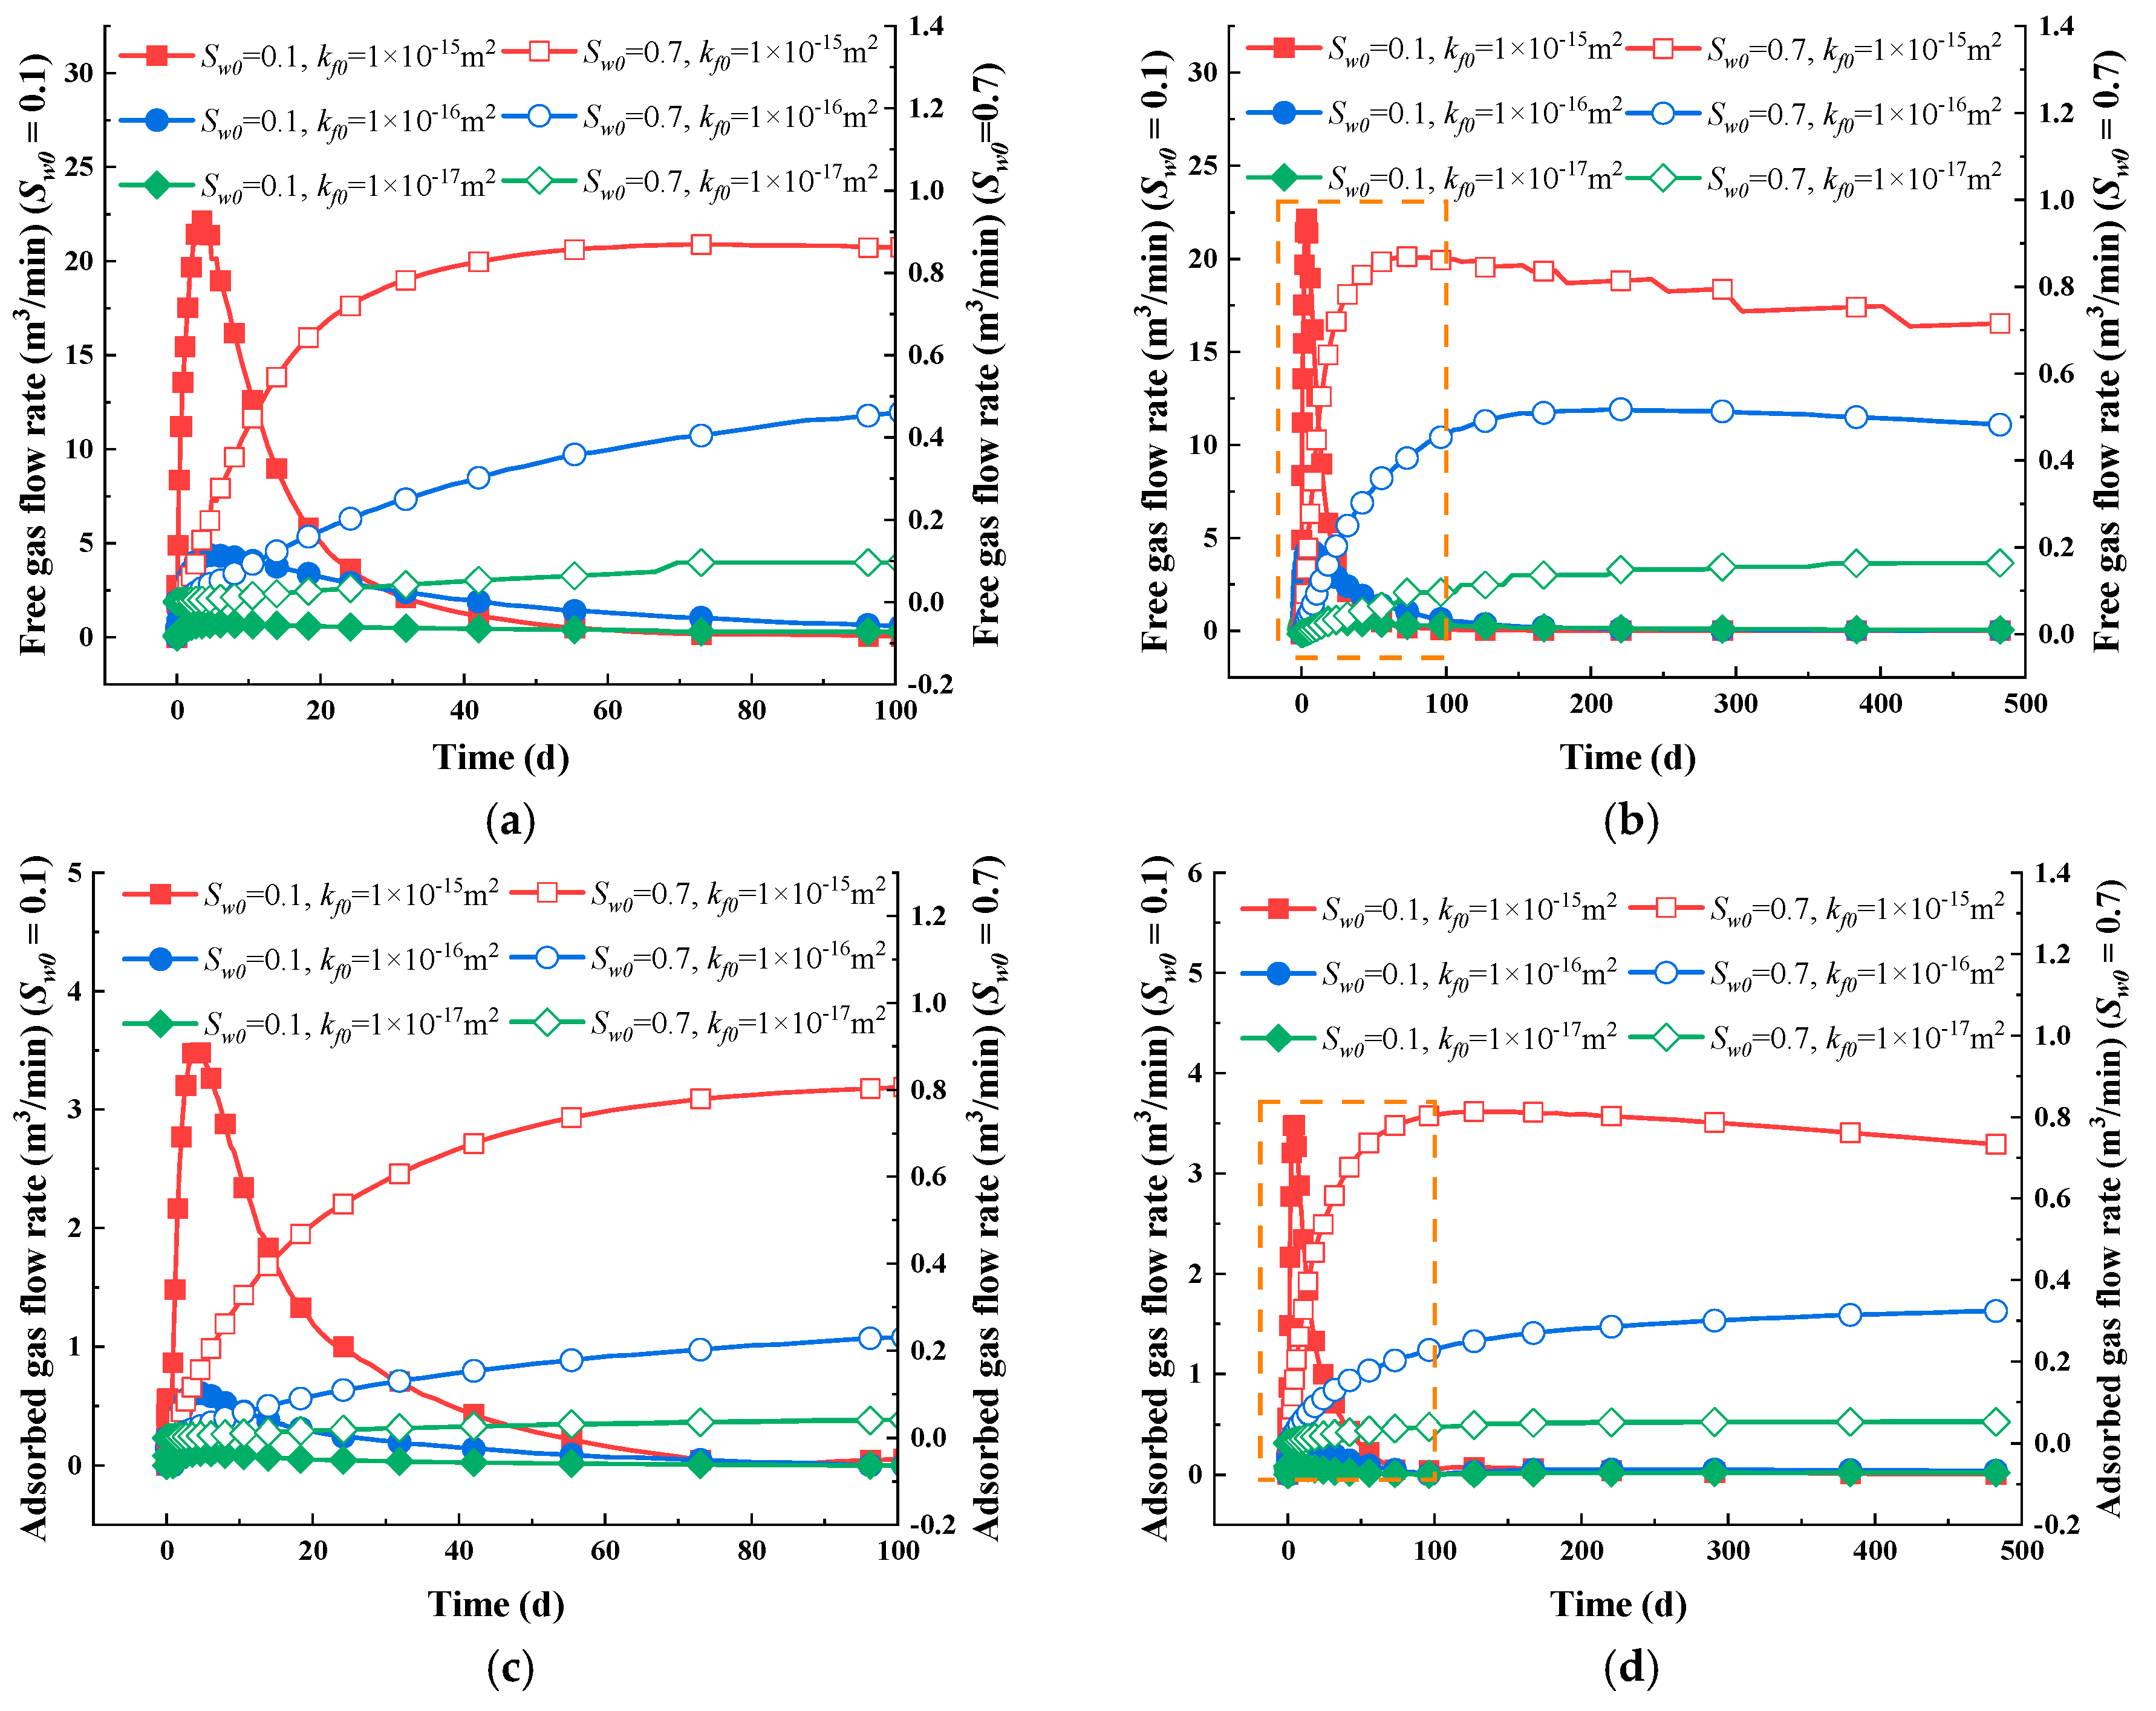
Figure 17a,b show that at water saturation of 0.1, the free gas flow rate curve first rises before subsequently decreasing. When kf0 equals 1 × 10⁻¹⁵ m2, the rising section of the curve is most prominent, showing the highest maximum flow rate. In contrast, when kf0 is set to 1 × 10⁻¹⁷ m2, the curve does not display any descending segment. At water saturation of 0.7, the free gas flow rate curve for high permeability initially increases rapidly but then declines. In contrast, for low-permeability cases, the curve only shows a continuous rise.
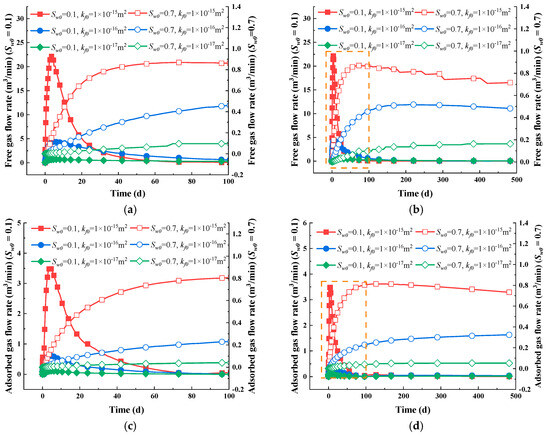
Figure 17.
Flow rates of free gas and adsorbed gas with different initial permeability values under varied water saturation levels. (a) Free gas flow rate in the short term; (b) free gas flow rate in the long term; (c) adsorbed gas flow rate in the short term; (d) adsorbed gas flow rate in the long term.
Figure 17c,d show that at water saturation of 0.1, the adsorbed gas flow rate initially rises before decreasing. When kf0 = 1 × 10⁻¹⁵ m2, the curve’s rising portion is most pronounced, resulting in the peak flow rate being the highest. At water saturation of 0.7, both free gas and adsorbed gas yield the highest production flow rate under high-permeability conditions.
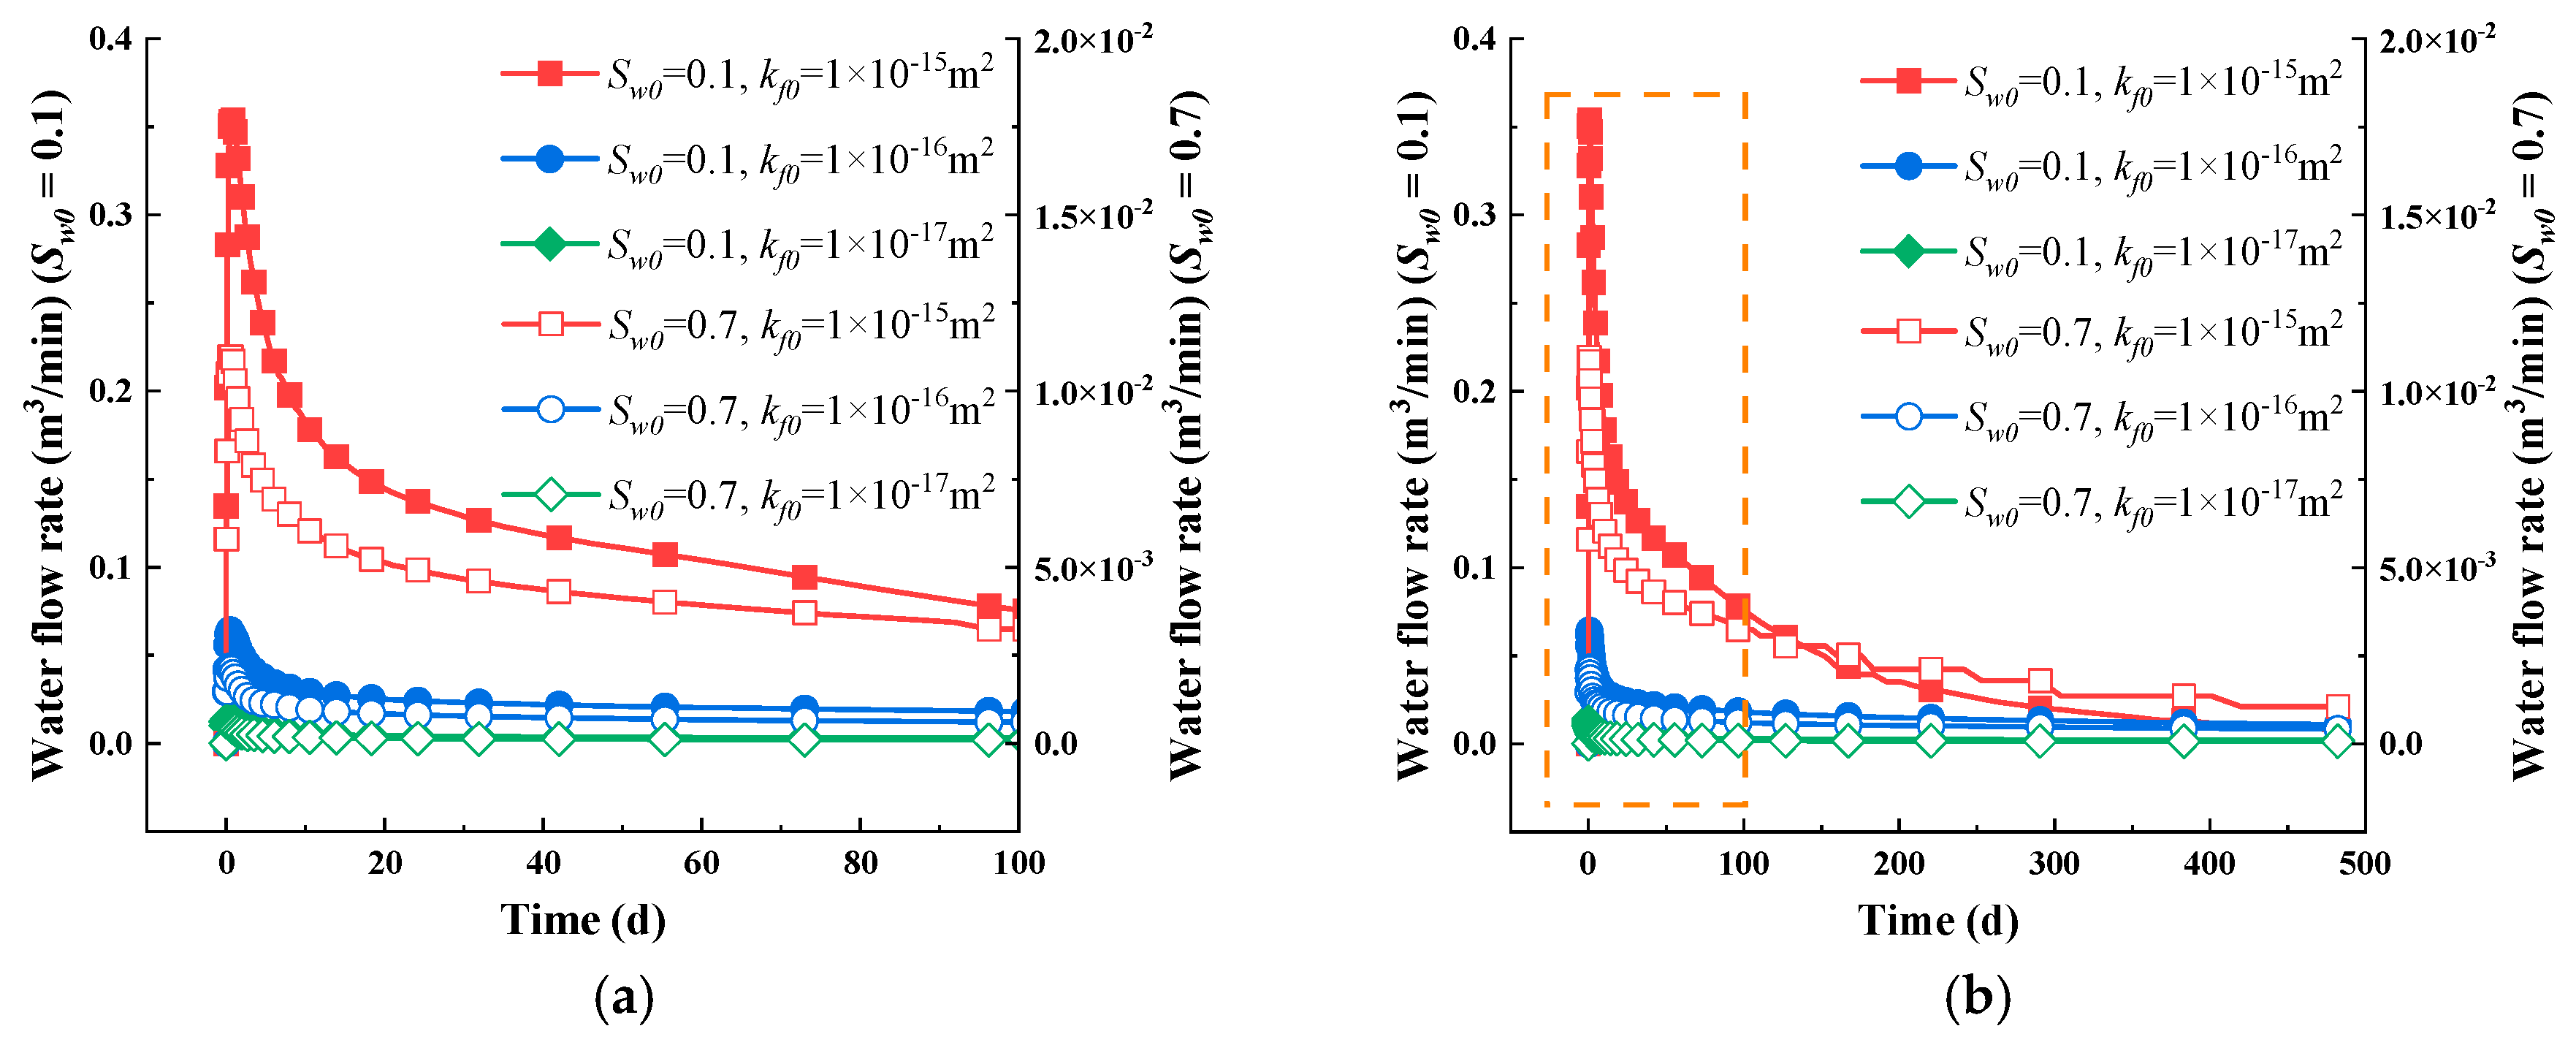
Figure 18 shows that with water saturation of 0.1 and 0.7, the water flow rate curve initially rises sharply before gradually declining. Greater initial permeability leads to a more noticeable upward trend and a higher peak flow rate. Under water-poor conditions, variations in permeability have a greater impact on production flow rates than in water-rich conditions.
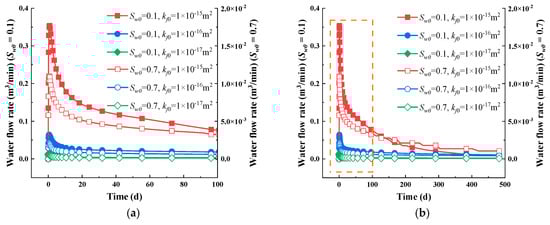
Figure 18.
Flow rates of water with different initial permeability values under varied water saturation levels. (a) Adsorbed gas flow rate in the short term; (b) Adsorbed gas flow rate in the long term.
6. Discussion
6.1. Guidance in Relation to Field Practice
The existence of water in the reservoir has the ability to significantly lower the gas flow rate through two approaches. (i) The water molecule occupies the flow channel, reducing the gas transport ability [67]. (ii) The non-deformability decreases with water content, which means more deformation is expected at higher water saturation levels. Based on the results, some suggestions can be given as guidance in relation to field practice. A hydrophobic environment is preferable for underground coalbed methane extraction. In a coal mine with abundant water, pre-drainage must be performed prior to gas extraction. In low-permeability coal reservoirs, water is retained for extended periods. This results in both the gas relative permeability and intrinsic permeability remaining low, which hinders gas flow. Therefore, the stimulation method should be applied to the low-permeability reservoir to allow water to move out quickly.
During hydraulic fracturing, the hydraulic fluid remains in the reservoir, increasing the water content. Therefore, waterless fracturing is highly recommended. Additionally, the residual water saturation would influence the water content during extended extraction times. Therefore, the reservoir stimulation method should enlarge the pore throat, ensuring that a smaller proportion of water is retained in the reservoir.
6.2. Limitations
This work certainly has some shortcomings due to the assumptions and the simplification of the model. In the model implementation process, the anisotropy and softening characteristics with the water saturation are artificially assumed. In this work, the exponential function is specified to describe the relationship between softening and anisotropy parameters with water saturation. This relationship may not be true for nature. The empirical parameter within the relative permeability model is also presumed synthetically, which should, instead, be determined in the gas–water two-phase flow test. Additionally, during the modeling process, the damage process associated with tunnel and borehole excavation is not considered [68,69], which may lead to errors in evaluating the gas depletion characteristics. A conceptual geology model is established, and the results are not verified against real-world field data.
6.3. Future Work
The relationship between softening and anisotropy parameters and water content should be determined through experimental work. Additionally, the values of some empirical parameters can be obtained. To this end, a centimeter-scale gas seepage experiment with a water-containing coal sample should be conducted using a triaxial rock seepage–stress coupling test system. An independent flow–pressure control system can regulate water saturation and gas pressure. In addition, temperature may be controlled to replicate the thermal environment of the reservoir. Linear Variable Displacement Transducers (LVDTs), installed in both axial and radial directions, are employed to measure the strain characteristics at varied water saturation levels. Thus, the softening and anisotropy parameters can be determined. The transient method is applied to determine the gas’s relative permeability at different gas pressure and water saturation levels. In this approach, the value of the empirical parameters in the relative permeability model (Equation (22)) can be obtained.
Additionally, more factors should be included in the numerical model. Most importantly, the damage process should be incorporated. To this end, the Mohr–Coulomb criterion [70,71] and maximum tensile stress criterion [72,73] can be used to determine the failure mode of the sample. The damage variable can be obtained from the stress–strain curve, and its relationship with permeability can be specified as an exponential function.
7. Conclusions
This study introduces a fluid flow–reservoir deformation coupling model that takes into account the mechanical anisotropy of coal seams, created through a blend of theoretical analysis and numerical simulation. The model incorporates the anisotropic characteristics of coal mechanical parameters and the effects of water softening in the gas–water two-phase flow process. It explores how the water immersion-induced changes in mechanical properties influence coal permeability and gas extraction production patterns. The following conclusions can be drawn:
- (1)
- The gas depletion process involves a gas–water two-phase flow process that can be divided into three distinct stages. Firstly, water dominates the flow, and as a result, the relative permeability of the water decreases, whereas that of gas increases. Then, the free gas depletes out, leading to the mixed flow of gas and water. As the pressure drops, adsorbed gas slowly desorbs and moves into the fracture system, eventually resulting in a gas-dominated flow stage.
- (2)
- Intrinsic permeability shows directional differences. In the vertical direction, permeability is primarily influenced by horizontal deformation, and later by a combination of adsorption strain and horizontal deformation. In the horizontal direction, permeability is primarily influenced by vertical deformation.
- (3)
- The water immersion-induced changes in the mechanical properties have the ability to reduce the permeabilities in both the vertical and horizontal directions, especially in the former. When Sw0 is 0.7, the vertical permeability decreases by 60%, while the horizontal permeability decreases by 43%. Ultimately, the vertical permeability ratio stabilizes between 0.9 and 1.0, while the horizontal permeability ratio stabilizes in the range of 0.6 to 0.7.
- (4)
- The impact of initial permeability on the gas depletion characteristics depends on the level of water saturation. Under water-scarce conditions (Sw0 = 0.1), differing initial permeability values have a minimal effect on the evolution pattern of intrinsic permeability. In contrast, in water-abundant conditions (Sw0 = 0.7), increased initial permeability values promote a faster return to the initial permeability; meanwhile, the permeability is significantly reduced and stays at a lower value when the initial permeability is low.
Author Contributions
Methodology, Q.N.; Formal analysis, H.Z.; Writing—original draft, Y.T. and X.C.; Writing—review & editing, Y.T. and G.C. All authors have read and agreed to the published version of the manuscript.
Funding
This work was financially supported by the Basic Research Project of Shijiazhuang Universities in Hebei Province (241790687A), the Key Laboratory of the Ministry of Education for Safe Mining of Deep Metal Mines of Northeastern University (DM2023B02), the National Key Research and Development Program of China (2021YFC2902101), and the National Natural Science Foundation of China (12002081).
Data Availability Statement
The original contributions presented in this study are included in the article. Further inquiries can be directed to the corresponding author.
Conflicts of Interest
The authors declare no conflicts of interest.
References
- Joshi, D.; Prajapati, P.; Sharma, P.; Sharma, A. Past, present and future of Coal Bed Methane (CBM): A review with special focus on the Indian scenario. Int. J. Coal Prep. Util. 2022, 43, 377–402. [Google Scholar] [CrossRef]
- Tu, Z.; Li, L.; Wang, F.; Zhang, Y. Review on separation of coalbed methane by hydrate method. Fuel 2024, 358, 130224. [Google Scholar] [CrossRef]
- Shi, J.-Q.; Durucan, S.; Shimada, S. How gas adsorption and swelling affects permeability of coal: A new modelling approach for analysing laboratory test data. Int. J. Coal Geol. 2014, 128–129, 134–142. [Google Scholar] [CrossRef]
- Pan, Z.; Connell, L.D. Modelling of anisotropic coal swelling and its impact on permeability behaviour for primary and enhanced coalbed methane recovery. Int. J. Coal Geol. 2011, 85, 257–267. [Google Scholar] [CrossRef]
- Zhang, H.; Liu, J.; Elsworth, D. How sorption-induced matrix deformation affects gas flow in coal seams: A new FE model. Int. J. Rock Mech. Min. Sci. 2008, 45, 1226–1236. [Google Scholar] [CrossRef]
- Clarkson, C.R.; Pan, Z.; Palmer, I.D.; Harpalani, S. Predicting sorption-induced strain and permeability increase with depletion for CBM reservoirs. In SPE Annual Technical Conference and Exhibition; Society of Petroleum Engineers: Denver, CO, USA, 2008. [Google Scholar]
- Pan, Z.; Connell, L.D. Modelling permeability for coal reservoirs: A review of analytical models and testing data. Int. J. Coal Geol. 2012, 92, 1–44. [Google Scholar] [CrossRef]
- Pan, Z.; Connell, L.D.; Camilleri, M. Laboratory characterisation of coal reservoir permeability for primary and enhanced coalbed methane recovery. Int. J. Coal Geol. 2010, 82, 252–261. [Google Scholar] [CrossRef]
- Cui, X.; Bustin, R.M. Volumetric strain associated with methane desorption and its impact on coalbed gas production from deep coal seams. AAPG Bull. 2005, 89, 1181–1202. [Google Scholar] [CrossRef]
- Santiago, V.; Zabala, F.; Sanchez-Barra, A.; Deisman, N.; Chalaturnyk, R.; Zhong, R.; Hurter, S. Experimental investigation of the flow properties of layered coal-rock analogues. Chem. Eng. Res. Des. 2022, 186, 685–700. [Google Scholar] [CrossRef]
- Perera, M.S.A.; Ranjith, P.G. Carbon dioxide sequestration effects on coal’s hydro-mechanical properties: A review. Int. J. Energy Res. 2012, 36, 1015–1031. [Google Scholar] [CrossRef]
- Yang, D.; Qi, X.; Chen, W.; Wang, S.; Dai, F. Numerical investigation on the coupled gas-solid behavior of coal using an improved anisotropic permeability model. J. Nat. Gas Sci. Eng. 2016, 34, 226–235. [Google Scholar] [CrossRef]
- Zhou, H.W.; Rong, T.L.; Wang, L.J.; Mou, R.Y.; Ren, W.G. A new anisotropic coal permeability model under the influence of stress, gas sorption and temperature: Development and verification. Int. J. Rock Mech. Min. Sci. 2020, 132, 104407. [Google Scholar] [CrossRef]
- Li, J.; Li, B.; Wang, Z.; Ren, C.; Yang, K.; Gao, Z. A permeability model for anisotropic coal masses under different stress conditions. J. Pet. Sci. Eng. 2021, 198, 108197. [Google Scholar] [CrossRef]
- Li, J.; Li, B.; Cheng, Q.; Gao, Z. Characterization of anisotropic coal permeability with the effect of sorption-induced deformation and stress. Fuel 2022, 309, 122089. [Google Scholar] [CrossRef]
- Geng, Y.; Tang, D.; Xu, H.; Tao, S.; Tang, S.; Ma, L.; Zhu, X. Experimental study on permeability stress sensitivity of reconstituted granular coal with different lithotypes. Fuel 2017, 202, 12–22. [Google Scholar] [CrossRef]
- Niu, Q.; Wang, X.; Chang, J.; Wang, W.; Liu, X.; Wang, Q. Influencing mechanisms of multi-scale pore-fracture responses of coals on their macro/micromechanical behaviors under ScCO2 injection. Adv. Geo-Energy Res. 2024, 14, 64–80. [Google Scholar] [CrossRef]
- Niu, Q.; Cao, L.; Sang, S.; Wang, W.; Zhou, X.; Yuan, W.; Ji, Z.; Chang, J.; Li, M. Experimental study on the softening effect and mechanism of anthracite with CO2 injection. Int. J. Rock Mech. Min. Sci. 2021, 138, 104614. [Google Scholar] [CrossRef]
- Srivastava, M.K.; Kishor, K.; Singh, A.K.; Mukherjee, S.; Bharti, S.K. Tectonically deformed coal: Focus on microstructures & implications for basin evolution. Mar. Pet. Geol. 2025, 172, 107223. [Google Scholar]
- He, M.; Wang, H.; Ma, C.; Zhang, Z.; Li, N. Evaluating the anisotropy of drilling mechanical characteristics of rock in the process of digital drilling. Rock Mech. Rock Eng. 2023, 56, 3659–3677. [Google Scholar] [CrossRef]
- Zhang, Q.; Li, X.; Li, B.; Meng, J.; Nie, B.; Lu, W. Mechanical heterogeneity characterization of coal materials based on nano-indentation experiments. J. Cent. South Univ. 2024, 31, 3142–3155. [Google Scholar] [CrossRef]
- Manjunath, G.L.; Jha, B. Geomechanical characterization of gondwana shale across nano-micro-meso scales. Int. J. Rock Mech. Min. Sci. 2019, 119, 35–45. [Google Scholar] [CrossRef]
- Zhou, X.; Li, X.; Bai, G.; Chai, L.; Wang, Y.; Xiao, M.; Xia, S. Research method of pressure relief and permeability enhancement in low permeability coal seam: A review. AIP Adv. 2022, 12, 010702. [Google Scholar] [CrossRef]
- Li, M.; Sun, M.; Mohammadian, E.; Ji, Y.; Blach, T.P.; Ostadhassan, M.; Wen, J.; Wu, C.; Pan, Z. Confinement effect in nanopores of shale and coal reservoirs: A review on experimental characterization methods. J. Nat. Gas Sci. Eng. 2024, 123, 205249. [Google Scholar] [CrossRef]
- Lu, Y.; Zhang, H.; Zhou, Z.; Ge, Z.; Chen, C.; Hou, Y.; Ye, M. Current status and effective suggestions for efficient exploitation of coalbed methane in China: A review. Energy Fuels 2021, 35, 9102–9123. [Google Scholar] [CrossRef]
- Sheng, J. Enhanced oil recovery in shale reservoirs by gas injection. J. Nat. Gas Sci. Eng. 2015, 22, 252–259. [Google Scholar] [CrossRef]
- Qin, Q.; Zhou, K.; Wei, B.; Du, Q.; Liu, Y.; Li, X.; Hou, J. Experimental and simulation study on deep reservoir fracturing technology: A review and future perspectives. Geo. Sci. Eng. 2024, 242, 213209. [Google Scholar] [CrossRef]
- Gale, J.F.W.; Laubach, S.E.; Olson, J.E.; Eichhuble, P.; Fall, A. Natural fractures in shale: A review and new observations. AAPG Bull. 2014, 98, 2165–2216. [Google Scholar] [CrossRef]
- Gregory, K.B.; Vidic, R.D.; Dzombak, D.A. Water management challenges associated with the production of shale gas by hydraulic fracturing. Elements 2011, 7, 181–186. [Google Scholar] [CrossRef]
- Guo, T.; Zhang, S.; Qu, Z.; Zhou, T.; Xiao, Y.; Gao, J. Experimental study of hydraulic fracturing for shale by stimulated reservoir volume. Fuel 2014, 128, 373–380. [Google Scholar] [CrossRef]
- Wang, K.; Guo, L.; Xu, C.; Wang, W.; Yang, T.; Lin, S.; Cai, Y. Multiscale characteristics of pore-fracture structures in coal reservoirs and their influence on coalbed methane (CBM) transport: A review. Geo. Sci. Eng. 2024, 242, 213181. [Google Scholar] [CrossRef]
- Wang, H. Discrete fracture networks modeling of shale gas production and revisit rate transient analysis in heterogeneous fractured reservoirs. J. Pet. Sci. Eng. 2018, 169, 796–812. [Google Scholar] [CrossRef]
- Afagwu, C.; Abubakar, I.; Kalam, S.; Al-Afnan, S.F.; Awotunde, A.A. Pressure-transient analysis in shale gas reservoirs: A review. J. Nat. Gas Sci. Eng. 2020, 78, 103319. [Google Scholar] [CrossRef]
- Gao, Q.; Liu, J.; Huang, Y.; Li, W.; Shi, R.; Leong, Y.-K.; Elsworth, D. A critical review of coal permeability models. Fuel 2022, 326, 125124. [Google Scholar] [CrossRef]
- Liu, Y.; Tang, D.; Xu, H.; Zhao, T.; Hou, W. Effect of interlayer mechanical properties on initiation and propagation of hydraulic fracturing in laminated coal reservoirs. J. Pet. Sci. Eng. 2022, 208, 109381. [Google Scholar] [CrossRef]
- Chen, Y.; Jiang, C.; Leung, J.Y.; Wojtanowicz, A.K.; Zhang, D. Gas slippage in anisotropically-stressed shale: An experimental study. J. Pet. Sci. Eng. 2020, 195, 107620. [Google Scholar] [CrossRef]
- Ren, Y.; Yuan, Q.; Jiang, D.; Fan, J.; Liu, W.; Wei, L.; Wang, Z. A non-Darcy gas flow model for coalbed methane in mine gobs. Phys. Fluids 2021, 33, 116601. [Google Scholar] [CrossRef]
- Clarkson, C.; Bustin, R.; Levy, J. Application of the mono/multilayer and adsorption potential theories to coal methane adsorption isotherms at elevated temperature and pressure. Carbon 1997, 35, 1689–1705. [Google Scholar] [CrossRef]
- Brunauer, S.; Emmett, P.H.; Teller, E. Adsorption of gases in multimolecular layers. J. Am. Chem. Soc. 1938, 60, 309–319. [Google Scholar] [CrossRef]
- Chugh, Y. Laboratory Characterization of Immediate Floor Strata Associated with Coal Seams in lllinois. lllinois Mine Subsidence Research Program; lllinois State Geological Survey: Champaign, IL, USA, 1986. [Google Scholar]
- Niu, Q.; Cao, L.; Sang, S.; Zhou, X.; Wang, Z. Anisotropic adsorption swelling and permeability characteristics with injecting CO2 in coal. Energy Fuels 2018, 32, 1979–1991. [Google Scholar] [CrossRef]
- Peng, Y.; Liu, J.; Pan, Z.; Connell, L.D.; Chen, Z.; Qu, H. Impact of coal matrix strains on the evolution of permeability. Fuel 2017, 189, 270–283. [Google Scholar] [CrossRef]
- Xia, T.; Zhou, F.; Liu, J.; Hu, S.; Liu, Y. A fully coupled coal deformation and compositional flow model for the control of the pre-mining coal seam gas extraction. Int. J. Rock Mech. Min. Sci. 2014, 72, 138–148. [Google Scholar] [CrossRef]
- Wu, Y.; Liu, J.; Chen, Z.; Elsworth, D.; Pone, D. A dual poroelastic model for CO2-enhanced coalbed methane recovery. Int. J. Coal Geol. 2011, 86, 177–189. [Google Scholar] [CrossRef]
- Cheng, W.; Guo, Y.; Cui, G.; Elsworth, D.; Tan, Y.; Pan, Z. Impact of micro-scale characteristics of shale reservoirs on gasdepletion behavior: A microscale discrete model. Adv. Geo-Energy Res. 2025, 15, 143–157. [Google Scholar] [CrossRef]
- Hui, G.; Chen, S.; Gu, F. Strike-Slip fault reactivation triggered by hydraulic-natural fracture propagation during fracturing stimulations near clark lake, Alberta. Energy Fuels 2024, 38, 18547–18555. [Google Scholar] [CrossRef]
- Sun, Z.; Elsworth, D.; Cui, G.; Li, Y.; Zhu, A.; Chen, T. Impacts of rate of change in effective stress and inertial effects on fault slip behavior: New insights into injection-induced earthquakes. J. Geophys. Res. Solid Earth 2024, 129, e2023JB027126. [Google Scholar] [CrossRef]
- Cui, G.; Tan, Y.; Chen, T.; Feng, X.-T.; Elsworth, D.; Pan, Z.; Wang, C. Multidomain Two-Phase Flow Model to Study the Impacts of Hydraulic Fracturing on Shale Gas Production. Energy Fuels 2020, 34, 4273–4288. [Google Scholar] [CrossRef]
- Dongari, N.; Sharma, A.; Durst, F. Pressure-driven diffusive gas flows in micro-channels: From the Knudsen to the continuum regimes. Microfluid. Nanofluid. 2009, 6, 679–692. [Google Scholar] [CrossRef]
- Geng, L.; Li, G.; Zitha, P.; Tian, S.; Sheng, M.; Fan, X. A diffusion–viscous flow model for simulating shale gas transport in nano-pores. Fuel 2016, 181, 887–894. [Google Scholar] [CrossRef]
- Miao, Y.; Li, X.; Zhou, Y.; Lee, J.; Sun, Z.; Chang, Y.; Wang, S.; Hou, C. A new rate-transient analysis model for shale gas reservoirs coupled the effect of slip flow and surface diffusion. Int. J. Heat Mass Transf. 2018, 124, 1–10. [Google Scholar] [CrossRef]
- Darabi, H.; Ettehad, A.; Javadpour, F.; Sepehrnoori, K. Gas flow in ultra-tight shale strata. J. Fluid Mech. 2012, 710, 641–658. [Google Scholar] [CrossRef]
- Menéndez, J.; Loredo, J.; Galdo, M.; Fernández-Oro, J.M. Energy storage in underground coal mines in NW Spain: Assessment of an underground lower water reservoir and preliminary energy balance. Renew. Energy 2019, 134, 1381–1391. [Google Scholar] [CrossRef]
- Brooks, R.H.; Corey, A.T. Properties of porous media affecting fluid flow. Irrig. Drain. 1966, 92, 61–90. [Google Scholar] [CrossRef]
- Leverett, M. Capillary behavior in porous solids. Trans. AIME 1941, 142, 152–169. [Google Scholar] [CrossRef]
- Alexis, D.A. Evaluation of Fluid Transport Properties of Coal Bed Methane Reservoirs. Ph.D. Thesis, The Pennsylvania State University, University Park, PA, USA, 2013. [Google Scholar]
- Cheng, W.; Cui, G.; Tan, Y.; Elsworth, D.; Wang, C.; Yang, C.; Chen, T.; Jiang, C. A multi-layer nanocased model to explain the U-shaped evolution of shale gas permeability at constant confining pressure. Fuel 2024, 359, 130478. [Google Scholar] [CrossRef]
- Huang, Y.; Liu, J.; Elsworth, D.; Leong, Y.-K. A transient dual porosity/permeability model for coal multiphysics. Geomech. Geophys. Geo-Energy Geo-Resour. 2022, 8, 40. [Google Scholar] [CrossRef]
- COMSOL COMSOL Multiphysics; COMSOL AB: Stockholm, Sweden, 2017.
- Ma, T.; Rutqvist, J.; Oldenburg, C.M.; Liu, W.; Chen, J. Fully coupled two-phase flow and poromechanics modeling of coalbed methane recovery: Impact of geomechanics on production rate. J. Nat. Gas Sci. Eng. 2017, 45, 474–486. [Google Scholar] [CrossRef]
- Ahamed, M.A.A.; Perera, M.S.A.; Matthai, S.K.; Ranjith, P.G.; Li, D.Y. Coal composition and structural variation with rank and its influence on the coal-moisture interactions under coal seam temperature conditions-A review article. J. Pet. Sci. Eng. 2019, 180, 901–917. [Google Scholar] [CrossRef]
- Perera, M.S.A.; Ranathunga, A.S.; Ranjith, P.G. Effect of coal rank on various fluid saturations creating mechanical property alterations using Australian coals. Energies 2016, 9, 440. [Google Scholar] [CrossRef]
- Durucan, S.; Ahsan, M.; Syed, A.; Shi, J.Q.; Korre, A. Two phase relative permeability of gas and water in coal for enhanced coalbed methane recovery and CO2 storage. Energy Procedia 2013, 37, 6730–6737. [Google Scholar] [CrossRef]
- Ahsan, M. An Investigation into Gas Flow and Retention Characteristics of Coal Seams for Enhanced Coalbed Methane Recovery and Carbon Dioxide Storage. Ph.D. Thesis, Imperial College London (University of London), London, UK, 2006. [Google Scholar]
- Jasinge, D.; Ranjith, P.G.; Choi, S.K. Effects of effective stress changes on permeability of latrobe valley brown coal. Fuel 2011, 90, 1292–1300. [Google Scholar] [CrossRef]
- Vishal, V.; Ranjith, P.G.; Singh, T.N. CO2 permeability of Indian bituminous coals: Implications for carbon sequestration. Int. J. Coal Geol. 2013, 105, 36–47. [Google Scholar] [CrossRef]
- Perera, M.S.A. Influences of CO2 injection into deep coal seams: A review. Energy Fuels 2017, 31, 10324–10334. [Google Scholar] [CrossRef]
- Sinha, S.; Walton, G. Integration of three-dimensional continuum model and two-dimensional bonded block model for studying the damage process in a granite pillar at the Creighton Mine, Sudbury, Canada. J. Rock Mech. Geotech. Eng. 2021, 13, 275–288. [Google Scholar] [CrossRef]
- Tahmasebinia, F.; Zhang, C.G.; Canbulat, I.; Sepasgozar, S.; Saydam, S. A novel damage model for strata layers and coal mass. Energies 2020, 13, 1928. [Google Scholar] [CrossRef]
- Galindo, R.A.; Serrano, A.; Olalla, C. Ultimate bearing capacity of rock masses based on modified Mohr-Coulomb strength criterion. Int. J. Rock Mech. Min. Sci. 2017, 93, 215–225. [Google Scholar] [CrossRef]
- Schwartzkopff, A.K.; Sainoki, A.; Bruning, T.; Karakus, M. A conceptual three-dimensional frictional model to predict the effect of the intermediate principal stress based on the Mohr-Coulomb and Hoek-Brown failure criteria. Int. J. Rock Mech. Min. Sci. 2023, 172, 22. [Google Scholar] [CrossRef]
- Ziv, A.; Rubin, A.M.; Agnon, A. Stability of dike intrusion along preexisting fractures. J. Geophys. Res. Solid Earth 2000, 105, 5947–5961. [Google Scholar] [CrossRef]
- Yang, Y.T.; Tang, X.H.; Zheng, H.; Liu, Q.S.; He, L. Three-dimensional fracture propagation with numerical manifold method. Eng. Anal. Boundary Elem. 2016, 72, 65–77. [Google Scholar] [CrossRef]


Disclaimer/Publisher’s Note: The statements, opinions and data contained in all publications are solely those of the individual author(s) and contributor(s) and not of MDPI and/or the editor(s). MDPI and/or the editor(s) disclaim responsibility for any injury to people or property resulting from any ideas, methods, instructions or products referred to in the content. |
© 2025 by the authors. Licensee MDPI, Basel, Switzerland. This article is an open access article distributed under the terms and conditions of the Creative Commons Attribution (CC BY) license (https://creativecommons.org/licenses/by/4.0/).