
Study of Potential Embodied Carbon Transfer Flows Based on Link Prediction Model


 ,
,  , and
, and 
Abstract
:1. Introduction
2. Data and Methods
2.1. Data
2.2. Methodology
2.2.1. Multi-Regional Input–Output Model
2.2.2. EC-Transfer Network
- (1)
- Accounting for EC transfers
- (2)
- Establishing the -transfer network
- (3)
- Structural Features
- ①
- Degree centrality
- ②
- Strength centrality
- ③
- Closeness centrality
2.2.3. Link Prediction Model
- Step 1: Design of similarity indicators
- (1)
- Endogenous attribute indicator
- ①
- indicator
- ②
- indicator
- (2)
- Exogenous attribute indicator
- ①
- -based similarity
- ②
- -based similarity
- ③
- -based similarity
- (3)
- Hybrid indicator
- Step 2: Division of test set and training set [28].
- Step 3: Evaluation of unknown link scores [45].
- Step 4: Evaluation the accuracy of the link prediction algorithm.
3. Results
3.1. Structure Evolution
3.1.1. Evolution of Net EC-Transfer Flows
3.1.2. Evolution of Centrality Indicators in Global EC-Transfer Networks
3.2. Link Prediction Algorithm Selection
3.3. Comparison of Predicted Results with Actual EC Links
3.4. Summary of Success Rules for Link Prediction
- (1)
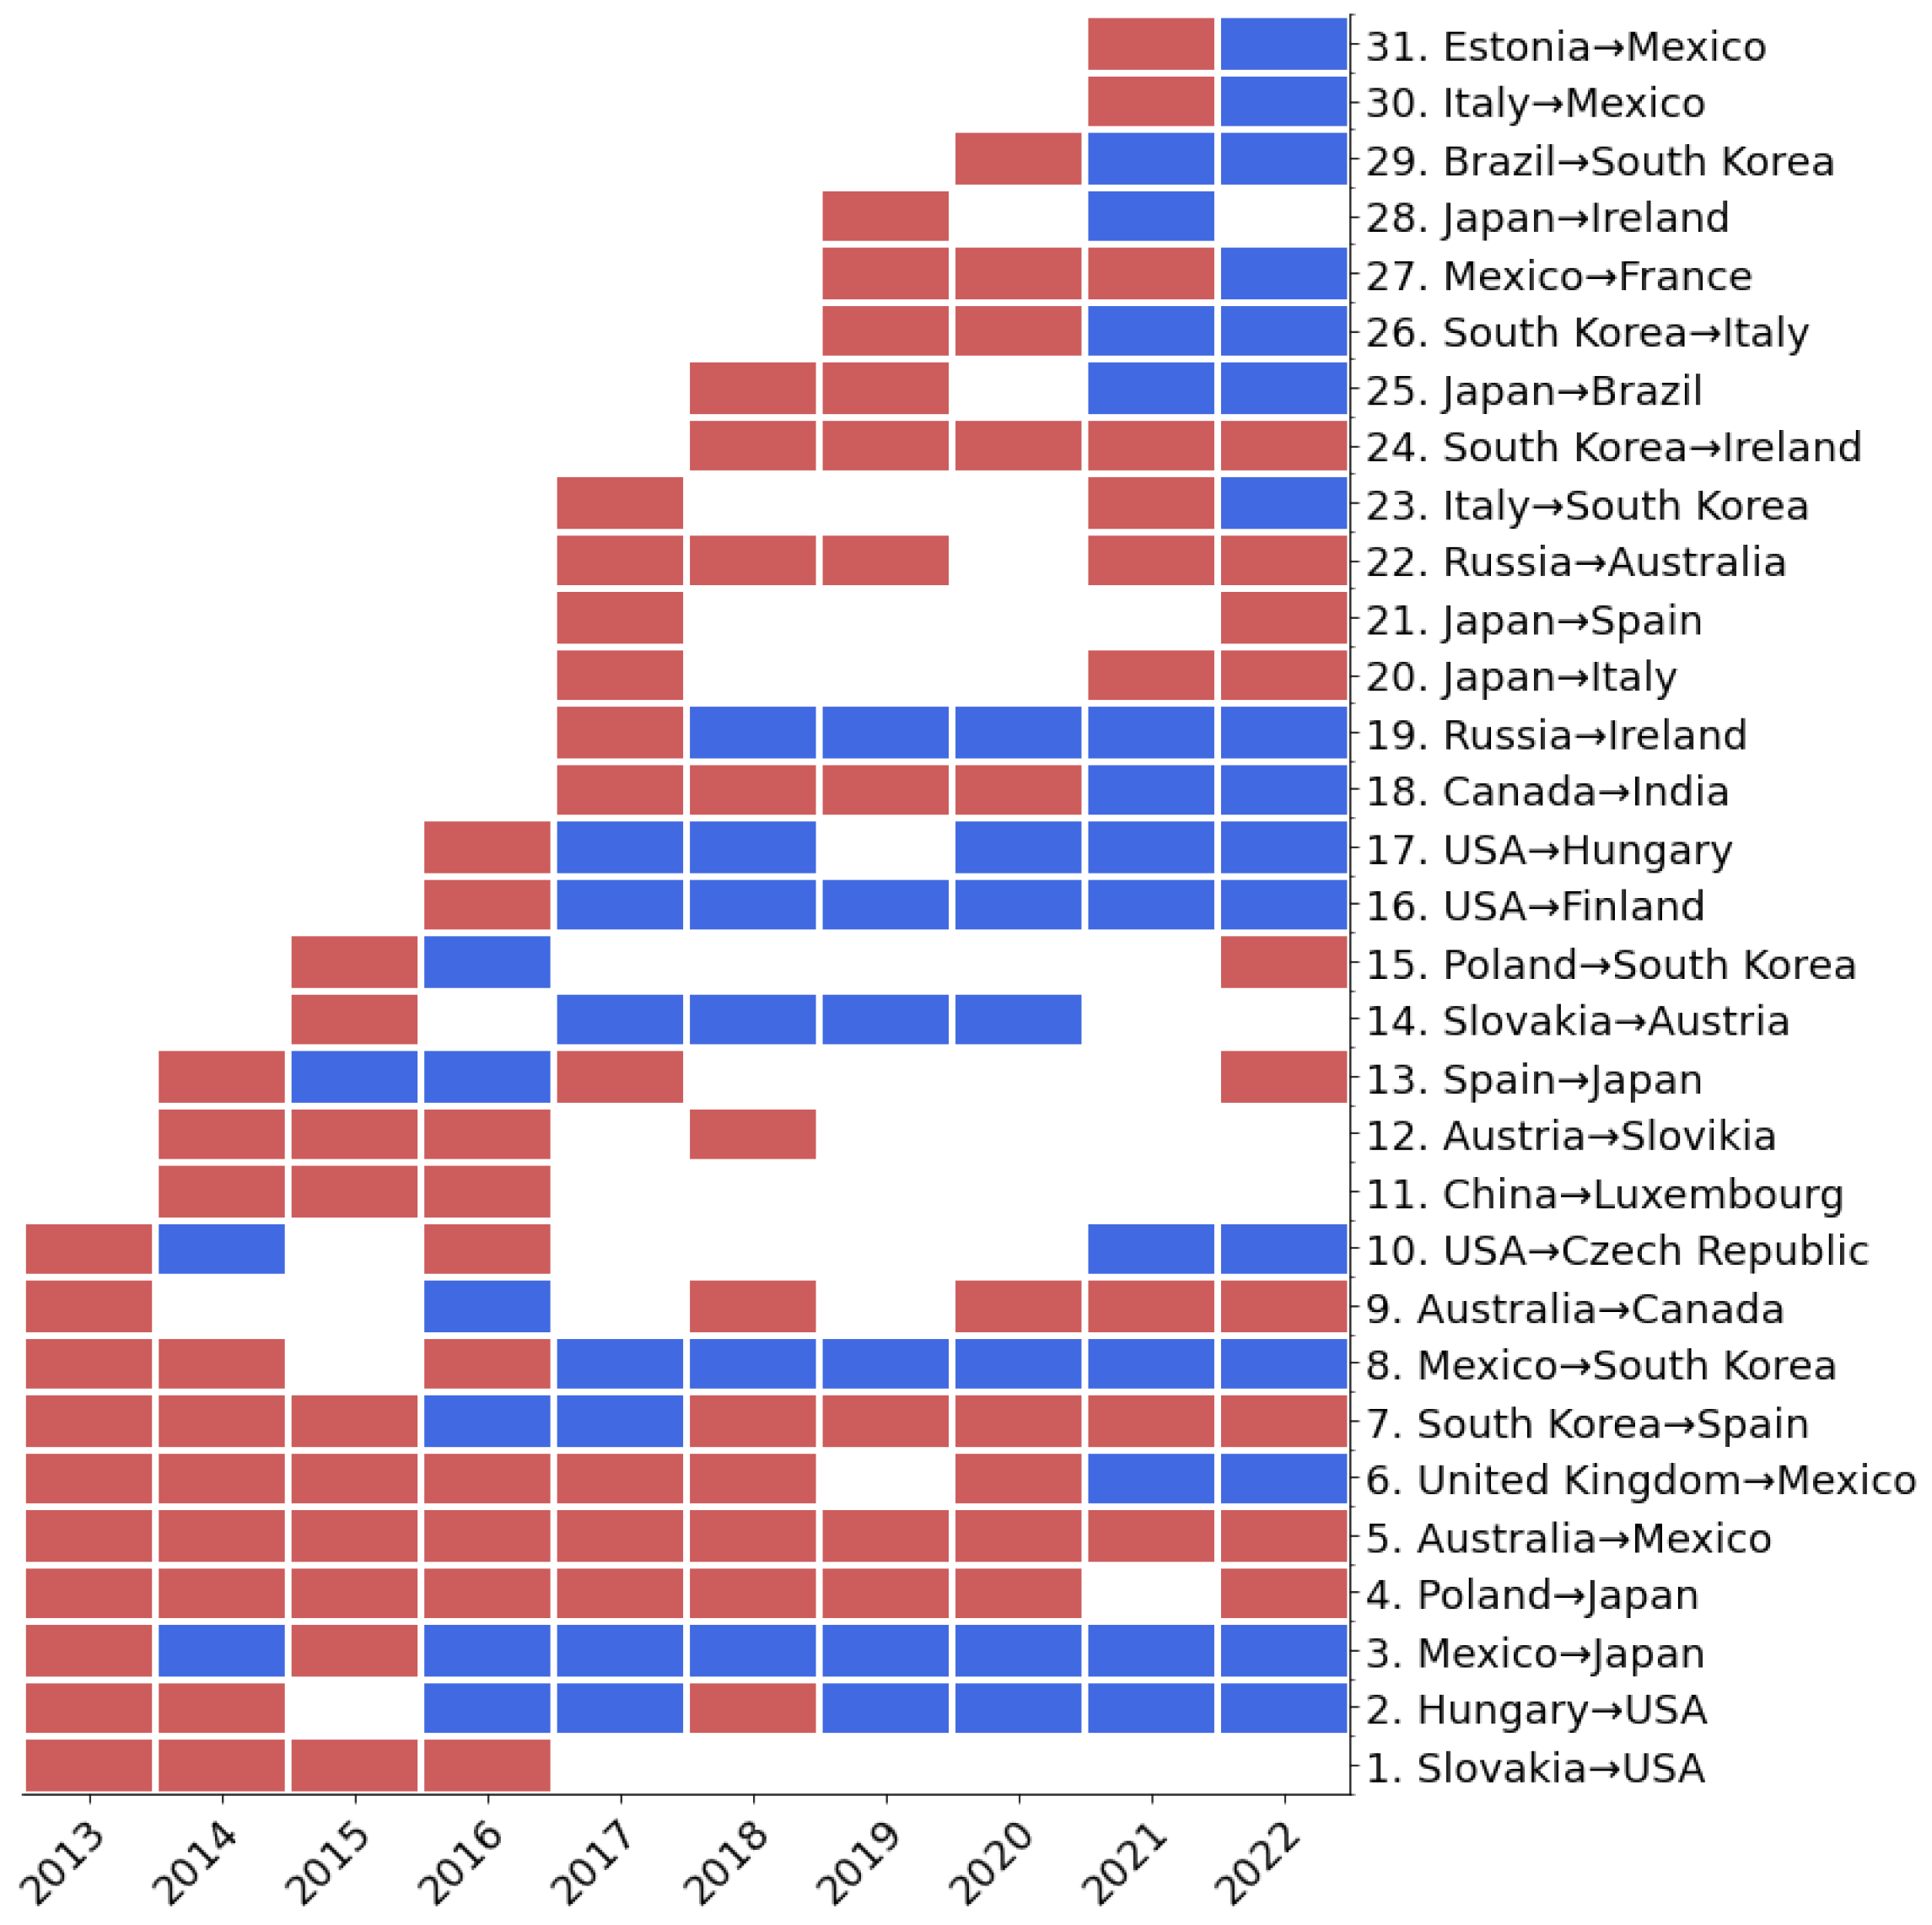
- Potential -transfer links that became real during the study period but lasted less than two years were less likely to form again in the future. Out of the 20 links predicted to succeed (excluding the two new potential links from 2021, as only one year of testing was available in 2022), 15 (75%) persisted for at least two years. This suggests that countries/regions tend to select familiar -transfer partners. The remaining unsuccessful links may be influenced by factors such as political dynamics, geographical distance, or levels. Therefore, -transfer links lasting less than two years between 2013 and 2022 are unlikely to form again.
- (2)
- Among the potential -transfer links, real links are unlikely to be formed between net exporters. According to Figure 10, three potential -transfer links were identified between net outflow countries: China→Luxembourg, Russia→Australia, and Poland→South Korea. The first two links did not materialize during the study period, and while the Poland→South Korea link did occur, it was unstable and categorized under the . In other words, it is less likely that actual links will be formed between net exporters.
- (3)
- Among the potential -transfer links, there is a high probability of forming real stable links between net importers. From the successfully predicted stable potential -transfer links in Figure 10, 10 country pairs are included in , with 6 pairs (60%) consisting of net importers. In , 7 country pairs were identified, with 4 pairs (57%) composed of net importers. A typical feature of the net importers is that they all have many common net exporters as partners. On the one hand, there is a competitive relationship between these net importers, and on the other hand, to avoid the risk of supply chain disruptions, there are transfers between some importers. Overall, there is a high possibility of forming flows between importers, motivated primarily by product exchange rather than profit.
- (4)
- The potential -transfer links between net exporters and net importers are highly likely to become real in the future. Ten of the 22 potential -transfer links (45%) involve connections between net exporters and net importers. Of these, four and three fall into and , respectively, indicating a high likelihood of stable link formation. Specifically, if the potential link is from a net exporter to a net importer, it is likely to materialize within two years. Conversely, if the potential -transfer link is from a net importer to a net exporter, the predicted link has a higher probability of being realized after two years. Further, the performance of each country/region connected by potential -transfer links from historical data. It can be found that on the inflow side, if flows to countries such as Ireland, Italy, etc., it is easy to form links of . That is, real links are established quickly within two years. If flows to countries like USA, India, etc., it is easy to form links of . That is, real links are formed slowly after two years. If flows to countries like Mexico, South Korea, Japan, etc., links of (stable links) may be formed, and the links targeting South Korea and Japan may also belong to , i.e., the existence of real links fluctuates. On the outflow side, if flows originate from countries such as Russia, it is easy to form links of . If flows originate from countries such as Mexico, Italy, Japan, etc., links of or may be formed. If flows originate from countries such as USA and South Korea, links of or are likely to be formed. The serial numbers of the Top 10 potential -transfer links predicted in the last year of the study period are 4, 5, 7, 9, 13, 15, 20, 21, 22, and 24. First, the potential links with low probability were filtered out by Rules 1 and 2. It is worth noting that the most promising links discussed here are the ones with high probability of formation based on the data from the study period, and it does not mean that other links will not come true in the future. Then the probability of formation of the remaining links is evaluated based on Rules 3 and 4. Finally, it is obtained that South Korea→Spain and Spain→Japan have a high probability of becoming real in the future. Combined with the historical data performance of these economies, they may establish real links quickly in the next two years, but may fluctuate.
4. Conclusions and Suggestions
- (1)
- On the net outflow side, China, Russia, and India dominate net exports, representing over 70% of total transfers. The from these countries primarily flow to the EU and the US, making them the primary destinations for net flows. Furthermore, regardless of economic size, analysis shows that countries such as Russia and South Africa export large quantities of -rich products. This reflects the bias of their economic structure towards export-oriented high-carbon industries. The carbon-emission responsibility induced by foreign demand should be transferred downstream to the consuming countries as flows. In terms of net inflow, countries like Mexico and Switzerland rely more on importing carbon-intensive products, reflecting an import-oriented economic structure that shifts the responsibility for carbon emissions to trade partners.
- (2)
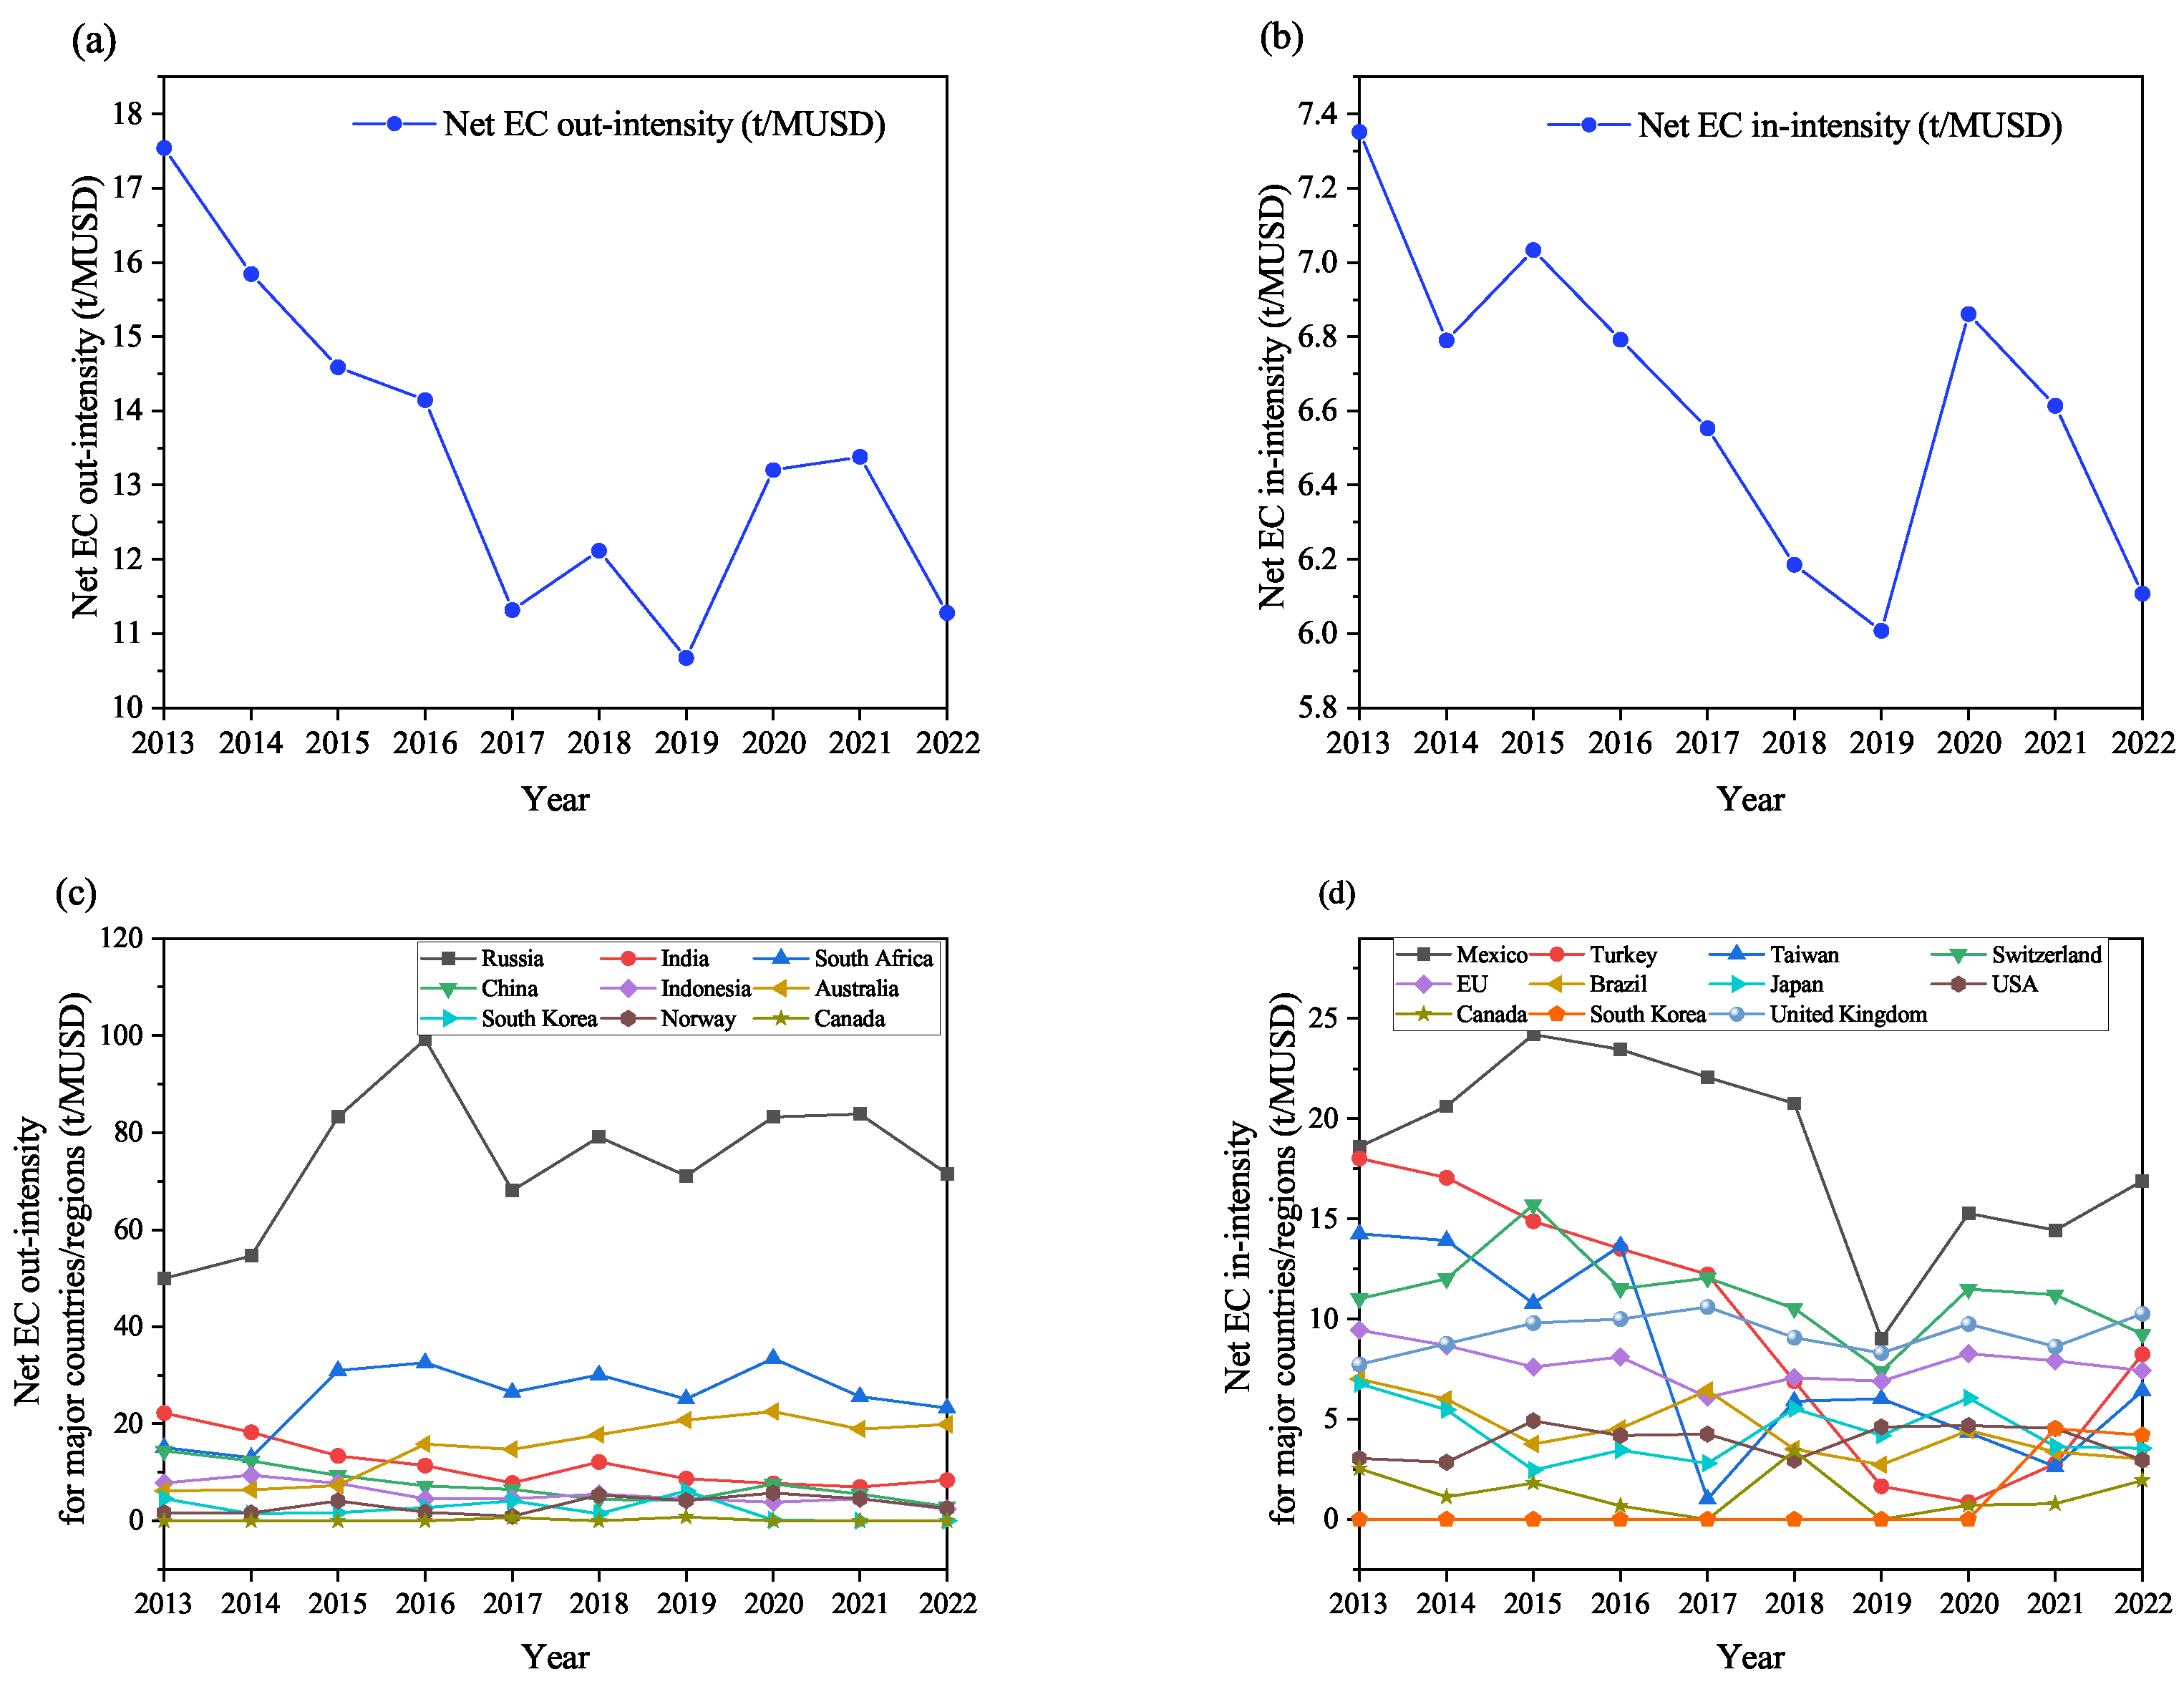
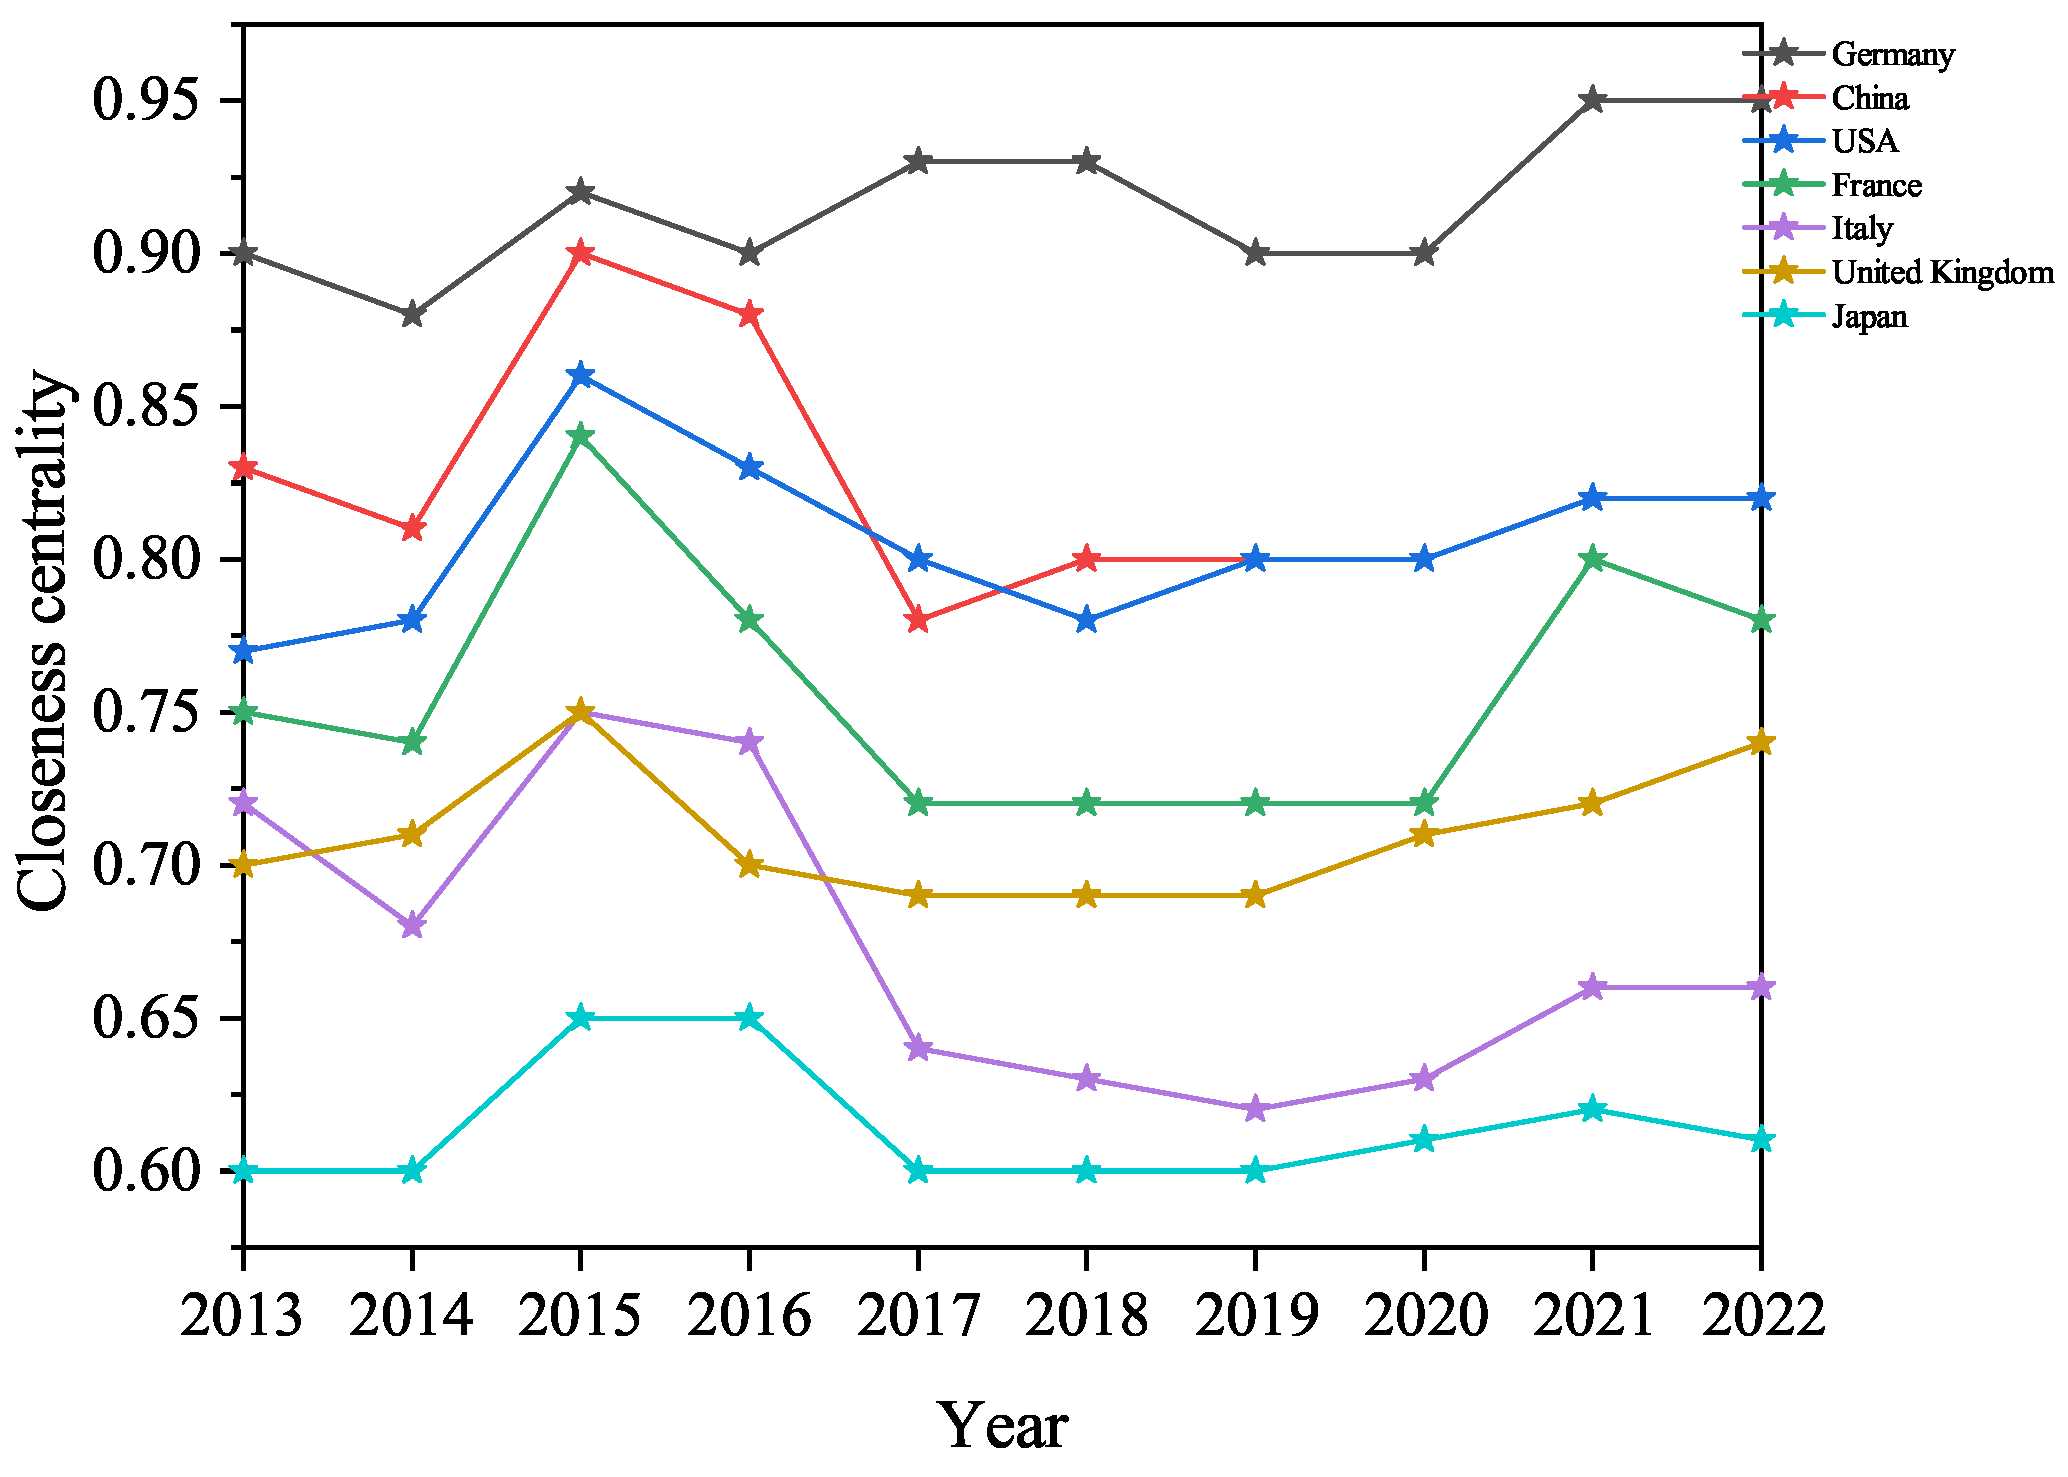
- The evolution analysis of the global -transfer network indicates that free trade agreements have significantly enhanced the involvement of various economies, leading to a notable rise in the network’s average degree. However, the “Paris Agreement” imposed restrictions on transfers, resulting in a temporary decline in both the average degree and the degree centrality of major economies. Following the global economic recovery in 2017, government-led stimulus measures fostered closer economic integration, restoring the network’s average degree and intensifying interactions between economies. However, both the net out-intensity and in-intensity show a downward trend during the observation period. Additionally, closeness centrality analysis reveals that some key economies/regions including Germany, China, USA, and France play important roles in driving transfers.
- (3)
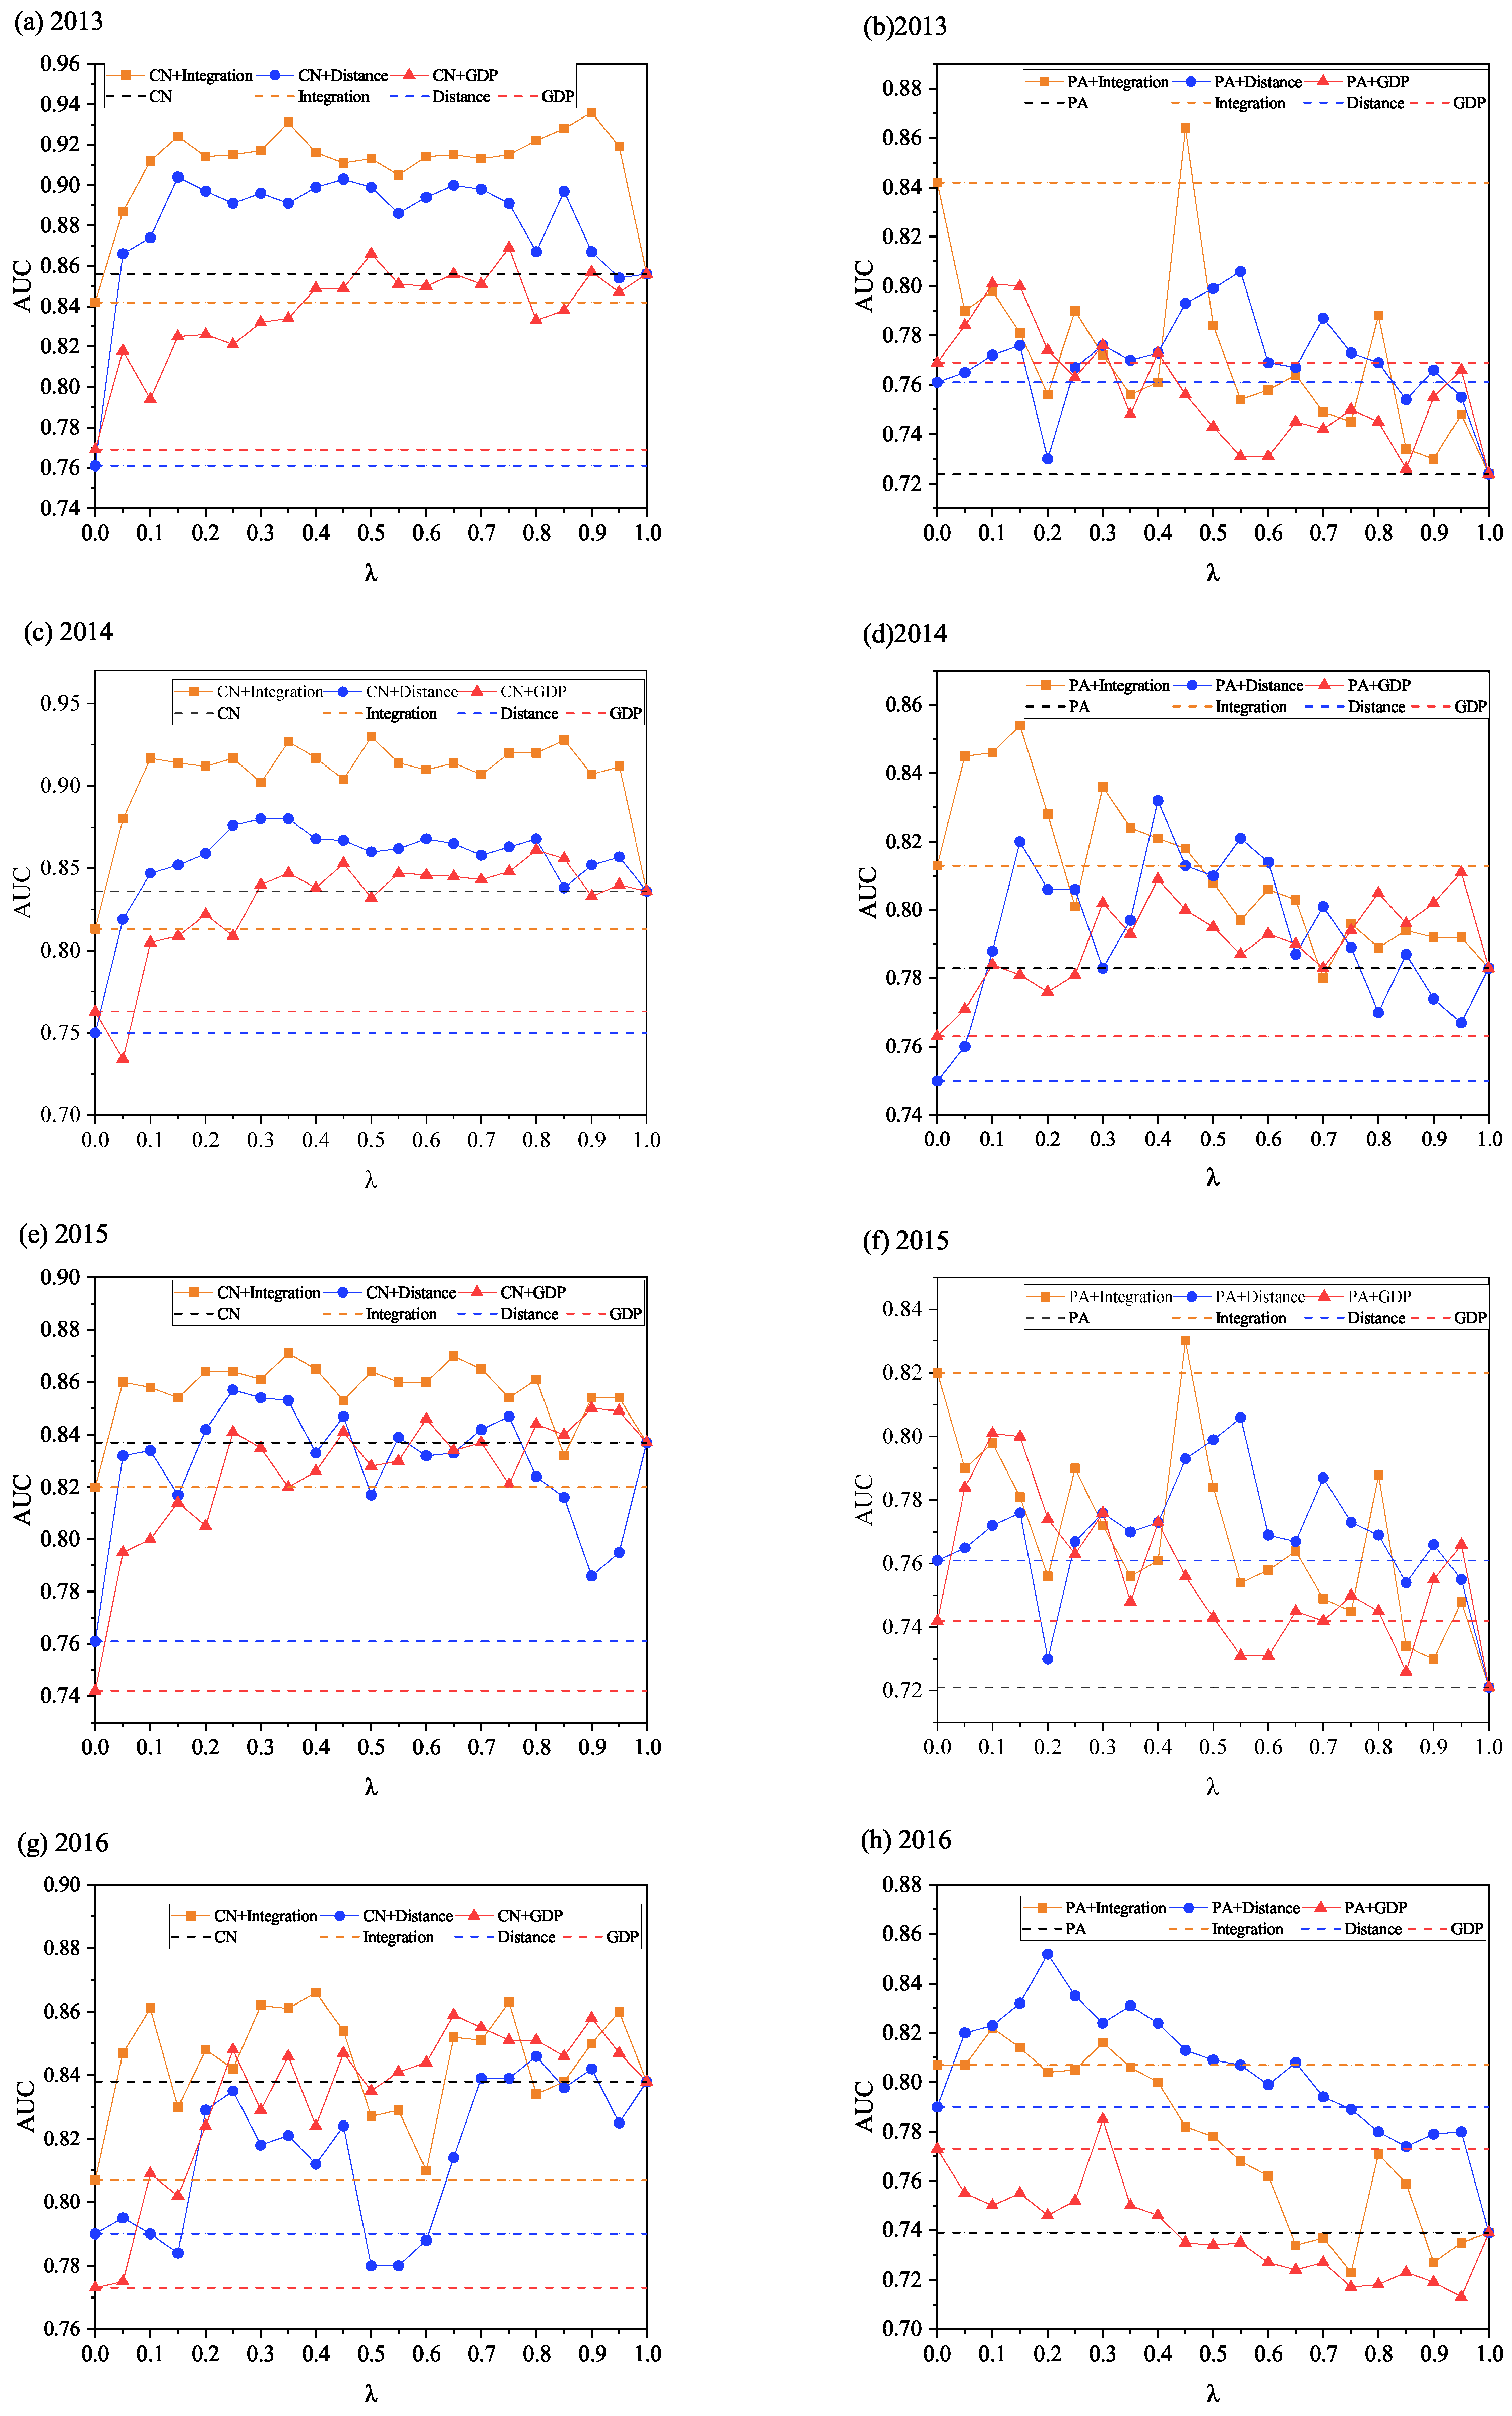
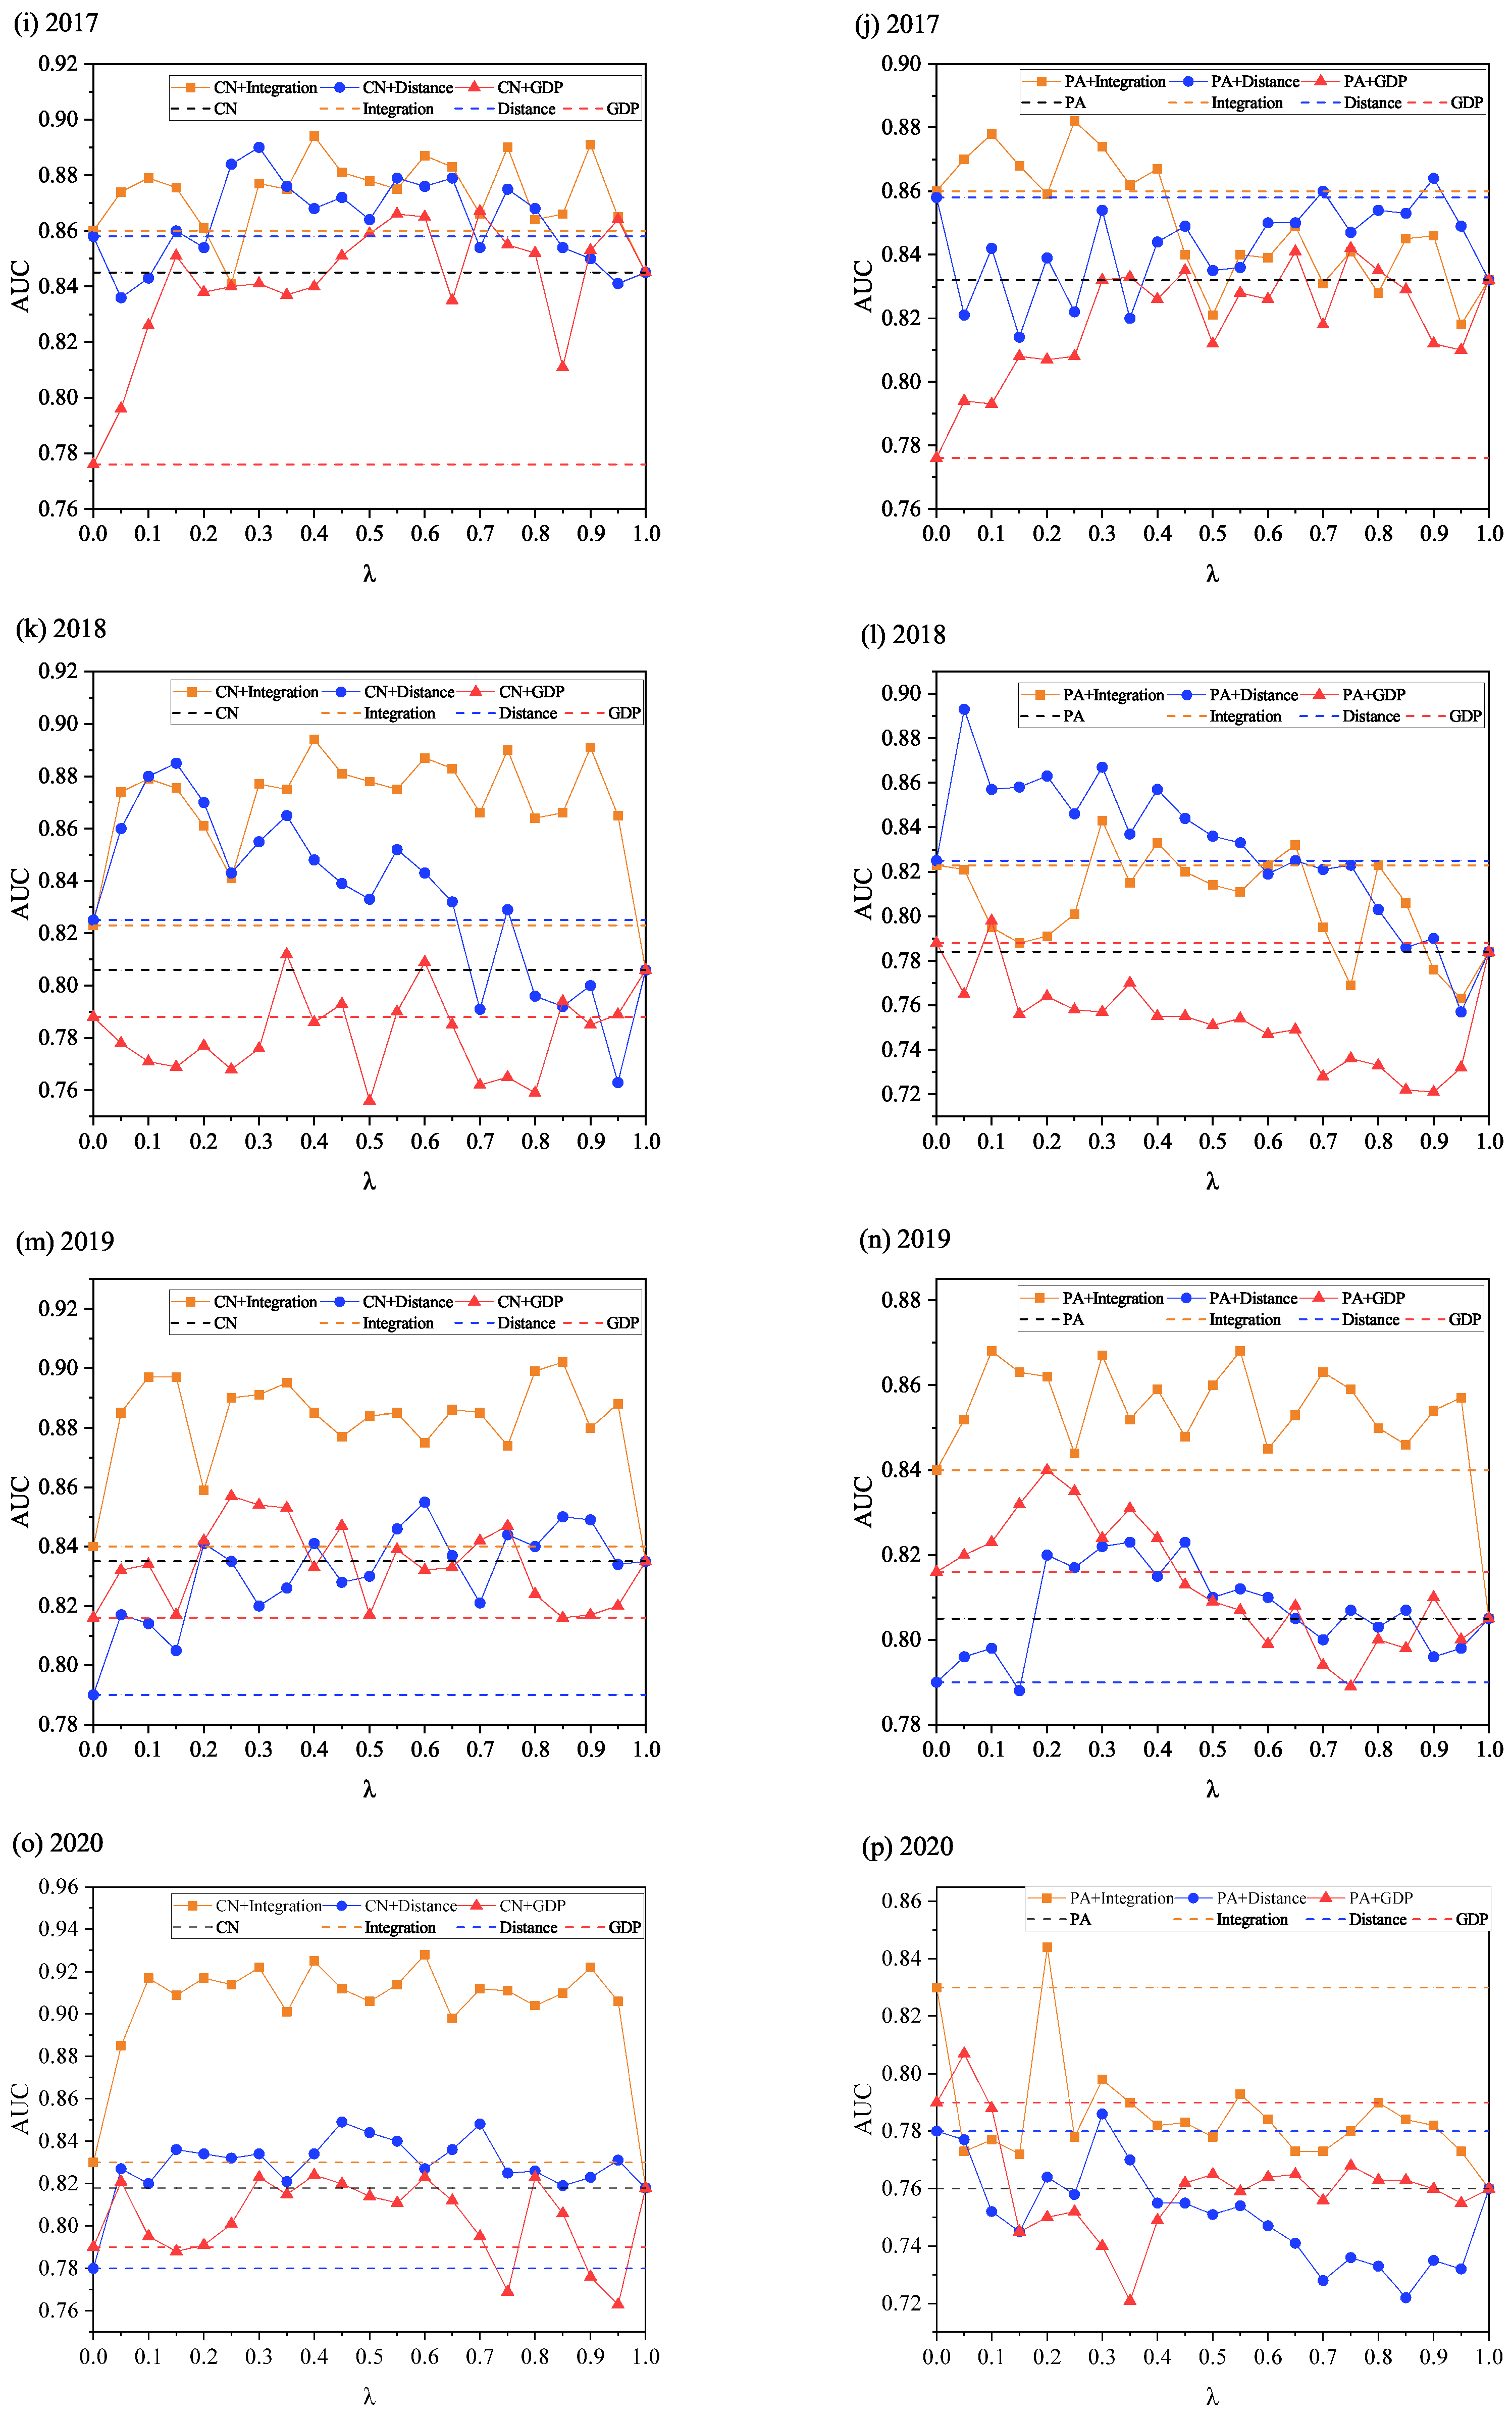
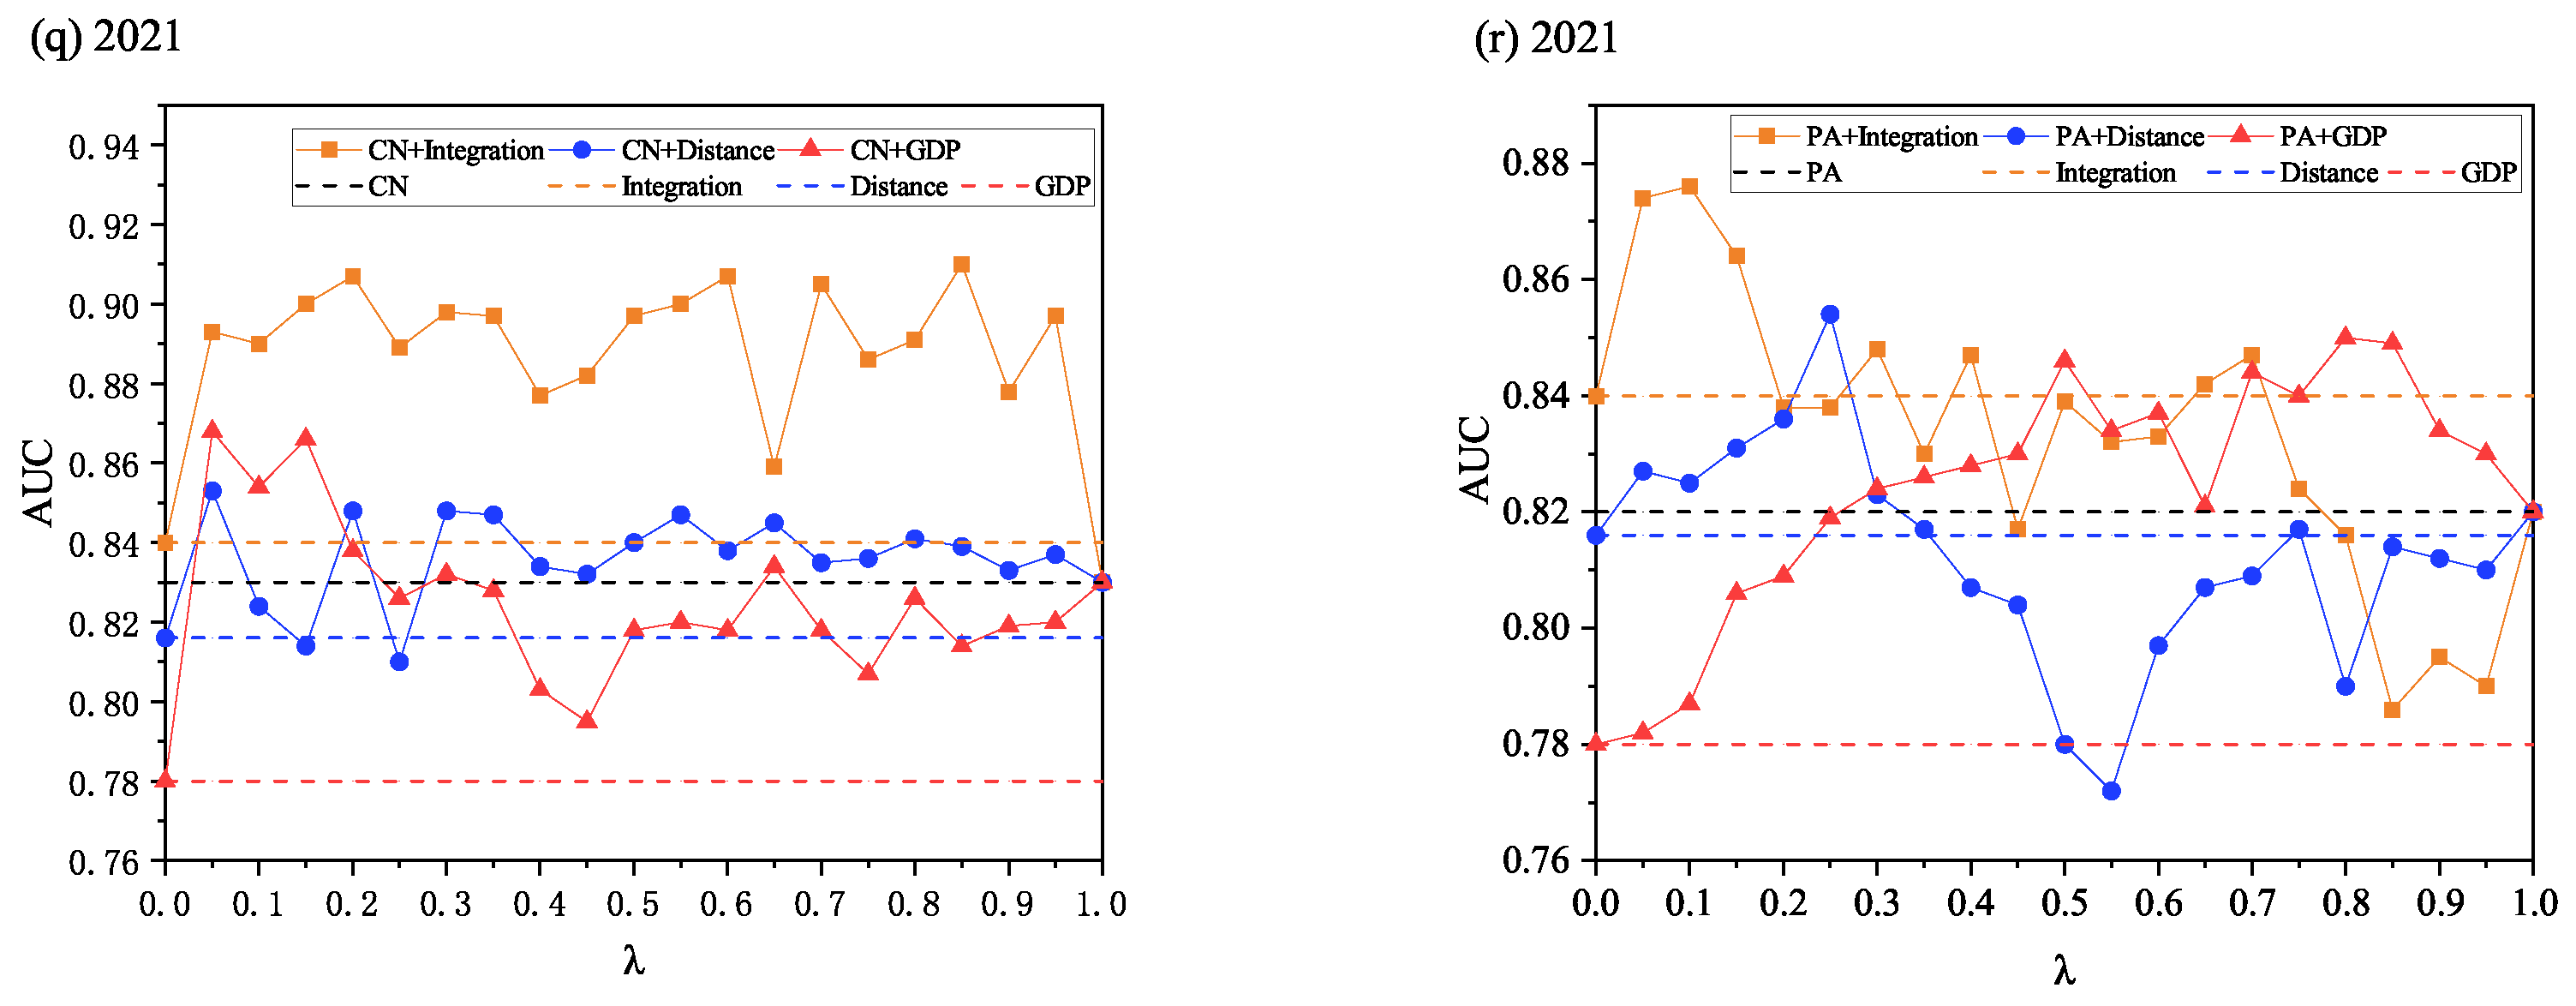
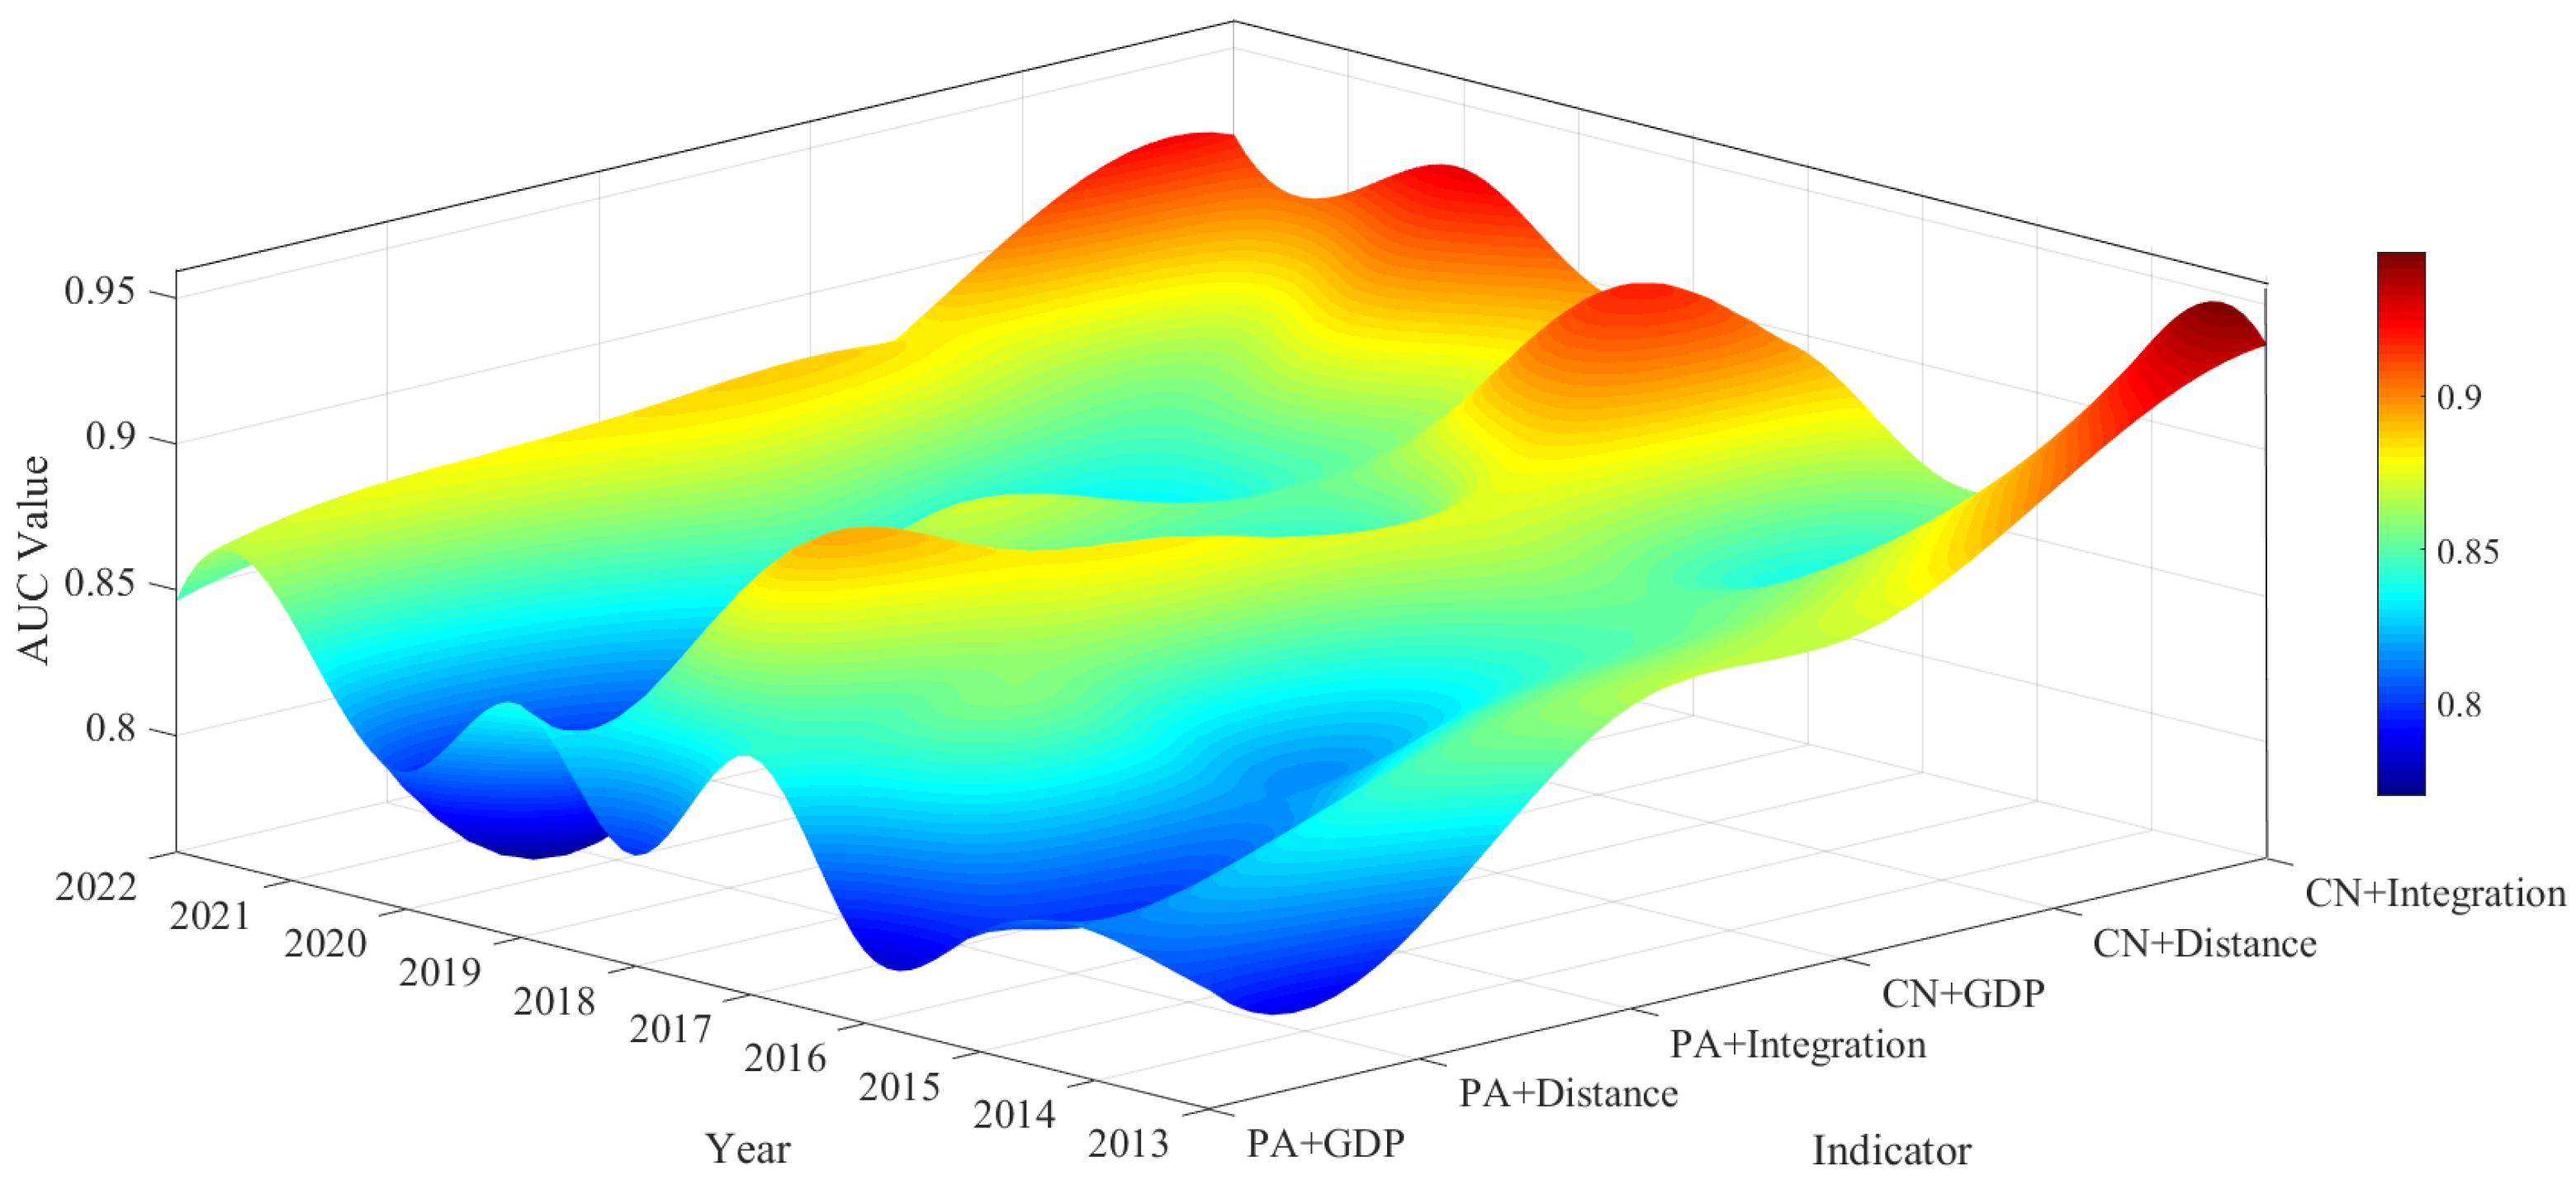
- Link prediction results based on various similarity indicators reveal that the indicator achieves the highest value, averaging 0.92, an improvement of 8.11% and 10.71% compared to single endogenous or exogenous factor indicators, respectively. This suggests that factors such as the number of common trade partners among countries, -transfer strength, levels, and geographic distances positively influence the formation and evolution of -transfer links. Comparative analysis of potential links with actual links indicates that over 70% of economies have been successfully assessed at least once. Further, the rules governing potential -transfer links are discussed, providing a foundation for economies to select suitable -transfer partners.
- (1)
- For countries/regions with a high net in-strength, such as the US and EU, strategies should be developed to optimize supply chain structures and reduce reliance on economies with high net out-strength. In particular, countries like Mexico and Switzerland are overly dependent on -intensive product imports, encouraging net outflow economies such as Russia and China to restructure their industries, promote green initiatives, and enhance energy efficiency to reduce in their supply chains. Given that the downward trend in net out-intensity and net in-intensity is mainly due to technological advances, international cooperation and exchanges among economies in the field of green and low-carbon technologies should be further strengthened. By sharing research results, technology transfer and diffusion, global energy efficiency and emission-reduction capabilities can be collectively enhanced.
- (2)
- Regarding potential -transfer paths, governments should proactively prepare to establish -transfer links that better address their own needs. Low-carbon policymakers should also strengthen consultations to develop synergistic carbon-emission-reduction-management mechanisms, promoting cross-regional cooperation and reducing carbon-leakage risks. For economies not currently involved, the forecasting rules obtained in this study offer a reference for identifying suitable -transfer partners. Core economies within the network—such as Germany, China, the USA, and France—play a critical role in implementing global carbon-emission control and are key drivers of international emission-reduction efforts.
Author Contributions
Funding
Data Availability Statement
Conflicts of Interest
Appendix A
References
- World Meteorological Organization. State of the Global Climate 2023. 2024. Available online: https://wmo.int/publication-series/state-of-global-climate-2023 (accessed on 10 March 2024).
- Peters, G.P.; Hertwich, E.G. Post-Kyoto greenhouse gas inventories: Production versus consumption. Clim. Change 2008, 86, 51–66. [Google Scholar] [CrossRef]
- Zhong, Z.; Jiang, L.; Zhou, P. Transnational transfer of carbon emissions embodied in trade: Characteristics and determinants from a spatial perspective. Energy 2018, 147, 858–875. [Google Scholar] [CrossRef]
- Pan, X.; Wang, Y.; Shen, Z.; Song, M. Technological progress on embodied carbon emissions in G7 countries’ exports: A structural decomposition analysis. J. Clean. Prod. 2022, 372, 133800. [Google Scholar] [CrossRef]
- de Vries, G.J.; Ferrarini, B. What accounts for the growth of carbon dioxide emissions in advanced and emerging economies? The role of consumption, technology and global supply chain participation. Ecol. Econ. 2017, 132, 213–223. [Google Scholar] [CrossRef]
- Wu, L.; Zhou, Y.; Qian, H. Global actions under the Paris agreement: Tracing the carbon leakage flow and pursuing countermeasures. Energy Econ. 2022, 106, 105804. [Google Scholar] [CrossRef]
- Lu, Q.; Fang, K.; Heijungs, R.; Feng, K.; Li, J.; Wen, Q.; Li, Y.; Huang, X. Imbalance and drivers of carbon emissions embodied in trade along the Belt and Road Initiative. Appl. Energy 2020, 280, 115934. [Google Scholar] [CrossRef]
- Xu, Y.; Dietzenbacher, E. A structural decomposition analysis of the emissions embodied in trade. Ecol. Econ. 2014, 101, 10–20. [Google Scholar] [CrossRef]
- Huang, Y.; Zhang, Y.; Xiang, Y.; Dong, X. Has servitization reduced the embodied carbon emissions of manufacturing export trade? Evidence from 38 countries. Environ. Technol. Innov. 2022, 28, 102950. [Google Scholar] [CrossRef]
- Wood, R.; Grubb, M.; Anger-Kraavi, A.; Pollitt, H.; Rizzo, B.; Alexandri, E.; Stadler, K.; Moran, D.; Hertwich, E.; Tukker, A. Beyond peak emission transfers: Historical impacts of globalization and future impacts of climate policies on international emission transfers. Clim. Policy 2020, 20 (Suppl. S1), S14–S27. [Google Scholar] [CrossRef]
- Zhong, S.; Goh, T.; Su, B. Patterns and drivers of embodied carbon intensity in international exports: The role of trade and environmental policies. Energy Econ. 2022, 114, 106313. [Google Scholar] [CrossRef]
- Bandyopadhyay, A.; Kar, S. Impact of network structure on synchronization of Hindmarsh–Rose neurons coupled in structured network. Appl. Math. Comput. 2018, 333, 194–212. [Google Scholar] [CrossRef]
- Du, R.; Zhang, M.; Zhang, N.; Liu, Y.; Dong, G.; Tian, L.; Ziyang, K.; Ahsan, M. Evaluation of key node groups of embodied carbon emission transfer network in China based on complex network control theory. J. Clean. Prod. 2024, 448, 141605. [Google Scholar] [CrossRef]
- Du, R.; Zhang, N.; Zhang, M.; Kong, Z.; Jia, Q.; Dong, G.; Tian, L.; Ahsan, M. Identifying the optimal node group of carbon emission efficiency correlation network in China based on pinning control theory. Appl. Energy 2024, 368, 123353. [Google Scholar] [CrossRef]
- Dong, G.; Wang, F.; Shekhtman, L.M.; Danziger, M.M.; Fan, J.; Du, R.; Liu, J.; Tian, L.; Stanley, H.E.; Havlin, S. Optimal resilience of modular interacting networks. Proc. Natl. Acad. Sci. USA 2021, 118, e1922831118. [Google Scholar] [CrossRef] [PubMed]
- Lv, K.; Feng, X.; Kelly, S.; Zhu, L.; Deng, M. A study on embodied carbon transfer at the provincial level of China from a social network perspective. J. Clean. Prod. 2019, 225, 1089–1104. [Google Scholar] [CrossRef]
- Paterson, M.; Hoffmann, M.; Betsill, M.; Bernstein, S. The micro foundations of policy diffusion toward complex global governance: An analysis of the transnational carbon emission trading network. Comp. Political Stud. 2014, 47, 420–449. [Google Scholar] [CrossRef]
- Wang, H.; Ang, B. Assessing the role of international trade in global CO2 emissions: An index decomposition analysis approach. Appl. Energy 2018, 218, 146–158. [Google Scholar] [CrossRef]
- Chen, C.; Lu, Y.; He, G. Driving mechanisms for decoupling CO2 emissions from economic development in the ten largest emission countries. Ecosyst. Health Sustain. 2022, 8, 2059016. [Google Scholar] [CrossRef]
- Chai, Z.; Yan, Y.; Simayi, Z.; Yang, S.; Abulimiti, M.; Wang, Y. Carbon emissions index decomposition and carbon emissions prediction in Xinjiang from the perspective of population-related factors, based on the combination of STIRPAT model and neural network. Environ. Sci. Pollut. Res. 2022, 29, 31781–31796. [Google Scholar]
- Li, W.; Du, L. Assessment framework of provincial carbon emission peak prediction in China: An empirical analysis of Hebei province. Pol. J. Environ. Stud. 2019, 28, 3753–3765. [Google Scholar] [CrossRef]
- Zhang, S.; Yang, F.; Liu, C.; Chen, X.; Tan, X.; Zhou, Y.; Guo, F.; Jiang, W. Study on global industrialization and industry emission to achieve the 2 °C goal based on MESSAGE model and LMDI approach. Energies 2020, 13, 825. [Google Scholar] [CrossRef]
- Li, H.; Li, B.; Niu, D. Prediction on the Energy Consumption Structure in Liaoning Province Based on System Dynamics. Pol. J. Environ. Stud. 2021, 30, 5593–5604. [Google Scholar] [CrossRef]
- Malik, A.; Hussain, E.; Baig, S.; Khokhar, M.F. Forecasting CO2 emissions from energy consumption in Pakistan under different scenarios: The China–Pakistan economic corridor. Greenh. Gases Sci. Technol. 2020, 10, 380–389. [Google Scholar] [CrossRef]
- Yang, Y.; Du, Q.; Wang, C.; Bai, Y. Research on the method of methane emission prediction using improved grey radial basis function neural network model. Energies 2020, 13, 6112. [Google Scholar] [CrossRef]
- Amar, M.N.; Ghriga, M.A.; Ouaer, H.; Ben Seghier, M.E.A.; Pham, B.T.; Andersen, P.Ø. Modeling viscosity of CO2 at high temperature and pressure conditions. J. Nat. Gas Sci. Eng. 2020, 77, 103271. [Google Scholar] [CrossRef]
- Clauset, A.; Moore, C.; Newman, M.E. Hierarchical structure and the prediction of missing links in networks. Nature 2008, 453, 98–101. [Google Scholar] [CrossRef]
- Lü, L.; Zhou, T. Link prediction in complex networks: A survey. Phys. A Stat. Mech. Its Appl. 2011, 390, 1150–1170. [Google Scholar] [CrossRef]
- Liu, S.; Dong, Z.; Ding, C.; Wang, T.; Zhang, Y. Do you need cobalt ore? Estimating potential trade relations through link prediction. Resour. Policy 2020, 66, 101632. [Google Scholar] [CrossRef]
- Liben-Nowell, D.; Kleinberg, J. The link prediction problem for social networks. In Proceedings of the 12th International Conference on Information and Knowledge Management, New Orleans, LA, USA, 3–8 November 2003; pp. 556–559. [Google Scholar]
- Zhou, T.; Lü, L.; Zhang, Y. Predicting missing links via local information. Eur. Phys. J. B 2009, 71, 623–630. [Google Scholar] [CrossRef]
- Feng, S.; Li, H.; Qi, Y.; Guan, Q.; Wen, S. Who will build new trade relations? Finding potential relations in international liquefied natural gas trade. Energy 2017, 141, 1226–1238. [Google Scholar] [CrossRef]
- Guan, Q.; An, H.; Gao, X.; Huang, S.; Li, H. Estimating potential trade links in the international crude oil trade: A link prediction approach. Energy 2016, 102, 406–415. [Google Scholar] [CrossRef]
- Zhu, M.; Zhou, X.; Zhang, H.; Wang, L.; Sun, H. International trade evolution and competition prediction of boron ore: Based on complex network and link prediction. Resour. Policy 2023, 82, 103542. [Google Scholar] [CrossRef]
- Takahashi, Y.; Osawa, R.; Shirayama, S. A basic study of the forecast of air transportation networks using different forecasting methods. J. Data Anal. Inf. Process. 2017, 5, 49–66. [Google Scholar] [CrossRef]
- Stadler, K.; Wood, R.; Bulavskaya, T.; Södersten, C.J.; Simas, M.; Schmidt, S.; Usubiaga, A.; Acosta-Fernández, J.; Kuenen, J.; Bruckner, M.; et al. EXIOBASE 3: Developing a Time Series of Detailed Environmentally Extended Multi-Regional Input–Output Tables. J. Ind. Ecol. 2018, 22, 502–515. [Google Scholar] [CrossRef]
- Leontief, W.W. Environmental Repercussions and the Economic Structure: An Input–Output Approach. Rev. Econ. Stat. 1970, 52, 262–271. [Google Scholar] [CrossRef]
- Xing, Z.; Jiao, Z.; Wang, H. Carbon footprint and embodied carbon transfer at city level: A nested MRIO analysis of Central Plain urban agglomeration in China. Sustain. Cities Soc. 2022, 83, 103977. [Google Scholar] [CrossRef]
- Brown, M.T.; Herendeen, R.A. Embodied energy analysis and EMERGY analysis: A comparative view. Ecol. Econ. 1996, 19, 219–235. [Google Scholar] [CrossRef]
- Watts, D.J. The “new” science of networks. Annu. Rev. Sociol. 2004, 30, 243–270. [Google Scholar] [CrossRef]
- Jiang, M.; Gao, X.; Guan, Q.; Hao, X.; An, F. The structural roles of sectors and their contributions to global carbon emissions: A complex network perspective. J. Clean. Prod. 2019, 208, 426–435. [Google Scholar] [CrossRef]
- Wang, X.; Wei, W.; Ge, J.; Wu, B.; Bu, W.; Li, J.; Yao, M.; Guan, Q. Embodied rare earths flow between industrial sectors in China: A complex network approach. Resour. Conserv. Recycl. 2017, 125, 363–374. [Google Scholar] [CrossRef]
- Xue, W.; Lei, Y.; Liu, X.; Shi, X.; Liu, Z.; Xu, Y.; Chen, X.; Song, X.; Zheng, Y.; Zhang, Y.; et al. Synergistic assessment of air pollution and carbon emissions from the economic perspective in China. Sci. Total Environ. 2023, 858, 159736. [Google Scholar] [CrossRef] [PubMed]
- Alhussam, M.I.; Ren, J.; Yao, H.; Abu Risha, O. Food trade network and food Security: From the perspective of Belt and Road Initiative. Agriculture 2023, 13, 1571. [Google Scholar] [CrossRef]
- Liu, H. Uncovering the network evolution mechanism by link prediction. Sci. Sin. Phys. Mech. Astron. 2011, 41, 816. [Google Scholar]
- Zhang, R.; Tai, H.; Cheng, K.; Zhu, Y.; Hou, J. Carbon emission efficiency network formation mechanism and spatial correlation complexity analysis: Taking the Yangtze River Economic Belt as an example. Sci. Total Environ. 2022, 841, 156719. [Google Scholar] [CrossRef] [PubMed]


| Variable | Description |
|---|---|
| n | Number of countries/regions |
| U | Set of all possible links based on n nodes |
| E | Set of existing links |
| Test set | |
| Training set | |
| Set of non-existing links, |
| Hybrid Indicator | Optimal Value | Rate of Improvement in Values (%) | ||
|---|---|---|---|---|
|
Compared to |
Compared to | |||
| 0.8 | 0.92 | 8.11 | 10.71 | |
| 0.3 | 0.906 | 6.46 | 8.24 | |
| 0.2 | 0.862 | 1.29 | 3.86 | |
| 0.4 | 0.855 | 6.88 | 2.89 | |
| 0.8 | 0.857 | 7.13 | 2.39 | |
| 0.1 | 0.846 | 5.75 | 1.93 | |
Disclaimer/Publisher’s Note: The statements, opinions and data contained in all publications are solely those of the individual author(s) and contributor(s) and not of MDPI and/or the editor(s). MDPI and/or the editor(s) disclaim responsibility for any injury to people or property resulting from any ideas, methods, instructions or products referred to in the content. |
© 2025 by the authors. Licensee MDPI, Basel, Switzerland. This article is an open access article distributed under the terms and conditions of the Creative Commons Attribution (CC BY) license (https://creativecommons.org/licenses/by/4.0/).
Share and Cite
Du, R.; Liu, Y.; Guo, X.; Dong, G.; Tian, L.; Fan, X.; Ahsan, M. Study of Potential Embodied Carbon Transfer Flows Based on Link Prediction Model. Energies 2025, 18, 2068. https://doi.org/10.3390/en18082068
Du R, Liu Y, Guo X, Dong G, Tian L, Fan X, Ahsan M. Study of Potential Embodied Carbon Transfer Flows Based on Link Prediction Model. Energies. 2025; 18(8):2068. https://doi.org/10.3390/en18082068
Chicago/Turabian StyleDu, Ruijin, Yue Liu, Xiaorui Guo, Gaogao Dong, Lixin Tian, Xinghua Fan, and Muhammad Ahsan. 2025. "Study of Potential Embodied Carbon Transfer Flows Based on Link Prediction Model" Energies 18, no. 8: 2068. https://doi.org/10.3390/en18082068
APA StyleDu, R., Liu, Y., Guo, X., Dong, G., Tian, L., Fan, X., & Ahsan, M. (2025). Study of Potential Embodied Carbon Transfer Flows Based on Link Prediction Model. Energies, 18(8), 2068. https://doi.org/10.3390/en18082068