Article

Optimization of Injection Strategy for CH4/Diesel Dual-Fuel Engine Using Response Surface Methodology

1
LEMI Laboratory, Faculty of Technology, M’hammed Bougara University, Frantz Fanon Street, Boumerdes 35 000, Algeria
2
GEPEA, UMR 6144, Energy Systems and Environment Department, IMT Atlantique, 04 Rue Alfred Kastler, CS 20722, 44307 Nantes Cedex 3, France
*
Author to whom correspondence should be addressed.
Energies 2025, 18(8), 2115; https://doi.org/10.3390/en18082115
Submission received: 14 December 2024 / Revised: 19 March 2025 / Accepted: 18 April 2025 / Published: 20 April 2025
(This article belongs to the Section A: Sustainable Energy)

Abstract

:
Dual-fuel combustion technology allows for lower emissions of particulate matter (PM) and nitrogen oxide (NOx). However, under low load conditions, this mode of combustion has large amounts of emissions of carbon monoxide (CO) and unburned hydrocarbons (HCs) and low thermal efficiency. Several solutions have been presented to solve the issues associated with this operating mode. Optimizing the injection strategy is a potential method to enhance engine performance and reduce emissions, given that the injection parameters have significant effects on the combustion process. The present investigation optimized a methane/diesel dual-fuel engine’s emissions and performance using response surface methodology (RSM). Three parameters were investigated as input variables: dwell time (DT), diesel pre-injection timing (IT), and engine load (EL). RSM was used to optimize brake thermal efficiency (BTE), NOx emissions, and HC emissions, aiming to identify the best combination of these input factors. The RSM analysis revealed that the optimal combination of input parameters for achieving maximum BTE and minimum NOx and HC emissions is an 87% engine load, an 8° crank angle (CA) dwell time, and a 11° bTDC pre-injection timing. The RSM model demonstrated high accuracy with a prediction error less than 4%.

1. Introduction

Due to their higher efficiency and reliability, diesel engines are widely used in transport, agriculture, and industrial sectors [1]. However, the high flame temperature and locally rich air–fuel mixture lead to increased nitrogen oxide (NOx) and particulate matter (PM) formation from diesel engines, which increase the greenhouse effect and adversely impact human health [2]. These emissions are controlled worldwide by adopting stringent emission standards. In this regard, many studies have focused on the optimization of diesel combustion strategies. This has given rise to advanced homogeneous charge compression ignition (HCCI) and low temperature combustion (LTC) engines [3,4]. These types of combustion processes are designed to reduce NOx and PM emissions, which are the main obstacles to the use of compression ignition engines. Additionally, the exhaust gas recirculation (EGR) and selective catalytic reduction (SCR) emission control technologies are also a recognized way of increasing fuel efficiency and reducing emissions from diesel engines [5,6].
Furthermore, the growth in energy consumption is constantly increasing, while fossil fuel resources are limited. It is therefore necessary to overcome the conflict between reducing engine emissions through stricter emission standards and the depletion of fossil fuel reserves. Consequently, the use of alternative, sustainable, and cleaner fuels in advanced combustion modes has appeared as an attractive proposition [7].
Dual-fuel combustion is a promising technology that aims to address both environmental concerns and fuel costs in existing diesel engines. The concept involves using two different fuels simultaneously, typically a gaseous fuel such as natural gas (NG) as the primary fuel and diesel as the secondary fuel.
Researchers reported that the dual-fuel combustion can substantially diminish emissions, such as nitrogen oxides (NOx) and particulate matter, considered to be the primary sources of air pollution. Moreover, given how simply the traditional diesel engine could be modified, the dual-fuel operating mode attracted a lot of attention. However, there are some issues that continue to limit the use of dual-fuel engines. Indeed, the challenges associated with dual-fuel combustion in diesel engines, particularly at low engine loads [8,9], have indeed prompted researchers to explore various strategies to overcome these limitations. Some of the key issues, such as high emissions of carbon monoxide (CO) and unburned hydrocarbons (HCs), as well as reduced thermal efficiency at low loads, have been addressed through different approaches: Diesel and gaseous fuel injection timings, supplying strategies, and injection pressure have a major impact on engine efficiency [10,11,12]. The timing of fuel injection plays a crucial role in achieving efficient combustion. Researchers have focused on the effect of injection timings of both diesel and gaseous fuels to improve combustion stability, reduce emissions, and enhance overall engine performance. Precise control of injection timing helps in achieving better mixing of the fuels and promoting complete combustion.
In order to avoid the reverse effects of combinations of different parameters on engine efficiency, injection parameter optimization should be implemented. Different methods have been reported in the literature to optimize engine performance and emissions, namely the genetic algorithm, neural network [13], non-linear regression [14], response surface methodology (RSM) [15,16], and Taguchi method [17]. The use of genetic algorithms and neural networks requires a large number of experimental data for training the networks, as well as massive computational resources and considerable computational time. Incorrect predictions may result from training the network with fewer unplanned experimental results. An alternative approach is to use an appropriate design of experiments to statistically determine a planned set of engine experiments. Response surface methodology (RSM) is a statistical tool that can be used to achieve prediction and optimization based on experimental results [18].
This statistical method simultaneously optimizes the effects of the different factors and the interaction between variables in order to obtain the best system performance. Compared with full factorial experimental designs, the RSM method takes a minimum amount of time to complete the process by reducing the number of experiments and constructing an appropriate matrix of the experiments involved [19].
The RSM optimization method in the engine has been effectively used by many researchers [19,20]. Singh et al. [21] examined diesel engine emissions and performance at different engine loads, biodiesel blends, injection pressures, and timings using RSM based on the central composite design (CCD). Pongamia biodiesel/diesel was used to power the engine. The optimal operating conditions were a 53% engine load, a 40% biodiesel blend, a 196.36 bar fuel spray pressure, and a 15° before top dead center (bTDC) injection time. RSM effectively optimized diesel engine parameters with error percentages less than 5%. Similarly, Kumar et al. [19] employed the CCD to analyze the performance of an engine operating on Honge oil methyl ester under varying engine loads (ELs), compression ratios (CRs), and injection timings. The findings demonstrate that EL was the major variable influencing brake thermal efficiency (BTE), while compression ratios, load, and injection timing impacted nitrogen oxides (NOx) emissions. In their study, Singh et al. [20] used RSM to find the optimal conditions for controlling the performance and emissions of a direct-injection diesel engine that ran on biodiesel and cassia tora. It was found that a 15° TDC injection timing, a 221-bar injection pressure, a 40% mixture ratio, and a 47% engine load were the optimal operating conditions. Authors concluded that RSM provided effective outcomes with a reasonable error rate compared to experimental findings.
In another study, Suleyman Simsek et al. [22] used the CCD to evaluate the efficiency of a biodiesel-powered diesel engine. The responses for BTE, exhaust gas temperature (EGT), smoke, NOx, and CO2 were 20.54%, 199.88 °C, 0.26%, 558.44 ppm, and 4.52%, respectively, under the optimal operating conditions of a 25.79% biodiesel ratio, a 1484.85 watts engine load, and a 215.56 bar injection pressure. Mustafa Aydın et al. [13] created an Artificial Neural Network (ANN) model for predicting diesel engine operating characteristics using diesel/biodiesel blends. The authors employed RSM for determining the ideal operating parameters for diesel engines under various loads, biodiesel ratios, and injection pressures, with the objective of lowering EGT, brake specific fuel consumption (BSFC), NOx, HC, CO, and smoke, while maximizing BTE. The RSM results indicate that the optimal engine operating conditions are a fuel injection pressure of 470 bar, a biodiesel ratio of 32%, and an engine load of 816 W. The combination of the ANN and RSM is demonstrated to be an excellent technique for optimizing and predicting the characteristics of diesel engines.
In the previous literature, few authors have previously highlighted the influence of injection strategy, specifically fractional injection utilizing the RSM method. Different from other works, this study investigates the influence of the dwell time of the multiple injection strategy in dual-fuel engines. In view of these important shortcomings, our study aims to predict optimal operating parameters using RSM, considering the engine load, pre-injection timing, and dwell time (duration time) between pre-injection and main injection as input parameters with the aim of lowering NOx and HC emissions while maximizing BTE. Therefore, the novelty of this work is predicting optimal operating parameters of a methane (CH4) dual-fuel engine with a minimum number of experiments. This approach allows saving computational time and reduce the need for exhaustive experimental work. For quantitative analysis, we have provided a detailed Analysis of Variance (ANOVA) to evaluate the significance of input parameters and their interactions on engine performance and emissions. The correlation coefficient (R2) and adjusted R2 values have been reported to ensure the robustness of our models.

2. Materials and Methods

2.1. Experimental Setup

An engine test bench in the Energy Systems and Environment Department laboratory (IMT Atlantique, Nantes, France) was used for experiments. The test bench includes a single-cylinder AVL 5402 water-cooled diesel engine with a 0–4500 rpm speed range and 6 kW power output at 4500 rpm. Table 1 lists the main AVL engine specifications.
Figure 1 depicts various test bench components. The engine cell includes an exhaust emissions test bench, a particle analyzer, a dynamometer, and a dual-fuel gas supply system. The exhaust emissions test bench employs a spectral approach with varied levels of resolution. FTIR SESAM emissions analysis is used to measure the main pollutant emissions (NOx, HC, and CO). It also contains an oxygen analyzer with a paramagnetic detector. The oxygen sensor is cleaned using pressurized nitrogen stored in bottles. The experimental setup scheme is shown in Figure 2.
In the present work, five fuel pre-injection timings have been considered, i.e., 31° bTDC, 26° bTDC, 21° bTDC, 16° bTDC, and 11° bTDC, while the main injection timing is obtained by summing the pre-injection timing and the dwell time, which is the interval time between the end of the first injection and the beginning of the second one.
Response variables are recorded at a constant speed of 1500 rpm for five engine loads, namely 20%, 40%, 60%, 80%, and 100%. Corresponding to 44.9%, 54.3%, 63.2%, 69%, and 73.5% in terms of the gaseous fuel energy share. Experiments were carried out with the input parameter combinations suggested by the central composite design.

2.2. Response Surface Methodology

The response surface methodology (RSM) was established in 1951 by Box and Wilson [23]. It includes a set of statistical and mathematical techniques for the analysis and modeling of engineering issues with numerous influencing variables. The primary objective is to discern interactions between responses and input variables.
In this work, an RSM-based central composite design (CCD) was chosen to optimize the performance of a CH4 dual-fuel engine. The CCD is particularly suitable for second-order model fitting in complex systems with non-linear interactions, such as internal combustion engines. The CCD allows for efficient parameter optimization with a minimized number of experiments. Engine tests were conducted following the central composite design. Table 2 indicates the input parameters and their corresponding levels. The input parameters used to optimize the BTE, HC, and NOx emissions were A, dwell time (°CA); B, engine load (%); and C, diesel pre-injection timing (°bTDC).
The CCD is a full factorial design with a center point connecting the high and low levels, eight factorial points, and six axial points. Data reproducibility and experimental error are computed using these points. There are five levels of parameter variations (−2, −1, 0, +1, and +2). Table 3 shows the specifics of the tests performed using the CCD technique. It includes 17 experiments involving different combinations of input variables.
After the experiments have been carried out, the response variables are fitted to a second-order model in order to establish a correlation between the response parameter and the independent variables. The general formulation of the second-order quadratic equation is expressed as follows:
Y = β 0 + i = 1 k β i X i + i = 1 k β i i X i 2 + j i k β i j X i X j + Ɛ
where i and j correspond to the linear and quadratic coefficients, respectively. β represents the regression coefficient, whereas k denotes the number of elements investigated. Xi is the linear terms, Xi2 is the quadratic terms, and XiXj signifies the interaction terms. Ɛ represents the residual of the experiments.
Once the response variables were fitted, the resultant models were subjected to normal probability and significance tests using the analysis of variance (ANOVA) method. The significance of the various input parameters within the specified range was determined using ANOVA. The responses were found to be best fitted by a reduced quadratic model based on coded values. The models generated by the regression analysis are shown in Equations (2)–(4).
BTE = + 23.05 − 0.2838A + 3.80B + 0.1588C − 0.1800AB − 0.1600AC + 0.1725BC + 0.1441A2 − 0.7646B2 − 0.4296 C2
HC = + 5978.16 + 241.15A + 144.13B + 470.24C − 75.18AB + 143.94AC − 203.91BC − 138.01A2 − 212.77B2 + 137.30C2
NOx = + 767.91 − 227.10A + 345.65B − 477.73C − 56.32AB + 128.10AC − 155.29BC + 58.00A2 + 69.99B2 + 98.76C2
Table 4 presents the analysis of variance (ANOVA) results for BTE, HC, and NOx. It is essential to determine the probability value (p-value) and conduct the Fisher’s statistical test (F-value) to approve any quadratic model. A higher F-value indicates greater reliability of the model, while a lower p-value indicates more model’s significance [24].
In ANOVA results, the p-value is the most significant parameter. Models exhibiting p-values above 0.1 suggest that the model terms lack statistical significance, while models with p-values below 0.05 denote that the model terms are statistically significant [16]. As shown in Table 4, the p-value of all the models is less than 0.0001, suggesting that the regression model is highly significant.
In addition to ANOVA, the precision index values were also used to confirm that the model predictions are very close to experimental values. The precision index values of different models are shown in Table 5.
The correlation coefficient (R2) measures the level of variability in the responses provided by the model’s independent factors. R2 = 1 occurs when there is an exact fit between the experimental findings and the model outcomes [25]. The results indicate that the respective R2 for BTE, HC, and NOx emissions are 0.99, 0.97, and 0.98. The values are more than 0.95 and are in accordance with the findings of many researchers [20,26]. The R2 (adj.) values for BTE, HC, and NOx are 0.97, 0.93, and 0.97, respectively. The R2 values are nearly equal to 1, indicating a significant correlation between the independent variables.
In addition, the plots of predicted values versus experimental data presented in Figure 3, Figure 4 and Figure 5 reveal that all predicted values are in close agreement with those of the experimental data. The different colors of the data points represent the range of a variable, following a color gradient from blue (low) to red (high) along the diagonal line. This visual differentiation facilitates evaluation of model performance as a function of concentration levels. An imperceptible deviation of high value points from the reference line may suggest a reduction in predictive accuracy at higher values.

3. Results and Discussion

This section presents the influence of the control parameters on the BTE, HC, and NOx output responses. The Design Expert software (version 11, Stat-Ease Inc., Minneapolis, MN, USA) was used to create the 3D surface plots.

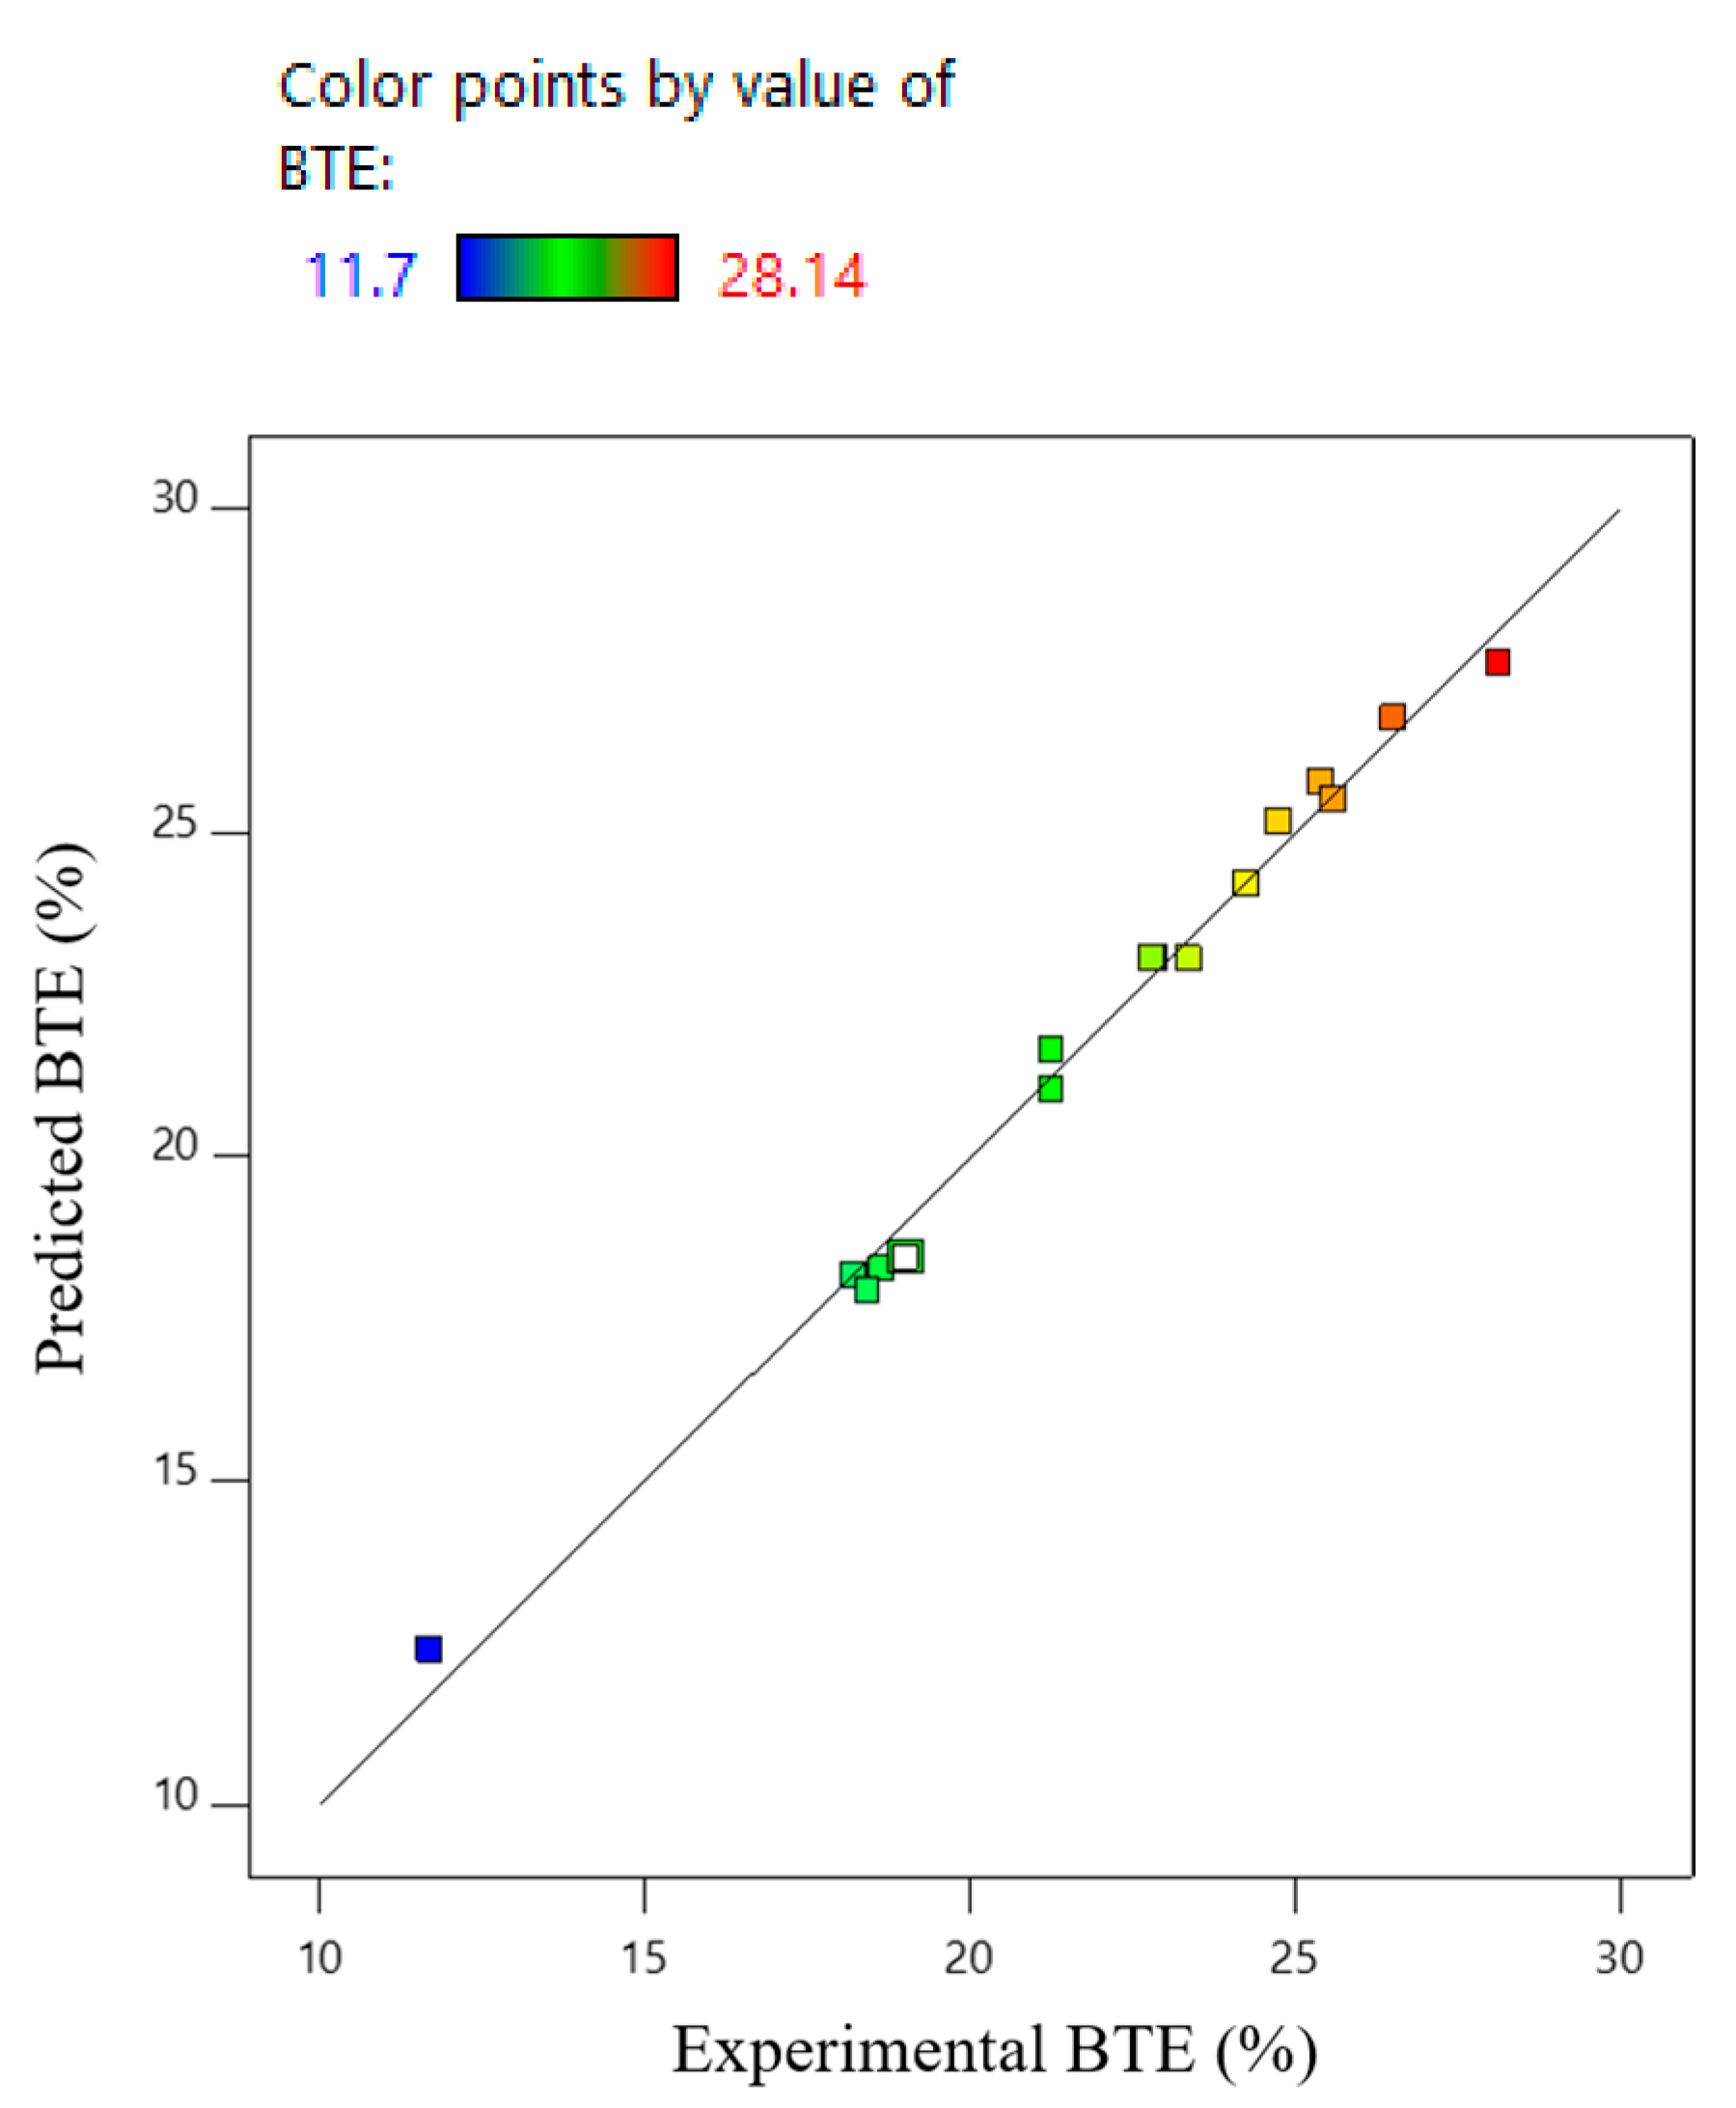
3.1. Brake Thermal Efficiency (BTE) Model

The efficiency of any engine could be estimated through the brake thermal efficiency (BTE) engine response. The brake thermal efficiency (BTE) is illustrated in Figure 6 as a function of all input values. The change in BTE with dwell time and pre-injection timing at a 60% EL hold value is illustrated in Figure 6a. It is observed that more advanced pre-injection timing and longer dwell times have been shown to reduce BTE. As the pre-injection timing is advanced, the ignition delay increases, and once the injection starts, the pressure and temperature are low. This can be explained by the fact that the main diesel fuel injection is located far from the high-temperature zone created by the pre-injected diesel fuel combustion. As a result, the main diesel fuel injection is less influenced by the elevated temperature and pressure regions, leading to a lower BTE. The same trend has been observed by researchers [19].
As seen in Figure 6b,c, BTE increases with the load. This is because, with an increase in load, the engine cylinder temperature increases, resulting in better combustion of fuel and thereby minimizing the losses of the engine [26].
Figure 6b shows the variation of BTE versus the fuel injection timing and engine load at constant DT. It reveals a significant variation with load and IT. With an increase in IT from 31° bTDC to 11° bTDC, a considerable rise in BTE is observed with a maximum of more than 28% at a pre-injection timing of 21° bTDC and under a full-load condition.

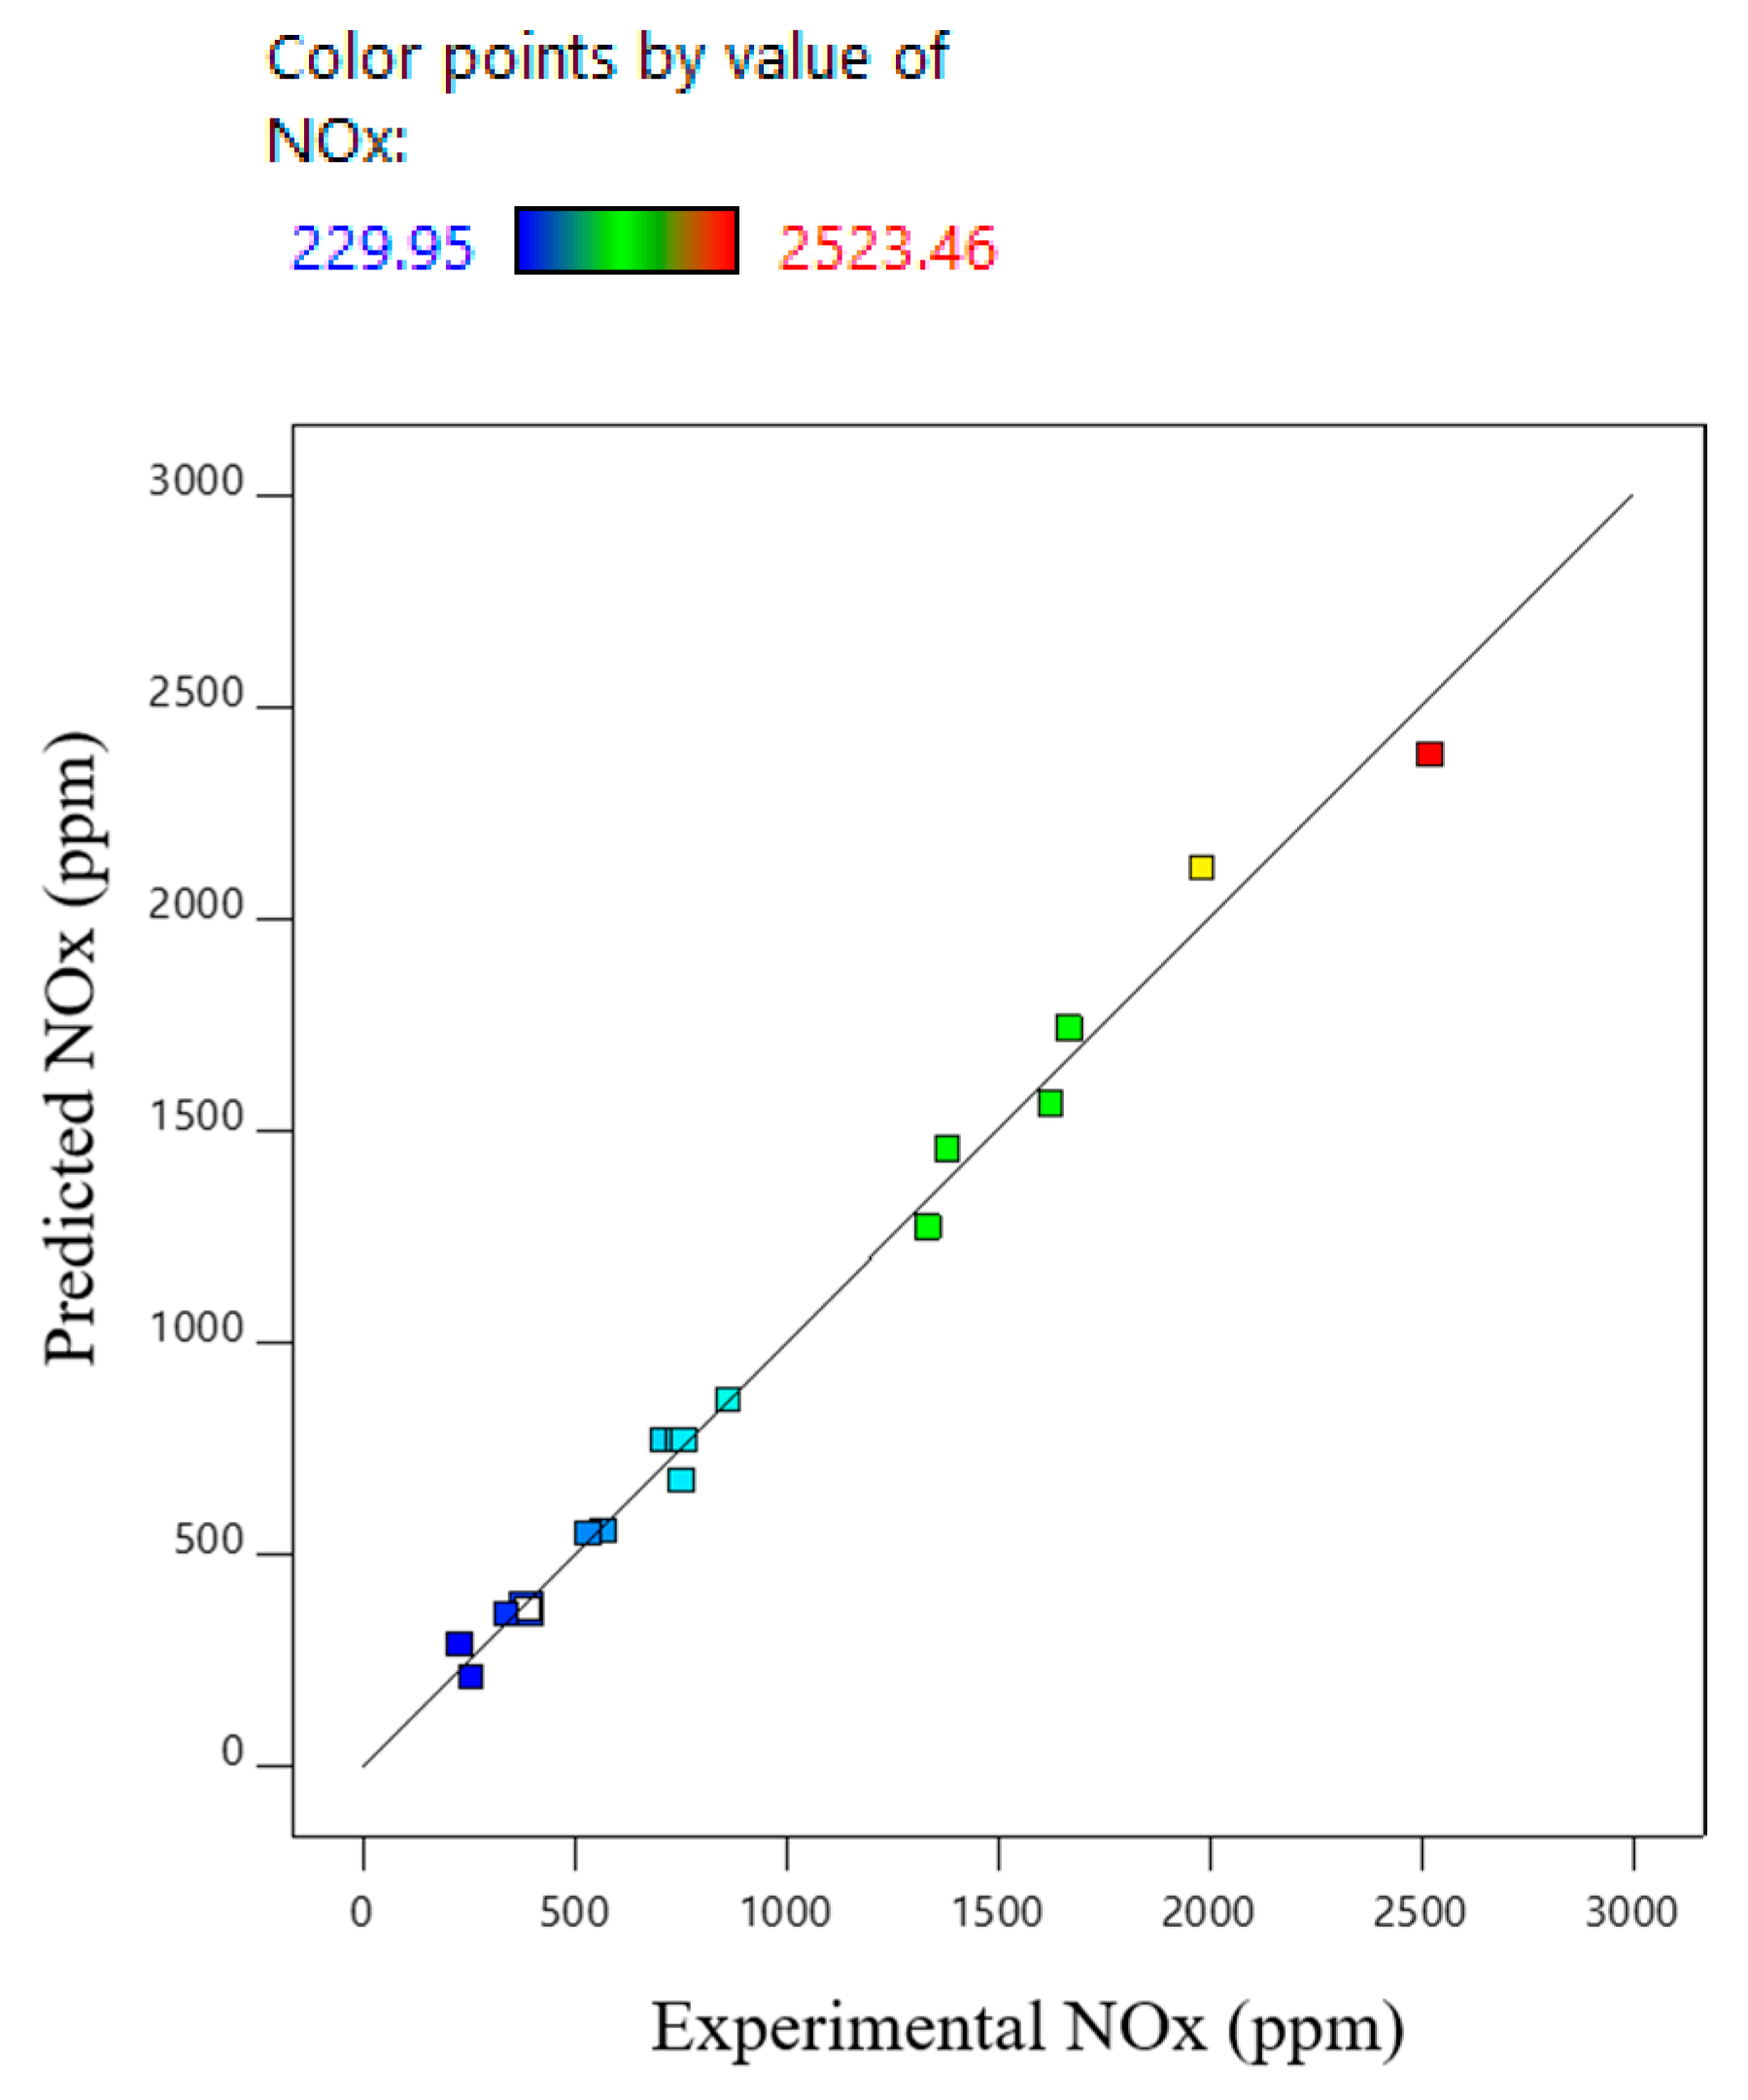
3.2. Nitrogen Oxide Emission (NOx) Model

Oxygen availability and cylinder temperature have a significant impact on higher NOx generation. Figure 7 illustrates the variation of NOx emissions with all control factors. Figure 7a displays the variation of NOx with dwell time and pre-injection timing when the hold value is 60% EL. Less NOx emission is observed with retarded injection timings than with advanced injection timings (far from TDC) [21,26]. Retarded injection timings result in a shorter delay period, a proportion of combustion takes place during the expansion stroke, and the temperature of the cylinder will be effectively reduced. As a result, the emissions of NOx are reduced.
The variation of NOx with fuel injection timing and engine load for constant DT is shown in Figure 7b. The findings indicate that the concentration of NOx emissions increases as the engine load increases. Furthermore, short dwell times further increase the NOx emissions (Figure 7c) since the interaction between the combustion of the two diesel injections gradually increased, leading to a higher temperature region. The lower value of NOx is obtained with a combination of an advanced injection timing of 11° bTDC and a dwell time of 16° CA. Therefore, optimizing engine operating parameters is important for lowering NOx emissions without significantly reducing BTE.

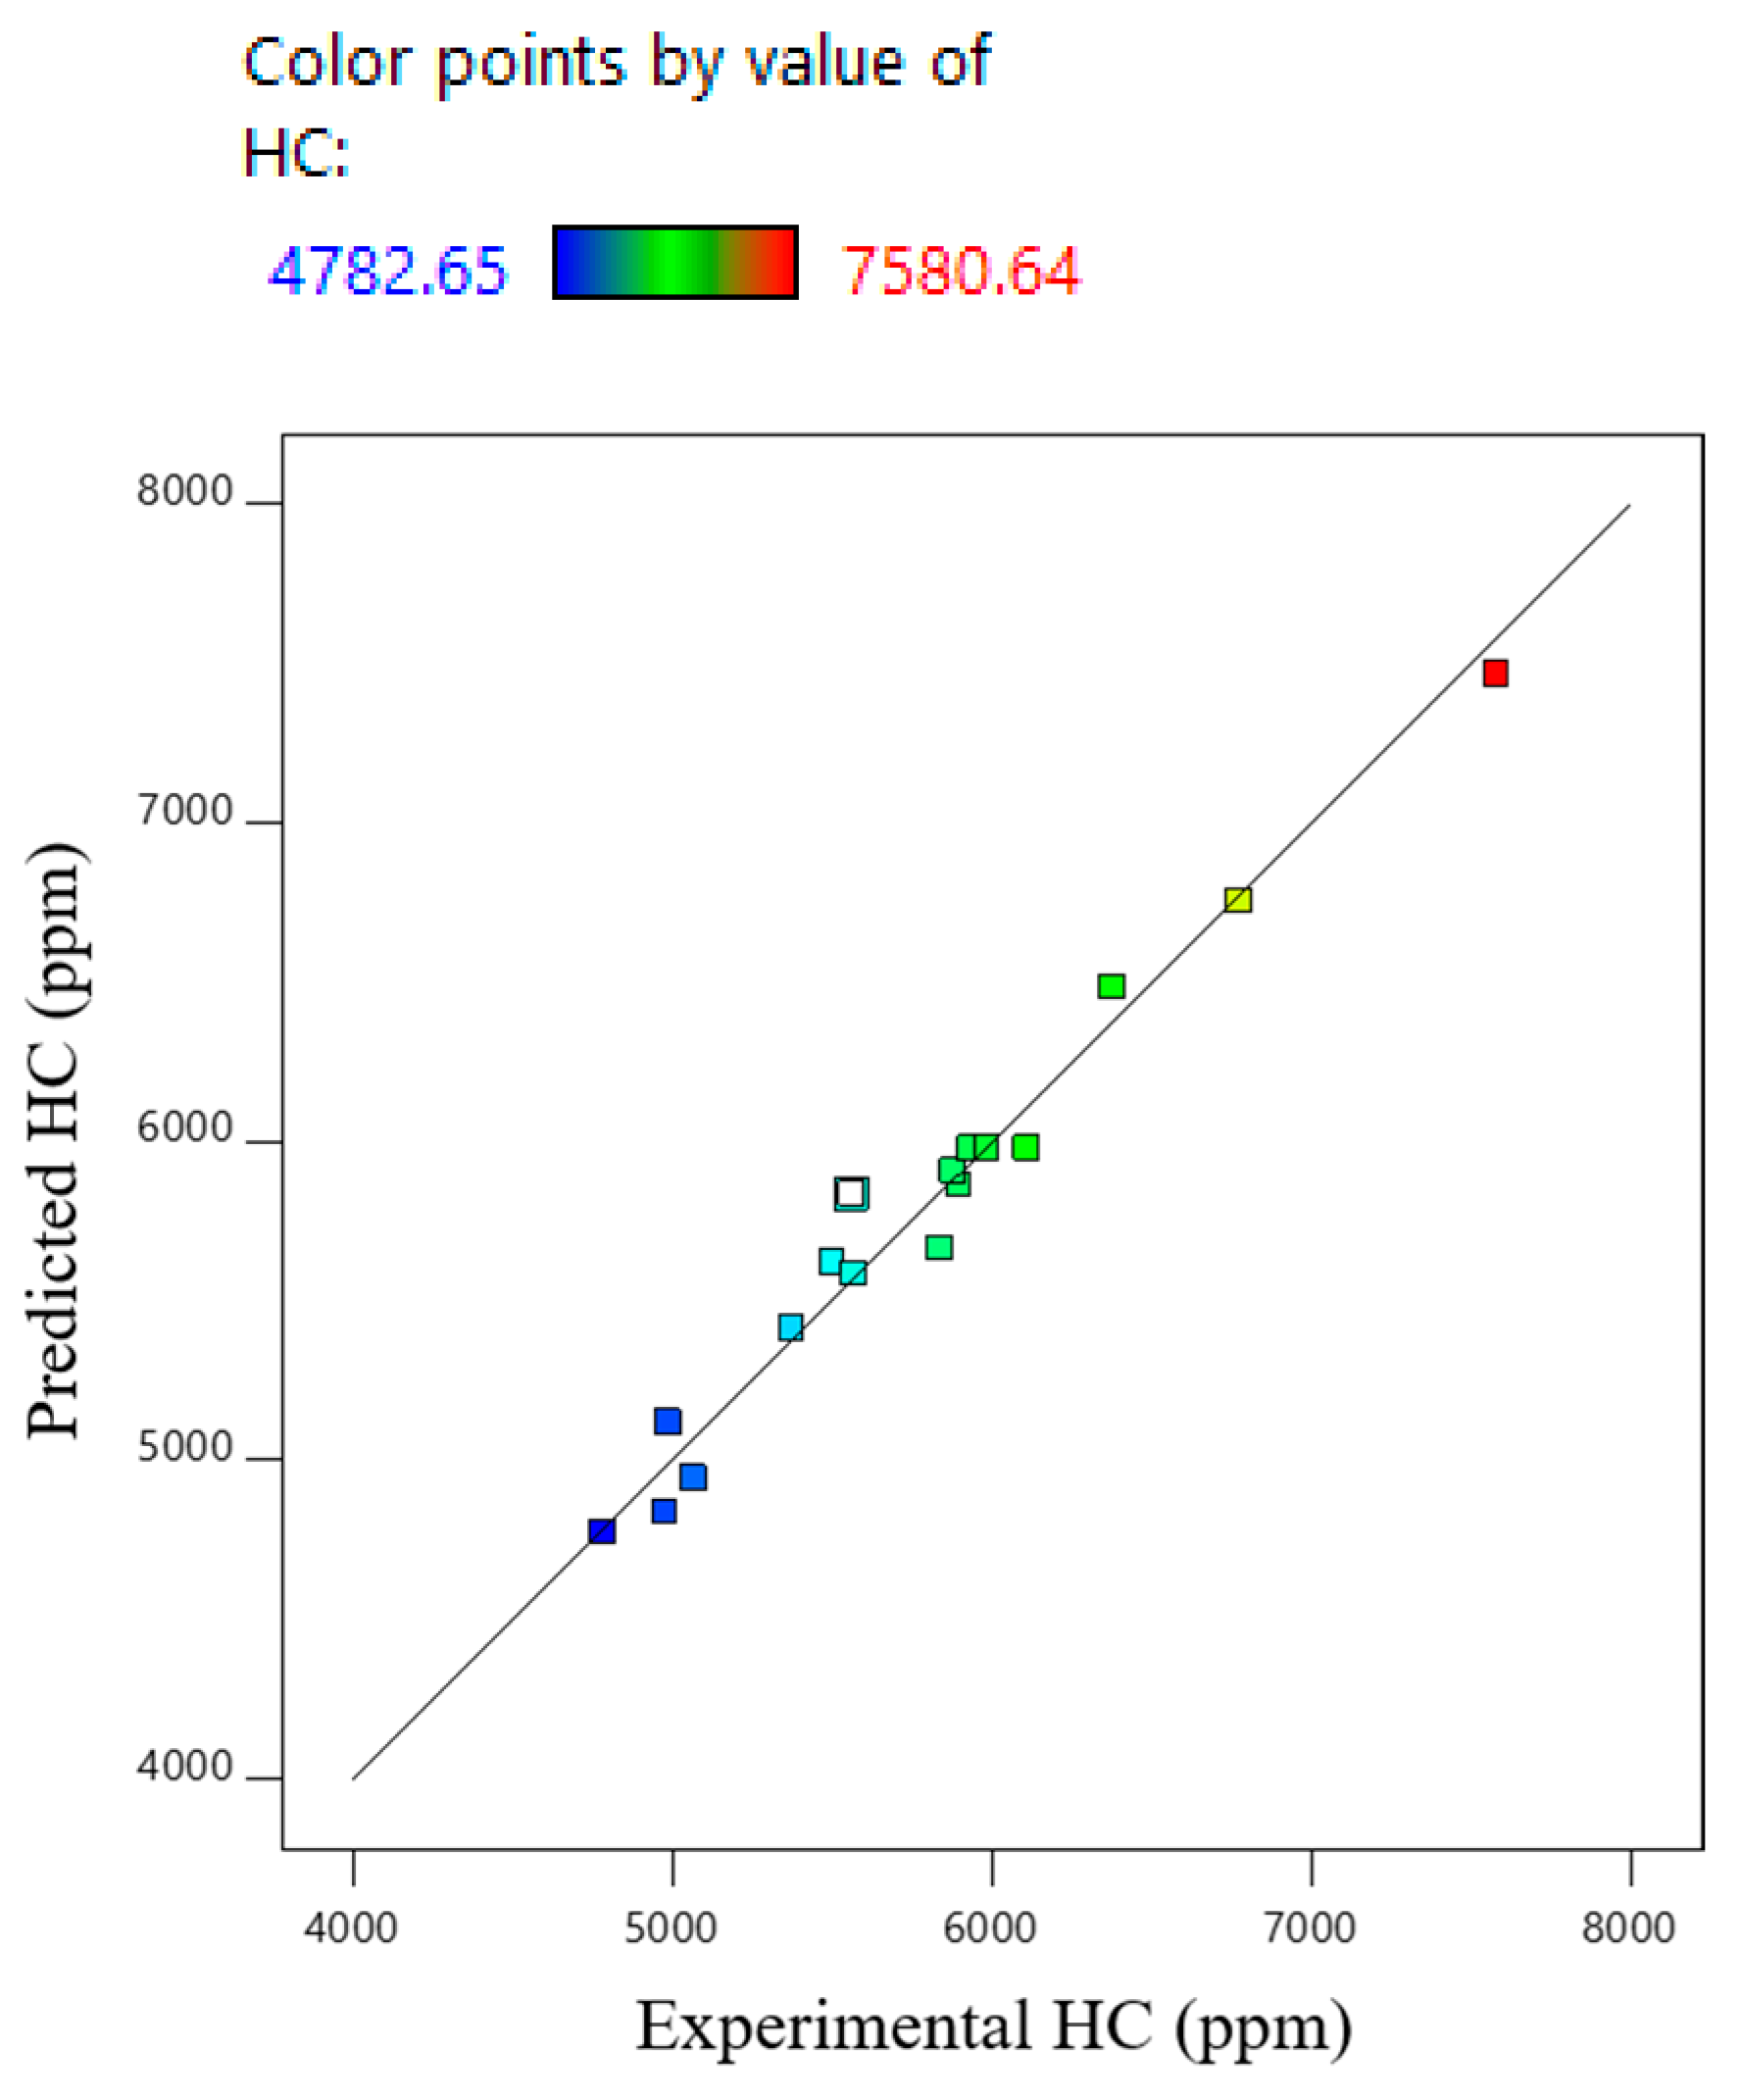
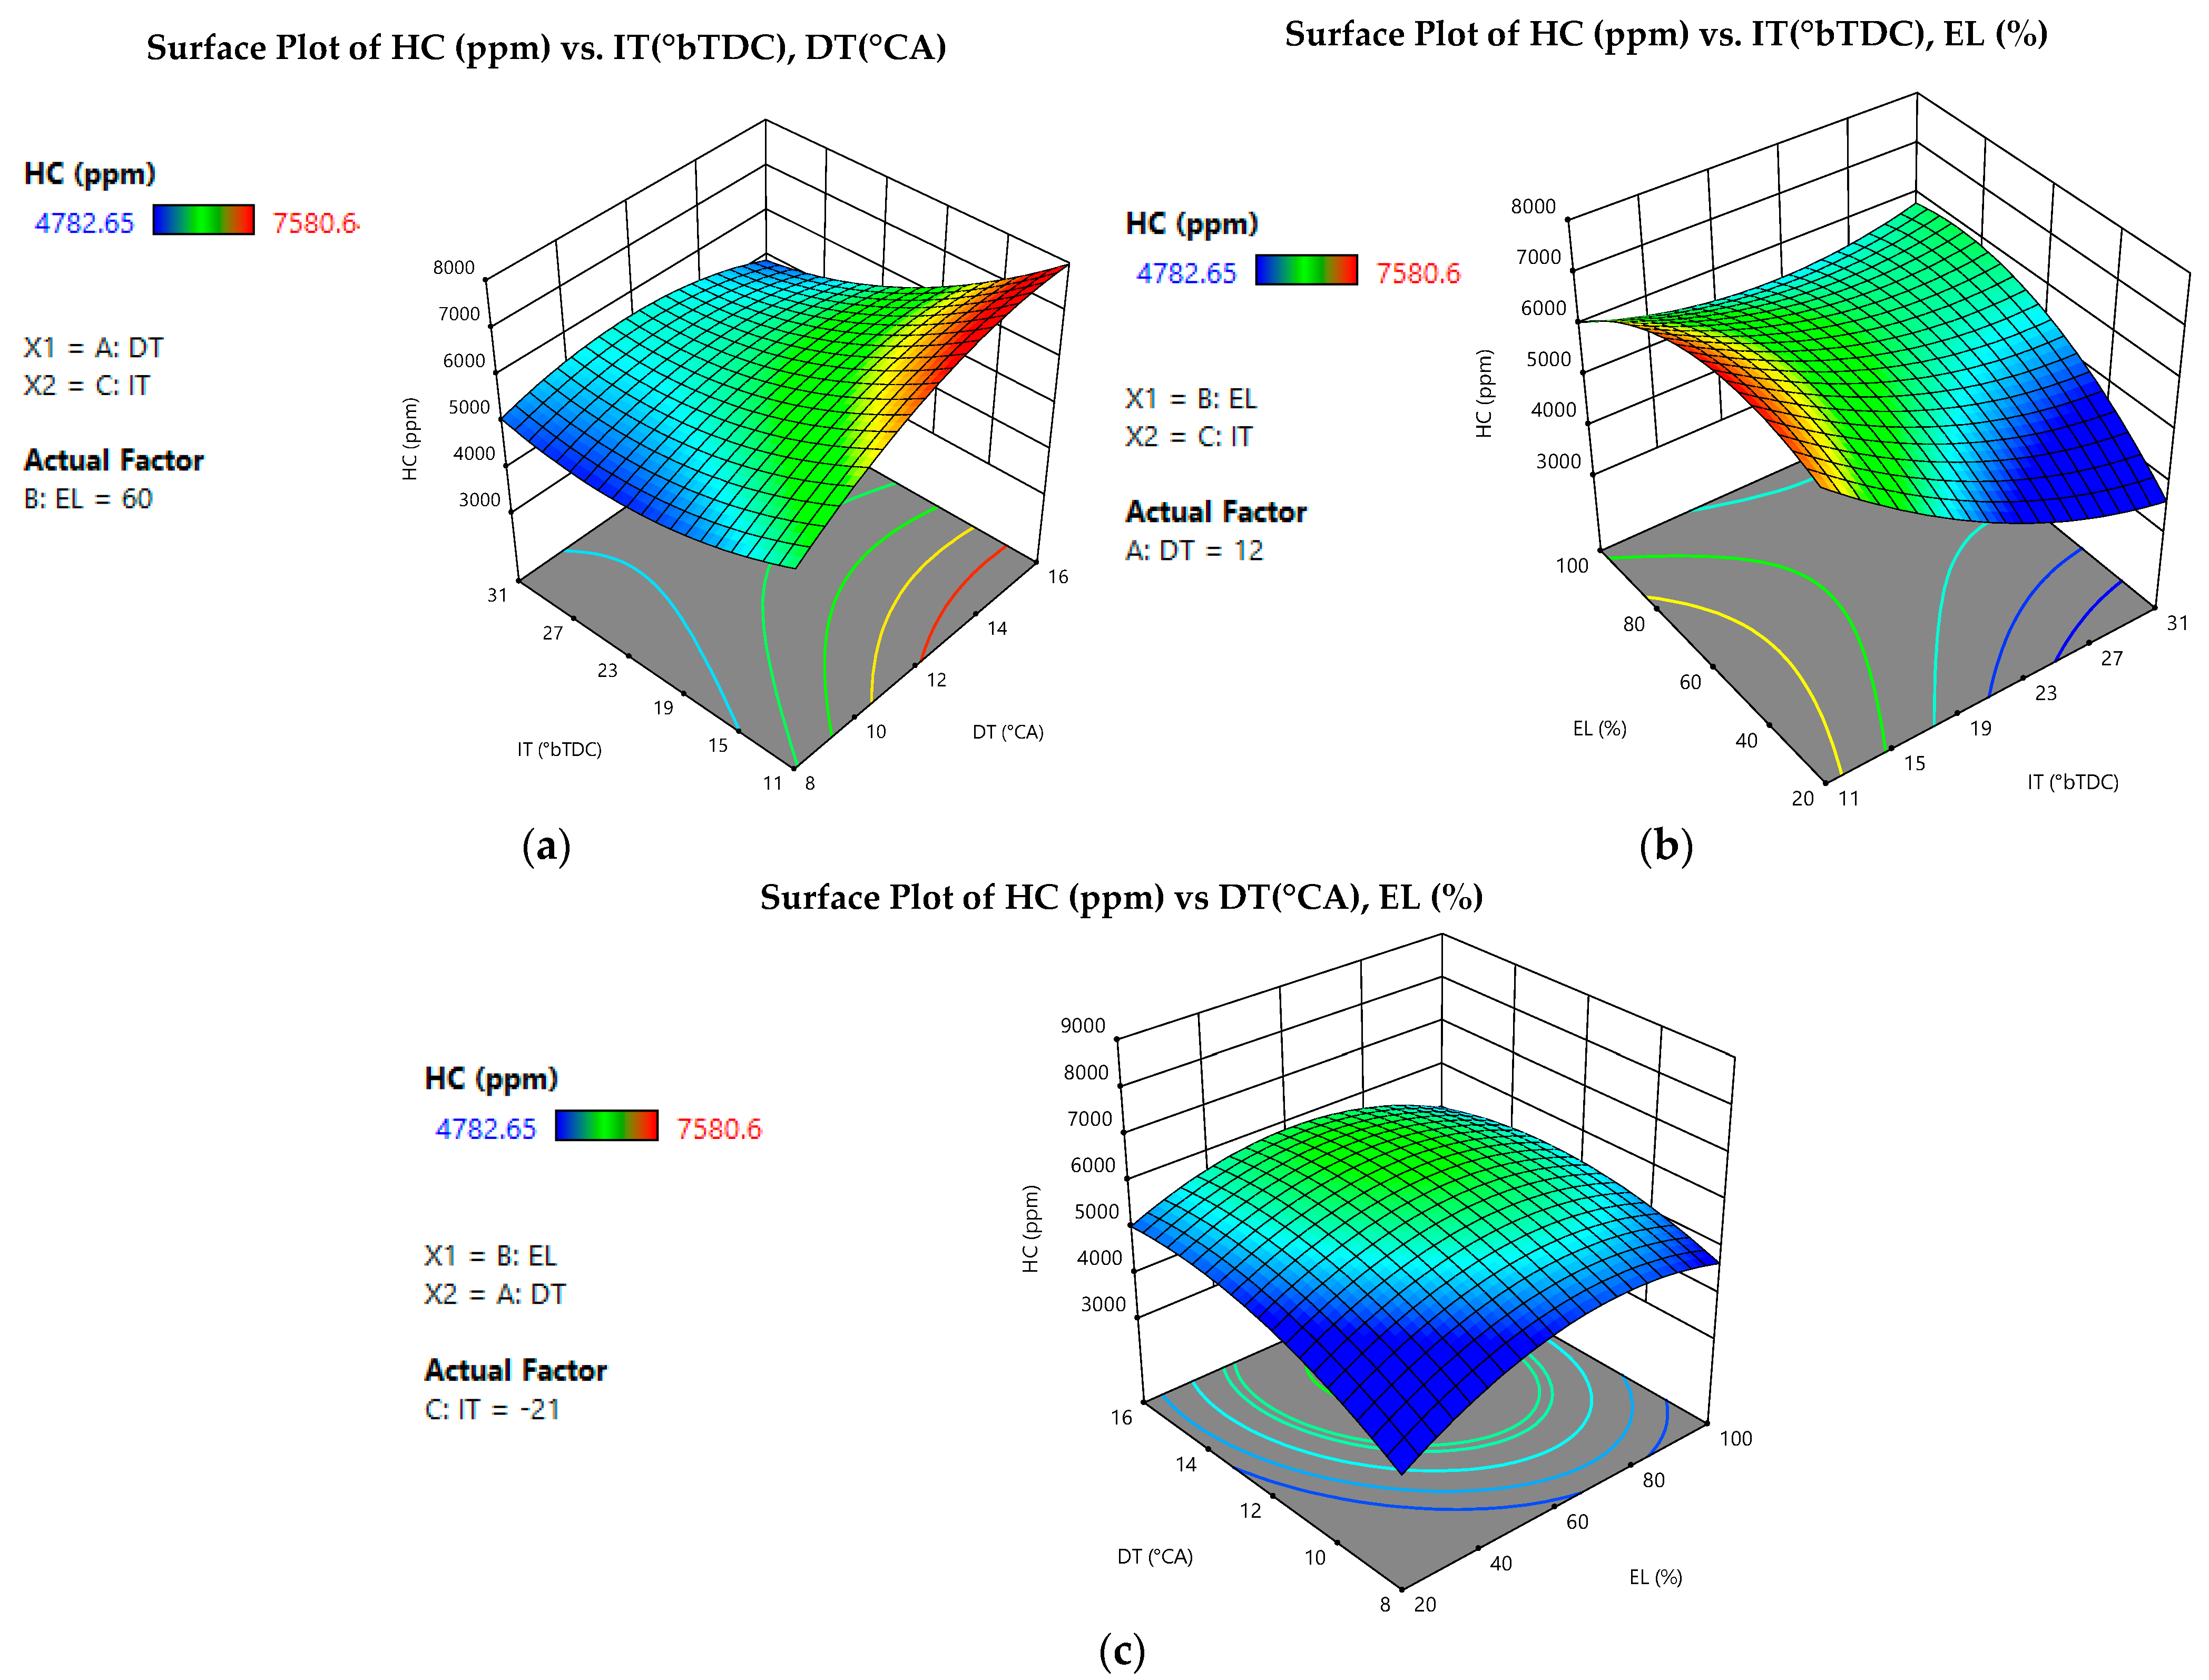
3.3. Unburned Emission (HC) Model

The amount of unburned HC reveals the quality of the combustion process. Figure 8 depicts the effect of the engine load, pre-injection timing, and dwell time on HC emissions. Figure 8a illustrates the variation of HC emissions with dwell time and pre-injection timing under a constant engine load. We notice that advanced pre-injection timing reduces HC emissions since it results in a longer ignition delay period, leading to additional time for fuel combustion and thus enhanced oxidation. A similar trend has been observed by researchers [19,20,26]. It is also noticed from Figure 8a that the combination of advanced injection timing and a shorter dwell time results in a minimum value of unburned hydrocarbon [19,20,26].

4. Response Optimization and Validation Test

The RSM optimizer is used in this study to optimize the engine operating parameters in order to maximize engine performance while minimizing emissions. The main engine performance parameter is BTE. Also, HC and NOx are major pollutants produced during combustion.
For BTE, HC, and NOx, the projected optimum values are 28.14%, 5313.93 ppm, and 709.85 ppm, respectively. Accordingly, the optimal operating variables combination is an 8° CA dwell time, a 11° bTDC injection timing, and an 87% engine load. A desirability value of 0.84 was found, which is the highest and the closer to the criteria defined for the optimization.
It is necessary to confirm and validate the optimal results. Therefore, a confirmation test was carried out using the predicted values derived from the model. The error percentage is shown in Table 6. The prediction error was found to be within the 5% limit. Thus, the model is approved.

5. Conclusions

In the current study, response surface methodology (RSM) was used to optimize the injection strategy of a CH4/diesel dual-fuel engine. The effects of controlled input variables on BTE, HC, and NOx emissions were studied, including pre-injection timing, dwell time, and the engine load. The experiments were conducted on a single-cylinder diesel engine as per the sequence of 17 tests suggested by the RSM using Design Expert software (version 11, Stat-Ease Inc.). An analysis of variance (ANOVA) has also been conducted to evaluate the statistical significance and reliability of the model. In order to predict BTE, HC, and NOx, second-order equations were generated using RSM. Input factors were optimized using the desirability approach and their response predictions were generated. The major findings are given below.
  • The developed statistical model resulted in a p-value less than 0.05 for the experimental results. This revealed that the developed models were statistically significant.
  • The predicted results were compared with the experimental data. It revealed a significant correlation between the experimental findings and the model results. Coefficient of variance (R2) values are close to 1, suggesting that the independent variables are highly correlated.
  • Higher desirability of 0.84 is obtained for the optimized operating parameters.
  • The best combination of engine operating parameters was obtained as an 87% load, 11° bTDC pre-injection timing, and a dwell time of 8° CA, corresponding to 28.14% for BTE, 5313.93 ppm for NOx and 709.85 ppm for HC. The validation experiments were carried out for the RSM-predicted outcomes. The average error for BTE, HC, and NOx was found to be 2.83%, 3.7%, and 2.85%, respectively, which signified that the present optimization model delivered appropriate results with acceptable error levels.
In summary, the proposed RSM-based model effectively predicts BTE, HC, and NOx emissions while optimizing dual-fuel engine performance by systematically evaluating injection parameters and minimizing experimental efforts. Its adaptability extends beyond the studied engine, making it a valuable tool for optimizing various dual-fuel configurations and guiding engine design, calibration, and emission control strategies. Additionally, it provides researchers and engine designers with a reliable knowledge base for the early prediction of optimal conditions, enabling improved dual-fuel engine performance with minimal experimentations.
For future prospects, a comprehensive investigation of the combustion and emission performance of a dual-fuel CH4/diesel engine across a wide range of operating parameters is essential to further improve dual-fuel engine efficiency. The ideal approach would involve obtaining complete engine maps through a specific experimental procedure; however, this method is highly costly and resource-intensive.

Author Contributions

Conceptualization, S.O. and M.S.L.; Methodology, S.O. and M.S.L.; Writing—original draft preparation, S.O.; writing—review and editing, K.L.; supervision, K.L. and M.T. All authors have read and agreed to the published version of the manuscript.

Funding

This research received no external funding.

Data Availability Statement

The authors declare that the data supporting the findings of this study are available within the paper and no additional source data are required. Should any raw data files be needed in another format, they are available from the corresponding author upon reasonable request.

Conflicts of Interest

The authors declare that they have no known competing financial interests or personal relationships that could have appeared to influence the work reported in this paper.

References

  1. Geng, P.; Cao, E.; Tan, Q.; Wei, L. Effects of alternative fuels on the combustion characteristics and emission products from diesel engines: A review. Renew. Sustain. Energy Rev. 2017, 71, 523–534. [Google Scholar] [CrossRef]
  2. Breuer, J.L.; Samsun, R.C.; Peters, R.; Stolten, D. The impact of diesel vehicles on NOx and PM10 emissions from road transport in urban morphological zones: A case study in North Rhine-Westphalia, Germany. Sci. Total Environ. 2020, 727, 138583. [Google Scholar] [CrossRef]
  3. Verma, S.K.; Gaur, S.; Akram, T.; Gautam, S.; Kumar, A. Emissions from homogeneous charge compression ignition (HCCI) engine using different fuels: A review. Environ. Sci. Pollut. Res. 2022, 29, 50960–50969. [Google Scholar] [CrossRef] [PubMed]
  4. Krishnasamy, A.; Gupta, S.K.; Reitz, R.D. Prospective fuels for diesel low temperature combustion engine applications: A critical review. Int. J. Engine Res. 2021, 22, 2071–2106. [Google Scholar] [CrossRef]
  5. Elkelawy, M.; El Shenawy, E.; Mohamed, S.A.; Elarabi, M.M.; Bastawissi, H.A.-E. Impacts of using EGR and different DI-fuels on RCCI engine emissions, performance, and combustion characteristics. Energy Convers. Manag. X 2022, 15, 100236. [Google Scholar]
  6. Wardana, M.K.A.; Lim, O. Review of improving the NOx conversion efficiency in various diesel engines fitted with SCR system technology. Catalysts 2022, 13, 67. [Google Scholar] [CrossRef]
  7. Salvi, B.; Subramanian, K. Sustainable development of road transportation sector using hydrogen energy system. Renew. Sustain. Energy Rev. 2015, 51, 1132–1155. [Google Scholar] [CrossRef]
  8. Li, W.; Liu, Z.; Wang, Z. Experimental and theoretical analysis of the combustion process at low loads of a diesel natural gas dual-fuel engine. Energy 2016, 94, 728–741. [Google Scholar] [CrossRef]
  9. Lounici, M.S.; Loubar, K.; Tarabet, L.; Balistrou, M.; Niculescu, D.-C.; Tazerout, M. Towards improvement of natural gas-diesel dual fuel mode: An experimental investigation on performance and exhaust emissions. Energy 2014, 64, 200–211. [Google Scholar] [CrossRef]
  10. Ouchikh, S.; Lounici, M.; Loubar, K.; Tarabet, L.; Tazerout, M. Effect of diesel injection strategy on performance and emissions of CH4/diesel dual-fuel engine. Fuel 2022, 308, 121911. [Google Scholar] [CrossRef]
  11. Yang, B.; Wang, L.; Ning, L.; Zeng, K. Effects of pilot injection timing on the combustion noise and particle emissions of a diesel/natural gas dual-fuel engine at low load. Appl. Therm. Eng. 2016, 102, 822–828. [Google Scholar] [CrossRef]
  12. Yang, B.; Xi, C.; Wei, X.; Zeng, K.; Lai, M.-C. Parametric investigation of natural gas port injection and diesel pilot injection on the combustion and emissions of a turbocharged common rail dual-fuel engine at low load. Appl. Energy 2015, 143, 130–137. [Google Scholar] [CrossRef]
  13. Aydın, M.; Uslu, S.; Çelik, M.B. Performance and emission prediction of a compression ignition engine fueled with biodiesel-diesel blends: A combined application of ANN and RSM based optimization. Fuel 2020, 269, 117472. [Google Scholar] [CrossRef]
  14. Tosun, E.; Aydin, K.; Bilgili, M. Comparison of linear regression and artificial neural network model of a diesel engine fueled with biodiesel-alcohol mixtures. Alex. Eng. J. 2016, 55, 3081–3089. [Google Scholar] [CrossRef]
  15. Ganapathy, T.; Gakkhar, R.; Murugesan, K. Optimization of performance parameters of diesel engine with Jatropha biodiesel using response surface methodology. Int. J. Sustain. Energy 2011, 30, S76–S90. [Google Scholar] [CrossRef]
  16. Awad, O.I.; Mamat, R.; Ali, O.M.; Azmi, W.; Kadirgama, K.; Yusri, I.; Leman, A.; Yusaf, T. Response surface methodology (RSM) based multi-objective optimization of fusel oil-gasoline blends at different water content in SI engine. Energy Convers. Manag. 2017, 150, 222–241. [Google Scholar] [CrossRef]
  17. Ganapathy, T.; Murugesan, K.a.; Gakkhar, R. Performance optimization of Jatropha biodiesel engine model using Taguchi approach. J. Appl. Energy 2009, 86, 2476–2486. [Google Scholar] [CrossRef]
  18. Myers, R.H.; Montgomery, D.C.; Anderson-Cook, C.M. Response Surface Methodology: Process and Product Optimization Using Designed Experiments; John Wiley & Sons: Hoboken, NJ, USA, 2016. [Google Scholar]
  19. Kumar, S.; Dinesha, P. Optimization of engine parameters in a bio diesel engine run with honge methyl ester using response surface methodology. Measurement 2018, 125, 224–231. [Google Scholar] [CrossRef]
  20. Singh, Y.; Sharma, A.; Tiwari, S.; Singla, A. Optimization of diesel engine performance and emission parameters employing cassia tora methyl esters-response surface methodology approach. Energy 2019, 168, 909–918. [Google Scholar] [CrossRef]
  21. Singh, Y.; Sharma, A.; Singh, G.K.; Singla, A.; Singh, N.K. Optimization of performance and emission parameters of direct injection diesel engine fuelled with pongamia methyl esters-response surface methodology approach. Ind. Crops Prod. 2018, 126, 218–226. [Google Scholar] [CrossRef]
  22. Simsek, S.; Uslu, S. Determination of a diesel engine operating parameters powered with canola, safflower and waste vegetable oil based biodiesel combination using response surface methodology (RSM). Fuel 2020, 270, 117496. [Google Scholar] [CrossRef]
  23. Box, G.E.; Wilson, K.B. On the experimental attainment of optimum conditions. J. R. Stat. Soc. B 1992, 13, 270–310. [Google Scholar]
  24. Bharadwaz, Y.D.; Rao, B.G.; Rao, V.D.; Anusha, C. Improvement of biodiesel methanol blends performance in a variable compression ratio engine using response surface methodology. Alex. Eng. J. 2016, 55, 1201–1209. [Google Scholar] [CrossRef]
  25. Kumar, B.R.; Saravanan, S.; Rana, D.; Nagendran, A. Combined effect of injection timing and exhaust gas recirculation (EGR) on performance and emissions of a DI diesel engine fuelled with next-generation advanced biofuel–diesel blends using response surface methodology. Energy Convers. Manag. 2016, 123, 470–486. [Google Scholar] [CrossRef]
  26. Kashyap, D.; Das, S.; Kalita, P. Exploring the efficiency and pollutant emission of a dual fuel CI engine using biodiesel and producer gas: An optimization approach using response surface methodology. Sci. Total Environ. 2021, 773, 145633. [Google Scholar] [CrossRef]
Figure 1. Engine cell components. (a) Diesel engine; (b) dynamometer; (c) particulate analyzer; (d) fuel balance; (e) emissions bench.
Energies 18 02115 g001
Figure 2. Experimental setup scheme.
Energies 18 02115 g002
Figure 3. Experimental vs. predicted values of BTE.
Energies 18 02115 g003
Figure 4. Experimental vs. predicted values of NOx.
Energies 18 02115 g004
Figure 5. Experimental vs. predicted values of HC.
Energies 18 02115 g005
Figure 6. (a) Variation of BTE with dwell time and pre-injection timing; (b) Variation of BTE with engine load and pre-injection timing; (c) Variation of BTE with dwell time and engine load.
Energies 18 02115 g006
Figure 7. (a) Variation of NOx with dwell time and pre-injection timing; (b) Variation of NOx with engine load and pre-injection timing; (c) Variation of NOx with dwell time and engine load.
Energies 18 02115 g007
Figure 8. (a) Variation of HC with dwell time and pre-injection timing; (b) Variation of HC with engine load and pre-injection timing; (c) Variation of HC with dwell time and engine load.
Energies 18 02115 g008
Table 1. Characteristics of the diesel engine (AVL 5402).
Engine Type4 Strokes, CI, Diesel Direct Injection (DI)
Bore × stroke85.01 mm × 90 mm
Connecting rod165.3 mm
Volumetric capacity511 cm3
Compression ratio17:1
Power output6 kW at 4500 rpm
Number of injections5
Number of valves2 admission, 2 exhaust
IVO0° CA before TDC
IVC14° CA after BDC
EVO24° CA before BDC
EVC3° CA after TDC
Table 2. The level of engine input variables.
Input ParametersSymbolCoded Level
−2−1012
Dwell time (DT) (°CA)A810121416
Engine load (EL) (%)B20406080100
Pre-injection timing (IT) (°bTDC)C3126211611
Table 3. Experimental design matrix.
Factor 1Factor 2Factor 3Response 1Response 2Response 3
StdRunDTELITBTEHCNOx
°CA%°bTDC%ppmppm
6114401618.436775.08229.95
5210401619.025563.49390.56
3310802625.425503.382523.46
948602124.265068.121382.42
15512602123.375935.43711.04
16612602122.836111.02748.13
7710801626.525899.03864.28
128121002128.145374.281670.62
14912601121.267580.64256.27
21014402618.664988.03755.6
101116602122.855881.04532.75
171212602122.815984.98759.9
11310402618.214782.651336.86
111412202111.74976.82340.48
131512603121.2655711985
41614802624.755838.511625.2
81714801625.616379.47570.15
Table 4. Results of the analysis of variance (ANOVA) for BTE, HC, and NOx Models.
Model TermsBTE ModelHC ModelNOx Model
F-Valuep-ValueF-Valuep-ValueF-Valuep-Value
Model83.32<0.000127.580.000174.70<0.0001
A (DT)3.840.090830.060.000979.80<0.0001
B (EL)690.56<0.000110.740.0135184.87<0.0001
C (IT)1.200.3090114.29<0.0001353.15<0.0001
AB0.77320.40841.460.26612.450.1612
AC0.61090.46015.350.053912.700.0092
BC0.71010.427310.750.013518.660.0035
A21.200.309511.920.01076.300.0404
B233.780.000728.330.00119.180.0191
C210.660.013811.790.010918.270.0037
Lack of fit4.250.20144.890.178521.860.0443
Table 5. Precision index values.
BTE ModelHC ModelNOx Model
R20.99080.97260.9897
R2 (adj.)0.97890.93730.9764
Predicted R20.92690.80070.9171
Table 6. Confirmation test for RSM-predicted values and % error.
Input Control Variable Output Response
EL (%)DTITBTE (%)HC (ppm)NOx (ppm)
87%8° CA11° bTDCPredicted28.145313.93709.85
Experimental27.345468.69737.13
% Error2.83 < 5%3.70 < 5%2.85 < 5%
Disclaimer/Publisher’s Note: The statements, opinions and data contained in all publications are solely those of the individual author(s) and contributor(s) and not of MDPI and/or the editor(s). MDPI and/or the editor(s) disclaim responsibility for any injury to people or property resulting from any ideas, methods, instructions or products referred to in the content.

