Article

Comparative Studies of Three-Dimensional Complex Flow Field Designs in a Proton Exchange Membrane Hydrogen Fuel Cell

Department of Thermal and Nuclear Power Engineering, Technical University of Sofia, 8 Kl. Ohridsky Blvd., 1000 Sofia, Bulgaria
*
Author to whom correspondence should be addressed.
Energies 2025, 18(9), 2165; https://doi.org/10.3390/en18092165
Submission received: 12 March 2025 / Revised: 17 April 2025 / Accepted: 22 April 2025 / Published: 23 April 2025
(This article belongs to the Special Issue Renewable Fuels and Chemicals)

Abstract

:
The performance and durability of proton-exchange membrane fuel cells (PEMFCs) are dependent on fuel flow, humidifying water, and outgoing water management. Unlike conventional flow fields with linear channels, the complex 3D flow field—featuring repeating baffles along the channel, known as the baffle design—induces a micro-scale interface flux between the gas diffusion layer (GDL) and the flow fields. Thus, an intensive oxygen flow is created that removes excess water from the GDL, thereby improving the fuel cell efficiency. Another approach for channel design is the Turing flow field, which resembles the organization of fluid flows in natural objects such as leaves, lungs, and the blood system. This design enhances the distribution of inlet flow significantly compared with traditional designs. The present study aims to combine the advantages of both Turing and baffle flow field designs and to provide model investigations on the influence of the mixed flow field design on the efficiency of PEMFCs. It was established that the mixed design achieves the highest electrode current density of 1.2 A/cm2, outperforming the other designs. Specifically, it achieves 20% improvement over the Turing design, reaching 1.0 A/cm2 and generating three times more current than the baffle design, which delivers 0.4 A/cm2. In contrast, the conventional serpentine designs exhibit the lowest current density. The mixed flow field design provides better oxygen utilization in the electrochemical reaction, offers optimal membrane hydration, and contributes to superior electrode current density performance. These data illustrate how flow field structure directly impacts fuel cell efficiency through enhancement of current density.

1. Introduction

Hydrogen fuel cells are a modern technology for efficient generation of green energy and considered as an alternative to carbon fuels in the transition to sustainable energy production, replacing internal combustion engines and small-capacity stationary energy facilities powered by fossil fuels [1,2,3]. Hydrogen fuel cells operate through electrochemical interactions between hydrogen and oxygen, generating electrical energy, and the only waste products released are water and heat [4,5,6]. Proton exchange membrane fuel cells (PEMFCs) are among the most promising energy conversion devices with significant advantages over other types of fuel cells (FCs), such as alkaline electrolyte or solid oxide fuel cells [7,8]. PEMFCs have a shorter start-up time than the other FC types, lower operating temperature (below 100 °C), high energy density, good efficiency with a small size, rapid power output regulation, etc., which make them suitable for mobile and stationary energy applications. Despite significant progress in the development of PEMFCs, there are still a number of challenges that limit their wide practical implementation and economic viability. These limitations are related to their performance at high current densities, membrane lifetime, effective control of gas flow fields, and water optimization [9,10,11,12]. This requires research and optimization in the design of materials and configurations of electrodes and fluid channels [13,14]. The relationship between the flow distribution and fluid resistance in the channels related to the flow structure and control of chemical reactions has been established as a key optimization FC performance factor [15]. Each flow field includes a microchannel structure and a porous sublayer, as shown in Figure 1.
The main objectives of the channel design are to maximize the flow across the FC, distributing it evenly though the porous layer to the cathode electrode. The channels need to reduce resistance to reactant flow and to enhance reaction uniformity across the entire area of the electrode surface [15]. Improving the reactant flow through the cell leads to increasing the total reaction rate taking place in the active area, which contributes directly to the higher FC power output. By reducing the flow resistance in flow field plates, less pumping power is required for gases supplied in the cell, thereby improving overall efficiency.
The performance of the FCs mainly depends on these two main objectives and water management in order to ensure the unhindered passing of protons. These challenges could be addressed by optimizing the flow field plate design [16]. There are diverse flow field channel designs such as pin-type flow fields, series parallel flow fields, serpentine flow fields, integrated flow fields, and interdigitated flow fields [17]. These flow field designs, with the exception of interdigitated flow fields, provide continuous flow channels from inlet to outlet, and reactant flow is parallel to the electrode surface [18]. A single channel configuration is the simplest flow design. This design has no issues of distributing the gas reactant and is suitable for the arrangement of small FCs. Large FCs require a longer channel length; thus, a high pressure drop occurs due to the high frictional resistance. Therefore, the serpentine configuration is a good option. The parallel straight flow field has the lowest pressure drops due to the simplicity in the structure; however, it has maldistribution flow, which reduces the chemical reaction rate taking place throughout the active area [19]. The time for a transient response for a serpentine configuration is 9.5 s, which is higher that than for a parallel design at 7.5 s. This is the time needed for the fuel FC to start increasing its voltage back to steady state after reducing it due to instantly increasing the current density [20,21]. Therefore, the parallel configuration has the best results in transient time, but it has low steady-state performance and issues with pressure drops due to uneven gas distribution. The low velocity in the channels in the parallel flow field cause poor water removal, affecting the membrane ion conductivity and FC performance, whereas the serpentine flow configuration shows better water removal [20]. However, the mixed configuration of a parallel and serpentine design was found to give the best results in terms of efficiency and water removal, and this design is called the parallel in series [22,23]. Comparison between the parallel and serpentine configuration shows that channel depth has a major influence on the parallel plate performance, while the serpentine design has minimum response to the channel depth. Further comparison shows that pin-type configurations could be comparable to the mixed serpentine configuration at high current density. Pin-type flow fields have a much lower pressure drop of 34 Pa, while the serpentine has the highest at 206 Pa compared to the pressure drops of 73 Pa for parallel channels [24].
While the fluid flow in a FC is related to flow in the channels, flow in a porous medium, multiphase flow with phase change, and diffusion losses, the flow in a FC stack is mainly related to the design of the inlet and outlet manifolds of the stack. This ensures uniformity of the reaction over a larger active area and reduces the resistance to fluid flow, which requires less pumping power, which in turn directly affects the final performance of the system [25].
Studies for PEMFCs under different loading conditions reveal that at higher current densities (above 0.8 A/cm2), the main limitation to increasing energy production is related to the transport mechanisms of the reactants (mainly oxygen), rather than kinetic or ohmic losses. Forced convection in the special electrode configuration can improve oxygen delivery and lead to higher current at lower voltages, which has been confirmed by the conducted studies [26].
Unlike the conventional flow fields with linear channels, the 3D complex flow field with repeating baffles along the channel, the so called baffle design, induces a micro-scale interface flux between the gas diffusion layer (GDL) and the flow fields. Thus, an intensive oxygen flow is created that removes excess water from the GDL, thus improving the FC efficiency. Numerical studies of the serpentine-baffle design of PEMFCs reveal improved transport of oxygen and an increased concentration of reactants in the flows as reflected by the higher power density of greater than 25% depending on baffle shapes as compared to symmetrical serpentine channels [27]. Baffle channels distribute hydrogen and oxygen more evenly throughout the electrolyte, increase the effective contact area between the gases and the electrolyte, ensure better gas flow control, promote turbulence in the channel, and reduce local pressure and gas concentration gradients, thus ensuring longer FC life and better efficiency. This can increase the reactivity of the FC by providing better gas distribution and active areas. Another approach for channel design is the Turing flow field, which resembles the organization of fluid flows in natural objects such as leaves, lungs, and the blood system, enhancing the distribution of inlet flow significantly compared with traditional designs. The Turing design can be tuned to create more efficient and controlled gas flows within the cell, allowing for more uniform gas distribution. Optimized Turing channels can reduce hydraulic resistance more effectively than baffle channels, providing less energy losses and higher efficiency. The Turing design offers the most efficient channel geometry as well as optimal active reaction area and heat distribution. It also has great flexibility to adapt to different FC needs.
Along with the increasing the mass flow, the production of water vapor is also increased, although some water management improvements are noted due to enforced flow toward the gas diffusion layer in the interdigitated design. In the straight channel configuration, water vapor decreases along the channel length according to the reactant concentration gradient, and liquid water is formed mainly on the cathode side [27]. In contrast, in the interdigital design, water condensation is observed only on the anode side when the current is low (<0.17 A/cm2) and on the cathode side when the current density is high [28]. Given the inability of the membrane to absorb the excess water generated, it remains in the gas diffusion layer in the oxygen flow [29]. Studies have shown that diffusion is the primary method of transport in straight parallel channels, and interdigitated designs exhibit forced convection. At high current, water forms on the cathode due to excess water remaining in the gas diffusion [30]. During operation on the cathode side, transport limitations either from flooding the electrodes with product water and blocking the oxygen transport pathways, which typically occurs at high current densities, or drying of the membrane due to a rate that is too high, which leads to higher ohmic losses, cause membrane degradation and decreased proton conductivity. All of these observations confirm that water management is a key element that allows FCs to operate efficiently [31].
During FC load changes, cell temperature varies and alters average water content. Therefore, humidifiers are used to maintain inlet flow humidification around 95% RH, ensuring a relatively small range of cell water variation [32]. In bipolar plate channels, single-phase flow is often not observed, especially at high current densities where significant water generation can lead to two-phase flow. This phenomenon is critical in the catalyst layer and the GDL, as liquid water obstructs catalyst sites and GDL pores, hindering oxygen transport and increasing resistance. Water enters the channels as droplets from the GDL. Depending on the gas flow rate and channel conditions (such as wall contact angle), different flow regimes can develop [33]. Many researchers use the two-phase flow CFD models in order to obtain FC working conditions similar to reality. Efficient removal of liquid water is essential to maintain oxygen access to the catalyst. FCs with a parallel flow field design are known for its limitations in managing liquid water. Water droplets often can block one of the channels, causing a local increase in resistance to gas flow. Since other channels are empty and taking the ‘diverted’ flow, the system is unable to clear out the accumulated water [17].
Another alternative for good water management is providing baffles within the channels at the cathode in order to enforce the air flow toward the GDL at certain angles and draw out water droplets from the GDL into the channel.
In Figure 2, the upside-down trapezium presented in light blue is called a baffle, and its effect on the cathode side accounts for 30% higher efficiency compared with conventional flow field design [34]. The baffle angle also plays an important role as it determines the air angle ‘attack’ toward the GDL and cathode catalyst layer. The angle in this baffled design is 45°, which accounts for an 18.87% power density increase in PEMFCs compared with angels of 30° and 60° that exhibit increases of 11.32% and 15.10%, respectively [35].
An FC system operating without a humidifier has been proposed to simplify the design, reducing costs for the FC system and improving reliability [36]. A 3D micro-lattice flow field design, which is also known as a louver-like structure, has been used to draw water generated from the electrode to the back surface of the flow field by allowing turbulent air flow toward the electrode. This approach prevents the inhibition of gas flow due to flooding, as noted for the parallel design. As a result, a volume power density of 3.1 kW/L is achieved. The maximum power of the stack was increased by 27% from 90 kW to 114 kW. At the same time, the cell volume was reduced by 24%.
FC performance is not only directly affected by water management but also directly impacted by fluid flow resistance in the channels (require less pumping power). This ensures efficient penetration through the porous material layer, thereby delivering an adequate amount of reactant to the electrode. This process utilizes a larger region of the FC active area. In order to enhance reaction uniformity across the entire area of the electrode surface, the homogenization-based method uses pattern algorithms derived from Alan Turing’s work on bio-inspired approaches for engineering design [37,38].
The design of the flow channel is critical and the most investigated component of PEMFCs in order to increase their efficiency and extend their lifetime. The study of hybrid channel configurations of hydrogen FCs has been of significant research interest in recent years with the aim of increasing their efficiency by improving the transport of reactants. The study of hybrid channel configurations of PEMFCs has been of significant interest in recent years with the aim of increasing their efficiency by improving the transport of reactants. Although the most practically valuable parallel–serpentine hybrid hydrogen fuel cell design possesses improved energy efficiency and system robustness, it entire active area is not efficiently utilized because of the low convection and reactant concentration in the plate of catalyst given the effect of the ribs. This requires improvements such as blocking channels to create over-rib convection, which increases the parasitic power [39]. Another recent concept is the bio-inspired flow channel designs of PEMFCs, the so called bionics approach. This approach uses concepts from biological subjects for the development of technological decisions. Based on this method, four biological channel systems could be attributed to FC flow field design: leaf, lung, tree and unconventional shapes [40]. Overall, bio-inspired flow channels have been found to be effective with a significant positive effect on solving the problem of organizing water flows and improving the overall performance of PEMFCs. The main development issues concerning the practical application of bio-inspired flow channels are directed to their simplification, economic viability, and technological feasibility. For example, lower pressure loss, faster flow rates, and increased current density have been noted for leaf-shaped channels compared to serpentine channels [41]. Experimental test confirms the superior performance of leaf-shaped channels over serpentine channels in direct methanol FCs [42]. A bio-inspired wave-like channel has been proposed to improve the output power density of PEMFCs by 2.2% [43]. The Turing flow filed design can also use natural and mathematical models that recreate chaotic or self-sustaining structures, such as those that might be found in nature.
The present study aims to compare different flow field model investigations on the efficiency of a simulated proton exchange membrane hydrogen fuel cell with different channel designs: serpentine, baffle, Turing and a mixed baffle and Turing configuration. It is expected that combining the advantages of both Turing and baffle flow field designs will provide improved efficiency and optimized performance of PEMFCs. Combining these two channel designs can provide better cell operation at different flow rates, while minimizing energy losses and flow turbulence. It is expected that the mixed design will have better flexibility across a wide range of operating conditions, including wide temperature ranges, and will also provide longer cell life due to less wear, reduced critical loads, and improved process uniformity. Combining the two designs could provide a balanced distribution of hydrogen and oxygen across the cell, efficient heat distribution, and increased process stability. The main novelty of the present study is the use of software modeling to investigate possible advantages of a mixed design of the PEMFC channels, combining the advantages of the modern concepts of Turing and baffle flow field designs, with the aim of performing subsequent reasonable experimental studies using this approach.

2. Model Description

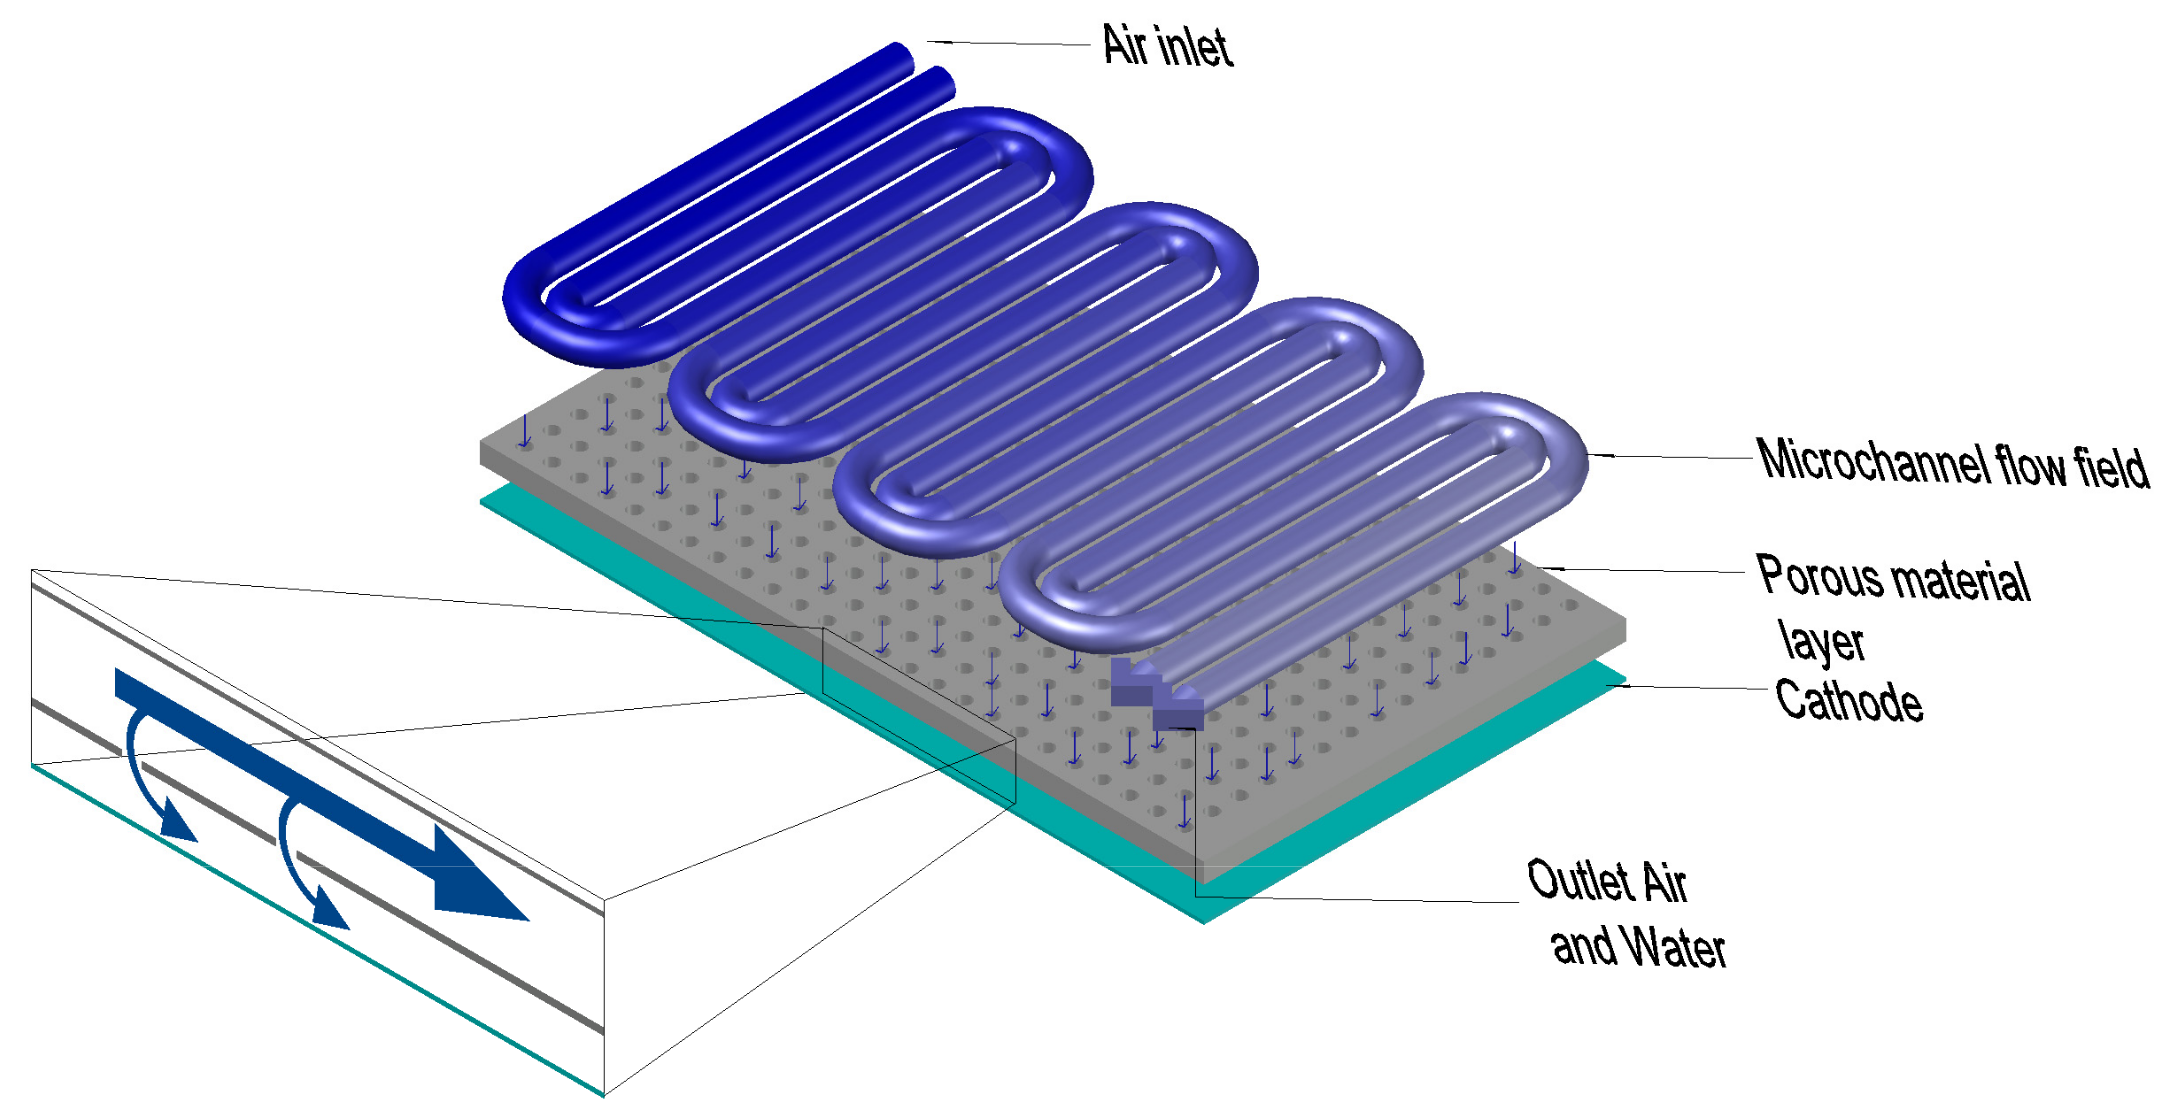
2.1. PEMFC Model Design

As part of this study, four different flow field designs are considered. Membrane electrode assemblies (MEAs) for all designs are evaluated with equal dimensions and materials. The cell size is 12 mm in width and 20 mm in length with a membrane of a polymer structure transporting ions with high conductivity called the “proton exchange membrane”. A Nafion membrane is used as the solid electrolyte in PEMFCs that operate at temperatures below 100 °C. The gas diffusion layer (GDL) is around 70–80% porosity with a thickness of 500 µm, and the catalyst layer (CL) comprises platinum nanoparticles with a thickness of 1 µm. The study only models the cathode side where the air is supplied, and the oxygen reduction reaction occurs. This is known as the most sluggish reaction due to the slow kinetics and represents a main focus of research to enhance its efficiency [44]. The inlet mass flow rate is the same for each model in order to compare how the mole fraction of oxygen is distributed in the active zone of the cell, the humidity of the water contained in the channels and membrane, the pressure loss for each design, and the polarization curves. The modeling was performed using COMSOL Multiphysics software (COMSOL, Inc., Burlington, MA, USA), version 6.1, work package Water Electrolysers and Fuel Cells.

2.2. Mathematical Model Descriptions

Unlike conventional flow fields, the addition of baffles into the channels to create 3D micro-lattices to promote flow recirculation, expansion, contraction, and vortex shedding called inertial effects (Forchheimer’s effect) are dominant in 3D complex flow field PEMFCs. In this case, it is crucial to conder Forchheimer’s law in addition to the multi-phase mixture model based on Darcy’s two-phase law [45]. In this study, a two-phase Forchheimer extension was used to describe macroscopic liquid water and mass behavior in 3D complex flow fields.
In Darcy’s law, the flow of fluids is model through porous media where laminar (viscous) flow is assumed and not applicable when inertial effects occur. The Forchheimer equation presented in Equation (1) is used to describe the fluid flow in porous media. This is an extension to Darcy’s law that accounts for higher velocities, where inertial effects become significant and suitable for turbulent flows in porous media [46]:
μ k u = [ p I + μ ε p ( u + ( u ) T ) ] ρ ε p C f k u | u |
where k (m2) is the permeability of the porous medium, εp (dimensionless) is the porosity, μ (Pa·s) is the dynamic viscosity, u (m/s) is the velocity in the open channel, ρ (kg/m3) is the fluid density, and p (Pa) is the pressure. The dimensionless Forchheimer coefficient βF in Equation (2) accounts for the additional drag [47].
β F = ρ ε p C f k
The pressure level at the outlet is used as a reference value, and the boundary condition is u = 0, which accounts for the wall, as no slip is assumed. The assumptions for the design models are provided in Table 1 below.

2.3. Electrochemical Model Description

The electrochemical cell potential Vcell is described using Equation (3), as a function of several types potential losses, as follows:
V c e l l     V N e r n s t ƞ o h m ƞ a c t ƞ d i f   =   f ( )
In practical fuel cell applications, a cell voltage of around 0.7 V could be considered as realistic operating voltage. Indeed, it is commonly used as a standard operating point for PEMFCs [48]. As part of this research, the current density is compared at a set voltage of 0.7 V for all models. Since the Nernst equation gives the equilibrium potential, which is the theoretical open-circuit voltage ( V o c p ), Equation (3) could be expressed as follows:
V c e l l = V o c p ƞ o h m ( ) ƞ a c t ( )   ƞ d i f ( )
where V N e r n s t   i s   t h e   N e r n s t   p o t e n t i a l ,   a n d   ƞ o h m , ƞ a c t , and ƞ d i f represents ohmic losses, activation losses, and diffusion losses, respectively. These are a function of current density, causing the voltage drop across the fuel cell when the current density increases.
ƞ o h m = R i n t e r n a l i
Ohmic losses in Equation (5) are typically liner. Here, R i n t e r n a l is the sum of the cell ohmic resistance of the anode, cathode, and electrolyte multiplied by the current density (i) per area of electrode (A/cm2), which is expressed as follows:
ƞ a c t = R T a F ln o
R is the universal gas constant (8.314 J/mol·K); T is the operating temperature, K; a is the charge transfer coefficient; F is Faraday’s constant (96,485 C/mol); is the operating current density; and o is the exchange current density, which represents activation losses.
Ƞ d i f = B ln 1 l i m
Diffusion losses in Equation (7) occur due to mass transport limitations as reactant gases are depleted near the electrode surface at high current densities. B is an empirical coefficient related to mass transport properties, and ilim the limiting current density, which represents the maximum current that the FC can sustain before reactant depletion occurs.
l i m = 2 F D C H 2 O L
In Equation (8), the limiting current density is calculated using Faraday’s constant (F), the thickness of the gas diffusion layer (L), the diffusion coefficient (D), and reactant concentration C H 2 O [49].

2.3.1. Exchange Current Density

The exchange current density ( i 0 ) mentioned in Equation (6) is a fundamental parameter for modelling as quantifies the rate at which the electrochemical reaction proceeds at equilibrium, where no net current flows through the electrode. It depends mainly on electrode material. A higher reference current density indicates faster reaction kinetics and lower activation overpotentials. In PEMFCs, the exchange current density varies significantly between the anode and cathode due to different kinetics. At the anode, the reaction using platinum (Pt) catalysts exhibit a high exchange current density. However, on the cathode side, the reaction (oxygen reduction) is much slower, indicating the sluggish nature of oxygen reduction on platinum. For purpose of this study, 10−3 A/cm2 at the anode and 10−6 A/cm2 for the cathode have been applied using data from literature studies [50,51].

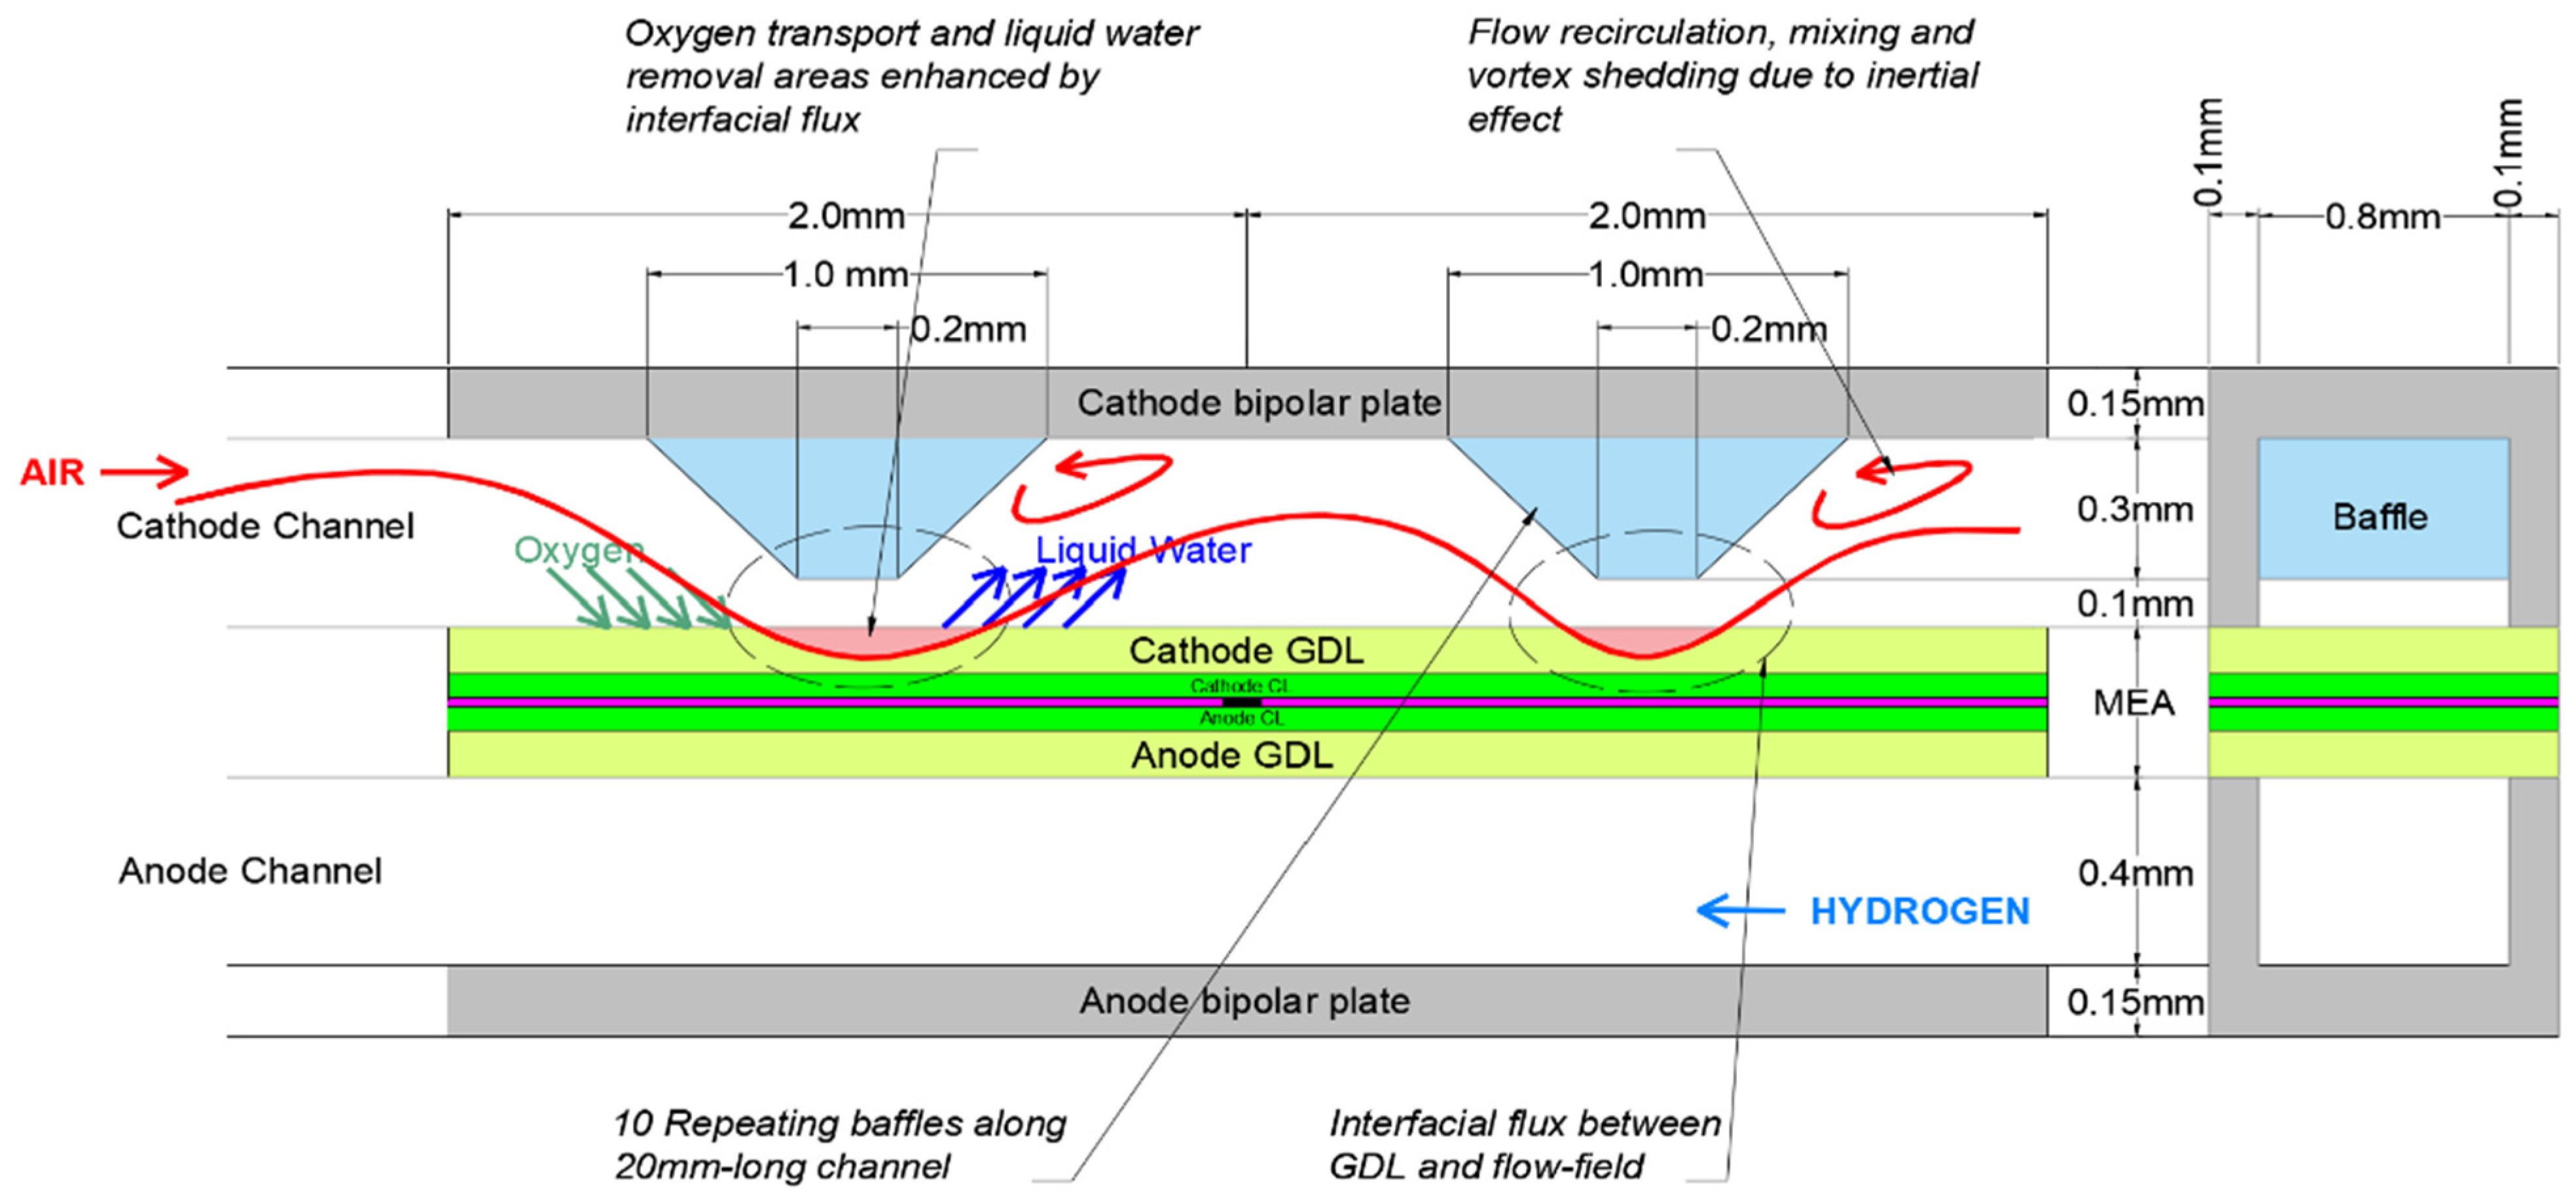
2.3.2. Boundary Conditions and Water Management

Uneven flow distribution reduces the durability and reliability of FCs by causing imbalances in chemical reactions [52]. The pressure drop, Δp, between the inlet and outlet also affects chemical reaction homogeneity. While a low pressure drop reduces parasitic losses, it can hinder water removal from the channels, potentially leading to flooding. A smaller pressure drop is linked to non-uniform behavior, decreasing performance. The pressure drop can be expressed as follows:
Δ p = f   L . ρ . V 2 2 . D H
where f is the friction factor, L is the channel length, ρ is fluid density, V is the flow velocity, and D H is hydraulic diameter. Power density loss due to total cathode pressure loss is expressed as follows:
W p   =   Δ p . A c h a . V c A c e l l
where A c h a is the area of the channel divided by its perimeter, and V c is the flow velocity at the cathode inlet and divided by the area of the cell A c e l l . As can be seen from Equation (10), the pressure loss directly affects the power density loss. Therefore, balancing the water produced by the electrochemical reaction and the water required to keep the membrane hydrated to ensure high proton conductivity is key for PEMFC operation [53].
In addition to Equation (1), which represents the Forchheimer effect for the turbulent drag contribution, the boundary conditions used are as follows: the velocity in the open channel (u) is equal to zero (u) = 0. At the inlet, (u) has a specified value, and velocity is also present in porous media (GDL) as well, indicating that the fluid is running through it under no slip conditions. The velocity (u) = 0 is applied for boundary walls (static relatively). The pressure level at the outlet is used as a reference value.

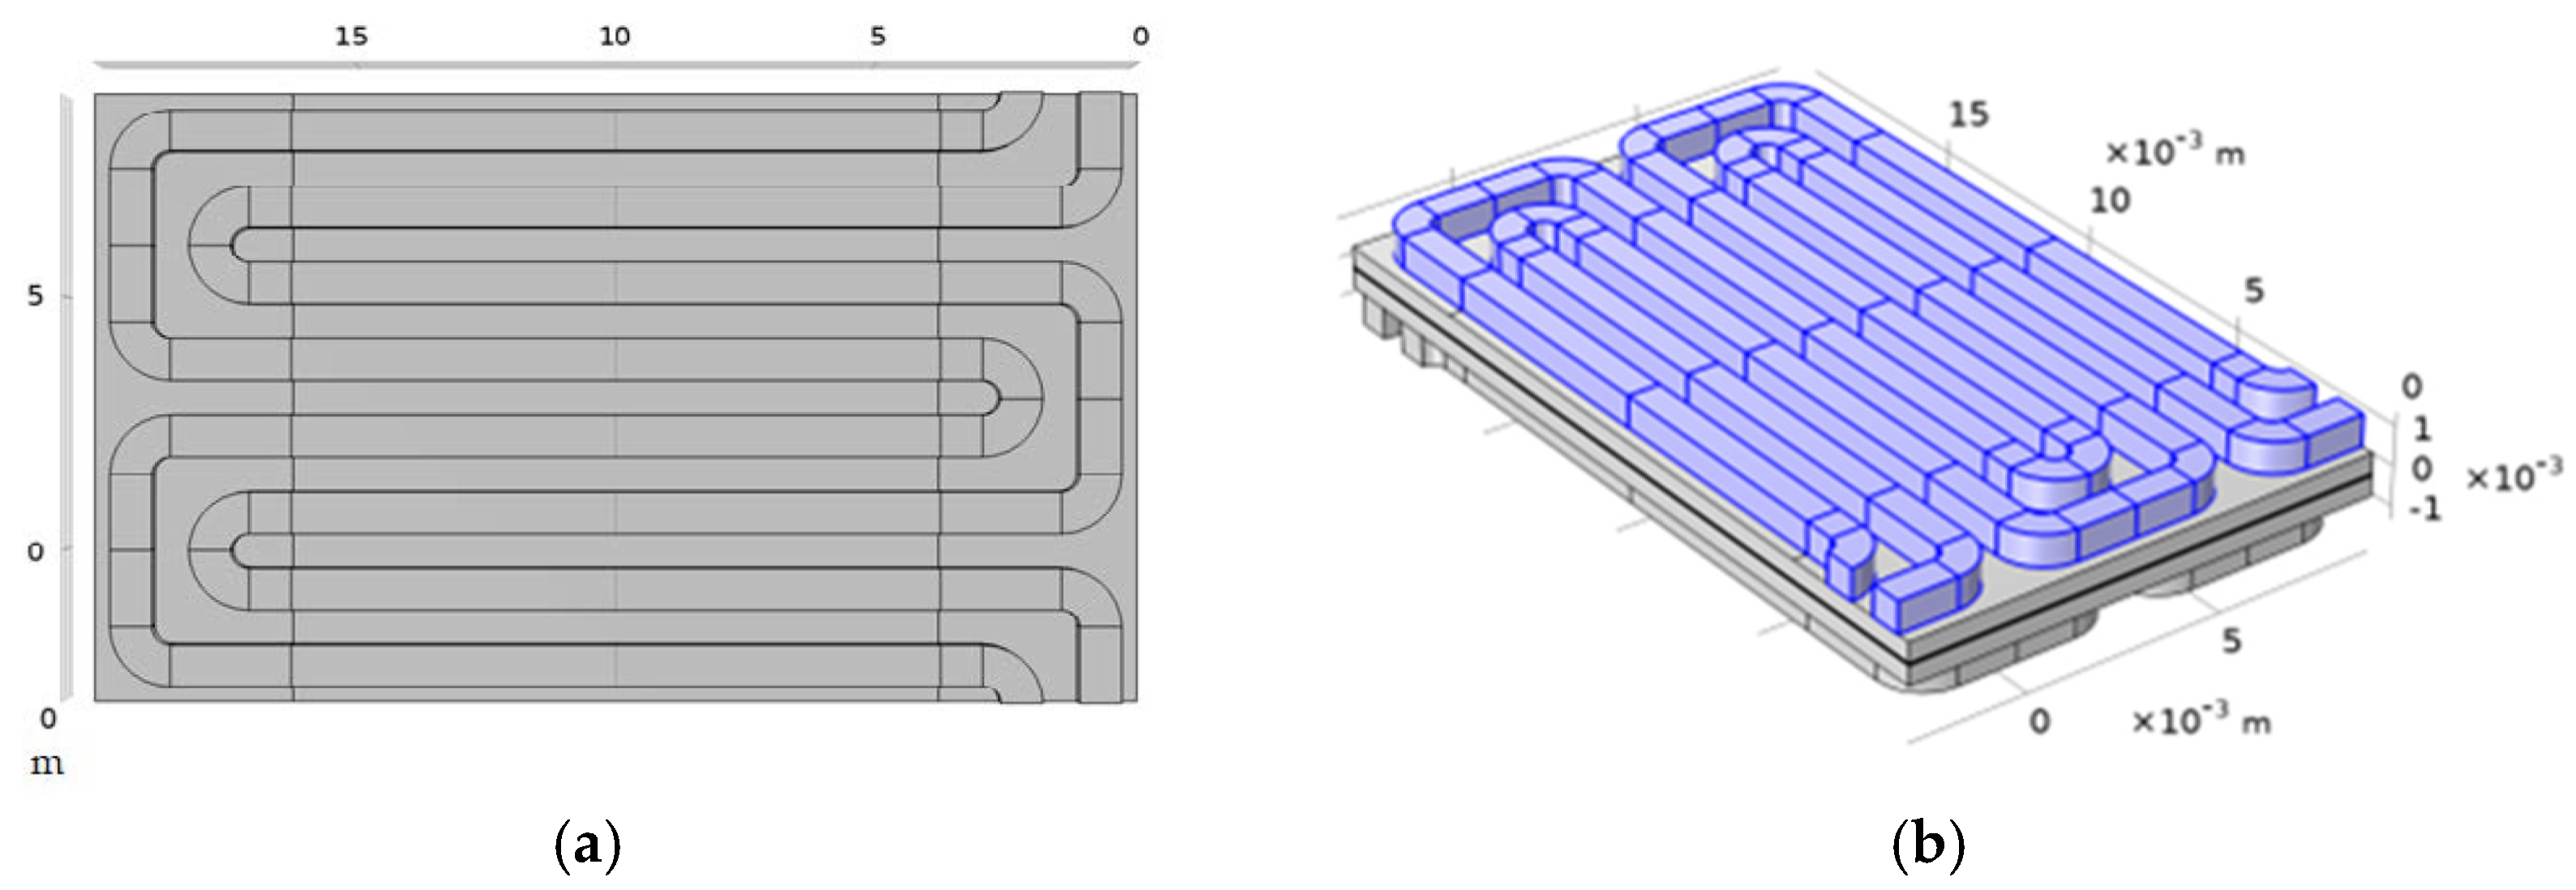
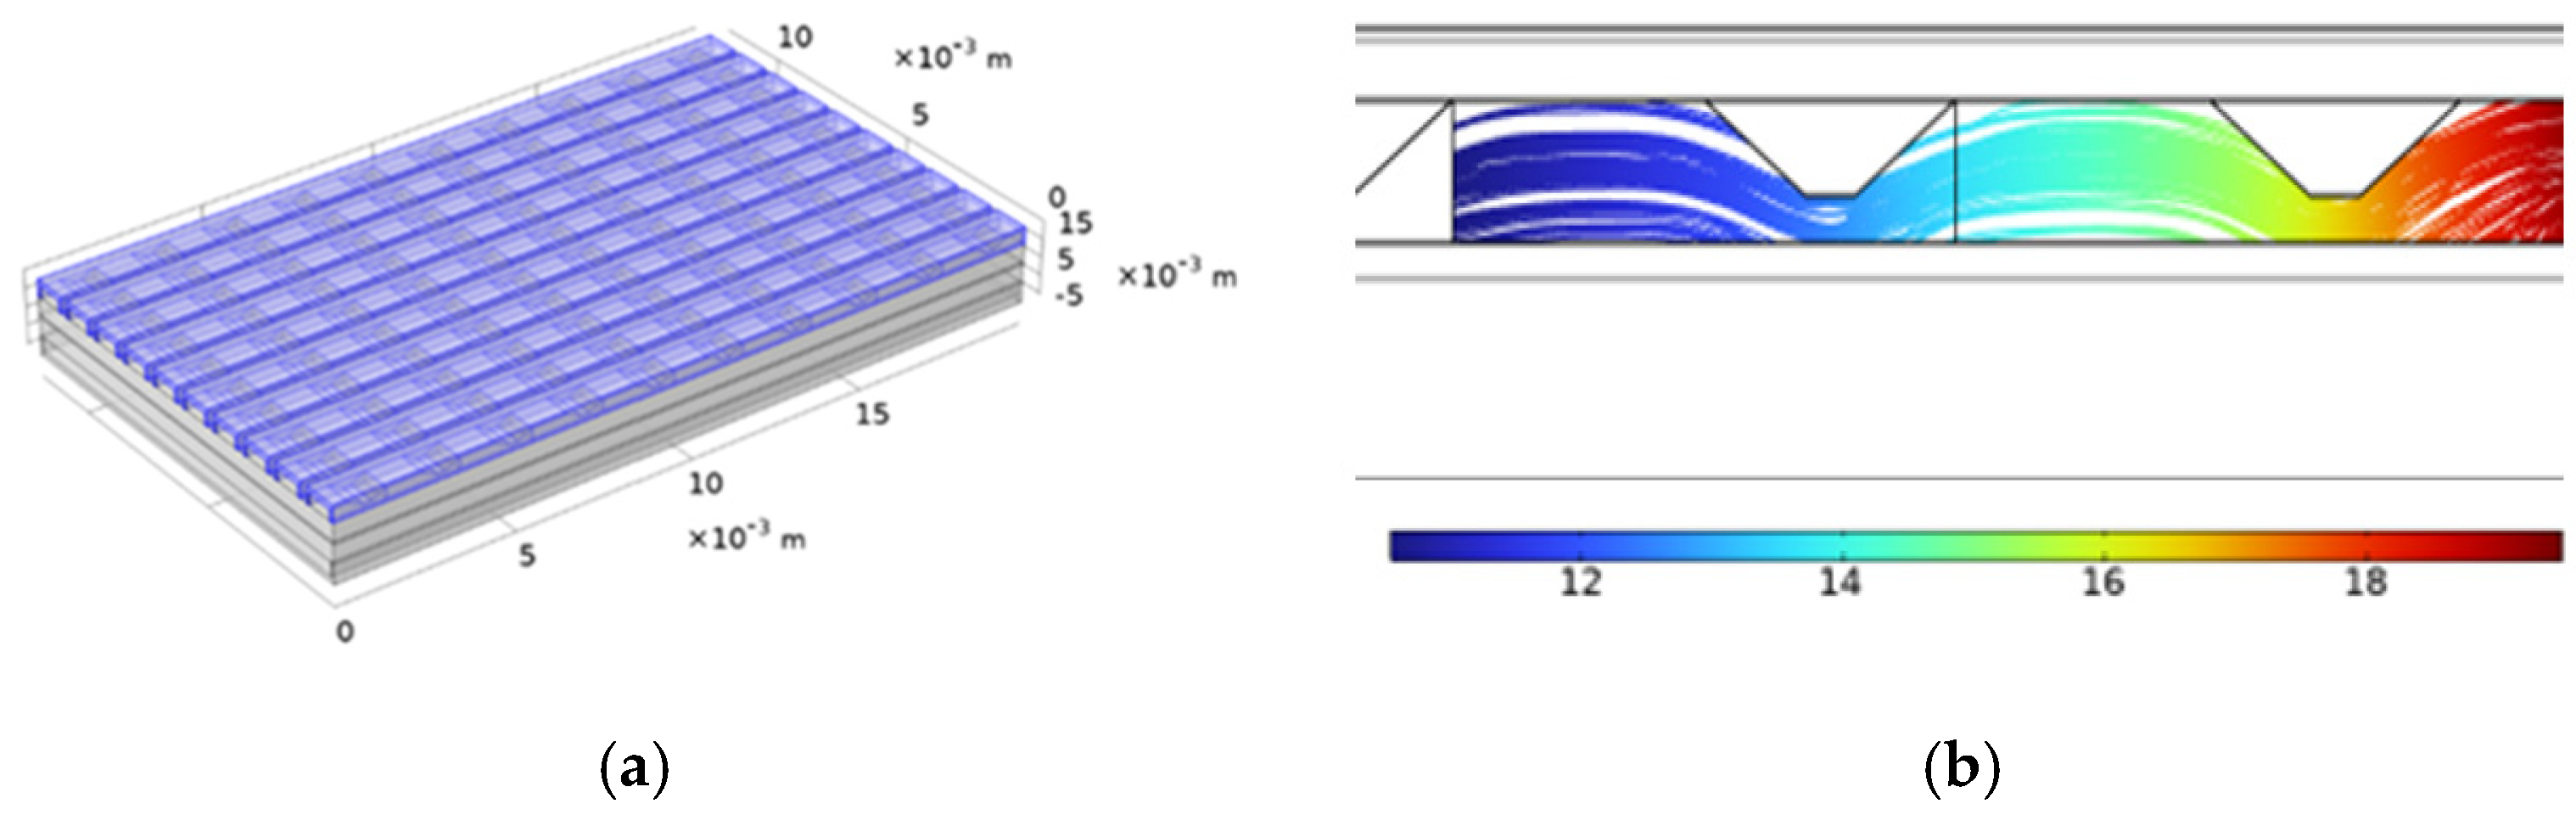
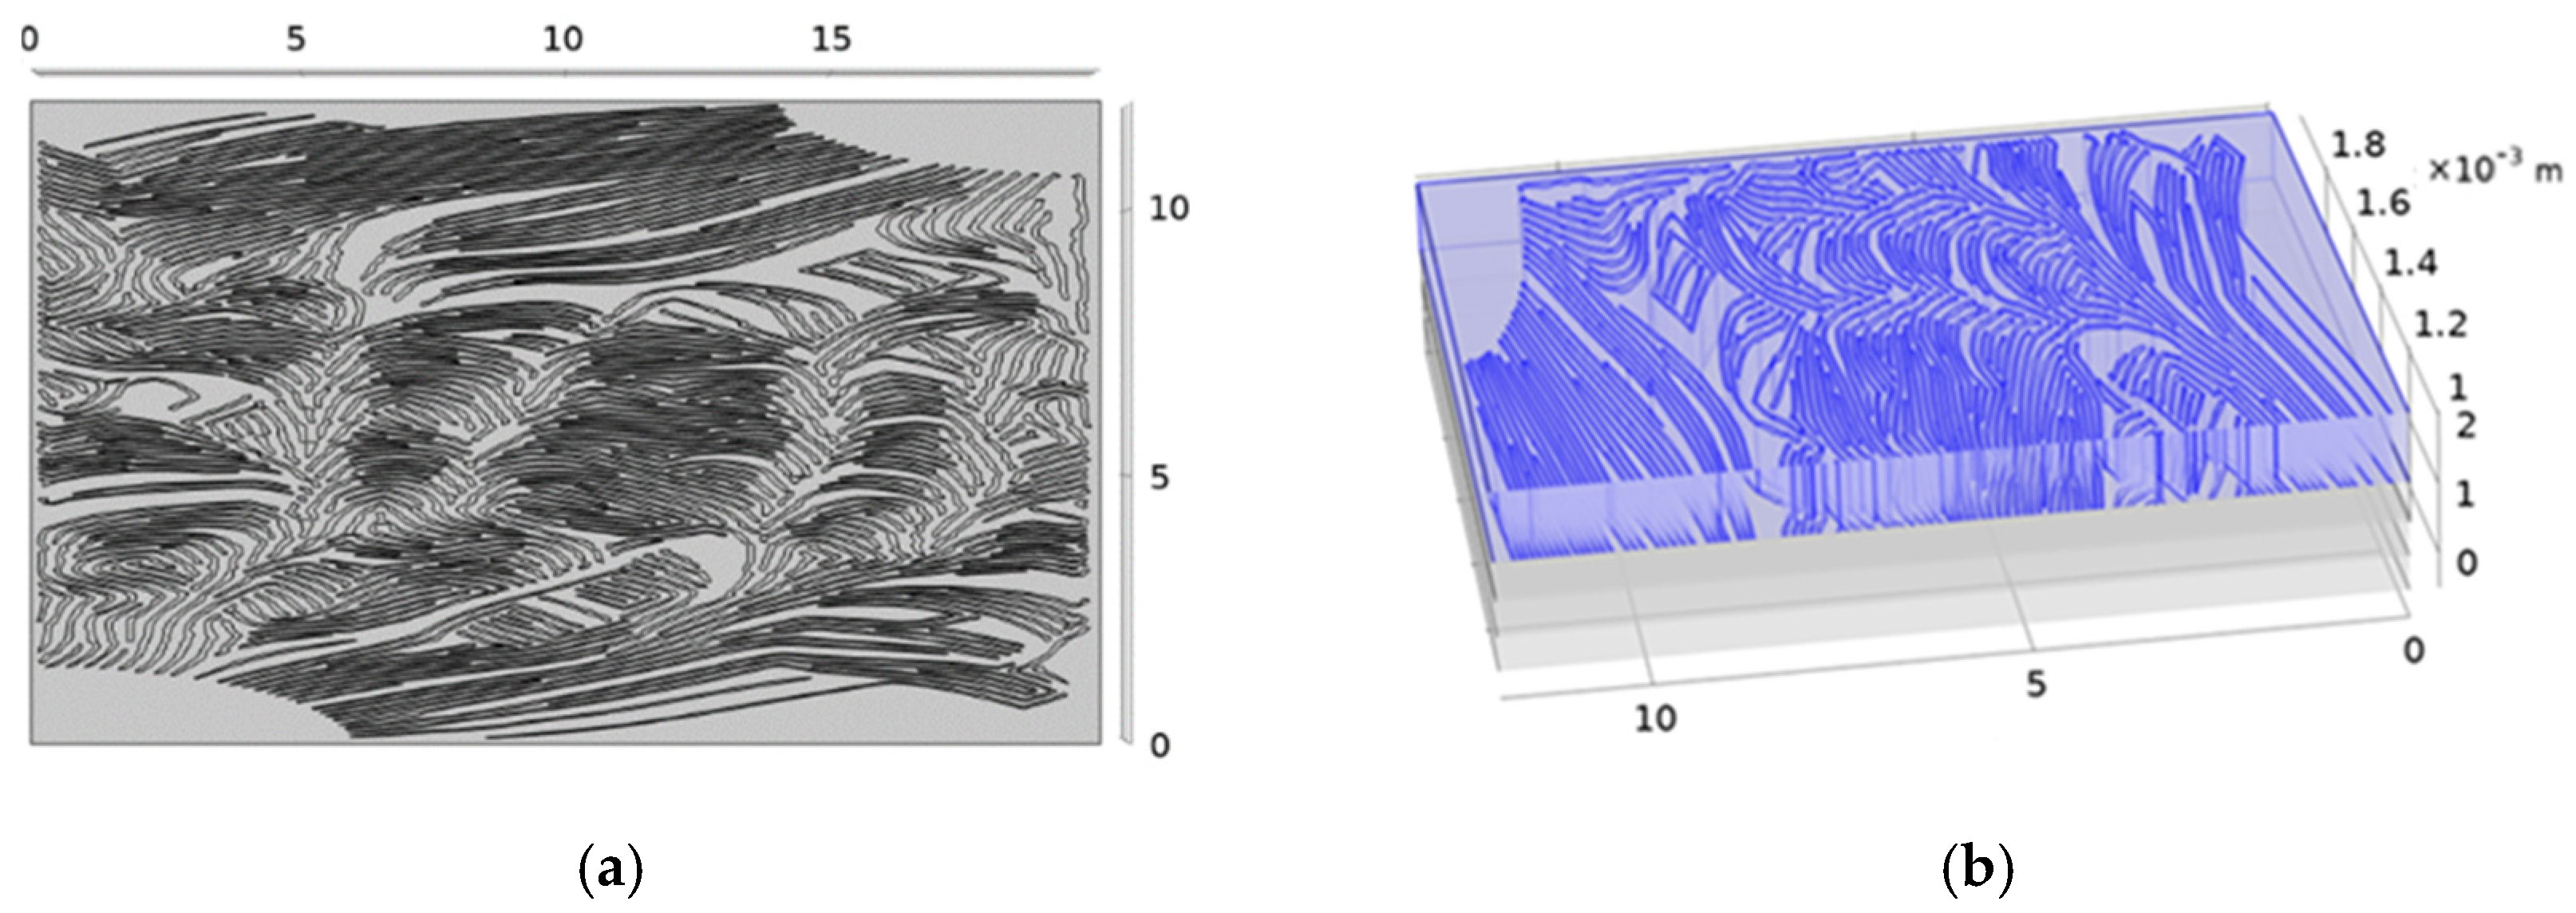
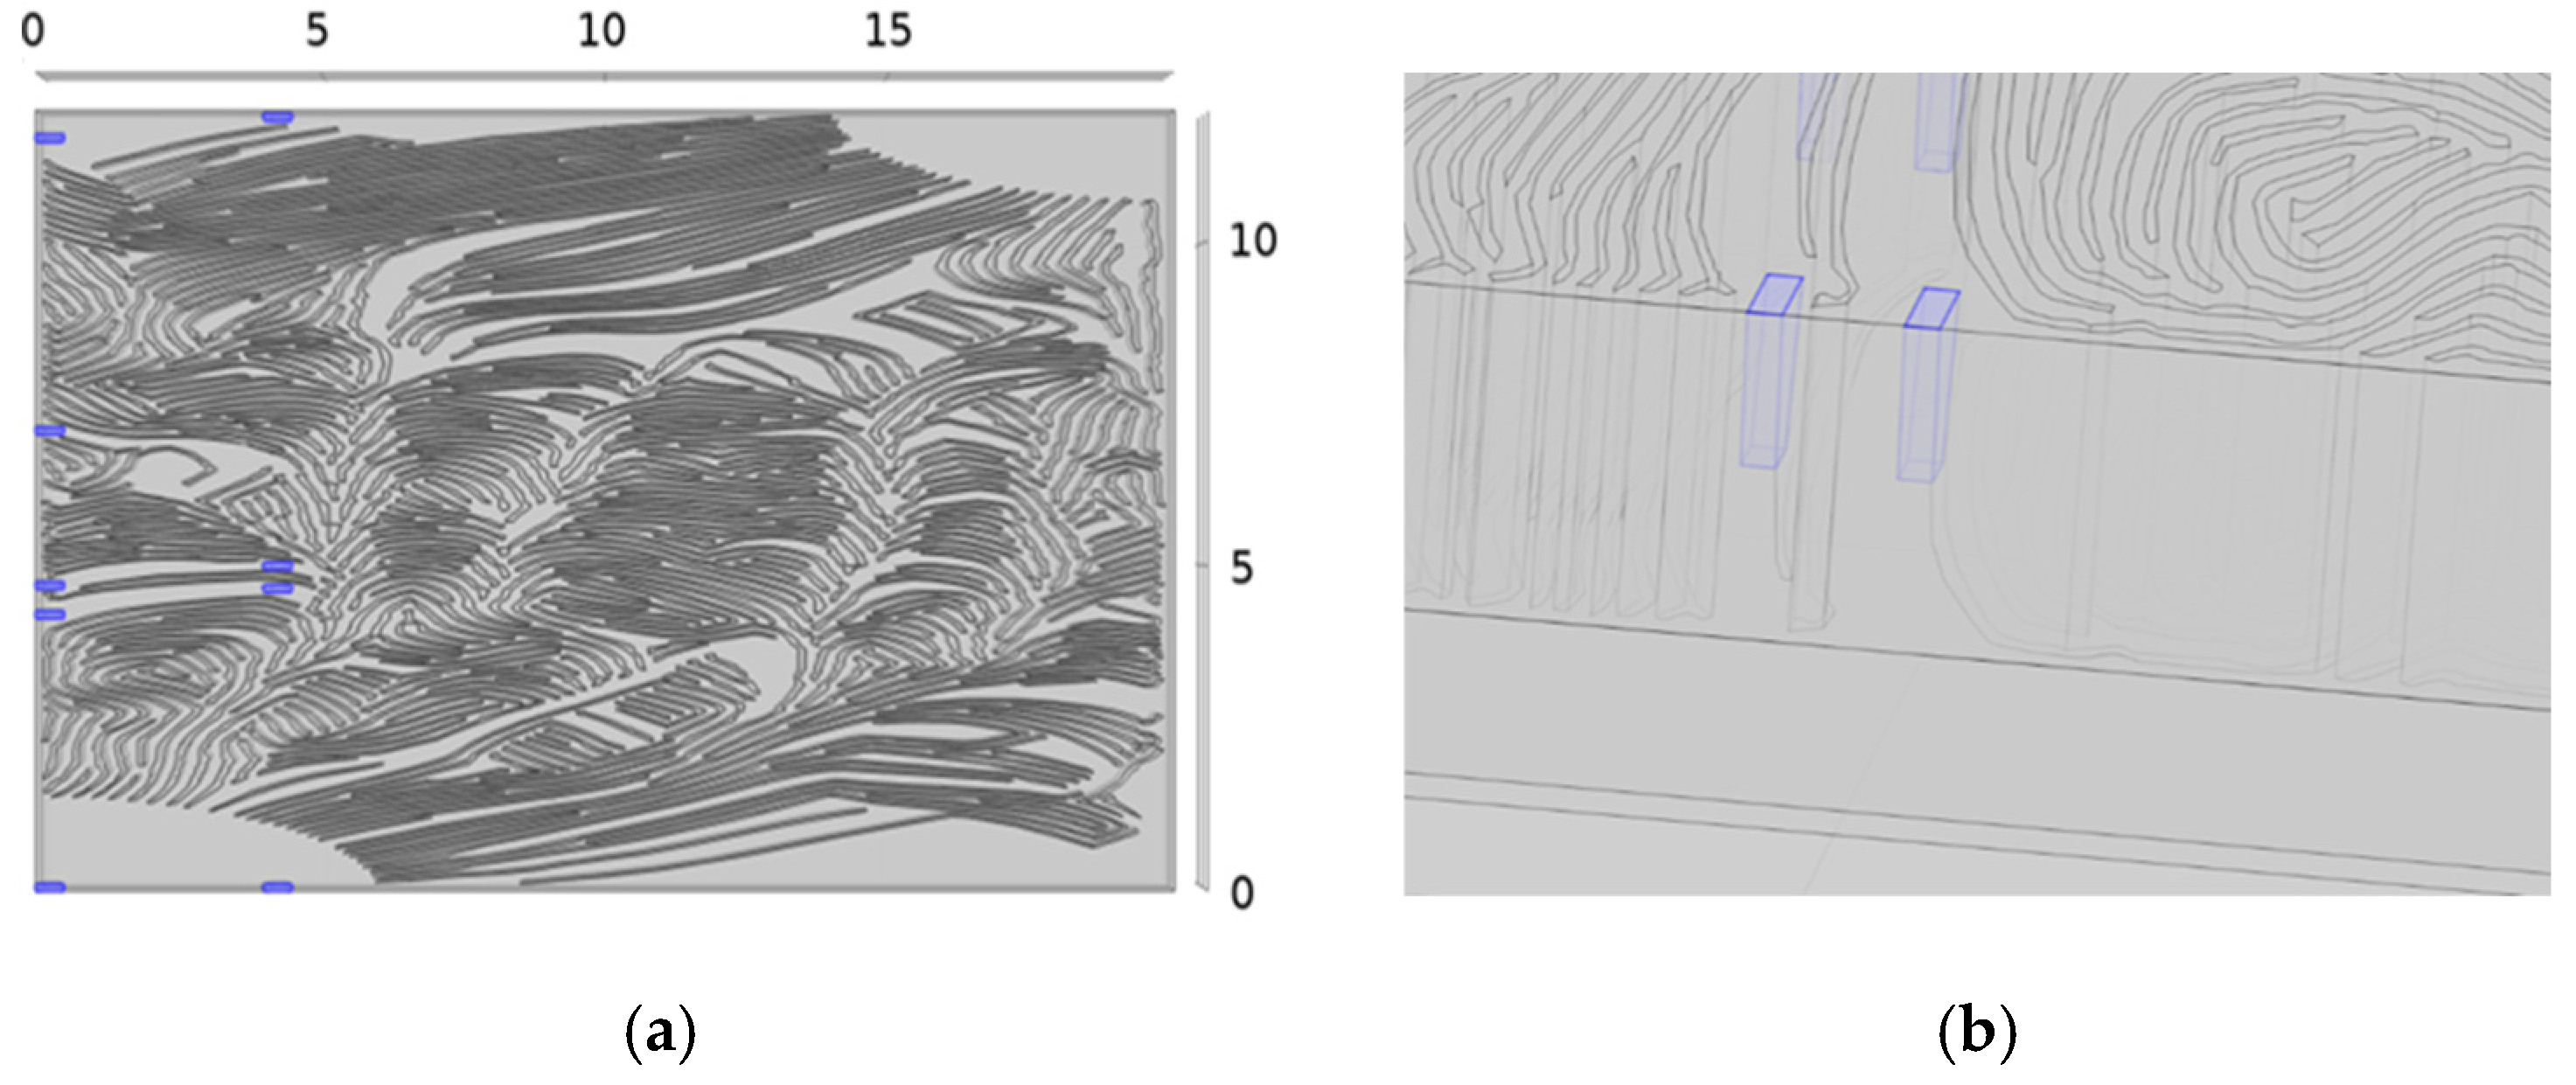
2.4. Flow Channel Configuration

The serpentine flow field (multiple) with two parallel channels running next to each other was modeled, as show in Figure 3. The channel width and height are 0.8 mm, and the distance between channels is 0.0015 mm. The serpentine design has the longest channel in length, which leads to lower pressure drops, thus accounting for less fluid resistance. A lower pressure drop means that less energy is required to maintain the same flow rate, reducing the pumping costs and overall system efficiency [52]. However, one drawback is the lower reactant distribution over the channel due to the uneven flow concentration toward the outlet compared with the inlet reactant concentration [54]. The straight parallel flow field design is another conventional design that has been used in PEMFCs. In contrast to the serpentine design, the parallel flow field has the smallest pressure drop and resistance [55].
Bernoulli’s theorem states that the conservation of total energy results in a reduction in pressure. In the case of straight parallel flow fields, this pressure drop at the outlet makes it more difficult for liquid water to be effectively removed from the flow channels. Installing baffles within the channel not only leads to a pressure drop [56] but improves water management and thus FC efficiency. Ten baffles were added along the length of the parallel design channel in Figure 4, with 2.0 mm distance between the baffles. This is the same channel length and width as the serpentine design. The baffle is an upside-down isosceles trapezoid with non-parallel sides of equal length and a 45° angle between the sides and base.
Third model is a non-conventional flow field based on a Turing design (Figure 5). This design was developed based on biological patterns and optimized orientation fields [57] along the active cell area, with the aim of addressing the challenges posed by other designs by promoting uniformity in the reaction across a broader area, thereby enhancing the overall electrochemical activity. This approach also aims to balance the pressure drop from the inlet to the outlet, ensuring adequate flow velocity while minimizing resistance within the flow channels.
While the Turing design is advantageous in terms of flow distribution and efficiency, it still presents challenges related to water management. To address this, an innovative approach has been developed by integrating a baffle configuration, known for its effective water management, with the Turing design’s superior flow distribution, as shown in Figure 5.
This hybrid configuration, referred to as the mixed design flow field, is illustrated in Figure 6.
The blue highlighted trapezoids can be seen from a closer view, equally spaced along the active area where a high concentration of reactant is observed in the Turing design in order to provide better water management in that area and improve efficiency.

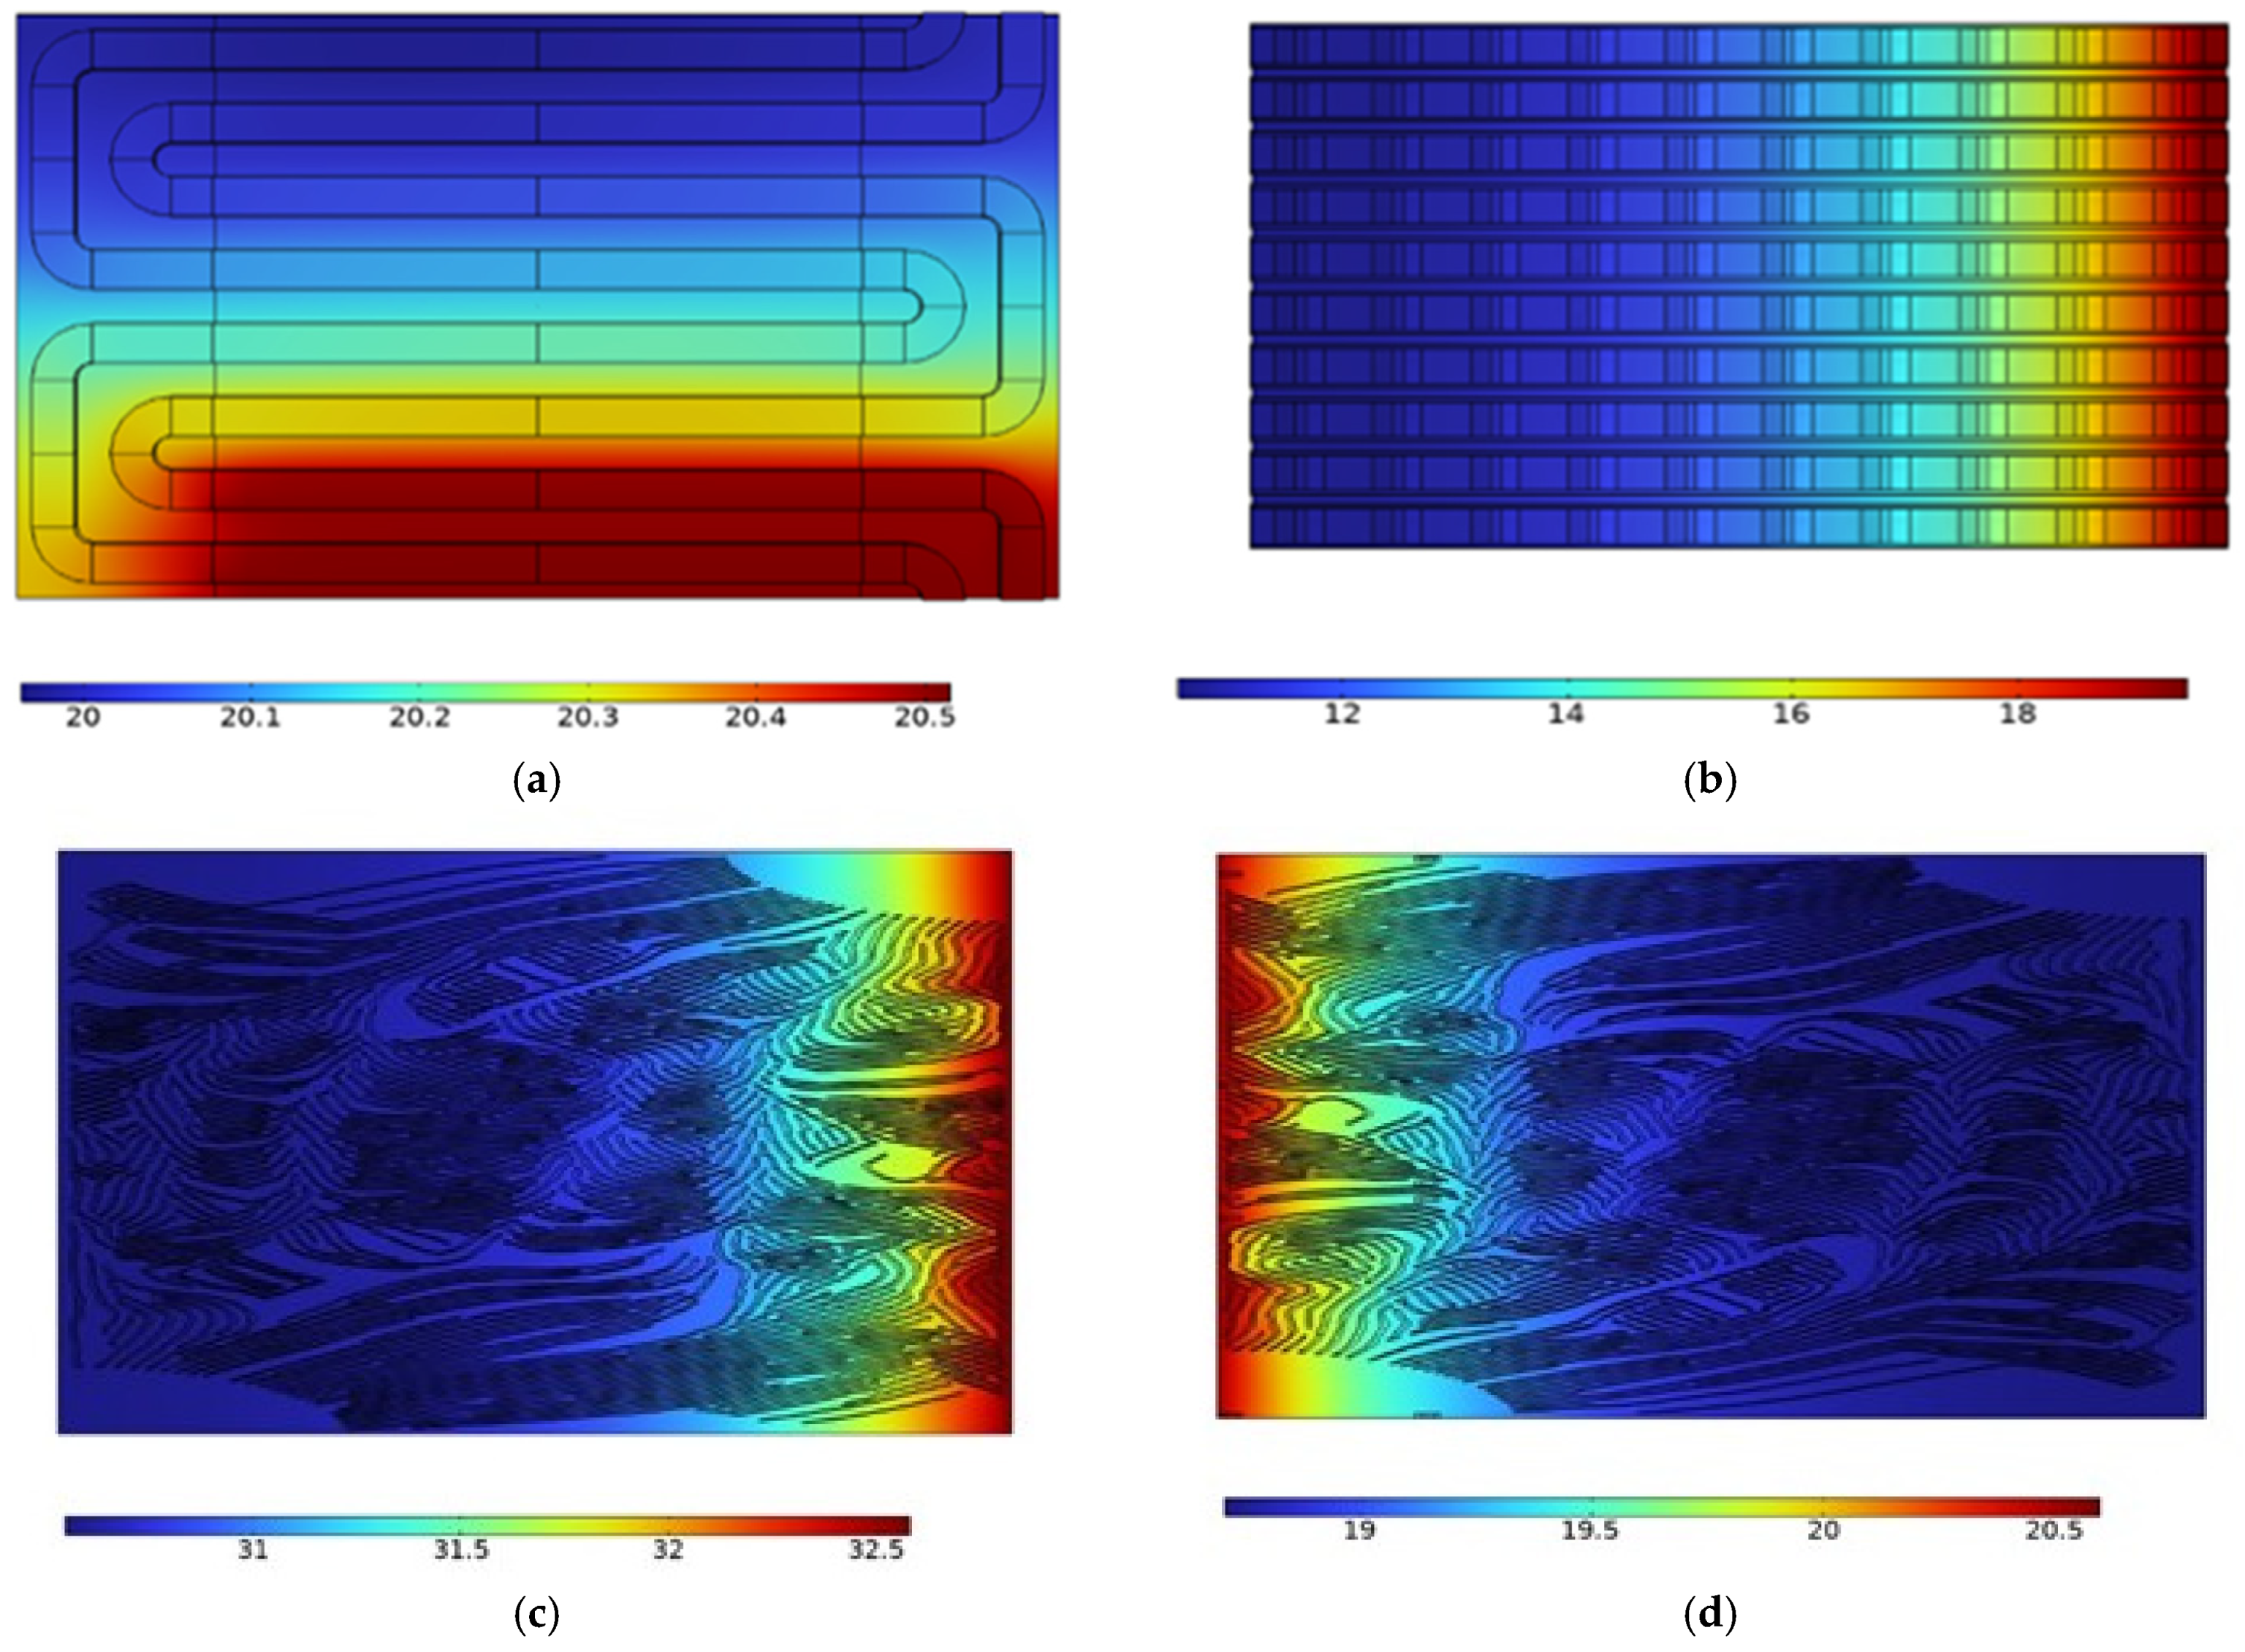
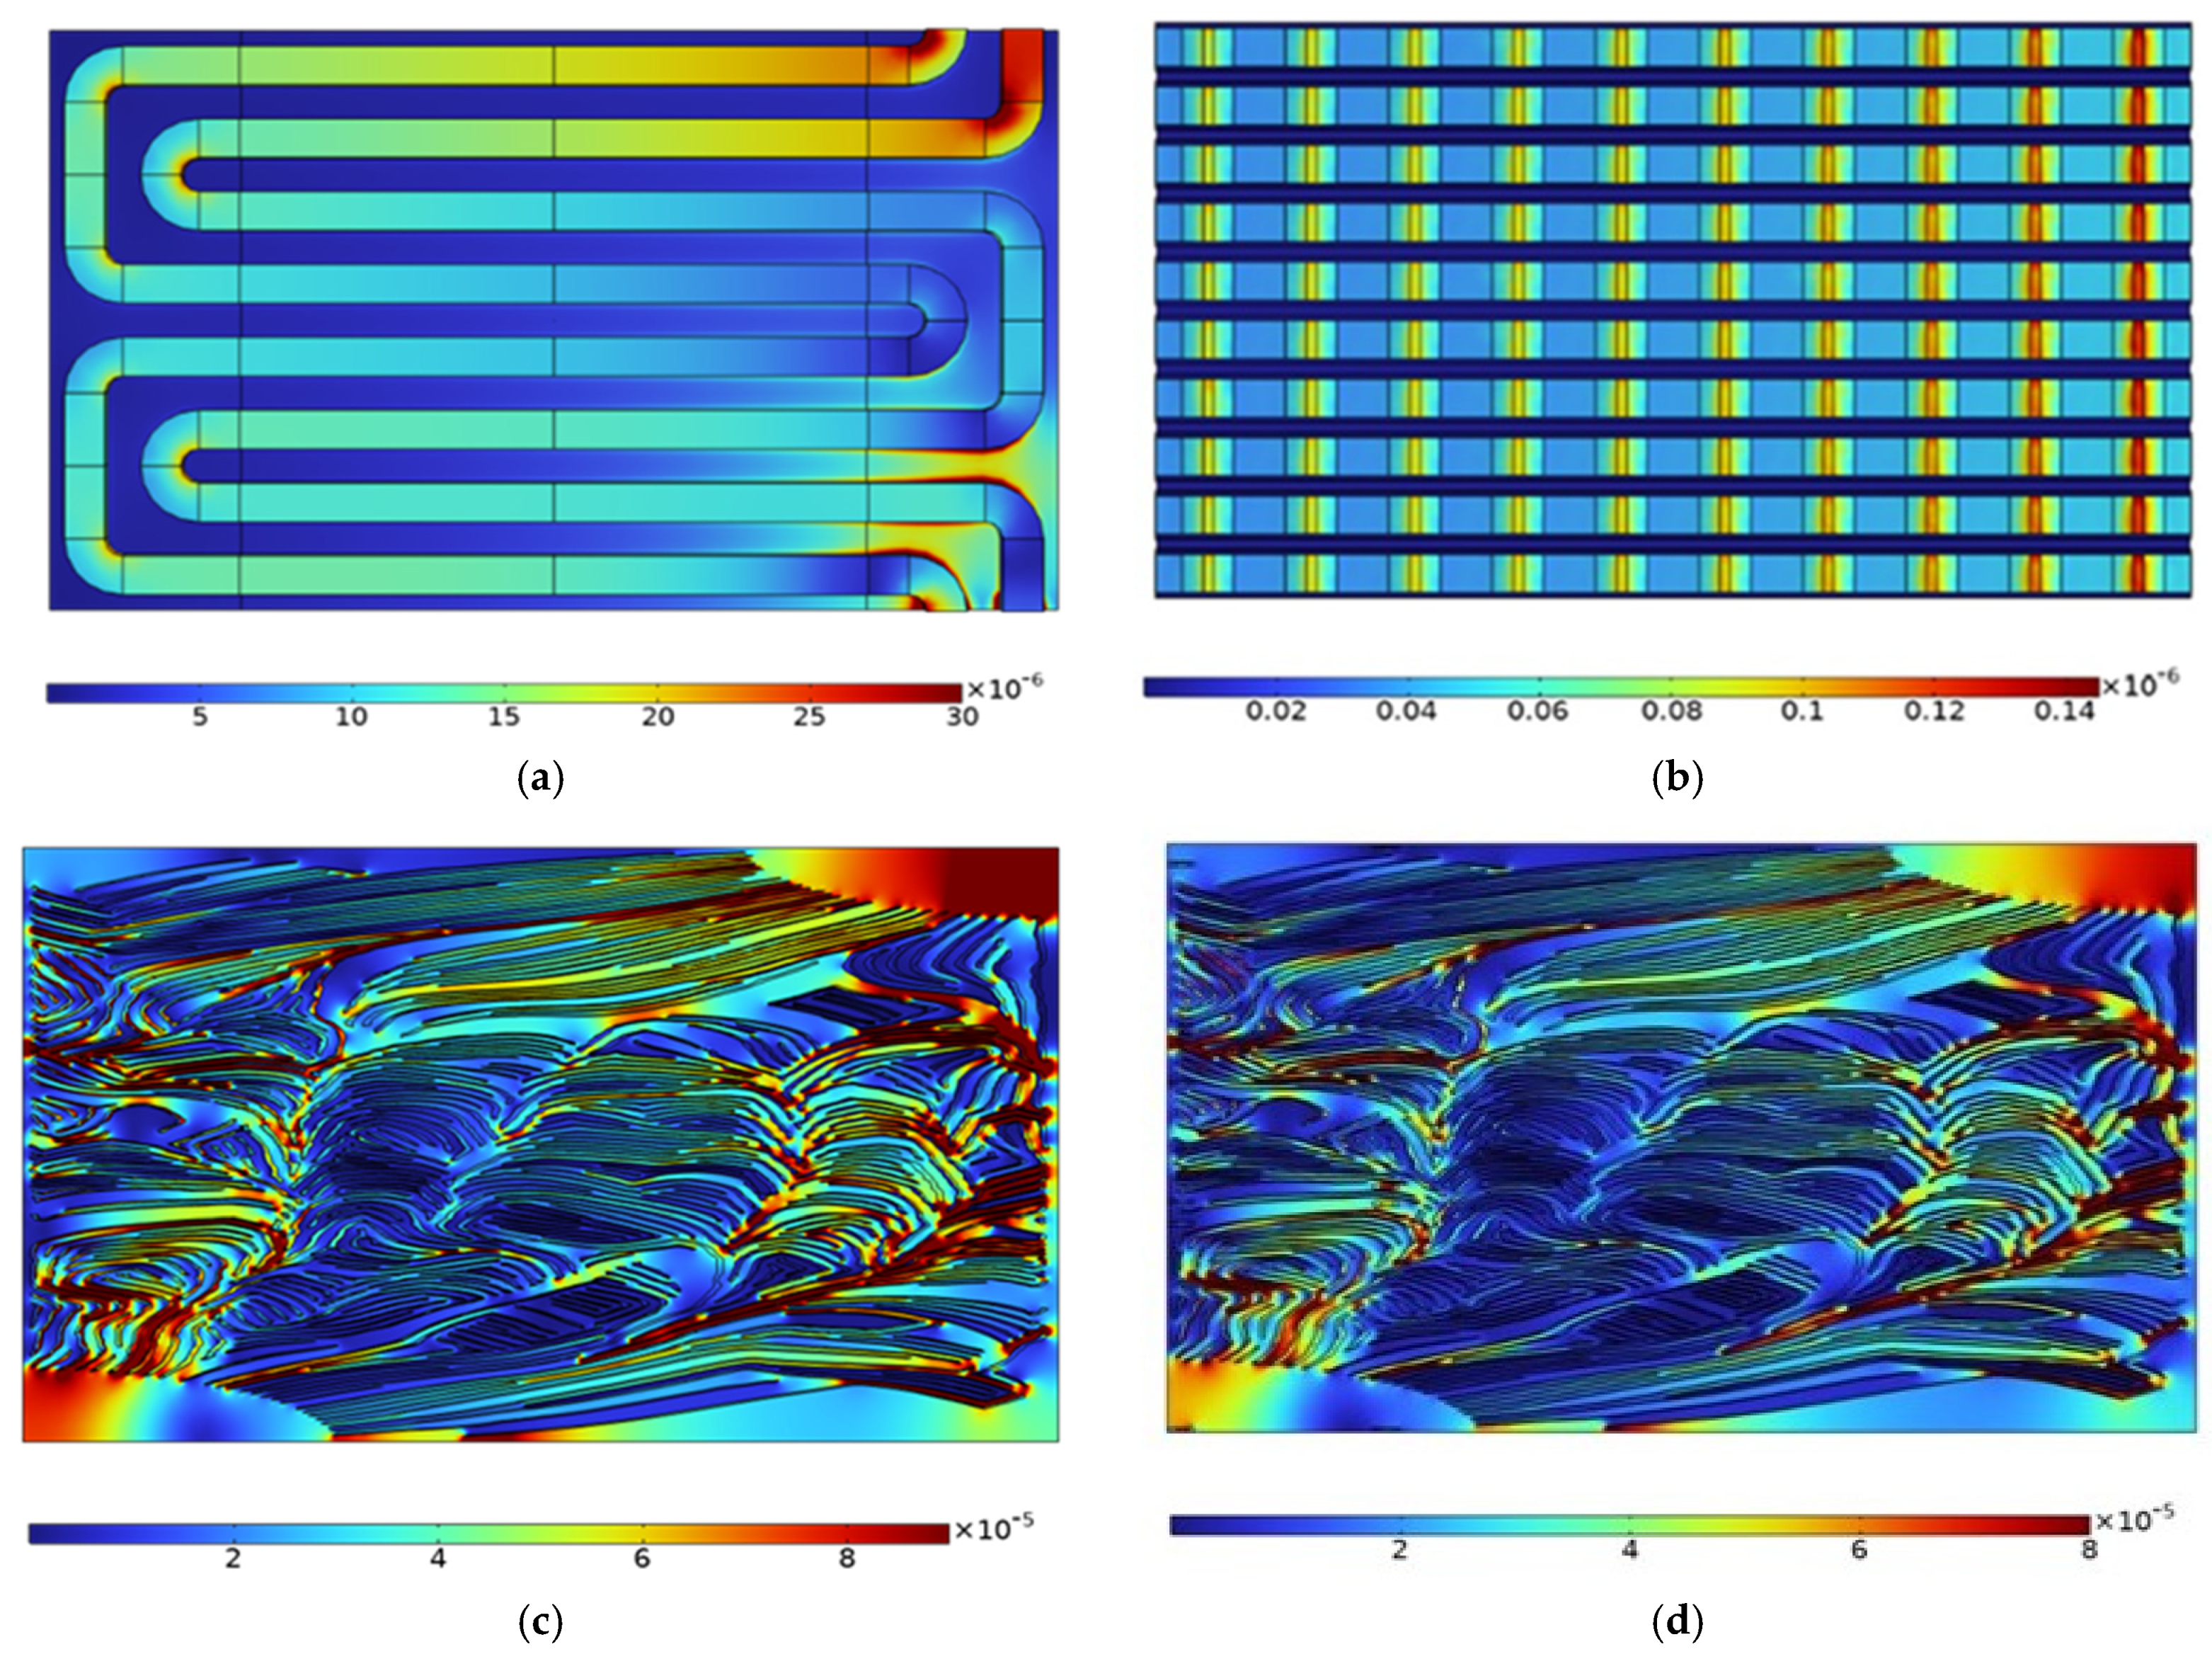
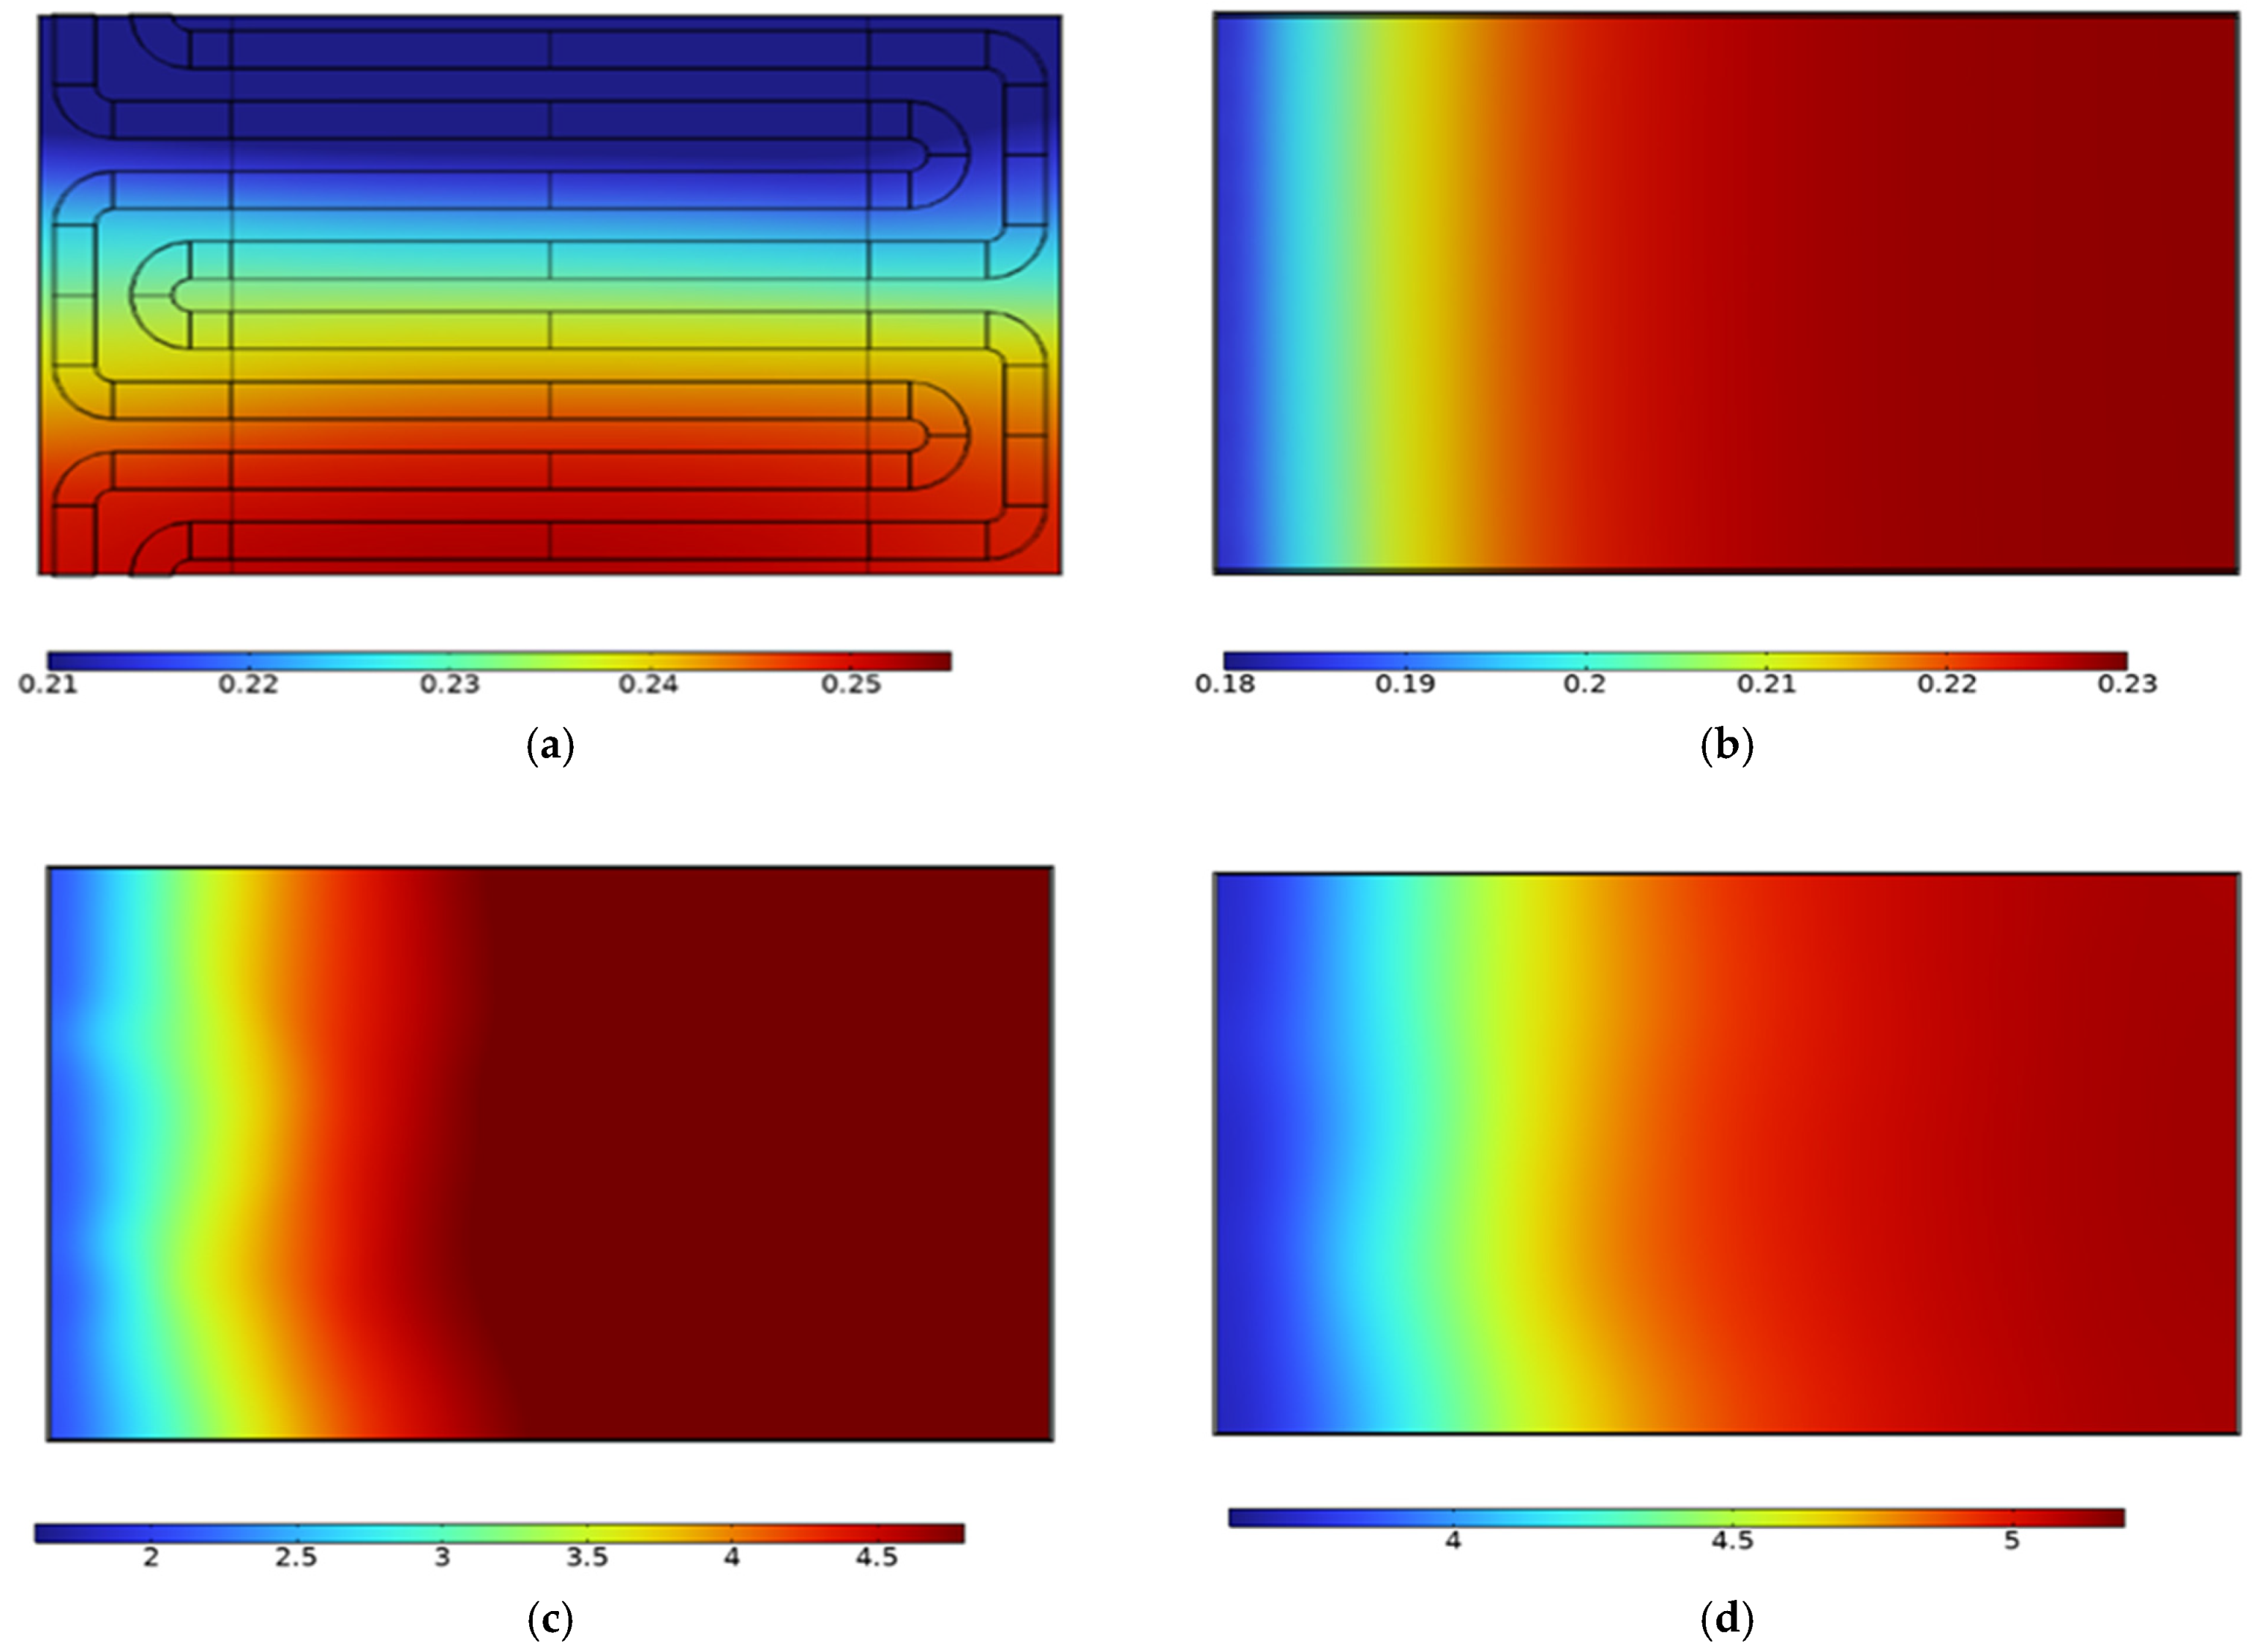
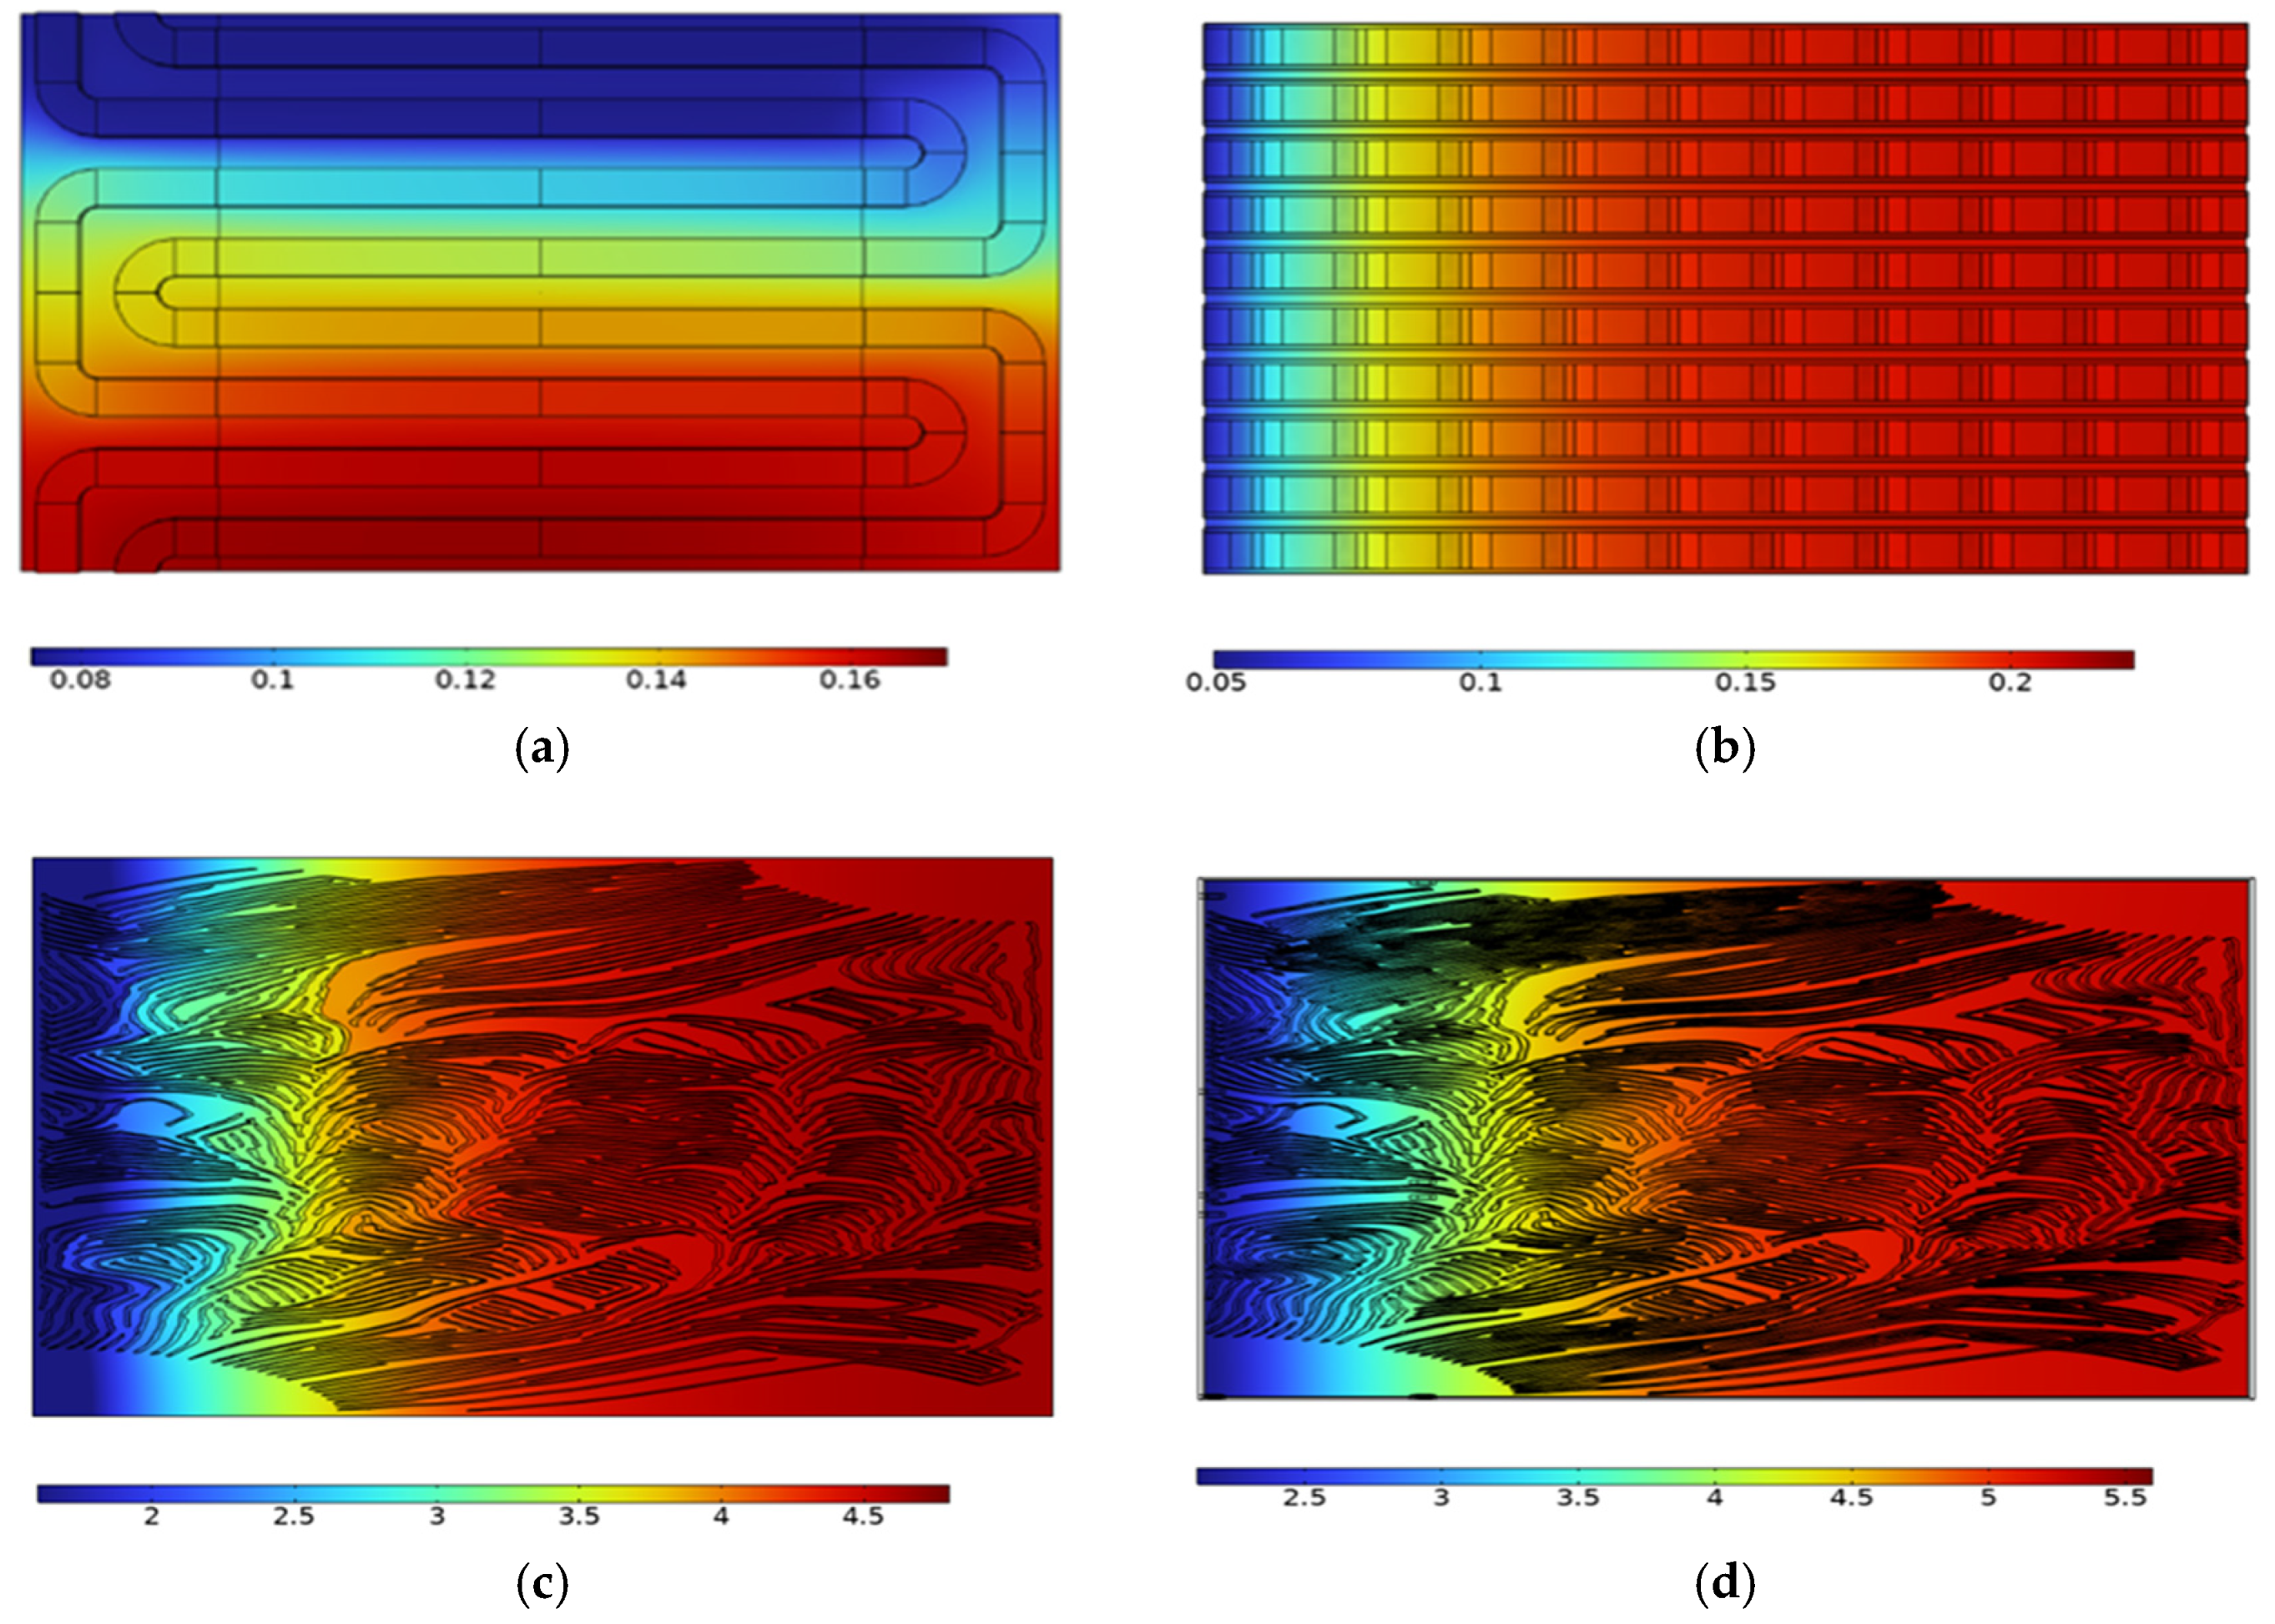
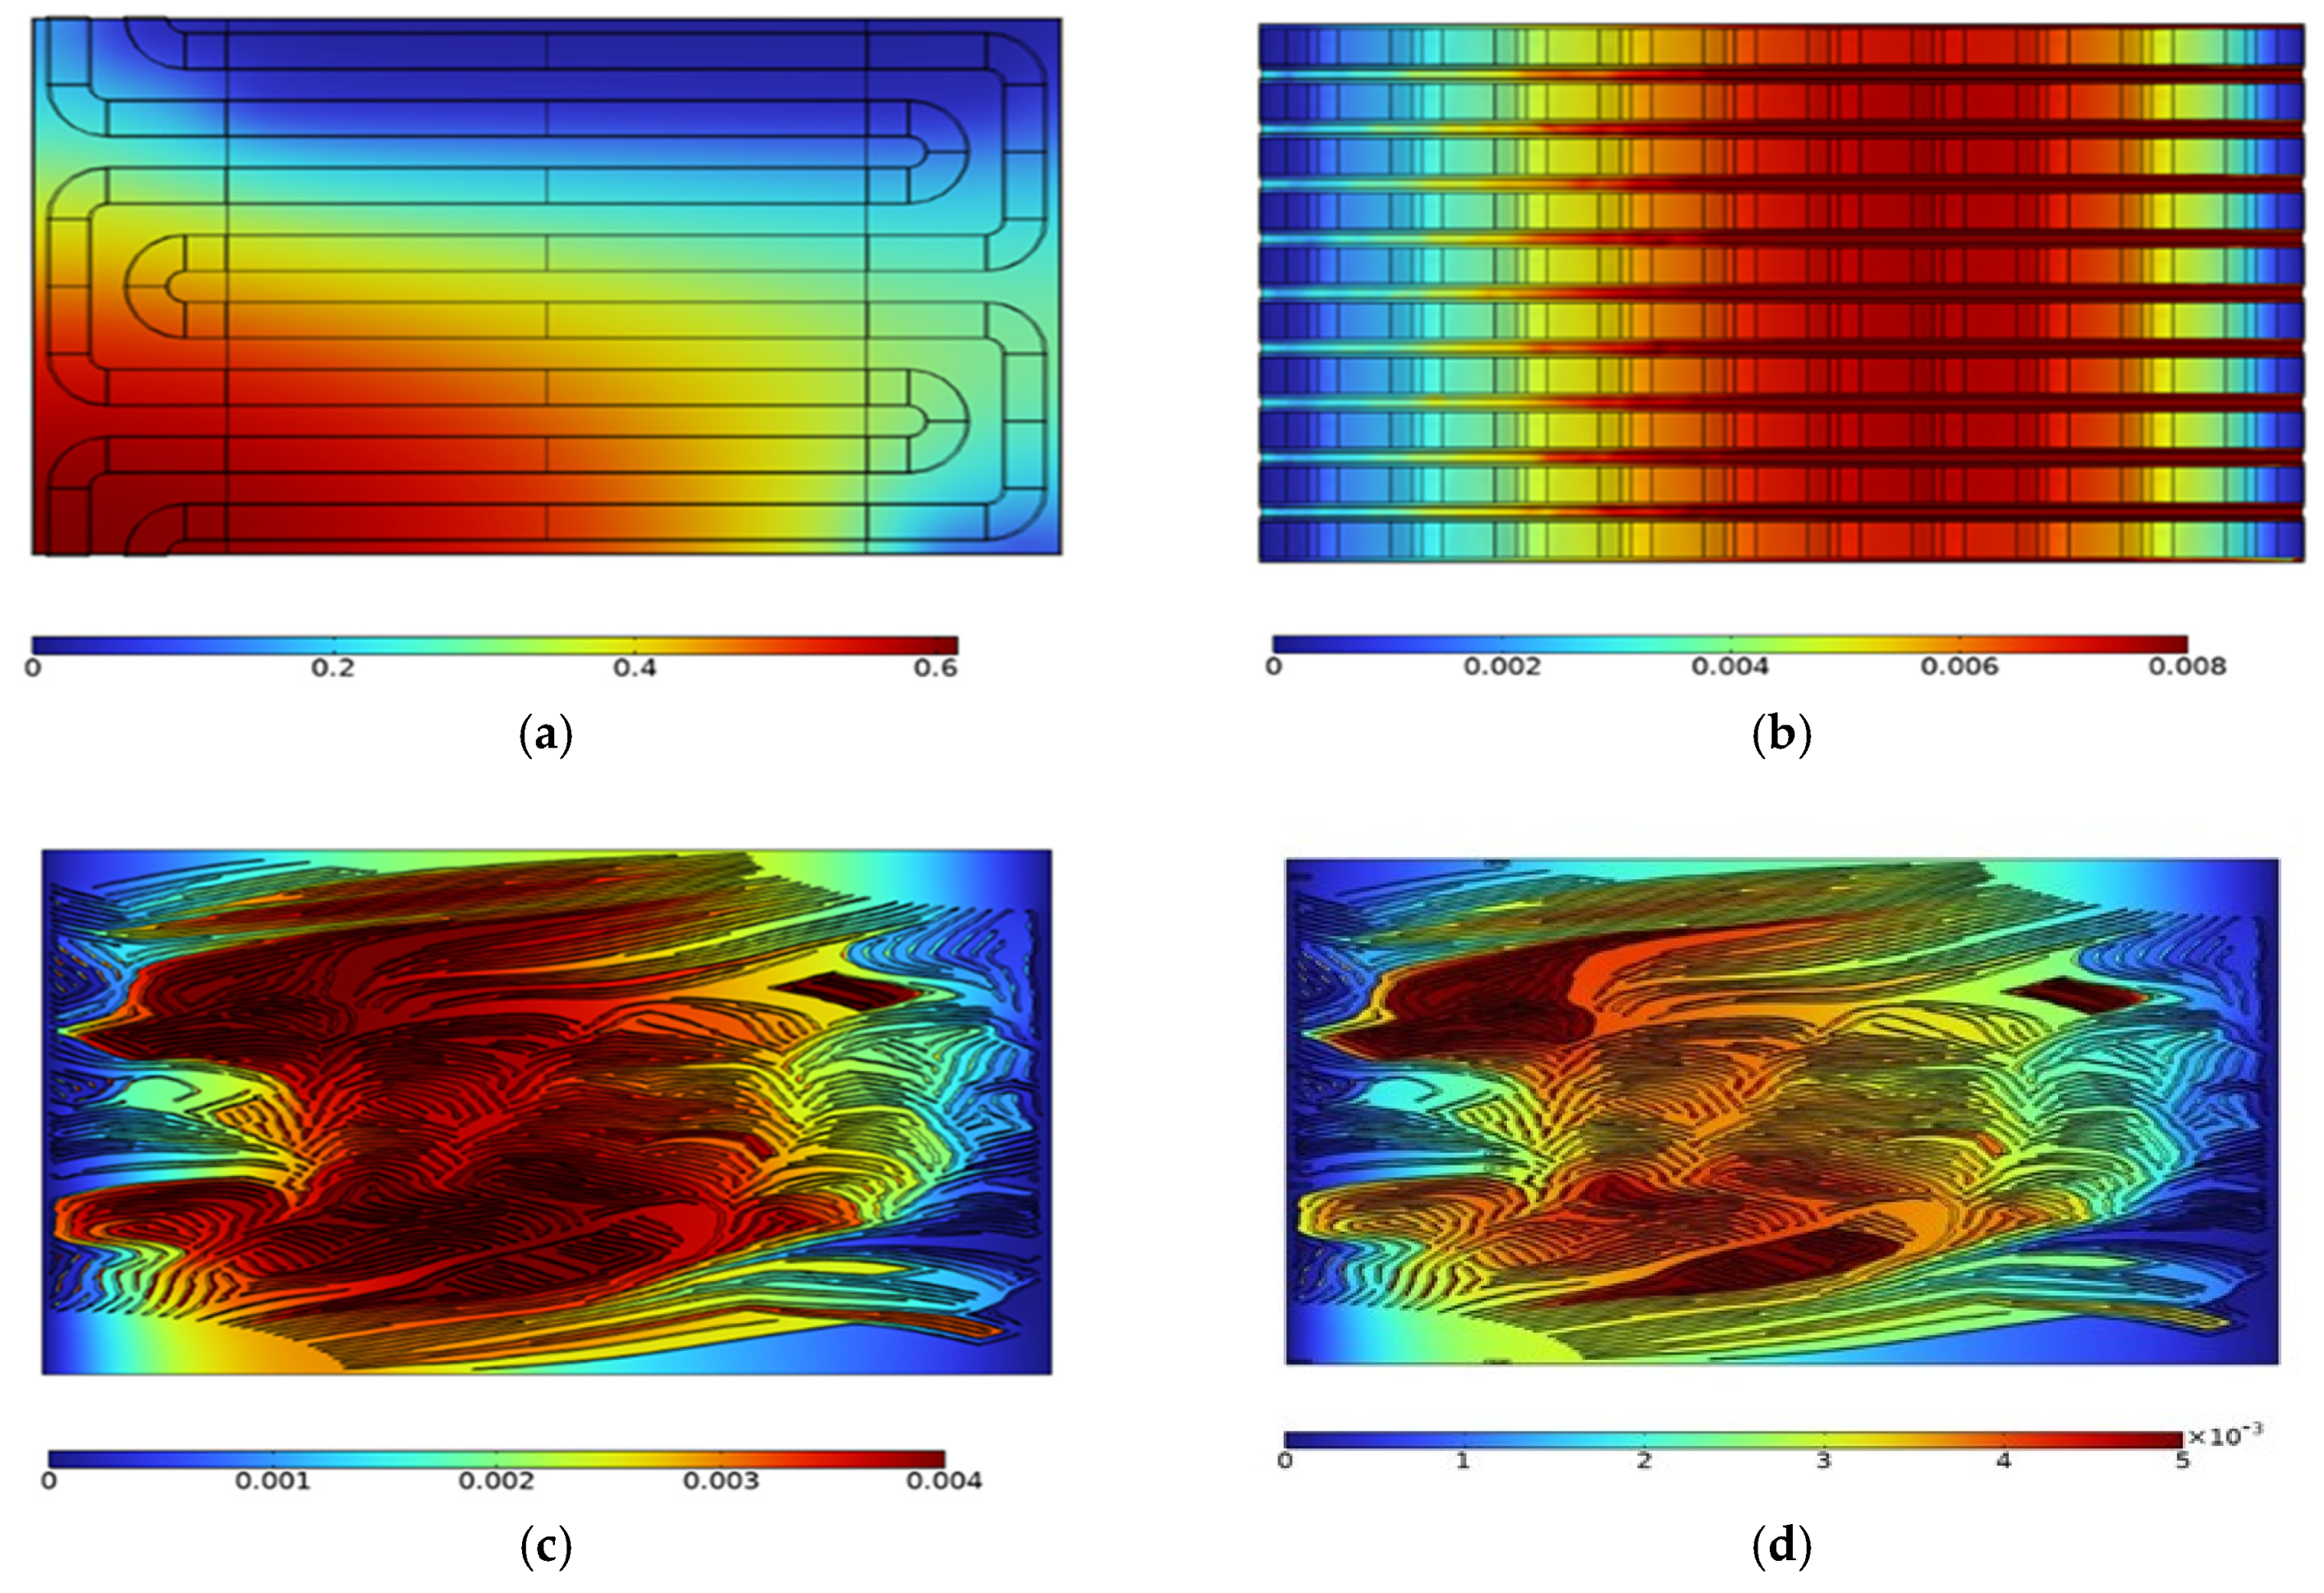
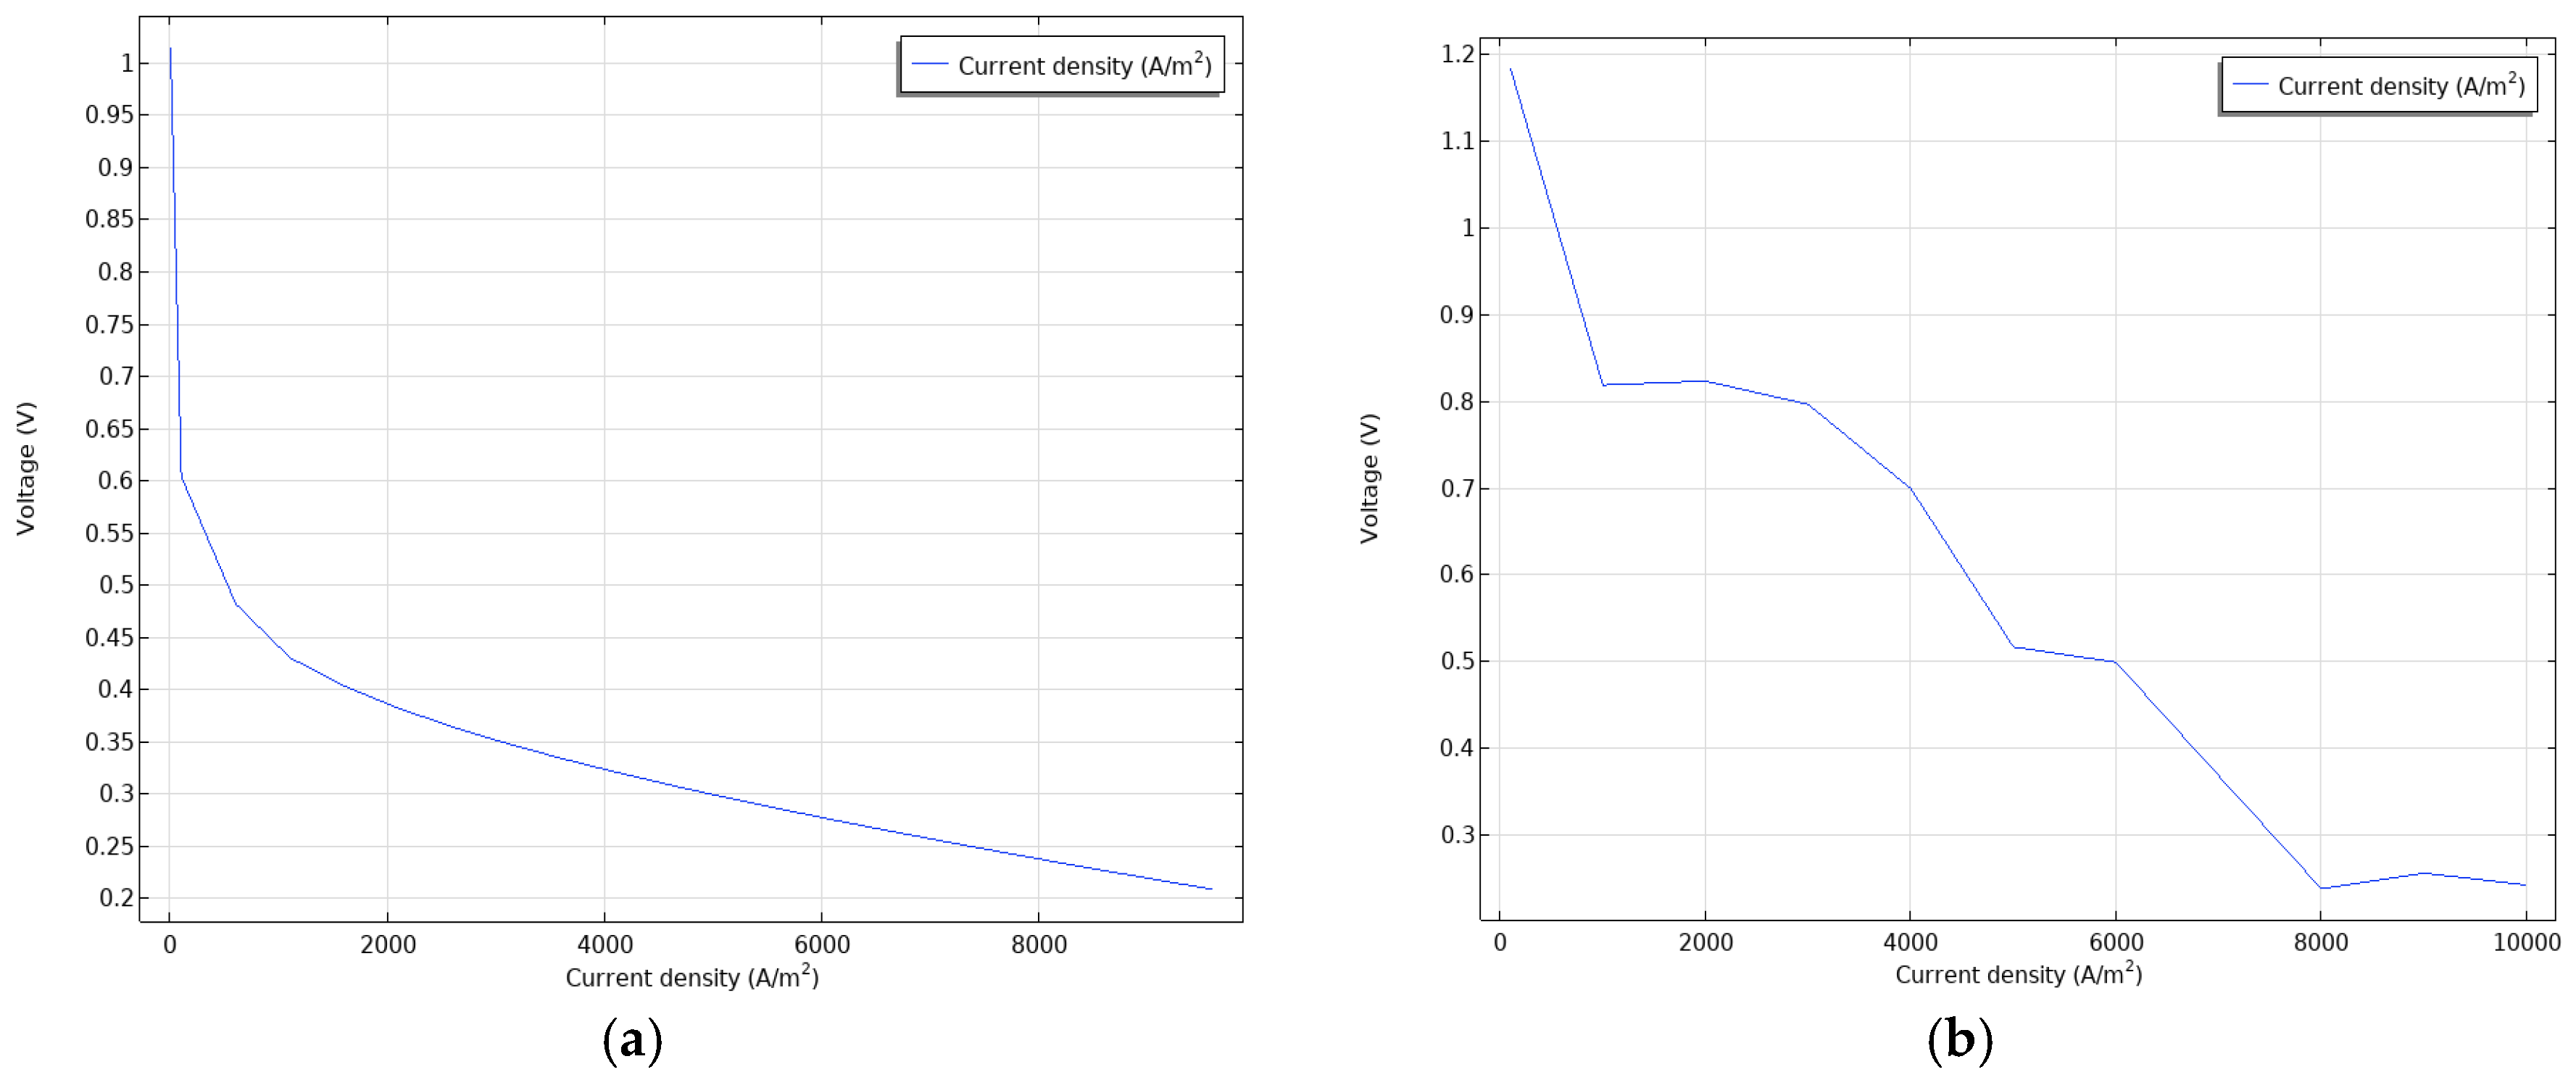
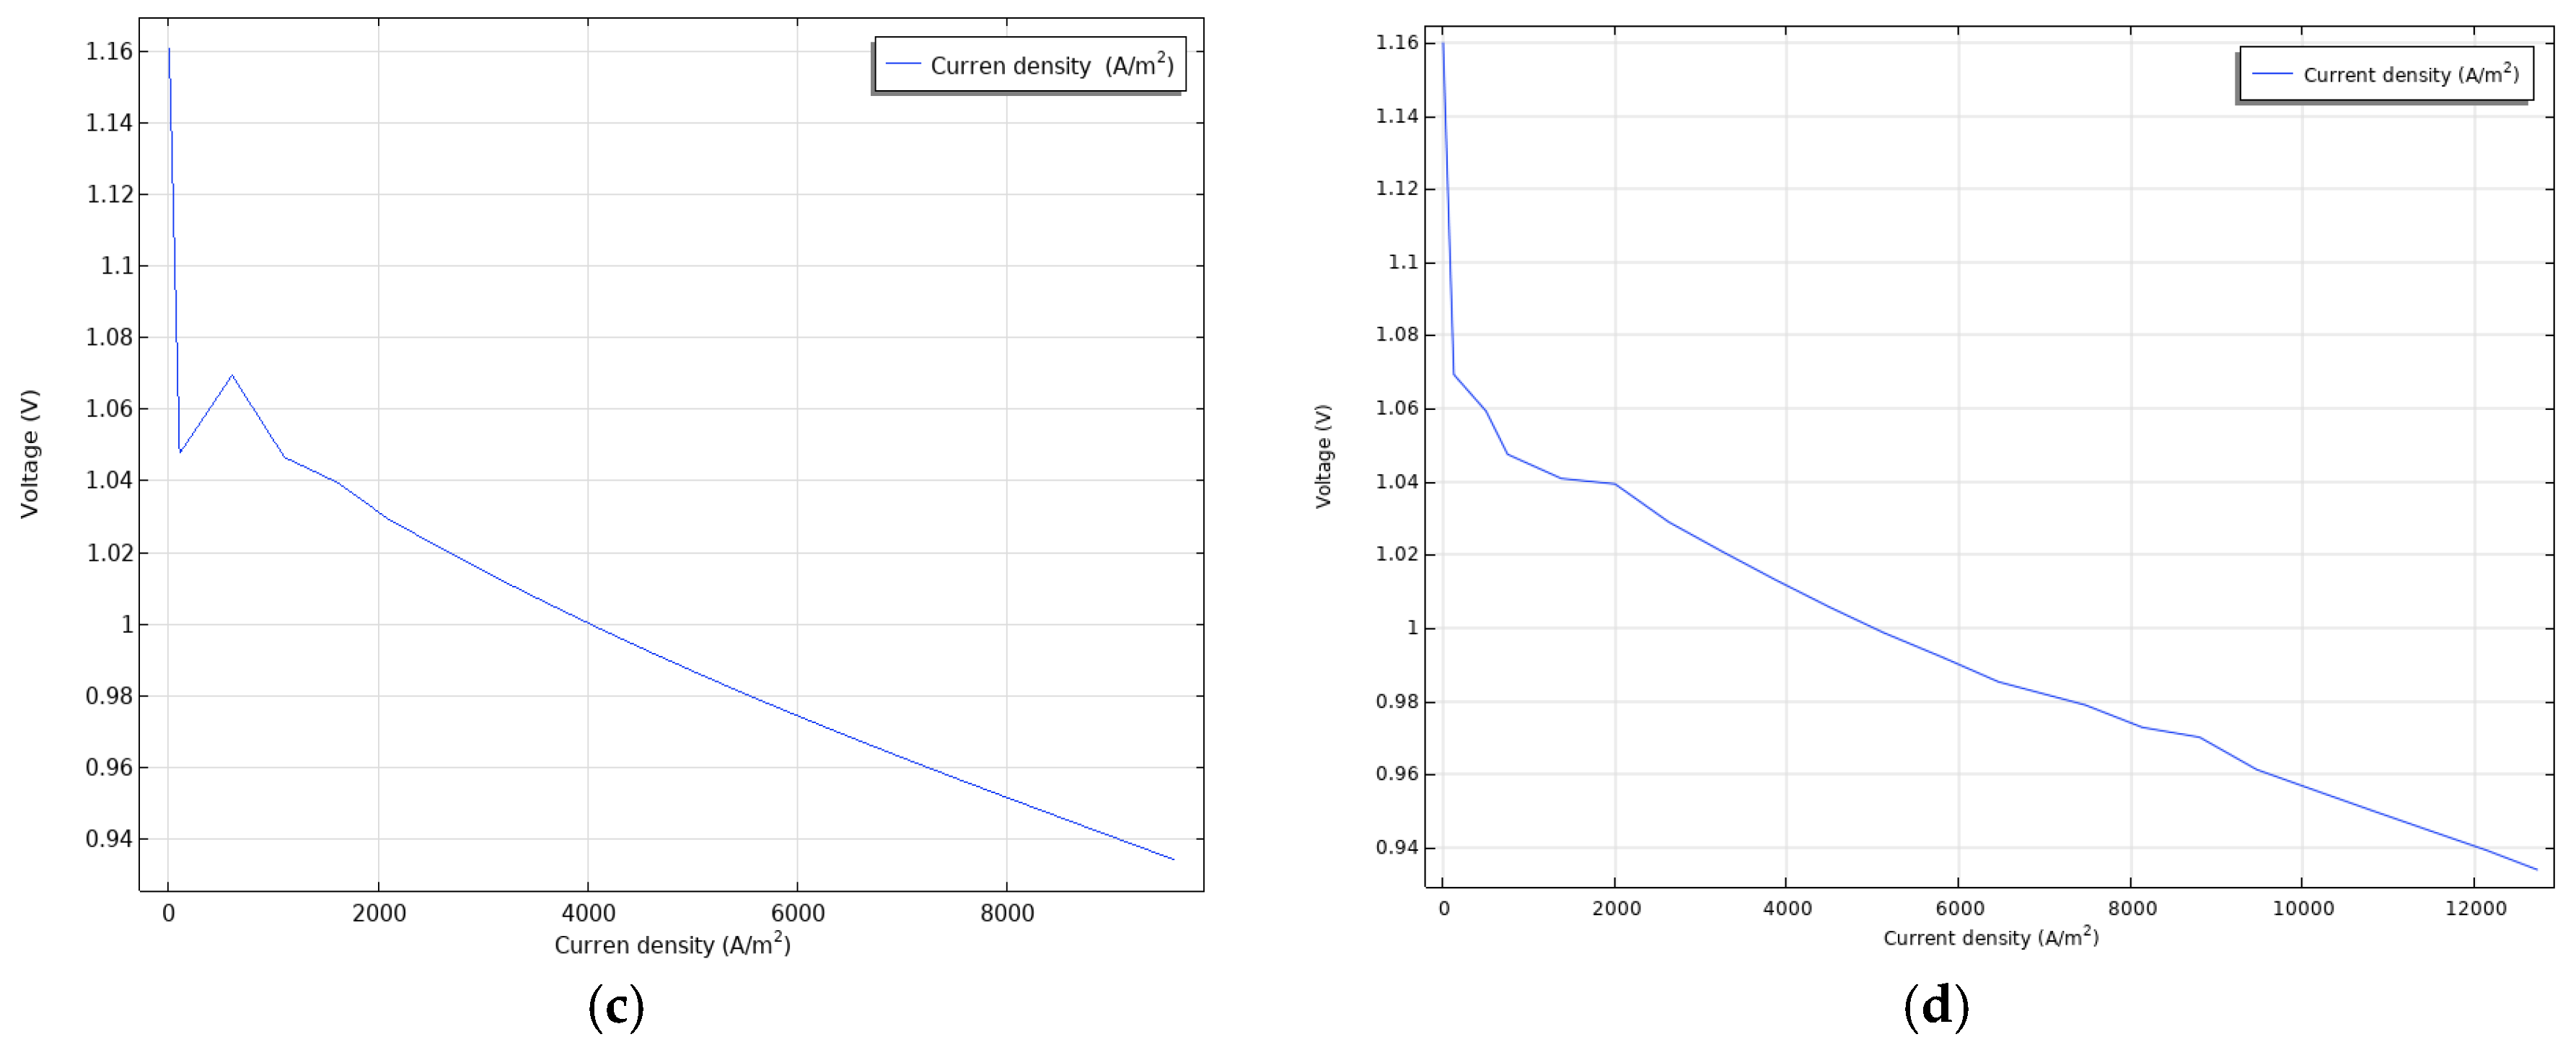
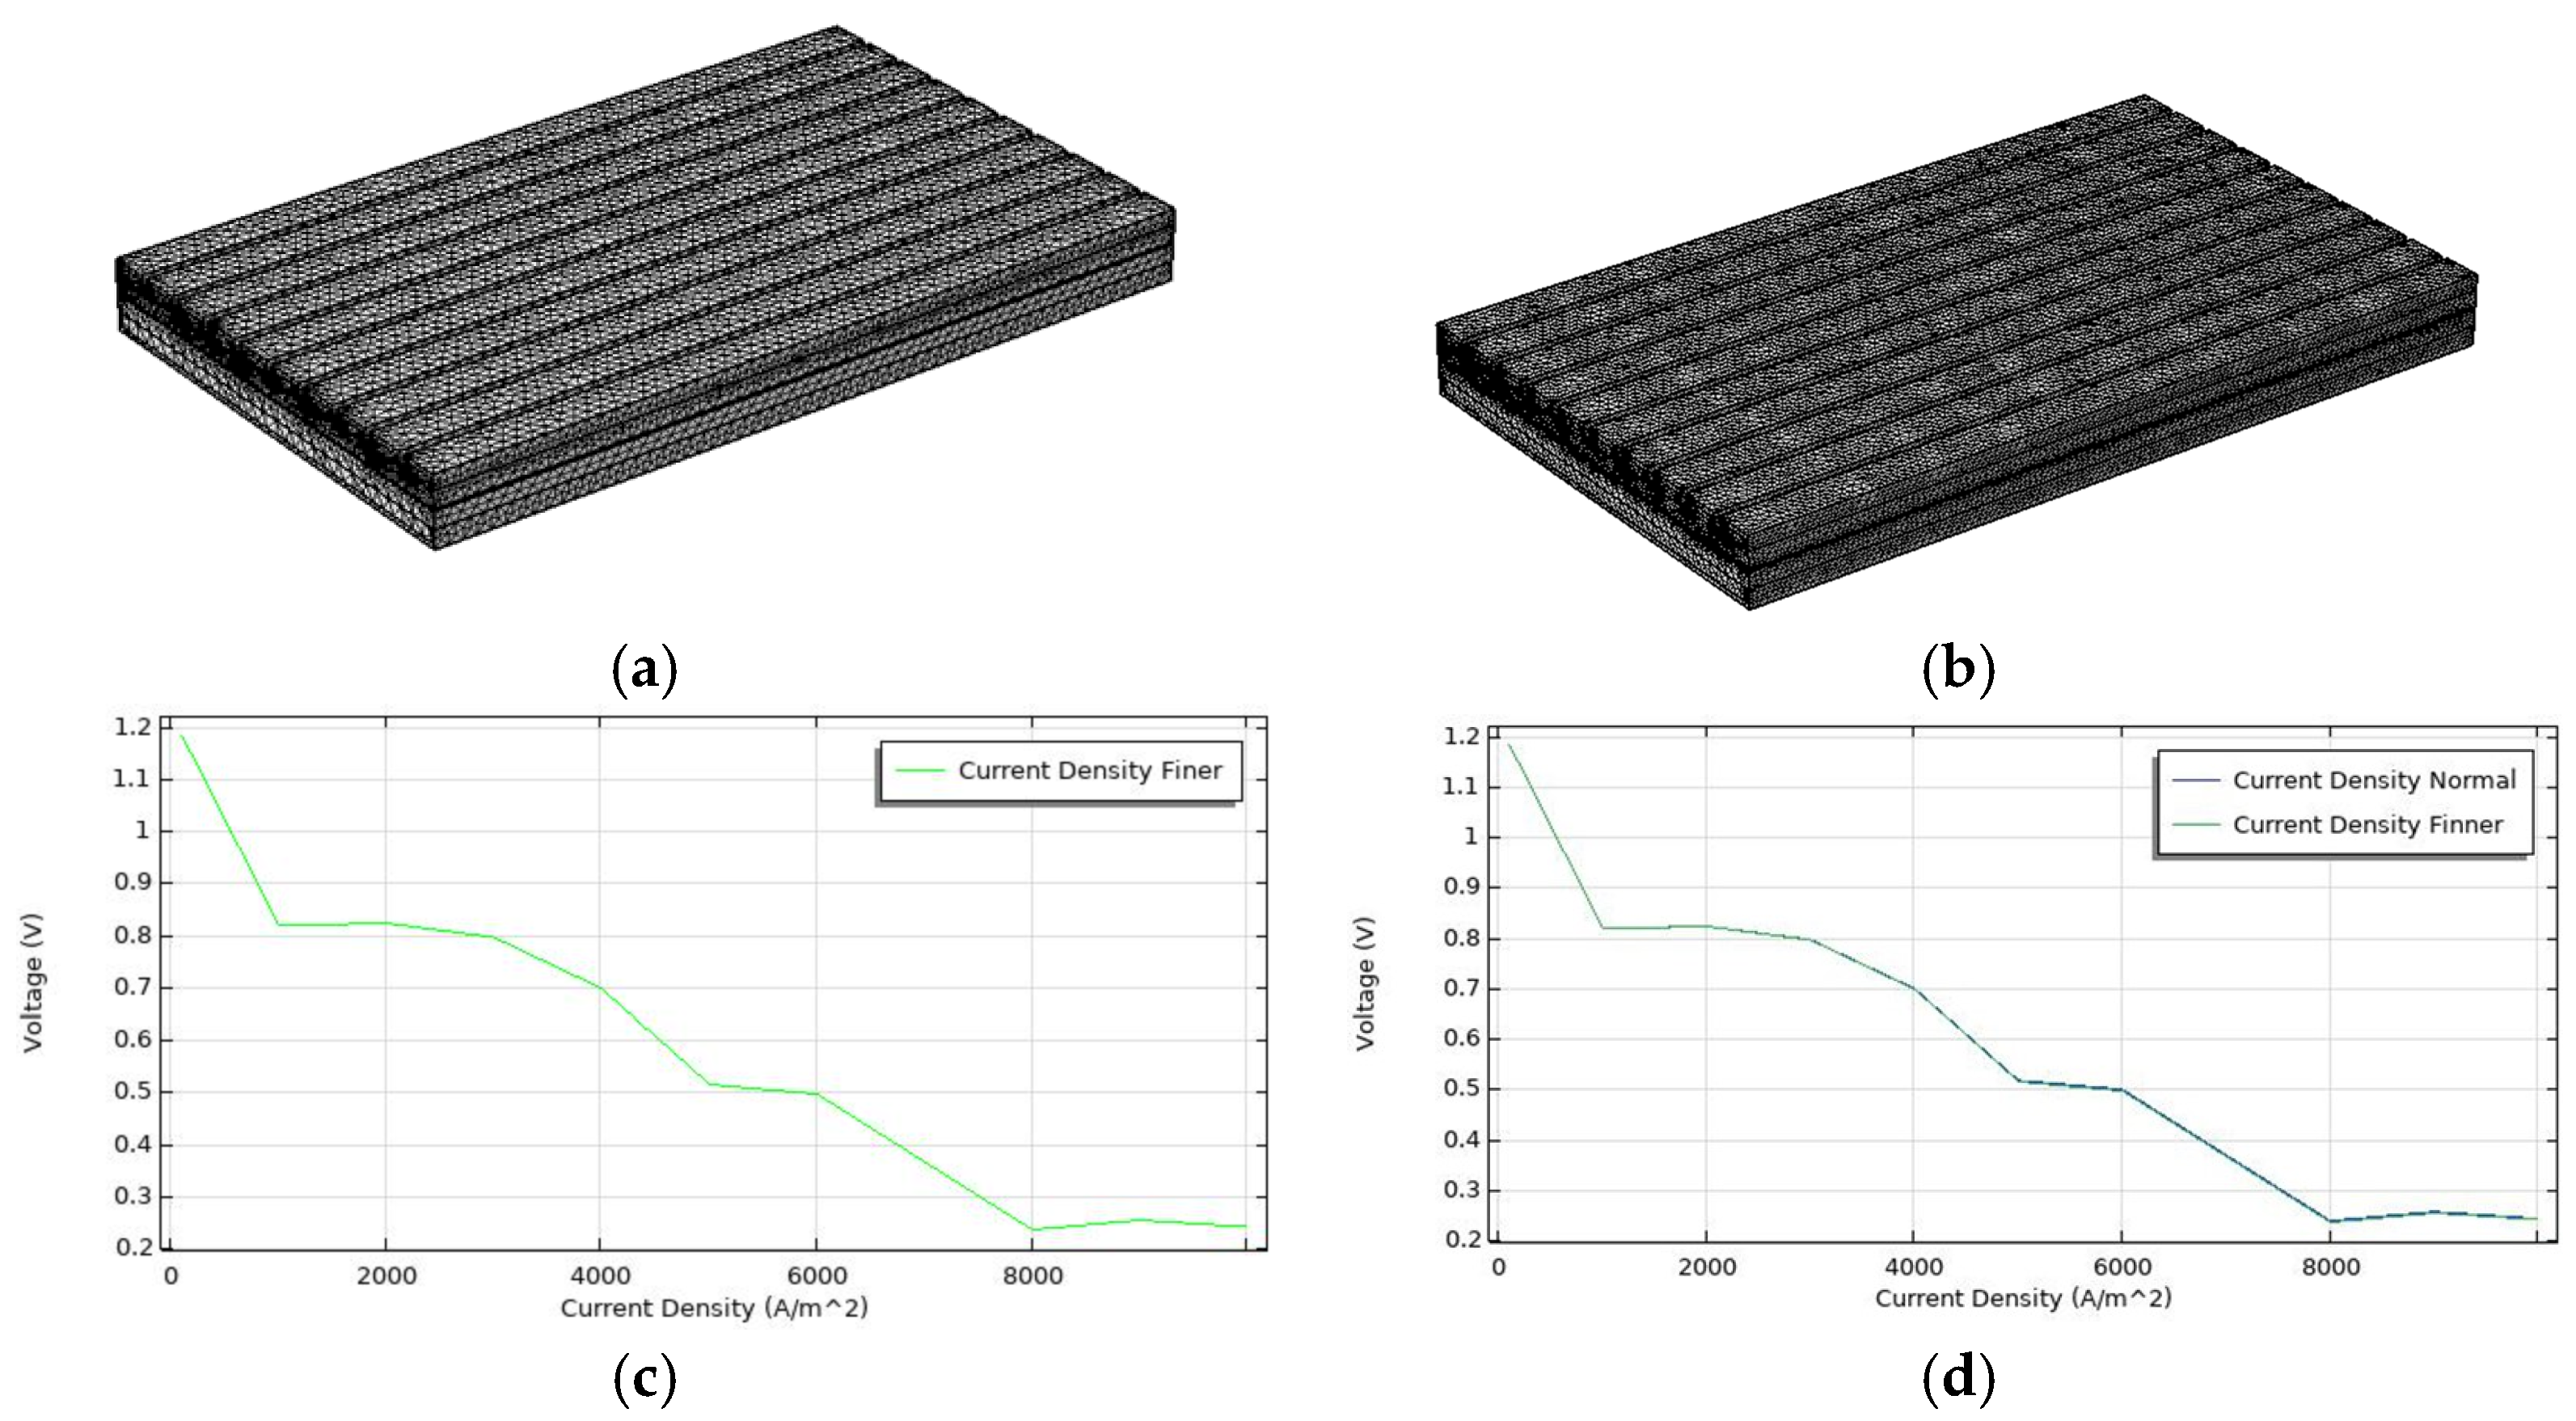
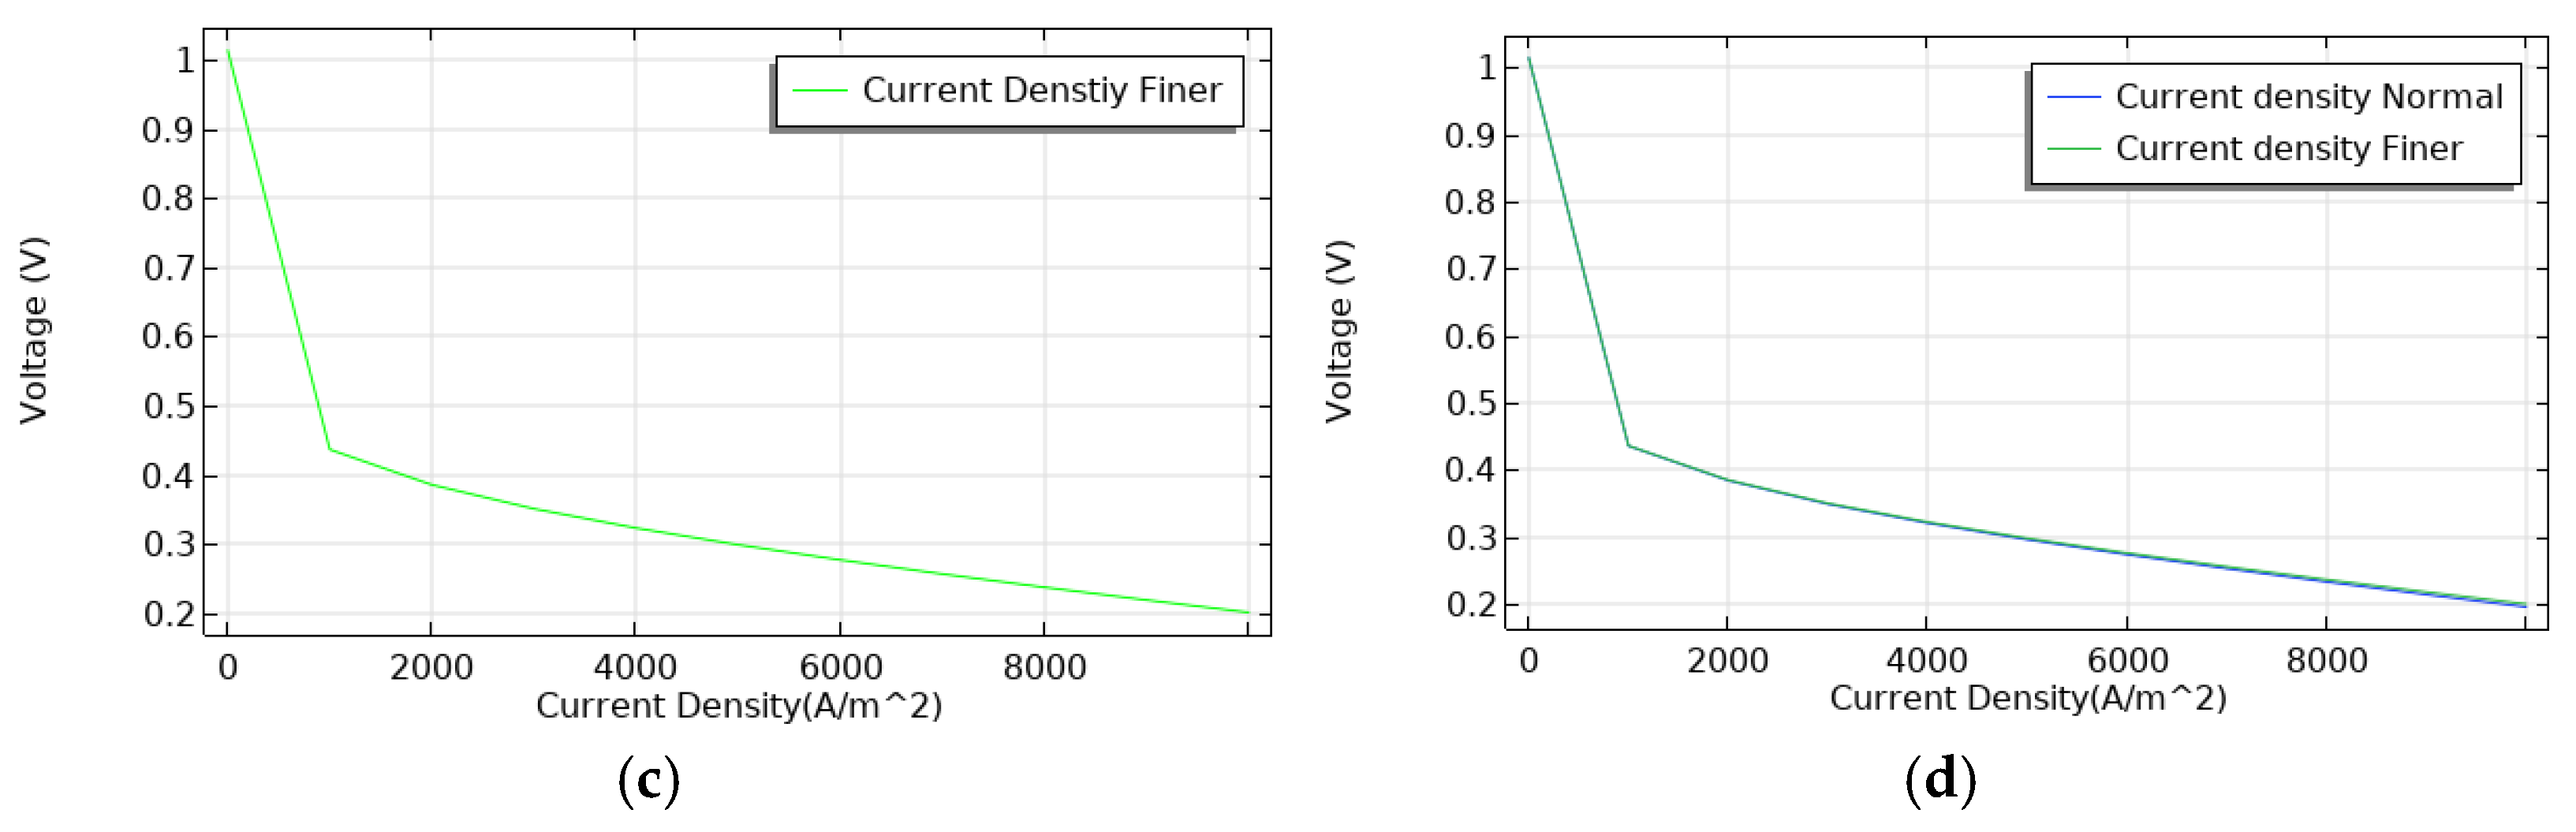
3. Results and Discussion

Numerical simulations are conducted on the cathode side with a consistent air mass flow rate at the inlet of 4.16 × 10⁻⁷ kg/s across modules comprising 21% oxygen and 79% nitrogen. The oxygen mass flow rate was 2.53 × 10⁻⁵ kg/s. The molar flow rates of hydrogen and oxygen are proportional to the total current, with 20% excess hydrogen and 150% excess oxygen (stoichiometries of 1.2 and 2.5, respectively).
The analysis emphasizes mole fraction variations, total flux, and pressure gradients, as well as water formation within the cathode’s channels and membrane. Additionally, the study includes an examination of the exchange current density with a voltage of 0.7 V applied to all designs, with polarization curves provided for each model configuration. In the comparative CFD analysis of four FC flow fields in Figure 7, including serpentine, baffles, Turing, and mixed, the maximum oxygen mole fraction observed was 20.5 mol%, 18 mol%, 32.5 mol%, and 20.5 mol%, respectively, for all configurations. The oxygen mole concentration reaches its peak at the inlet and progressively declines toward the outlet for all designs. An oxygen mole fraction of around 20 mol% is achieved for all configurations, with the Turing design achieving the highest at 32.5 mol%. This higher oxygen concentration does not inherently indicate greater efficiency. Oxygen utilization across the GDL varies significantly due to disparities in distribution and localized water flooding hindering the reduction reaction at the electrode [58]. Increasing the oxygen more fraction alone is important, but it is not a reliable indicator of optimal FC performance. A larger amount of oxygen reaches the cathode per second, leading to improved reaction rates, and this is presented as the mass flow rate by area, as shown in Figure 8.
The baffle design exhibited the highest mass flow rate by area at 5.54 × 10⁻⁴ kg/m2·s, but this occurs only at interfacial flux areas, as shown in Figure 5. In contrast, the Turing, mixed, and serpentine designs showed lower rates, measuring 1.08 × 10⁻⁴ kg/m2·s, 7.69 × 10⁻⁵ kg/m2·s, and 3.67 × 10⁻⁵ kg/m2·s, respectively. The baffled design has the highest O2 flux, indicating effective oxygen delivery across the membrane, while the serpentine design has the lowest. The dispersion across the Turing and mixed designs indicate optimal reactant delivery efficiency. These findings highlight the critical role of flow design in enhancing reactant transport and overall efficiency. The higher the oxygen reactant flow per second is, the greater the water generation as a byproduct at the cathode side. This is crucial for maintaining membrane hydration and conductivity. The typical inlet relative humidity (RH) target is around 90% for FCs, ensuring optimal performance and efficiency [59]. However, decreasing the RH to 50% reduces the power used for humidification to about 40% [60]. In this study low-humidity conditions simulating a “dry” environment was used. The working temperature is maintained at 80 °C. However, the serpentine design shows a low RH with a maximum of 0.25, mainly at the inlet where the highest oxygen mole fraction is highlighted in Figure 7. The baffle design has the lowest RH at 0.23 due to the straight channel configuration, indicating inadequate moisture retention toward the outlet and thus reduced membrane water activity. This can hinder effective electrochemical reactions. The Turning and mixed designs achieve moderate RH levels of 4.5 and 5.0, respectively, providing better hydration, accounting for 20 times better performance. This is critical for efficient FC operation.
This elevated humidity not only enhances proton conductivity but also facilitates better reactant diffusion to the catalyst sites. Water activity in the membrane plays a critical role in the performance of fuel cells, as it directly impacts proton conductivity, flooding, and membrane dehydration. High water activity facilitates efficient proton transport by maintaining the necessary hydration level for the proton-conducting network in the membrane. However, excessive water content can lead to flooding, restricting gas flow and reducing the overall efficiency. On the other hand, low water activity can cause dehydration, which reduces proton conductivity and may damage the membrane structure. Therefore, maintaining an optimal water activity is essential for ensuring both the mechanical integrity and the electrochemical performance of the membrane in fuel cell applications [61]. Figure 9 shows the membrane water activity for all designs and the ability of the Turing and mixed designs to maintain good humidity throughout the whole active area from inlet to outlet compared with the serpentine design. While keeping good membrane water activity, as shown in Figure 10, channel water activity also plays a role in fuel cell performance. High channel water activity helps maintain membrane hydration but can lead to flooding, restricting gas flow. Low water activity may cause dehydration, reducing proton conductivity and affecting performance. Balancing channel water activity is essential to prevent these issues and ensure efficient fuel cell operation. When evaluating the effectiveness of the flow field designs based on their water activity levels, distinct advantages and challenges emerge. Serpentine channels achieve a channel water activity of 0.16, indicating a relatively low relative humidity that may lead to dehydration of the membrane, potentially limiting performance during operation. Conversely, the baffle configuration exhibit a bit higher channel water activity of 0.2 due to enforced air flow. Turing channels offer a high channel water activity of 4.5 due to the larger reactant rate distribution compared to serpentine and baffle designs.
Mixed design channels achieve the highest channel water activity at 5.5, due to the existence of the baffle configuration that forces the formed water droplets in the GDL into the channel, ensuring optimal membrane hydration, promoting efficient electrochemical reactions, and minimizing the need of additional humidification systems. The baffles increase the complexity of flow management. However, this high humidity could also pose risks of flooding if not carefully managed. As mentioned above, pressure loss for flow field design is important, and maintaining high pressure at the inlet improves the delivery of the reactant [62].
Figure 11 shows the maximum pressure values in the flow field models, highlighting the different operational capabilities for each design. The serpentine design, with a maximum pressure of 0.6 Pa, is well-positioned for effective performance compared to other models. Here, the higher pressure can enhance mass transport and water management while ensuring the system’s integrity. In contrast, the baffle design has a maximum pressure of 0.008 Pa, which is relatively low. This may limit reactant delivery and membrane hydration, potentially hindering overall efficiency. Similarly, the Turing design, with a maximum pressure of 0.004 Pa, faces challenges in maintaining adequate mass transport, suggesting that higher operational pressures could improve performance. The mixed design, operating at a maximum of 0.005 Pa, is also on the lower end and may not fully capitalize on its design potential, indicating that it could benefit from elevated pressures. However, achieving and maintaining these higher pressures in the Turing, mixed, and baffle designs would likely necessitate the addition of a pressure pump, thereby increasing system complexity and costs. The performance evaluation of the four FC designs shown in Figure 12—serpentine, baffle, Turing, and mixed—reveals significant differences in both current density and reactant utilization, all of which operate with the same inlet mass flow rate of 2.53 × 10⁻⁷ kg/s.
To evaluate performance under optimal conditions, the comparison focuses on the typical PEM fuel cell operating voltage range of 0.6–0.8 V, where efficiency is generally highest. However, the values for the Turing and mixed designs are 0.9 V, highlighting their ability to operate at high current density.
Among the tested configurations, the mixed design demonstrates the best overall performance, achieving a current density of 1.2 A/cm2 around 0.9 V, with an outlet mass flow rate of 1.26 × 10⁻⁷ kg/s and an oxygen utilization of 50.20%. These values highlight its balanced efficiency in both reaction kinetics and reactant distribution. The Turing design follows, generating a current density of 1.0 A/cm2, with an outlet mass flow of 1.23 × 10⁻⁸ kg/s and an impressively high oxygen utilization rate of 95.14%, suggesting highly effective reactant use despite a slightly lower current. The baffle configuration shows a more modest current density of 0.4 A/cm2, paired with an outlet mass flow of 2.26 × 10⁻⁸ kg/s and the same oxygen utilization rate of 95.14%, indicating effective water management but limited electrochemical performance. In contrast, the serpentine design begins generating current at a lower voltage, around 0.6 V, indicating greater activation losses. It reaches a current density of just 0.5 A/cm2 at around 0.35 V and an outlet mass flow of 3.64 × 10⁻⁸ kg/s, with an oxygen utilization rate of 85.61%, representing the lowest among the designs.
The Turing design has higher oxygen utilization compared to all designs, but this does not necessary translate to better performance at high power levels. The nearly 50% oxygen consumption in the mixed design directly contributes to the highest current density in an active area of the same size. This observation reveals high efficiency in both reaction kinetics and reagent management, which is important for the optimal performance of FCs.
Maximum oxygen utilization is important for long-term efficiency; however, having high oxygen utilization does not directly translate to higher current density in fuel cell designs. While maximum oxygen utilization is crucial for long-term efficiency, factors such as reactant delivery, water management, and electrode kinetics also influence current output. The Turing and baffle designs, which have the highest oxygen utilization rates (95.14%), do not achieve a current density as high as that noted for the mixed design due to limitations in optimizing reactant flow or managing water production. This affects their ability to reach higher current densities. In contrast, although the mixed design does not maximize oxygen utilization, it provides better reactant flow and water management, making it more suitable for applications where high throughput and power output are prioritized. Thus, current density and oxygen utilization should be considered separately when optimizing fuel cell performance.
The ability to maintain effective water formation, which prevents flooding and keeps the membrane well-hydrated, contributes to better ionic conductivity and thus supports higher current densities. Overall, the mixed design leads in current density and reactant efficiency, and it also reflects the highest operational effectiveness. Future flow fields are more likely to present biological-inspired configurations due to their good ability to distribute the reactant gases uniformly and reduce the pressure drop but with the limitations of water deficiency and increased relative humidity [63]. However, incorporating the baffle configuration into the design helps to improve the water management and significantly improves the efficiency. In contrast, the Turing and baffle designs provide solid performances, while the serpentine design clearly underperforms across all metrics, underscoring the critical role of flow field design in optimizing FC operation [64].

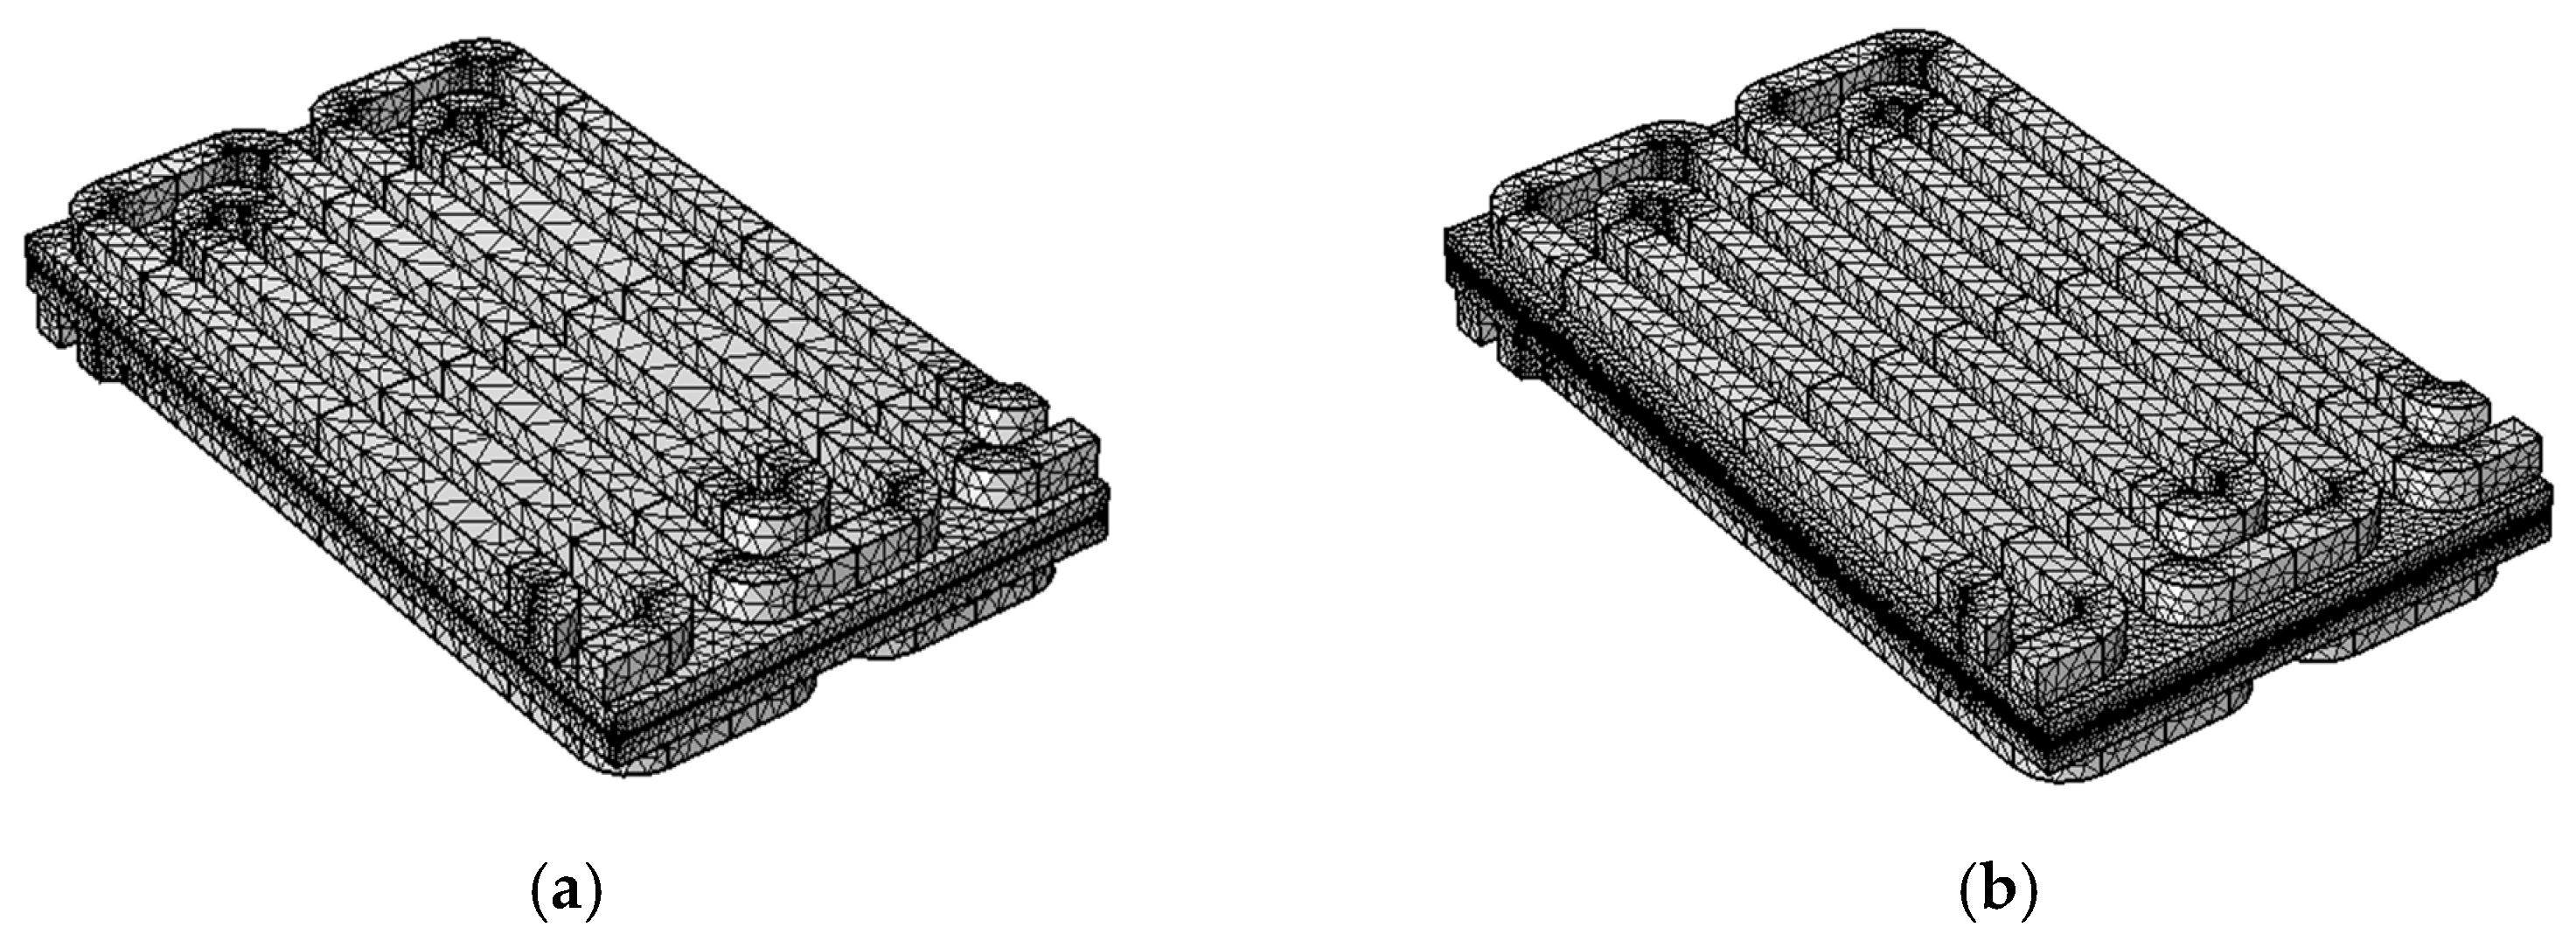
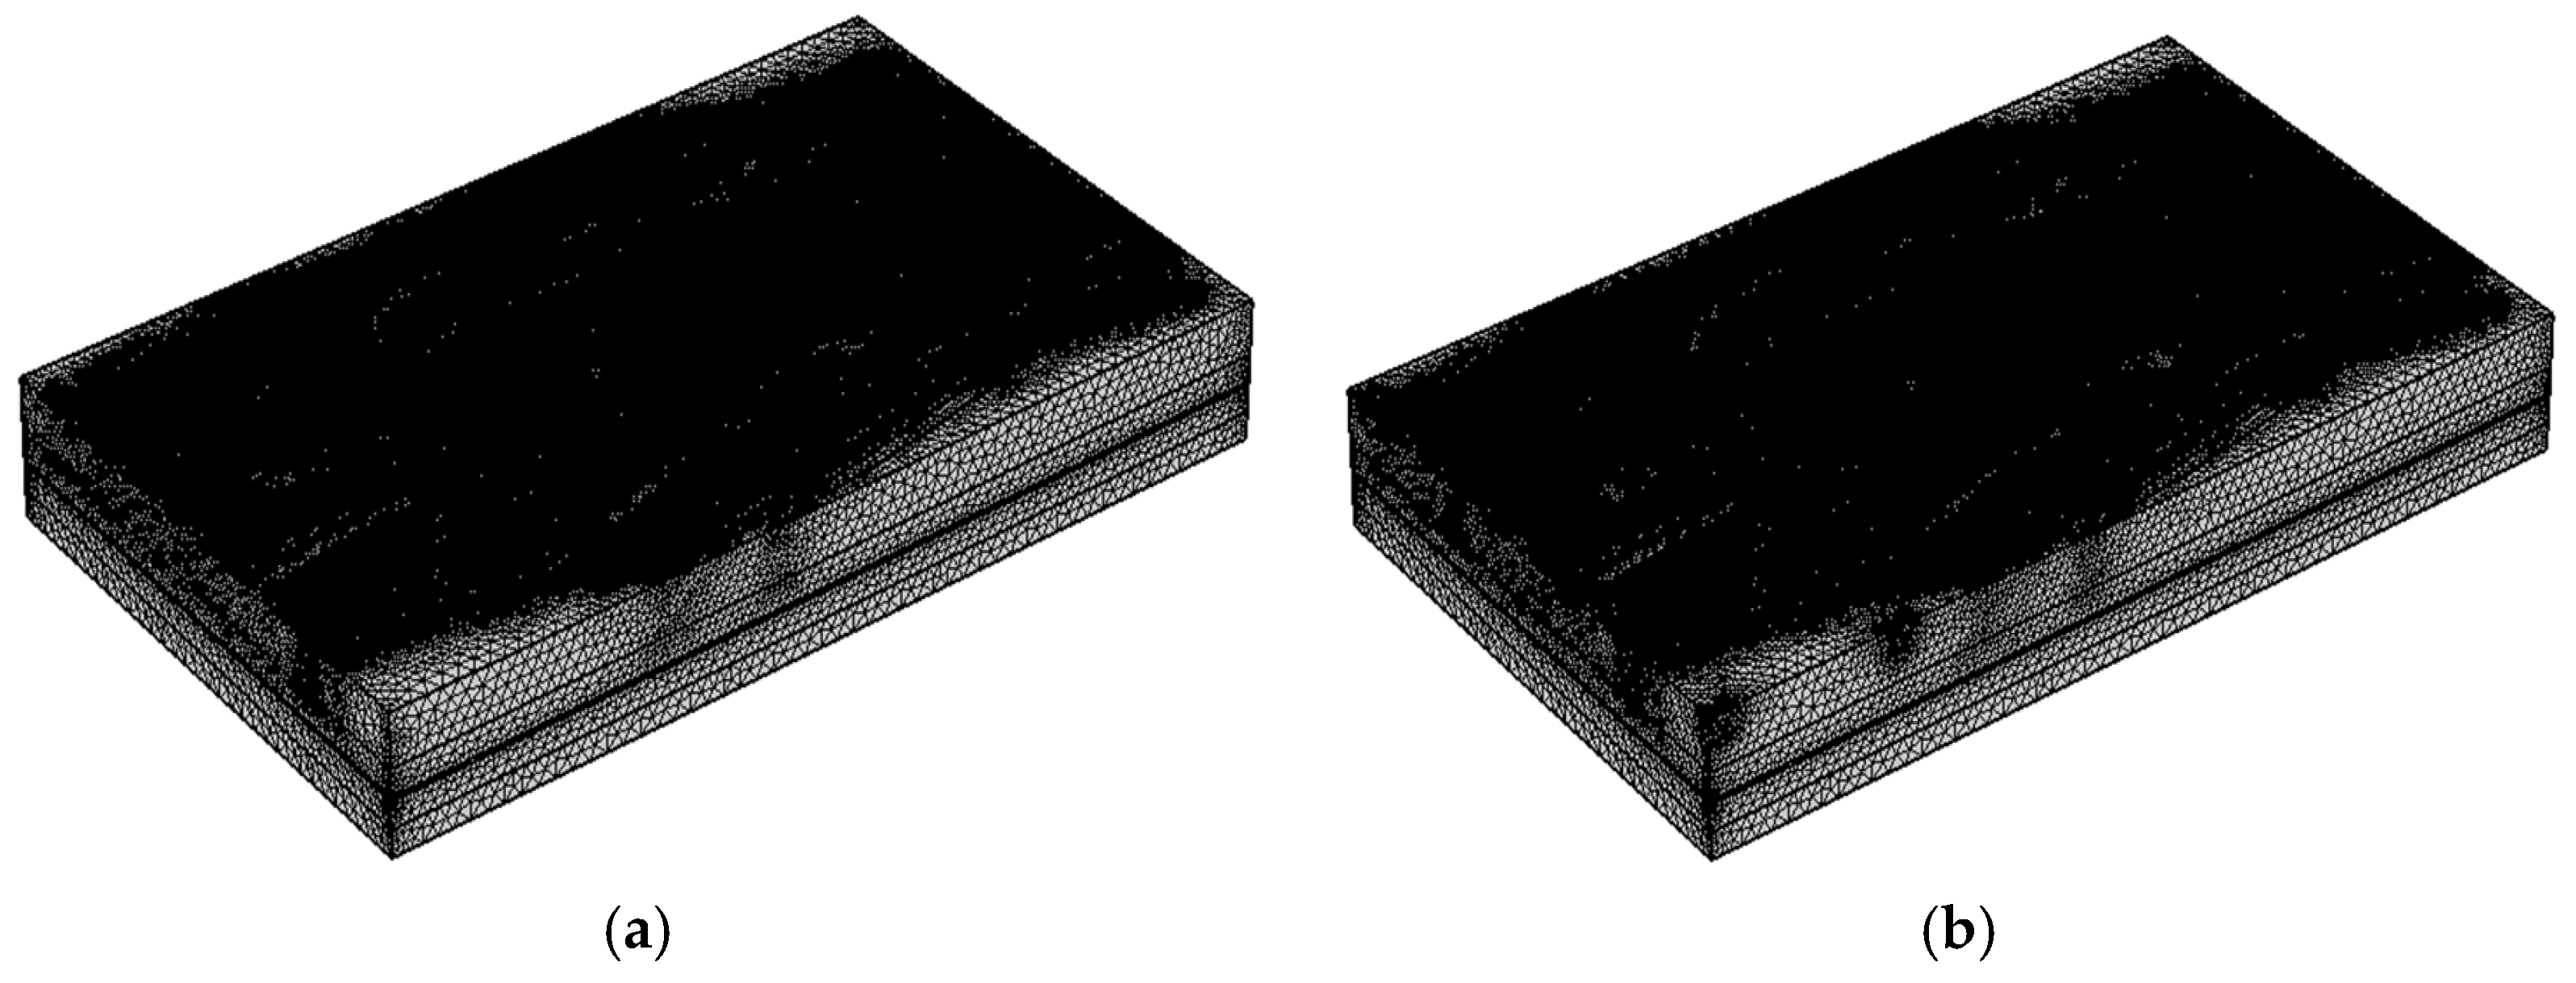
4. Mesh Independence Model Studies

In COMSOL Multiphysics software, a mesh consists of small, simple-shaped elements that discretize the modeling domain, impacting the accuracy and efficiency of simulations. The meshing sequence includes operations and attributes that define element size, distribution, and refinement. Global attributes set mesh sizes for the entire model, while local attributes override them for specific regions. Predefined mesh sizes vary, including normal, fine, finer, extra fine, and extremely fine. A normal mesh size is used for baffle and serpentine models in this study, which gives good solutions taking into account the complexity of the models. The Turing and mixed designs have smaller elements due to the bio-inspired flow field, which needs more detailed information, and finer size meshed is used for the body and extra fine for the smallest parts. In Figure 13, the baffle model mesh is shown and compared with the normal mesh (Figure 13a) and the finer mesh (Figure 13b), generating the finer mesh I-V curve presented in Figure 13c. The comparison between both I-V curves is presented in Figure 13d. The finer mesh captures more detailed variations in reaction kinetics and mass transport, although the resulting impact on current density is minimal and nearly indistinguishable from the normal mesh. The impact of mesh refinement is evident in Figure 13d, where the finer mesh results are identical to normal mesh. For this mesh, the relatively simple geometry is acceptable.
In Figure 14, the effect of mesh refinement on the serpentine flow field is examined by comparing the normal mesh (Figure 14a) with the finer mesh (Figure 14b). The corresponding I-V curve for the finer mesh is shown in Figure 14c, while Figure 14d presents a comparison between the normal and finer mesh results.
Similar to the baffle design, the difference between the finer and normal mesh is limited to variations in the second decimal place, rendering the resulting plots virtually identical.
Given their intricate structure, a finer mesh is essential for the Turing and mixed designs, as shown in Figure 15. As the main focus of this study, these two models feature bio-inspired flow fields that require a higher level of detail to accurately capture the fluid dynamics and mass transport phenomena. Therefore, a finer mesh is applied to the main body, while extra-fine elements are used for the smallest and most critical regions to enhance solution accuracy. This approach ensures reliable results while balancing computational efficiency.

5. Conclusions

The comparative analysis of four flow field designs—serpentine, baffle, Turing, and mixed—reveals distinct performance strengths and weaknesses, particularly in terms of oxygen utilization and current density. The mixed design achieves the highest current density at 1.2 A/cm2 with an oxygen utilization of 50.2%, balancing power output and reactant management well. Due to the additional baffles added along the channels, this design maintains high membrane water activity and relative humidity, which is ideal for preventing dehydration and flooding while reducing the need for external humidification, although it may require careful water management. The Turing design follows with a high oxygen utilization (95.14%) and a current density of 1.0 A/cm2, demonstrating strong reactant efficiency but lower current output, likely due to moderate water retention. The baffle design achieves a mass flow rate by area of 5.54 × 10⁻⁴ kg/m2·s and current density of 0.4 A/cm2, supporting effective oxygen delivery and yielding a utilization of 95.14%. However, its low RH of 0.23 suggests limited hydration potential. Meanwhile, the serpentine design shows the lowest current density (0.3 A/cm2) and oxygen utilization (85.61%), constrained by poor water management, activation losses, and a high reactant concentration drop along the channel length. The mixed design emerges as the most effective, leveraging moderate oxygen consumption to produce high current density and sustain optimal membrane hydration, whereas the serpentine’s low performance underscores the important effect of flow field design on FC efficiency. While experimental validation is beyond the scope of this study, future work will focus on experimentally validating the bio-inspired flow field to assess its practical performance and refine the observed trends. Additionally, a more in-depth investigation into the interplay between oxygen utilization, water management, and transport losses will be undertaken to provide further clarity on the mechanisms influencing current density.

Author Contributions

Conceptualization, D.G. and S.B.; methodology, D.G. and S.B.; software, D.G.; validation, D.G. and S.B.; formal analysis, S.B.; investigation, D.G.; resources, S.B.; data curation, D.G.; writing—original draft preparation, D.G.; writing—review and editing, S.B.; visualization, D.G.; supervision, S.B.; project administration, S.B.; funding acquisition, S.B. All authors have read and agreed to the published version of the manuscript.

Funding

This research was funded by European Union—NextGenerationEU, through the National Recovery and Resilience Plan of the Republic of Bulgaria, project No. BG-RRP-2.004-0005.

Data Availability Statement

The original contributions presented in this study are included in the article. Further inquiries can be directed to the corresponding author.

Conflicts of Interest

The authors declare no conflicts of interest.

References

  1. Jamal, T.; Shafiullah, G.M.; Dawood, F.; Kaur, A.; Arif, M.T.; Pugazhendhi, R.; Elavarasan, R.M.; Ahmed, S.F. Fuelling the future: An in-depth review of recent trends, challenges and opportunities of hydrogen fuel cell for a sustainable hydrogen economy. Energy Rep. 2023, 10, 2103–2127. [Google Scholar] [CrossRef]
  2. Hassan, Q.; Algburi, S.; Sameen, A.Z.; Salman, H.M.; Jaszczur, M. Green hydrogen: A pathway to a sustainable energy future. Int. J. Hydrogen Energy 2024, 50, 310–333. [Google Scholar] [CrossRef]
  3. Bhuiyan, M.M.H.; Siddique, Z. Hydrogen as an alternative fuel: A comprehensive review of challenges and opportunities in production, storage, and transportation. Int. J. Hydrogen Energy 2025, 102, 1026–1044. [Google Scholar] [CrossRef]
  4. Sharaf, O.Z.; Orhan, M.F. An overview of fuel cell technology: Fundamentals and applications. Renew. Sustain. Energy Rev. 2014, 32, 810–853. [Google Scholar] [CrossRef]
  5. Tong, C. Hydrogen and Fuel Cells. In Introduction to Materials for Advanced Energy Systems; Springer: Cham, Switzerland, 2019; pp. 587–653. [Google Scholar]
  6. Sebbani, I.; Ettouhami, M.K.; Boulakhbar, M. Fuel cells: A technical, environmental, and economic outlook. Clean. Energy Syst. 2025, 10, 100168. [Google Scholar] [CrossRef]
  7. Tellez-Cruz, M.M.; Escorihuela, J.; Solorza-Feria, O.; Compañ, V. Proton Exchange Membrane Fuel Cells (PEMFCs): Advances and Challenges. Polymers 2021, 13, 3064. [Google Scholar] [CrossRef]
  8. Qasem, N.A.A. A recent overview of proton exchange membrane fuel cells: Fundamentals, applications, and advances. Appl. Therm. Eng. 2024, 252, 123746. [Google Scholar] [CrossRef]
  9. Fan, L.; Tu, Z.; Chan, S.H. Recent development of hydrogen and fuel cell technologies: A review. Energy Rep. 2021, 7, 8421–8446. [Google Scholar] [CrossRef]
  10. Pourrahmani, H.; Yavarinasab, A.; Siavashi, M.; Matian, M.; Van Herle, J. Progress in the proton exchange membrane fuel cells (PEMFCs) water/thermal management: From theory to the current challenges and real-time fault diagnosis methods. Energy Rev. 2022, 1, 100002. [Google Scholar] [CrossRef]
  11. Liu, Z.; Cai, S.; Tu, Z.; Chan, S.H. Recent development in degradation mechanisms of proton exchange membrane fuel cells for vehicle applications: Problems, progress, and perspectives. Energy Storage Sav. 2024, 3, 106–152. [Google Scholar] [CrossRef]
  12. Spreafico, C.; Thonemann, N. Prospective life cycle assessment of proton exchange membrane fuel cell. Comparing data from patents and papers. Int. J. Hydrogen Energy 2025, 99, 45–52. [Google Scholar] [CrossRef]
  13. Al-okbi, Y.; Jweeg, M.J.; Atiya, M.A.; Al-Dujele, R. Design, analysis and development of a proton exchange membrane in fuel cell. J. Eng. Res. 2024; in press. [Google Scholar] [CrossRef]
  14. AhmadS, S.; Nawaz, T.; Ali, A.; Orhan, M.F.; Samreen, A.; Kannan, A.M. An overview of proton exchange membranes for fuel cells: Materials and manufacturing. Int. J. Hydrogen Energy 2022, 47, 19086–19131. [Google Scholar] [CrossRef]
  15. Petrillo, A. Powering Clean Energy Solutions. In Generative Design Puts Hydrogen Fuel Cell Development in High Gear COMSOL Multiphysics eBook; Toyota Research Institute of North America: Ann Arbor, MI, USA, 2023. [Google Scholar]
  16. Jiao, K.; Li, X. Water transport in polymer electrolyte membrane fuel cells. Prog. Energy Combust. Sci. 2011, 37, 221–291. [Google Scholar] [CrossRef]
  17. Li, X.; Sabir, I. Review of bipolar plates in PEM fuel cells: Flow-field designs. Int. J. Hydrogen Energy 2005, 30, 359–371. [Google Scholar] [CrossRef]
  18. Thitakamol, V.; Therdthianwong, A.; Therdthianwong, S. Mid-baffle interdigitated flow fields for proton exchange membrane fuel cells. Int. J. Hydrogen Energy 2011, 36, 3614–3622. [Google Scholar] [CrossRef]
  19. Wang, J. Theory and practice of flow field designs for fuel cell scaling-up: A critical review. Appl. Energy 2015, 157, 640–663. [Google Scholar] [CrossRef]
  20. Jithesh, P.; Bansode, A.; Sundararajan, T.; Das, S.K. The effect of flow distributors on the liquid water distribution and performance of a PEM fuel cell. Int. J. Hydrogen Energy 2012, 37, 17158–17171. [Google Scholar] [CrossRef]
  21. Weng, W.C.; Li, H.Y.; Kuo, J.K.; Yan, W.M. Transient response of proton exchange membrane fuel cell with serpentine flow field. In Proceedings of the IEEE 3rd International Conference on Communication Software and Networks, Xi’an, China, 27–29 May 2011; pp. 224–229. [Google Scholar]
  22. Guo, N.; Leu, M.; Koylu, U. Optimization of Parallel and Serpentine Configurations for Polymer Electrolyte Membrane Fuel Cells. Fuel Cells 2014, 14, 876–885. [Google Scholar] [CrossRef]
  23. Wang, Y.; Liao, X.; Liu, G.; Xu, H.; Guan, C.; Wang, H.; Li, H.; He, W.; Qin, Y. Review of Flow Field Designs for Polymer Electrolyte Membrane Fuel Cells. Energies 2023, 16, 4207. [Google Scholar] [CrossRef]
  24. Laboto, J.; Canizares, P.; Rodrigo, M.A.; Pinar, J.; Mena, E.; Ubeda, D. Three-dimensional model of a 50 cm2 high temperature PEM fuel cell. Study of the flow channel geometry influence. Int. J. Hydrogen Energy 2010, 35, 5510–5520. [Google Scholar] [CrossRef]
  25. Um, S.; Wang, C. Three-dimensional analysis of transport and electrochemical reactions in polymer electrolyte fuel cell. J. Power Sources 2004, 125, 40–51. [Google Scholar] [CrossRef]
  26. Iranzo, A.; Salva, A.; Rosa, F. Fluid Flow in Polymer Electrolyte Membrane Fuel Cells. In Fluid Dynamics, Computational Modeling and Applications; InTech: London, UK, 2012. [Google Scholar] [CrossRef]
  27. You, L.; Liu, H. A two-phase flow and transport model for the cathode of PEM fuel cells. Int. J. Heat Mass Transf. 2002, 45, 2277–2287. [Google Scholar] [CrossRef]
  28. Wei, Y.; Feng, Y.; Zhao, J.; Li, J.; Li, H.; Tan, J. Numerical Investigation of Proton Exchange Membrane Fuel Cells with Symmetrical Serpentine Channels Equipped with Baffles. ACS Omega 2025, 10, 1510–1518. [Google Scholar] [CrossRef]
  29. Wang, Z.H.; Wang, C.Y.; Chen, K.S. Two-phase flow and transport in the air cathode of proton exchange membrane fuel cells. J. Power Sources 2001, 94, 40–50. [Google Scholar] [CrossRef]
  30. Hu, M.; Gu, A.; Wang, M.; Zhu, X.; Yu, L. Three dimensional, two phase flow mathematical model for PEM fuel cell: Parts I and II. Analysis and discussion of the internal transport mechanism. Energy Convers. Manag. 2004, 45, 1861–1882. [Google Scholar] [CrossRef]
  31. Sauermoser, M.; Kizilova, N.; Pollet, B.; Kjelstrup, S. Flow Field Patterns for Proton Exchange Membrane Fuel Cells. Front. Energy Res. 2020, 8, 13. [Google Scholar] [CrossRef]
  32. Dai, W.; Wang, H.; Yuan, X.-Z.; Martin, J.J.; Yang, D.; Qiao, J.; Ma, J. A review on water balance in the membrane electrode assembly of proton exchange membrane fuel cells. Int. J. Hydrogen Energy 2009, 34, 461–9478. [Google Scholar] [CrossRef]
  33. Liso, L.; Pagh, M.N.; Knudsen, S.K.; Mortensen, H.H. Thermal modeling and temperature control of a PEM fuel cell system for forklift applications. Int. J. Hydrogen Energy 2014, 39, 8410–8420. [Google Scholar] [CrossRef]
  34. Wang, C.Y. Fundamental models for fuel cell engineering. Chem. Rev. 2004, 104, 4727–4765. [Google Scholar] [CrossRef]
  35. Heidary, H.; Kermani, M.; Prasad, A.A. Experimental investigation of in-line and staggered blockages in parallel flowfield channels of PEM fuel cells. Int. J. Hydrogen Energy 2016, 41, 6885–6893. [Google Scholar] [CrossRef]
  36. Cheng, T.; Liu, Q.; Jiang, G.; Zhao, Q.; Mu, D. The impact of baffle and taper channel tilt angle on the output performance of proton-exchange membrane fuel cells. Fuel Cells 2024, 24, 32–48. [Google Scholar] [CrossRef]
  37. Kizaki, M.; Asai, H.; Yumiya, H. Toyota Fuel Cell System (TFCS). World Electr. Veh. J. 2015, 7, 85–92. [Google Scholar] [CrossRef]
  38. Hankins, S.N.; Zhou, Y.; Lohan, D.J.; Dede, E.M. Generative design of large-scale fluid flow structures via steady-state diffusion-based dehomogenization. Sci. Rep. 2023, 13, 14344. [Google Scholar] [CrossRef]
  39. Turing, A.M. The chemical basis of morphogenesis. Philos. Trans. R. Soc. B 1952, 237, 37–72. [Google Scholar]
  40. Ebrahimi, F.; Kermani, M.J. Generalization of the method of flow channel blocking in PEM fuel cells; extensions from straight-parallel to parallel-serpentine flow fields. Int. J. Hydrogen Energy. 2025, in press. [CrossRef]
  41. Zhang, S.; Xu, H.; Qu, Z.; Liu, S.; Talkhoncheh, F.K. Bio-inspired flow channel designs for proton exchange membrane fuel cells: A review. J. Power Source 2022, 522, 231003. [Google Scholar] [CrossRef]
  42. Kang, H.C.; Jum, K.M.; Sohn, Y.J. Performance of unit PEM fuel cells with a leaf-vein-simulating flow field-patterned bipolar plate. Int. J. Hydrogen Energy 2019, 44, 24036–24042. [Google Scholar] [CrossRef]
  43. Cai, G.; Liang, Y.; Liu, Z.; Liu, W. Design and optimization of bio-inspired wave-like channel for a PEM fuel cell applying genetic algorithm. Energy 2020, 192, 116670. [Google Scholar] [CrossRef]
  44. Yagiz, M.; Çelik, S. Experimental investigation of bio-inspired flow field designs for direct methanol fuel cell. Fuel 2025, 381, 133624. [Google Scholar] [CrossRef]
  45. Tao, J.; Wang, X.; Xu, M.; Liu, C.; Ge, J.; Xing, W. Non-noble metals as activity sites for ORR catalysts in proton exchange membrane fuel cells (PEMFCs). Indust. Chem. Mat. 2023, 1, 388–409. [Google Scholar] [CrossRef]
  46. Kim, J.; Luo, G.; Wang, C.-Y. Modeling two-phase flow in three-dimensional complex flow-fields of proton exchange membrane fuel cells. J. Power Sources 2017, 365, 419–429. [Google Scholar] [CrossRef]
  47. Forchheimer Flow. COMSOL Multiphysics 5.6, Library COMSOL Fluid Flow 5.6. Available online: https://doc.comsol.com/5.6/doc/com.comsol.help.models.ssf.forchheimer_flow/models.ssf.forchheimer_flow.pdf (accessed on 31 March 2025).
  48. Amiri, A.; Vafai, K. Transient Analysis of Incompressible Flow Through a Packed Bed. Int. J. Heat Mass Transfer 1998, 41, 4259–4279. [Google Scholar] [CrossRef]
  49. Barbir, F. Fuel Cell Operating Conditions. In PEM Fuel Cells, 2nd ed.; Barbir, F., Ed.; Academic Press: Cambridge, MA, USA, 2013; pp. 119–157. [Google Scholar]
  50. Kadyk, T.; Kadow, M.; Hanke-Rauschenbach, R. Experimental assessment and analysis of mass transport limiting current densities in PEM fuel cells. Sci. Rep. 2025, 15, 12345. [Google Scholar]
  51. Sheng, W.; Gasteiger, H.A.; Shao-Horn, Y. Hydrogen Oxidation and Evolution Reaction Kinetics on Platinum: Acid vs. Alkaline Electrolytes. J. Electrochem. Soc. 2010, 157, B1529–B1536. [Google Scholar] [CrossRef]
  52. Brandes, B.A.; Krishnan, Y.; Buchauer, F.L.; Hansen, H.A.; Hjelm, J. Unifying the ORR and OER with surface oxygen and extracting their intrinsic activities on platinum. Nat. Commun. 2024, 15, 7336. [Google Scholar] [CrossRef]
  53. Manso, A.P.; Marzo, F.F.; Barranco, J.; Garikano, X.; Mujika, M.G. Influence of geometric parameters of the flow fields on the performance of a PEM fuel cell. A review. Int. J. Hydrogen Energy 2012, 37, 15256–15287. [Google Scholar] [CrossRef]
  54. Rocha, C.; Knöri, T.; Ribeirinha, P.; Gazdzicki, P. A review on flow field design for proton exchange membrane fuel cells: Challenges to increase the active area for MW applications. Renew. Sustain. Energy Rev. 2024, 192, 114198. [Google Scholar] [CrossRef]
  55. Paulino, A.L.R.; Robalinho, E.; Cunha, E.F.; Passos, R.R.; Santiago, E.I. Current Distribution on PEM Fuel Cells with Different Flow Channel Patterns. In Proceedings of the COMSOL Conference in Boston, Newton, MA, USA, 9–11 October 2013. [Google Scholar]
  56. Kandlikar, S.; Lu, Z.; Domigan, W.; White, A.; Benedict, M. Measurement of flow maldistribution in parallel channels and its application to ex-situ and in-situ experiments in PEMFC water management studies. Int. J. Heat Mass Transfer 2009, 52, 1741–1752. [Google Scholar] [CrossRef]
  57. Chen, H.; Guo, H.; Ye, F.; Ma, C.F. A numerical study of orientated-type flow channels with porous-blocked baffles of proton exchange membrane fuel cells. Int. J. Hydrogen Energy 2021, 46, 29443–29458. [Google Scholar] [CrossRef]
  58. Ichihara, N.; Ueda, M. 3D-print infill generation using the biological phase field of an optimized discrete material orientation vector field. Compos. Part B Eng. 2022, 232, 109626. [Google Scholar] [CrossRef]
  59. Sinha, P.K.; Mukherjee, P.P.; Wang, C.-Y. Impact of GDL structure and wettability on water management in polymer electrolyte fuel cells. J. Mat. Chem. Issue 2007, 17, 3089–3103. [Google Scholar] [CrossRef]
  60. de Bruijn, F.; Dam, V.; Janssen, G. Review: Durability and Degradation Issues of PEM Fuel Cell Components. Fuel Cells 2008, 8, 3–22. [Google Scholar] [CrossRef]
  61. Sanchez, D.G.; Ruiu, T.; Biswas, I.; Friedrich, A.; Sanchez-Monreal, J.; Vera, M. Effect of the Inlet Gas Humidification on PEMFC Behavior and Current Density Distribution. Electrochem. Soc. 2014, 64, 603–617. [Google Scholar]
  62. Yuan, W.-W.; Ou, K.; Jung, S.; Kim, Y.-B. Analyzing and Modeling of Water Transport Phenomena in Open-Cathode Polymer Electrolyte Membrane Fuel Cell. Appl. Sci. 2021, 11, 5964. [Google Scholar] [CrossRef]
  63. Kumar, A.; Reddy, R.G. Effect of gas flow-field design in the bipolar/end plates on the steady and transient state performance of polymer electrolyte membrane fuel cell. J. Power Sources 2006, 155, 264–271. [Google Scholar] [CrossRef]
  64. Bunyan, S.T.; Dhahad, H.A.; Khudhur, D.S.; Yusaf, T. The Effect of Flow Field Design Parameters on the Performance of PEMFC: A Review. Sustainability 2023, 15, 10389. [Google Scholar] [CrossRef]
Figure 1. Schematic presentation of fluid dynamics through the cathode-side flow field plate: the arrows present air flow direction.
Energies 18 02165 g001
Figure 2. Water management using the baffle design in the cathode channel.
Energies 18 02165 g002
Figure 3. Serpentine flow field with two parallel channels running next to each other shown from different views: (a) topological view; (b) side view.
Energies 18 02165 g003
Figure 4. Channel Baffle configuration: (a) Baffle configuration in parallel flow field design with 10 channels in blue; (b) Site look of streamline flow in the channel. Oxygen mole fraction (mol.% O2).
Energies 18 02165 g004
Figure 5. Turing configuration of the channel: (a) Turing flow field design based on biological patterns; (b) A cut-through section of the channel section in 3D.
Energies 18 02165 g005
Figure 6. Channel with a mixed flow field and baffle design: (a) The mixed flow field and baffle design are noted in blue; (b) The baffle design in the 3D channel is shown in blue.
Energies 18 02165 g006
Figure 7. Oxygen mole fraction (mol.% O2) for the following designs: (a) Serpentine; (b) Baffle; (c) Turing; (d) Mixed. Inlet from right to left, except for the serpentine design, where it is from bottom to top.
Energies 18 02165 g007
Figure 8. Oxygen mass flow rate by area (kg/s) for the following designs: (a) Serpentine; (b) Baffle; (c) Turing; (d) Mixed. Inlet from right to left, except for the serpentine design, where it is from top to bottom.
Energies 18 02165 g008
Figure 9. Water activity in membrane for the following designs: (a) Serpentine; (b) Baffle; (c) Turing; (d) Mixed. Inlet from right to left, except for the serpentine design, where it is from bottom to top.
Energies 18 02165 g009
Figure 10. Channel water activity in the following designs: (a) serpentine; (b) Baffle; (c) Turing; (d) Mixed. Inlet from right to left, except for the serpentine design, where it is from bottom to top.
Energies 18 02165 g010
Figure 11. Pressure drops (Pa) in the following designs: (a) Serpentine; (b) Baffle; (c) Turing; (d) Mixed.
Energies 18 02165 g011
Figure 12. Polarization curves (A/m2) for the following designs: (a) Serpentine; (b) Baffle; (c) Turing; (d) Mixed.
Energies 18 02165 g012aEnergies 18 02165 g012b
Figure 13. Baffled mesh independence: (a) Normal mesh; (b) Finer mesh; (c) I-V curve for finer mesh; (d) I-V curve normal (blue) vs. finer (green) mesh.
Energies 18 02165 g013
Figure 14. Serpentine mesh independence: (a) Normal mesh; (b) Finer mesh; (c) I-V curve for finer mesh; (d) I-V curve normal (blue) vs. finer (green) mesh.
Energies 18 02165 g014aEnergies 18 02165 g014b
Figure 15. Turing and Mixed mesh independence: (a) Turing finer and extra-fine mesh, (b) Mixed finer and extra-fine mesh.
Energies 18 02165 g015
Table 1. Input data for the design models.
UnitValueDescription
μ10−3 kg/(m·s)Dynamic viscosity
k10−12 m2Permeability
ρ1000 kg/m3Density
εp0.5Porosity
-2.53 × 10⁻⁵ kg/sInlet flow rate
-0.55Forchheimer coefficient
Disclaimer/Publisher’s Note: The statements, opinions and data contained in all publications are solely those of the individual author(s) and contributor(s) and not of MDPI and/or the editor(s). MDPI and/or the editor(s) disclaim responsibility for any injury to people or property resulting from any ideas, methods, instructions or products referred to in the content.

