Article

Study on Purge Strategy of Hydrogen Supply System with Dual Ejectors for Fuel Cells

by
Yueming Liang
1,2 and
Changqing Du
1,2,*
1
Hubei Research Center for New Energy & Intelligent Connected Vehicle, Wuhan University of Technology, Wuhan 430070, China
2
Foshan Xianhu Laboratory of the Advanced Energy Science and Technology Guangdong Laboratory, Foshan 528000, China
*
Author to whom correspondence should be addressed.
Energies 2025, 18(9), 2168; https://doi.org/10.3390/en18092168
Submission received: 14 March 2025 / Revised: 15 April 2025 / Accepted: 22 April 2025 / Published: 23 April 2025
(This article belongs to the Special Issue Advances in Hydrogen Energy and Fuel Cell Technologies)

Abstract

:
The exhaust purge on the anode side is a critical step in the operation of fuel cell systems, and optimizing the exhaust interval time is essential for enhancing stack efficiency and hydrogen utilization. This paper proposed a method to determine the purge strategy of hydrogen supply system based on theoretical and simulation analysis. To investigate the impact of anode purge strategy on the performance of automotive fuel cells, a model of a 100 kW fuel cell stack and a dual-ejector hydrogen supply system was developed in MATLAB/Simulink(R2022b) using principles of fluid dynamics, simulation, and experimental data. This model effectively captures the accumulation and exhaust of hydrogen, nitrogen, and vapor within the anode. Simulations were conducted under seven different exhaust interval times at varying current densities to study the effect of exhaust interval on the performance of the fuel cell. The results indicate that for a 100 kW fuel cell, the exhaust interval time should be controlled within 25 s and should decrease as the current density increases. At low current density, increasing the exhaust interval has a more significant effect on improving hydrogen utilization. At high current density, reducing the exhaust interval helps maintain a stable hydrogen excess ratio and shortens the time required for the output voltage to reach a stable state.

1. Introduction

As global issues such as climate warming and environmental pollution continue to intensify, the demand for clean energy vehicles as alternatives to traditional fuel-powered vehicles has grown significantly. Proton exchange membrane fuel cells, as a hydrogen energy conversion device, has gained widespread attention due to their high power density, efficiency, and the fact that they only produce water during operation.
During the operation of a fuel cell system, an excess amount of hydrogen is supplied to the anode side, resulting in residual unreacted hydrogen in the exhausted gas. If the exhausted gas is directly discharged, it would significantly reduce hydrogen utilization efficiency and cause environmental pollution. Therefore, it is common practice to recirculate the exhausted gas back into the stack for further reaction. Common hydrogen recirculation modes include the hydrogen recirculation pump with a single ejector mode and the dual ejector mode [1]. Among these, the dual ejector mode, by replacing the recirculation pump, can further enhance the net power and efficiency of the fuel cell system. During the process of recirculating the gas, nitrogen from the air on the cathode side permeates through the proton exchange membrane and accumulates on the anode side, leading to a decrease in hydrogen concentration [2]. This may even result in the hydrogen concentration being insufficient to meet the required hydrogen excess ratio [3], thereby degrading the stack’s output performance. Therefore, it is necessary to develop an appropriate purge strategy to periodically expel the accumulated nitrogen on the anode side. While exhausting the gas, an excess amount of hydrogen is replenished to ensure the continuous and stable operation of the stack.
Previous studies have explored various purge strategies. For example, Wang et al. [4] compared the two basic purge strategies, voltage based and nitrogenous based, the results showed that the purge interval had a greater effect on the energy efficiency under the two purge modes. Due to the difficulty of the real-time nitrogen fraction measurement, the voltage-based purge is more recommended. Plooy et al. [5] introduced a dynamic purging control system where the purging cycle varied with load changes. The results demonstrated that dynamic purging saved hydrogen and improved stack efficiency compared to fixed-cycle purging. It was also noted that under dynamic load conditions, fixed-cycle purging strategies could lead to hydrogen starvation or excessive loss. Hu et al. [6] experimentally studied the accumulation of nitrogen and water in the anode side and found that higher current densities resulted in greater accumulation of nitrogen and liquid water. Steinberger et al. [7] introduced continuous and discontinuous purging strategies, triggered by the hydrogen sensor at the anode outlet. The experimental results show that the discontinuous purging strategy can be applied to the mixture with nitrogen content of 10 vol%, and the continuous purging strategy can be successfully operated at nitrogen content of up to 30%. Pei et al. [8] developed a lumped-parameter model for shutdown purging, proposed an MAP optimal purging strategy based on stack temperature, purging current, and initial membrane water content. Validation confirms that this strategy not only truncates the purging duration but also curtails the system energy expenditure.
The aforementioned research demonstrates, from multiple perspectives of simulation and experimentation, the importance of the anode gas purge strategy for the normal operation of the stack. It can be concluded that the optimal exhaust interval should vary with changes in load, as a fixed-cycle purge strategy cannot maintain the stack at its highest efficiency. However, existing studies lack quantitative analysis of the relationship between the exhaust interval and the performance of the fuel cell system. Through quantitative analysis during the simulation phase, reference data can be provided for the calibration of exhausting strategies, thereby reducing both time and cost expenditures for bench calibration experiments. For different fuel cell stacks, model parameters can be modified to accommodate their respective performance characteristics. This study focuses on a hydrogen supply system with dual ejectors for a 100 kW fuel cell, organized as follows: Section 1 obtains modeling parameters for the dual ejectors through CFD simulations. In Section 2, based on detailed parameters from a 100 kW fuel cell system test bench, an anode model of the fuel cell stack and hydrogen supply system is established. On the basis of previous models, the description of the transport process of nitrogen across the proton exchange membrane is added to this model, which can characterize the transmission and accumulation of hydrogen, nitrogen, and water vapor in the anode of the reactor [9] for exhaust simulation research. Section 3 analyzes both simulation results and bench calibration data to investigate the impact of purging intervals on stack performance, providing valuable references for determining optimal purging intervals and bench calibration procedures.

2. Computational Fluid Dynamics Simulation of Dual Ejector Performance

The dual ejector system is employed for the recirculation of anode exhausted gas, wherein the low-power ejector exhibits a higher entrainment ratio with a relatively smaller range of primary hydrogen flow rate. Conversely, the high-power ejector has a lower entrainment ratio but can provide a higher primary hydrogen flow rate. Switching between the two ejectors is based on the fuel cell output power and the primary hydrogen flow rate. To construct a model of the anode hydrogen supply system, it is necessary to obtain the performance parameters of the dual ejectors, including the entrainment ratio and primary pressure under different primary flow rates. Using experimental data as boundary conditions [10], computational fluid dynamics (CFD) simulations of the dual ejectors were conducted using the Fluent(2020R2) software.

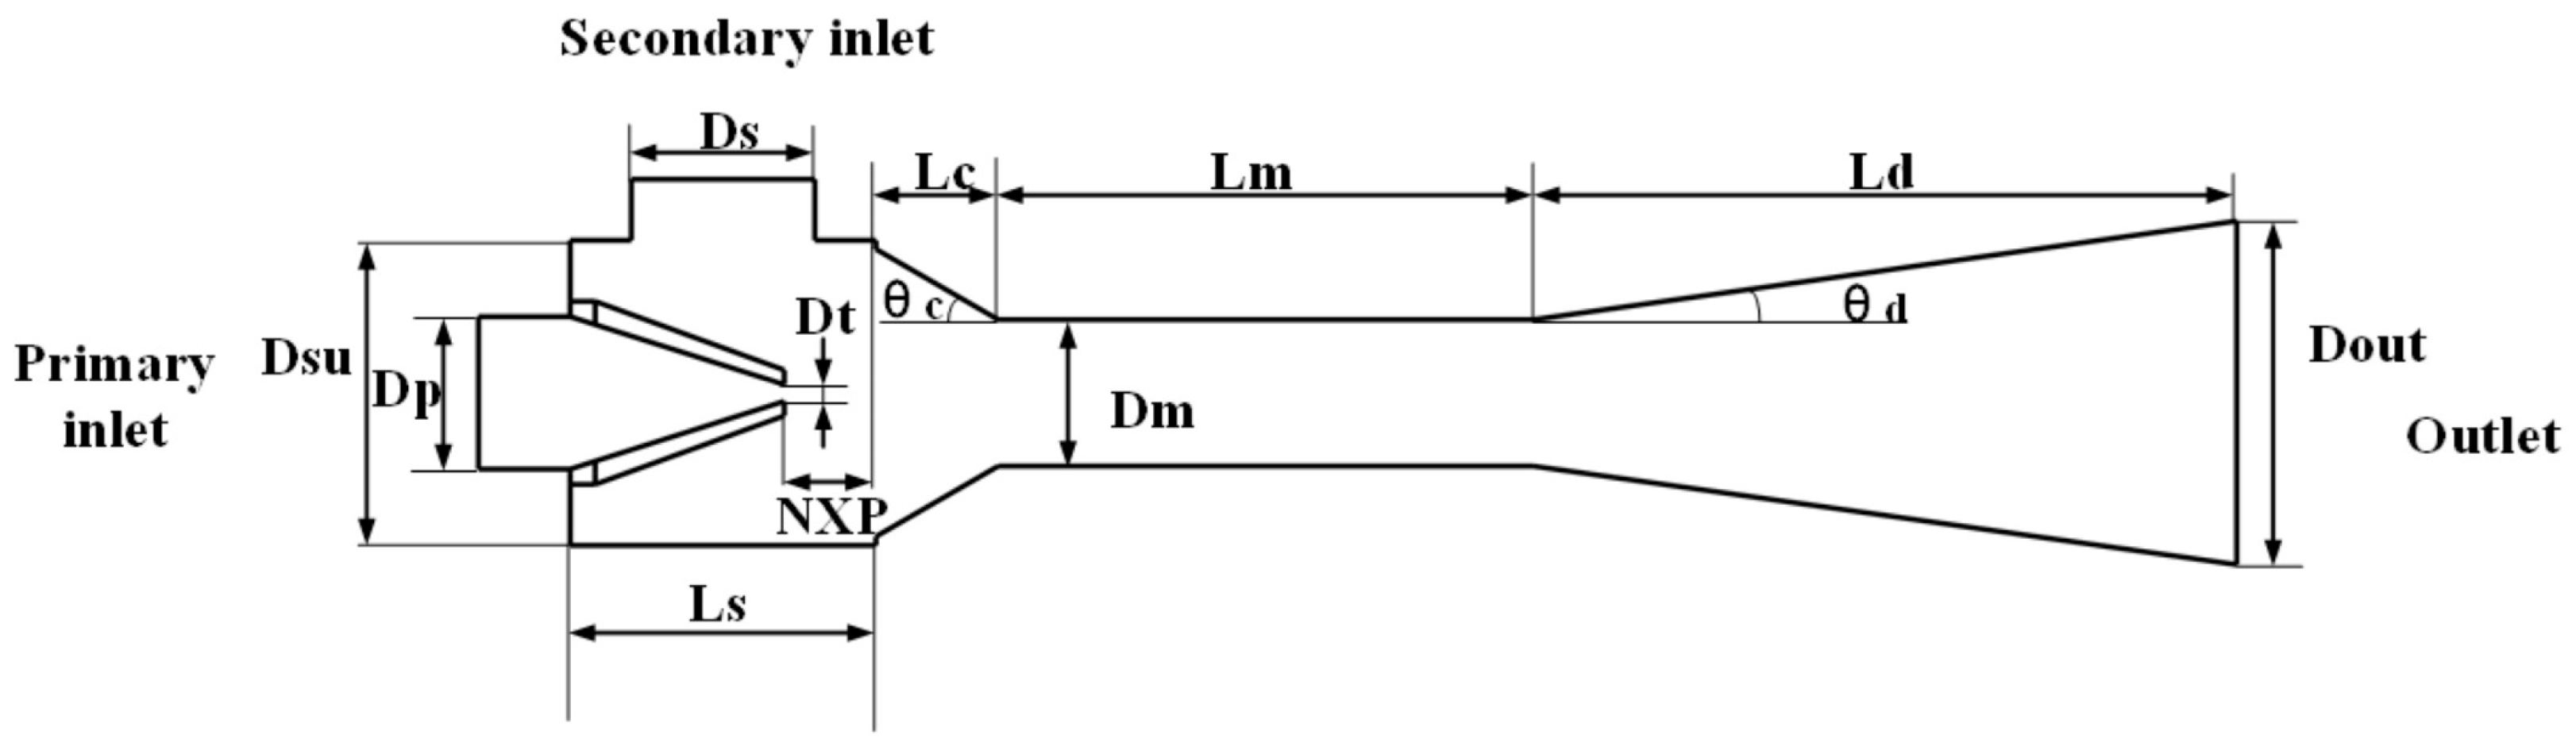
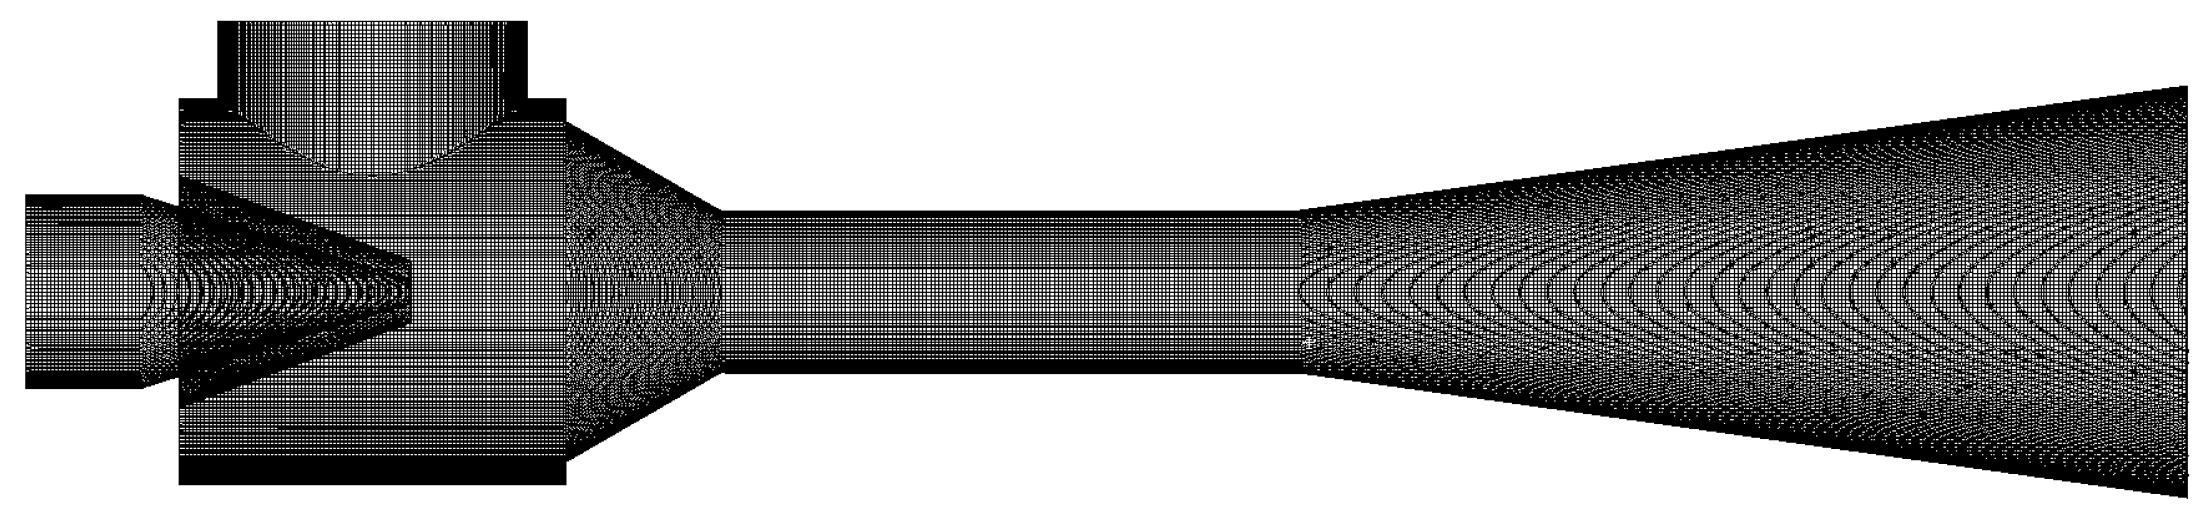
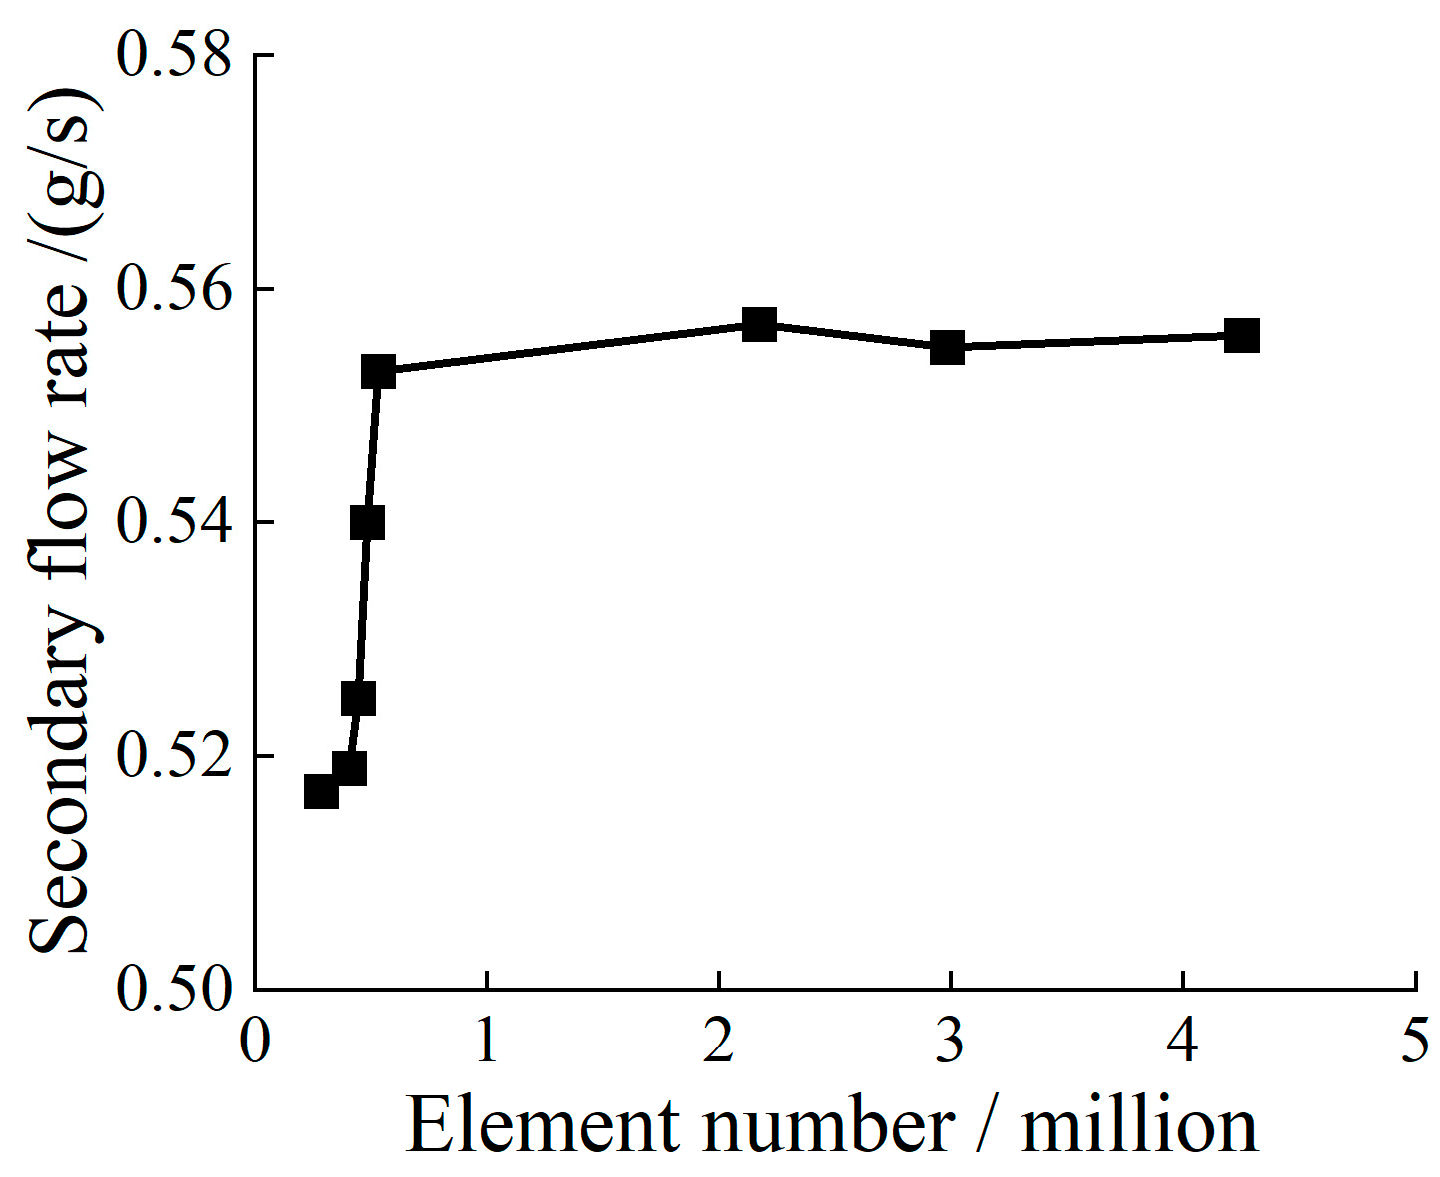
2.1. Finite Element Modeling of the Dual Ejectors

The three-dimensional model of the ejector was created using CATIA(V5 R20) software. A cross-sectional view of the ejector structure is shown in Figure 1, with dimensional parameters listed in Table 1.
The primary flow inlet was set as a mass flow inlet, with the inlet flow rate being the fresh hydrogen flow rate (i.e., the hydrogen flow rate consumed by the reaction) and a temperature of 300 K. The secondary flow inlet was set as a pressure inlet, with the inlet pressure being the experimentally measured anode outlet pressure of the fuel cell corresponding to the primary flow rate, and a temperature of 353 K, which is the operating temperature of the fuel cell. The outlet was set as a pressure outlet, with the pressure being the experimentally measured anode inlet pressure of the fuel cell corresponding to the primary flow rate, and a temperature of 353 K. The ejector model was meshed using a three-dimensional cartesian method with hexahedral elements. The resulting mesh model of the low-power ejector is shown in Figure 2. The high-power ejector shares a similar structure with the low-power ejector, differing only in the diameter of the primary flow inlet nozzle (Dt), as specified in Table 1. For this reason, only the schematic diagram of the low-power ejector model is presented in Figure 2. A grid independence test was conducted, and the results are shown in Figure 3. When the mesh size reached 0.2 mm, with a total of 2,173,621 elements, the simulation results stabilized. The error in the secondary flow rate compared to the model with 4,249,663 elements was only 0.18%, indicating that the simulation results were essentially unaffected by the number of mesh elements. Therefore, a mesh size of 0.2 mm was selected for the high-power ejector, ensuring that the number of elements exceeded 2 million.

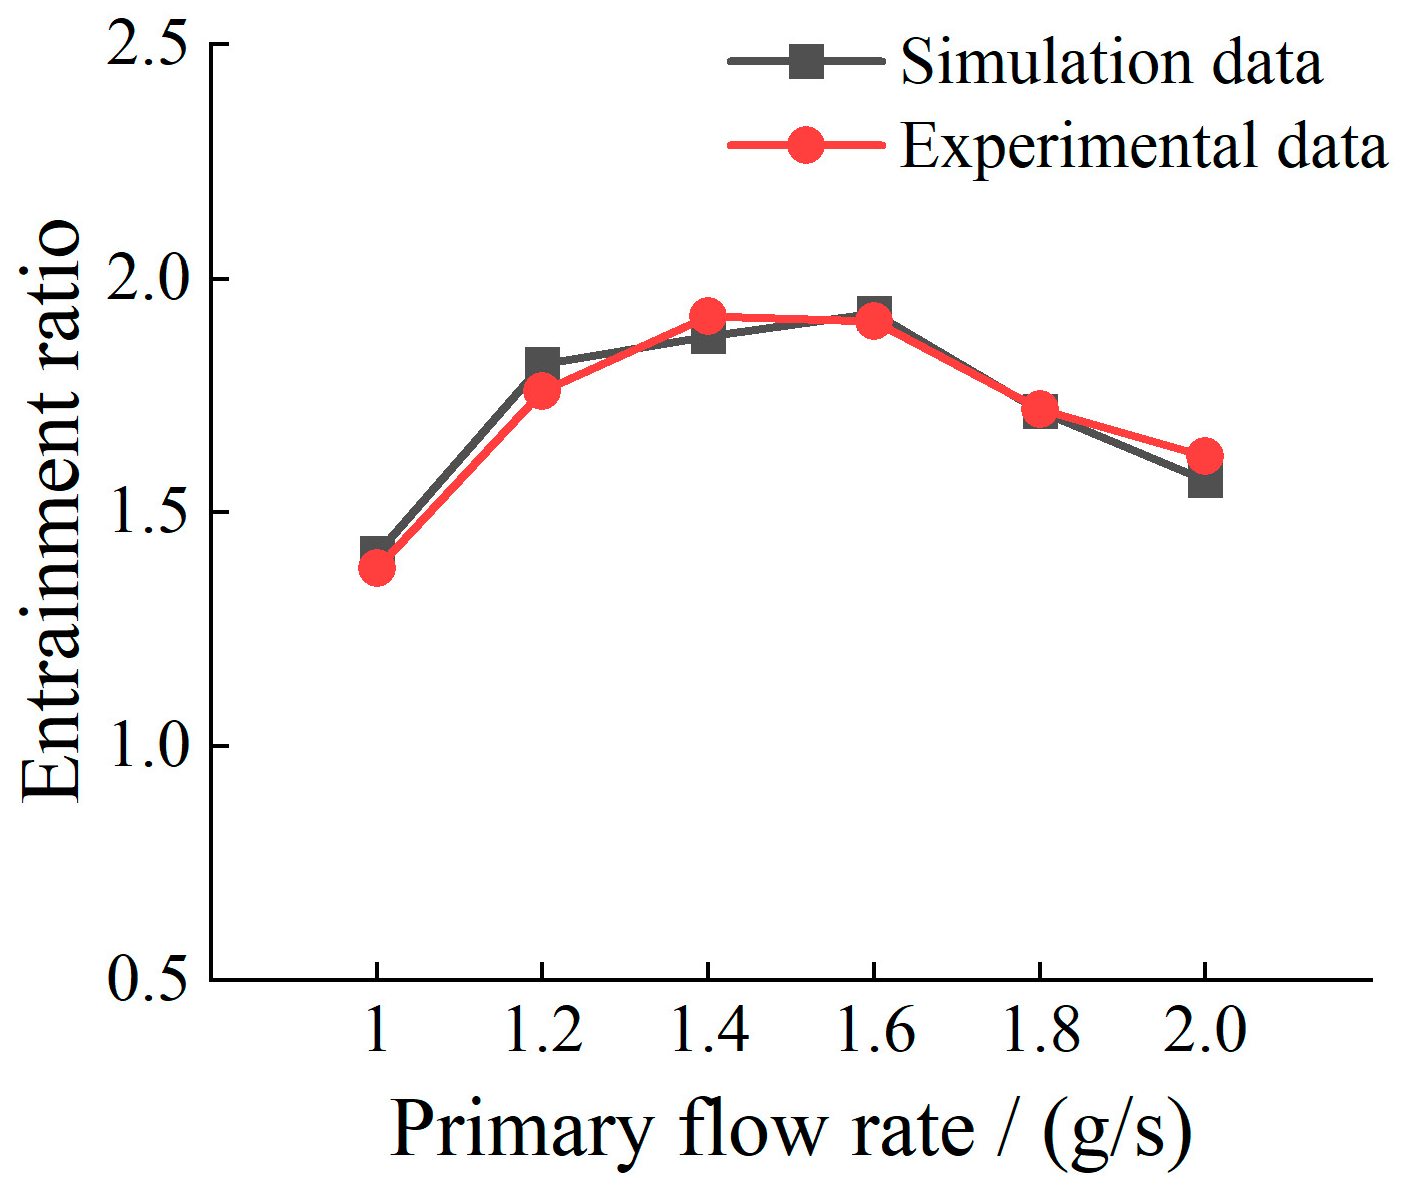
2.2. Validation with Experimental Data

Based on the dimensions of an ejector model used in the experiments in reference [11], a finite element model of the ejector was established using the method described in the previous section. The experimental conditions were used as boundary conditions for the CFD simulation of the ejector. A comparison between the simulation data and the experimental data are shown in Figure 4. The maximum error between the simulated and experimental entrainment ratios with various primary flow rates was less than 4%. This result demonstrates the high validity of the finite element model and simulation method, indicating that the performance parameters of the ejector can be accurately obtained through finite element simulation.

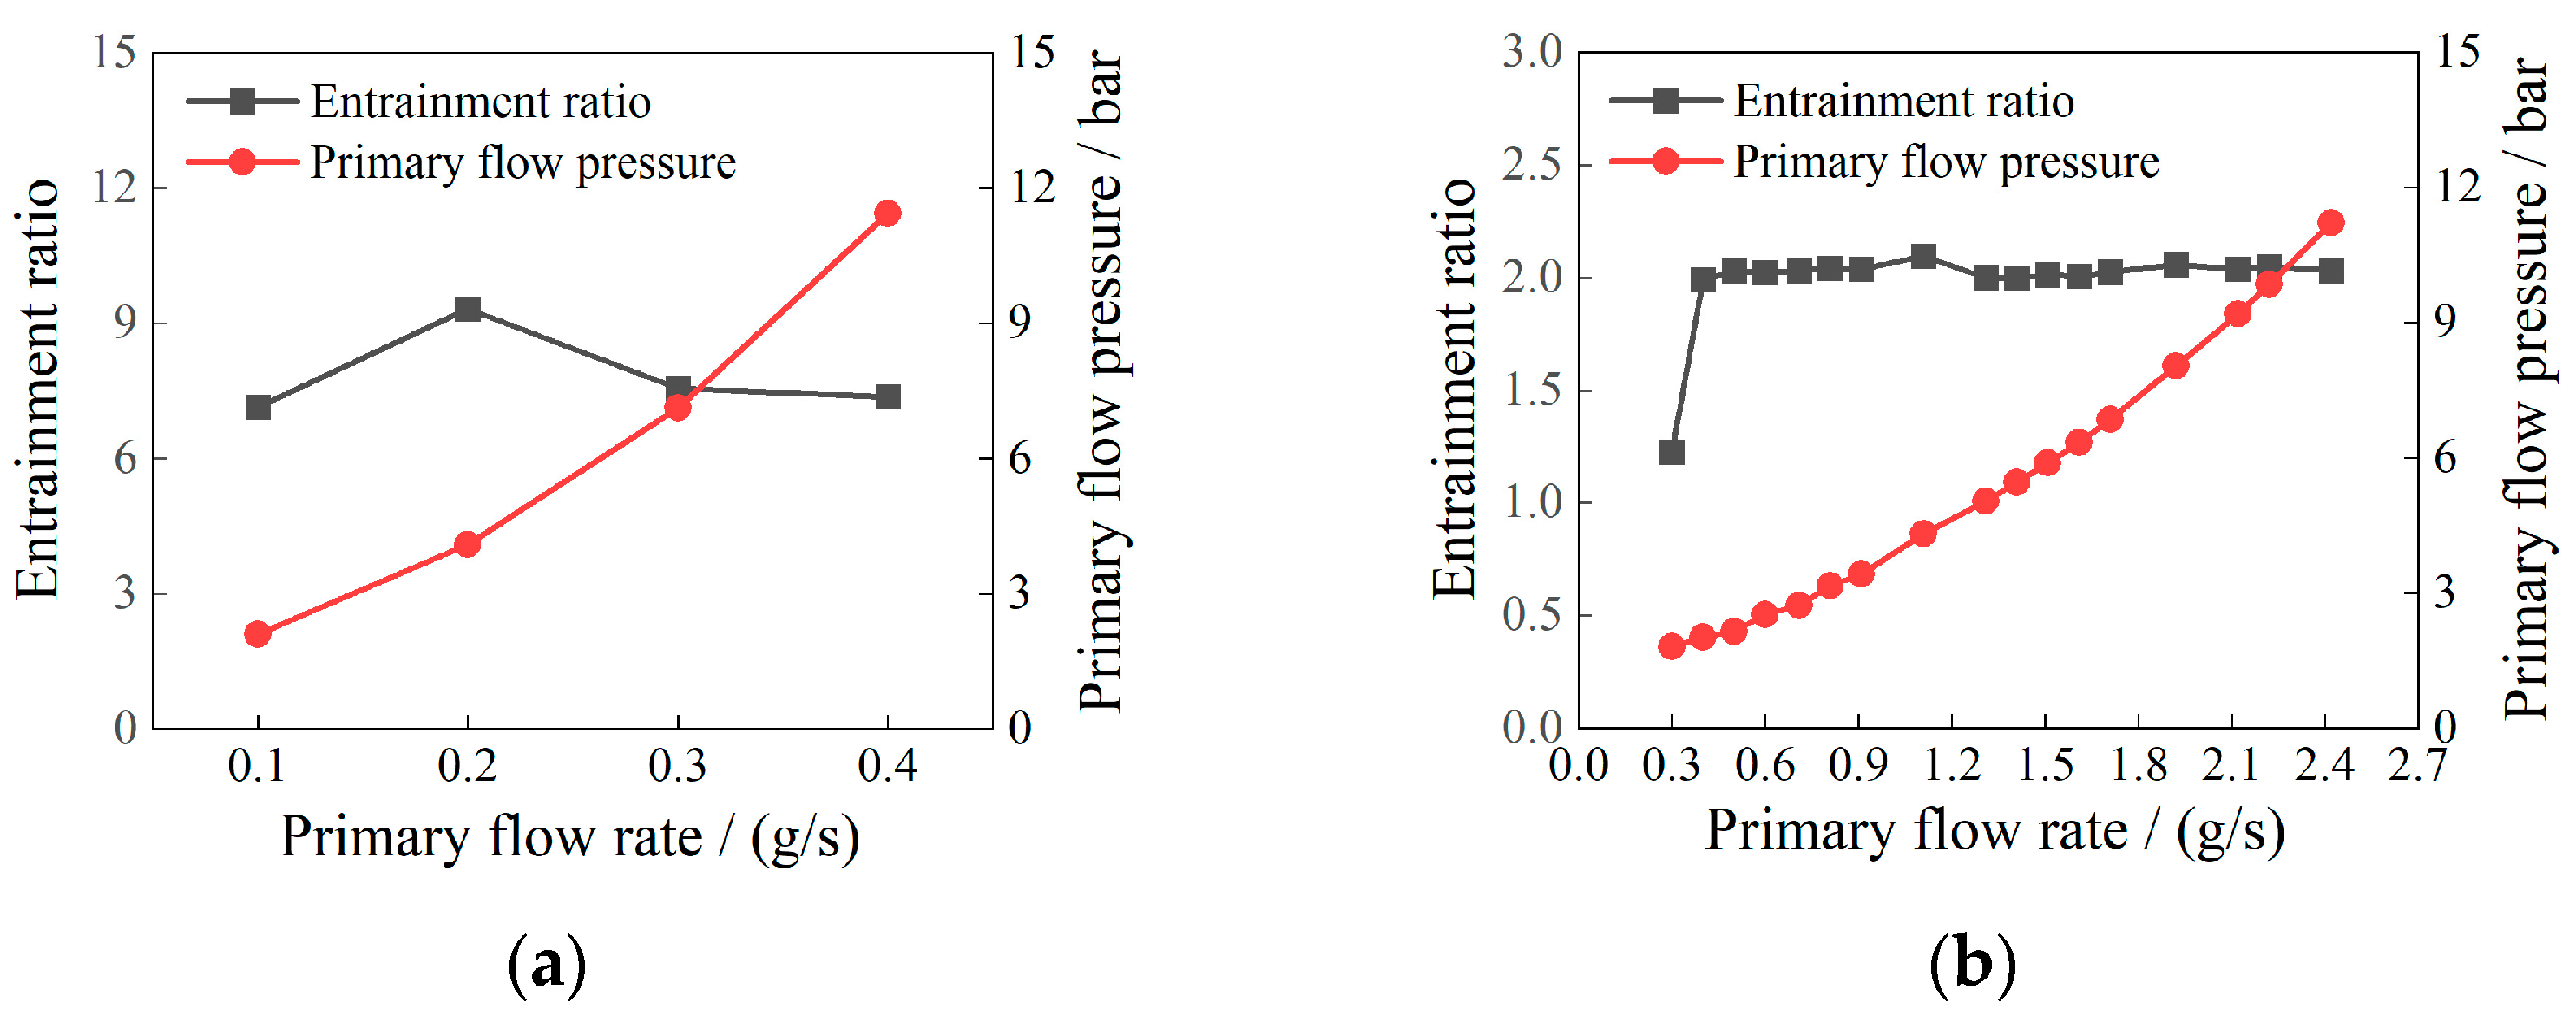
2.3. Dual Ejector Simulation Results

CFD simulations were conducted for both the high-power and low-power ejectors under corresponding operating conditions. The relationships between the entrainment ratio, primary flow pressure, and primary flow rate are shown in Figure 5. In Figure 5a, the low-power ejector exhibits an entrainment ratio of 7.133 at the minimum primary flow rate, which exceeds the requirements of the actual operating conditions. In Figure 5b, the high-power ejector shows an entrainment ratio of 1.266 at the minimum primary flow rate, which rapidly increases to above 2 as the primary flow rate increases. The maximum primary flow pressure for both ejectors is below 11.5 bar, meeting the design requirements. These simulation results were subsequently used to construct the dual ejector hydrogen supply system model.

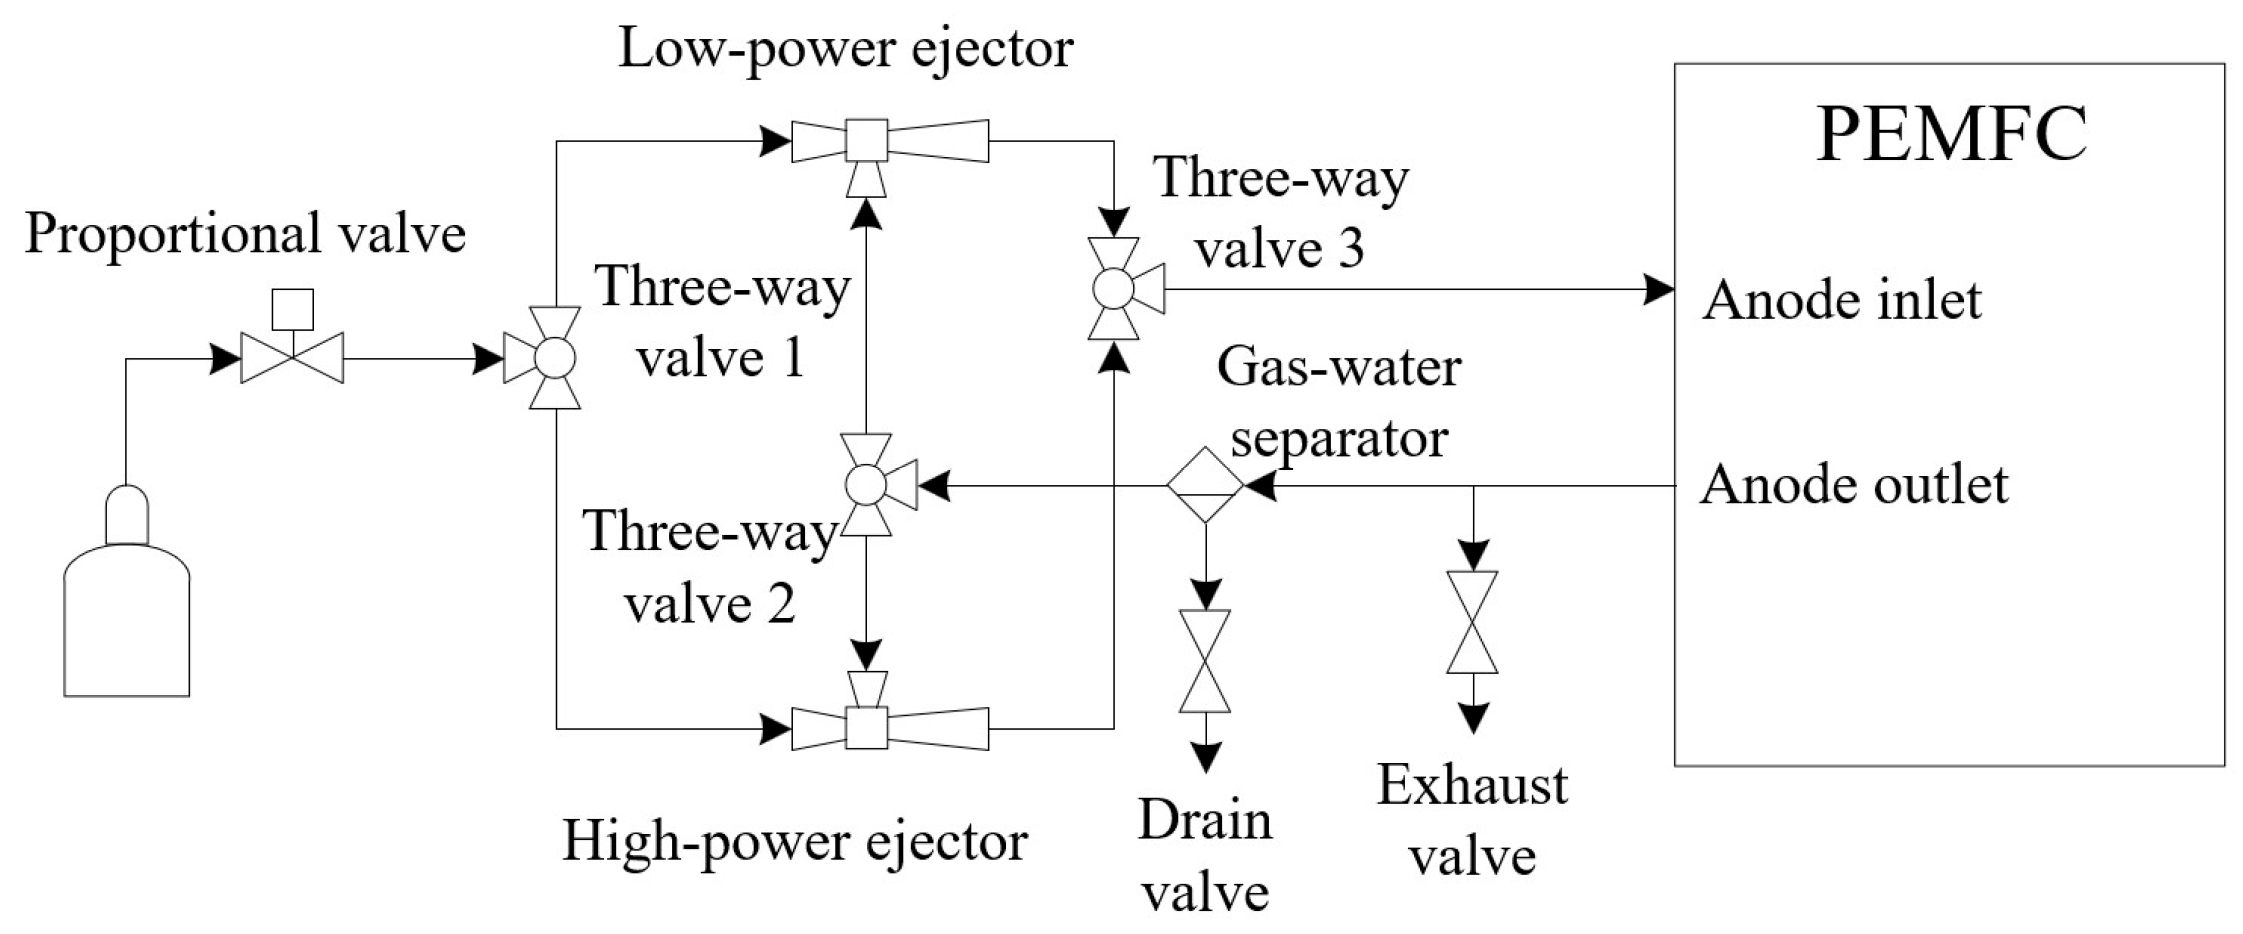
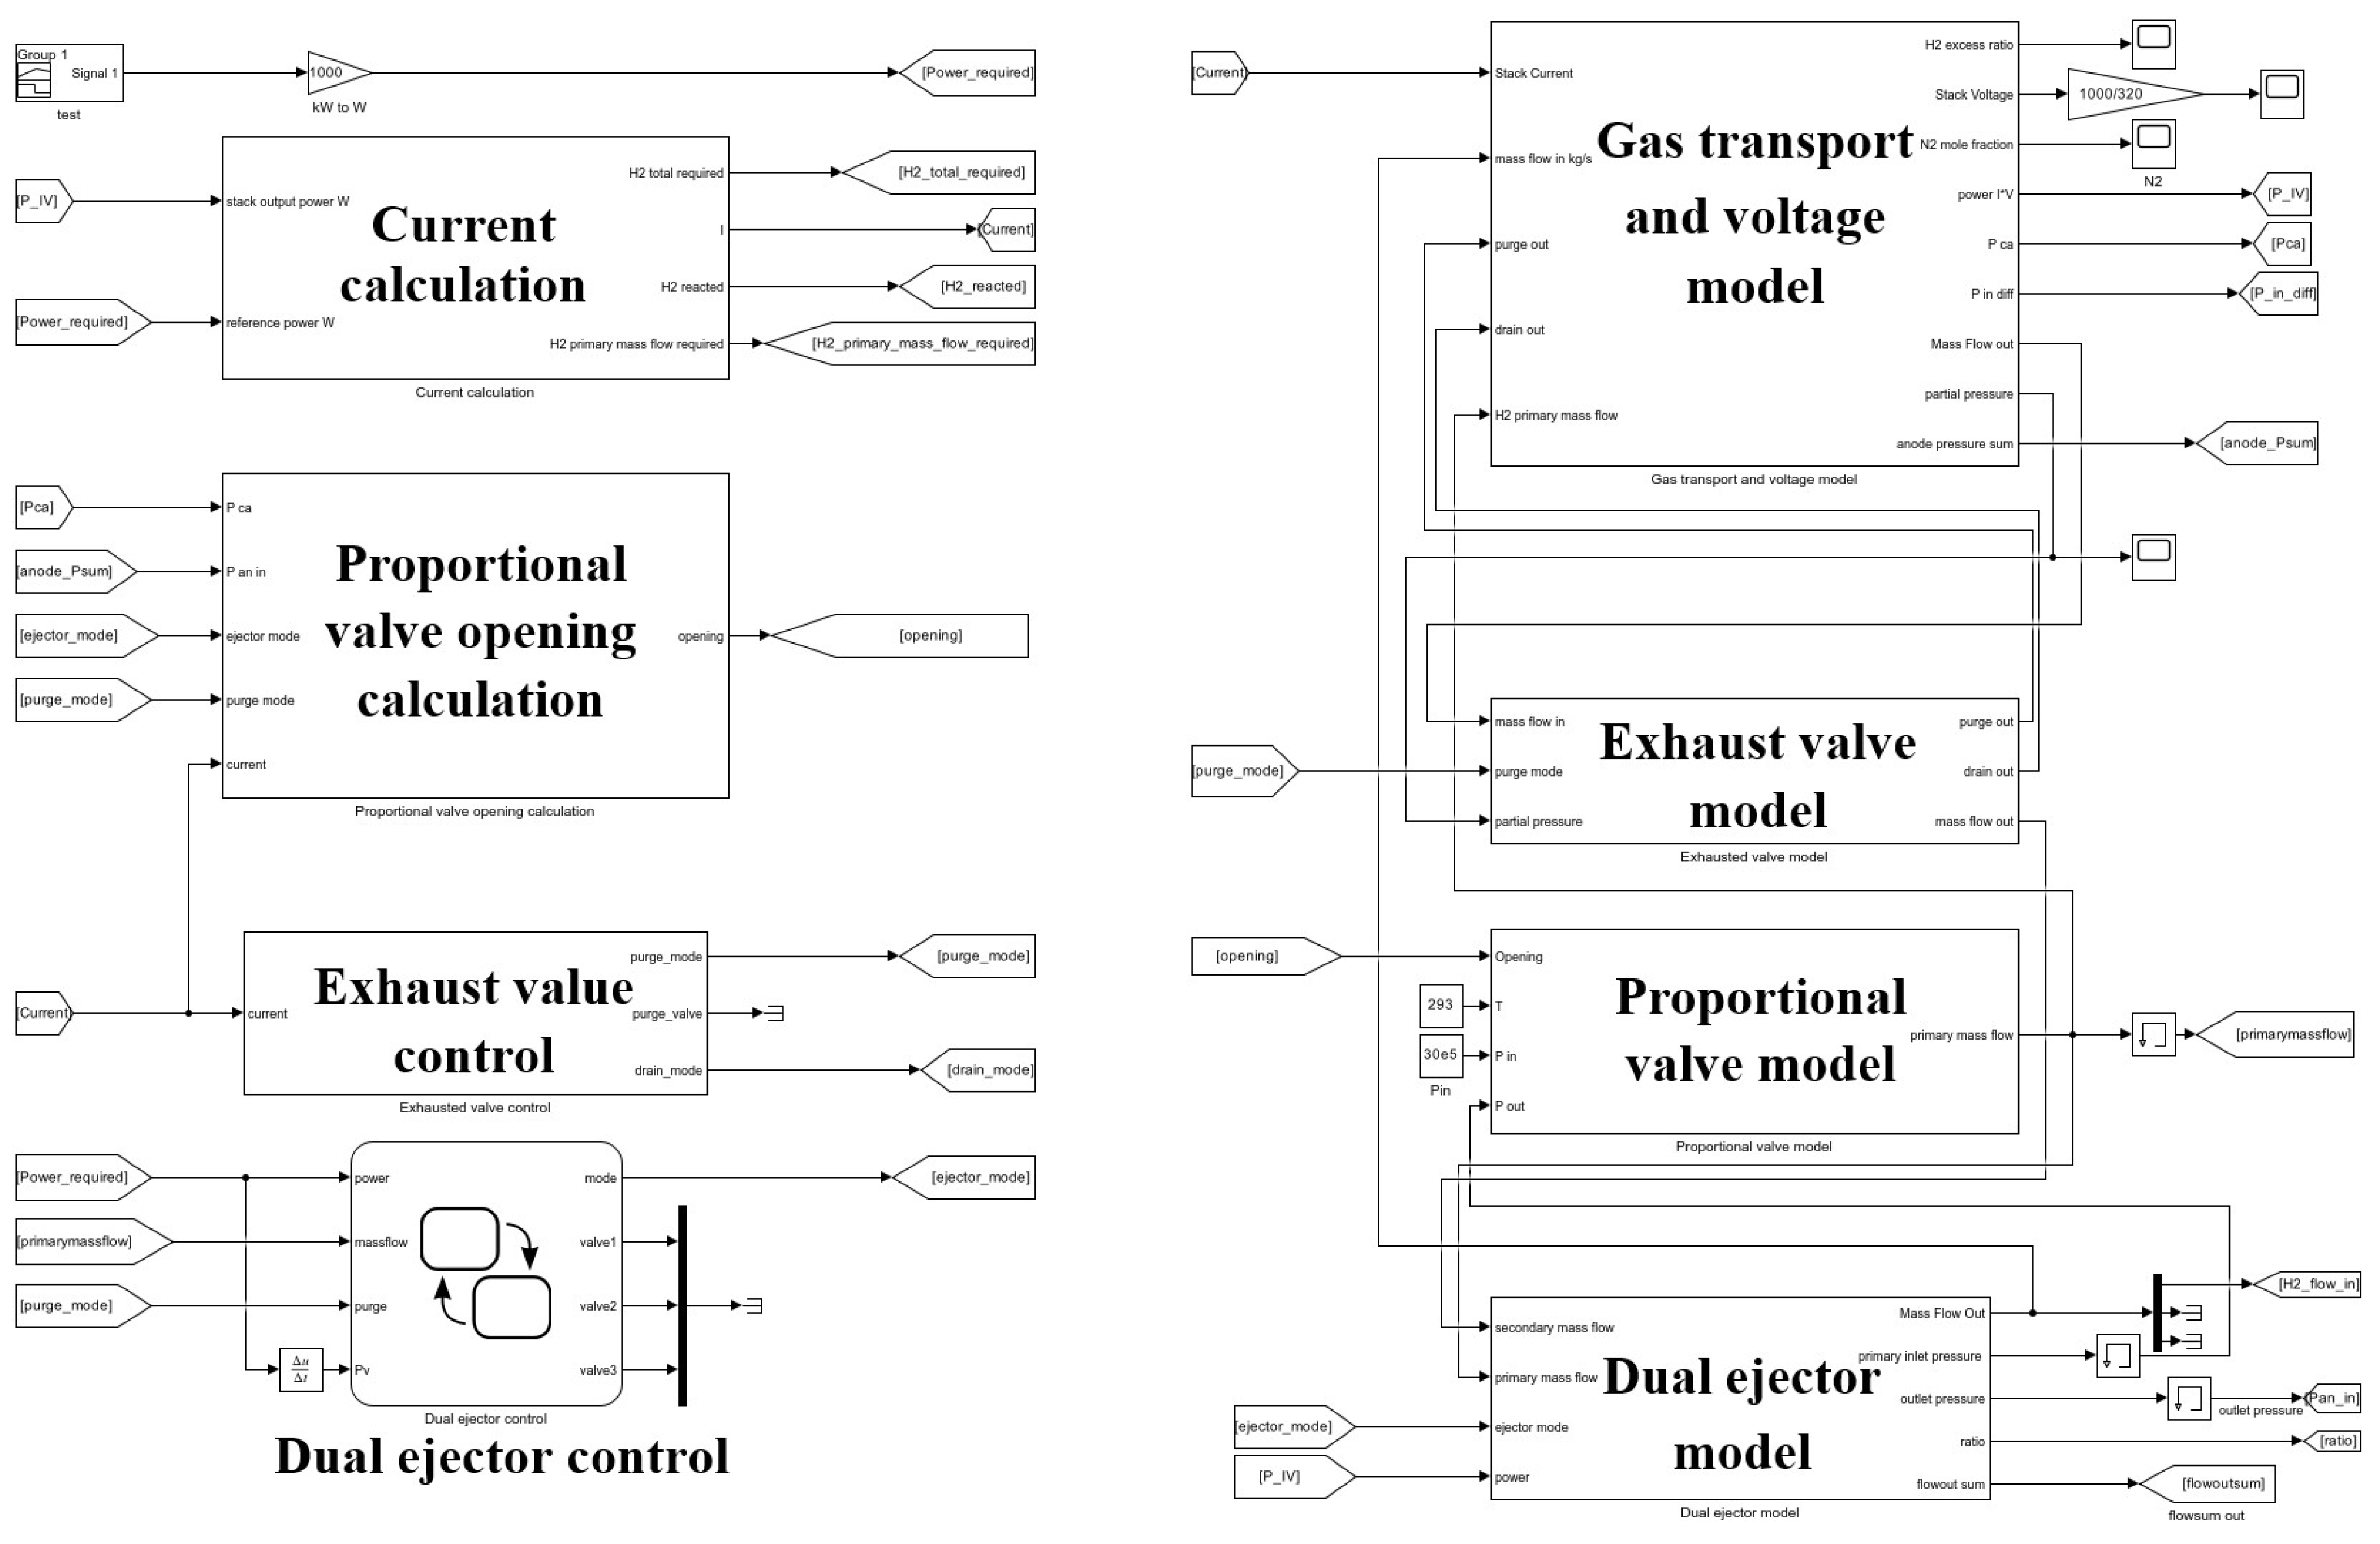
3. Modeling of the Fuel Cell Hydrogen Supply System

This paper models a 100 kW fuel cell system, with the hydrogen supply system consisting of a high-pressure gas cylinder, proportional valve, dual ejector, stack, exhaust valve, gas–water separator, and drain valve. Figure 6 shows its structure. The stack comprises 320 cells, each with an effective area of 304 cm2.
The cathode pressure in this model is obtained by the current–cathode intake pressure lookup table. The lookup table comes from the controller calibration value determined in the bench test to ensure that the system output power reaches the maximum under the corresponding current density. The anode pressure is the sum of the partial pressures of the gas components. The feedforward PID control is used to adjust the opening of the proportional valve model so that the anode pressure changes with the cathode inlet pressure and is 0.15 bar higher than the cathode inlet pressure [12].

3.1. Gas Transport Model

Since the gas flow in the fuel cell channels is laminar, the ideal gas equation of state can be used to describe the pressure dynamics of each gas component [13]. For hydrogen, the proportional valve supplies fresh hydrogen, and the exhaust valve removes partial hydrogen. The hydrogen partial pressure in the stack is given by Equation (1):
P H 2 = ( W p i , H 2 W r e a W H 2 , p u r g e   o u t ) × R H 2 × T V d t
where P H 2 is the hydrogen partial pressure in the stack; W p i , H 2 is the inlet hydrogen flow rate; W r e a is the hydrogen consumption rate due to the reaction; W H 2 , p u r g e o u t is the hydrogen flow rate removed by the exhaust valve; V is the anode channel volume; R H 2 is the gas constant for hydrogen; and T is the temperature. The inlet hydrogen flow rate is calculated using the proportional valve model, and the hydrogen consumption rate is calculated based on the real-time current using Equation (2) [14]:
W r e a = I × M H 2 × n 2 F
where I is the current; M H 2 is the molar mass of hydrogen; n is the number of cells in the stack; and F is Faraday’s constant.
For nitrogen, the nitrogen in the anode comes from the cathode through membrane permeation, and the exhaust valve removes partial nitrogen. The nitrogen partial pressure in the stack is given by Equation (3):
P N 2 = ( W N 2 C A W N 2 , p u r g e   o u t ) × R N 2 × T V d t
where P N 2 is the nitrogen partial pressure in the stack; W N 2 C A is the nitrogen flow rate permeating from the cathode to the anode; and W N 2 , p u r g e o u t is the nitrogen flow rate removed by the exhaust valve. The nitrogen permeation rate is influenced by the pressure difference between the anode and cathode nitrogen partial pressure, temperature, and humidity, as described by Equations (4) and (5):
W N 2 C A = k N 2 × P c a × 1 φ O 2 P N 2 d m e m × S f × M N 2 × n
k N 2 = k N 2 0 × exp E N 2 R T
where k N 2 is the nitrogen permeation coefficient; P c a is the cathode pressure, φ O 2 is the oxygen volume fraction in air; M N 2 is the molar mass of nitrogen; S f is the effective area of a single cell; d m e m is the membrane thickness; k N 2 0 is the nitrogen maximum permeability coefficient; E N 2 is the nitrogen permeate activation energy; the above two are related to relative humidity and obtained by test [15]. R is the universal gas constant.
For water vapor, the water vapor in the cathode permeates to the anode, and the exhaust valve removes partial water vapor. Assuming the gas-water separator converts water vapor into liquid water at a certain ratio, which is then removed by the drain valve, the water vapor partial pressure in the stack is given by Equation (6) [16]:
P H 2 O = ( W H 2 O C A W H 2 O , p u r g e   o u t W H 2 O , d r a i n   o u t ) × R H 2 O × T V d t
where P H 2 O is the water vapor partial pressure in the stack; W H 2 O C A is the water vapor flow rate permeating from the cathode to the anode; W H 2 O , p u r g e o u t is the water vapor flow rate removed by the exhaust valve; and W H 2 O , d r a i n o u t is the water vapor flow rate removed by the gas–water separator. The water vapor permeation rate is calculated using Equation (7) [17]:
W H 2 O C A = W H 2 O , d i f f W H 2 O , d r a g
where W H 2 O , d i f f is the water vapor flow rate due to concentration gradient diffusion, and W H 2 O , d r a g is the water vapor flow rate due to electro-osmotic drag. These are calculated using Equations (8) and (9) [18]:
W H 2 O , d r a g = n d × I × M H 2 O × n F
W H 2 O , d i f f = D w × C v , c a C v , a n × S f × M H 2 O × n d m e m
In the equation, n d represents the electro-osmotic drag coefficient, which is related to the membrane hydration level; M H 2 O is the molar mass of water vapor; D w is the water diffusion coefficient, which depends on the membrane hydration level and temperature; and C v , c a and C v , a n are the water concentrations on the cathode and anode surfaces of the membrane, respectively.

3.2. Exhaust Valve Model

The mass flow rate through the exhaust valve is calculated using Equation (10), which depends on the pressure difference across the valve:
W p u r g e , o u t = k × S p P H 2 + P N 2 + P H 2 O P 0
where k is the equivalent nozzle coefficient of the exhaust valve, which depends on the valve diameter. In this system, a 4 mm diameter exhaust valve is used, and its equivalent nozzle coefficient is determined experimentally. The relationship between exhaust valve flow rate and pressure difference is shown in Figure 7.
The flow rates of the three gas components (hydrogen, nitrogen, and water vapor) through the exhaust valve are proportional to their partial volumes, as given by Equations (11)–(13):
W H 2 O , p u r g e   o u t = P H 2 O × ρ H 2 O P H 2 × ρ H 2 + P N 2 × ρ N 2 + P H 2 O × ρ H 2 O × W p u r g e , o u t
W N 2 , p u r g e   o u t = P N 2 × ρ N 2 P H 2 × ρ H 2 + P N 2 × ρ N 2 + P H 2 O × ρ H 2 O × W p u r g e , o u t
W H 2 , p u r g e   o u t = P H 2 × ρ H 2 P H 2 × ρ H 2 + P N 2 × ρ N 2 + P H 2 O × ρ H 2 O × W p u r g e , o u t

3.3. Proportional Valve Model

The mass flow rate through the proportional valve is calculated based on the pressure difference across the valve and the valve opening, as given by Equation (14):
W p i , H 2 = P i n × k o p e n × k v × C 2 ρ H 2 × T , P o u t < 1 2 P i n P o u t × P i n P o u t × k o p e n × k v × C 1 ρ H 2 × T , P o u t < 1 2 P i n
In the equation, W p i , H 2 represents the primary hydrogen flow rate through the proportional valve; P i n is the pressure at the front end of the proportional valve; P o u t is the pressure at the rear end of the proportional valve; k o p e n is the opening proportion of the proportional valve; k v is the flow coefficient of the proportional valve; ρ H 2 is the density of hydrogen; T is the ambient temperature; and C 1 and C 2 are constants.

3.4. Dual Ejector Model

We generated the primary flow rate-entrainment ratio map and primary flow rate-primary flow pressure map based on the data from the dual ejector CFD simulation results in Section 2.3 and established the flow-pressure model of the dual ejector accordingly. This model determines the primary flow pressure (pressure at the rear end of the proportional valve) and maximum entrainment ratio by referencing simulation data maps based on the input primary flow rate, then calculates the ejector outlet flow rate using this maximum entrainment ratio and the actual secondary flow rate input [19].

3.5. Stack Voltage Model

The output voltage of a PEM fuel cell is affected by three main losses: activation loss, ohmic loss, and concentration loss. Therefore, the actual output voltage of the stack can be expressed as the theoretical thermodynamic voltage minus these three losses [20], as given by Equation (15):
V = n × ( E n e r n s t E a c t E o h m i c E c o n )
where E n e r n s t is the theoretical thermodynamic voltage of a single cell; E a c t is the activation polarization loss; E o h m i c is the ohmic polarization loss; and E c o n is the concentration polarization loss.
The above models are implemented in MATLAB/Simulink, and the hydrogen supply system model for the fuel cell anode is constructed, as shown in Figure 8.

4. Simulation of Exhaust Characteristics in the Fuel Cell Hydrogen Supply System

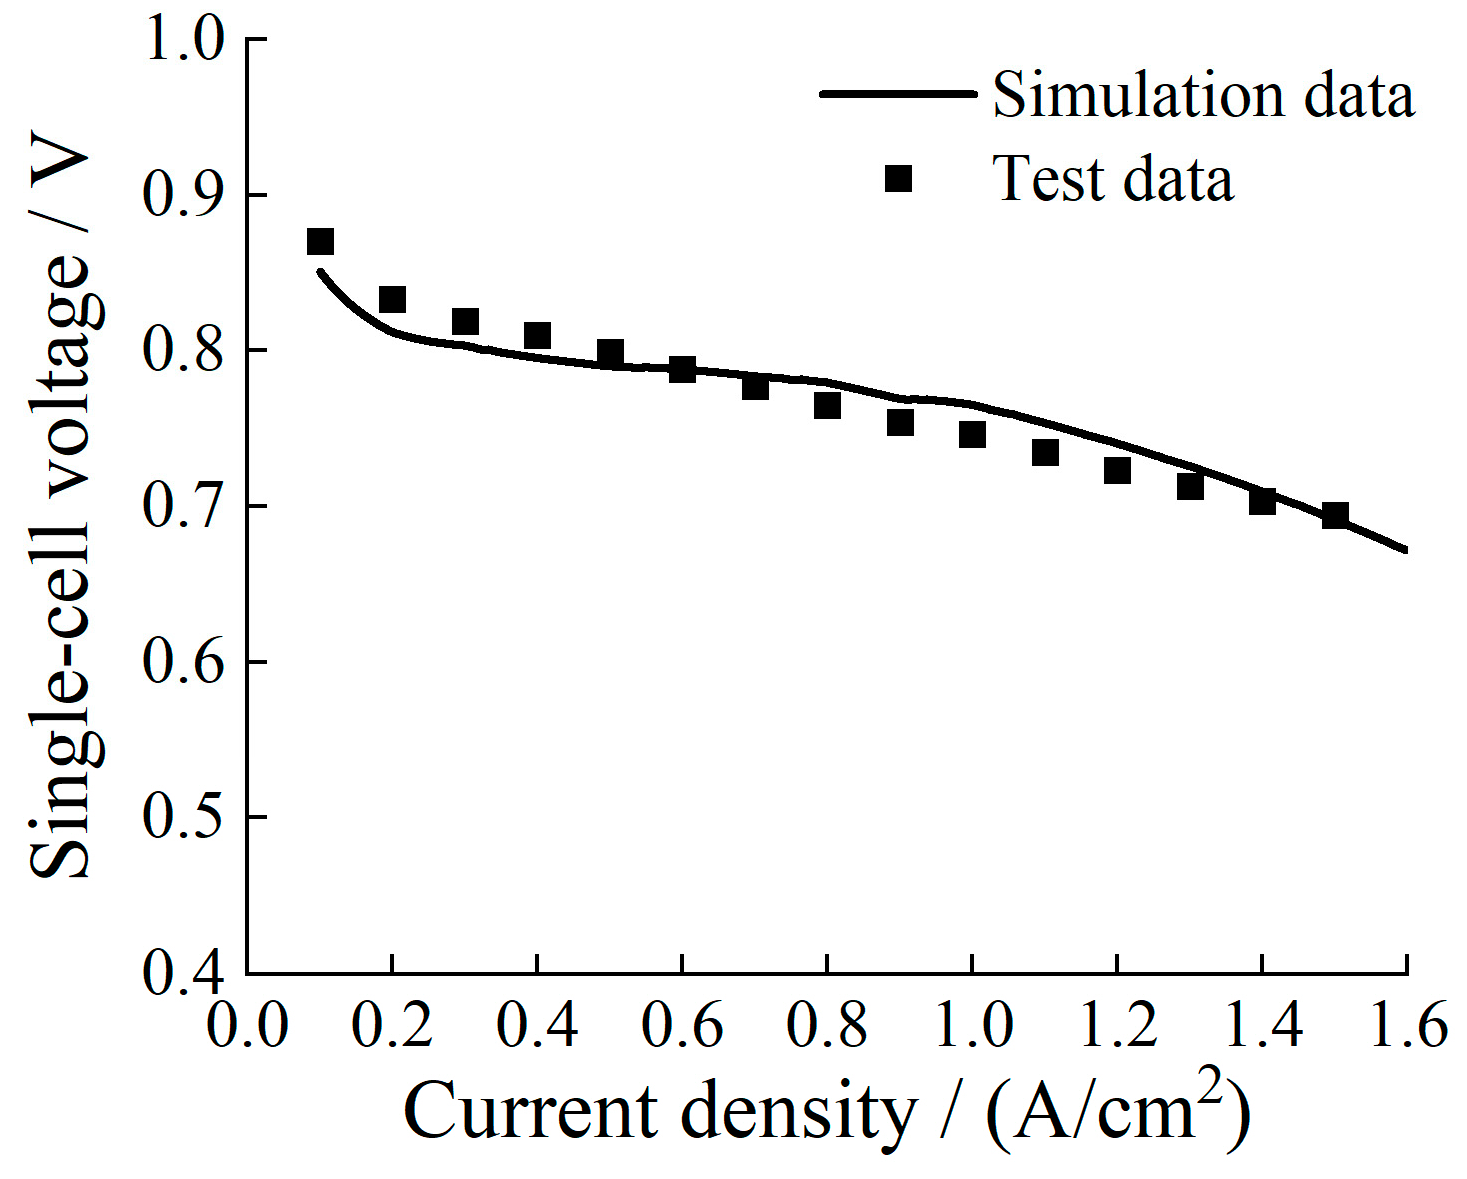
4.1. Model Validation

On the test bench, we conducted a steady-state polarization curve test to evaluate the performance of the 100 kW fuel cell system under various current densities. We replicated the same conditions in the simulation model, matching the test parameters such as stack temperature, inlet humidity, and cathode inlet pressure. The simulated polarization curve was compared with the experimental results, as shown in Figure 9. The maximum error was within 2.5%, indicating that the model meets the required simulation accuracy.

4.2. Simulation Scheme of Exhaust Interval Time Under Different Current Densities

An exhaust cycle consists of the exhaust time (exhaust valve open) and the exhaust interval time (exhaust valve closed). As shown in Table 2, seven exhaust combinations were simulated, with exhaust times of 1 s and interval times of 2.5 s, 5 s, 15 s, 25 s, 50 s, 75 s, and 100 s. The simulations were conducted at current densities of 0.3, 0.6, 0.9, 1.2, 1.5, and 1.8 A/cm2, with each current density running for 30 min. To reduce the impact of frequent exhaust on pressure fluctuations, the 1 s exhaust time, and 2.5 s interval time combination was replaced with a 2 s exhaust time and 5 s interval time combination. The simulation results showed that the two combinations had similar performance, confirming that the replacement did not affect the results. The single-cell voltage, nitrogen partial pressure, hydrogen excess coefficient, hydrogen reaction rate, and hydrogen consumption rate were recorded after the voltage stabilized. The corresponding hydrogen utilization rate, stack efficiency, and net output power were calculated to analyze the trends and determine the optimal exhaust interval time for each current density.

5. Results and Analysis

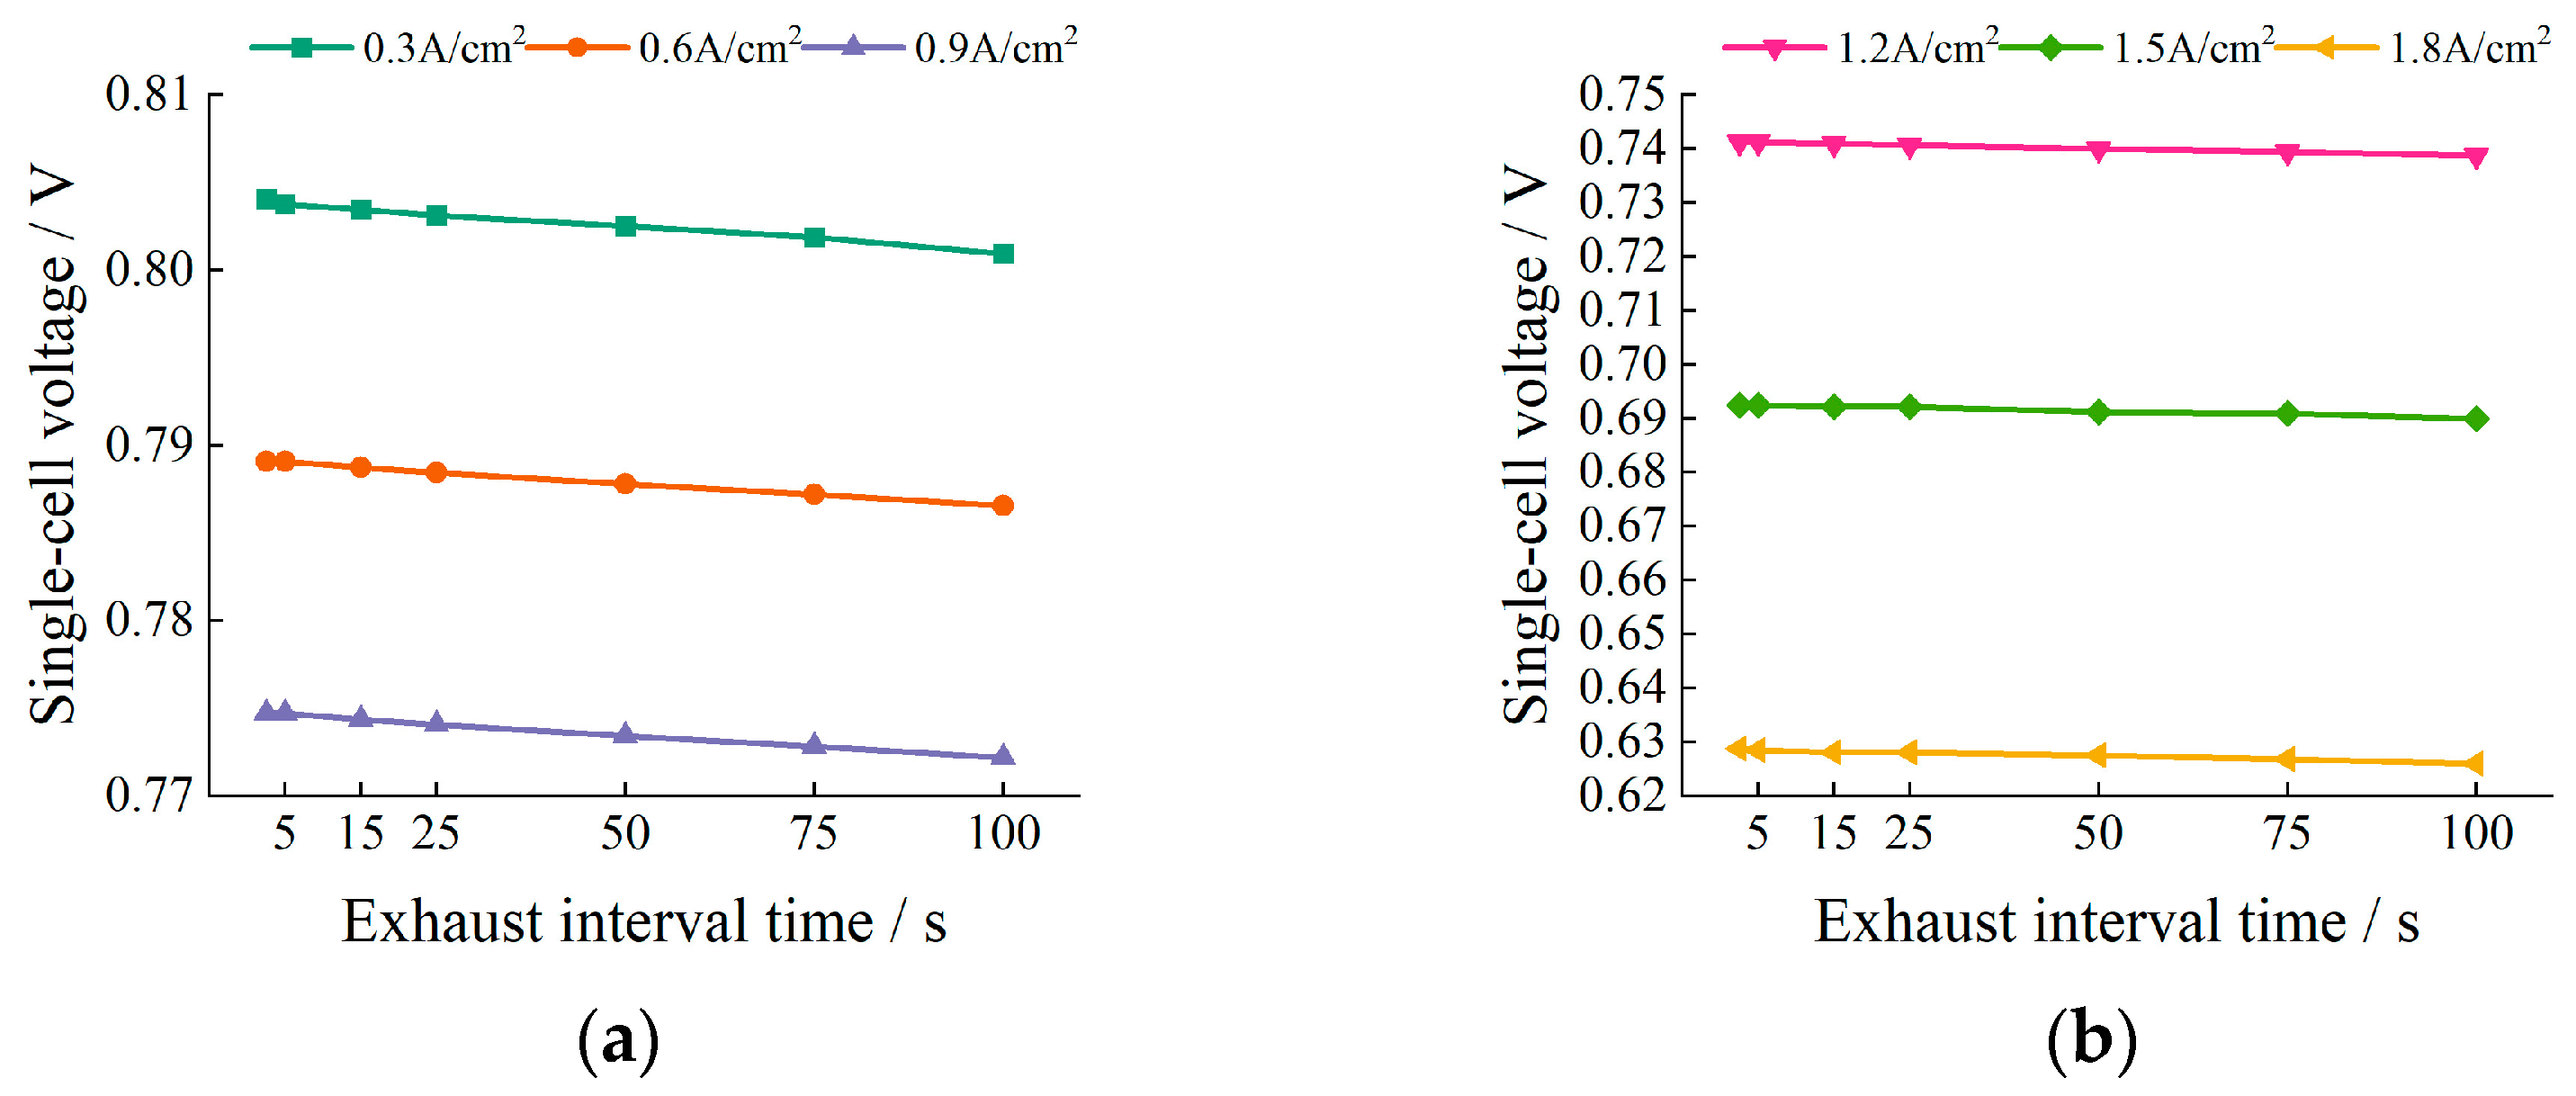
5.1. Impact of Exhaust Interval Time on Voltage

Figure 10 shows the single-cell voltage at different exhaust interval times. The single-cell voltage increases as the exhaust interval time decreases. When the exhaust interval time is shortened from 100 s to 5 s, the single-cell voltage increases by 2.5~2.8 mV. This is because during exhaust, nitrogen is partly removed, and the proportional valve supplies excess hydrogen to maintain stack pressure stability, resulting in a decrease in nitrogen partial pressure and an increase in hydrogen partial pressure. The shorter the exhaust interval time, the more pronounced this effect. When the exhaust interval is shortened from 25 s to 5 s, the nitrogen partial pressure decreases by 75.2~76.5% under different current densities. According to the theoretical fuel cell voltage equation Equation (16) [21], the theoretical voltage of a single fuel cell increases with hydrogen partial pressure. Therefore, increasing the exhaust frequency can increase the single-cell voltage at the same current density, thereby improving the net output power of the stack.
E n e r n s t = G 0 2 F + S 2 F T T 0 + R T 2 F l n P H 2 P a t m + 1 2 l n P c a × φ O 2 P a t m
where G 0 is the Gibbs free energy; S is the standard molar entropy; and T 0 is the reference temperature.

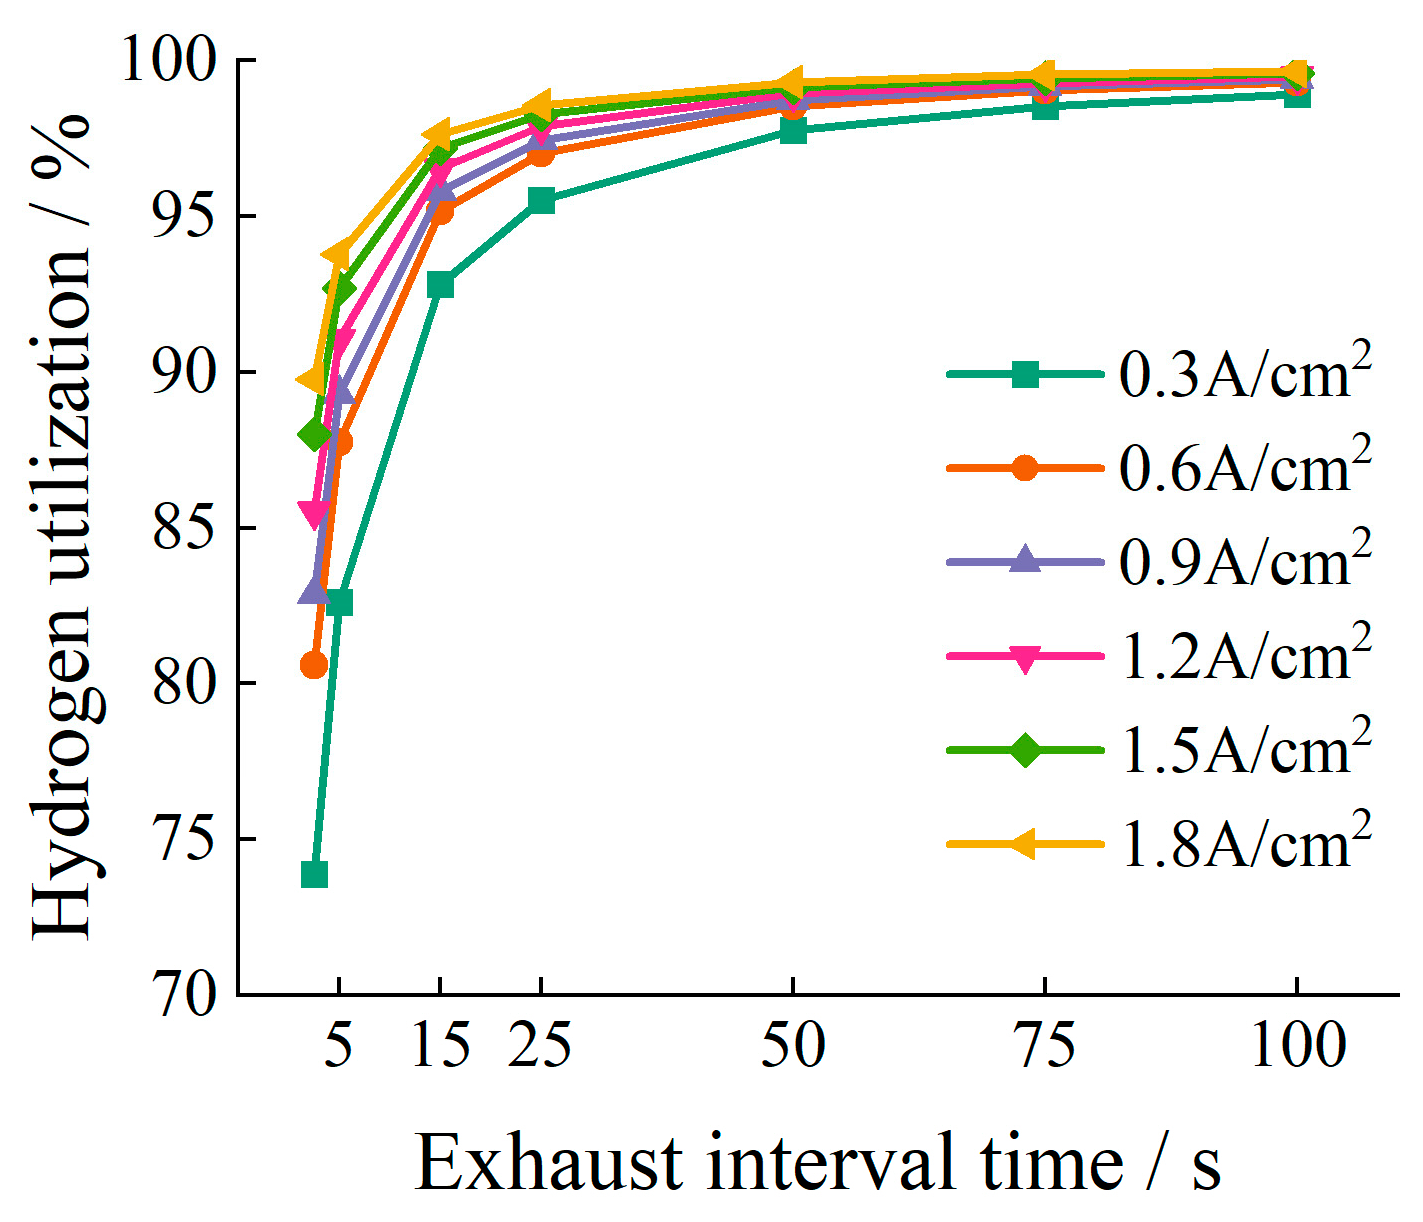
5.2. Impact of Exhaust Interval Time on Hydrogen Utilization

Figure 11 shows the hydrogen utilization rate at different exhaust interval times. The results indicate that at the same current density, the longer the exhaust interval time, the higher the hydrogen utilization rate. This is because during exhaust, some unreacted hydrogen is removed along with nitrogen. The more frequent the exhaust, the greater the loss of unreacted hydrogen, leading to a lower hydrogen utilization rate [22]. Additionally, the effect of extending the exhaust interval time on hydrogen utilization is more significant at low current densities than at high current densities. When the exhaust interval is extended from 5 s to 25 s, the hydrogen utilization rate increases by 15.6% at the current density of 0.3 A/cm2, while the hydrogen utilization rate increases by only 6.1% at the current density of 1.8 A/cm2. Therefore, it is recommended to extend the exhaust interval time at low current densities to improve hydrogen utilization.

5.3. Impact of Exhaust Interval Time on Stack Efficiency

The stack efficiency is calculated by Equation (17), which is the ratio of the total electrical energy output to the total heat value of the supplied hydrogen. The stack efficiency is influenced by both the net output power and the hydrogen utilization rate [23].
η = P d t m ˙ H 2 d t × Q H 2 l o w
where P is the stack output power in watts; m ˙ H 2 is the mass flow rate of hydrogen through the proportional valve; and Q H 2 l o w is the low heating value of hydrogen. Figure 12 shows the stack efficiency at different current densities and exhaust interval times. The results show that when the exhaust interval time is less than 25 s, the stack efficiency increases significantly with longer exhaust interval times at all current densities, with the effect being more pronounced at lower current densities. This is because in this region, extending the exhaust interval time significantly improves hydrogen utilization while having a smaller impact on the stack output power, resulting in higher stack efficiency. When the exhaust interval time exceeds 25 s, further extending the interval time leads to a slight increase followed by a slight decrease in stack efficiency. This is because in this region, the improvement in hydrogen utilization by extending the exhaust interval time is limited, while the single-cell voltage and output power decrease, leading to a gradual decline in stack efficiency after reaching a maximum. Additionally, the optimal exhaust interval time for maximum stack efficiency decreases as the current density increases. Therefore, it is recommended to extend the exhaust interval time as much as possible within the range of less than 25 s to improve stack efficiency.

5.4. Impact of Exhaust Interval Time on Hydrogen Excess Coefficient

A sufficient hydrogen excess coefficient is necessary for stable and complete reactions. The hydrogen excess coefficient is calculated as the ratio of the consumed hydrogen flow rate to the supplied hydrogen flow rate. Figure 13 shows that at the same current density, the shorter the exhaust interval time, the higher the hydrogen excess coefficient. When the exhaust interval time is shortened from 50 s to 5 s, the hydrogen excess coefficient increases by 11.6~13.3%. This is because during exhaust, excess hydrogen is supplied to maintain the anode-cathode pressure difference, and more frequent exhaust increases the supply of excess hydrogen. Additionally, at the same exhaust interval time, the hydrogen excess coefficient decreases as the current density increases. At high current densities, the increased water production can lead to insufficient hydrogen excess coefficients, causing gas distribution issues, hydrogen starvation [24], and water blockage [25], which can reduce single-cell voltage and affect stack stability. Therefore, reducing the exhaust interval time helps mitigate the decrease in the hydrogen excess coefficient and maintains its stability.

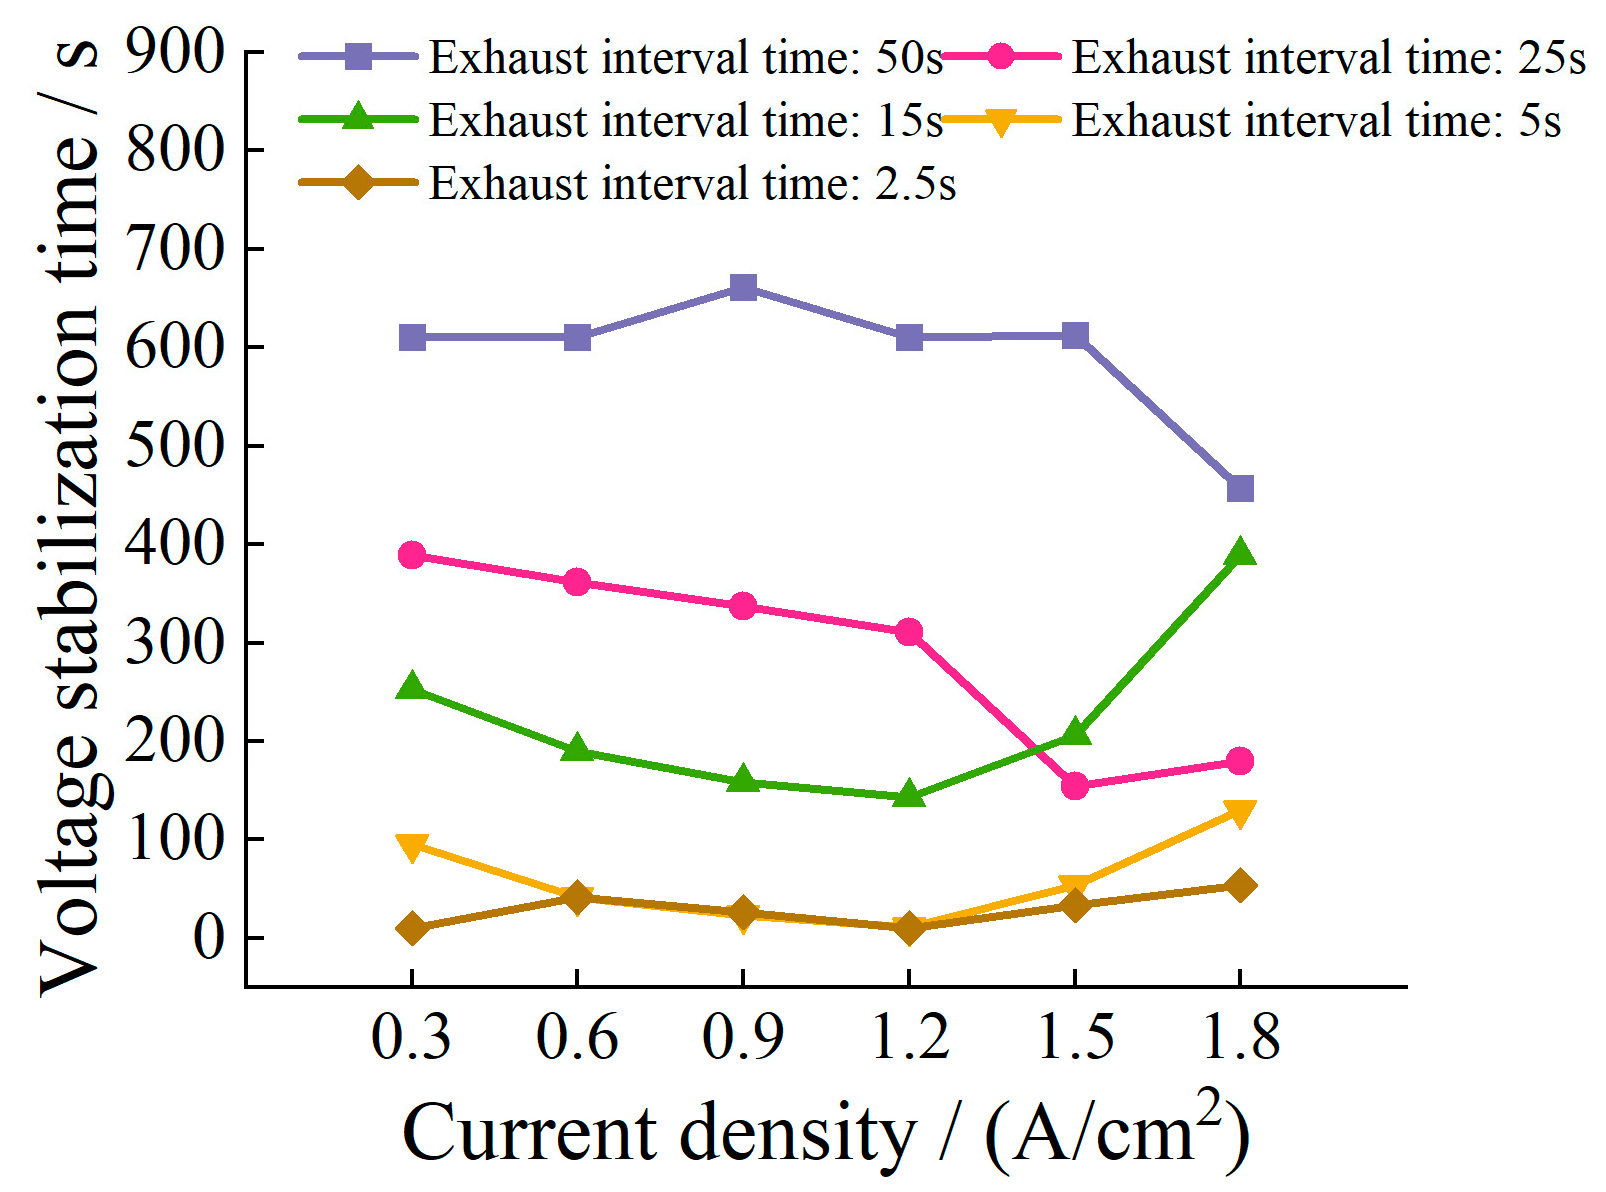
5.5. Impact of Exhaust Interval Time on Voltage Stabilization Time

The simulation results show that after the current is ramped up to the desired value, the output voltage gradually decreases and eventually stabilizes. This is because, as shown in Equation (13), the output voltage is related to the hydrogen partial pressure in the stack, which decreases and stabilizes as nitrogen permeates from the cathode to the anode and exhaust cycles occur. According to the simulation result, it was observed that when the exhaust interval exceeds 50 s, the voltage exhibits a slow and continuous decline across various current densities, with the time to reach a stable value exceeding 600 s, which fails to meet the safety operational requirements of the stack. During the operation of the fuel cell system, the controller calculates the target current based on the requested power and real-time voltage. If the voltage continues to drop after loading, the controller will further increase the target current. According to the polarization curve, an increase in current will further reduce the voltage. If the voltage cannot stabilize in a timely manner, it may trigger the protection mechanism for excessively low single-cell voltage. The relationship between the voltage stabilization time and current density for exhaust intervals within 50 s is illustrated in Figure 14.
From Figure 14 it can be seen that the shorter the exhaust interval, the less time it takes for the voltage to drop to a stable value after loading. More frequent exhaust allows the anode inside the stack to reach an equilibrium state of gas partial pressures more quickly. At current densities of 1.5 A/cm2 and 1.8 A/cm2, the stable voltage value with a 15 s exhaust interval is lower than that with a 25 s interval, resulting in an extended voltage stabilization time. Therefore, the selection of the exhaust interval must also consider the stability of the voltage after loading. Especially under high current densities, the output voltage of the stack is lower, and a continuous decline is more likely to reach the protection limit.

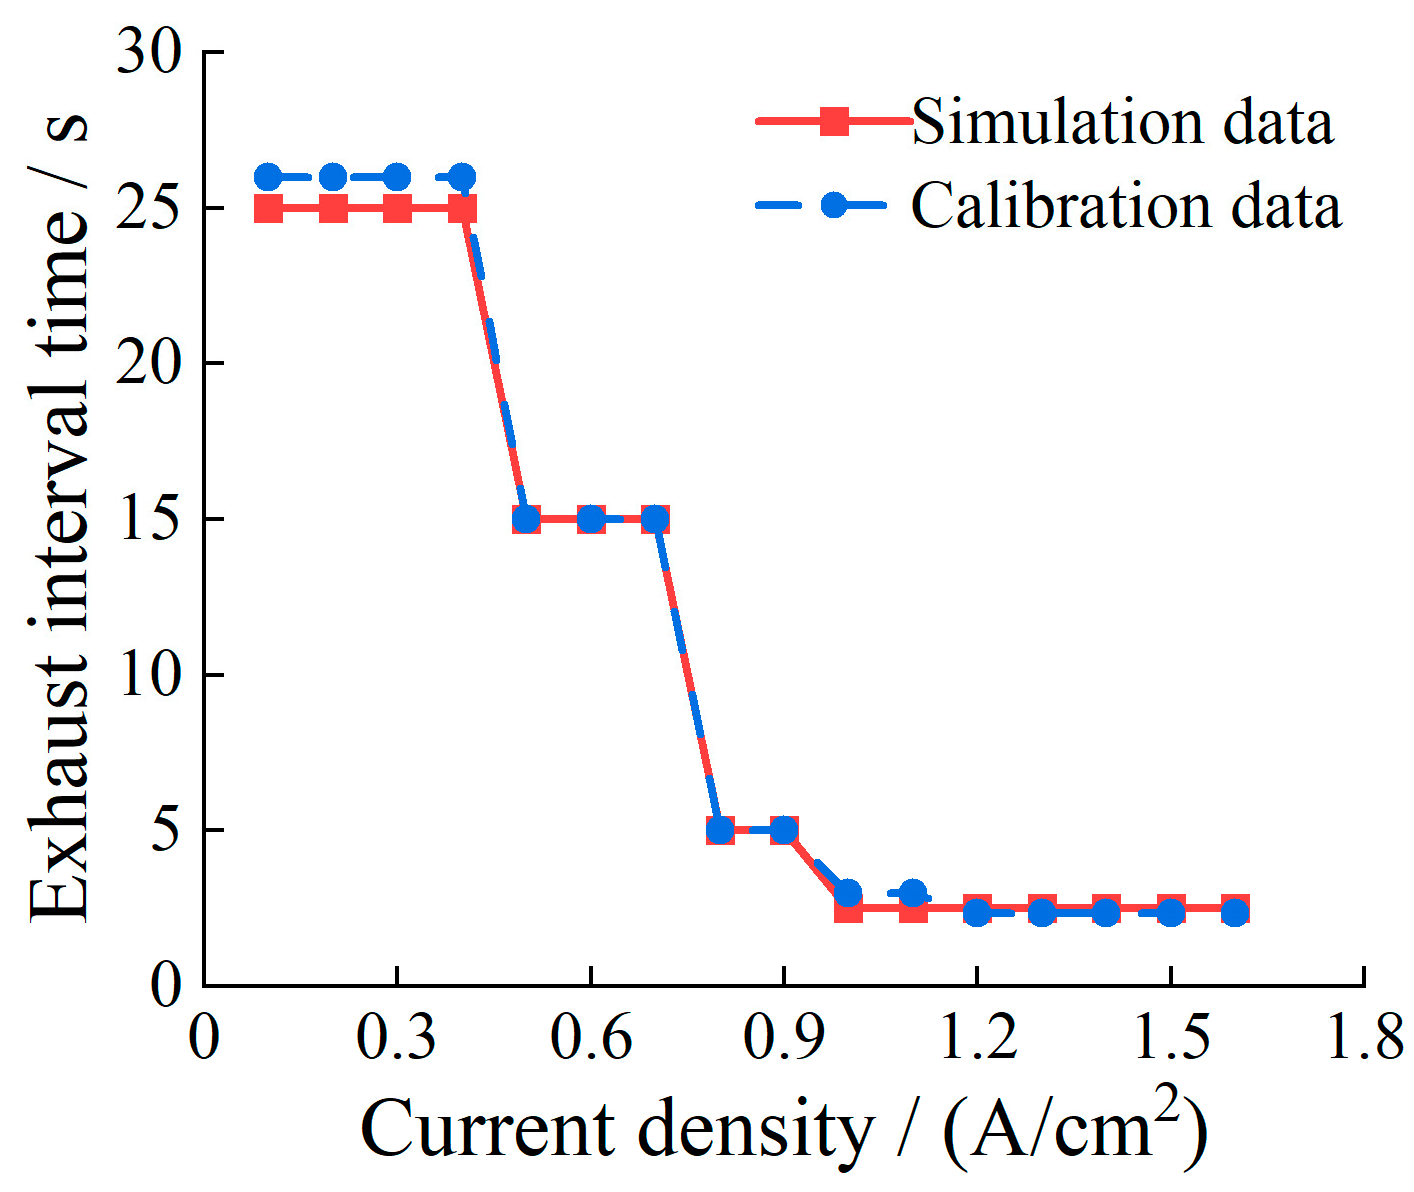
5.6. Determination of Optimal Exhaust Interval Time

Taking into account the effects of exhaust interval time on stack efficiency, hydrogen excess coefficient, and voltage stabilization speed, the optimal exhaust interval times for various current densities were determined. The specific analysis is as follows: From the conclusions in Section 5.3, it is known that when the exhaust interval time is less than 25 s, extending the exhaust interval time can significantly improve stack efficiency. According to the voltage stability analysis in Section 5.4 and Figure 14, an exhaust interval time of less than 50 s can achieve a faster voltage stabilization speed. Therefore, 25 s was selected as the exhaust interval time for a current density of 0.3 A/cm2. From Figure 13, it can be observed that when the current density increases from 0.3 A/cm2 to 0.6 A/cm2, the hydrogen excess coefficient experiences a significant decline. To compensate for this decline and reduce the voltage stabilization time, it is necessary to shorten the exhaust interval time, selecting 15 s as the exhaust interval time for 0.6 A/cm2. Similarly, at 0.9 A/cm2, the exhaust interval time is further reduced to 5 s. As shown in Figure 14, when the current density exceeds 1.2 A/cm2, the voltage stabilization time begins to gradually increase with the rise in current density. To minimize the voltage stabilization time, 2.5 s was chosen as the exhaust interval time for current density of 1.2 A/cm2 and above. In practical operation, an equivalent scheme of 2 s of exhaust time with a 5 s interval time is used to reduce pressure fluctuations caused by frequent exhaust. Using the above exhaust interval time, the obtained simulation values of the performance parameters related to the operational stability of the stack are shown in Table 3. It can be seen that, especially at high current density, the single-cell voltage and hydrogen excess coefficient can be maintained within the safe range, and the voltage can quickly reach a stable value when the load changes.
We determined the exhaust interval time calibration values through 100 kW fuel cell system bench testing and compared them with the optimal values obtained from simulations, as shown in Figure 15. The requirement of calibration is that the voltage does not drop continuously within 10 min after the stack is pulled to the target current density and can be maintained at a stable value. The results show that the maximum exhaust interval time in the bench test was 28 s, and the interval time decreased as the current density increased, consistent with the simulation results. This comparison validates the accuracy of the simulation model and demonstrates that the model can support future fuel cell system strategy development, saving time and costs associated with bench testing.

6. Conclusions

Through the modeling and simulation of the fuel cell anode hydrogen supply system, the performance characteristics of the stack under different exhaust intervals were studied. By analyzing the simulation data and considering the impact of exhaust interval time on stack efficiency, hydrogen excess coefficient, and voltage stabilization time, the optimal exhaust interval time for a 100 kW fuel cell stack was determined. The following conclusions were drawn:
For a 100 kW fuel cell system, the maximum exhaust interval time should be less than 25 s, and the exhaust cycle length should decrease as the current density increases. The minimum exhaust interval time at high current densities should not exceed 5 s.
When the exhaust interval time is less than 25 s, extending the interval time significantly improves stack efficiency. When the interval time exceeds 25 s, further extension has a limited effect on efficiency and may even reduce it.
At low current densities, extending the exhaust interval time has a more significant effect on improving hydrogen utilization than at high current densities. Therefore, it is recommended to extend the exhaust cycle at low current densities. As the current density increases, reducing the exhaust interval time helps reduce voltage stabilization time, maintain a stable hydrogen excess coefficient, and prevent low single-cell voltage.

Author Contributions

Conceptualization, Y.L. and C.D.; methodology, C.D.; software, Y.L.; validation, Y.L. and C.D.; formal analysis, Y.L.; writing—original draft preparation, Y.L.; writing—review and editing, C.D.; project administration, C.D.; funding acquisition, C.D. All authors have read and agreed to the published version of the manuscript.

Funding

This research was funded by the Foshan Xianhu Laboratory of the Advanced Energy Science and Technology Guangdong Laboratory, grant number XHRD2024-11233100-01 and Key R&D project of Hubei Province, China, grant number 2021AAA006.

Data Availability Statement

The original contributions presented in this study are included in the article. Further inquiries can be directed to the corresponding author.

Conflicts of Interest

The authors declare no conflicts of interest.

References

  1. Tri, D.T.L.; Vu, H.N.; Nguyen, H.L.; Kim, Y.; Yu, S.S. A comparative study of single and dual ejector concepts for anodic recirculation system in high performance vehicular proton exchange membrane fuel cells. Int. J. Hydrogen Energy 2023, 48, 27344–27360. [Google Scholar]
  2. Zhang, C.Z.; Chen, L.Y.; Lu, L.; Li, Y.; Hao, D.; Chin, C.S.; Qiao, Y.J. The experiment and the control of hydrogen circulation of fuel cell based on of fuel ejector: A review. Int. J. Hydrogen Energy 2023, 50, 1415–1431. [Google Scholar] [CrossRef]
  3. Gao, H.Y.; Yin, B.F.; Xu, S.; Chen, H.C.; Dong, F. Optimization of purge strategy under fuel cell startup conditions based on CFD-Simulink collaborative simulation. Ionics 2024, 30, 2969–2987. [Google Scholar] [CrossRef]
  4. Wang, B.W.; Deng, H.; Jiao, K. Purge strategy optimization of proton exchange membrane fuel cell with anode recirculation. Appl. Energy 2018, 225, 1–13. [Google Scholar] [CrossRef]
  5. Plooy, D.D.; Meyer, J.; Solms, S.V. Adaptive purging control of hydrogen fuel cells for high efficiency applications. In Proceedings of the 2018 International Conference on the Domestic Use of Energy, Cape Town, South Africa, 3–5 April 2018. [Google Scholar]
  6. Hu, Z.; Yu, Y.; Wang, G.J.; Chen, X.S.; Chen, P.; Chen, J.; Zhou, S. Anode purge strategy optimization of the polymer electrode membrane fuel cell system under the dead-end anode operation. J. Power Sources 2016, 320, 68–77. [Google Scholar] [CrossRef]
  7. Steinberger, M.; Geiling, J.; Oechsner, R.; Frey, L. Anode recirculation and purge strategies for PEM fuel cell operation with diluted hydrogen feed gas. Appl. Energy 2018, 232, 572–582. [Google Scholar] [CrossRef]
  8. Pei, Y.W.; Chen, F.X.; Jiao, J.R.; Liu, S.G. Analysis and control strategy design for PEMFC purging process. Energy 2024, 290, 130233. [Google Scholar] [CrossRef]
  9. Shen, J.; Liu, Z.C.; Liu, F.; Liu, W. Numerical Simulation of Water Transport in a Proton Exchange Membrane Fuel Cell Flow Channel. Energies 2018, 11, 1770. [Google Scholar] [CrossRef]
  10. Bian, J.; Zhang, Y.; Liu, Y.; Gong, L.; Cao, X.W. Structural optimization of hydrogen recirculation ejector for proton exchange membrane fuel cells considering the boundary layer separation effect. J. Clean. Prod. 2023, 397, 136535. [Google Scholar] [CrossRef]
  11. Me, D.S.; Ji, N.; Zhao, K.F.; Wu, G.P.; Pei, Y.Q. Study on optimization of hydrogen-fueled cell ejector’s structural parameters. J. Mach. Des. 2023, 40, 75–81. (In Chinese) [Google Scholar]
  12. Yuan, H.; Dai, H.; Wu, W.; Xie, J.P.; Shen, J.; Wei, X.Z. A fuzzy logic PI control with feedforward compensation for hydrogen pressure in vehicular fuel cell system. Int. J. Hydrogen Energy 2021, 46, 5714–5728. [Google Scholar] [CrossRef]
  13. Hong, L.; Chen, J.; Liu, Z.Y.; Huang, L.H.; Wu, Z.L. A Nonlinear Control Strategy for Fuel Delivery in PEM Fuel Cells Considering Nitrogen Permeation. Int. J. Hydrogen Energy 2017, 42, 1565–1576. [Google Scholar] [CrossRef]
  14. Kuo, J.K.; Jiang, W.Z.; Li, C.H.; Hsu, T.H. Numerical investigation into hydrogen supply stability and I-V performance of PEM fuel cell system with passive Venturi ejector. Appl. Therm. Eng. 2020, 169, 114908. [Google Scholar] [CrossRef]
  15. Kyung, D.B.; Min, S.K. Characterization of nitrogen gas crossover through the membrane in proton-exchange membrane fuel cells. Int. J. Hydrogen Energy 2011, 36, 732–739. [Google Scholar]
  16. Cheng, Z.Y.; Luo, L.Z.; Huang, B.; Jian, Q.F. Dynamic analysis of internal reactants and water content distribution during anode purge in a proton-exchange membrane fuel cell. Int. J. Energy Res. 2021, 45, 10609–10629. [Google Scholar] [CrossRef]
  17. Wu, H.; Berg, P.; Li, X. Non-isothermal transient modeling of water transport in PEM fuel cells. J. Power Sources 2007, 165, 232–243. [Google Scholar] [CrossRef]
  18. He, J.L.; Ahn, J.; Choe, S.Y. Analysis and control of a fuel delivery system considering a two-phase anode model of the polymer electrolyte membrane fuel cell stack. J. Power Sources 2011, 196, 973–984. [Google Scholar] [CrossRef]
  19. Liu, Y.; Tu, Z.K.; Chan, S.H. Performance enhancement in a H2/O2 PEMFC with dual-ejector recirculation. Int. J. Hydrogen Energy 2022, 47, 12698–12710. [Google Scholar] [CrossRef]
  20. Li, X.Y.; Wei, H.; Du, C.Q.; Shi, C.X.; Zhang, J.M. Control strategy for the anode gas supply system in a proton exchange membrane fuel cell system. Energy Rep. 2023, 10, 4342–4358. [Google Scholar] [CrossRef]
  21. Ding, H.B.; Dong, Y.Y.; Zhang, Y.; Yang, Y.; Wen, C. Energy efficiency assessment of hydrogen recirculation ejectors for proton exchange membrane fuel cell (PEMFC) system. Appl. Energy 2023, 346, 121357. [Google Scholar] [CrossRef]
  22. Yousefkhani, M.B.; Ghadamian, H.; Daneshvar, K.; Alizadeh, N.; Troconis, B.C.R. Investigation of the Fuel Utilization Factor in PEM Fuel Cell Considering the Effect of Relative Humidity at the Cathode. Energies 2020, 13, 6117. [Google Scholar] [CrossRef]
  23. Singer, G.; Pertl, P.; Trattner, A. Experiments on maximizing hydrogen utilization and efficiency in a PEM fuel cell system. Int. J. Hydrogen Energy 2025, 106, 1158–1166. [Google Scholar] [CrossRef]
  24. Wang, F.J.; Zhang, H.L.; Liu, M.; Zhang, X.S.; Yang, D.J.; Zhang, C.M. An effective PEMFC system shutdown purge strategy for improving the purging effect of liquid water and the dehydration of stack. Int. J. Hydrogen Energy 2023, 48, 28891–28905. [Google Scholar] [CrossRef]
  25. Zhong, Y.Y.; Yang, Y.B.; Yao, N.Y.; Ma, T.C.; Lin, W.K. Water Status Detection Method Based on Water Balance Model for High-Power Fuel Cell Systems. Energies 2024, 17, 5410. [Google Scholar] [CrossRef]
Figure 1. Ejector cross-section view.
Energies 18 02168 g001
Figure 2. Low-power ejector mesh model.
Energies 18 02168 g002
Figure 3. Graph of the relationship between the secondary flow rate and the number of elements.
Energies 18 02168 g003
Figure 4. Comparison of simulation data and experimental data.
Energies 18 02168 g004
Figure 5. Simulation result of the dual ejectors. (a) Entrainment ratio and primary flow pressure of the low-power ejector; (b) entrainment ratio and primary flow pressure of the high-power ejector.
Energies 18 02168 g005
Figure 6. Fuel cell hydrogen supply system structure diagram.
Energies 18 02168 g006
Figure 7. Exhaust valve mass flow-differential pressure relationship curve.
Energies 18 02168 g007
Figure 8. Simulink model of the fuel cell hydrogen supply system.
Energies 18 02168 g008
Figure 9. Polarization curve comparison between test data and simulation data.
Energies 18 02168 g009
Figure 10. The relationship between single-cell voltage and current density at different exhaust intervals. (a) Current density: 0.3~0.9 A/cm2; (b) current density: 1.2~1.8 A/cm2.
Energies 18 02168 g010
Figure 11. The relationship between hydrogen utilization and exhaust interval time at different current density.
Energies 18 02168 g011
Figure 12. Diagram of stack efficiency-current density-exhaust interval.
Energies 18 02168 g012
Figure 13. The relationship between hydrogen excess coefficient and exhaust interval time at different current density.
Energies 18 02168 g013
Figure 14. The relationship between voltage stabilization time and current density at different exhaust intervals.
Energies 18 02168 g014
Figure 15. Comparison between calibrated and simulated exhaust interval time of 100 kW fuel cell stack system.
Energies 18 02168 g015
Table 1. Dimension parameter of the dual ejectors.
Dt/mmDm/mmDp/mmDsu/mmDs/mmDout/mmNXP/mmLc/mmLd/mmLm/mmθ_c/°θ_d/°
Low-power ejector1.28.410201222.53884630308
High-power ejector38.410201222.53884630308
Table 2. Exhaust interval time simulation scheme table.
Current
Density/(A/cm2)
0.30.60.91.21.51.8
Exhaust interval time (s)/exhaust time (s)100/1100/1100/1100/1100/1100/1
75/175/175/175/175/175/1
50/150/150/150/150/150/1
25/125/125/125/125/125/1
15/115/115/115/115/115/1
5/15/15/15/15/15/1
5/25/25/25/25/25/2
Table 3. Simulation value of stack performance under optimal exhaust interval.
Current Density/(A/cm2)0.30.60.91.21.5
Single-cell voltage/mV803.13788.75774.69741.25692.5
Hydrogen excess coefficient2.0331.7121.6931.5861.471
Voltage stabilization time/s389190231033
Disclaimer/Publisher’s Note: The statements, opinions and data contained in all publications are solely those of the individual author(s) and contributor(s) and not of MDPI and/or the editor(s). MDPI and/or the editor(s) disclaim responsibility for any injury to people or property resulting from any ideas, methods, instructions or products referred to in the content.

