Abstract
Existing approaches insufficiently analyze the quantitative relationship between frequency stability indices and wind power penetration rates. This limitation impedes rapid and accurate assessments of wind power’s grid integration potential. This paper first analyzed the impact mechanism of wind power integration on system inertia and static power-frequency characteristics from different aspects of the influence of double-fed induction generators (DFIGs) on the operating modes of synchronous machines. Subsequently, based on this analysis, the paper derived the quantitative relationship between key indicators reflecting transient frequency response characteristics during power shortages and wind power penetration rates. It also rapidly calculated the maximum wind power penetration rate based on constraints of frequency change rate and maximum frequency deviation, thereby enabling a quantitative evaluation of wind power grid connection capability. Finally, the IEEE 39-bus test system was used for case analysis. The research results indicate that the proposed method can accurately quantify the impact of wind power variation on system frequency stability and rapidly determine the maximum wind power penetration rate to ensure frequency stability, thereby improving the accuracy of the wind power grid connection capability assessment.
1. Introduction
Following the global implementation of carbon neutrality and peak emissions targets, contemporary energy infrastructure has undergone a paradigm shift toward decarbonization and sustainable development [1]. The wind power sector achieved a historic milestone in 2023, with a worldwide cumulative installed capacity surpassing 900 GW, reflecting substantial advancements in technological sophistication and deployment scale. China emerged as the dominant contributor to this transition, accounting for 40.7% of the global cumulative grid-connected capacity while maintaining leadership in annual capacity additions, demonstrating consistent expansion trajectories across its renewable energy portfolio. However, the widespread integration of double-fed induction generators (DFIGs) has introduced critical stability challenges—particularly regarding system inertia depletion and frequency response deterioration. These technical limitations manifest as diminished disturbance rejection capabilities and aggravated frequency oscillations, ultimately compromising grid resilience and operational security [2].
The fluctuation and uncertainty of wind power output lead to the instability of the system inertia level, which, in turn, makes the system frequency dynamic process more complex. In order to find an analysis method suitable for the frequency stability of wind power after grid connection, experts and scholars at home and abroad have carried out a lot of research. In [3], the influence of wind power on the frequency stability of the system under wind speed disturbance was analyzed, and optimization measures to reduce the frequency fluctuation were proposed. In [4,5], the effects of UFLS (under frequency load shedding, https://ieeexplore.ieee.org/document/5697619, accessed on 10 April 2025) response and low-voltage ride-through (LVRT) performance of double-fed induction generators (DFIGs) on the frequency stability of the system were analyzed, and the results showed that optimizing the UFLS control strategy and LVRT parameters could effectively improve the frequency stability of the system. In [6], the influence of wind power on the frequency stability of the system was quantified from the perspective of equivalent inertia, and the permeability limit of wind power that can be accessed by the system was calculated based on the safety requirements of inertia. The results showed that the larger the wind power permeability, the smaller the inertia time constant of the system, and the worse the frequency stability, due to the lack of comprehensiveness in the analysis of a single index. In [7], the moment of inertia margin and inertia ratio were used to measure the frequency stability of the system, and the maximum disturbance power that the system could withstand was evaluated online considering the frequency deviation and rate of change constraints. In order to ensure the safe and stable operation of the high wind power permeability system, it was necessary to accurately evaluate the grid-connected capacity of wind power under the frequency constraint of the grid. In [8], the maximum wind power permeability of the system was evaluated by considering the maximum frequency deviation and the lowest frequency point, but these evaluation methods were highly dependent on simulation and had a long calculation time, which made it difficult to meet the requirements of online analysis. In [9], from a theoretical point of view, the calculation problem of maximum wind power permeability was transformed into an optimization problem, and the wind power permeability limit evaluation model was established with the frequency intensity index as the constraint and the maximum wind power permeability as the objective function; however, the correlation between the frequency intensity index and wind power permeability in the optimization model was weak, and the accuracy of the calculation results needed to be improved.
The above literature studied the frequency stability of the double-fed wind turbine grid-connected system from many aspects. Current research methodologies exhibit dual theoretical constraints in deciphering the interaction mechanisms between wind power integration and power system frequency stability. Firstly, conventional assessment frameworks predominantly rely on empirical interpretation of time-domain simulation data, resulting in the absence of quantitative analytical models for characterizing the dynamic coupling between wind farm connectivity and system frequency responses. Secondly, the critical correlation between key frequency stability parameters and wind power penetration levels lacks rigorous mathematical characterization models, thereby hindering the development of rapid precision evaluation capabilities essential for optimal grid-connected capacity allocation in engineering practice.
In this work, the influence mechanism of wind power access on the inertia characteristics and static frequency characteristics of the system was analyzed from the different aspects of the influence of double-fed wind turbine access on the operation mode of the synchronous machine. On this basis, the quantitative relationship between the key indicators reflecting the transient frequency response characteristics and the wind power permeability in the event of power shortage was deduced by taking the equivalent inertia time constant and the static power-frequency characteristic coefficient as the bridge, and the wind power permeability limit of the system was quickly calculated based on the frequency change rate and the maximum frequency deviation constraint, so as to realize the quantitative evaluation of the grid-connected capacity of wind power.
2. Mechanism Analysis of the Influence of Wind Power Grid Connection on Frequency Stability
In this section, the influence mechanism of wind power access on the inertia level and static frequency characteristics of the system was analyzed from the two situations in which only the output of the synchronous unit was changed after the double-fed wind turbine was connected and some synchronous generators were withdrawn after the double-fed wind turbine was connected [10].
2.1. Influence of Wind Power Grid Connection on the Level of System Inertia
After wind power is connected to the grid, the level of system inertia is one of the key parameters affecting frequency stability. The inertia time constant commonly used in the power system characterizes the inertia level of the system, and the equivalent inertia time constant of the system can be expressed as:
wherein SGi and HGi represent the rated power and inertia time constant of the synchronous unit, m represents the number of synchronous units in operation, and SW and EW represent the rated capacity of the wind turbine and the energy available to participate in the fast frequency response of the system, respectively.
The relationship between the equivalent inertia time constant and the frequency fluctuation of the system can be expressed by the rotor equation of motion of the synchronous machine. When the system power is unbalanced, the equation of motion of the equivalent rotor is:
wherein represents the power standard value of the power supply side, represents the power standard unit value of the load side, ω* represents the standard value of the angular velocity of the rotor of the equivalent machine, and represents the equivalent inertia time constant of the system before the wind power is connected to the grid. The expression is as follows:
After the double-fed wind turbine is connected to the grid, if the output and load of the system synchronous unit are stable, there will be no power imbalance. When the power is unbalanced due to load changes, the system adjusts the power flow to keep the frequency stable [11]. In the following section, the influence of wind power grid connection on the time constant of inertia is analyzed from two situations: the change in the synchronous output of wind power grid connection and the replacement of the synchronous generator by the wind turbine.
2.1.1. The Grid Connection of Wind Power Only Changes the Output of the Synchronous Machine
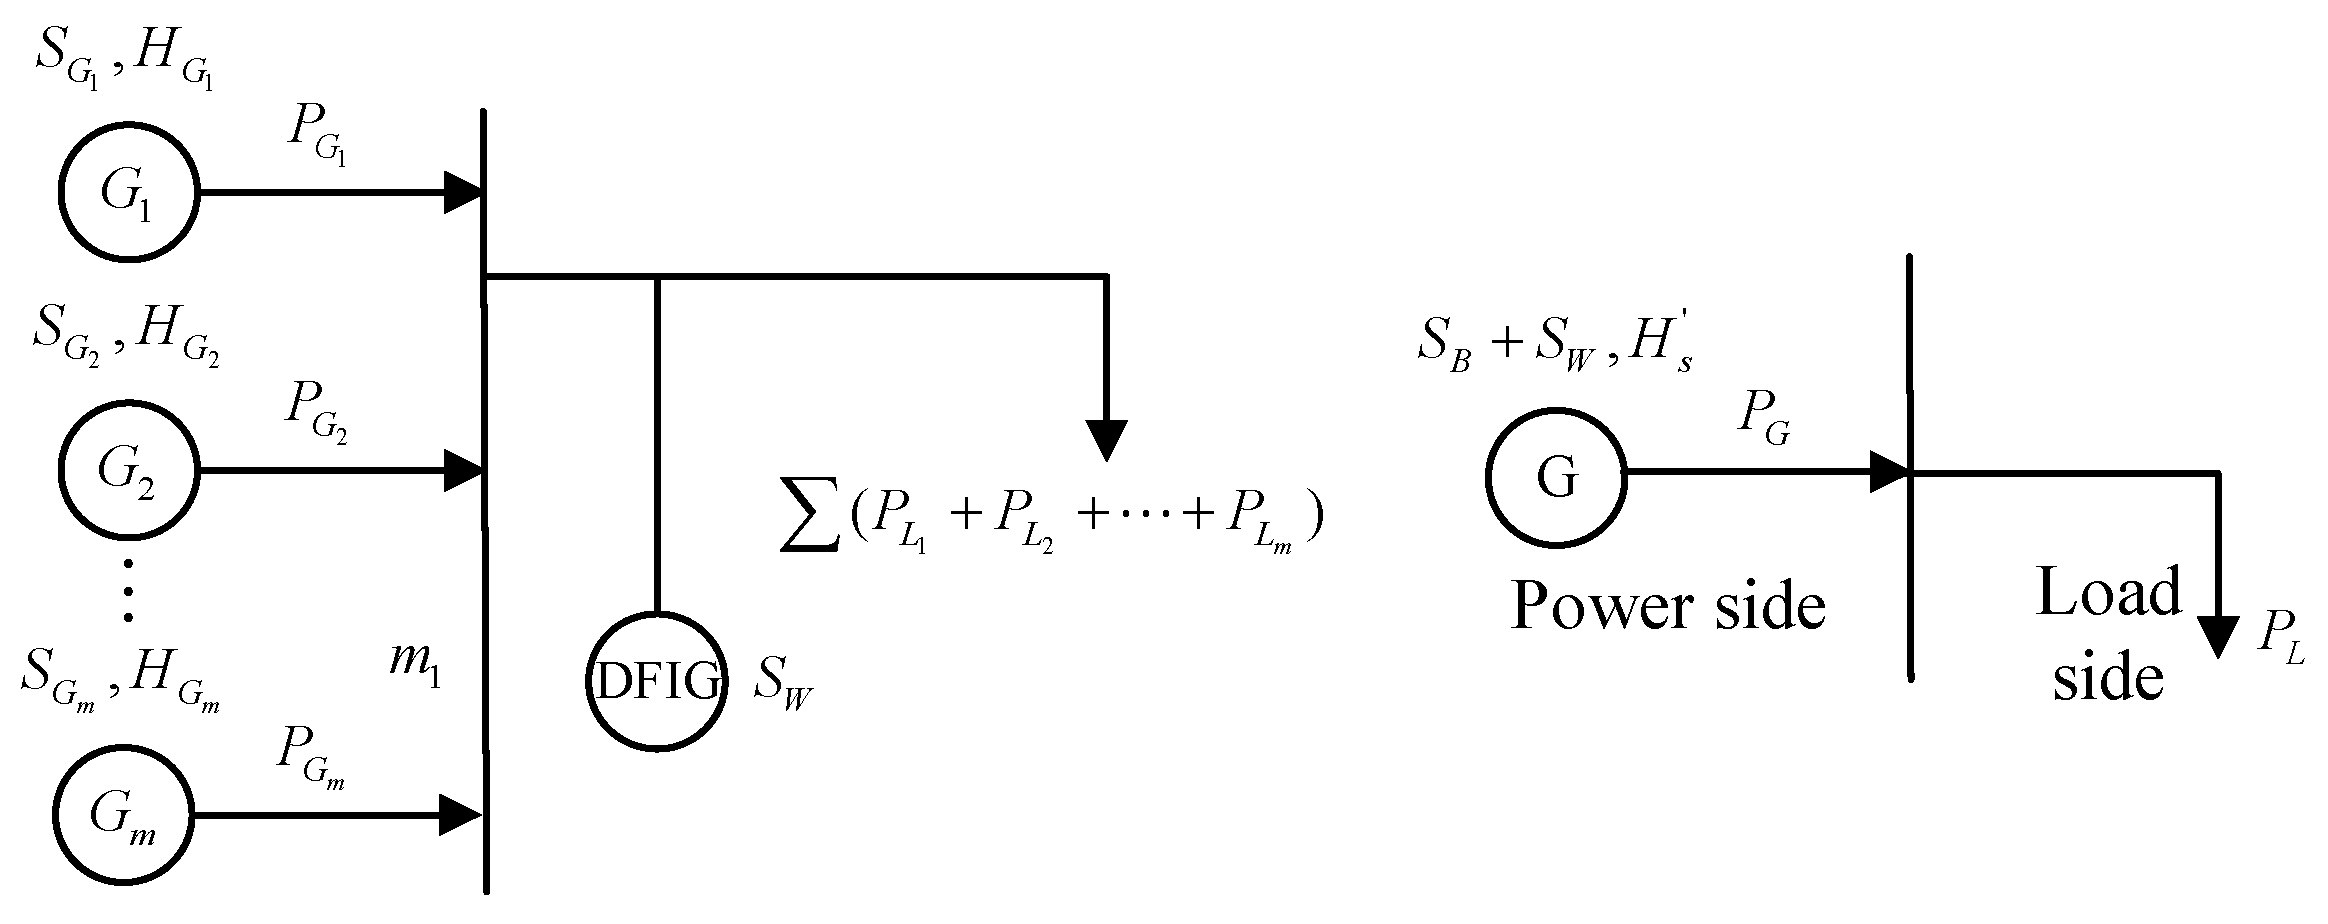
Figure 1 shows the structure of the grid-connected wind power system and its equivalent structure. SB represents the equivalent output power of multiple wind turbines. SW represents the grid-connected rated power of double-fed wind turbines, and represents the equivalent inertia time constant of the system after the wind power is connected to the grid.
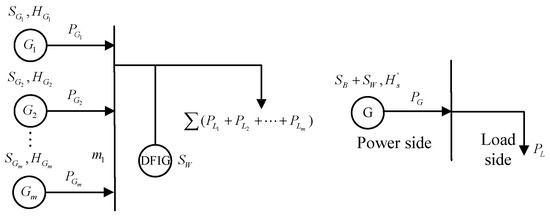
Figure 1.
Structure of the wind power grid-connected system and its equivalent system.
Under the same benchmark value, the expression of the inertia time constant of the wind power system before and after grid connection is as follows:
The equation of motion of the rotor of an equivalent system is:
After the wind power is connected to the grid, the equivalent inertia level of the system before and after grid connection is unchanged when only the output of the system synchronous machine is changed, so the frequency response of wind power to the system is consistent with that before grid connection.
2.1.2. After the Wind Power Is Connected to the Grid, Some Synchronous Machines Are Out of Operation
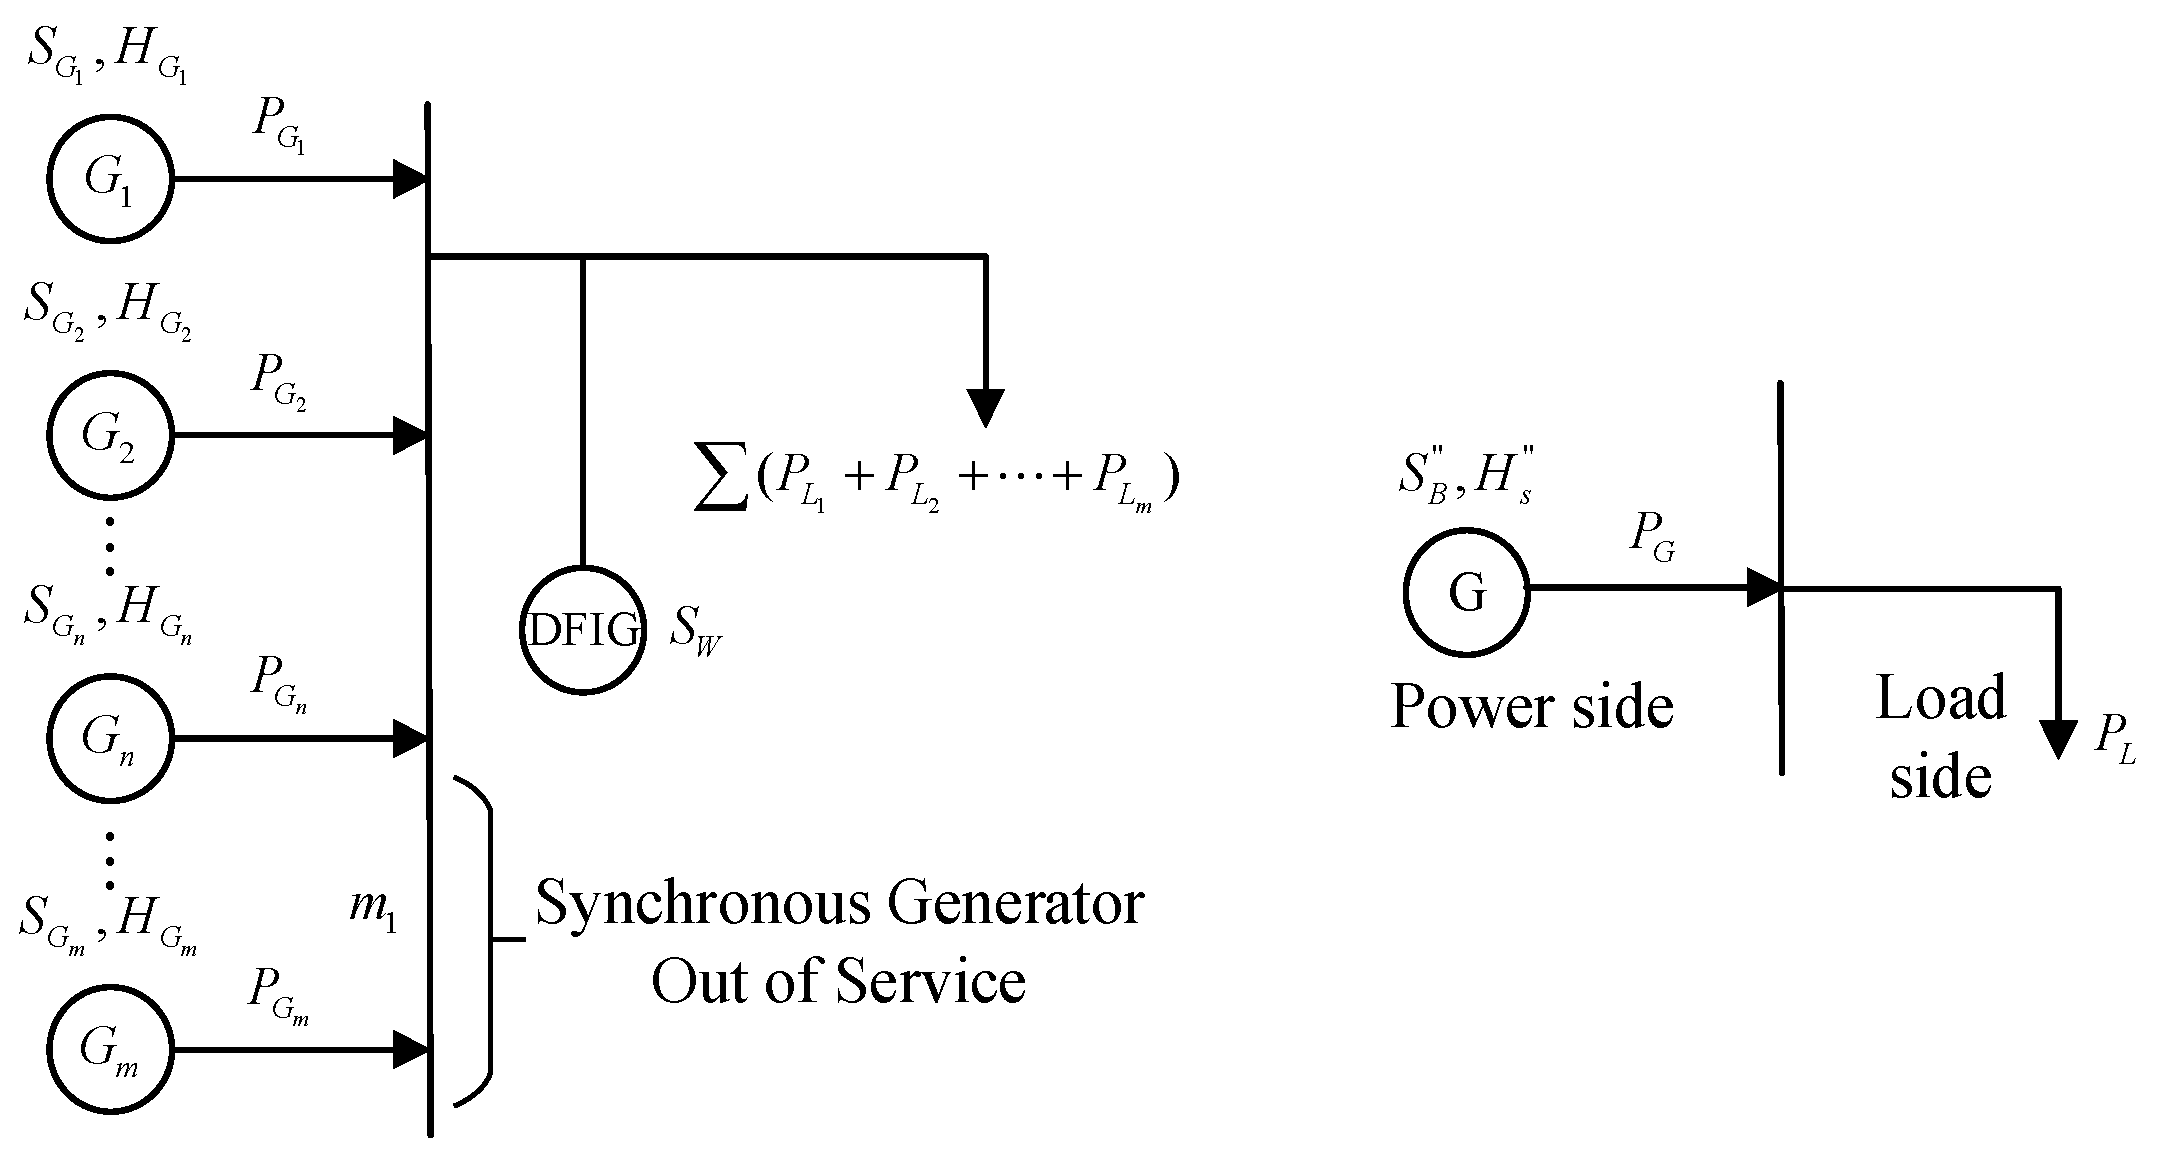
In the system with high wind power penetration, the grid connection of double-fed wind turbines will cause some synchronous generators to withdraw from operation, and the system structure and equivalent system diagram when the wind turbine replaces the synchronous turbine are shown in Figure 2.
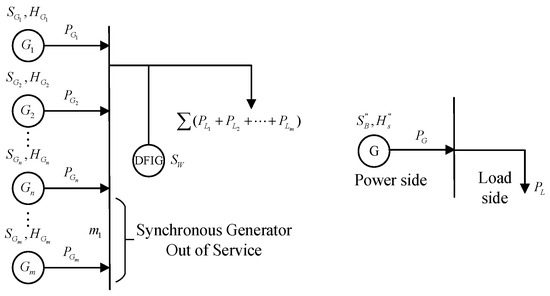
Figure 2.
System structure and equivalent system diagram when the wind turbine replaces the synchronous unit.
Under the same benchmark value, the expressions of the inertia time constants of the wind power system before and after grid connection are as follows:
wherein m1 represents the number of synchronous units replaced by wind turbines, represents the time constant of inertia of the synchronous turbine being replaced, and dw represents the wind power penetration.
The substitution of wind turbines for synchronous turbines reduces the inertia of the system, and with the increase in wind power permeability, the impact on the inertia level of the system will become more and more obvious, and the immunity of the system under unbalanced power will deteriorate, which will lead to the deterioration of the frequency stability of the system.
2.2. Influence of Wind Power Access on the Static Frequency Characteristics of the System
Without considering the load-frequency characteristic coefficient, the active power characteristic curve corresponding to the static frequency characteristic of the system is shown in Figure 3. The slope of segment AC corresponds to the static power-frequency characteristic coefficient, which maintains a reciprocal relationship with the generator’s unit regulating power. This coefficient is mathematically expressed as:

Figure 3.
Active power characteristic curve.
When large-scale wind power is connected to the grid, the static power-frequency characteristic coefficient of the system will increase, and the frequency stability of the system will be reduced. In this case, the expression of the static power-frequency characteristic coefficient of the system is as follows:
After further derivation, it can be obtained as:
wherein Rti represents the static power-frequency characteristic coefficient of the replaced synchronous machine, and ΔPWi represents the active power increment of the wind turbine, where the value is 0.
3. Quantitative Analysis of the Impact of Wind Power Grid Integration on Frequency Stability
In this chapter, the correlation between wind power permeability and system frequency indexes is established using the equivalent inertia time constant and static power-frequency characteristic coefficient of the system, and the influence of wind power grid connection on the frequency stability of the system is quantitatively analyzed [12].
3.1. Frequency Characteristic Model of the Wind Power System
From the relationship between the static power-frequency characteristic coefficient and the modulation coefficient of Section 2.2, it can be determined that the unit regulation power of the equivalent unit and load of the system is as follows:
wherein and represent the output change and load change of the synchronous machine, respectively, which are in the form of standard unit values based on the total power of the system; is the unit adjustment power of the ith synchronous machine in the system, which is also the standard unit value; and is the unit value of Δf based on the rated power.
Considering the static frequency characteristics of the system synchronous machine and the load, the expression of the system frequency characteristic equation is as follows:
wherein and are equal under the standard unitary value system, and Hs is the equivalent inertia time constant of the system.
On the premise of ignoring the differences in frequency spatiotemporal variation of different nodes of the system, the equivalent model of the frequency response of the system is established by considering the mechanical adjustment process of the governor and combining with Equation (11), as shown in Figure 4, where HG is the comprehensive response time constant of the governor of the equivalent unit. The frequency deviation Δf in this case can be expressed as:
wherein ; ; ; ; ; ;
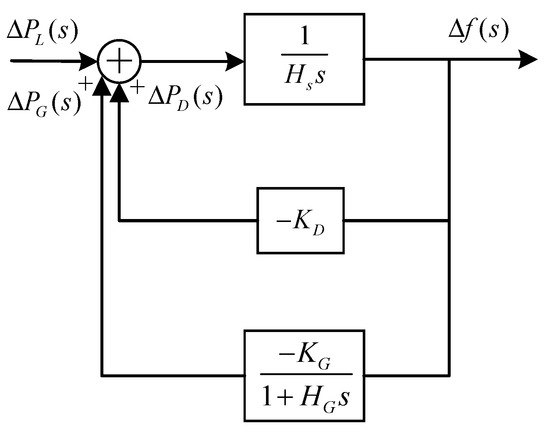
Figure 4.
Equivalent model of the system frequency response.
3.2. Derivation of the Quantitative Relationship Between Wind Power Penetration and System Frequency Stability Index
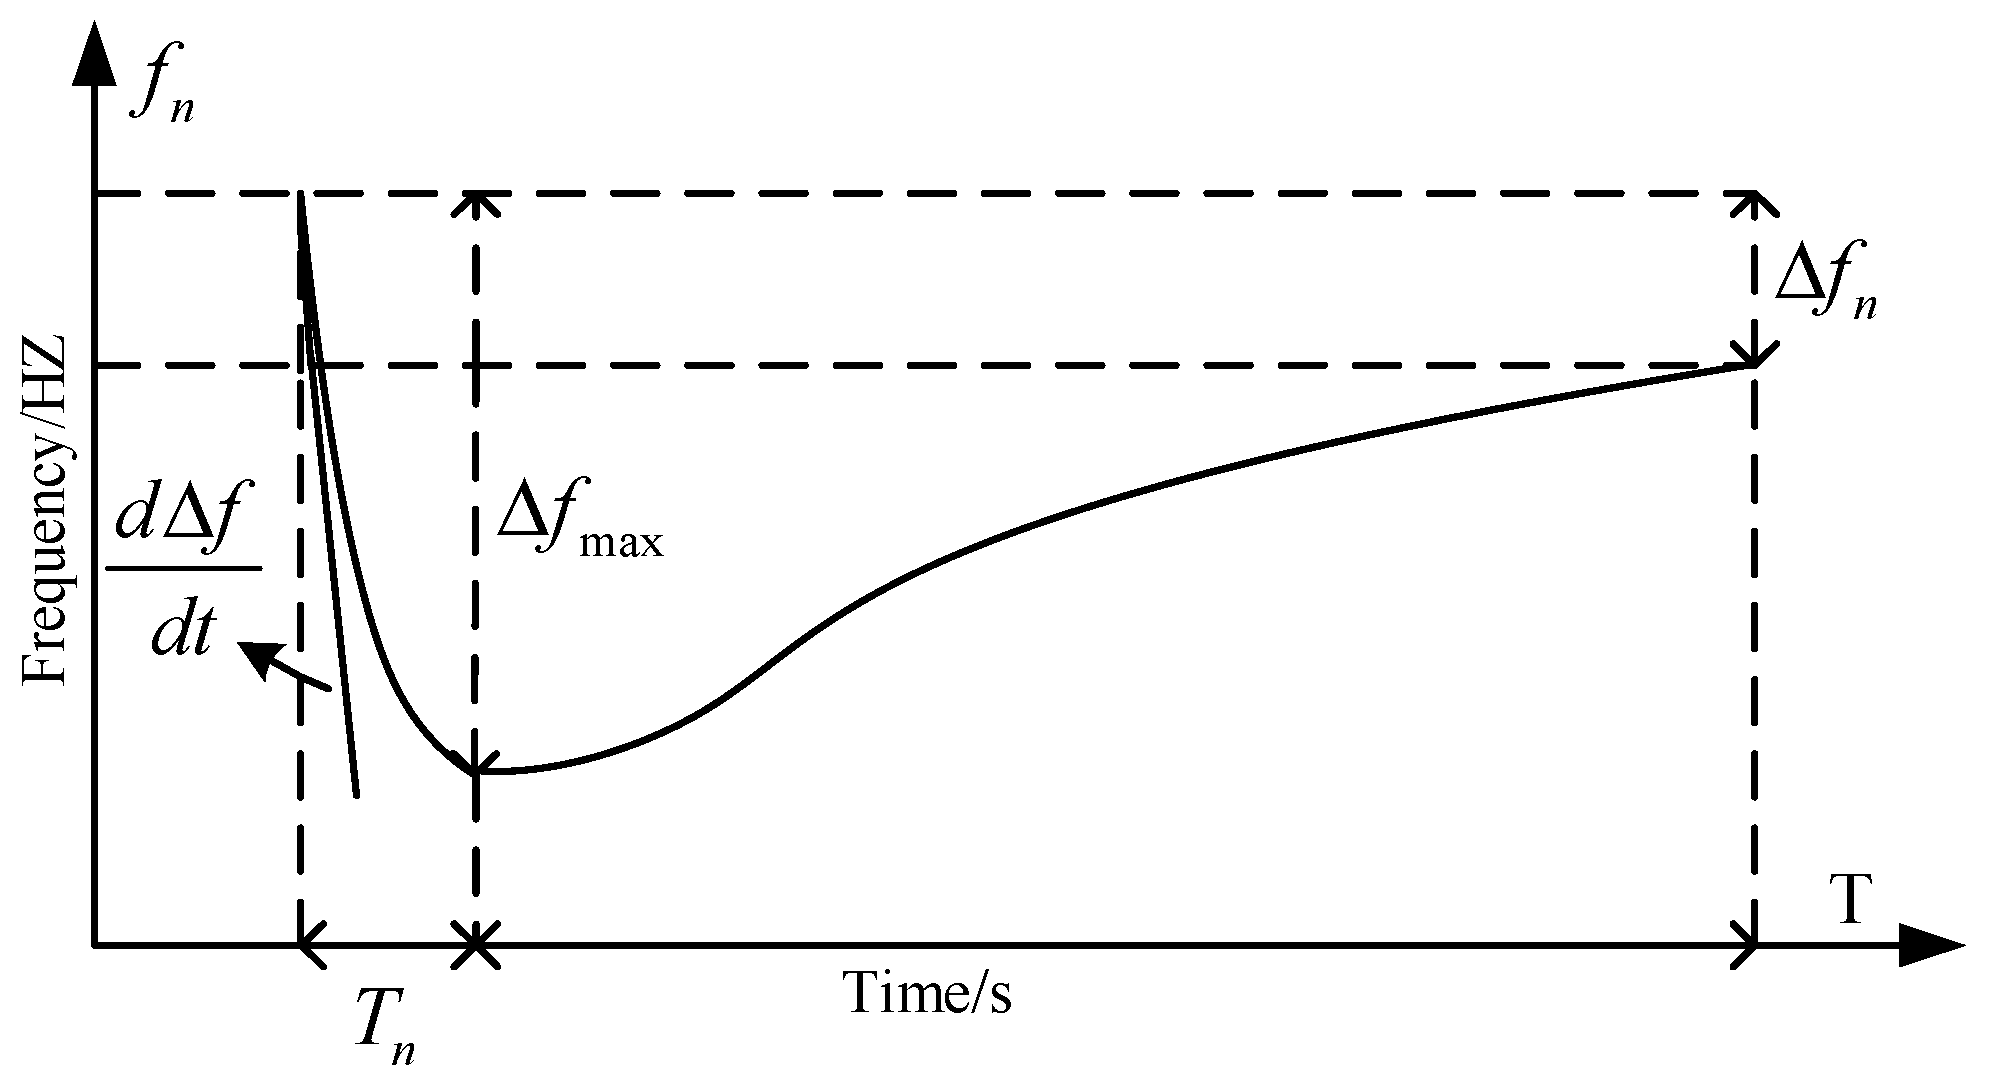
Figure 5 shows the frequency curve of the power system. In the figure, the steady-state frequency deviation is Δfn, the maximum frequency deviation is Δfmax, and the frequency change rate is dΔf/dt. Tn is the time needed to reach the minimum frequency point; it is often used as a quantitative analysis indicator for the frequency stability of the power system.

Figure 5.
Frequency characteristic curve of the power system.
3.2.1. Steady-State Frequency Deviation Δfn
The steady-state frequency deviation is the frequency deviation Δf of the system at time t tends to ∞, and it is expressed as:
Since KD is an inherent characteristic of the load and is generally not affected by wind power access, the steady-state frequency deviation is related to the change in KG before and after wind power access. Considering that wind power replaces synchronous machine access to the system, and wind power does not participate in frequency modulation, according to Equation (8), it can be seen that the expression of the unit adjustment power of the equivalent value of the system is as follows:
wherein KGti represents the unit equivalent of the synchronous unit regulation power of the part that is replaced by the double-fed fan.
The steady-state frequency deviation of the wind power system after grid connection can be expressed as:
When the system is subjected to the same power disturbance, the frequency steady-state deviation of the system increases with the increase in wind power permeability. In addition, the steady-state frequency deviation is positively correlated with the unit regulation power of the synchronous machine replaced by the wind turbine under the same wind power permeability.
The ratio of the steady-state frequency deviation of the wind power system before and after grid connection is:
The greater the unit regulation power and wind power penetration rate of the synchronous machine replaced by the wind turbine, the greater the impact of wind power grid connection on the steady-state frequency deviation.
3.2.2. Rate of Change in Frequency dΔf/dt
The initial frequency rate of change dΔf/dt represents the anti-interference ability of the system when the system suffers from power disturbance, which depends, to a certain extent, on the rotor rotation rate of the unit. When the power disturbance of the system is constant, the initial frequency change rate of the system decreases with the increase in Ek0, so the initial frequency change rate decreases with the increase in the equivalent inertia time constant. SN represents the installed capacity of the wind turbine.
The initial frequency change rate of the system after wind power is connected to the grid is expressed as:
The ratio of the initial frequency change rate of the system before and after wind power grid connection is:
The impact of wind power grid connection on the system’s initial frequency change rate is positively correlated with the equivalent inertia time constant of the synchronous machine replaced by the wind turbine and the wind power penetration rate.
3.2.3. Time Tn to Reach the Lowest Point of Frequency
The calculation of the time Tn to reach the lowest point of frequency needs to rely on the extreme point of frequency, that is, taking the derivative of the frequency. The lowest frequency point reflects the severity of the system’s frequency stability problem and is often used as a constraint on the limit of system access to wind power penetration. By deriving the derivative of Equation (12) on t, the expression of Tn after wind power is connected to the grid is obtained as follows:
3.2.4. Maximum Frequency Deviation Δfmax
Δfmax occurs at the lowest point of the frequency, that is, the difference between the rated frequency of the system and the frequency corresponding to the Tn time; the expression Δfmax after grid connection is shown in Equation (20). The Δfmax is related to the equivalent inertia time constant and the unit adjustment of the equalizer, and both parameters are affected by the grid connection of wind power.
4. Evaluation of Wind Power Grid-Connected Capabilities Considering Frequency Stability Constraints
In order to ensure the safe and stable operation of high wind power penetration systems, it is necessary to accurately evaluate the ability of wind power to connect to the grid [13]. To this end, the maximum frequency deviation and frequency change rate constraints are considered, and the maximum wind power penetration that the system can access is calculated.
4.1. Calculation of Wind Power Penetration Limit Considering Maximum Frequency Deviation Constraint
The maximum frequency deviation indicator mainly reflects the depth of the frequency drop. If the value is too large, it will trigger the low-frequency load shedding device, and in severe cases, it will lead to system frequency collapse. Therefore, the limit of this indicator needs to be restricted. The power grid operation guidelines stipulate that the maximum frequency deviation of the system cannot exceed 1.0 Hz, and when the margin is considered, the limit will be even smaller [14].
Assuming that the constraint limit for the maximum frequency deviation is Δfmax-cr, we can obtain from Equation (20):
wherein ; .
When Equation (21) is equal, the wind power permeability dw-cr1 can be calculated as the wind power permeability limit under the constraint of the maximum frequency deviation.
4.2. Calculation of the Wind Power Penetration Limit Considering the Frequency Change Rate Constraint
The frequency change rate indicator indicates the speed of frequency change. If its value is too large, the frequency will drop rapidly, and the frequency will drop significantly in a short period of time. Therefore, this indicator should also be restricted when considering the safe operation of the system frequency.
Assuming that the constraint limit for the rate of change of frequency is , we can obtain from Equation (17):
When Equation (22) is equal, the wind power permeability dw-cr2 at this time can be calculated as the wind power permeability limit value under the constraint of the frequency change rate.
Based on the analysis in Section 4.1 and Section 4.2, it can be seen that when considering both the maximum frequency deviation constraint and the frequency change rate constraint, the maximum wind power penetration rate that the system can be connected to can be determined to be:
5. Case Analysis
In order to verify the correctness and effectiveness of the frequency stability analysis method of the wind power grid-connected system in this chapter, the standard IEEE39-node system was still used as the test system for example analysis [15]. The system topology is shown in Figure 6, and the load of 800 MW was set at 5 s. The reference frequency of the system was 50 Hz, and the reference capacity was 1000 MVA.
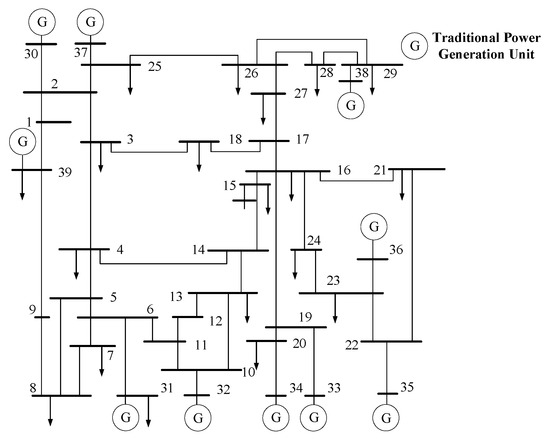
Figure 6.
Standard IEEE39-node network topology diagram.
5.1. Simulation Analysis of the Mechanism of the Influence of Wind Power Grid Connection on System Frequency Stability
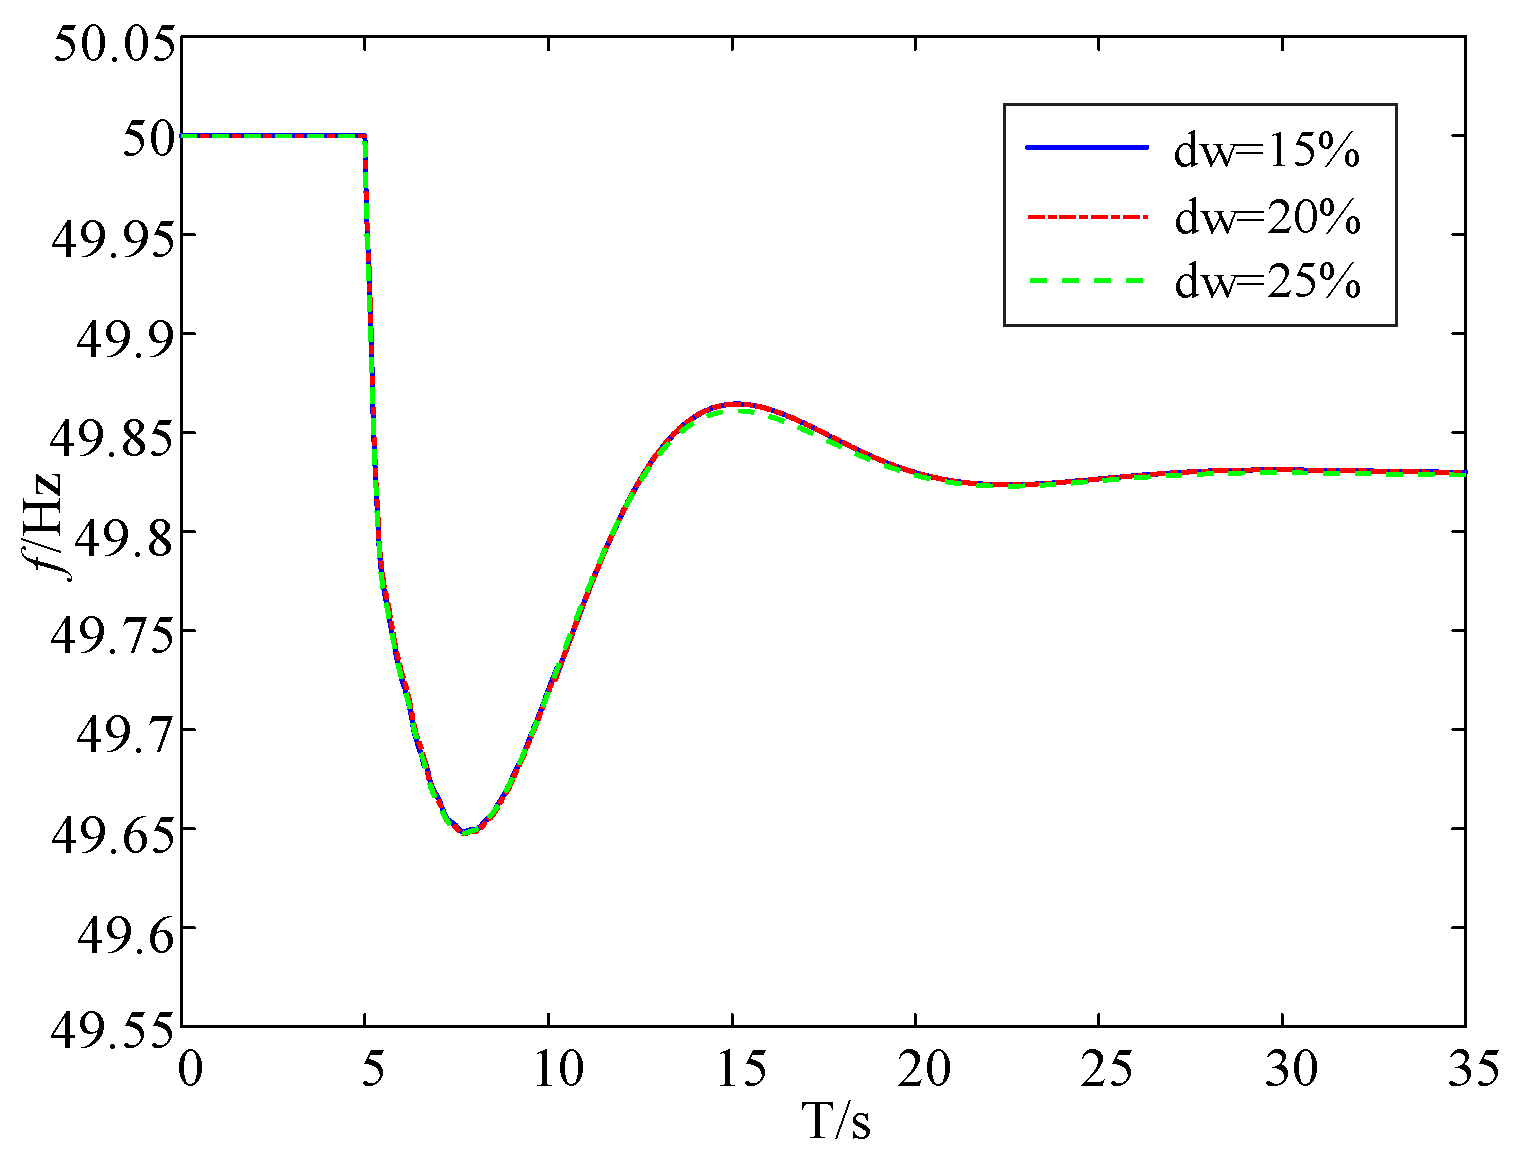
- (1)
- Wind power grid connection only changes the output of synchronous machines
When the wind farm was connected to node 22, wind power connected to the grid only changed the output of the synchronous machine, and the equivalent inertia time constant of the synchronous machine was set to 6, selected based on the typical inertia range of modern power systems with high renewable penetration. The wind power penetration rate was changed, and the frequency curve of the system under different penetration rates was obtained, as shown in Figure 7, which shows that when wind power grid connection only affects the output of synchronous machines, the system frequency characteristic curve is basically the same under different wind power penetration rates. When wind power grid connection only changes the output of synchronous machines, it will not affect the inertia level of the system.
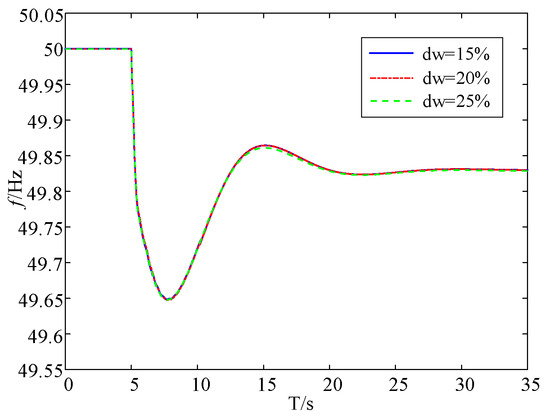
Figure 7.
System frequency characteristic curve when wind power is connected to the grid and only the output of the synchronous machines is changed.
- (2)
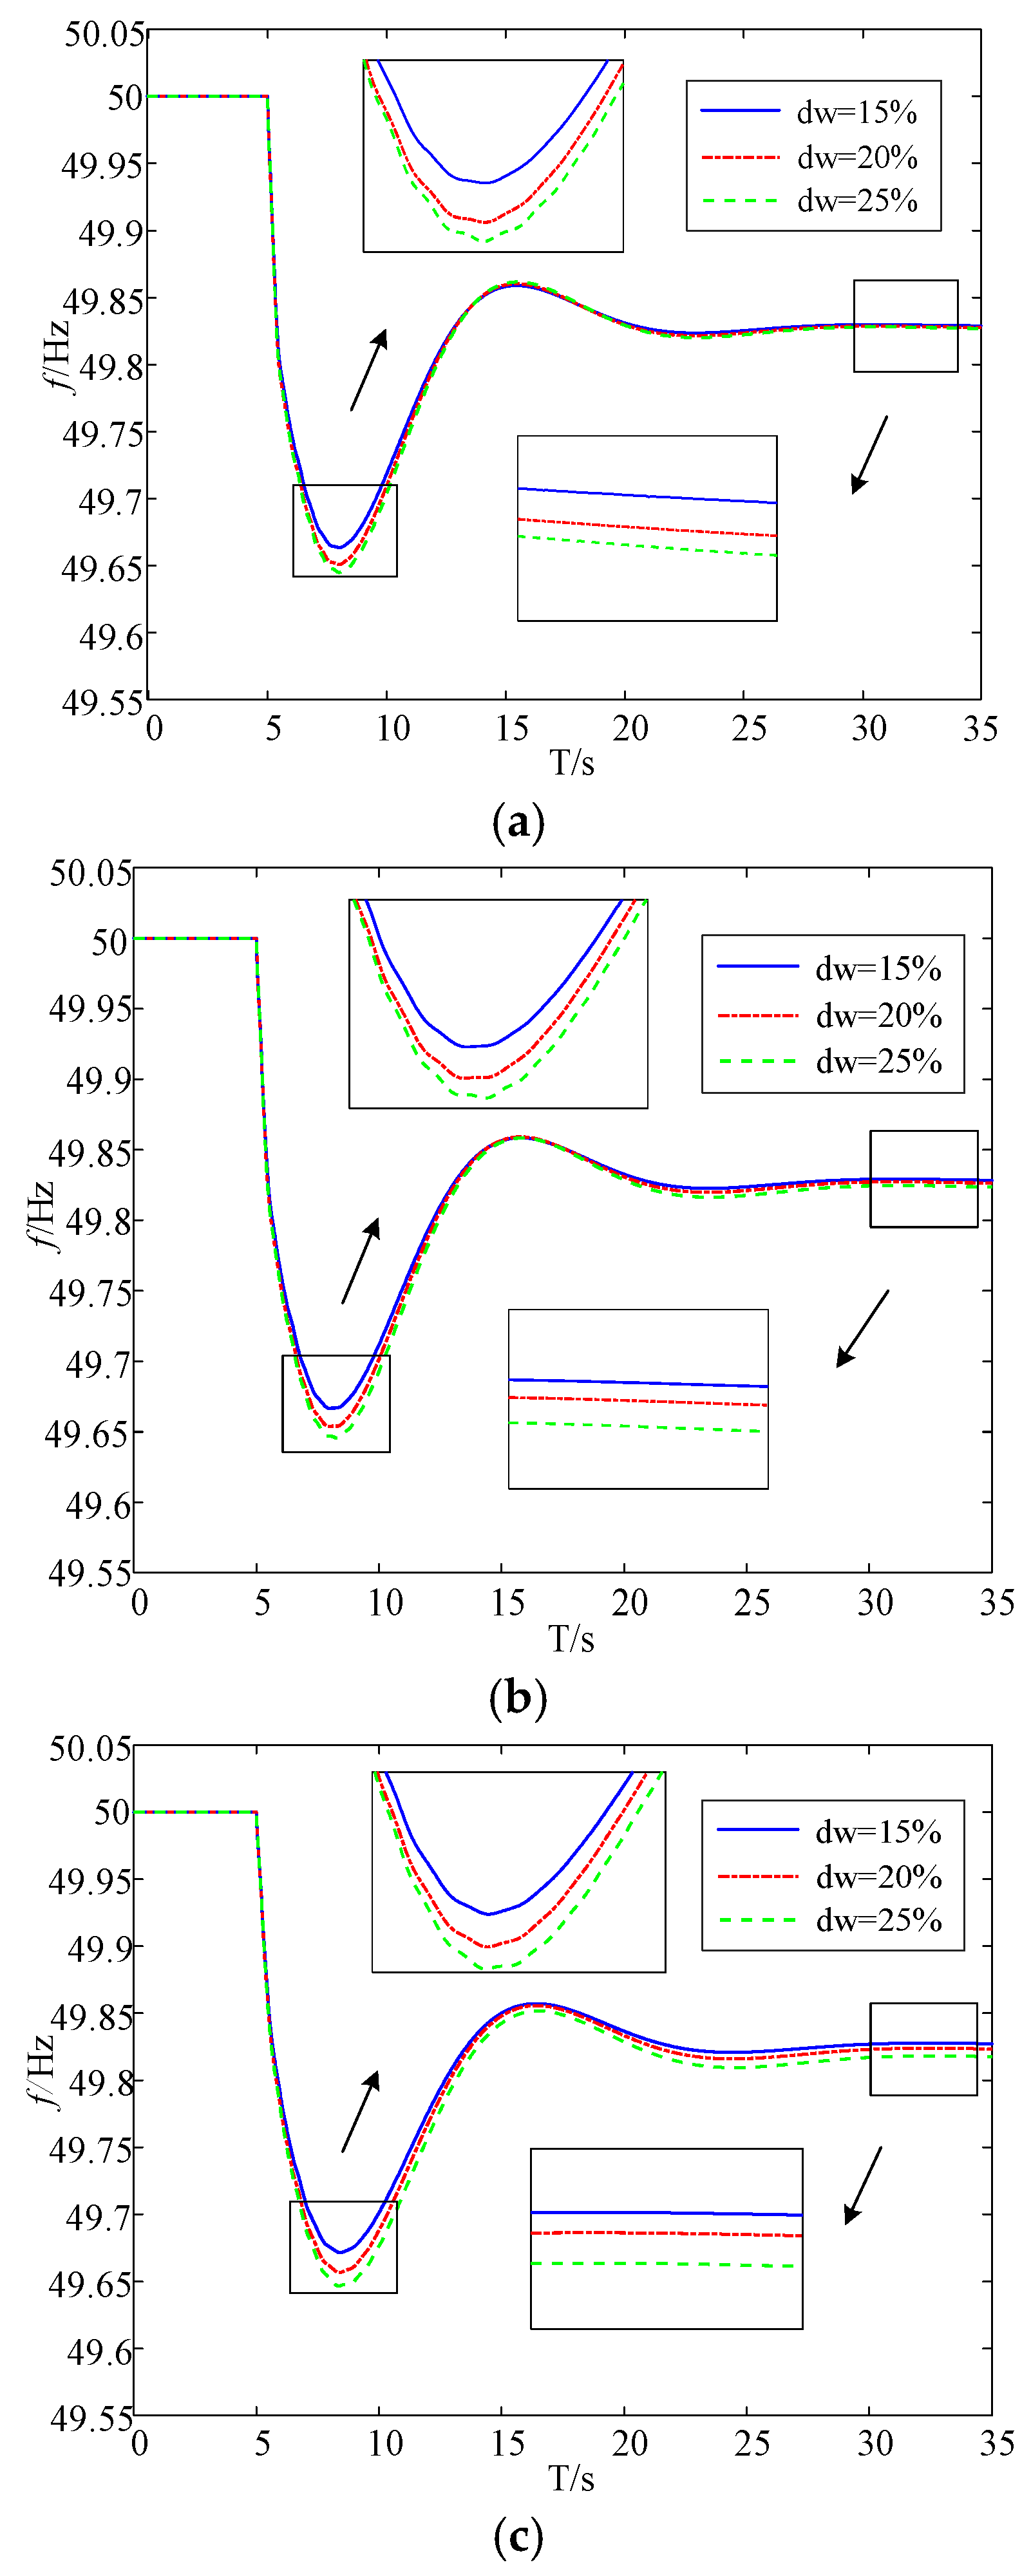
- Replacement of synchronous machines with equal capacity for wind turbines
Under different wind power penetrations, the system frequency characteristic curves when the equivalent inertia time constants were 3.0, 5.0, and 7.0, respectively, are shown in Figure 8a–c.
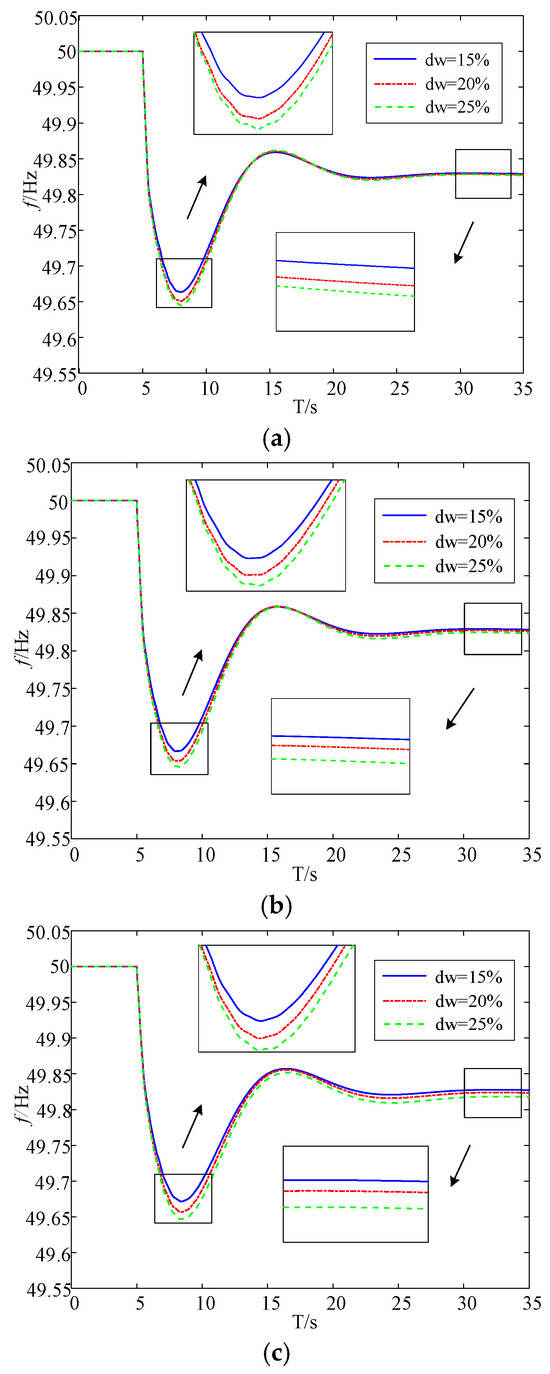
Figure 8.
System frequency characteristic curve when wind turbines replace synchronous machines. (a) System frequency characteristic curve when Hs = 3.0. (b) System frequency characteristic curve when Hs = 5.0. (c) System frequency characteristic curve when Hs = 7.0.
According to Figure 8a–c, when the synchronous machine was replaced by wind turbines with equal capacity, the maximum frequency deviation and steady-state frequency deviation of the system increased to a certain extent with the increase in wind power penetration, indicating that the inertia level of the system was reduced, and the anti-interference ability became worse.
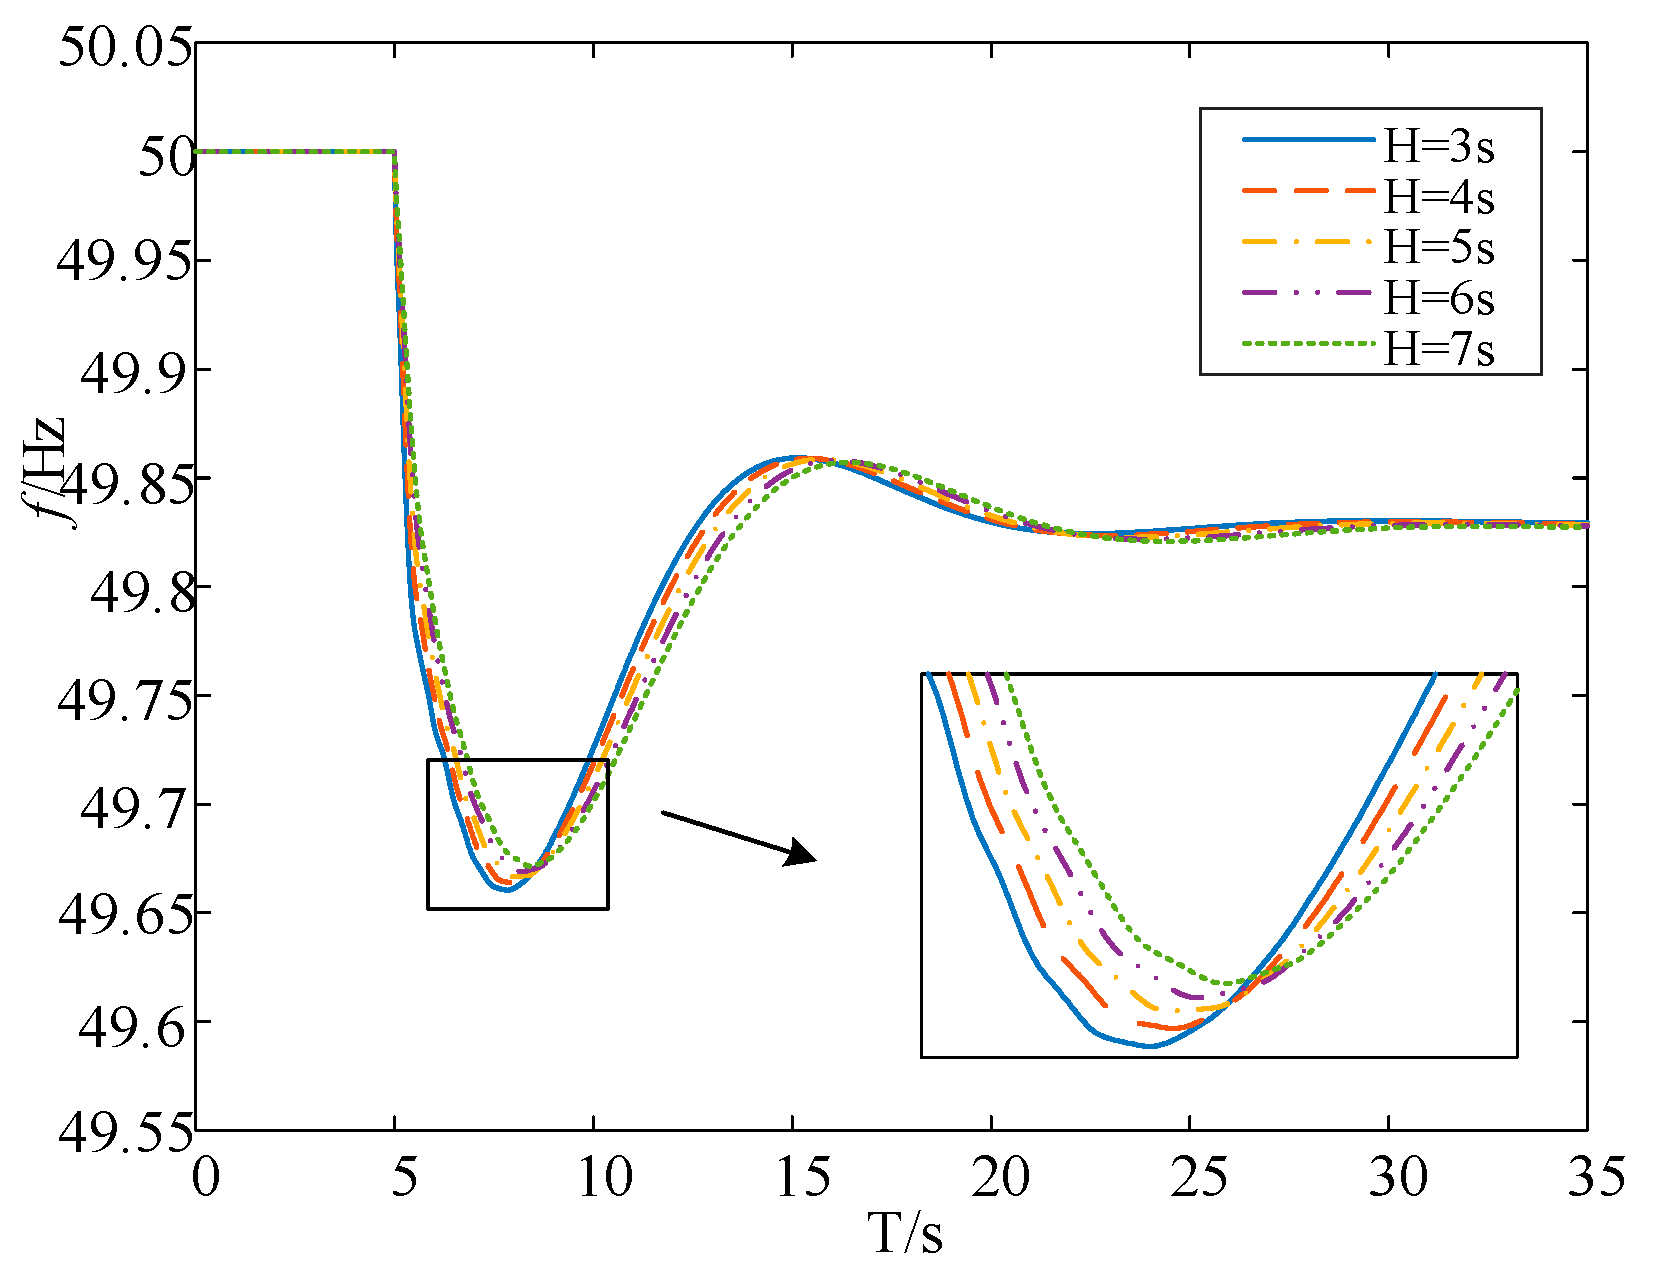
When the wind power penetration rate was 25%, the equivalent inertia time constant of the system was set to gradually decrease from 7 to 3 in unit increments of −1, and the frequency response curve of the system was obtained, as shown in Figure 9.
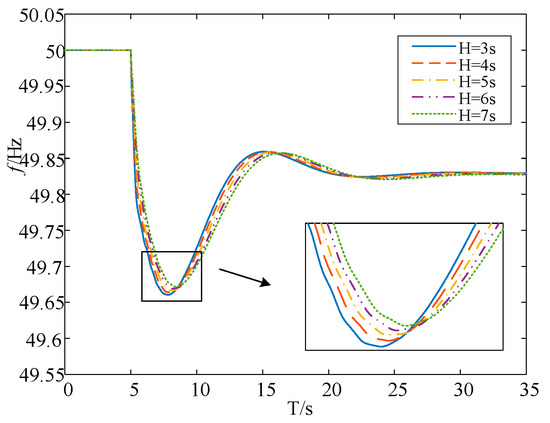
Figure 9.
System frequency characteristic curve under different equivalent inertia time constants.
Figure 9 suggests that the smaller the equivalent inertia time constant of the system and the greater the initial rate of change of the system frequency and the maximum frequency deviation, the smaller the moment corresponding to the lowest point of frequency, and the steady-state frequency deviation is basically unchanged.
5.2. Validation of the Validity of the Quantitative Relationship Between Frequency Stability Indicators and Wind Power Penetration
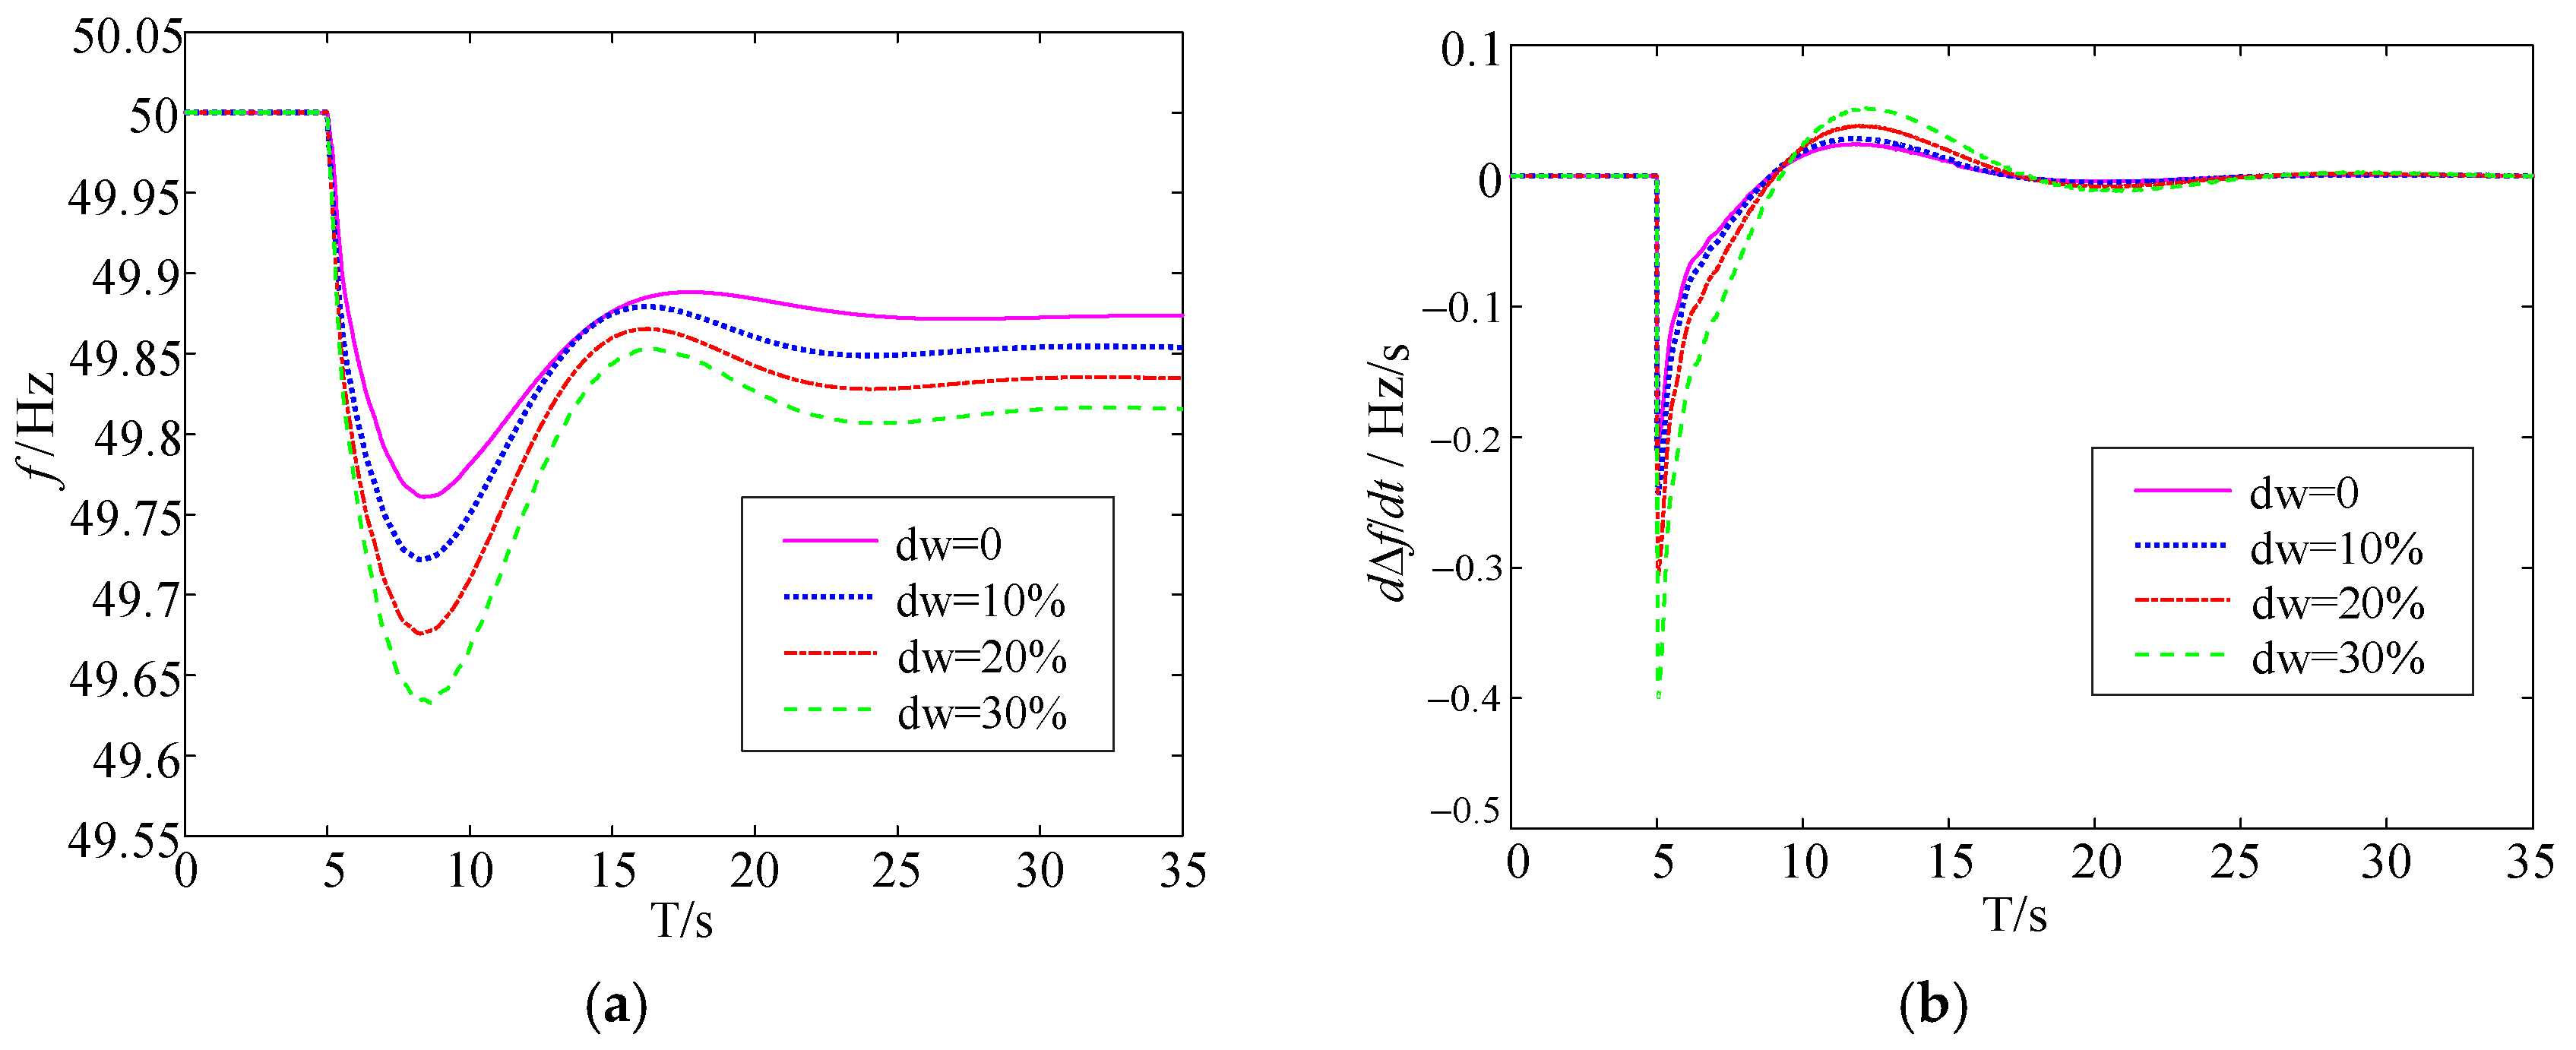
Figure 10a,b shows the time-domain simulation trajectories of the system’s frequency response characteristics and frequency change rate under different wind power penetrations, respectively. According to Equations (15), (17), (19), and (20), the values of each frequency stability index and the degree of influence by wind power changes were calculated, respectively, under wind power penetration rates of 0, 10%, 20%, and 30%, and the calculation results were compared with the simulation results, as shown in Table 1.
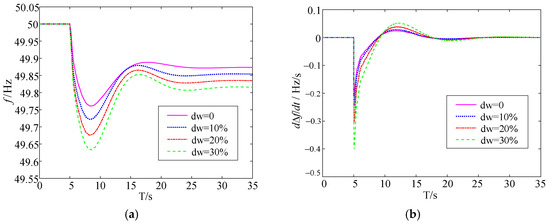
Figure 10.
System frequency response characteristics and frequency change rate curves under different permeabilities. (a) System frequency response characteristic curve; (b) system frequency change rate curve.

Table 1.
Analysis of the influence of wind power penetration on frequency stability indicators (calculated value/simulated value).
According to Table 1, the calculation results of the frequency stability index were basically consistent with the simulation results, which verified that the derived quantitative relationship between the frequency stability index and wind power penetration rate was accurate and effective. The calculation results showed that with the increase in wind power penetration, the frequency change rate, maximum frequency deviation, and steady-state frequency deviation all increased continuously, while the time to reach the lowest point remained unchanged. The calculation results of the influence degree suggest that the maximum frequency deviation and frequency change rate were most affected by wind power changes.
5.3. Calculation of Maximum Wind Power Penetration
From the analysis in Section 5.2, it can be seen that the system frequency change rate and the maximum frequency deviation had the highest correlation with the wind power permeability, indicating that it is reasonable to use them as constraints for the calculation of the maximum wind power permeability.
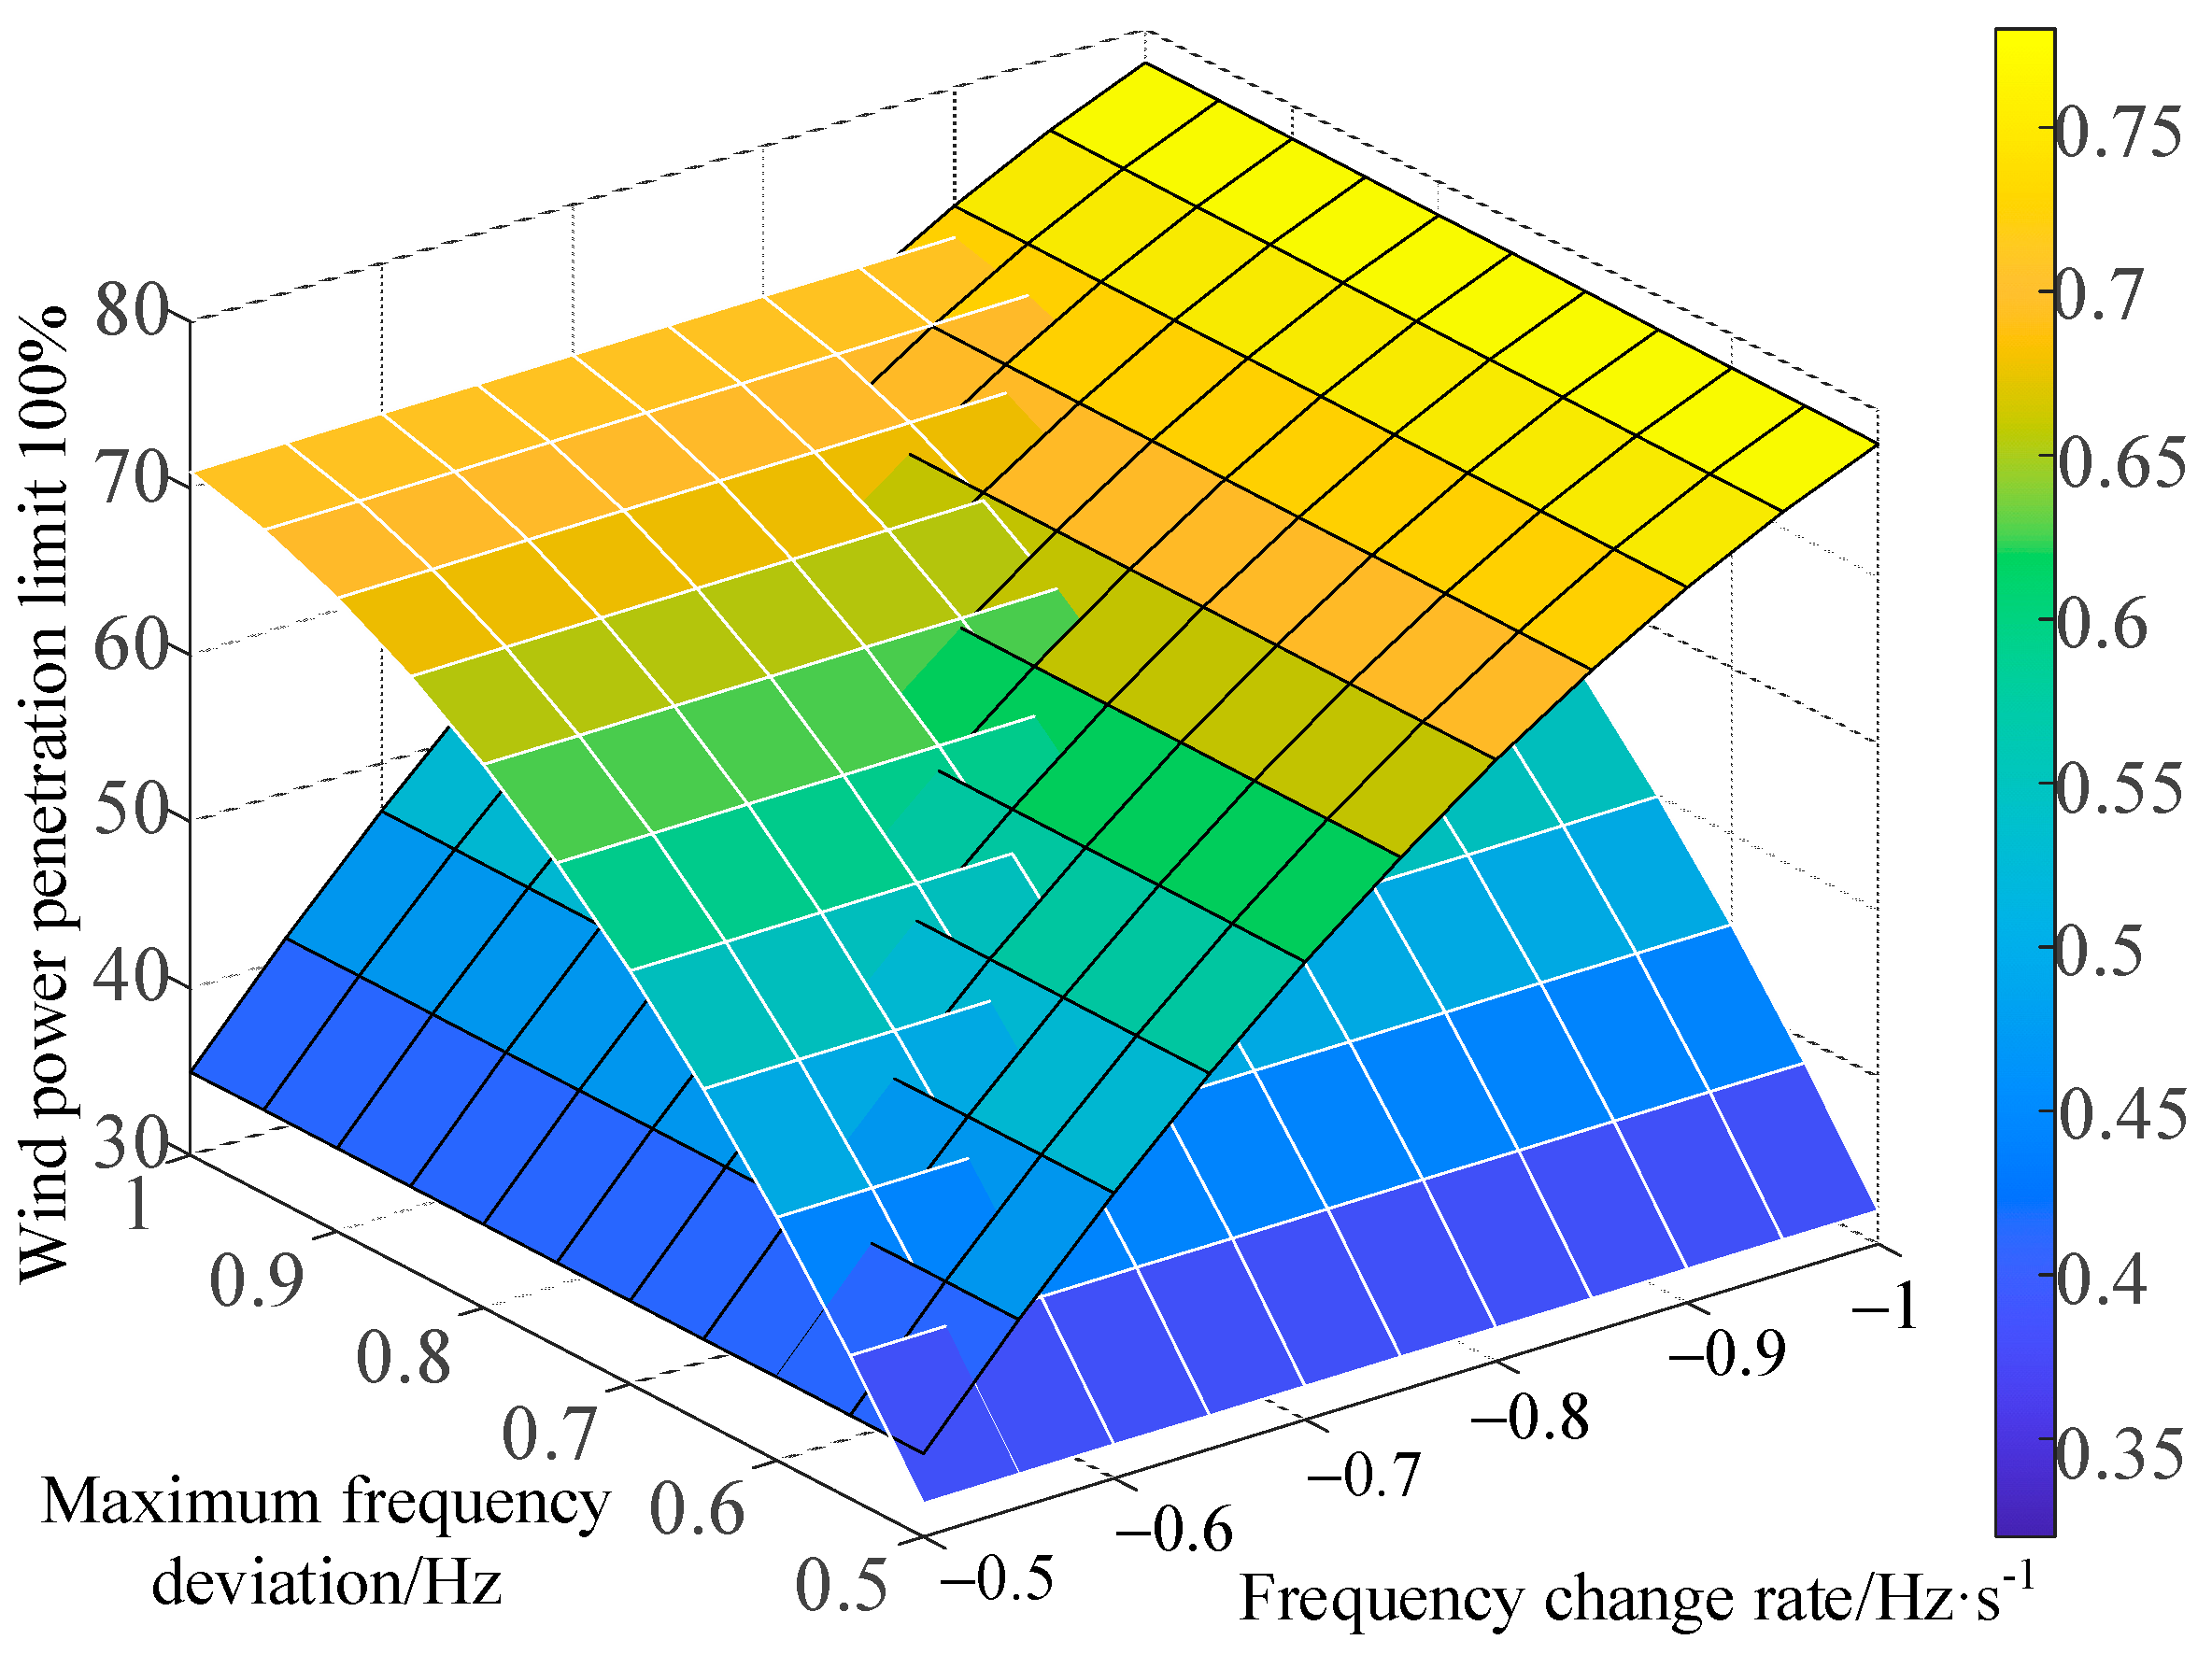
Based on the grid frequency stability requirements and taking into account margins, the constraint limits for this maximum frequency deviation, Δfmax-cr, and the constraint limits, , for the frequency change rate were set to 0.8 Hz and −0.5 Hz/s, respectively. In the case of an 800 MW power disturbance in the system, the limit change rule of wind power permeability under different frequency stability constraints can be obtained, according to Equations (15) and (20), as shown in Figure 11.
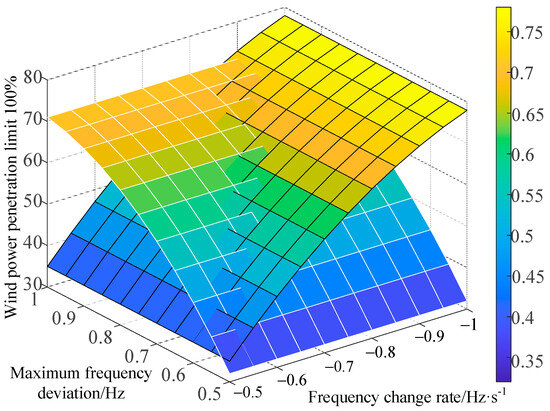
Figure 11.
Change rule of the wind power permeability limit under different frequency stability constraints.
According to Figure 11, the system’s maximum wind power permeability appeared as a black grid-line surface when only the frequency change rate constraint was considered, while the system’s maximum wind power permeability appeared as a white grid-line surface when only the maximum frequency deviation constraint was considered. The limit value of wind power permeability corresponded to the smaller point of the two surfaces when considering both the frequency change rate and the maximum frequency deviation. It can be seen from Figure 12 that when Δfmax-cr was 0.8 Hz, the wind power permeability limit dw-cr1 was 43.6%; when was −0.5 Hz, the wind power permeability limit dw-cr2 was 35%. According to Equation (23), the maximum wind power penetration dw-max considering frequency stability constraints was 35%.

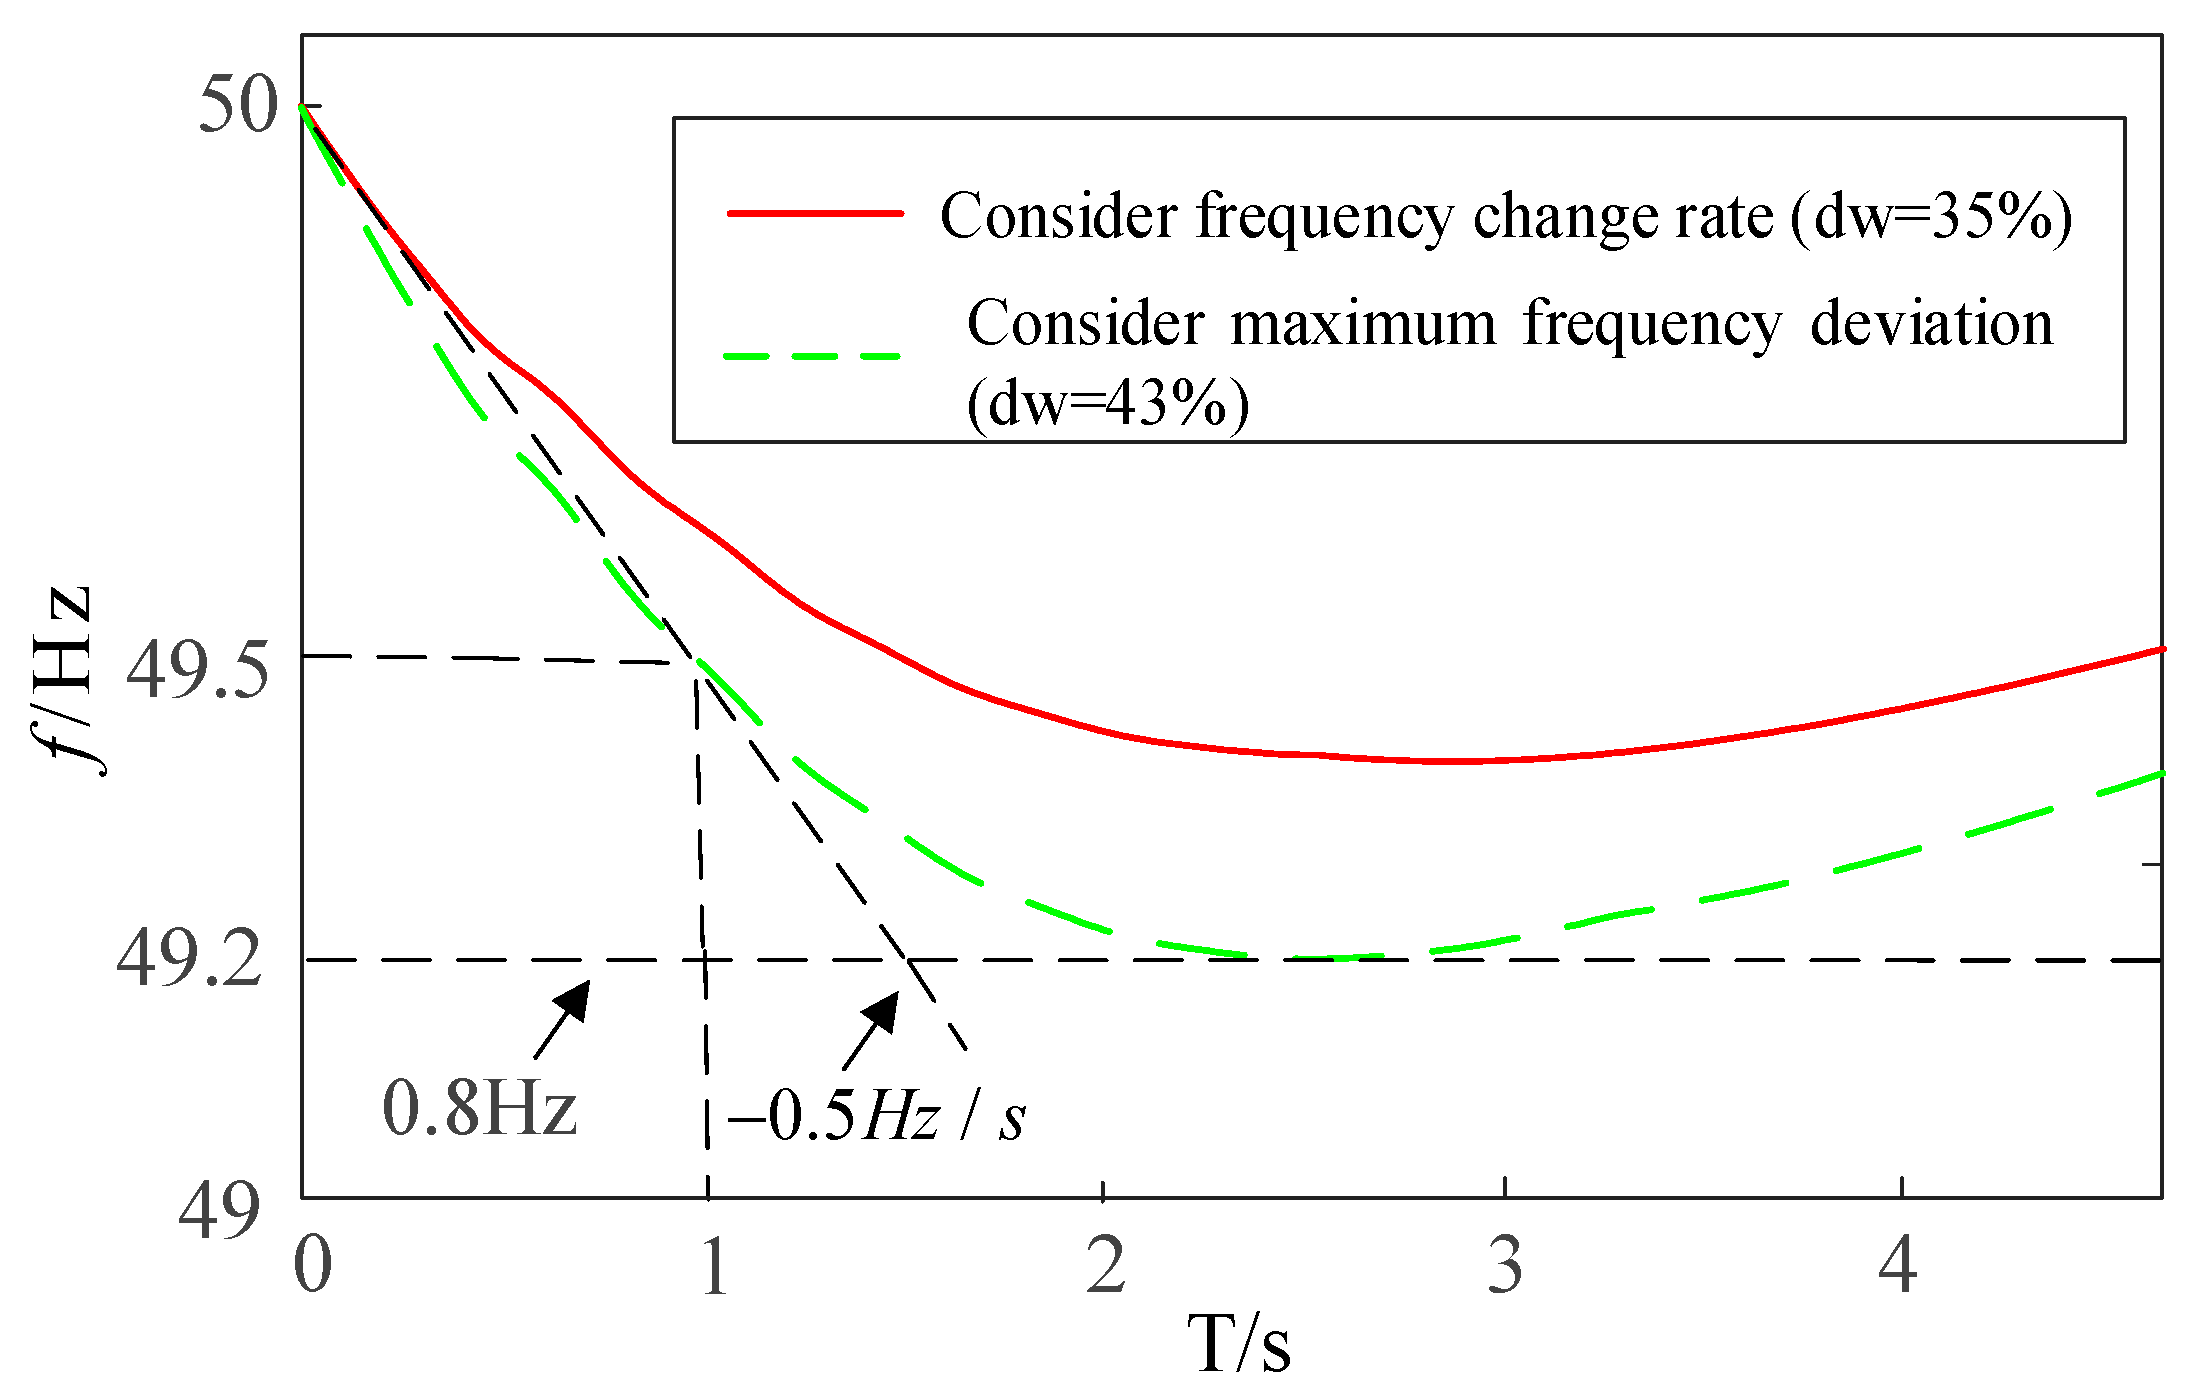
Figure 12.
System frequency response curve under maximum wind power penetration considering different frequency constraints.
In order to verify the accuracy and validity of this maximum wind power penetration calculation result, the synchronous machines at nodes 30, 36, 37, and 39 of the IEEE39-node system were replaced with double-fed wind turbines of equal capacity. At this time, the wind power penetration rate was 43%, which was close to the theoretical calculation result of 43.6%. The obtained frequency response simulation trajectory is shown in the green dotted line in Figure 12. The maximum frequency deviation of the system frequency response simulation trajectory was close to 0.8 Hz. Subsequently, the synchronous machines at nodes 31, 33, and 39 of the IEEE39-node system were replaced with double-fed wind turbines of equal capacity. At this time, the wind power penetration rate was 35%, and the frequency change rate of the system frequency response simulation trajectory was close to −0.5 Hz/s, which is consistent with the theoretical calculation results. The resulting frequency response simulation trajectory is shown as the solid red line in Figure 12.
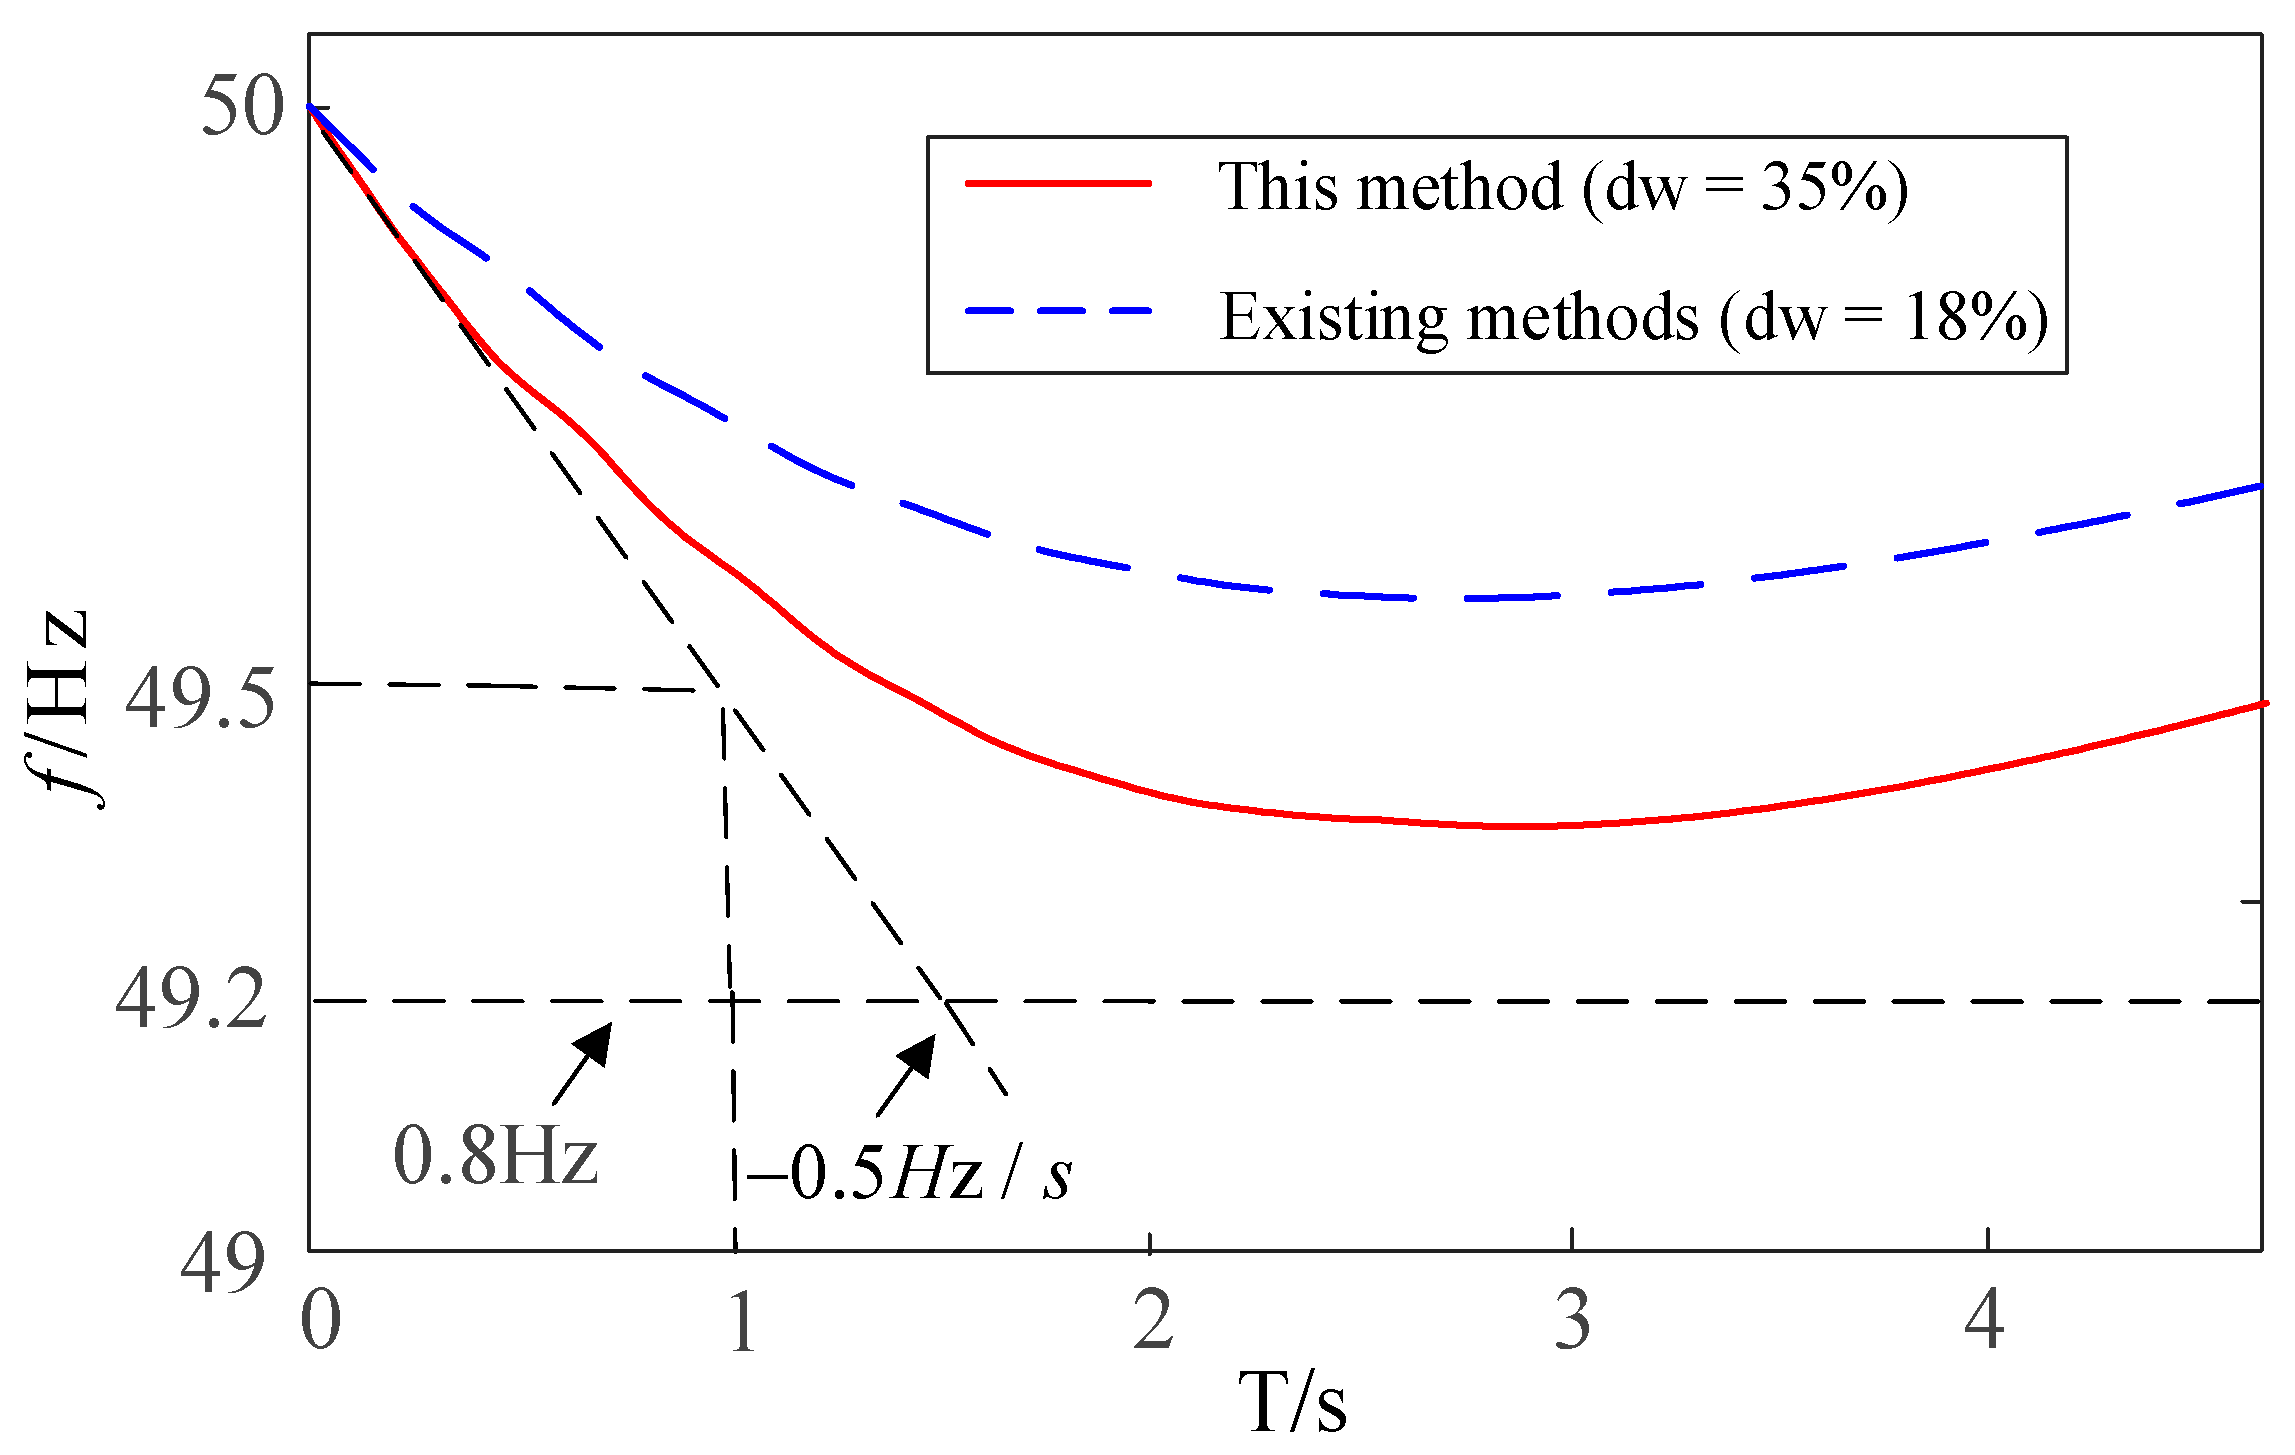
In order to further illustrate the superiority of this maximum wind power penetration calculation method, it was compared with the existing literature method that ignores the impact of the grid connection of double-fed fans on the operation mode of synchronous machines. When the maximum frequency deviation and frequency change rate constraint limits were 0.8 Hz and −0.5 Hz/s, respectively, the wind power penetration limit obtained by the existing method was 18%. The synchronous machines at nodes 36 and 37 of the IEEE39-node system were replaced with double-fed wind turbines of equal capacity, and the wind power penetration rate of the system was 18%. The simulation trajectory of the system frequency response is shown by the blue dotted line in Figure 13.
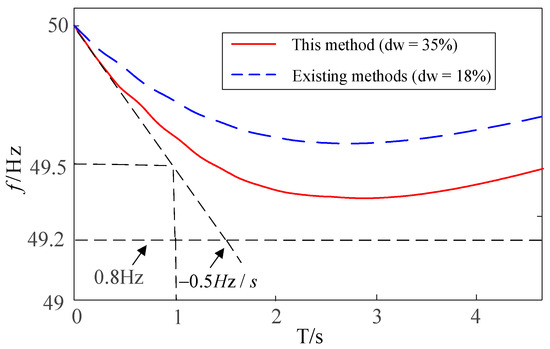
Figure 13.
System frequency response curve at maximum wind power permeability.
According to Figure 13, the results obtained by ignoring the influence of the double-fed wind turbine grid connection on the operation mode of the synchronous turbine were too conservative, and the maximum frequency deviation and frequency change rate did not reach the limit, which is not conducive to the further development of wind power. In contrast, this method improved the accuracy of wind power grid-connected capacity assessment while ensuring rapidity.
6. Conclusions
The influence mechanism of wind power access on the inertia characteristics and static frequency characteristics of the system was deeply analyzed from the different impact aspects of the connected double-fed wind turbines on the operating mode of synchronous machines, and the quantitative relationship between frequency stability indicators and wind power penetration was deduced. Subsequently, the system wind power penetration limit was quickly calculated based on the frequency change rate and maximum frequency deviation constraints, which enabled a quantitative evaluation of wind power grid-connected capabilities. Simulation results showed that this method can accurately quantify the impact of wind power changes on system frequency stability. At the same time, it can quickly solve the maximum wind power penetration rate that ensures system frequency stability. Compared with the existing literature methods, it significantly improves the accuracy of wind power grid-connected capability evaluation.
Author Contributions
Conceptualization, P.J. and G.M.; methodology, L.Y.; software, Y.S.; validation, P.J. and Y.S.; formal analysis, Y.S.; investigation, L.Y. and P.J.; resources, P.J.; data curation, P.J.; writing—original draft preparation, Y.S. and J.Z.; writing—review and editing, J.Z. and G.M.; visualization, Y.S.; supervision, X.J. and L.Y.; project administration, G.M.; funding acquisition, P.J. All authors have read and agreed to the published version of the manuscript.
Funding
This research was funded by The State Grid Henan Electric Power Company Technology Project, grant number 5217L0230007.
Data Availability Statement
Data are contained within the article.
Conflicts of Interest
The authors declare no conflict of interest.
References
- Li, B.; Chen, M.; Zhong, H.; Ma, Z.; Liu, D.; He, G. A Review of Long-term Planning of New Power Systems with Large Share of Renewable Energy. Proc. CSEE 2023, 43, 555–580. [Google Scholar]
- Zhuo, Z.; Zhang, N.; Xie, X.; Li, H.; Kang, C. Key Technologies and Developing Challenges of Power System with High Proportion of Renewable Energy. Autom. Electr. Power Syst. 2021, 45, 171–191. [Google Scholar]
- Ren, J.; Cheng, D.Z.; Song, Y.T. Influence of large-scale wind power integration on system frequency. Chin. J. Power Sources 2016, 40, 1491–1494. [Google Scholar]
- Ma, Y.D.; Liu, F.J.; Liu, P.L.; Yong, S.H.; Chen, J.; Liu, C.H.; Zhou, X.; Liu, Y.S. Analysis of the frequency characteristics of large-scale wind power grid-connected system considering under frequency load shedding response. Renew. Energy Resour. 2023, 41, 1352–1359. [Google Scholar]
- Cao, N.; Li, Z.P.; Yu, Q. Analysis on the Impact of LVRT of DFIG on Power Grid Frequency. Water Resour. Power 2021, 39, 161–164+145. [Google Scholar]
- Zhang, Q.W.; Wen, Y.F.; He, Y.; You, G.Z.; Li, H.X. Estimation of Medium-and Long-term Inertia Level Tendency for Power System and Its Application. Autom. Electr. Power Syst. 2024, 48, 54–65. [Google Scholar]
- Liu, Q.Y.; Yu, Z.H.; Zhang, L.L.; Lv, Y.; Wang, B.; Liu, T.; Xu, X. Online Frequency Support Capacity Assessment of Power Grid Based on Inertia Ratio. Power Syst. Technol. 2023, 47, 493–502. [Google Scholar]
- Guo, X.L.; Bi, T.S.; Liu, F.L.; Xu, G.Y.; Zhang, F.; Wang, H. Estimating maximum penetration level of renewable energy based on frequency stability constrains in networks with high-penetration wind and photovoltaic energy. Renew. Energy Resour. 2020, 38, 84–90. [Google Scholar]
- Hua, Y.Y. Assessment and Improvement of Wind Power Penetration Limits Considering Low Voltage Ride-Through Characteristics and Frequency Stability Constraints. Ph.D. Graduation Thesis, Zhejiang University, Hangzhou, China, 2023. [Google Scholar]
- Arani, M.; Mohamed, A. Analysis and mitigation of undesirable impacts of implementing frequency support controllers in wind power generation. IEEE Trans. Energy Convers. 2016, 31, 174–186. [Google Scholar] [CrossRef]
- Sun, H.D.; Wang, B.C.; Li, W.F.; Yang, C.; Wei, W.; Zhao, B. Research on Inertia System of Frequency Response for Power System with High Penetration Electronics. Proc. CSEE 2020, 40, 5179–5191. [Google Scholar]
- Saxena, A.; Shiva, C.K.; Shankar, R.; Vedik, B. Impacts of wind farms with multi-terminal HVDC system in frequency regulation using quasi-opposition pathfinder algorithm. Int. J. Syst. Assur. Eng. Manag. 2021, 12, 1–13. [Google Scholar] [CrossRef]
- Liu, K.T.; Wang, X.R. A Wide-Area Measurement Data Based Method for Power System Dynamic Frequency Analysis. Power Syst. Technol. 2013, 37, 2201–2206. [Google Scholar]
- Li, S.C.; Tian, B.J.; Li, H.Z.; Luo, Y.; Huang, S.Y.; Xu, S.L. Method for limiting wind power output in time periods based on frequency safety constraints and a critical inertia calculation. Power Syst. Prot. Control 2022, 50, 60–71. [Google Scholar]
- Ju, P.; Zheng, Y.; Jin, Y.; Qin, C.; Jiang, Y.; Cao, L. Analytic assessment of the power system frequency security. IET Gener. Transm. Distrib. 2021, 15, 2215–2225. [Google Scholar] [CrossRef]


Disclaimer/Publisher’s Note: The statements, opinions and data contained in all publications are solely those of the individual author(s) and contributor(s) and not of MDPI and/or the editor(s). MDPI and/or the editor(s) disclaim responsibility for any injury to people or property resulting from any ideas, methods, instructions or products referred to in the content. |
© 2025 by the authors. Licensee MDPI, Basel, Switzerland. This article is an open access article distributed under the terms and conditions of the Creative Commons Attribution (CC BY) license (https://creativecommons.org/licenses/by/4.0/).