
A Novel Hybrid FEM–Dynamic Modeling Approach for Enhanced Vibration Diagnostics in a Two-Stage Spur Gearbox


Abstract
1. Introduction
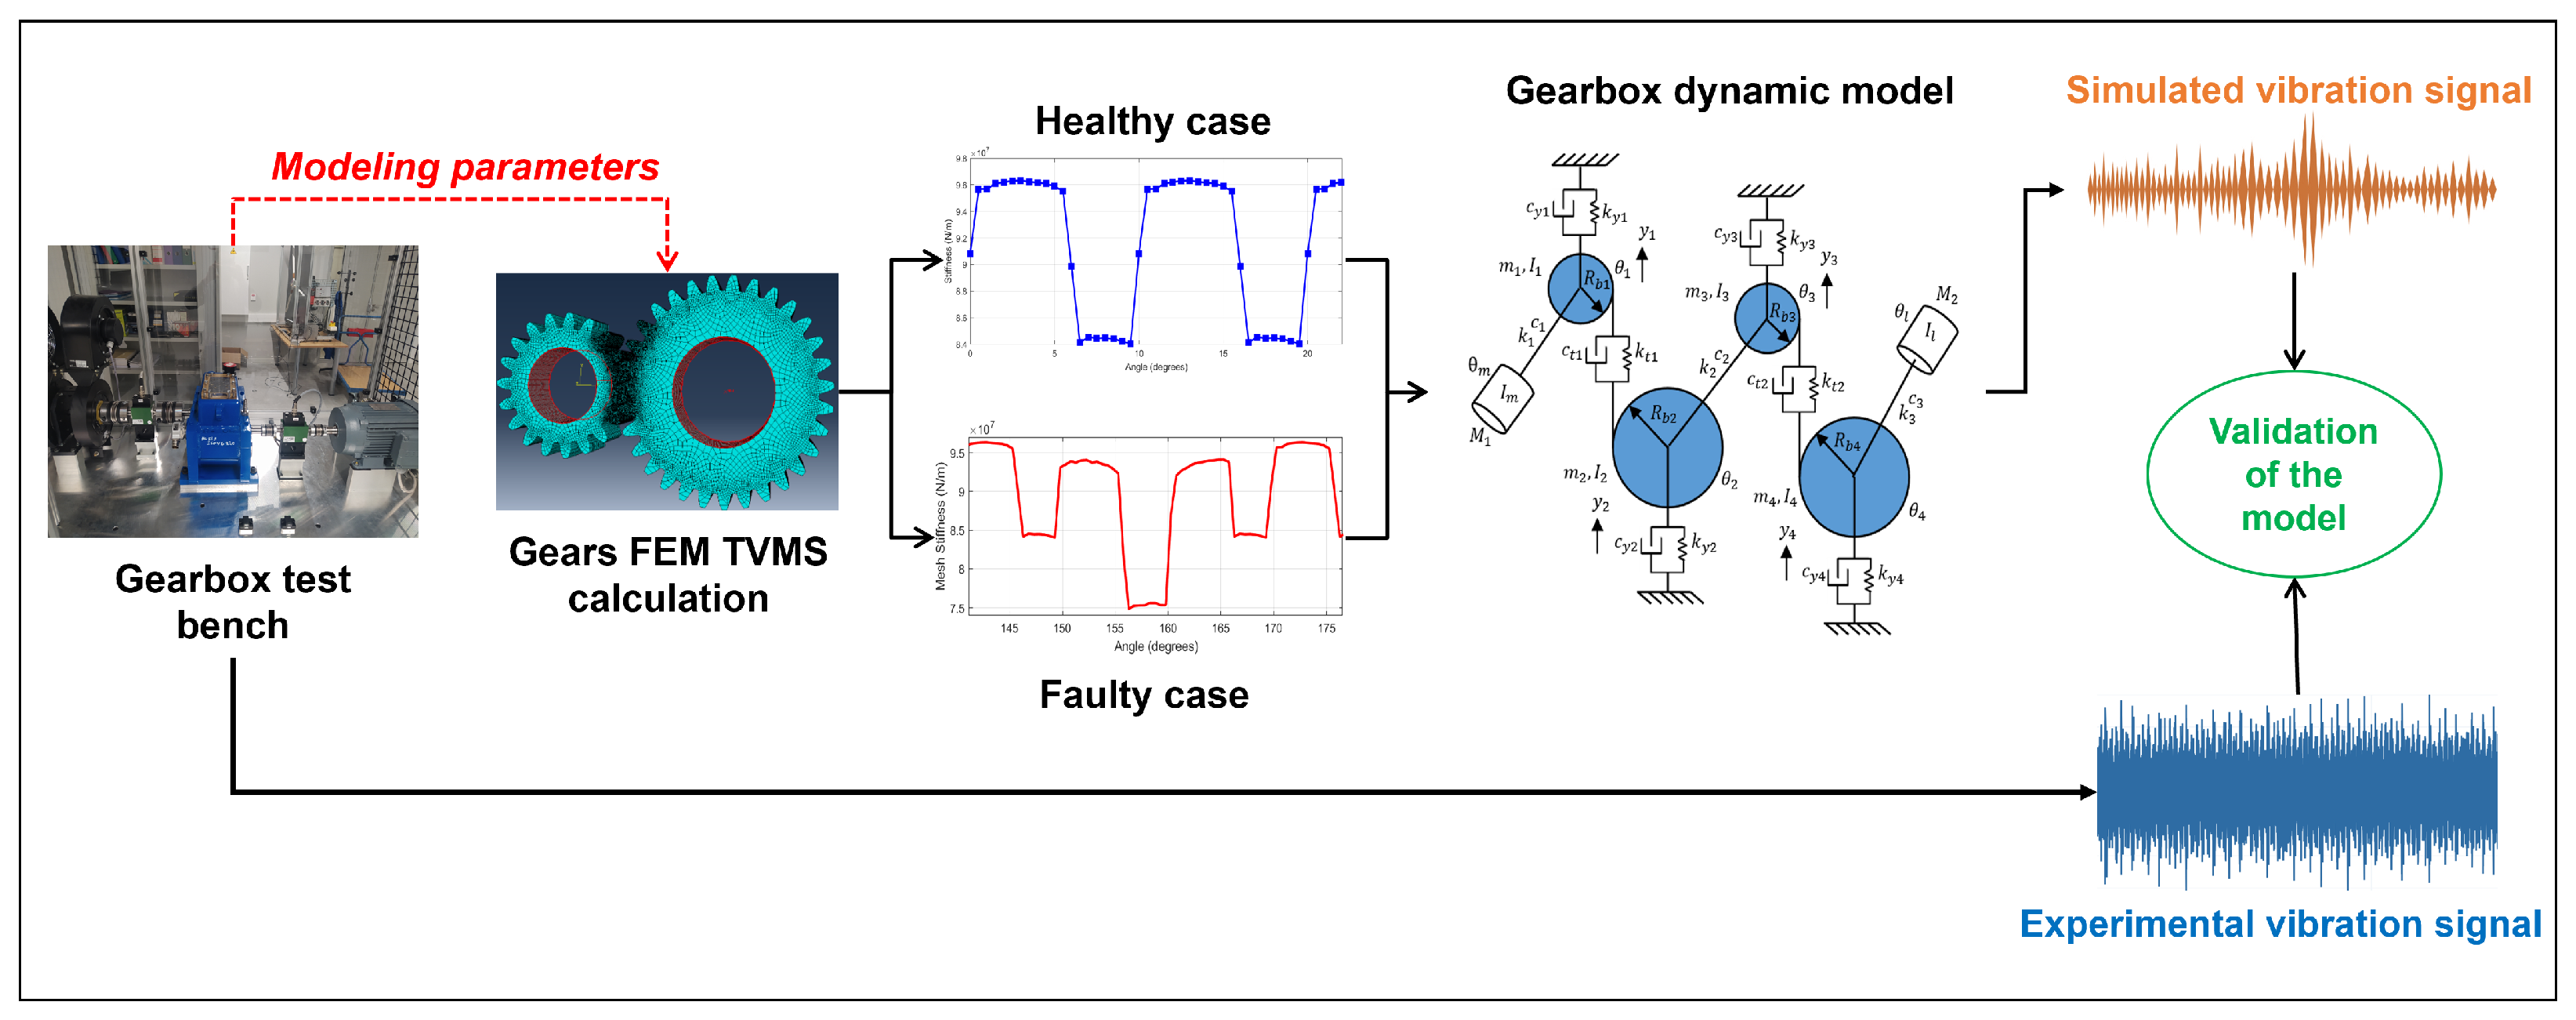
- Hybrid FEM–dynamic modeling approach: We propose a novel approach that integrates refined FEM-based stiffness estimation with a dynamic model of a two-stage gearbox. This method accurately simulates gear-body compliance and distributed load effects, effectively reproducing vibration responses under different fault scenarios.
- Parametric sensitivity analysis: We perform an extensive sensitivity analysis using the FEM approach on five critical parameters that impact TVMS estimation:
- -
- Load-dependent stiffness variations under operational torque.
- -
- Assembly tolerance-induced interaxial variations.
- -
- Tooth profile deviations and intentional geometry modifications.
- -
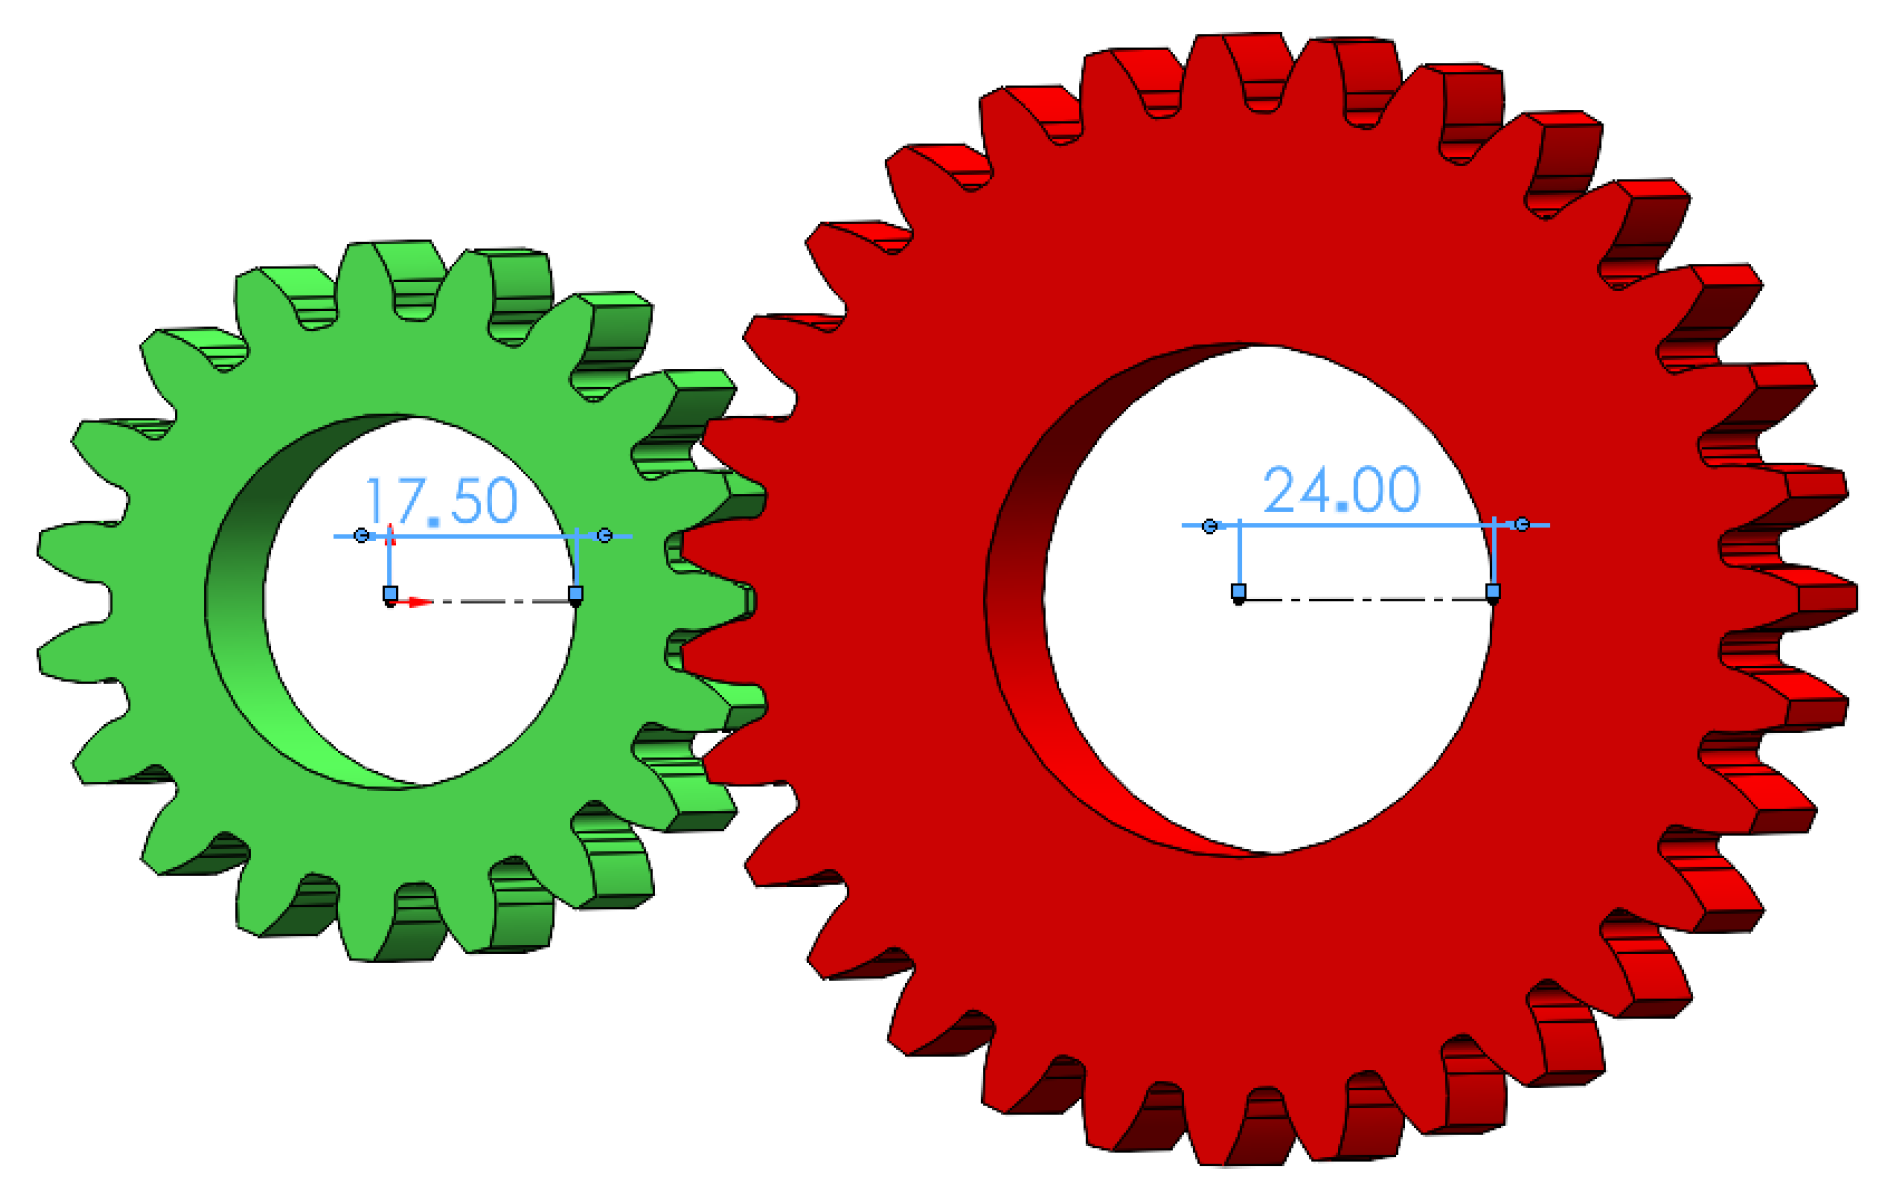
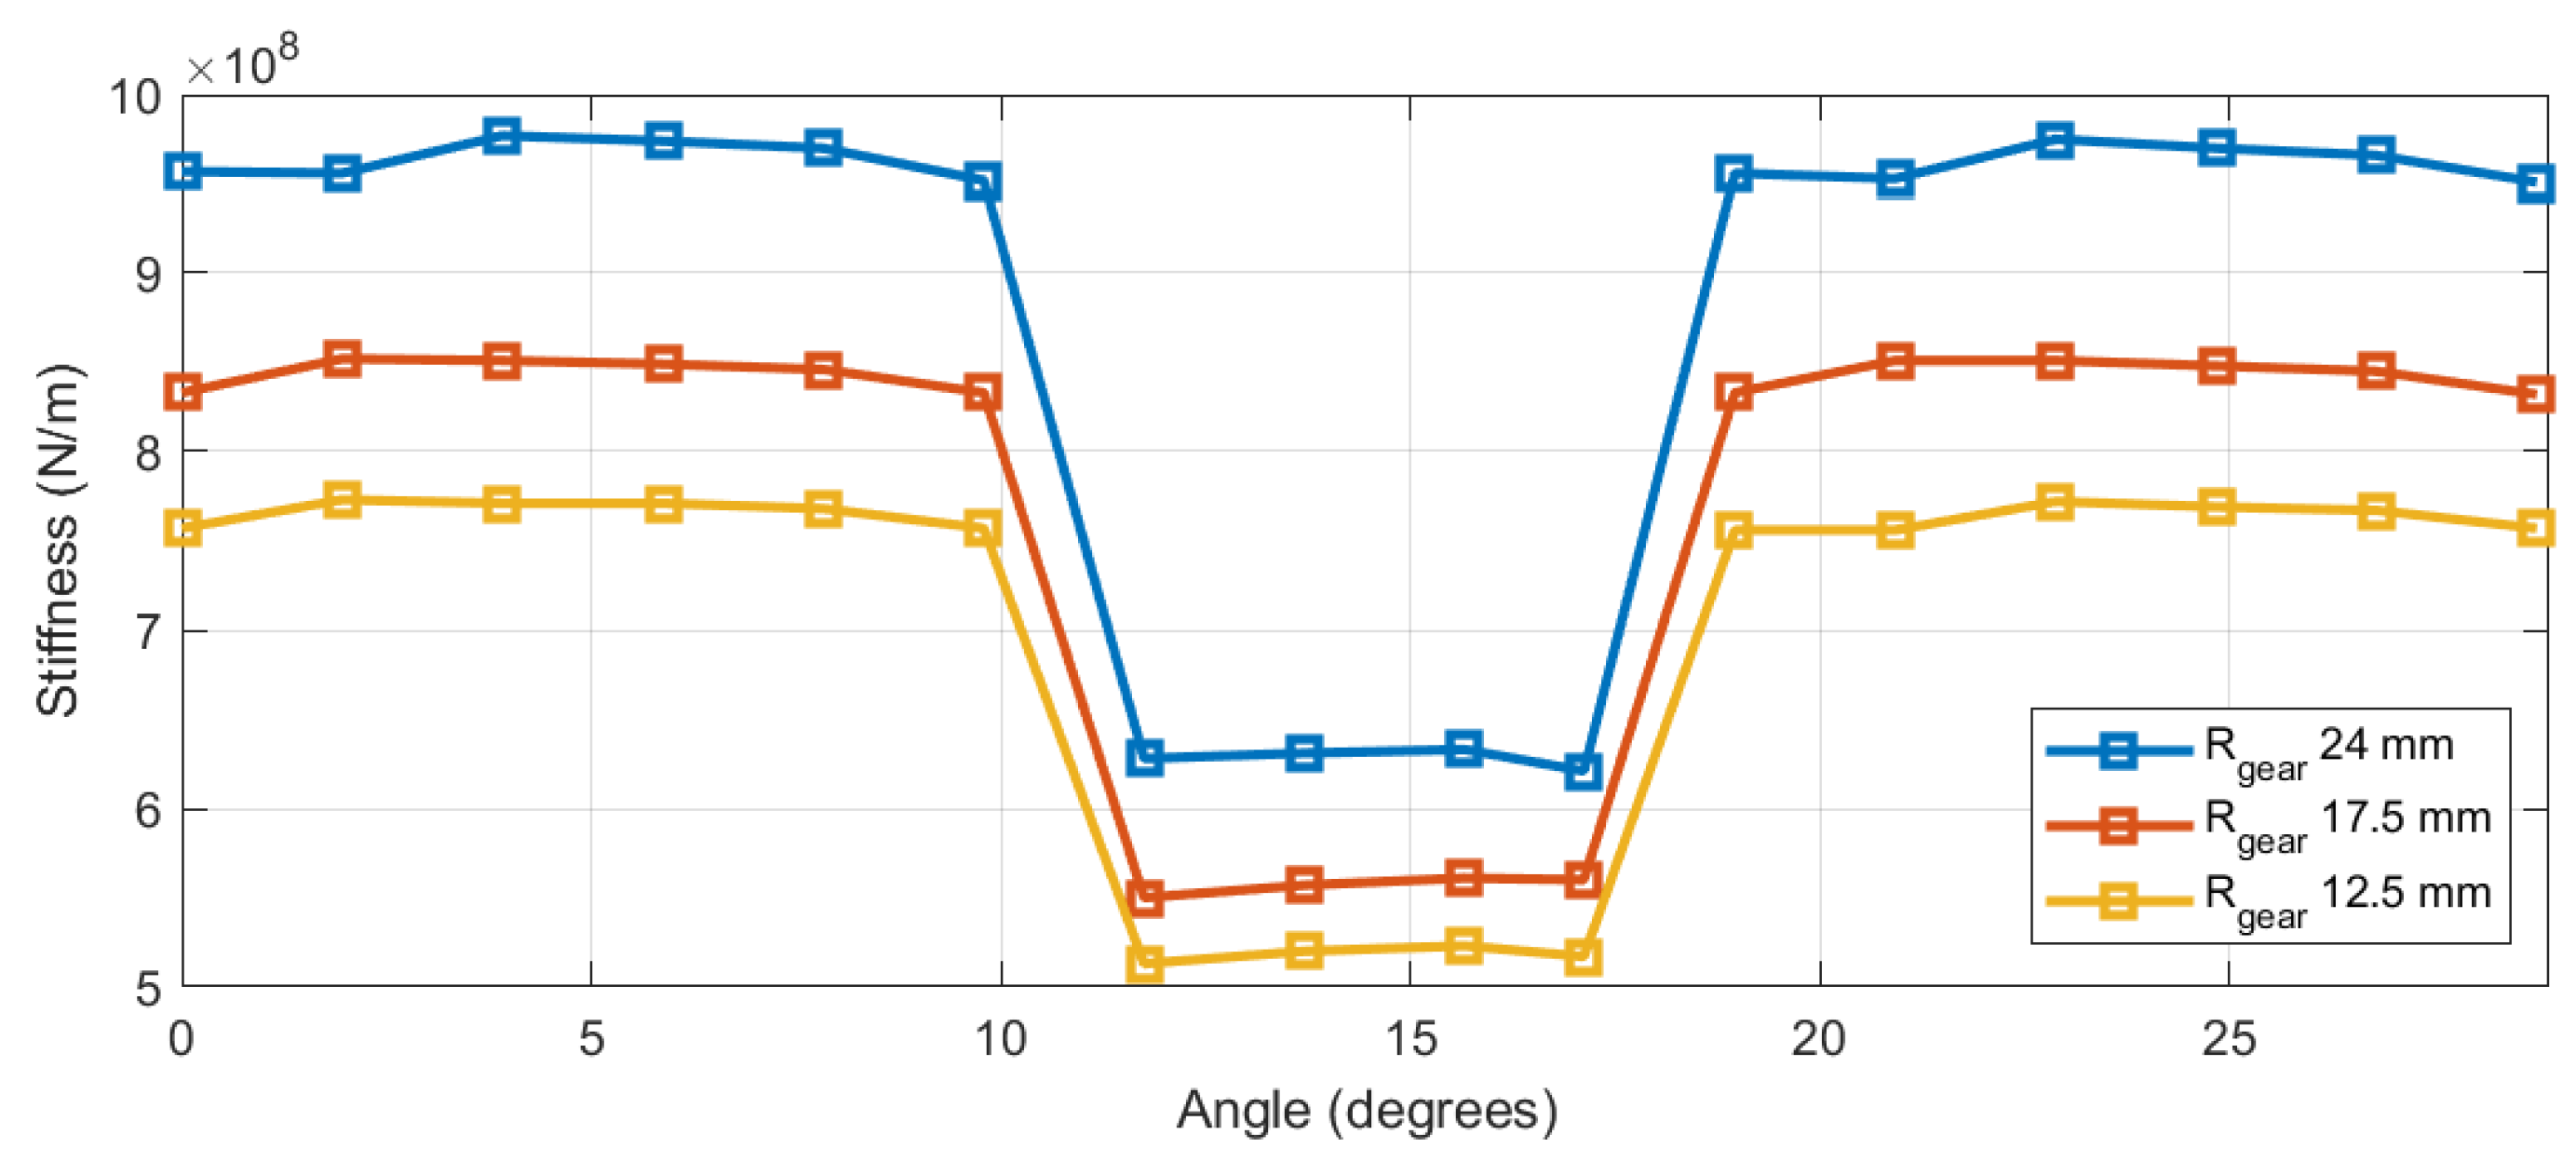
- Hub-radius effects on the overall stiffness response.
- -
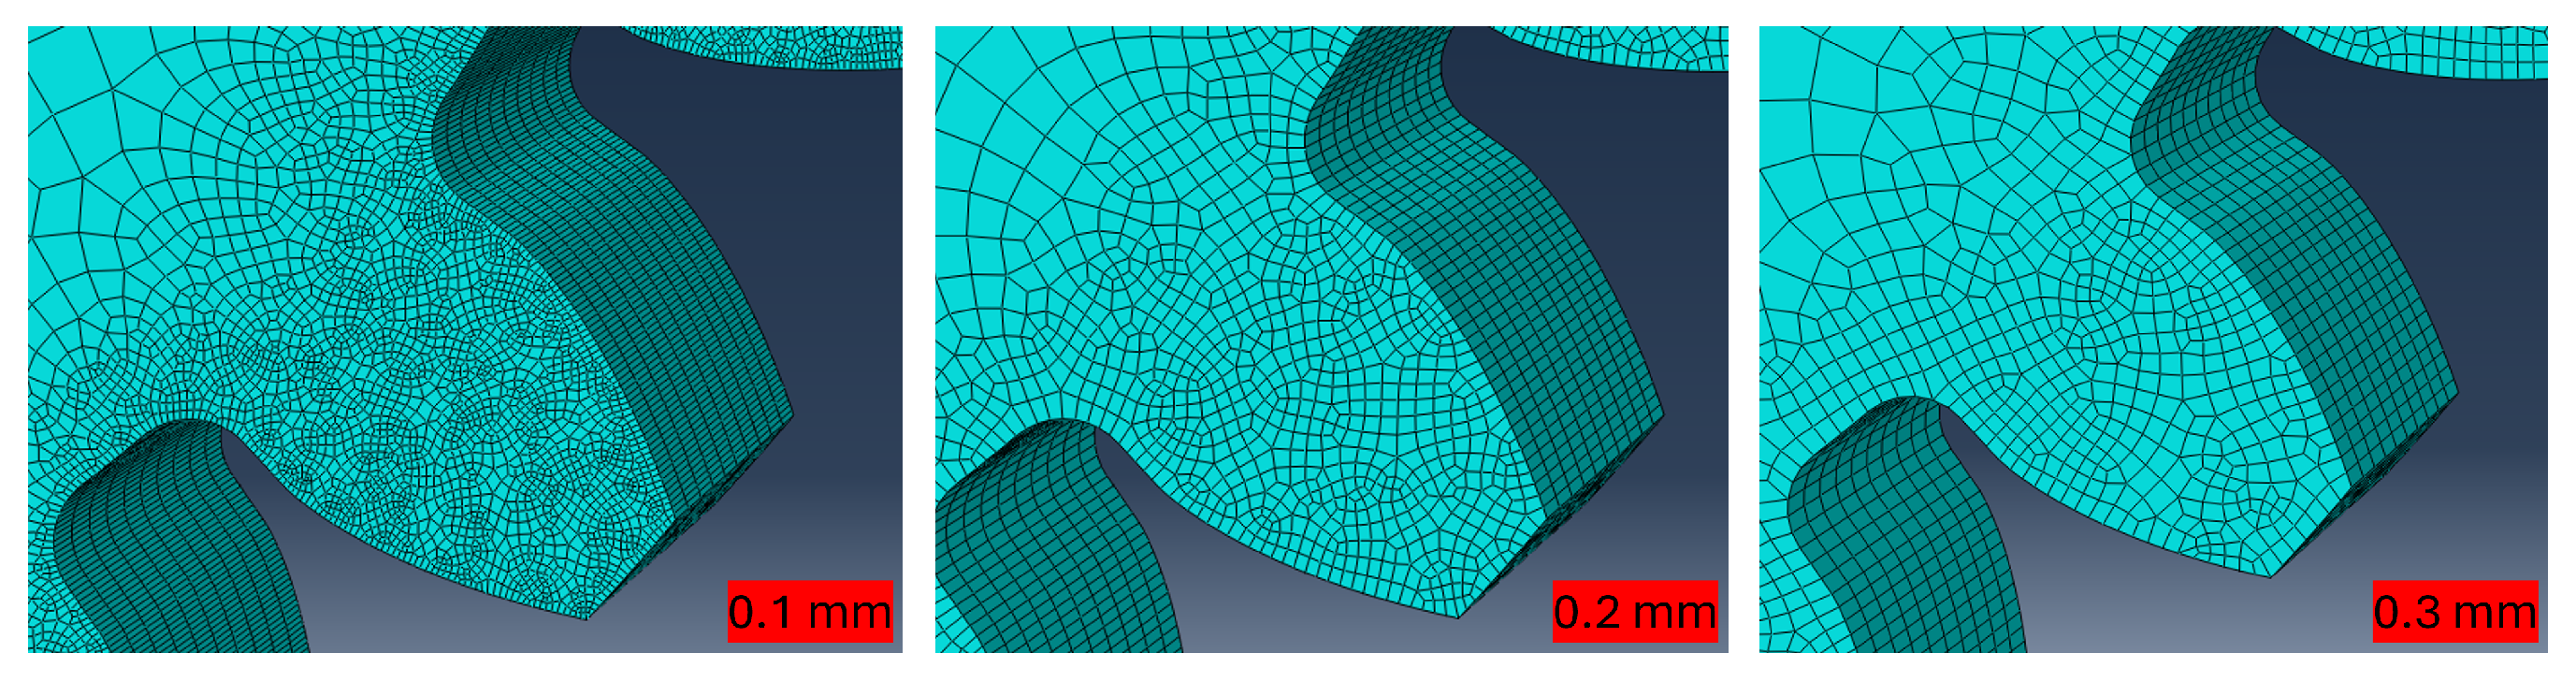
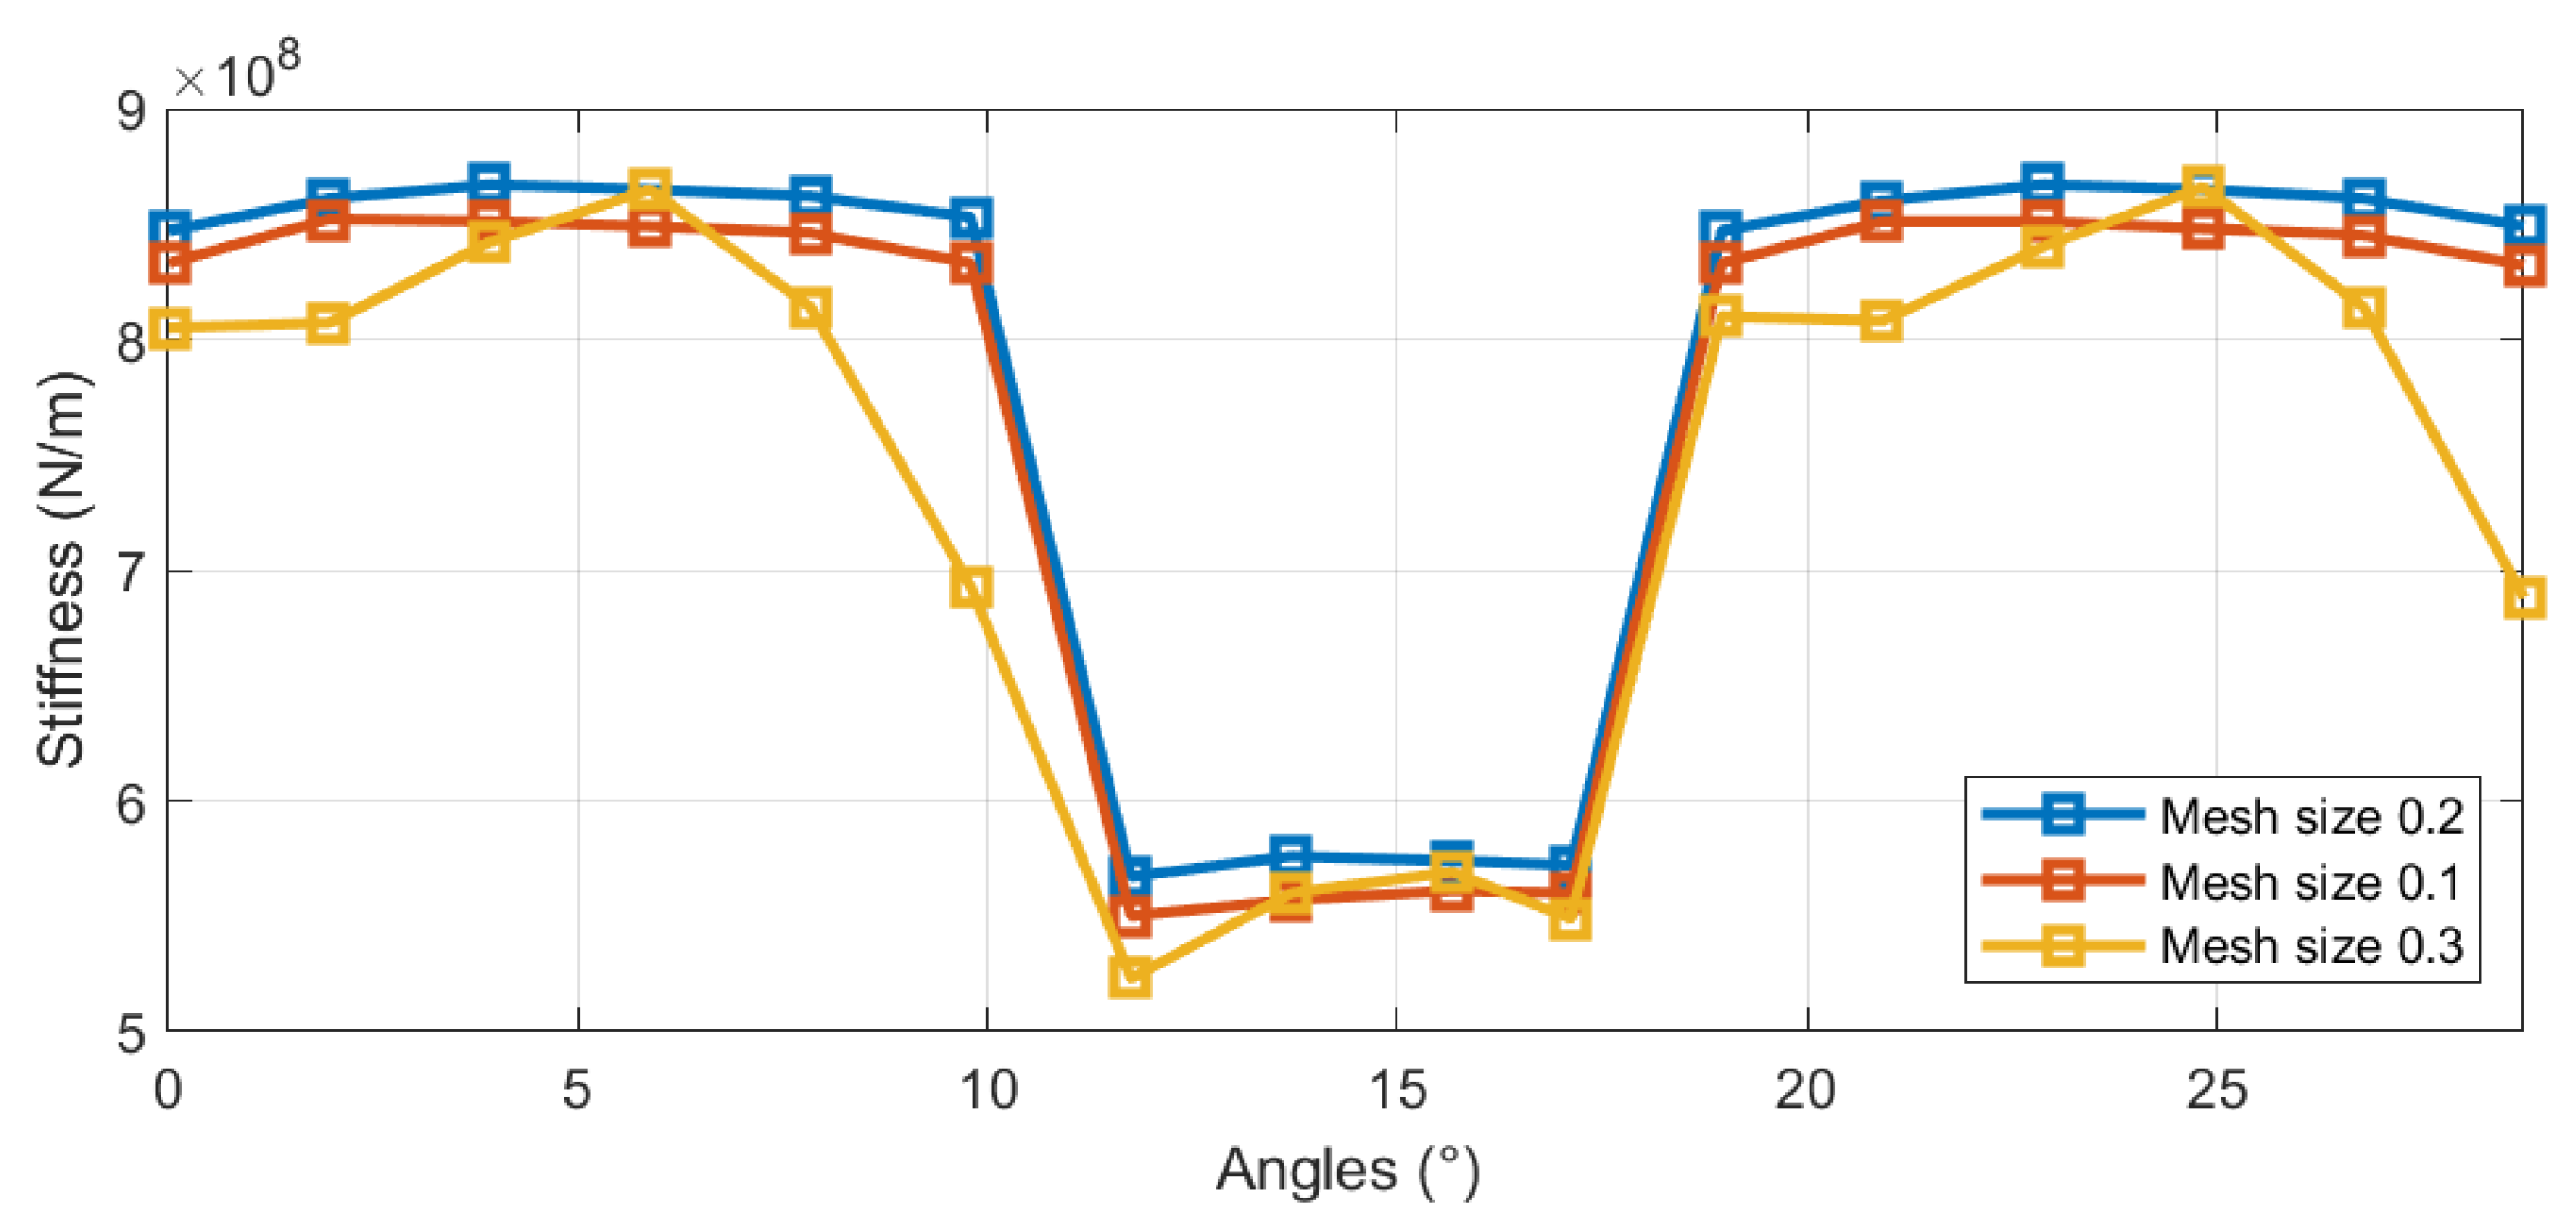
- Mesh convergence behavior in the contact zones.
- Integrated validation framework: We validate our methodology by using a closed-loop process that combines simulation and experimental data. The dynamic gearbox model generates vibration profiles for healthy and faulty conditions, and these are benchmarked against experimental results from a gearbox test bench, demonstrating the method’s capability to replicate the experimental signal characteristics.
2. Proposed Approach
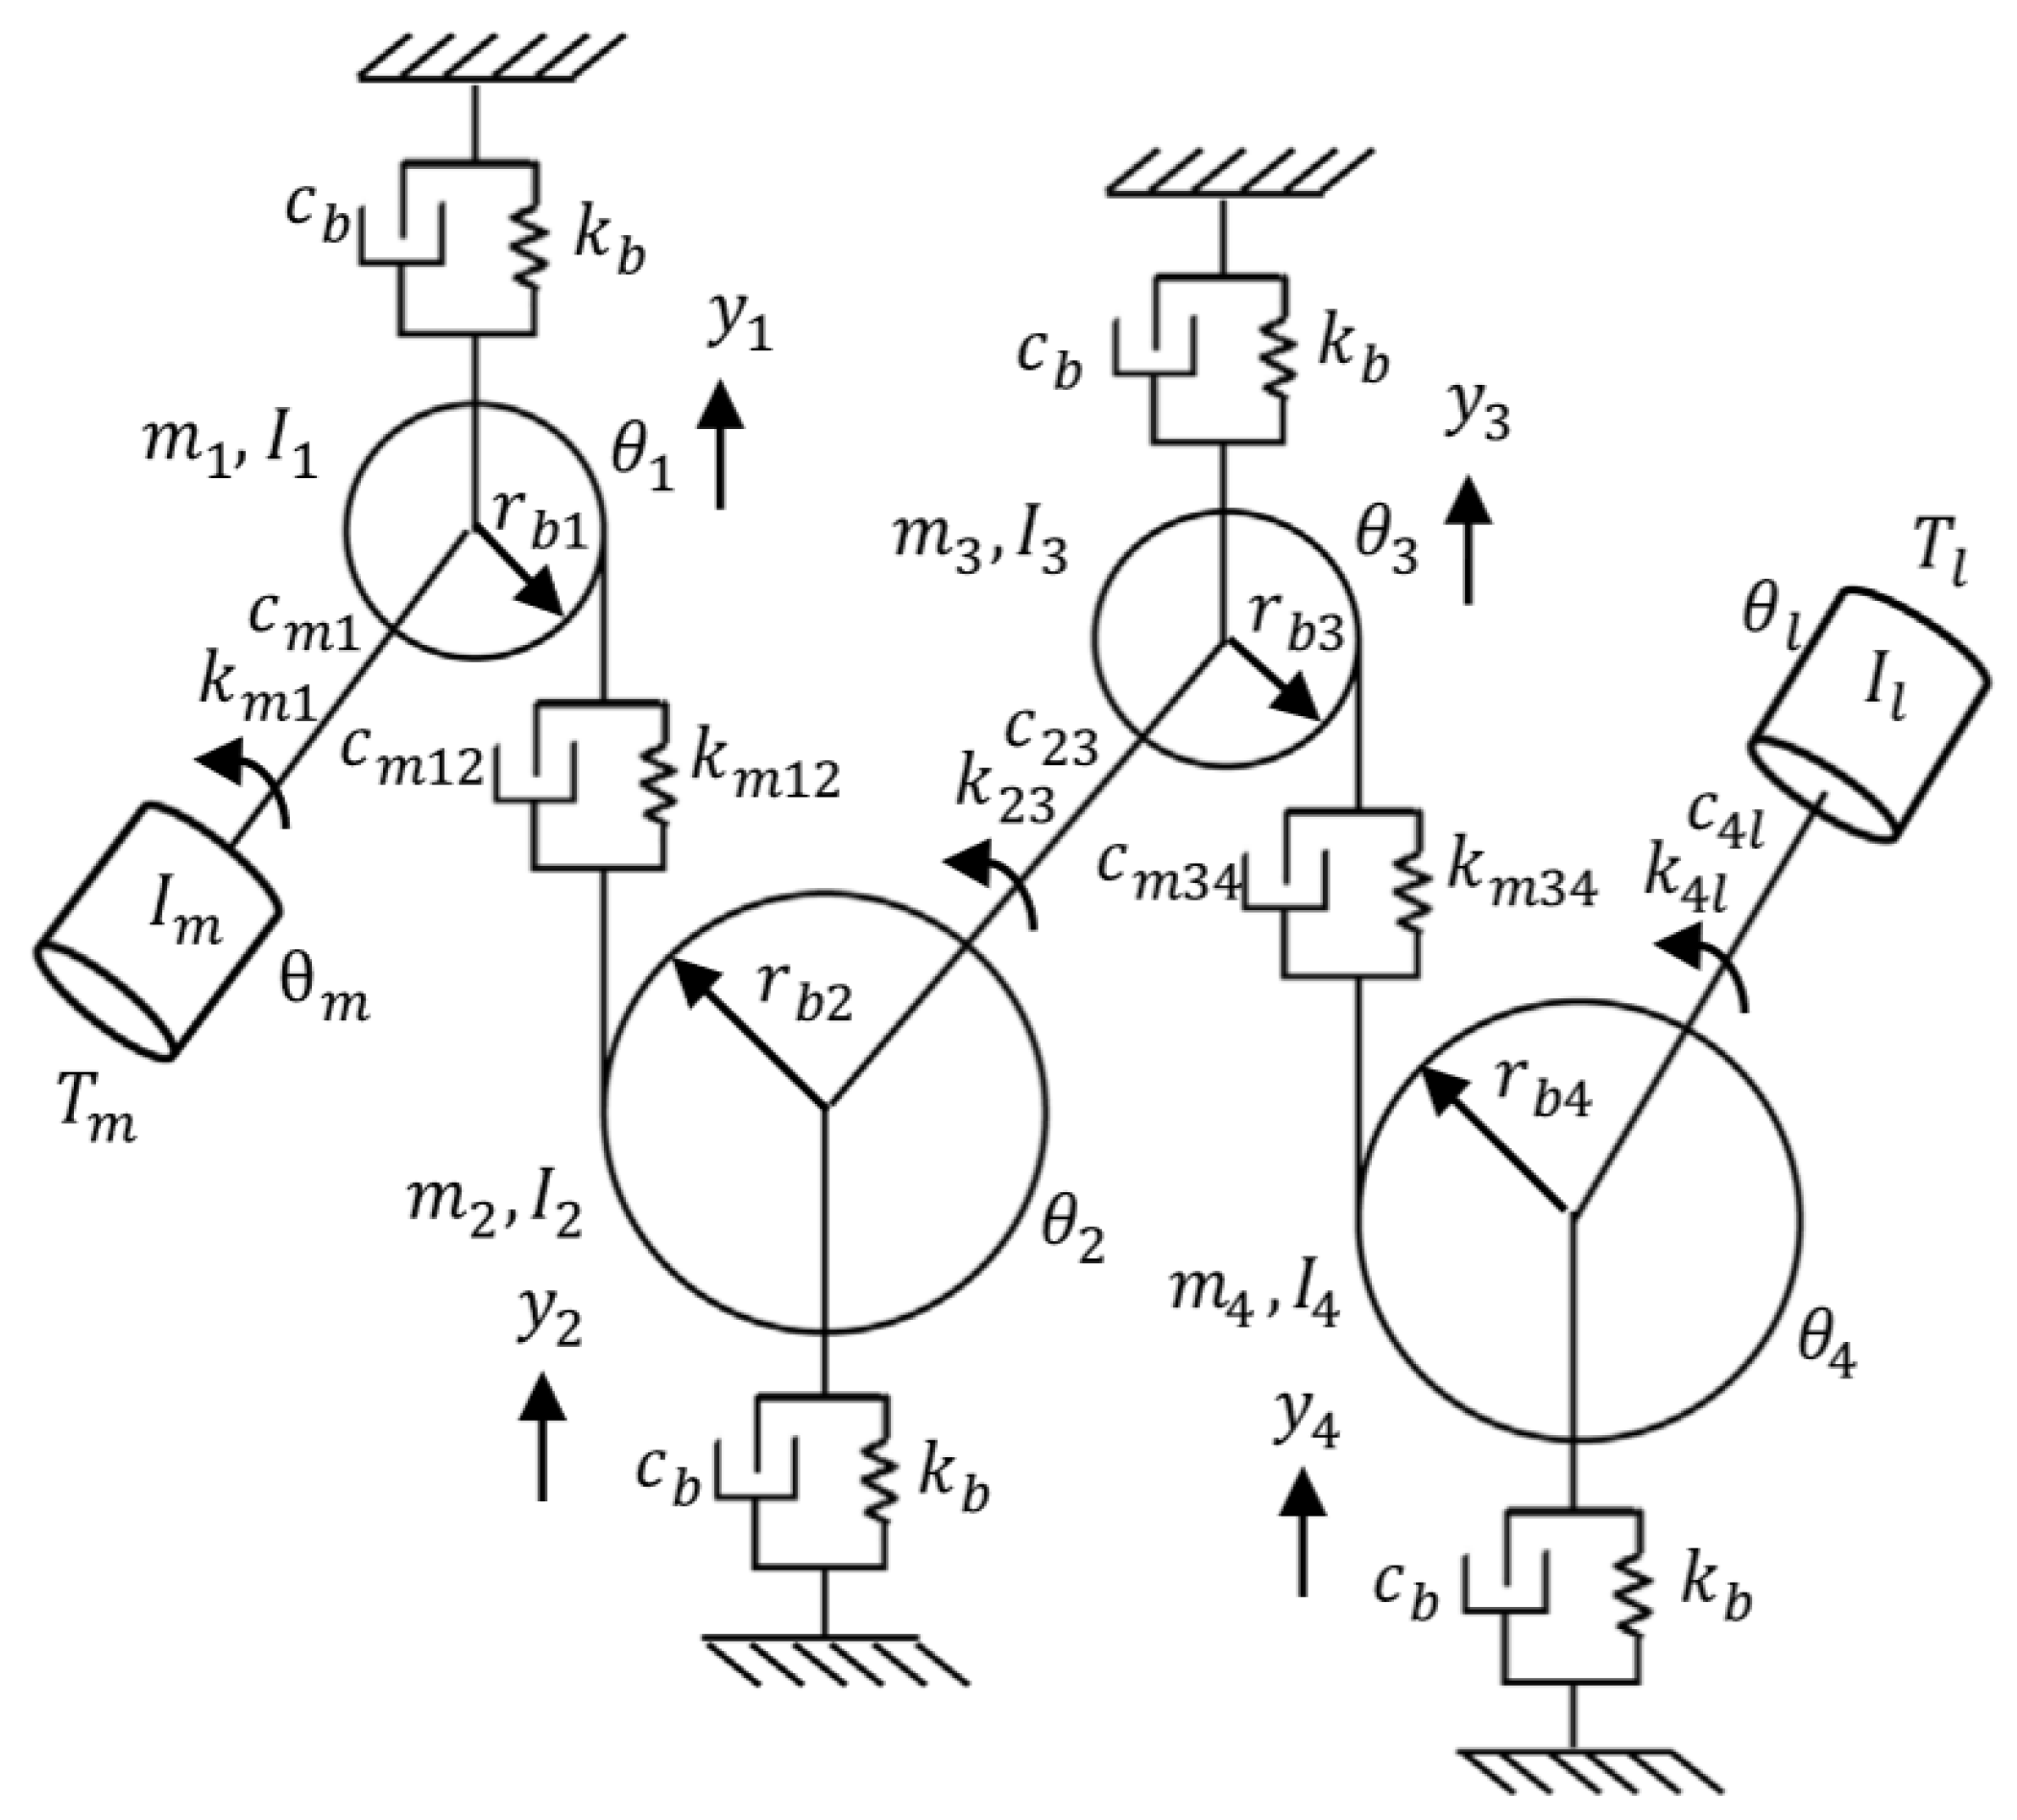
2.1. Dynamic Modeling of Gearbox
- (for ): mass and rotational inertia of gear i.
- : vertical displacement of gear i along line of action.
- : angular displacement of gear i.
- : base circle radius of gear i, converting into effective linear displacement.
- : motor inertia, angular displacement, and torque, respectively.
- : load inertia, angular displacement, and torque, respectively.
- : bearing stiffness and damping for each gear shaft, modeling radial support.
- : torsional stiffness and damping between motor and Gear 1.
- : gear mesh stiffness and damping between Gear 1 and Gear 2 (first stage).
- : torsional stiffness and damping of intermediate shaft connecting Gear 2 and Gear 3.
- : gear mesh stiffness and damping between Gear 3 and Gear 4 (second stage).
- : torsional stiffness and damping between Gear 4 and load.
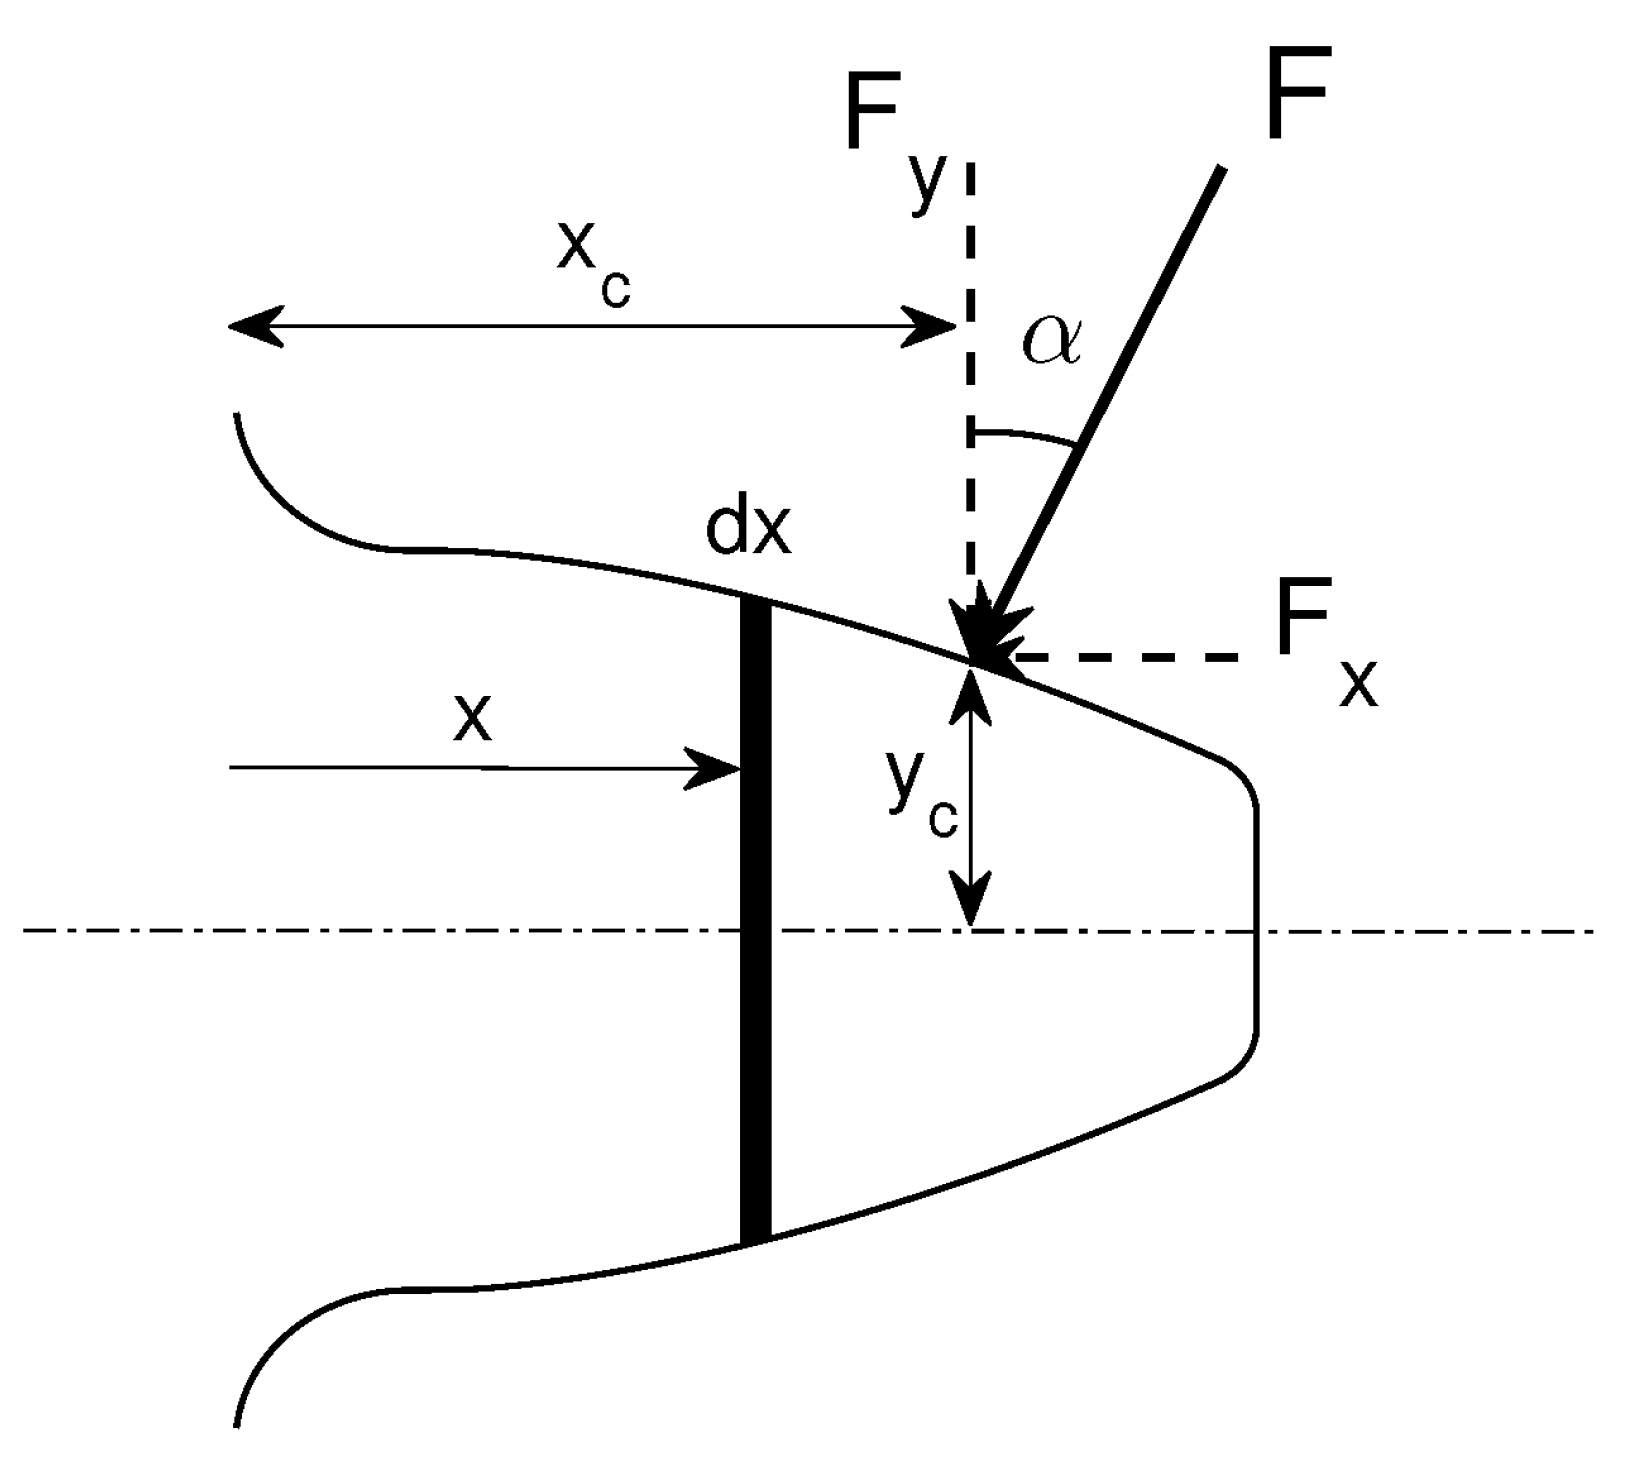
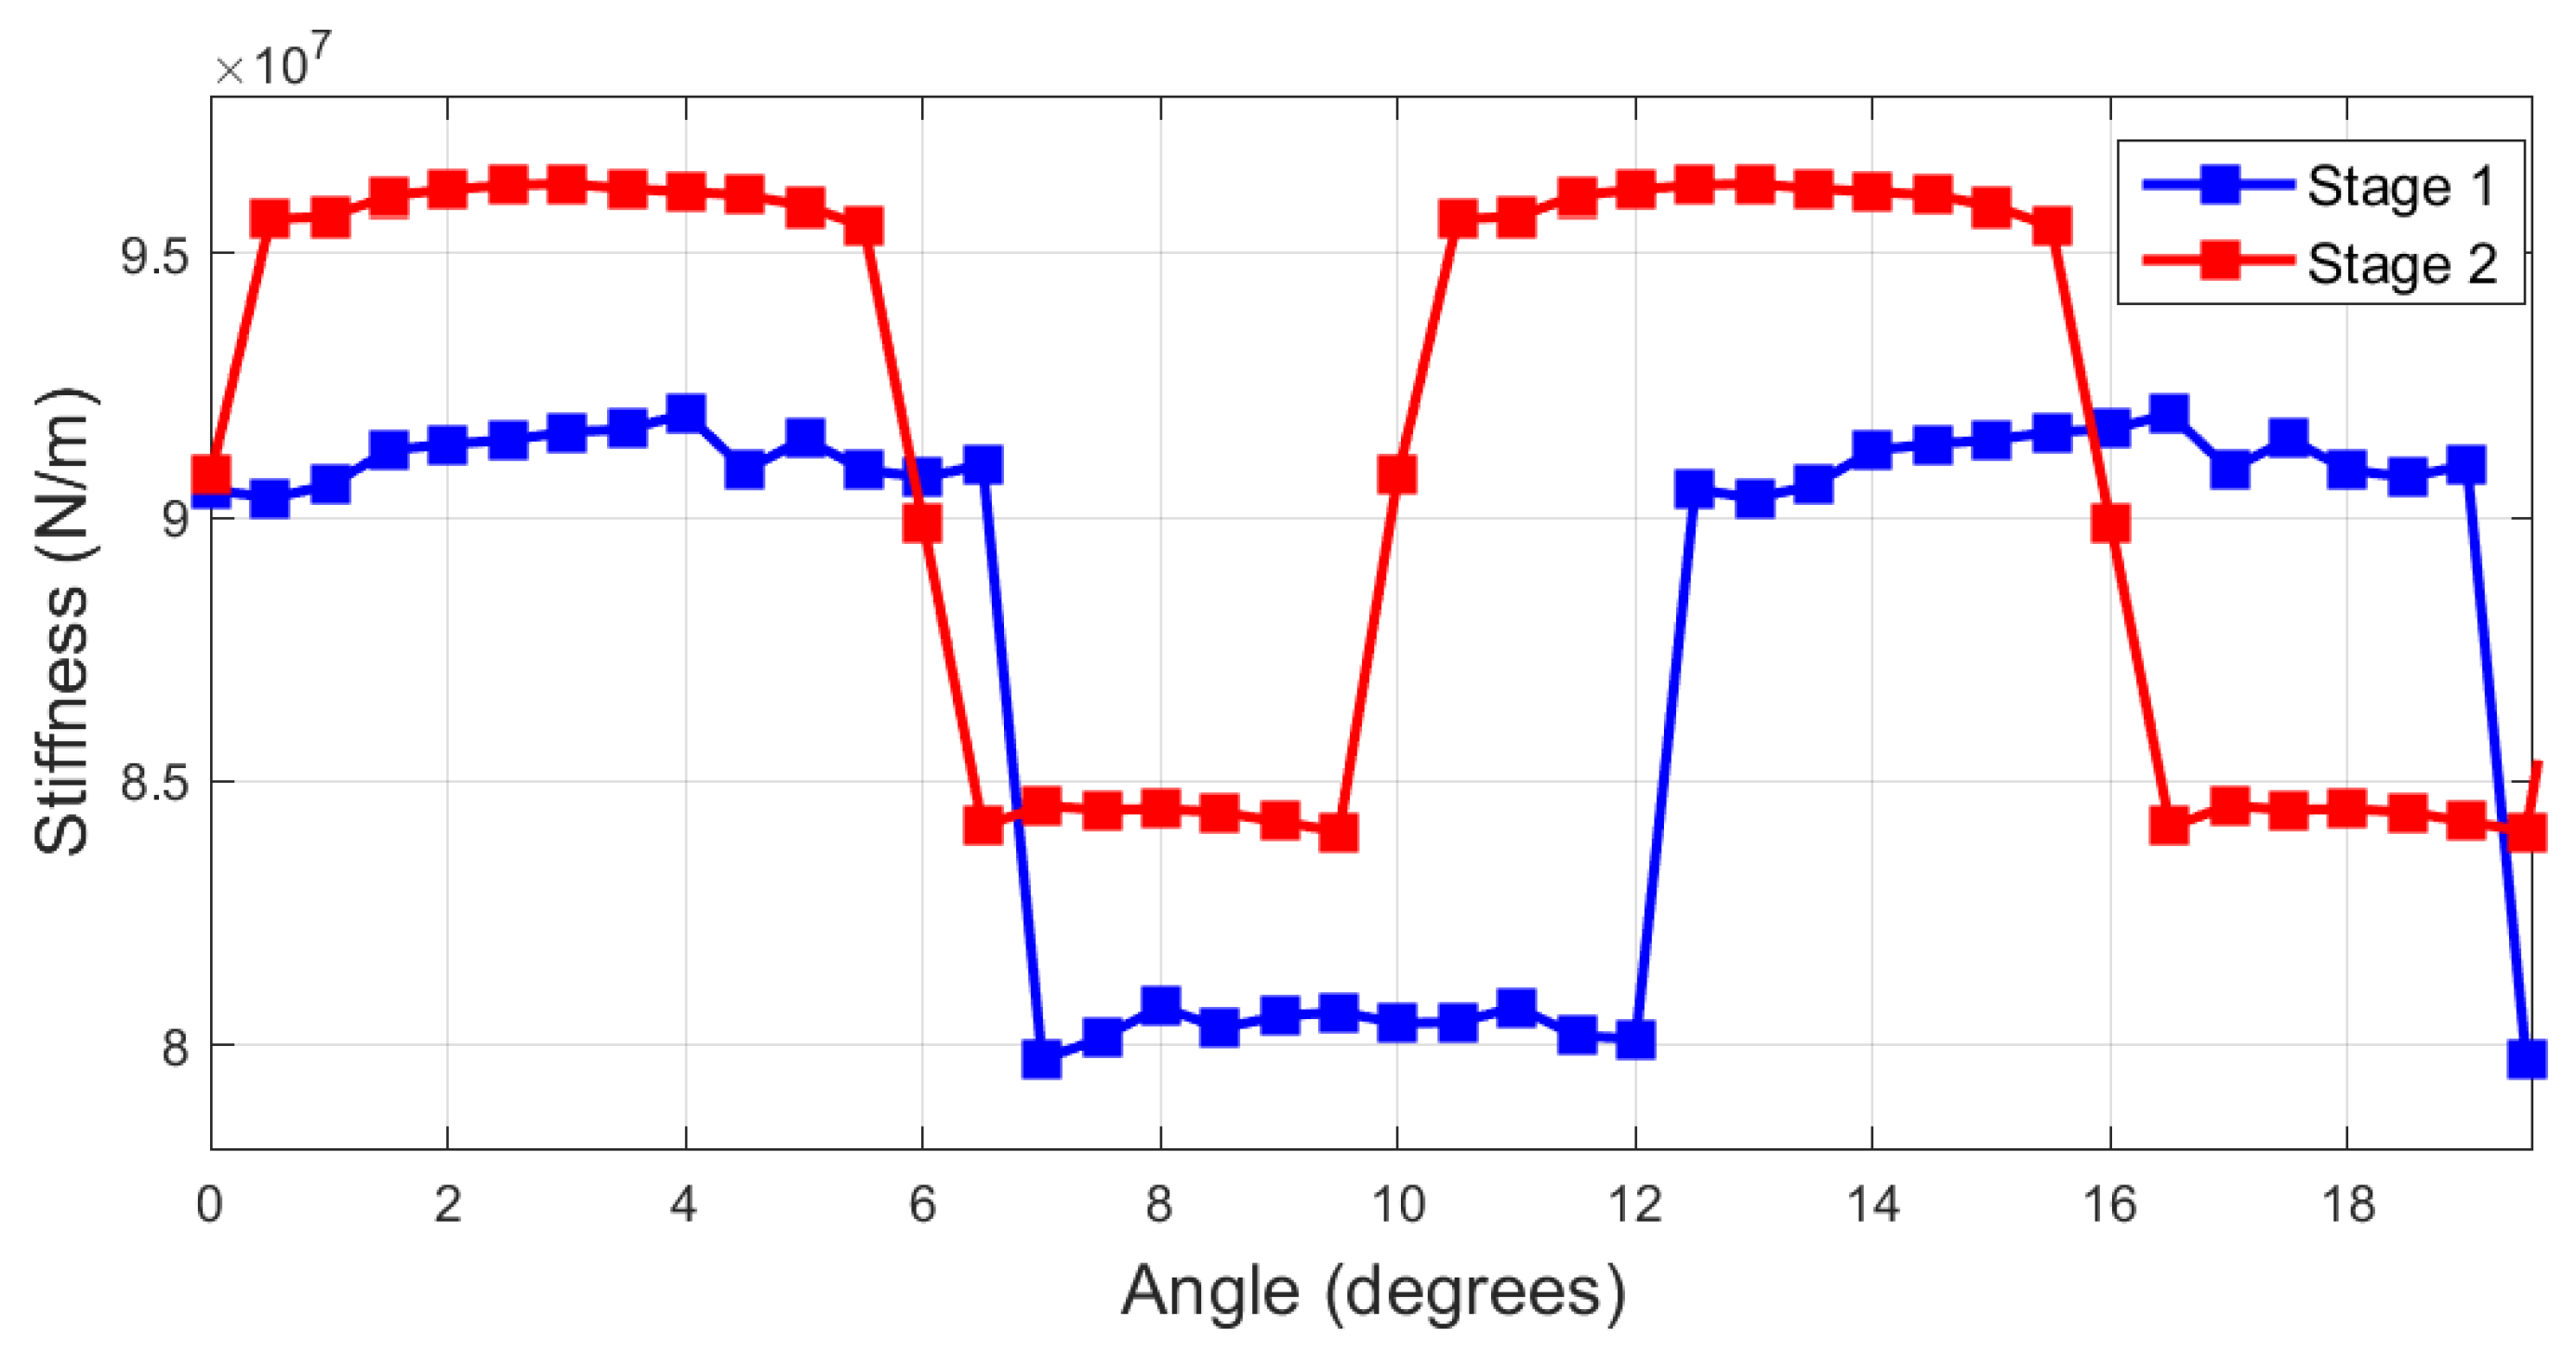
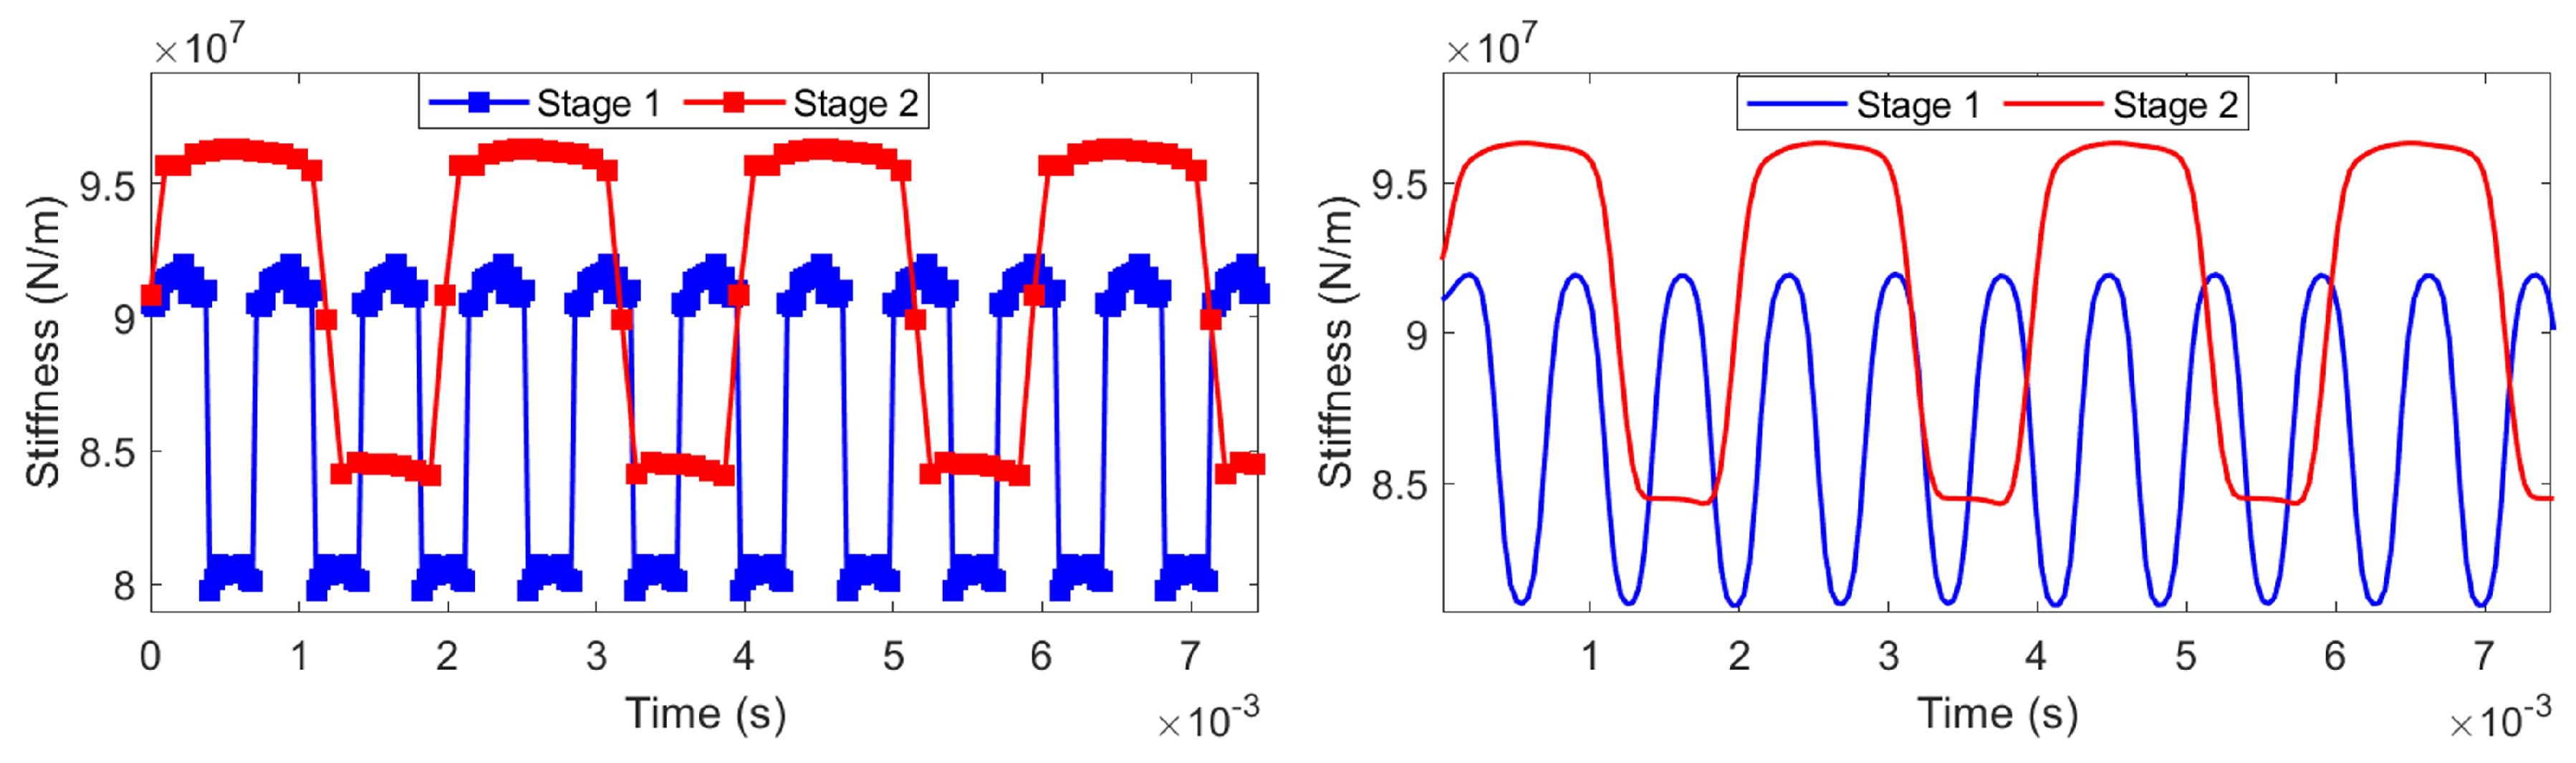
2.2. Analytical Calculation of TVMS
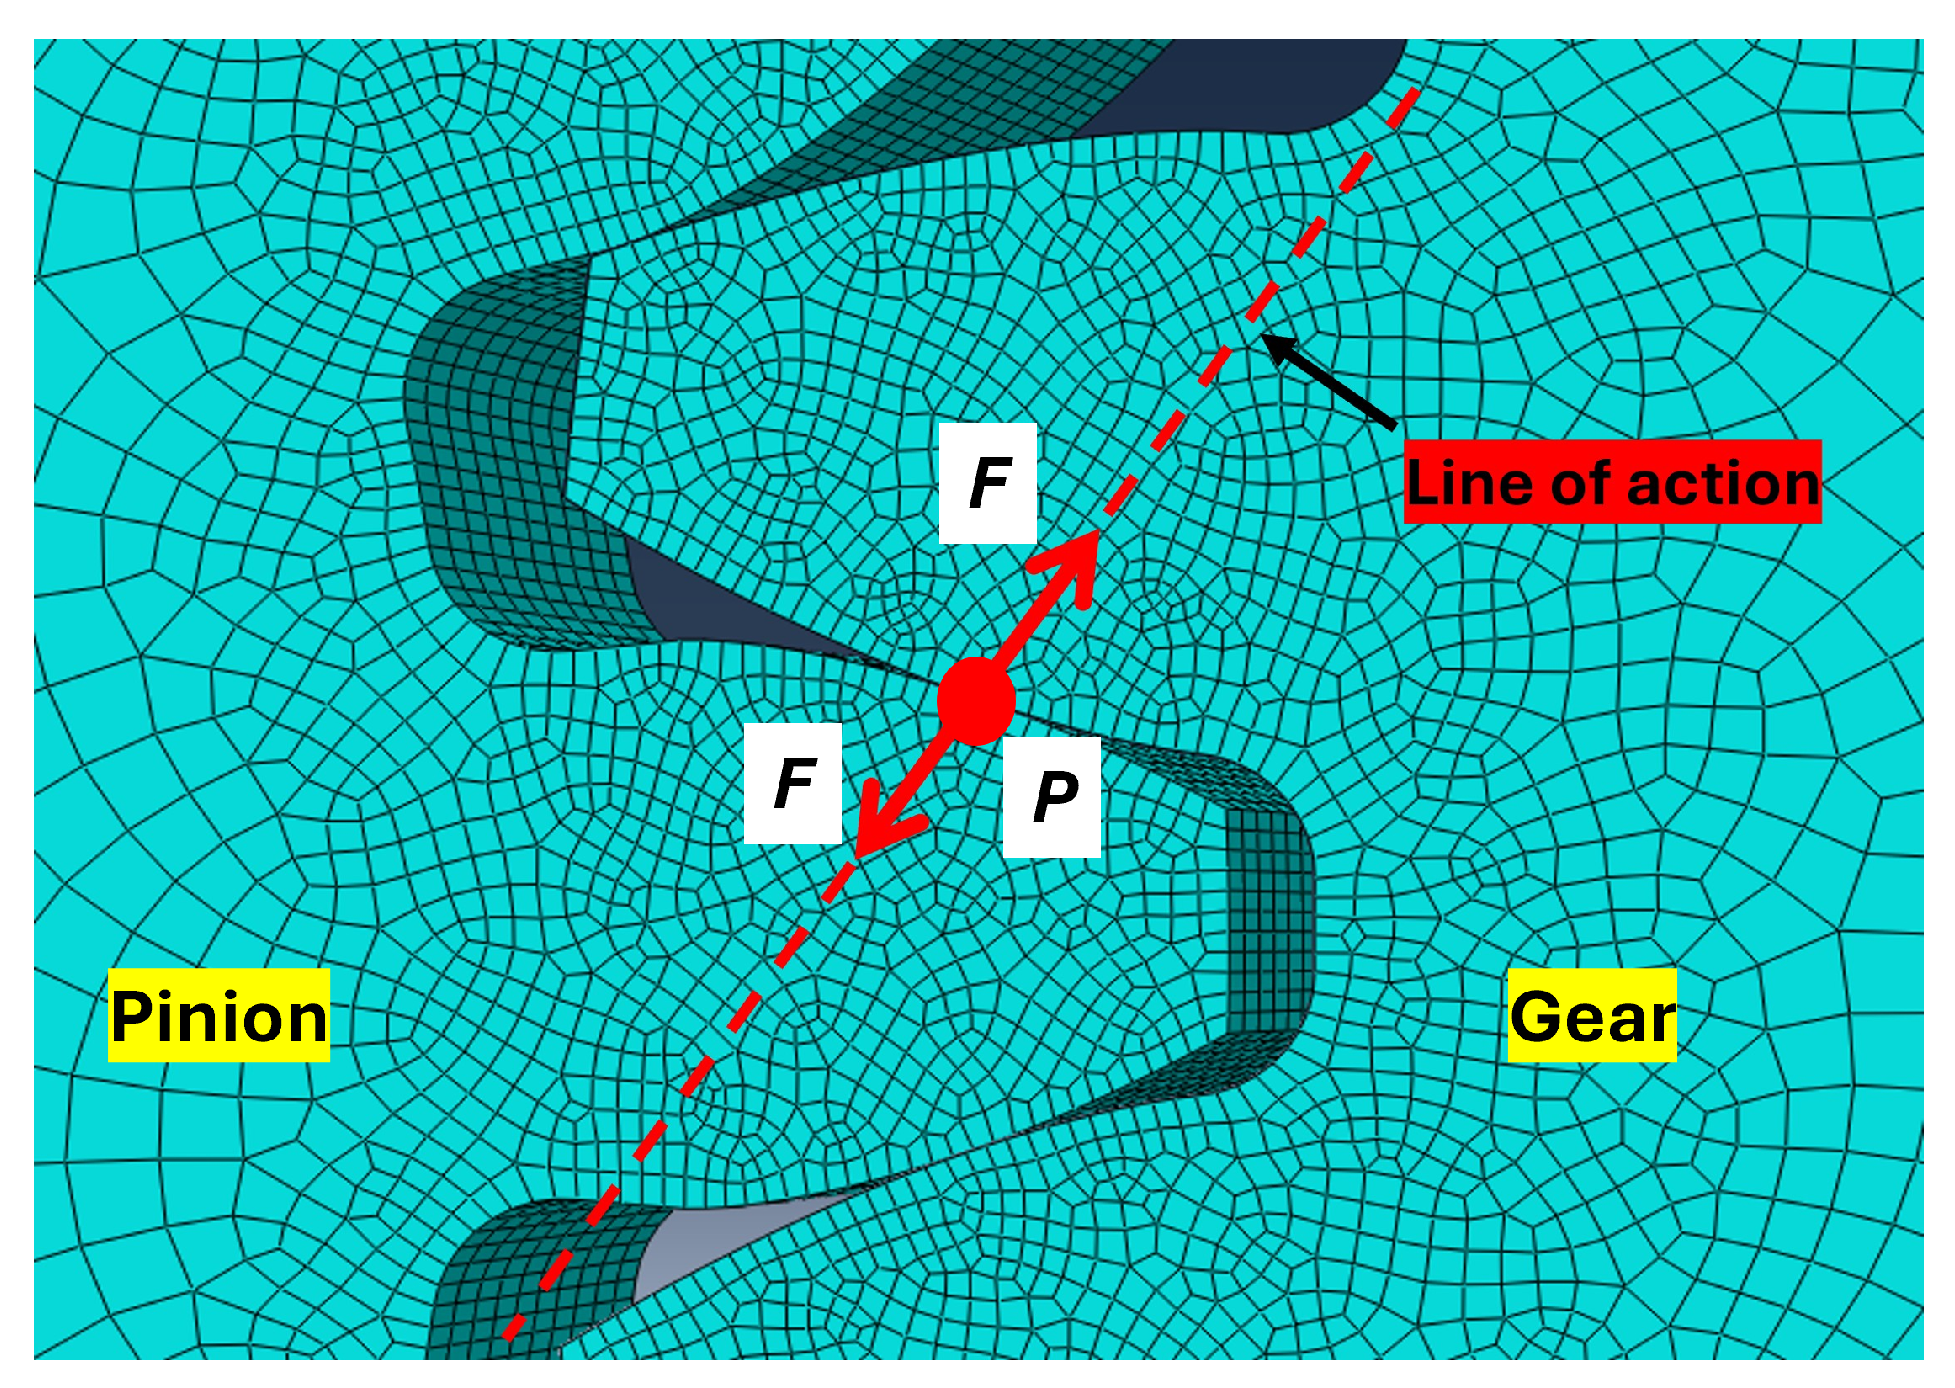
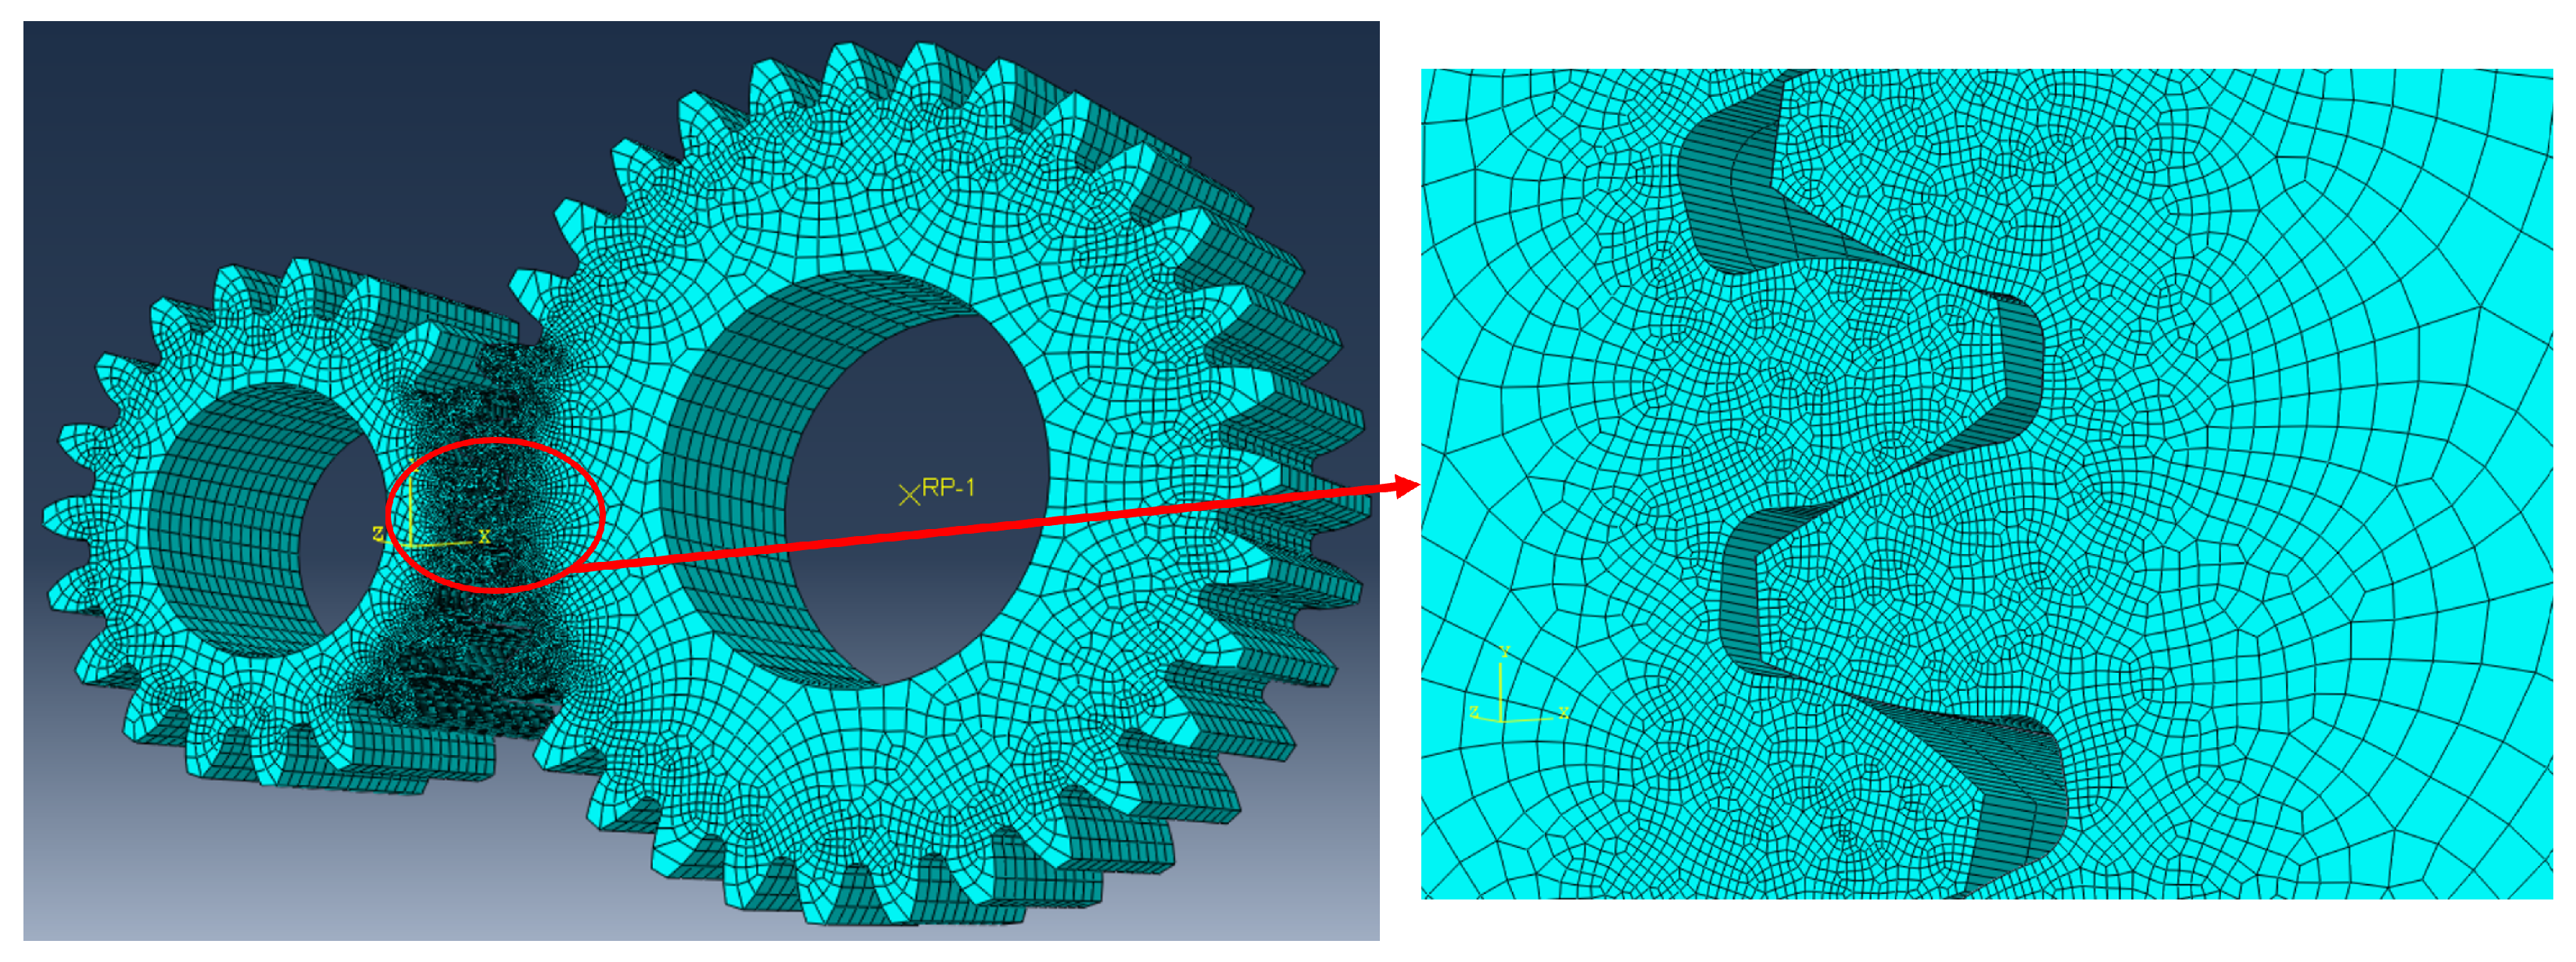
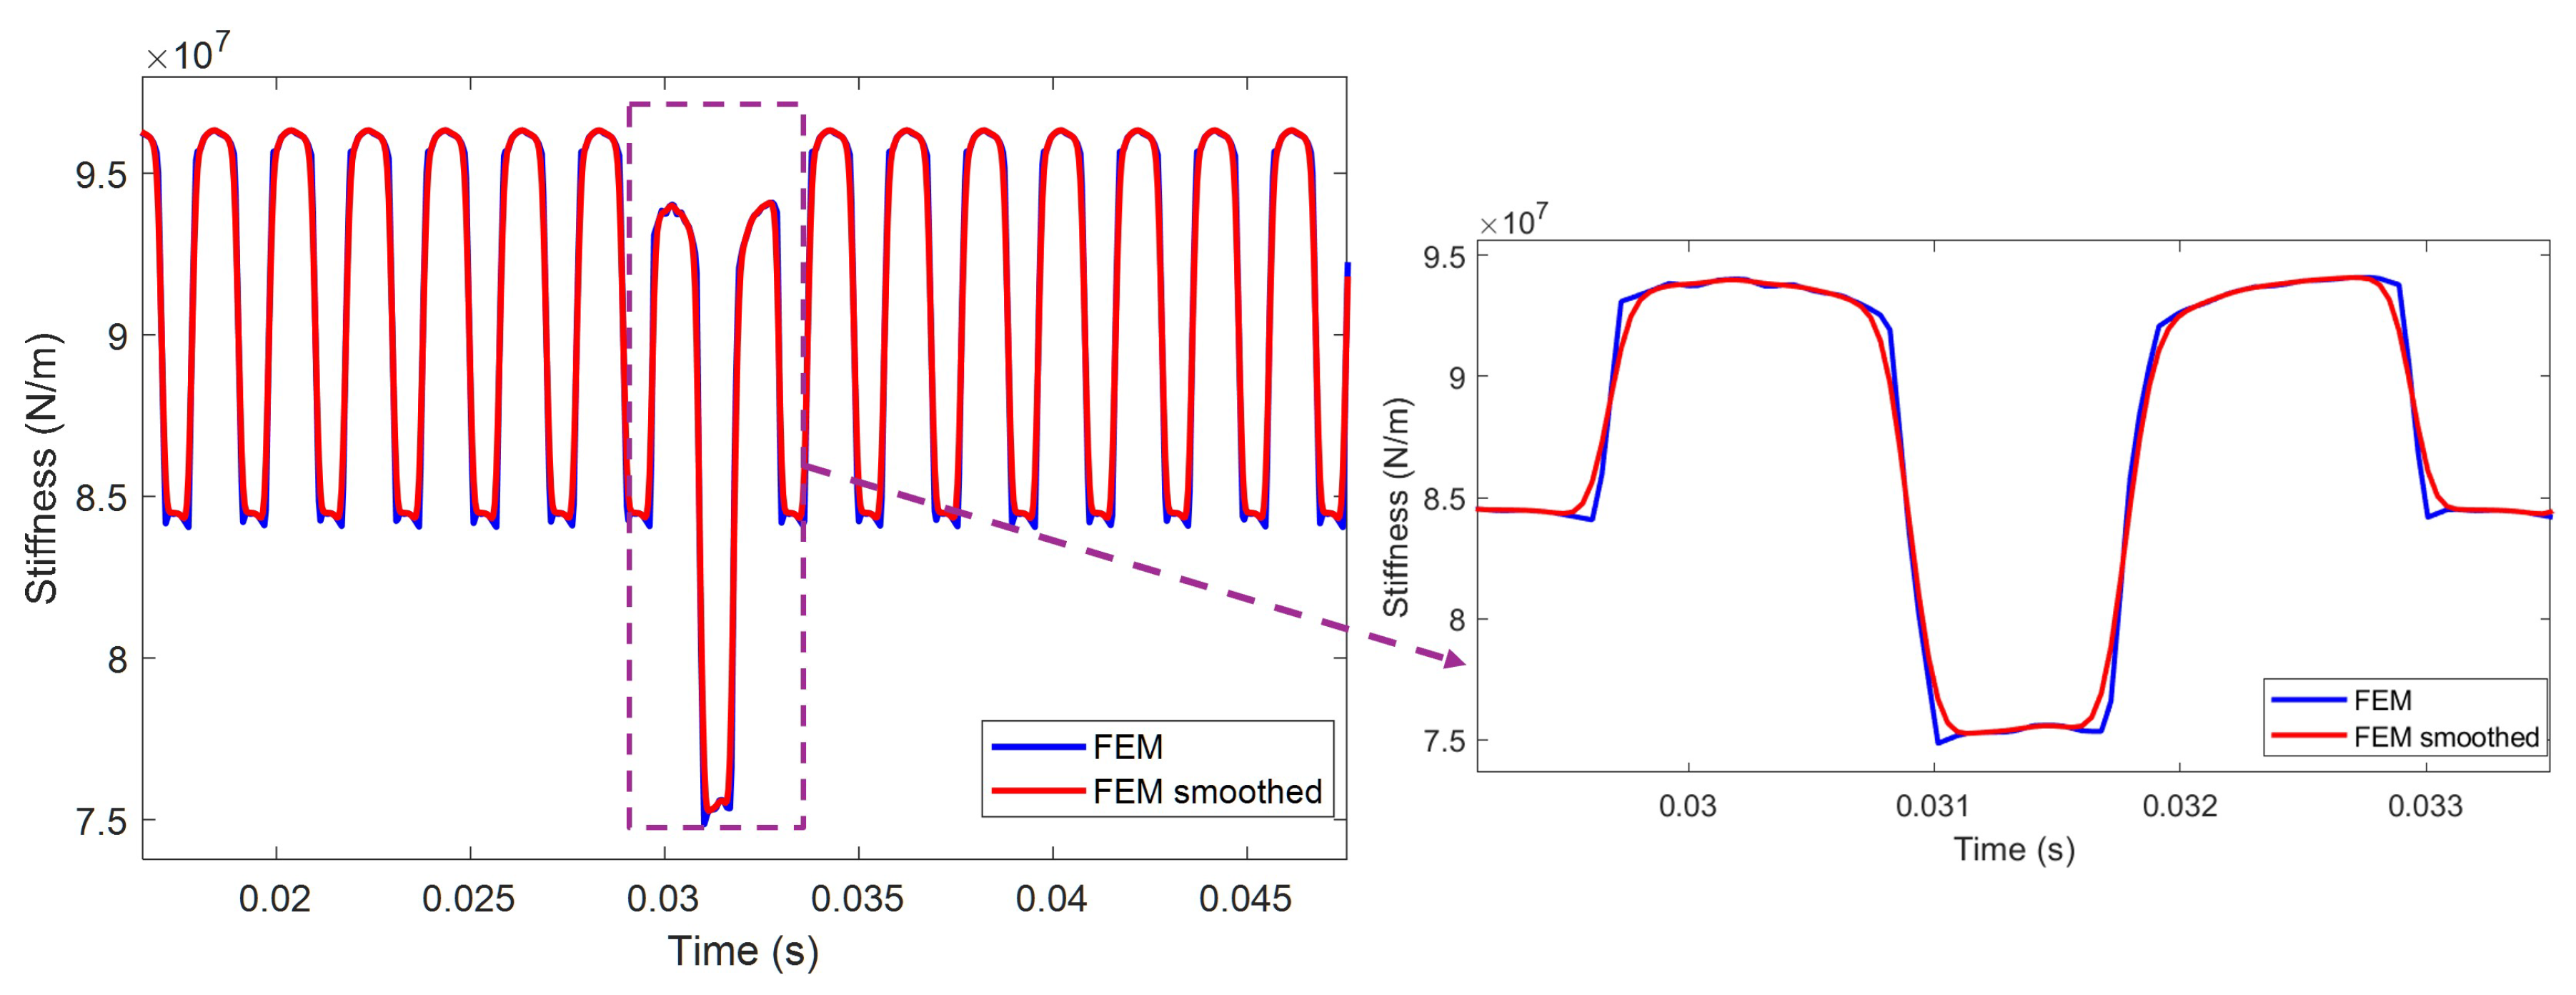
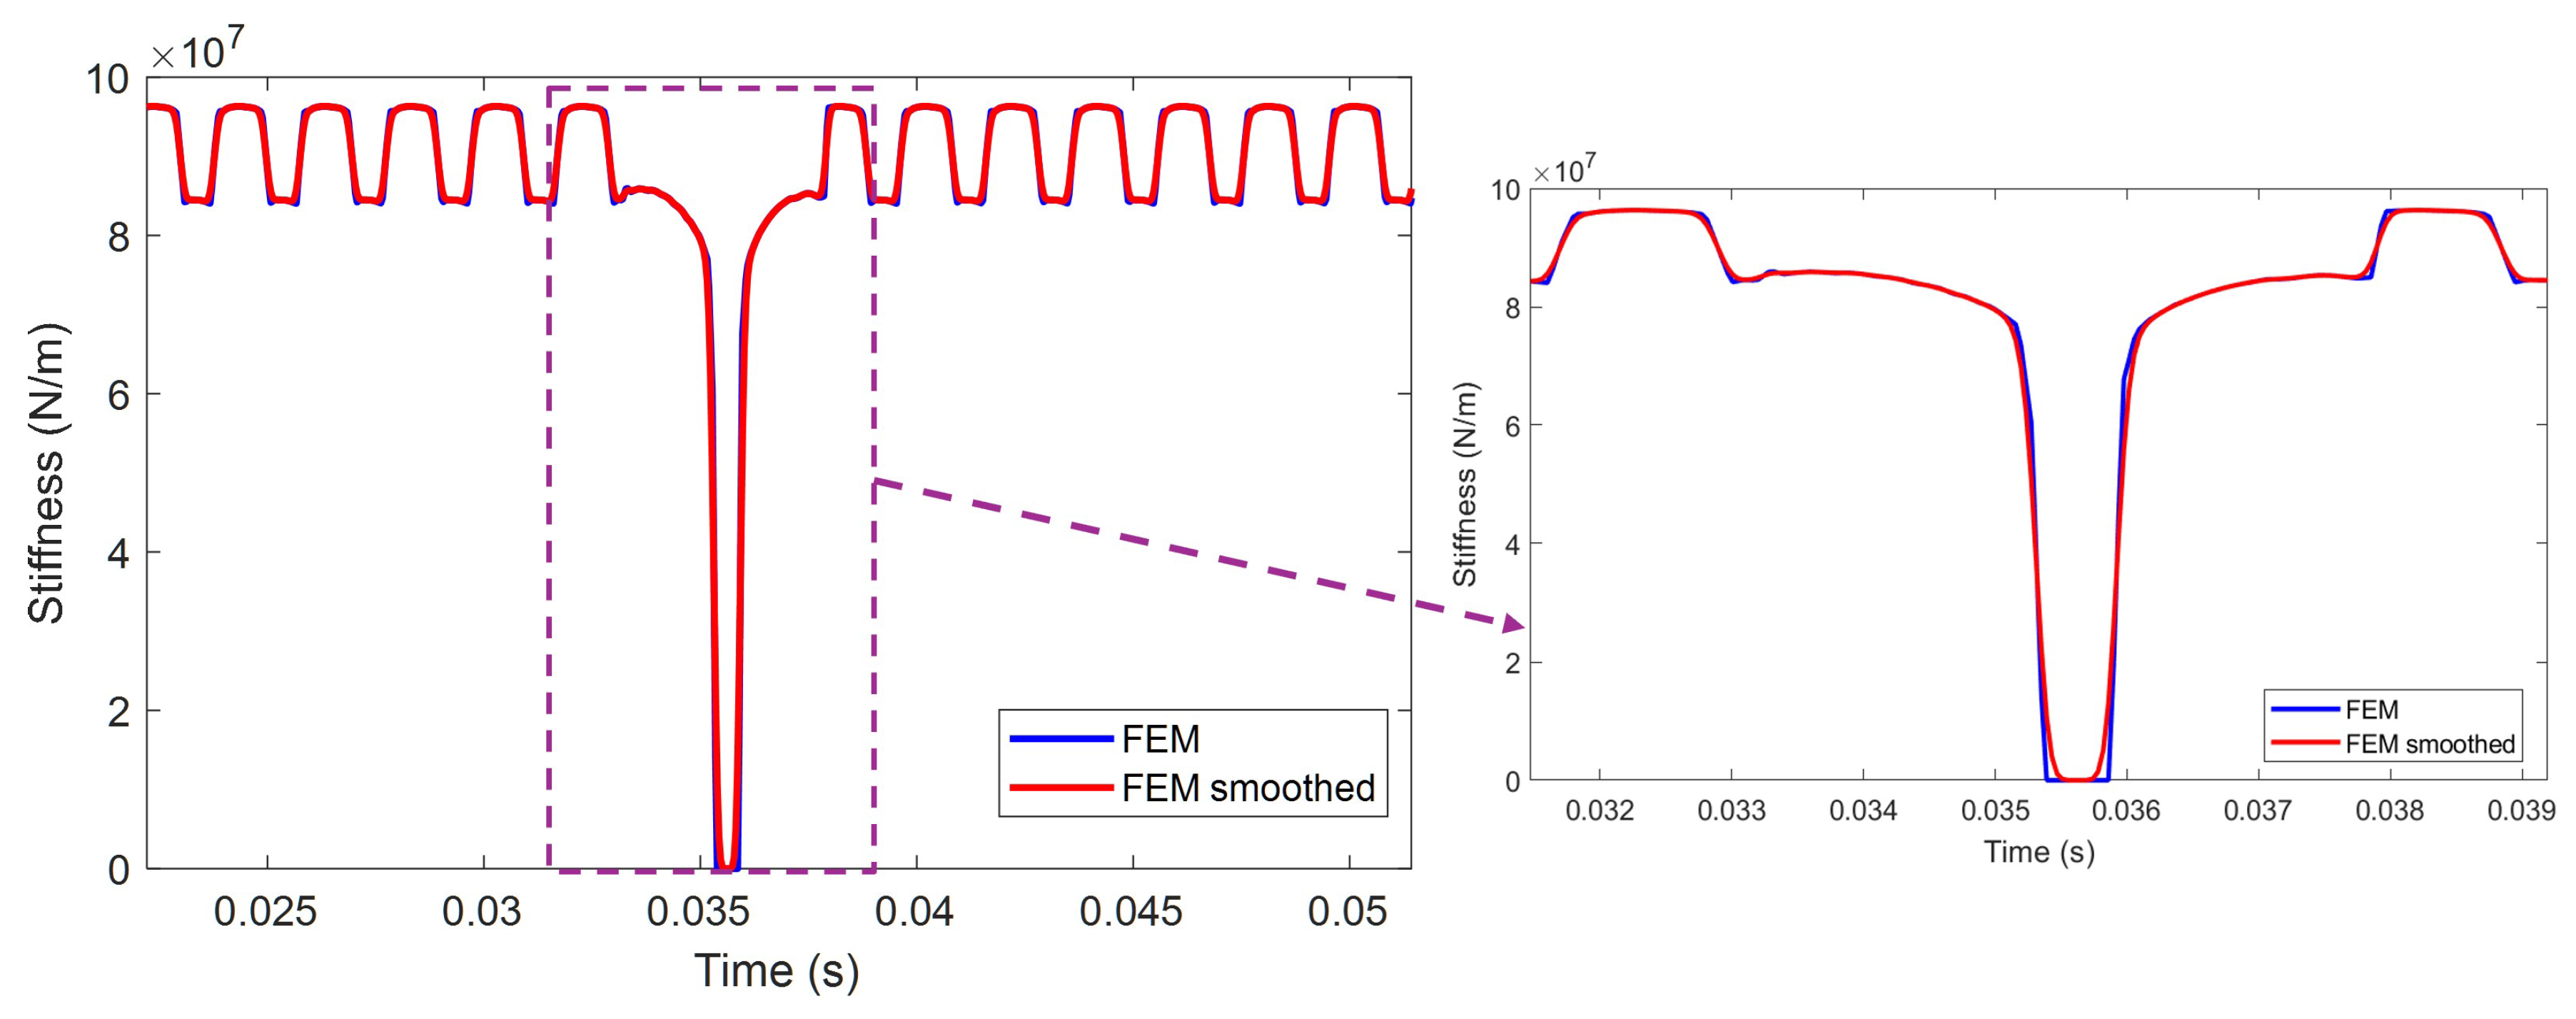
2.3. FEM Calculation of TVMS
- 1.
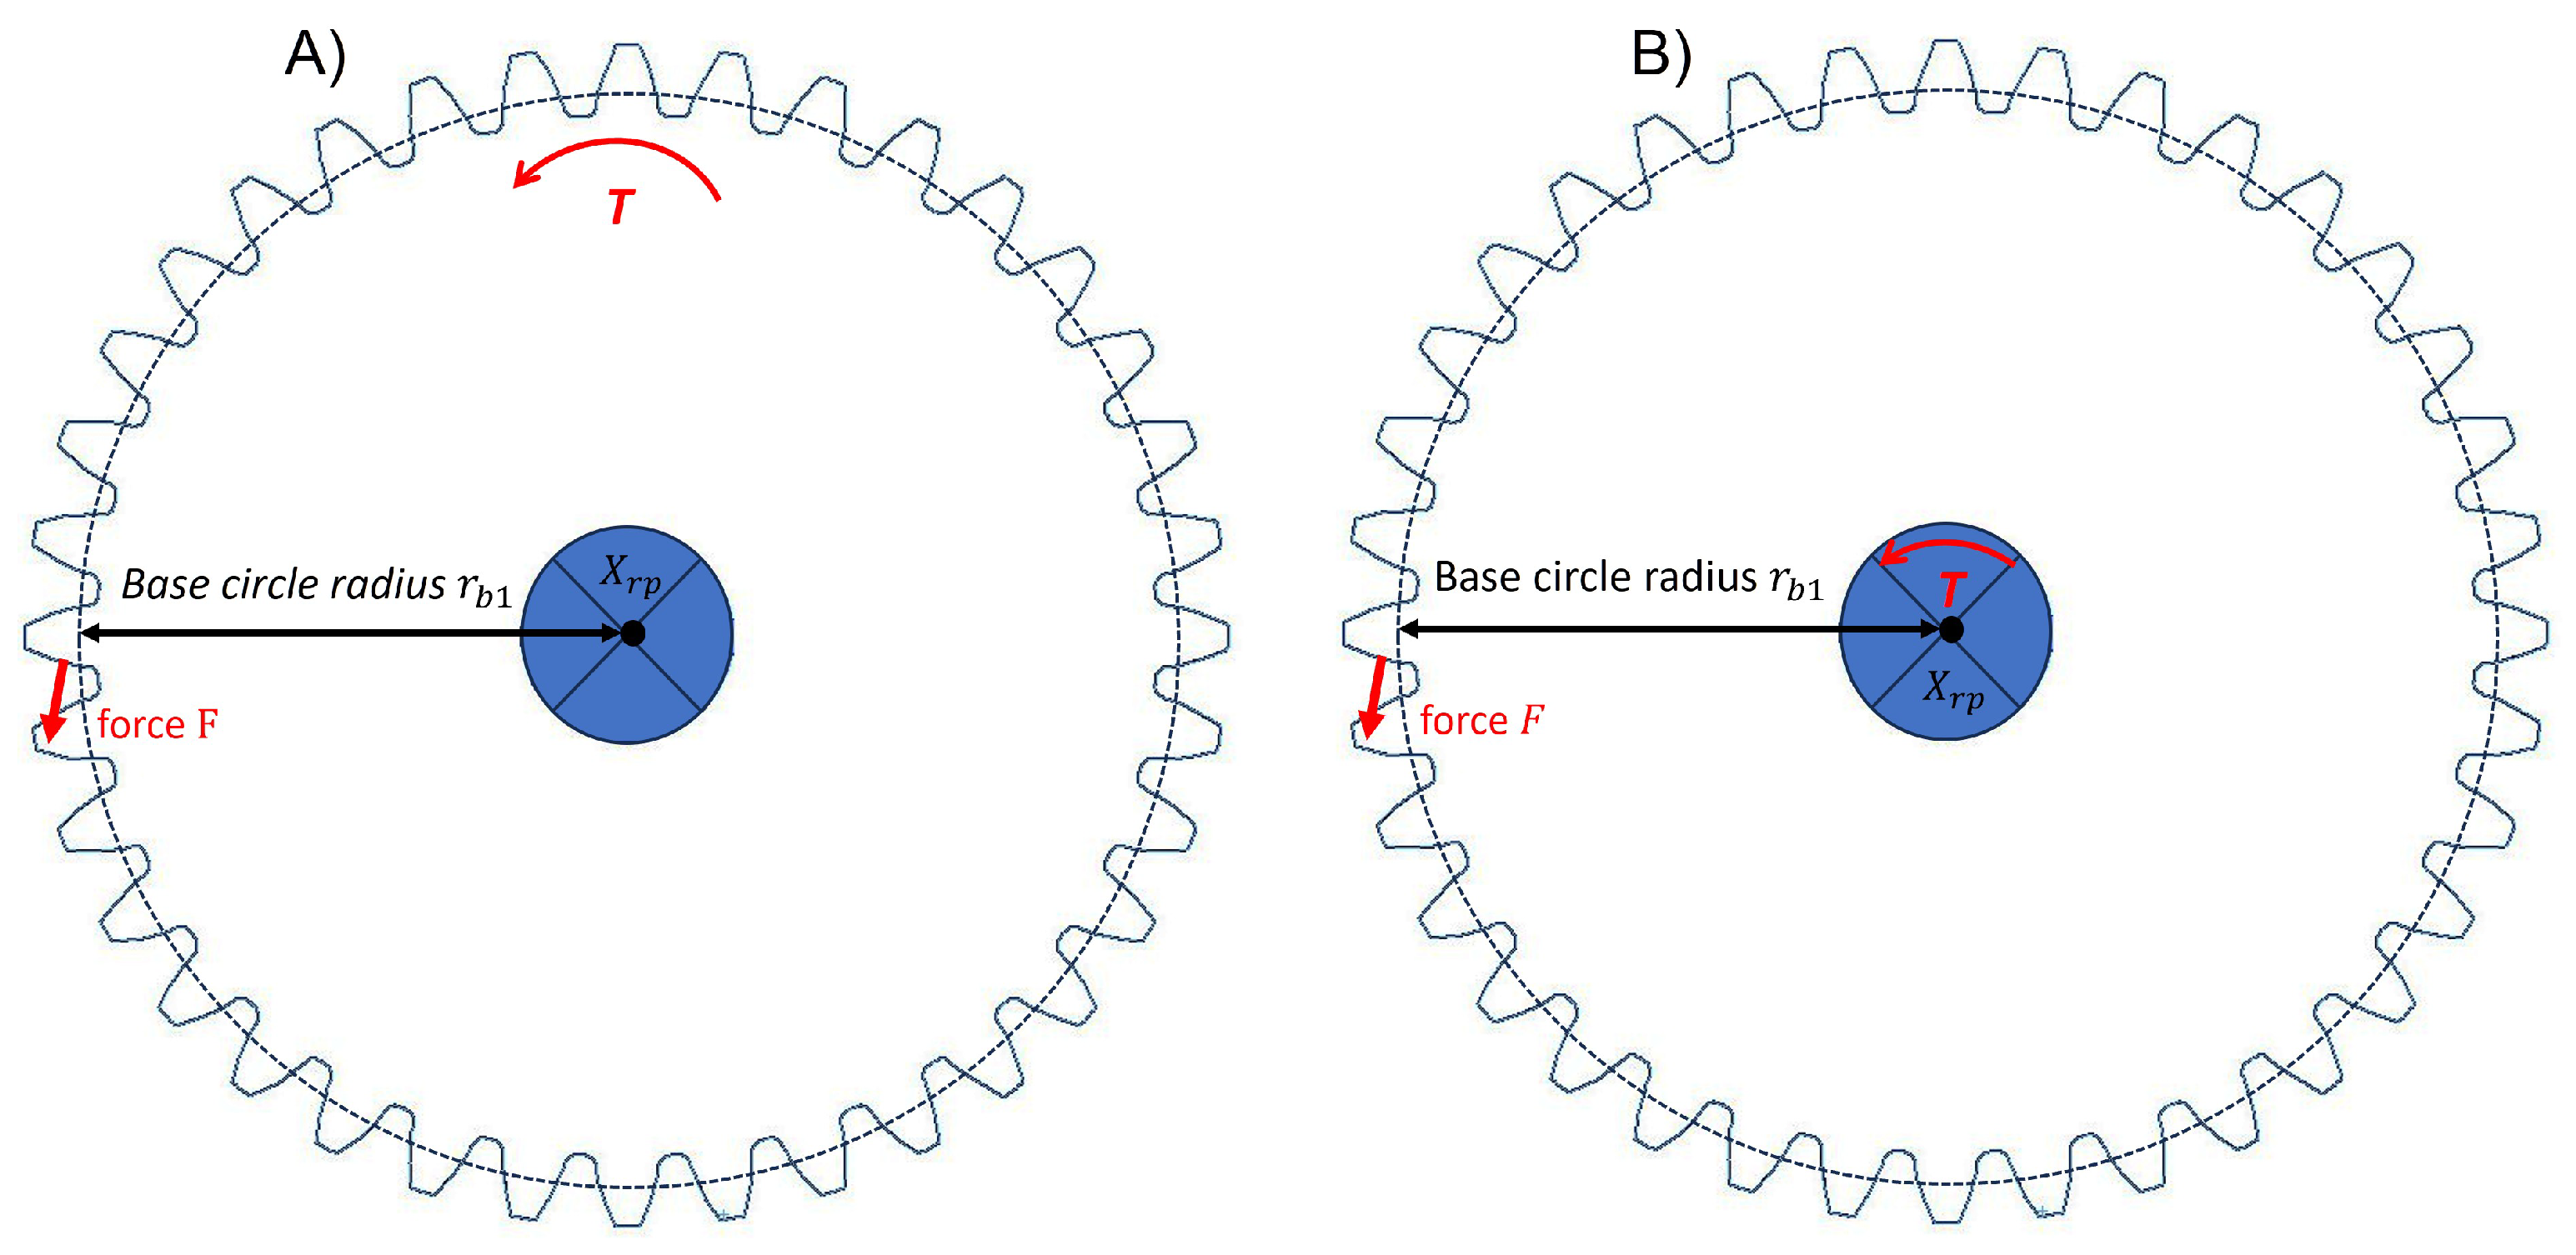
- Define the initial contact position between meshing teeth as the angular reference (0°).
- 2.
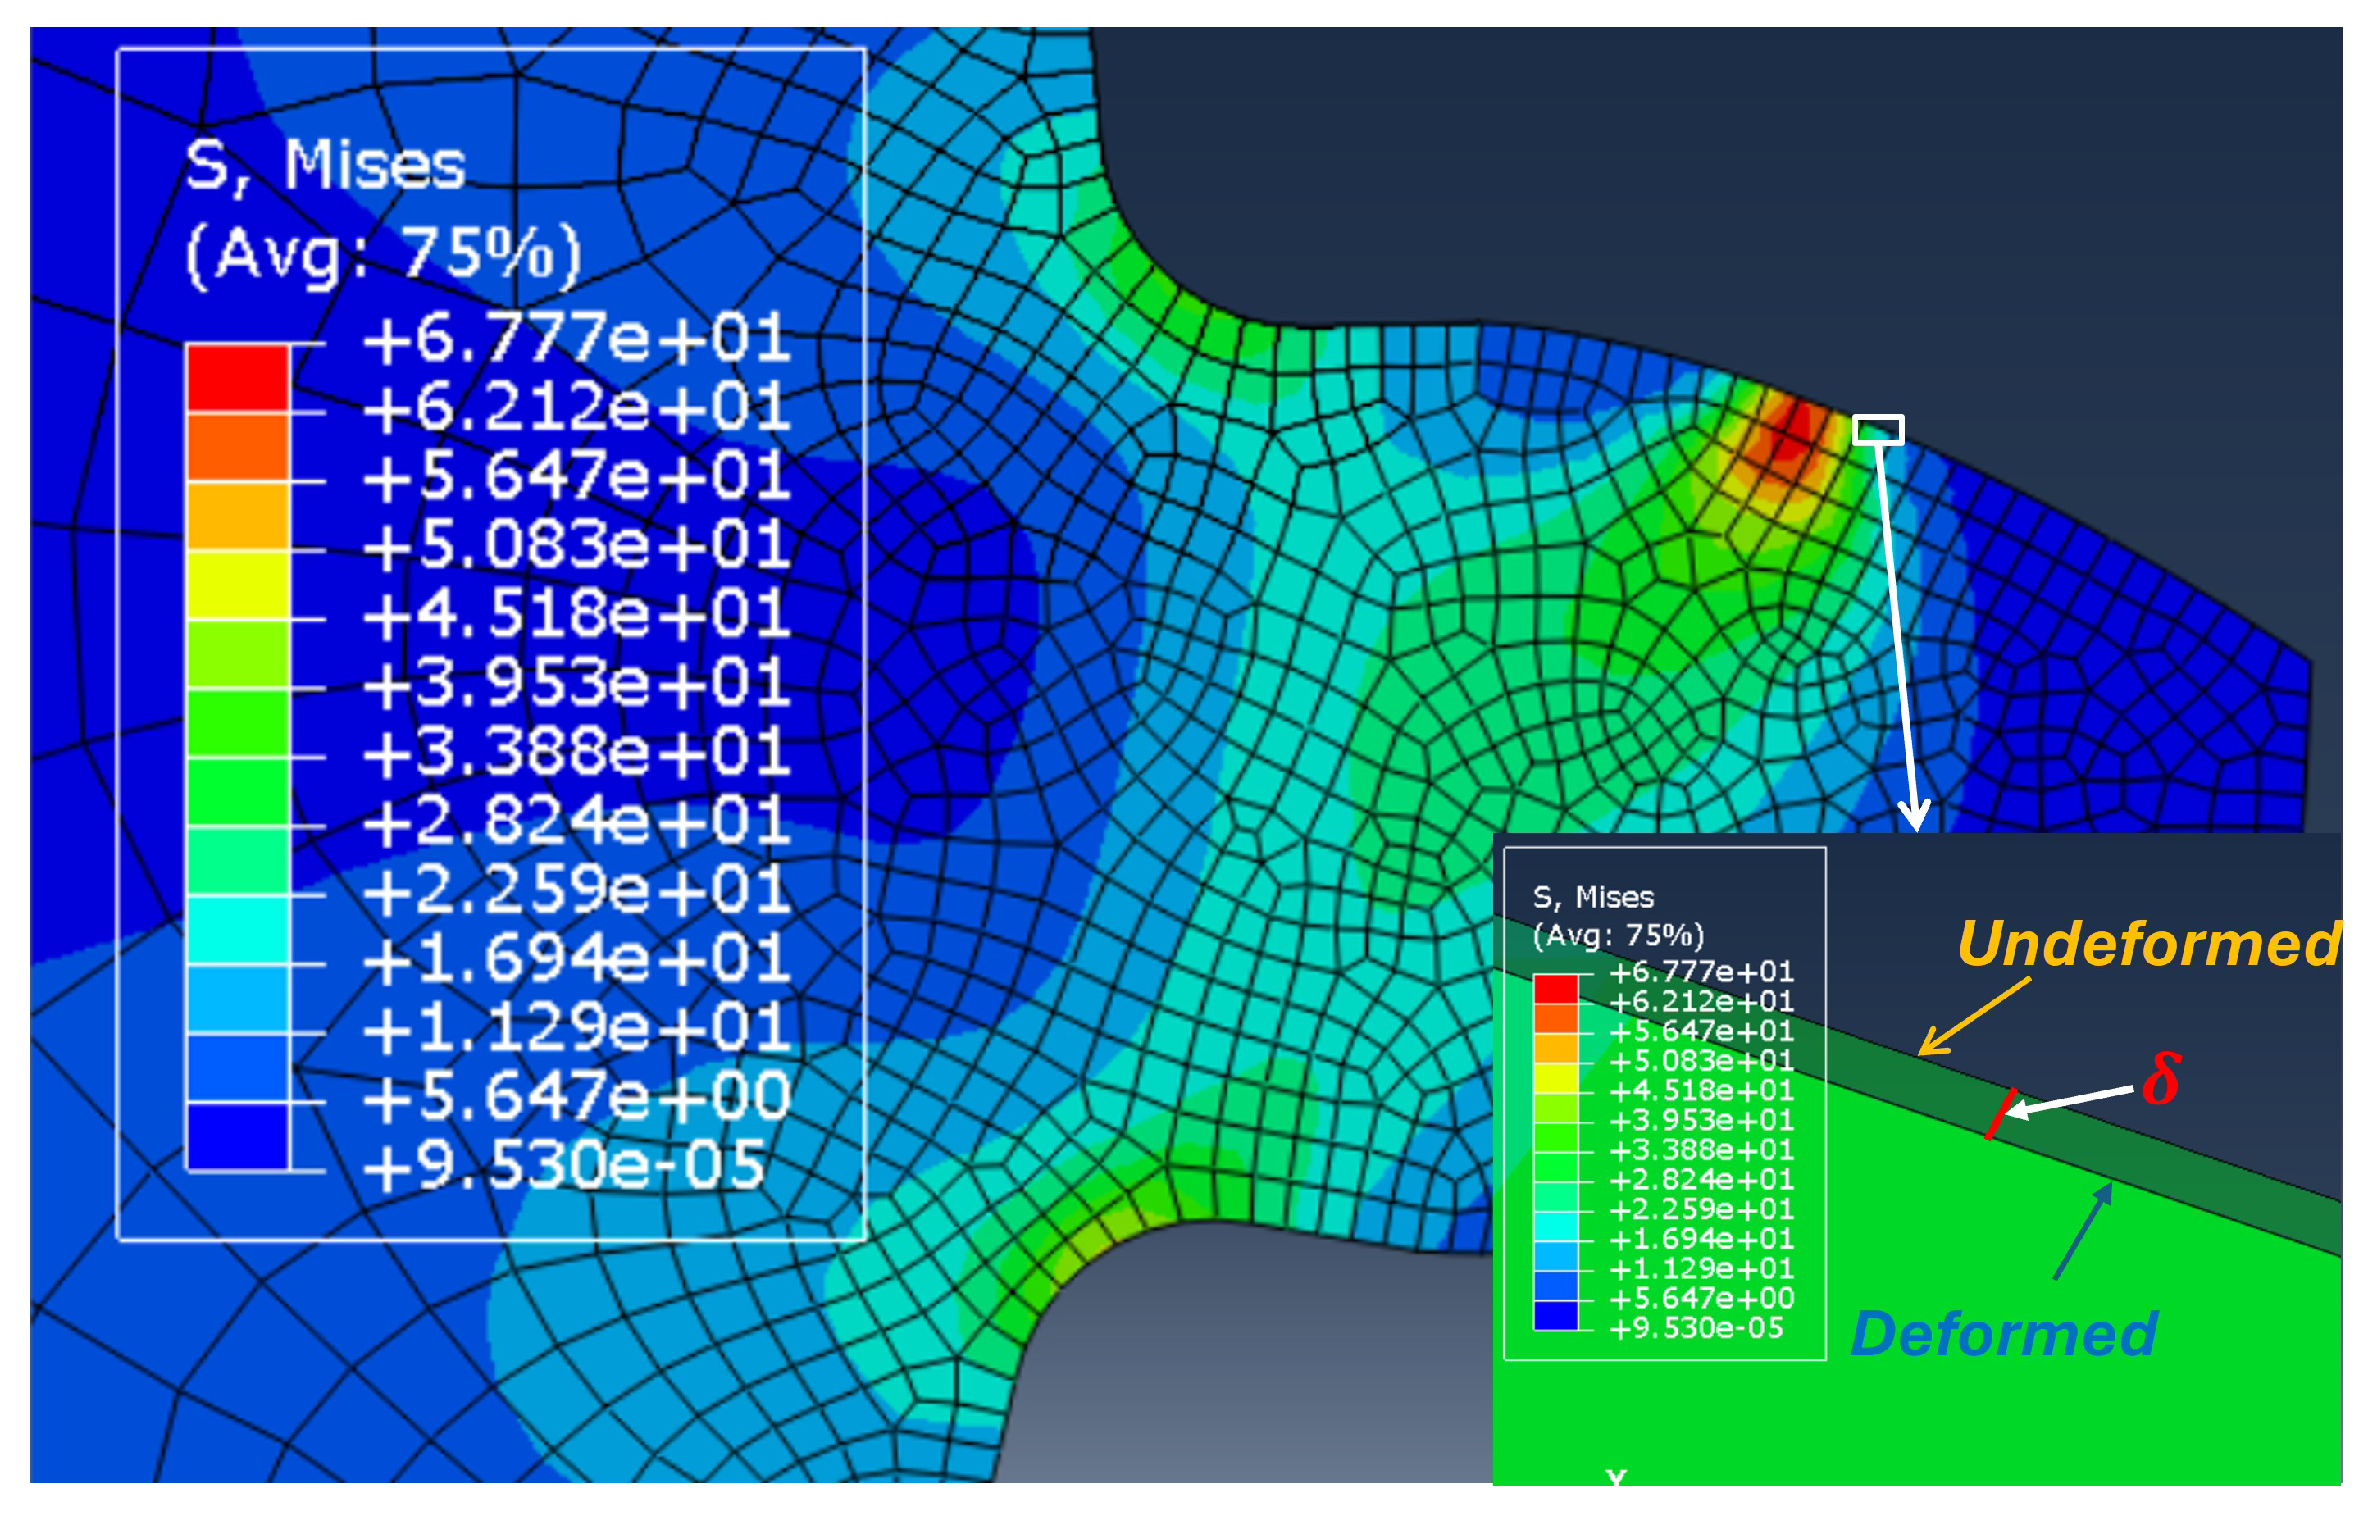
- Perform a quasi-static structural analysis under a specified torque to compute the resultant gear deformations.
- 3.
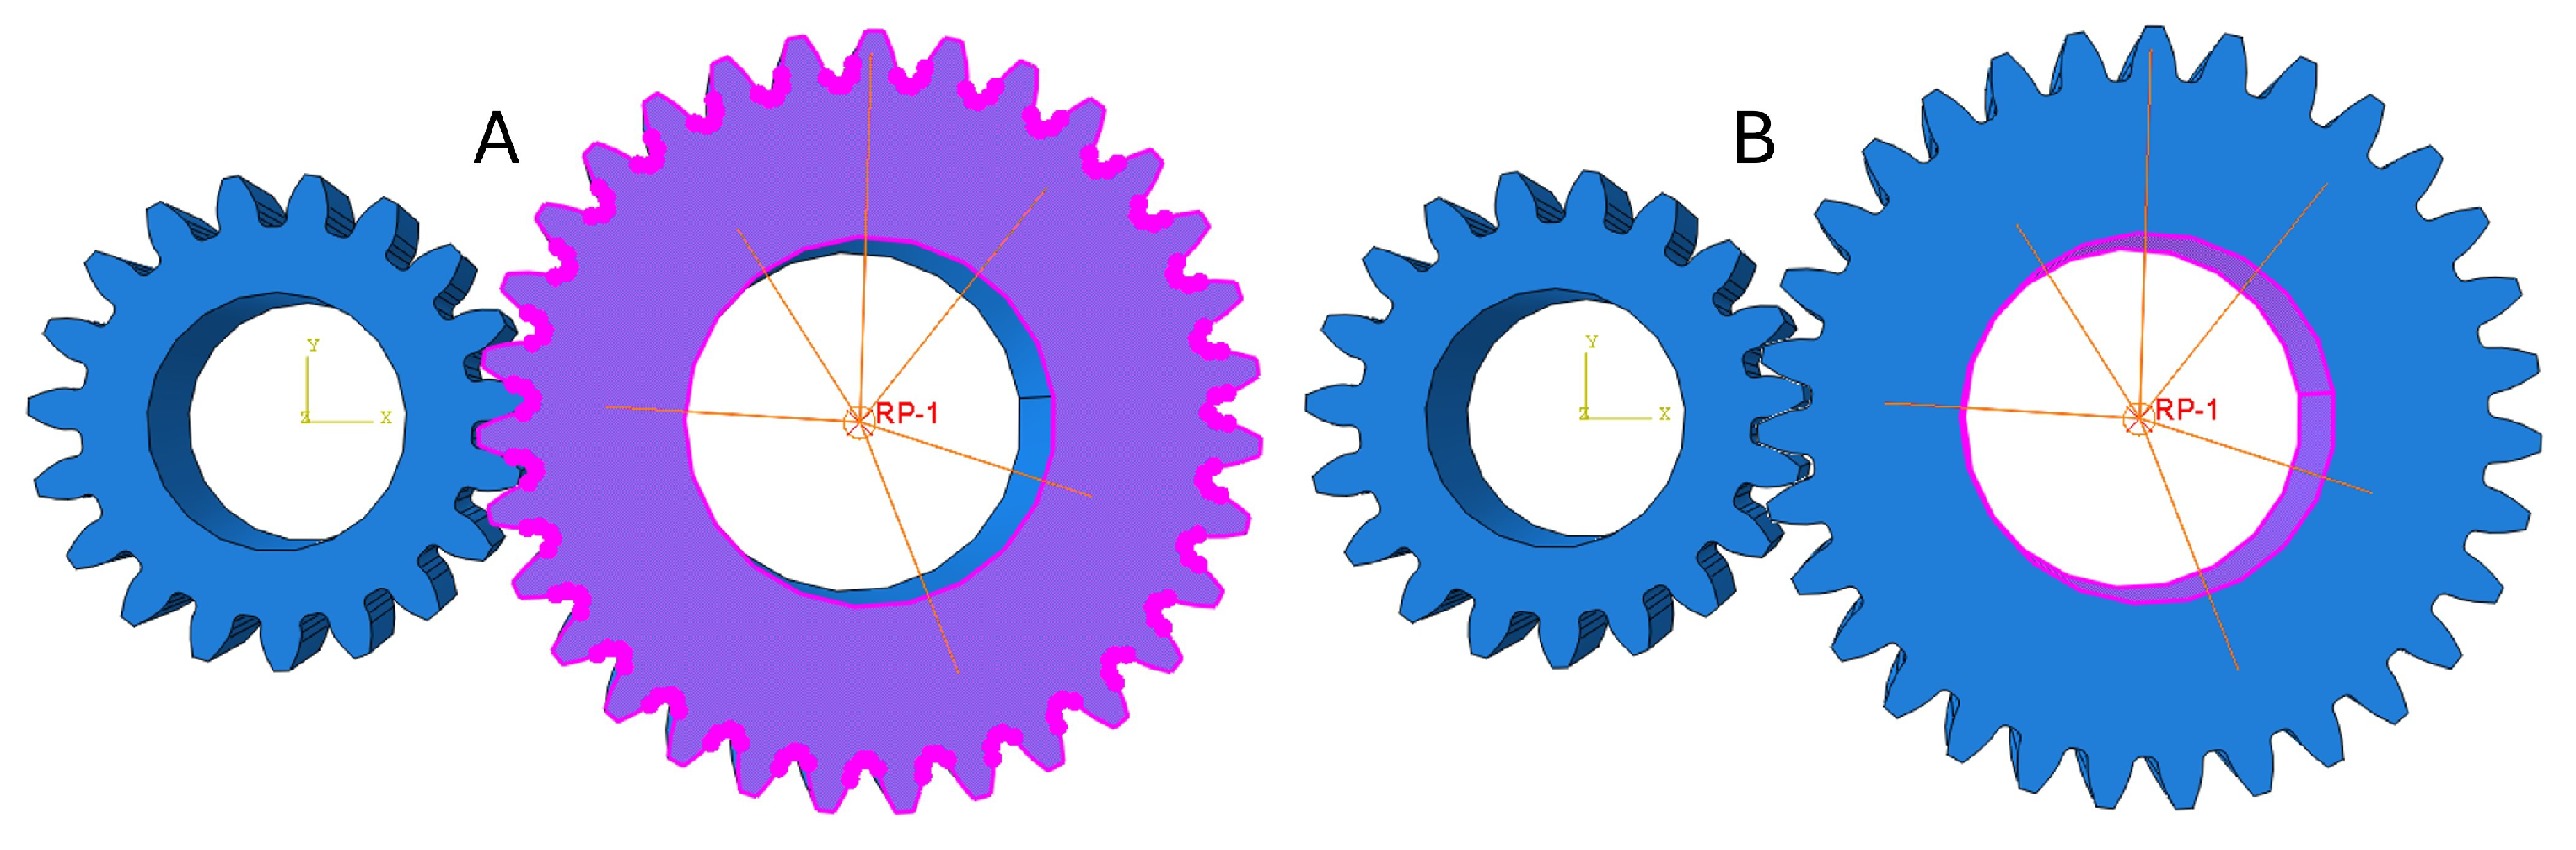
- Determine the angular displacement from the FE solution, which quantifies the rotational deflection of the pinion relative to a reference point (RP) induced by the applied torque.
- 4.
- Incrementally rotate the gear pair by an angular step proportional to the speed ratio () transitioning the contact to subsequent tooth pairs.
- 5.
- Repeat steps 2–4 across successive angular positions until a full mesh cycle is completed.
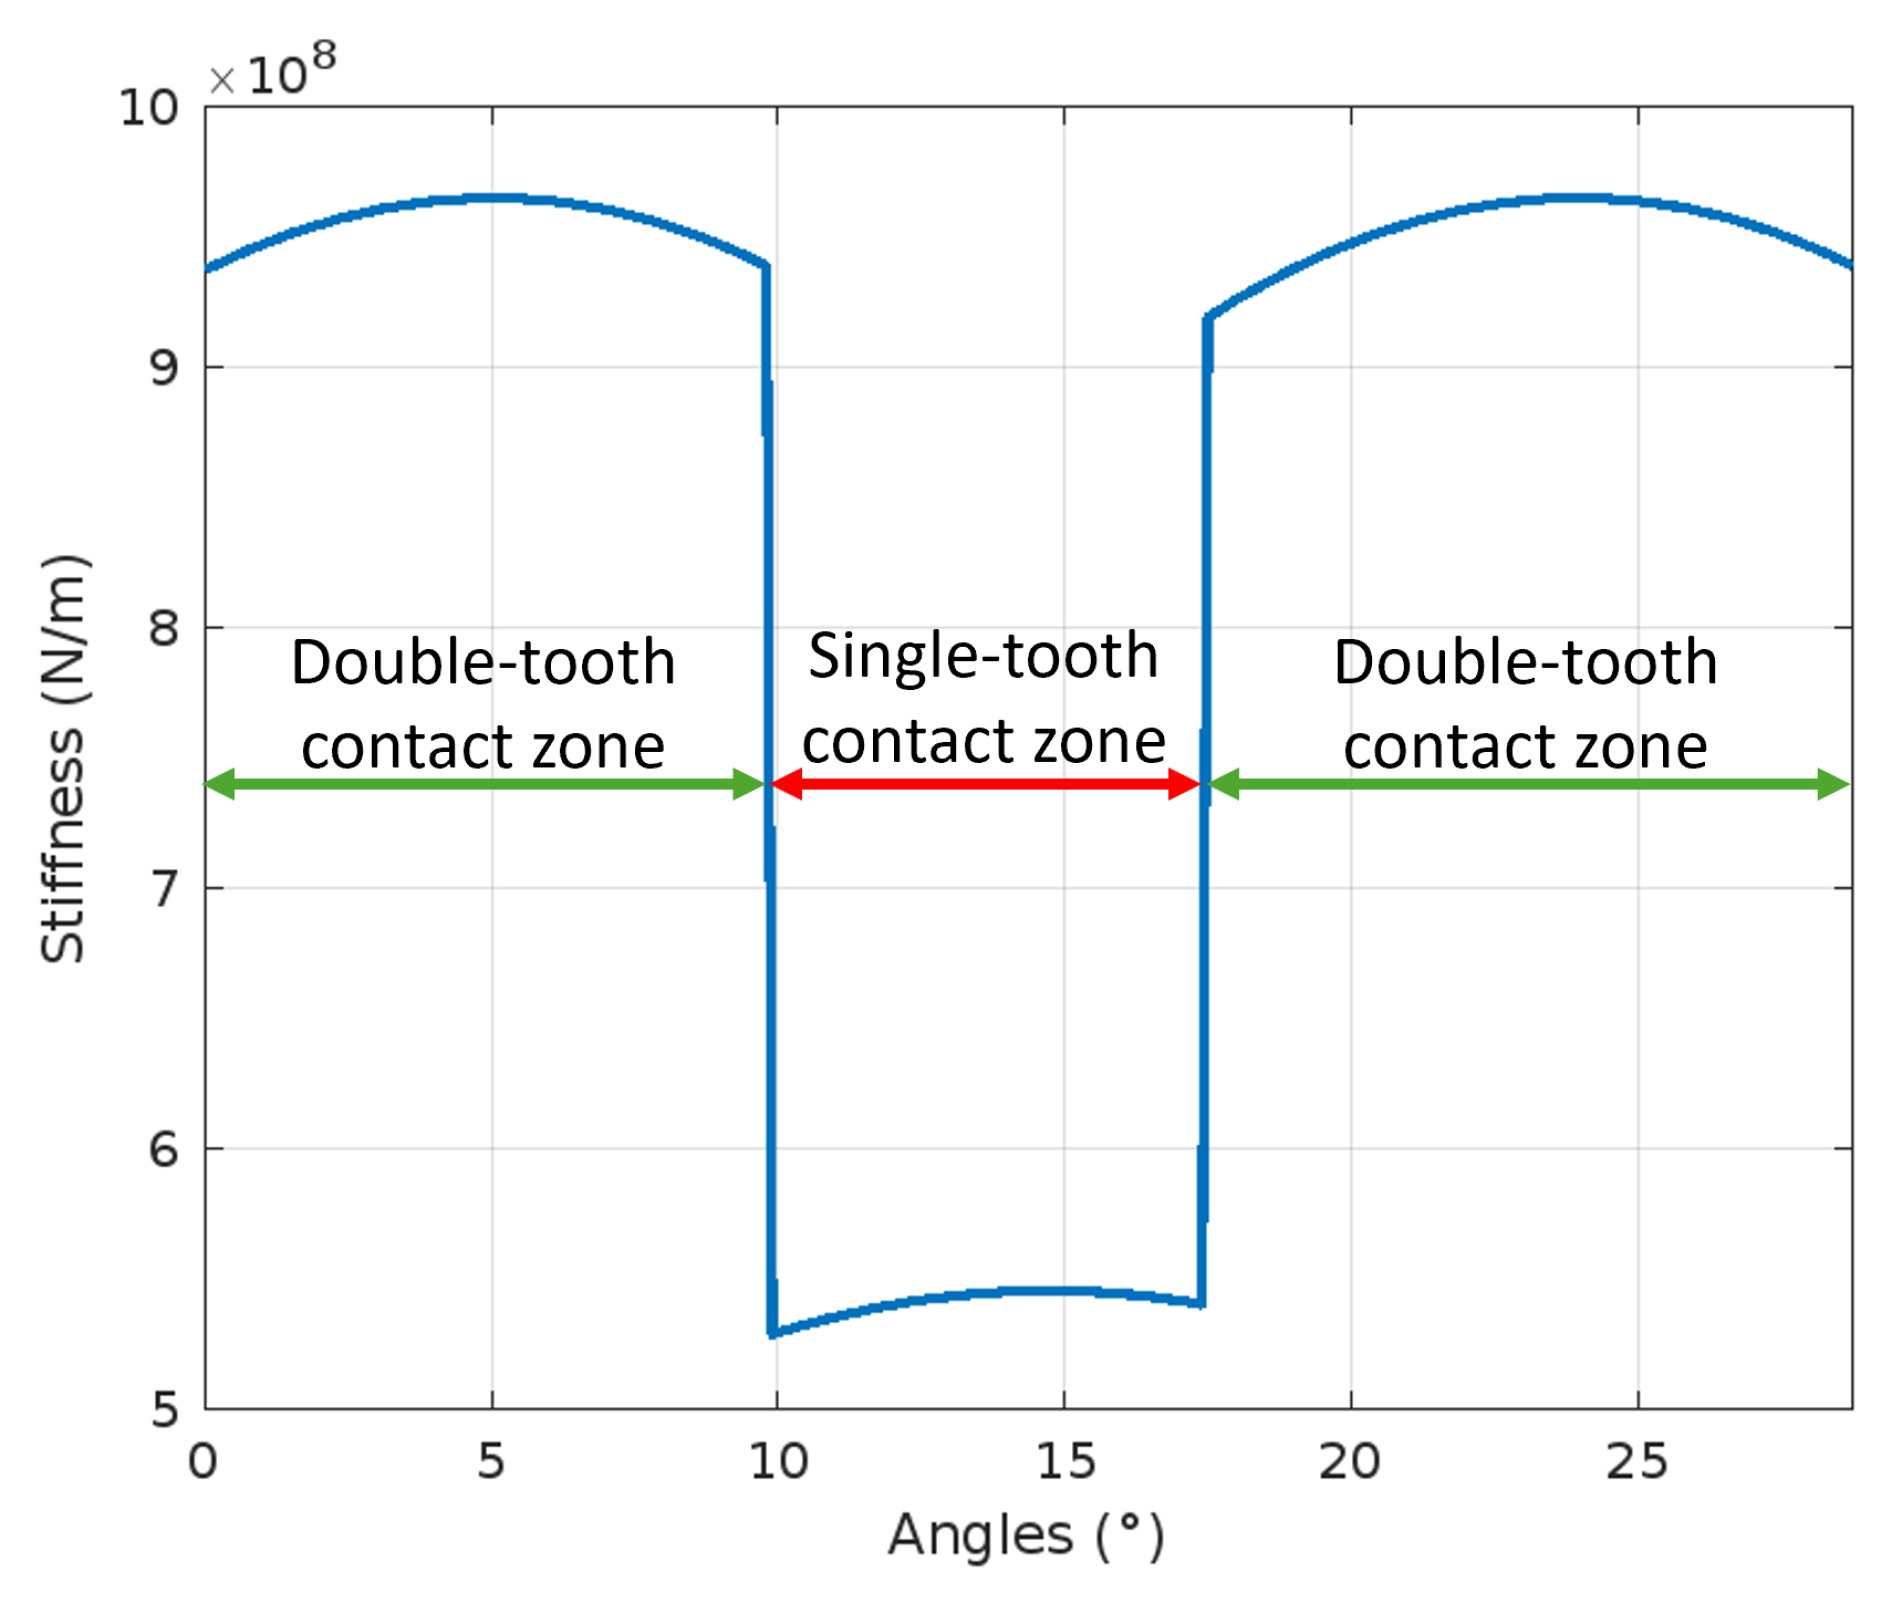
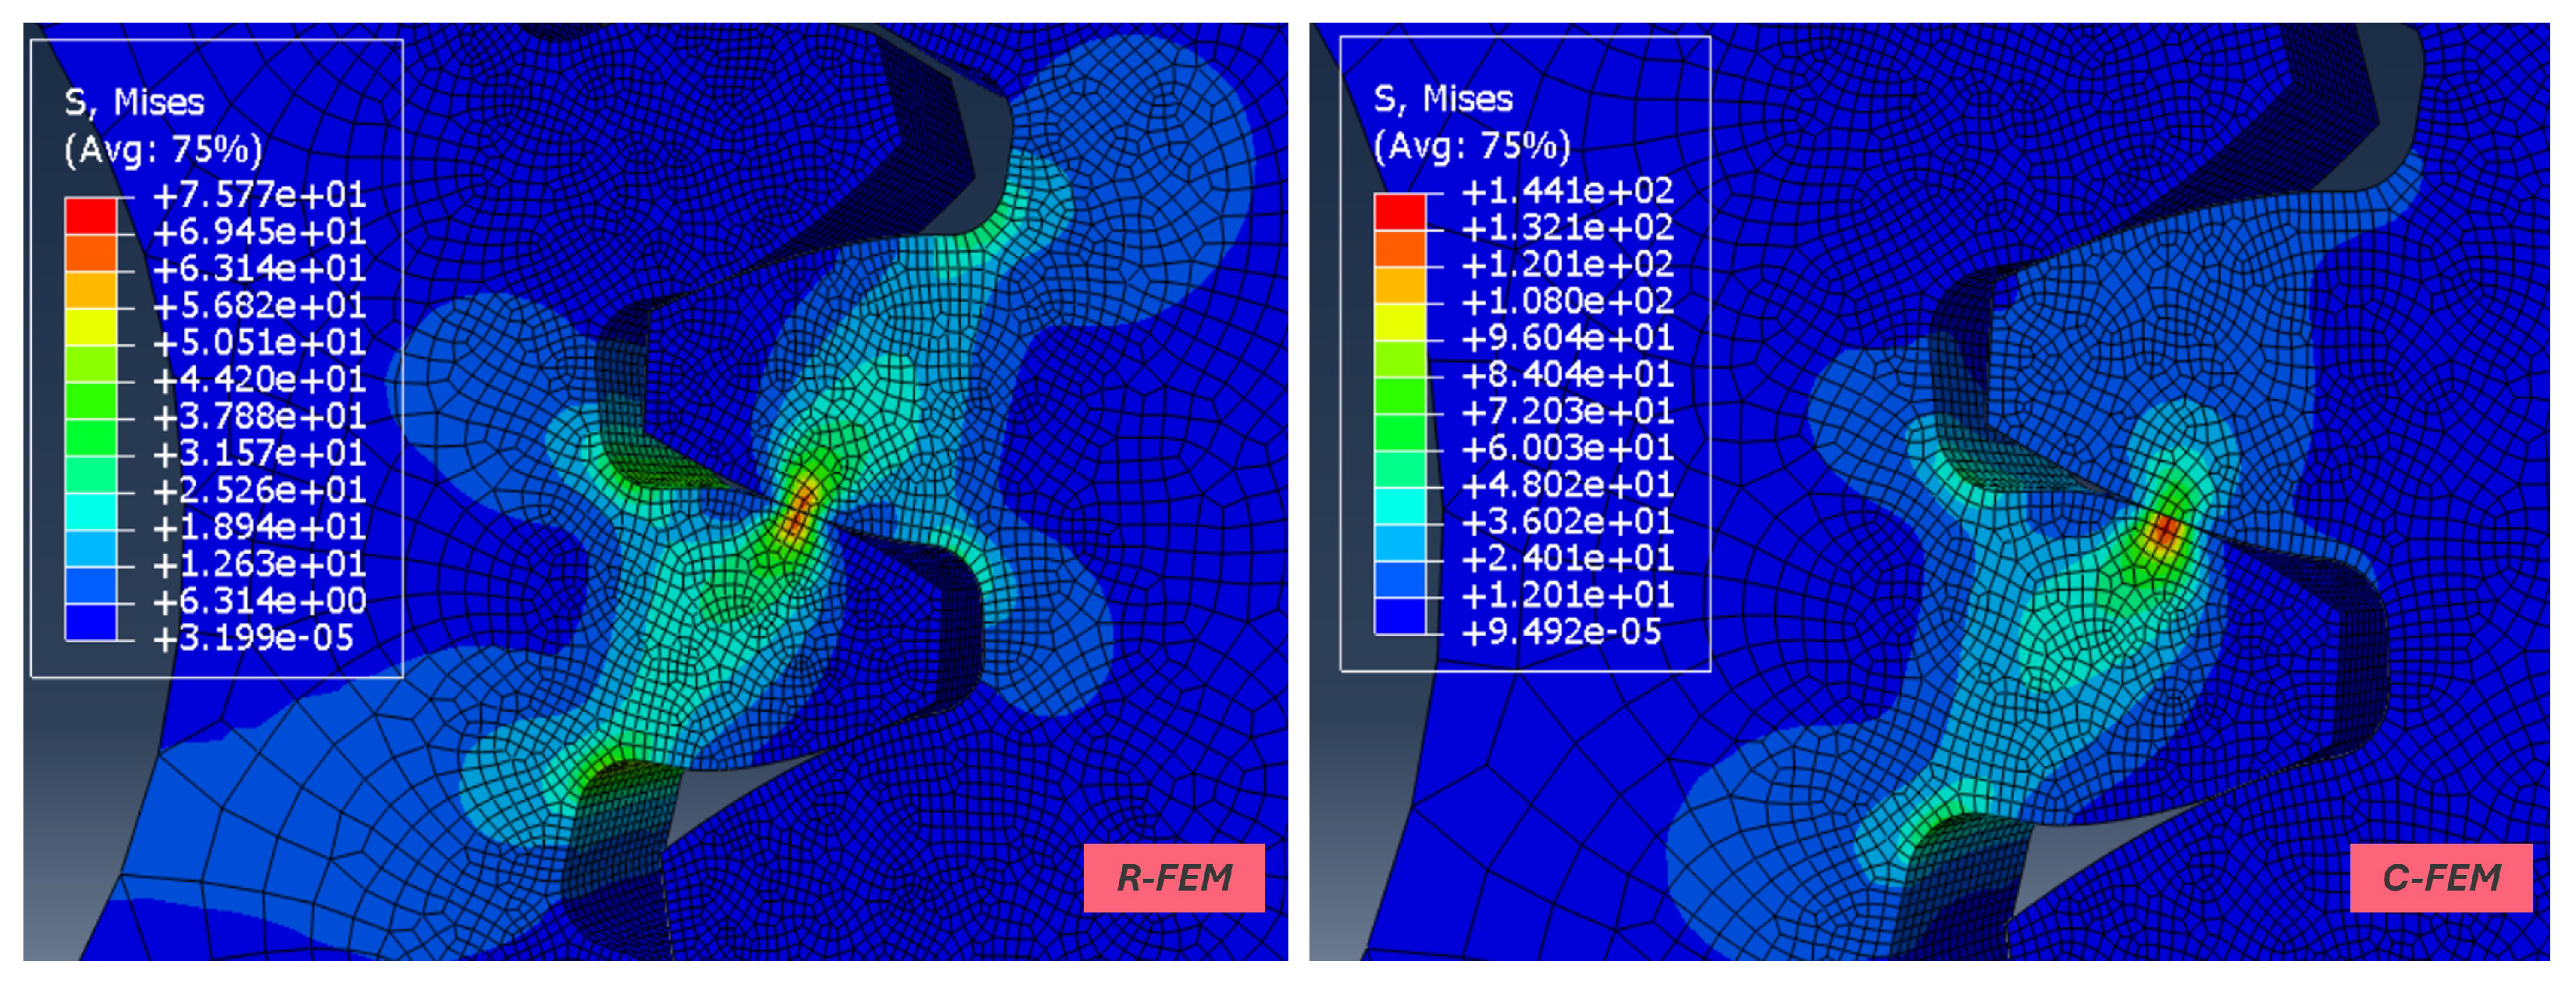
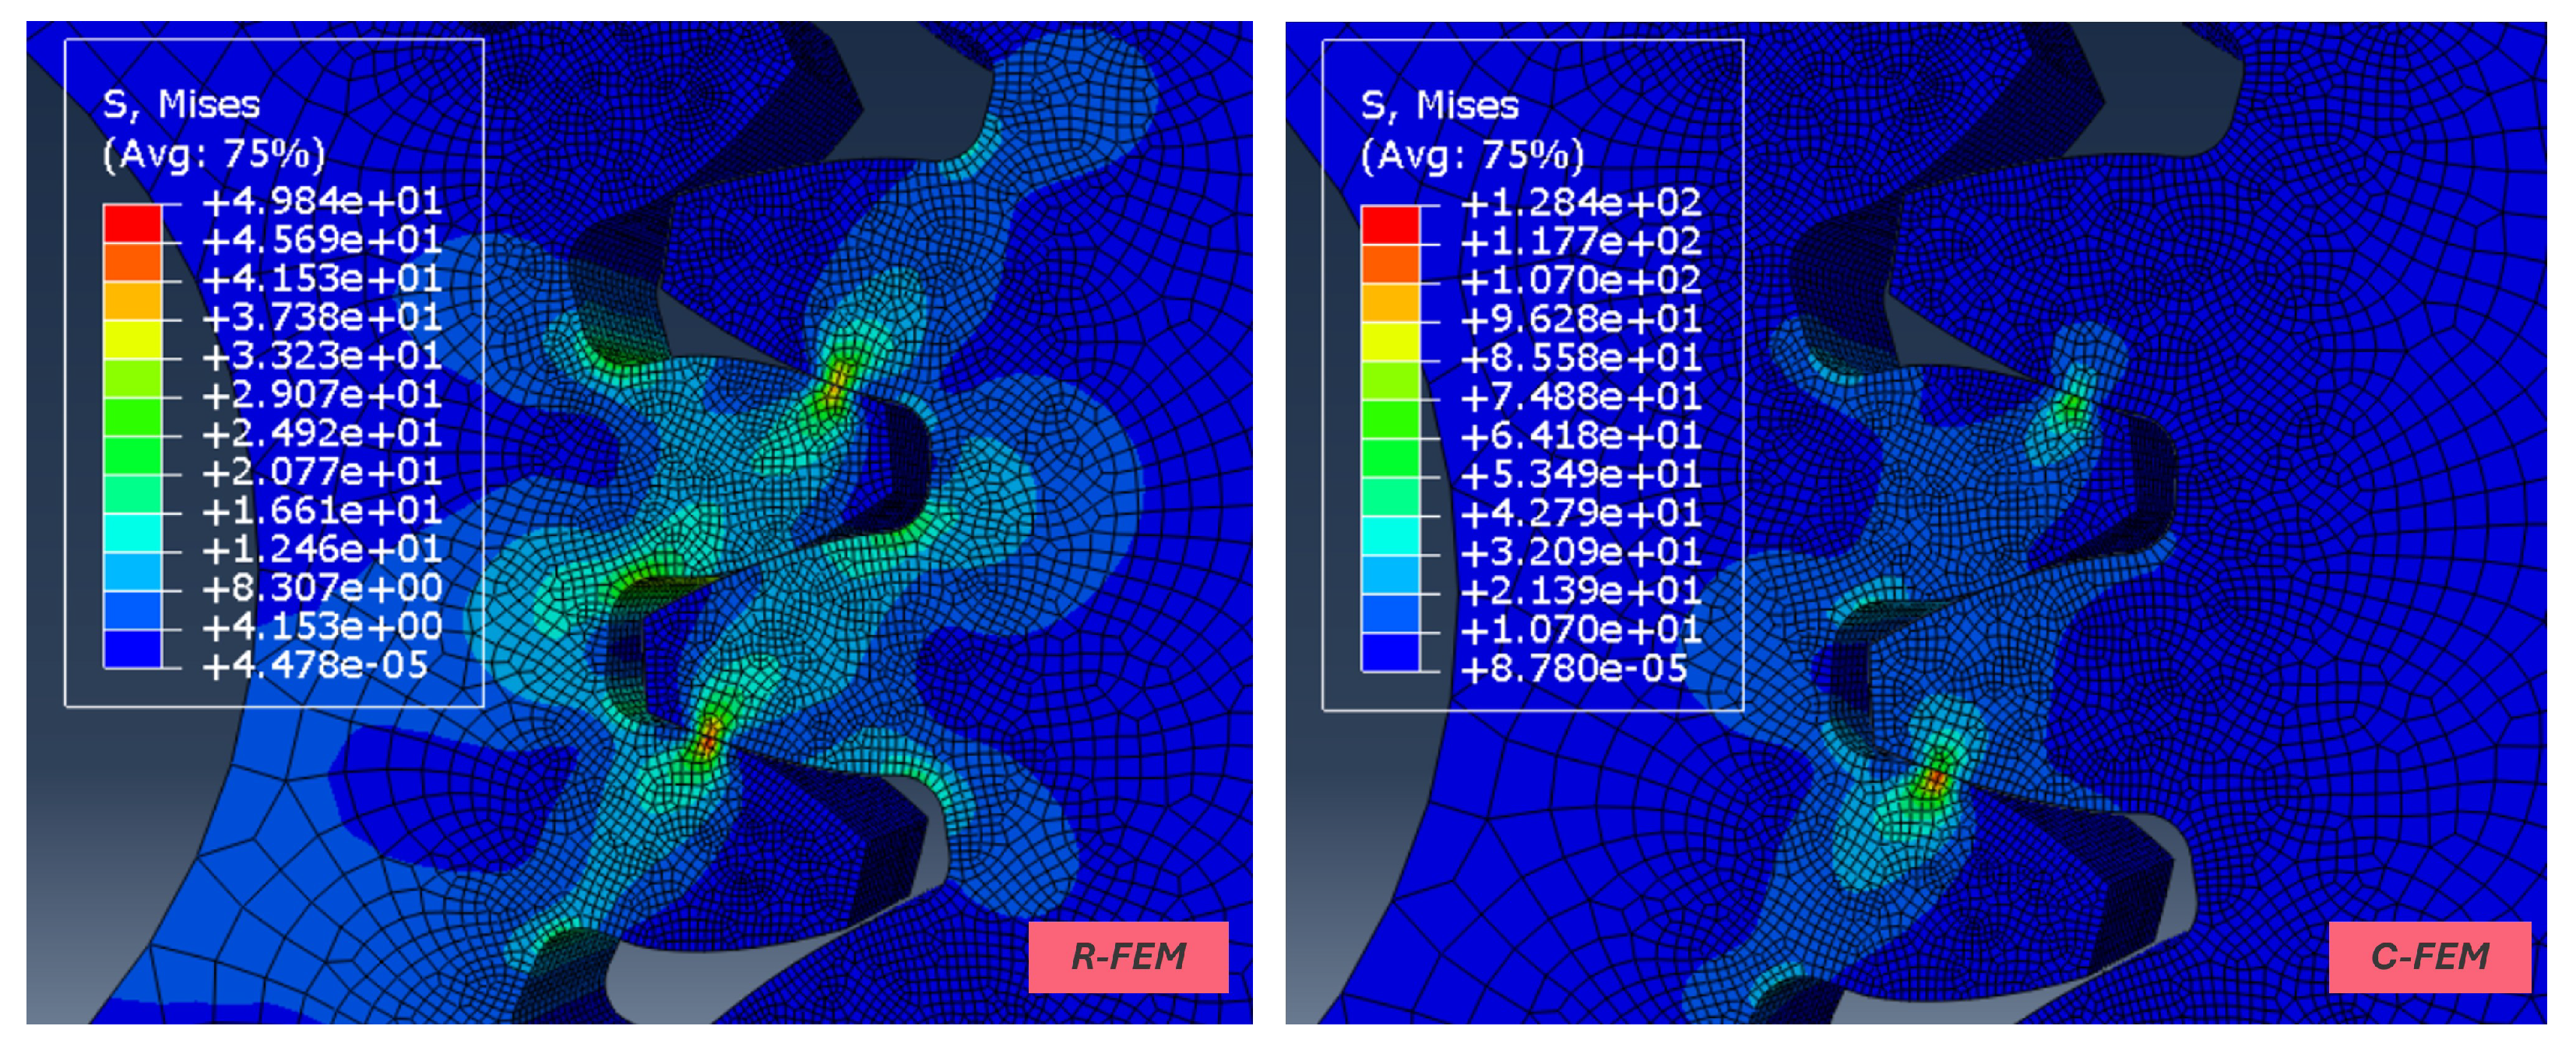
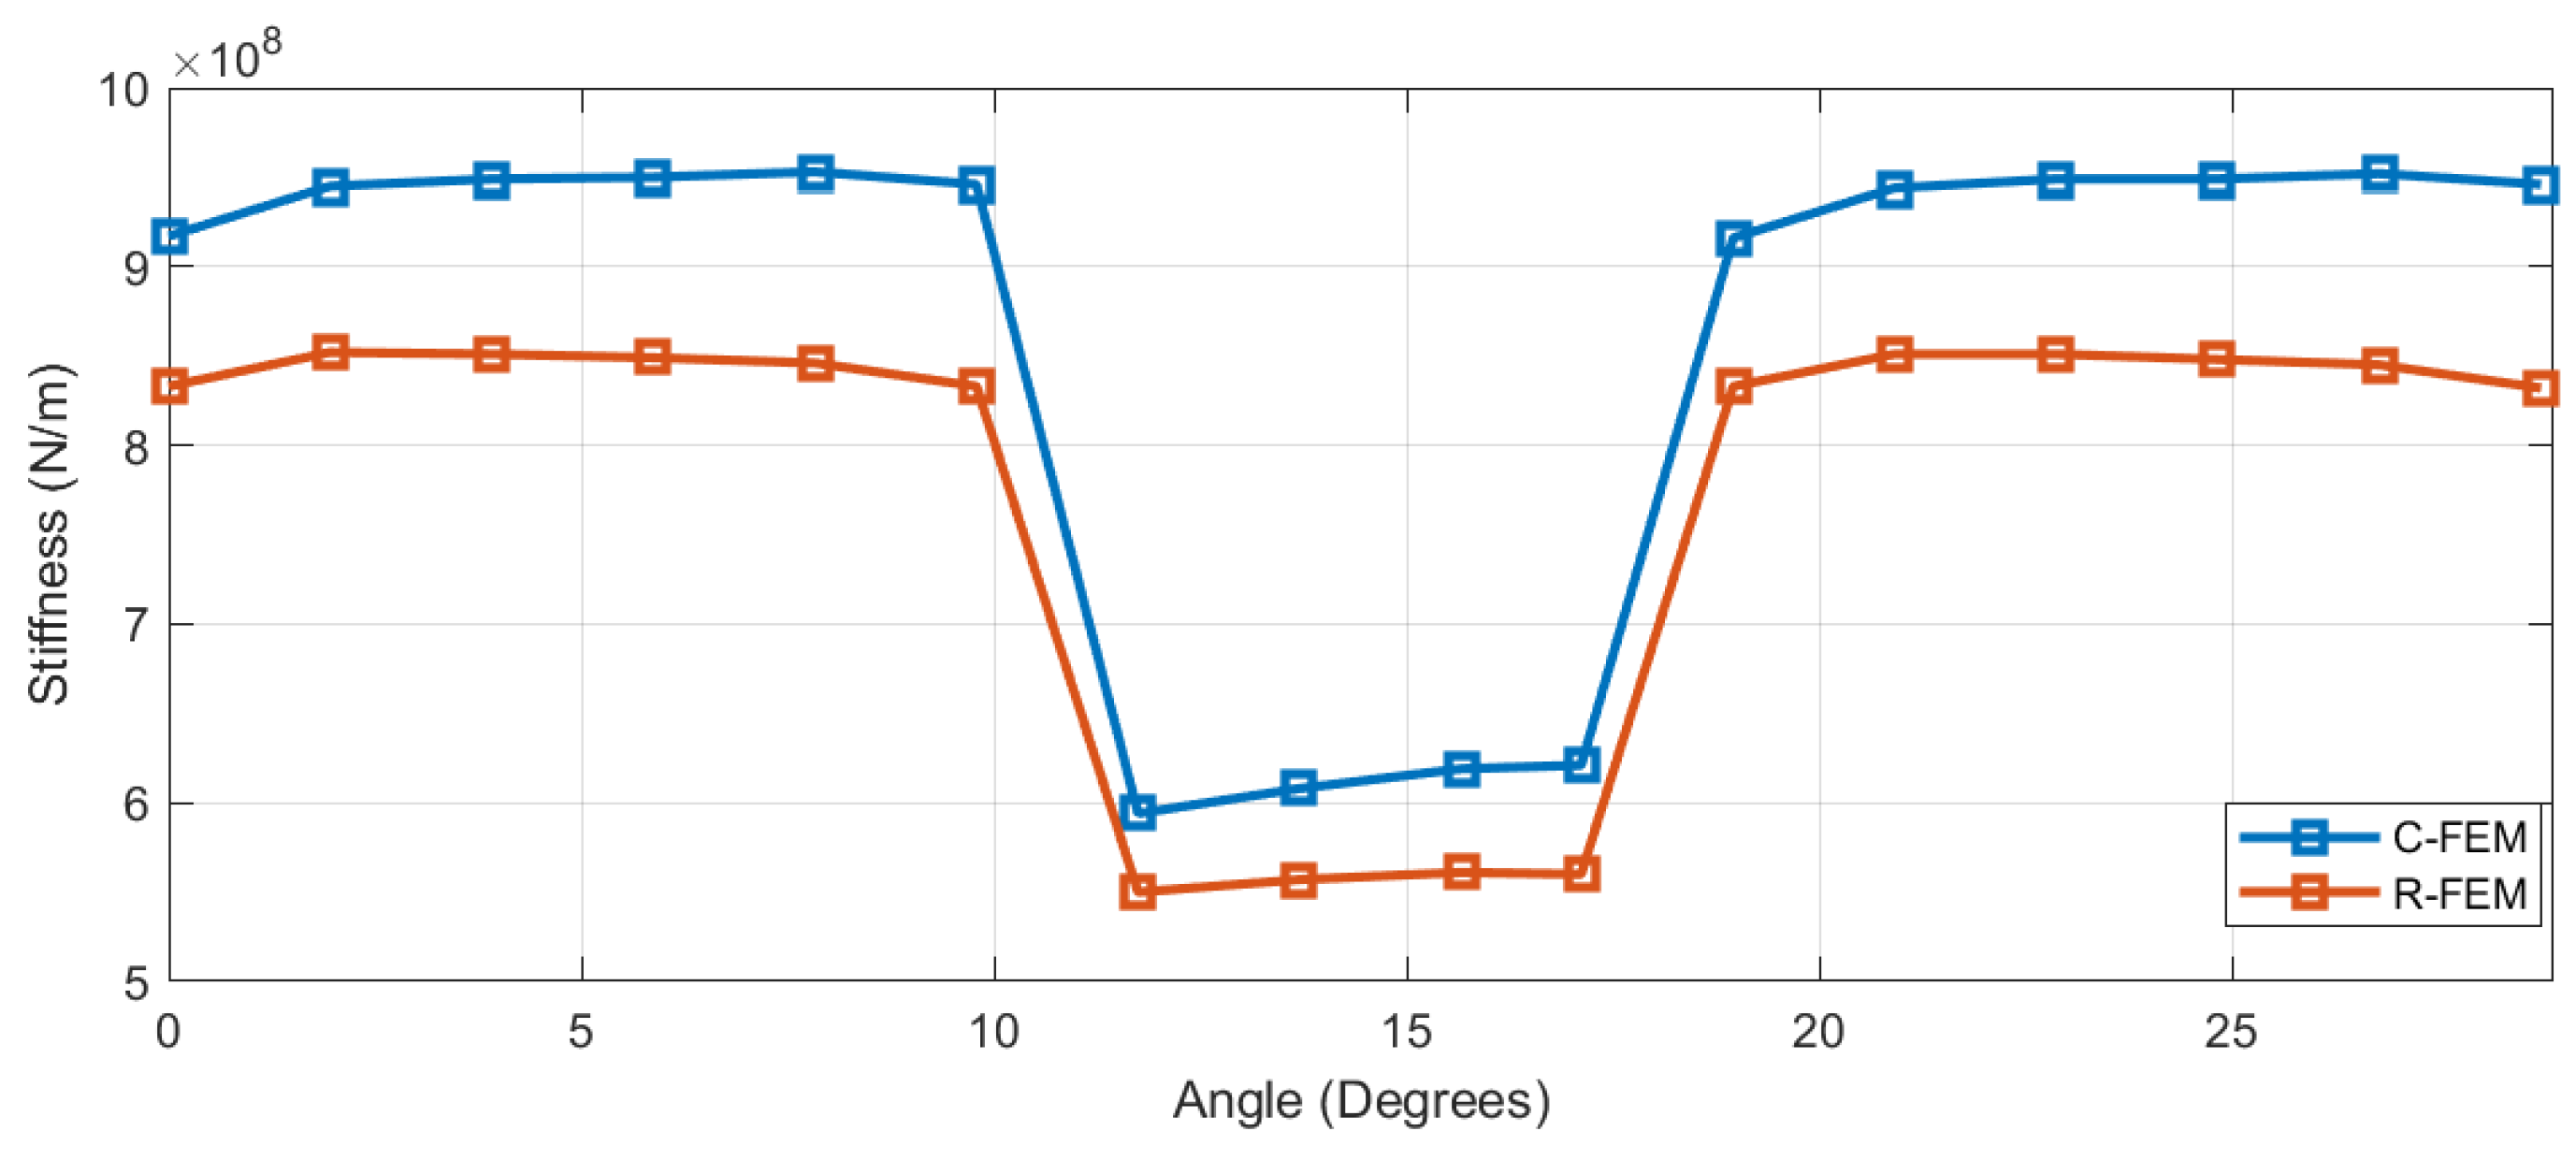
2.4. R-FEM and C-FEM
2.5. TVMS Sensitivity to Parameter Variations
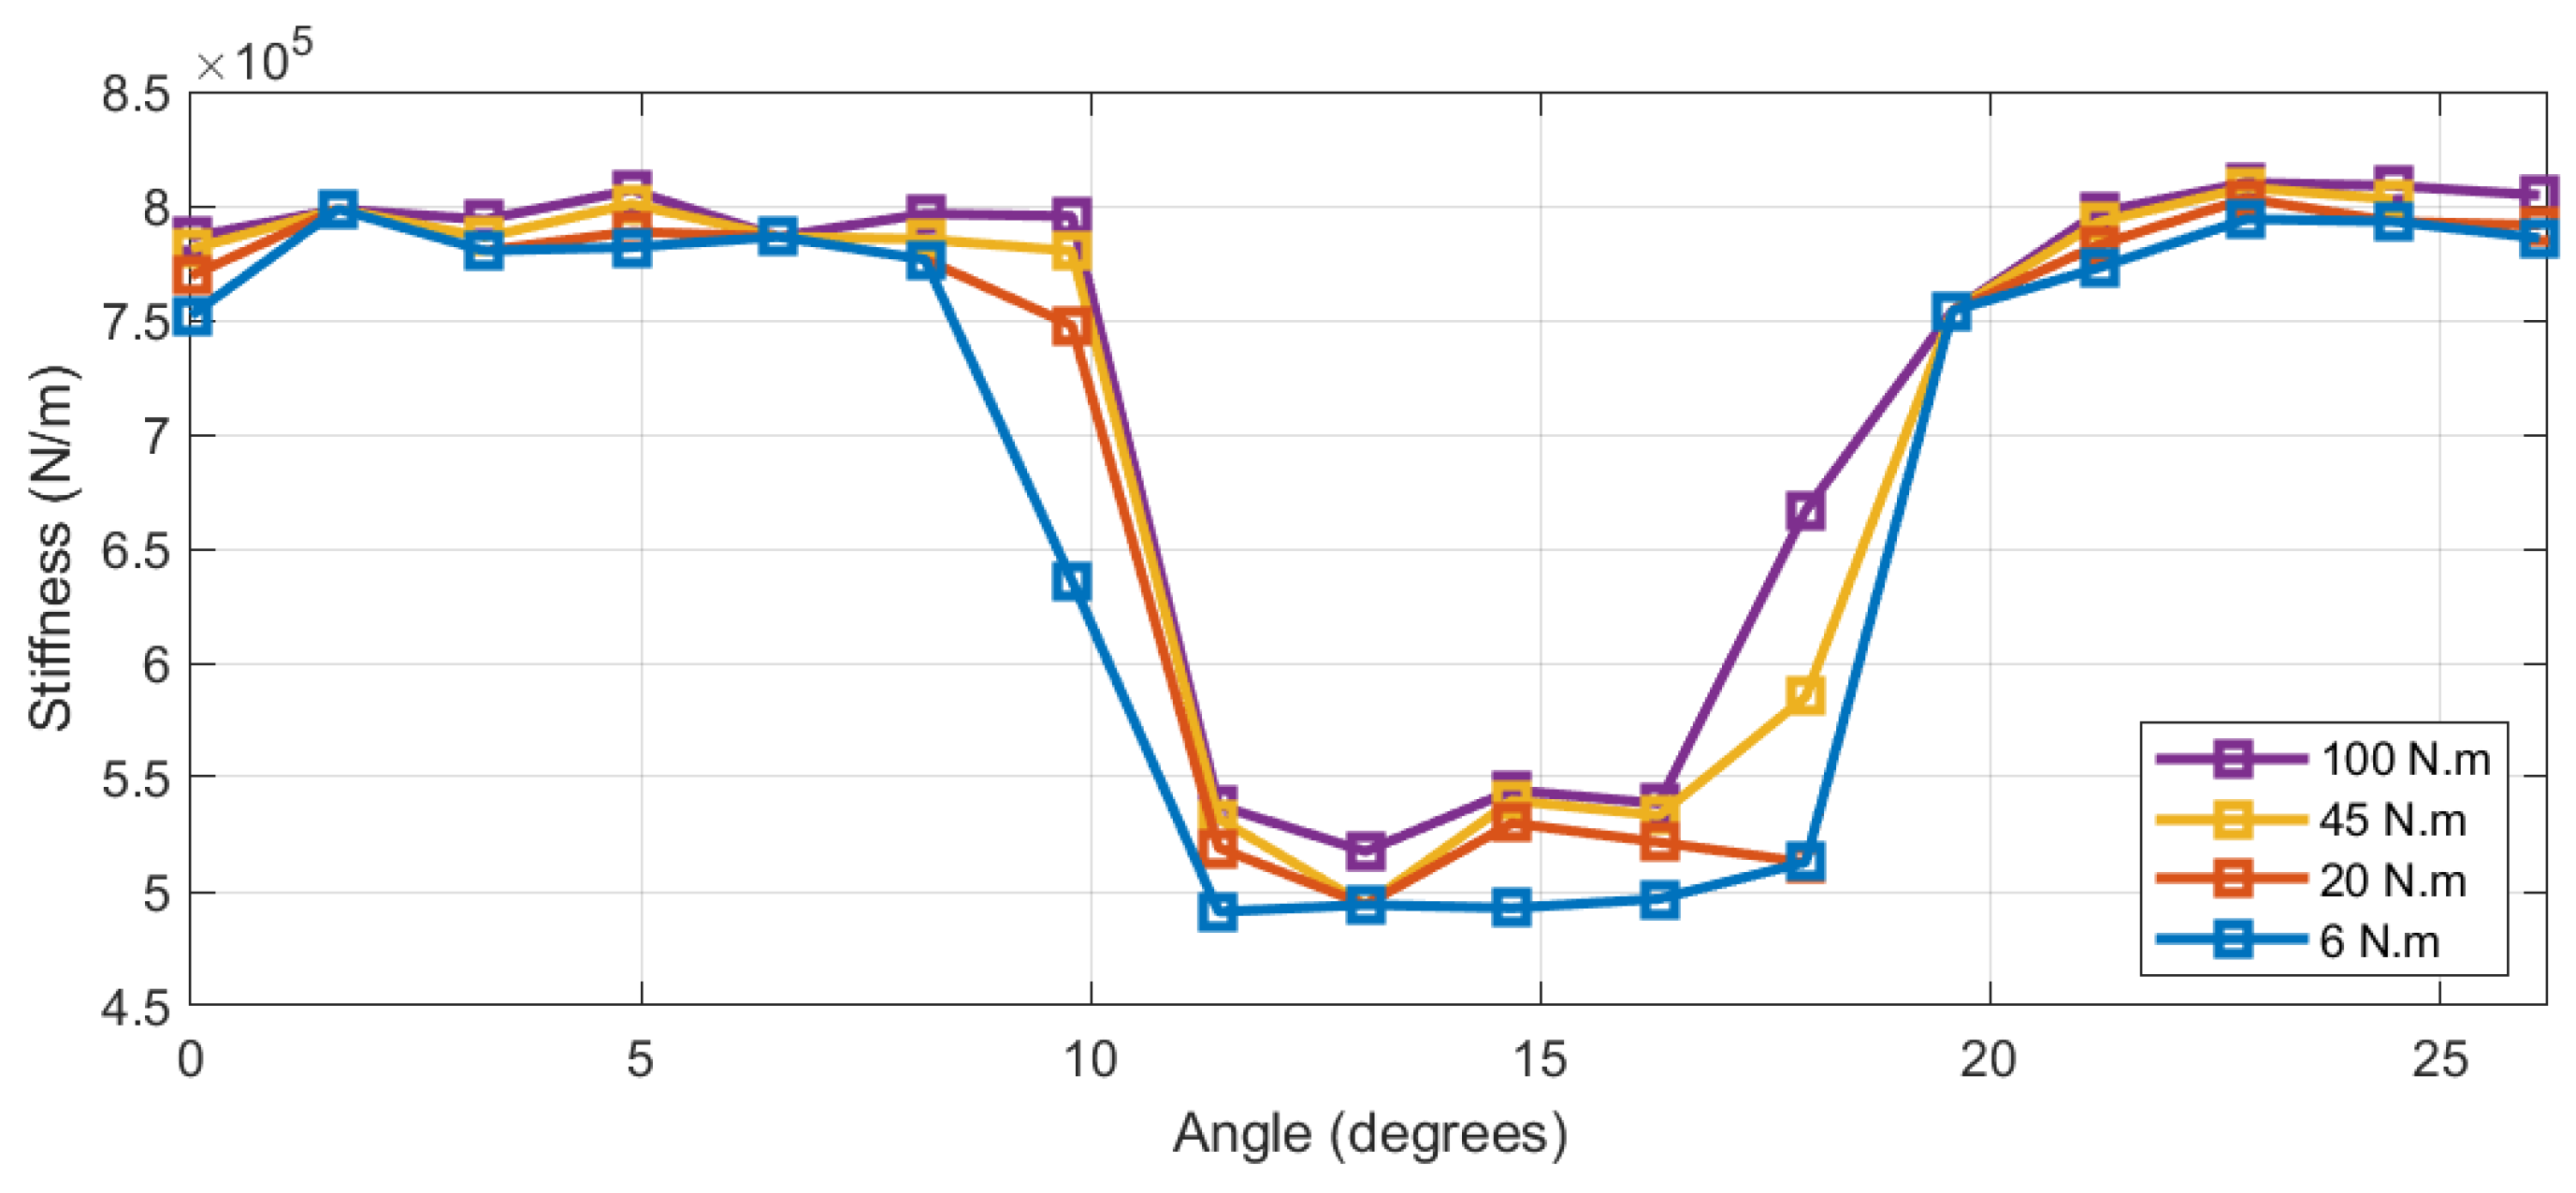
2.5.1. Effects of Applied Torque
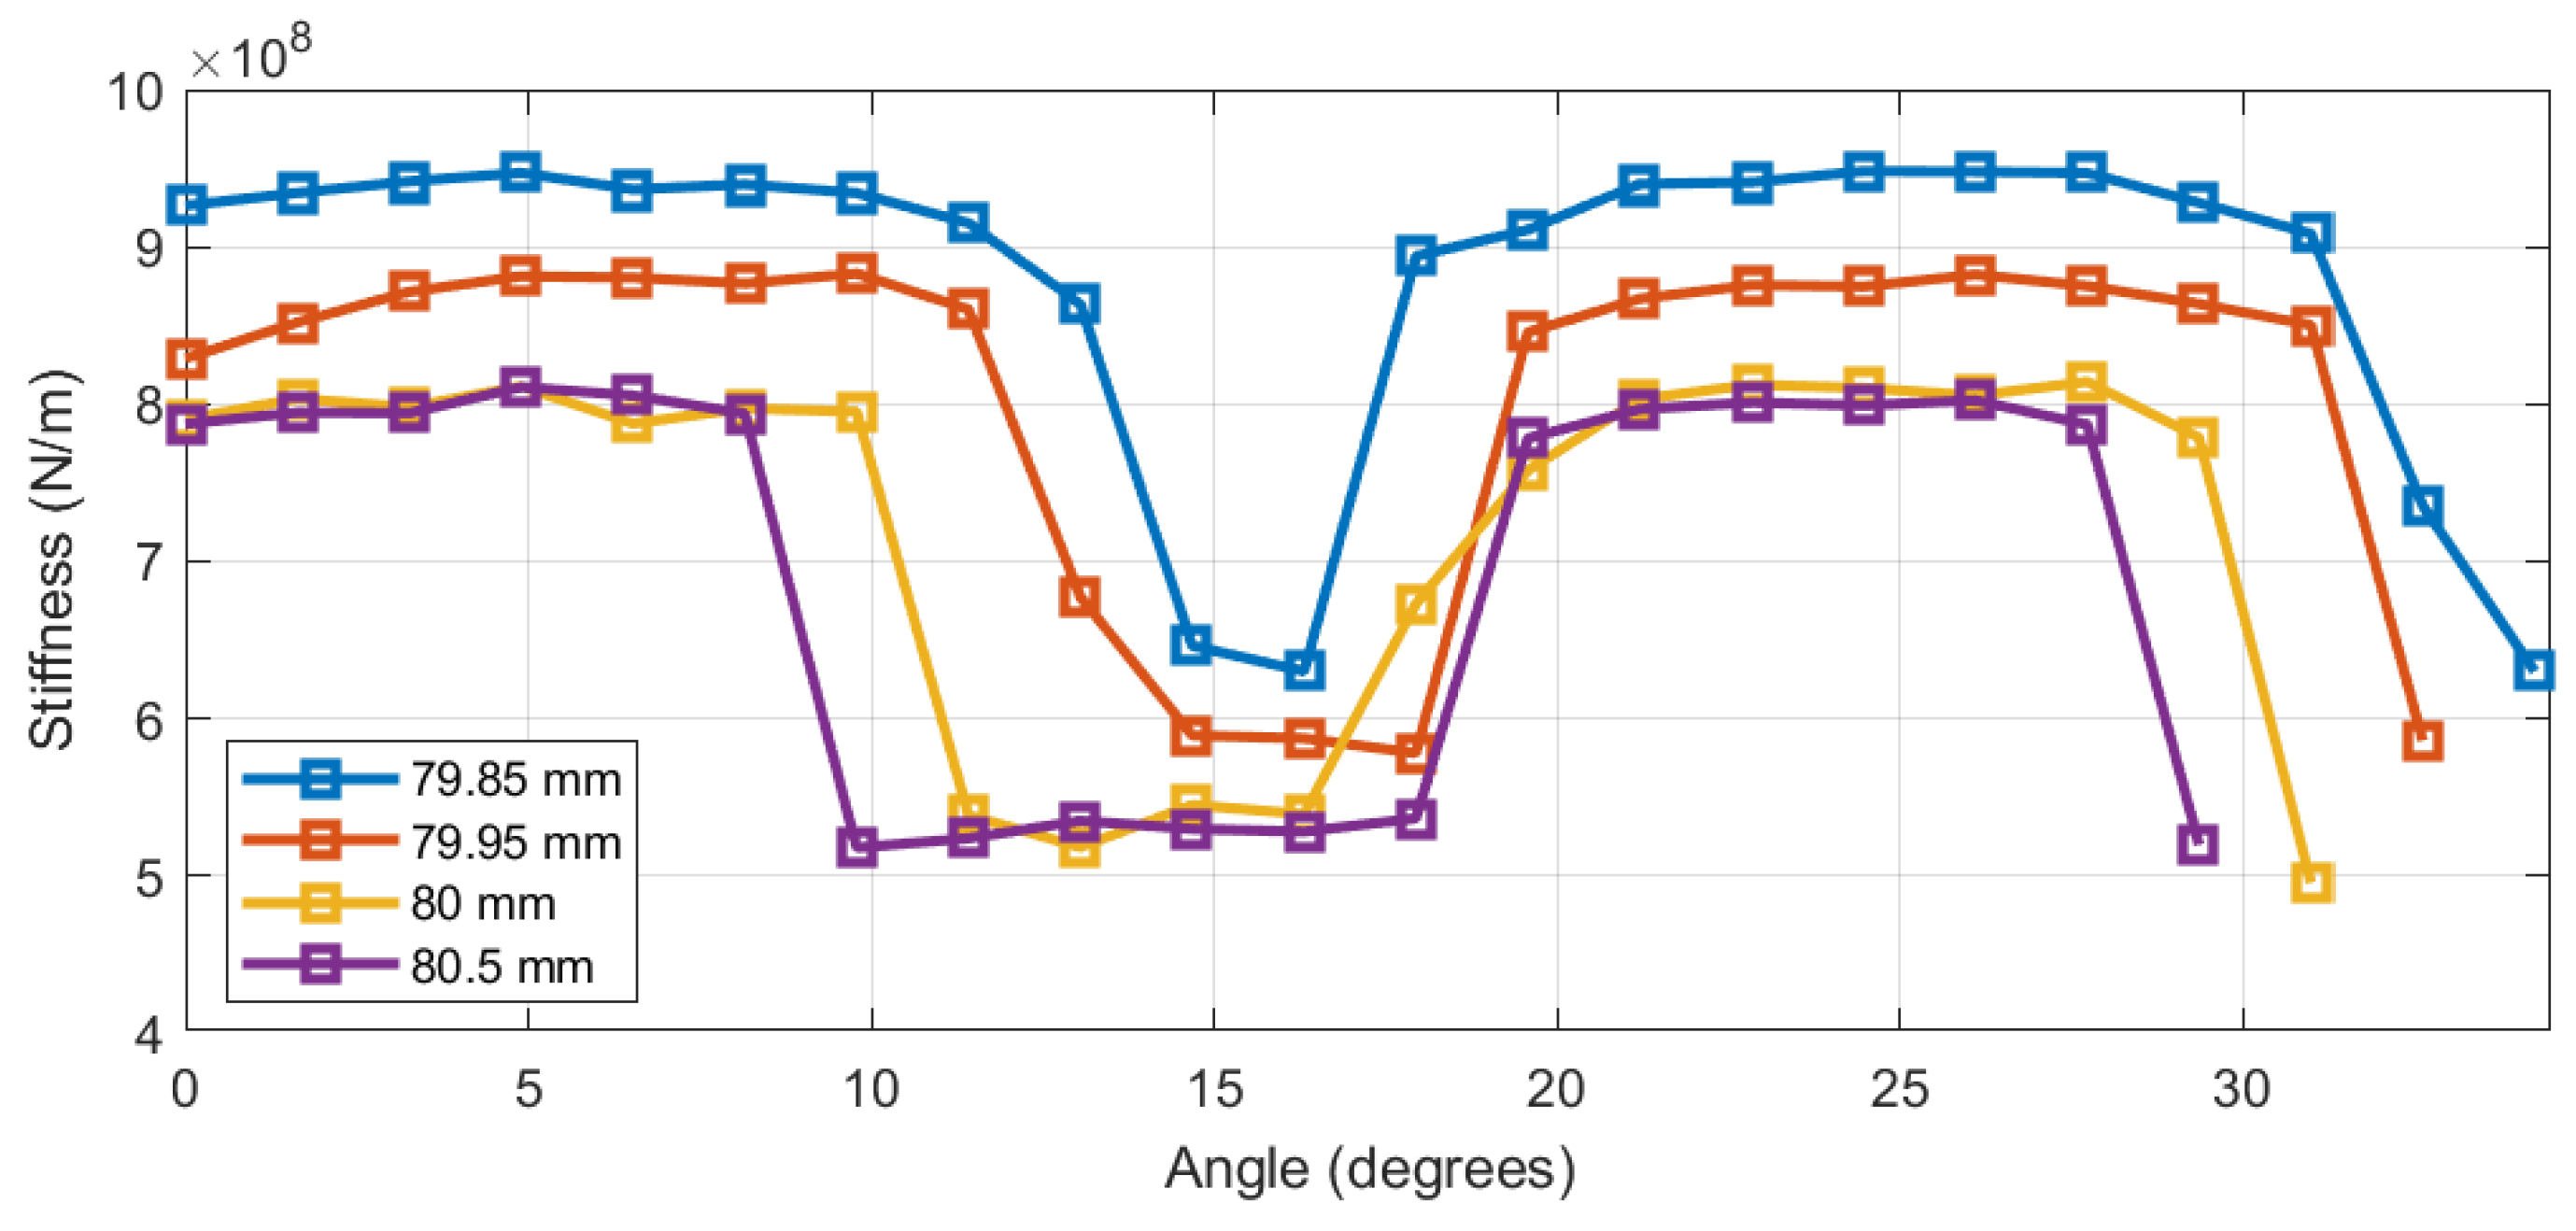
2.5.2. Impact of Gear Center Distance
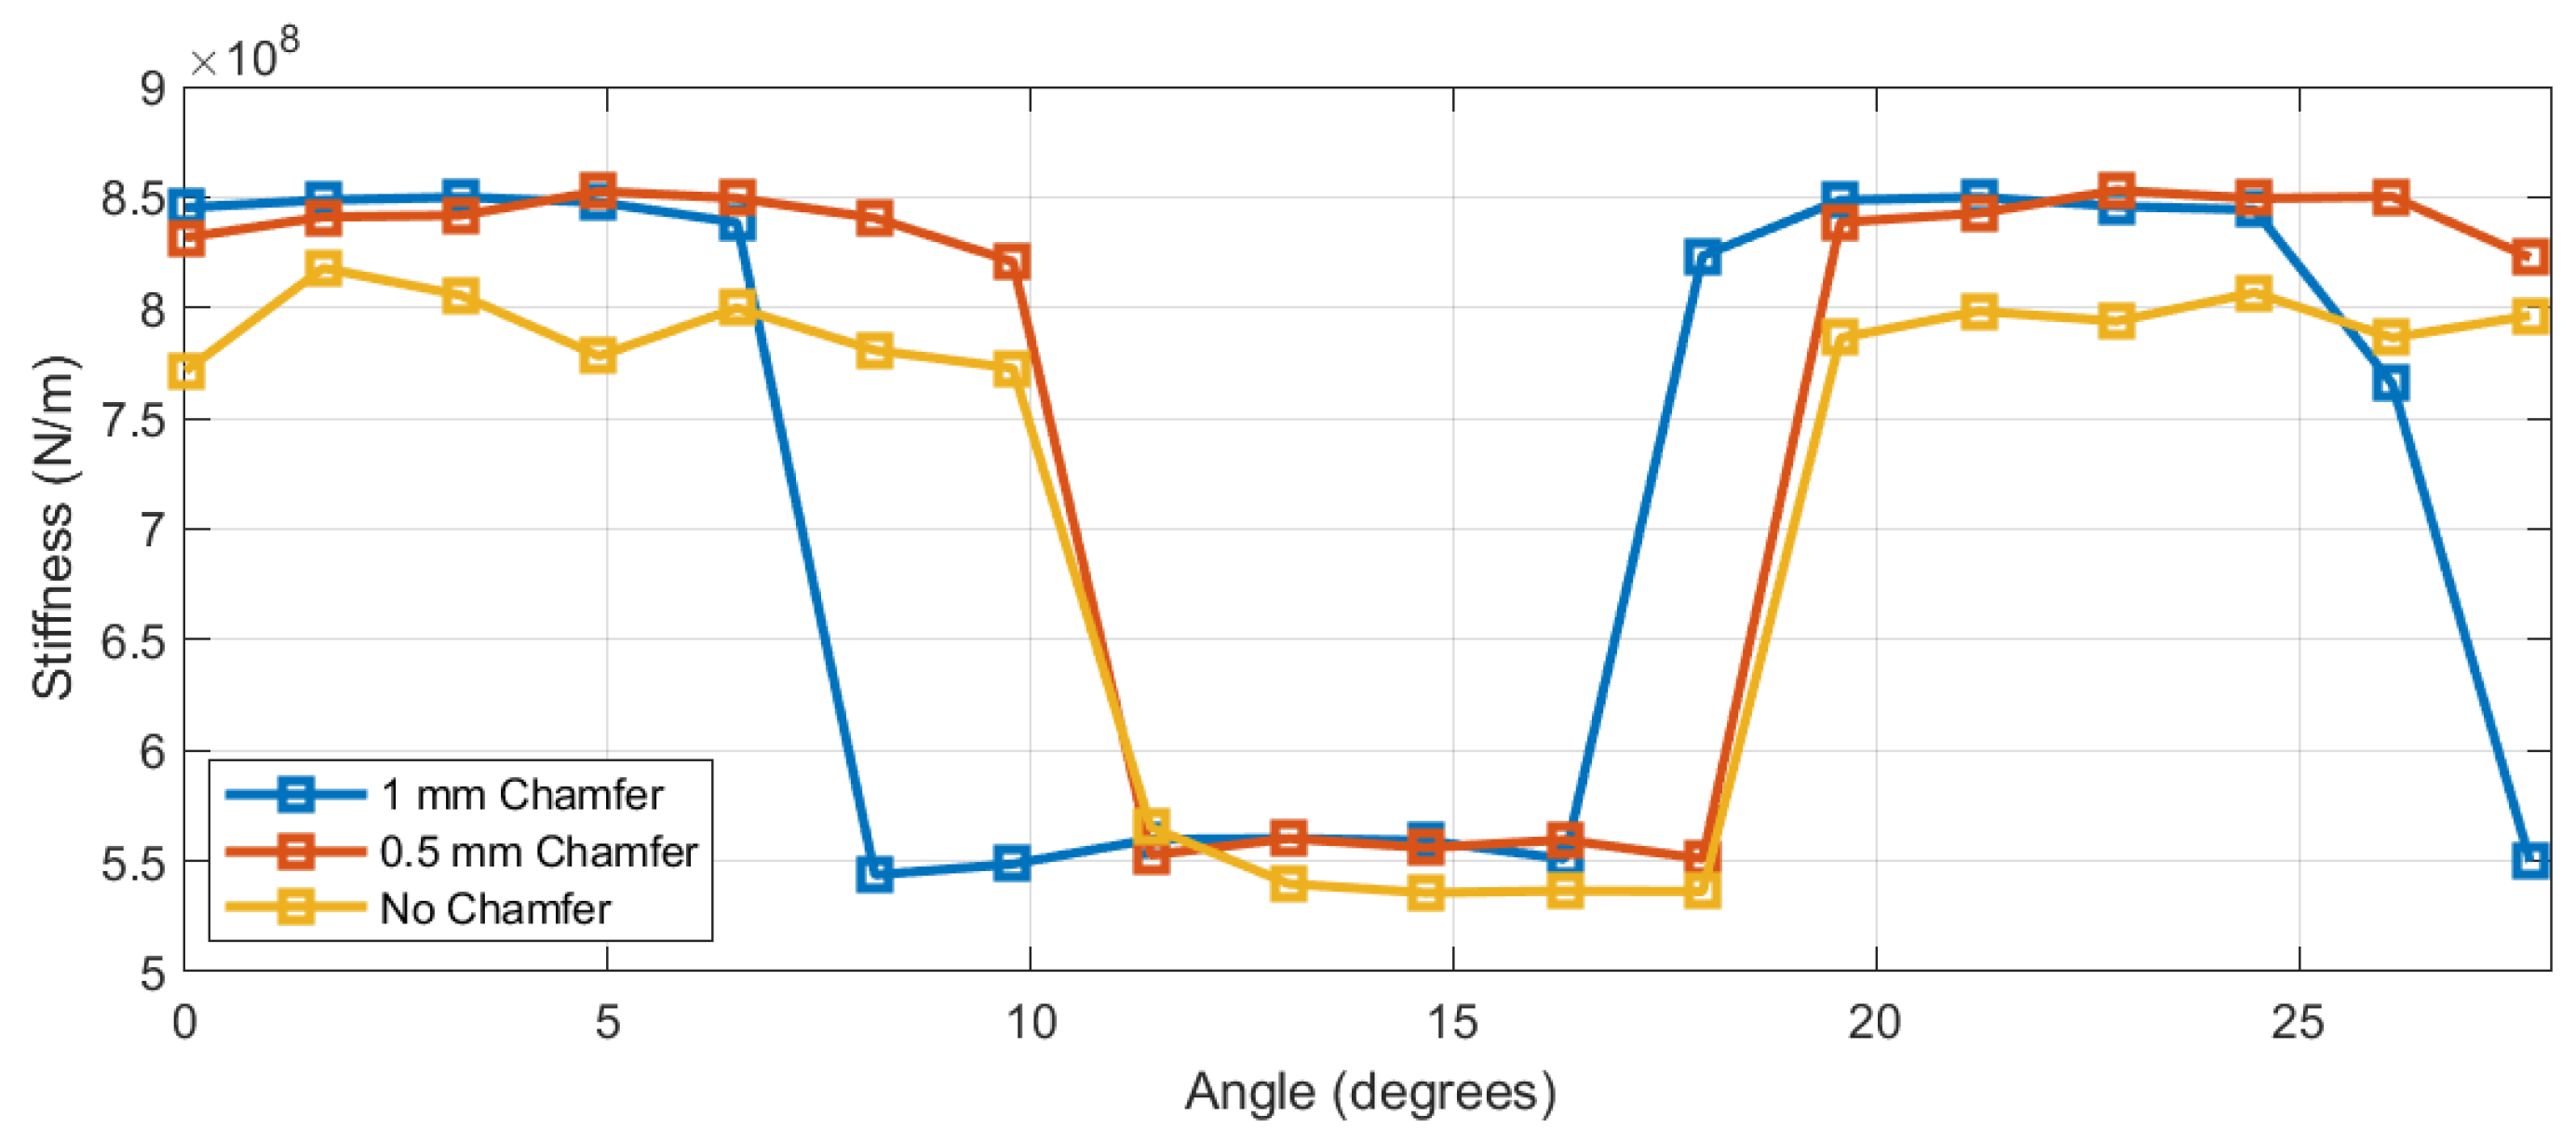
2.5.3. Impact of Tooth Profile
2.5.4. Impact of Gear Hub Radius
2.5.5. Impact of Mesh Size
3. Results and Discussion
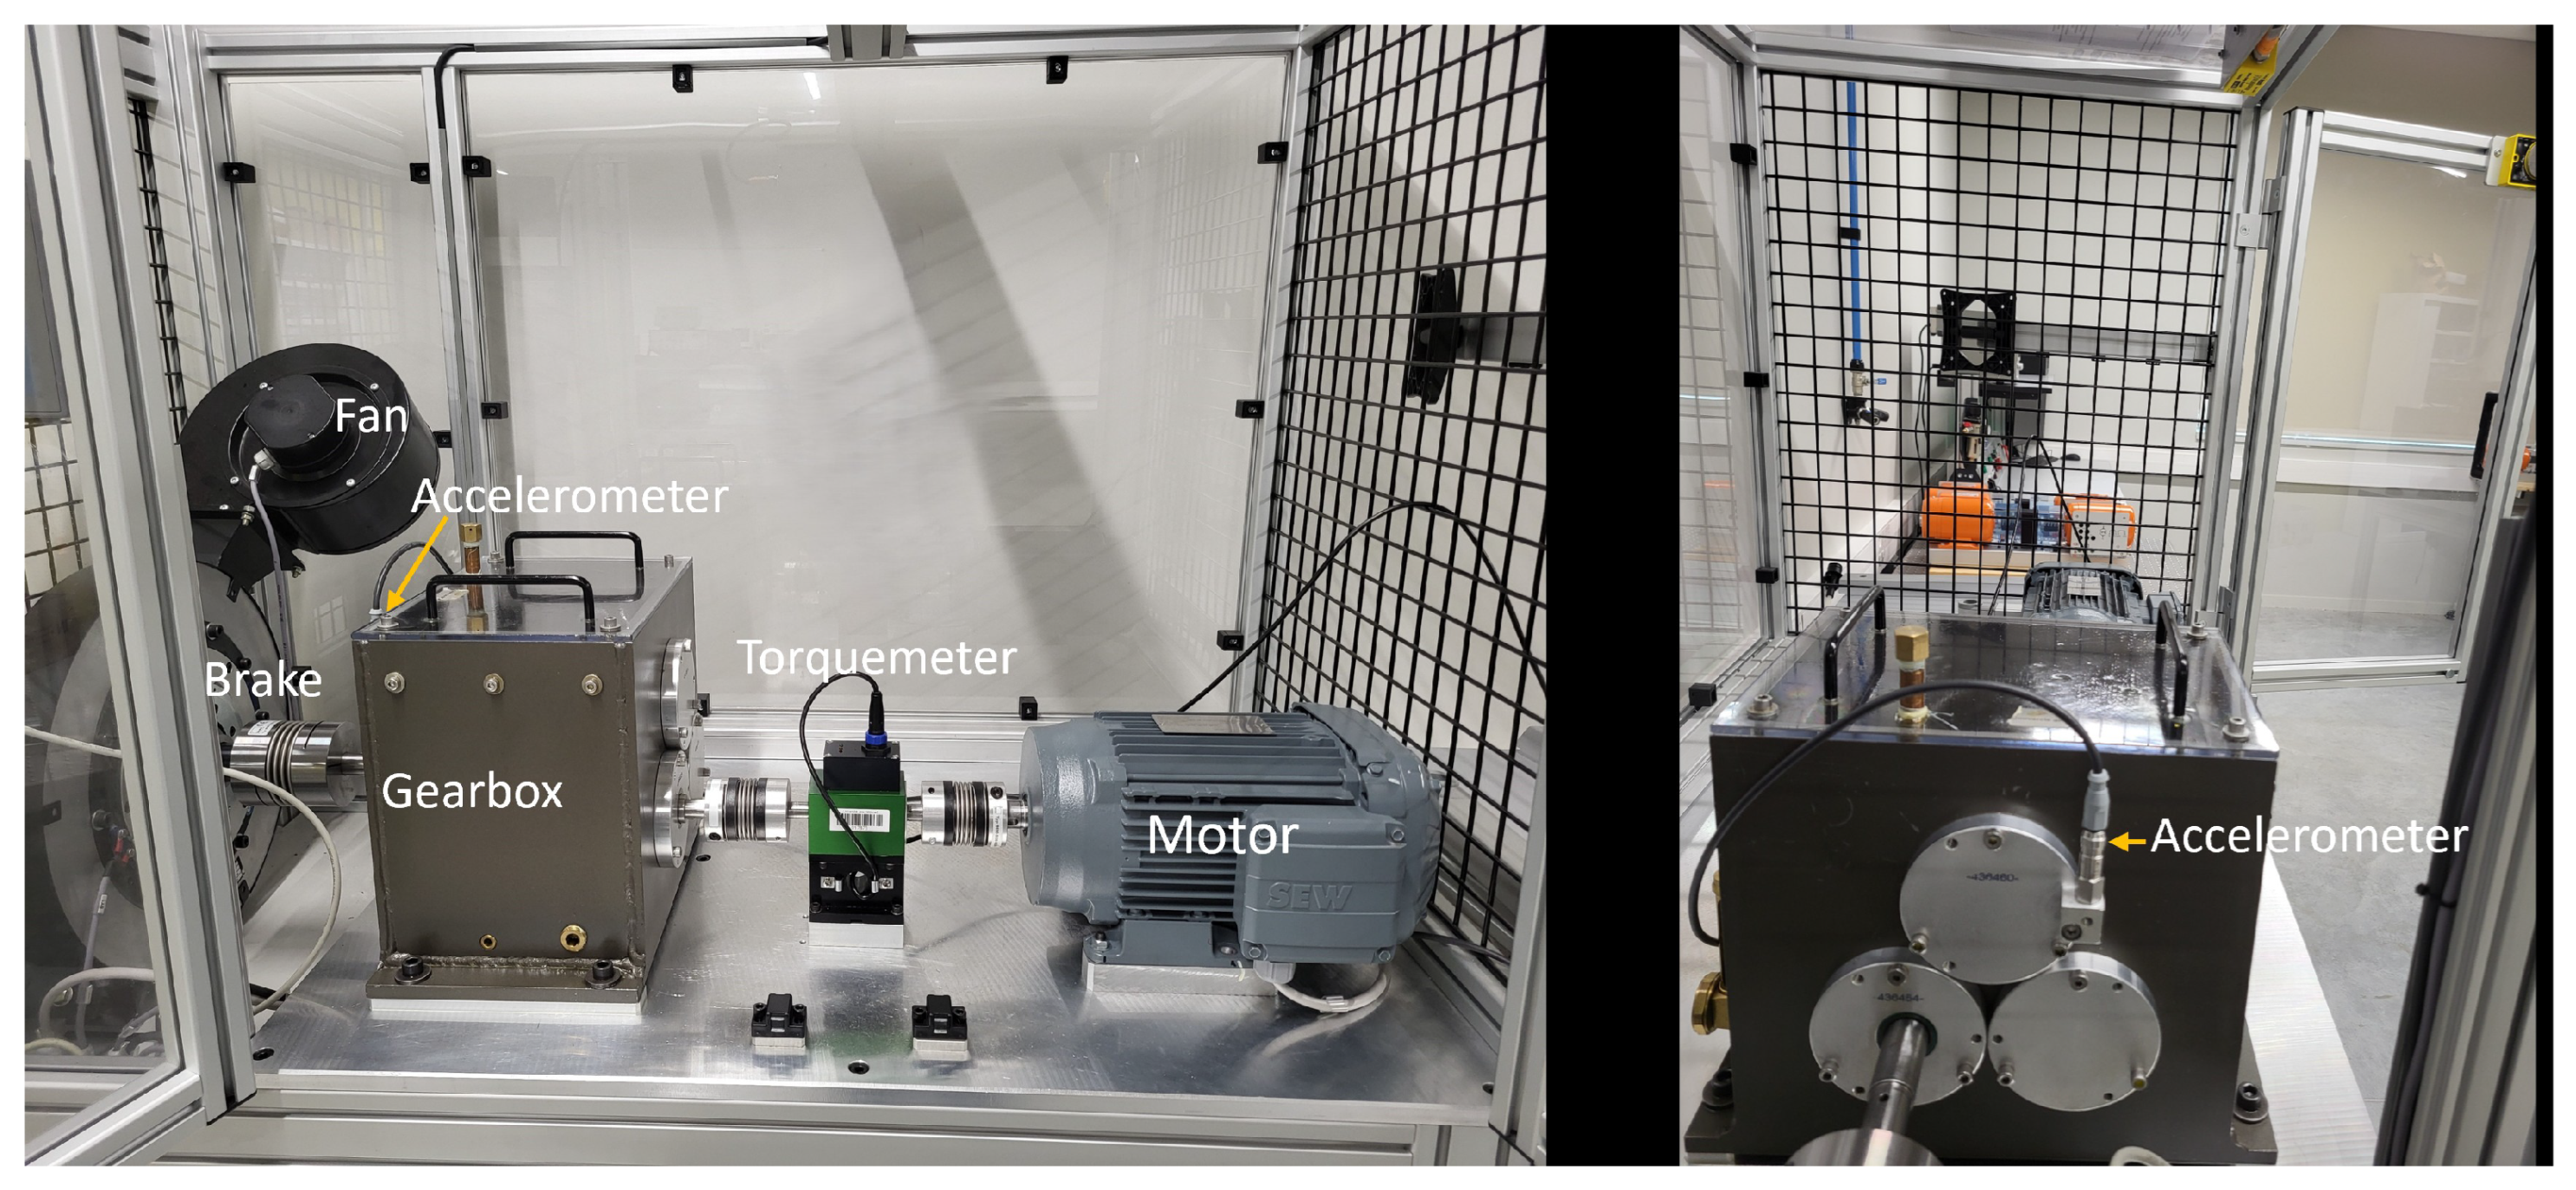
3.1. Experimental Setup
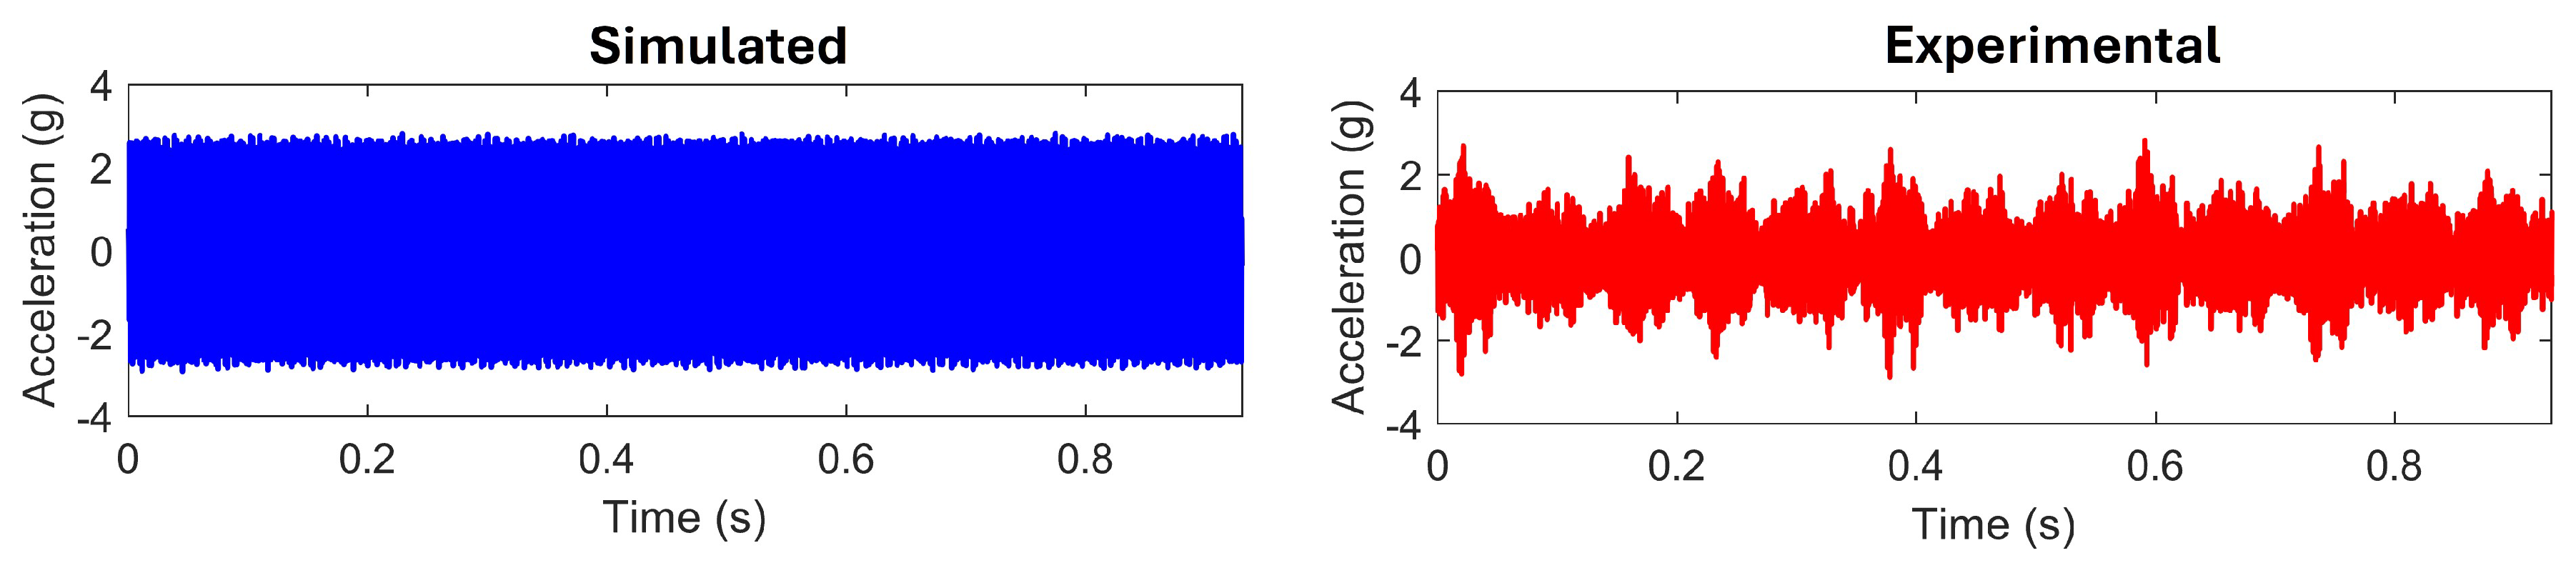
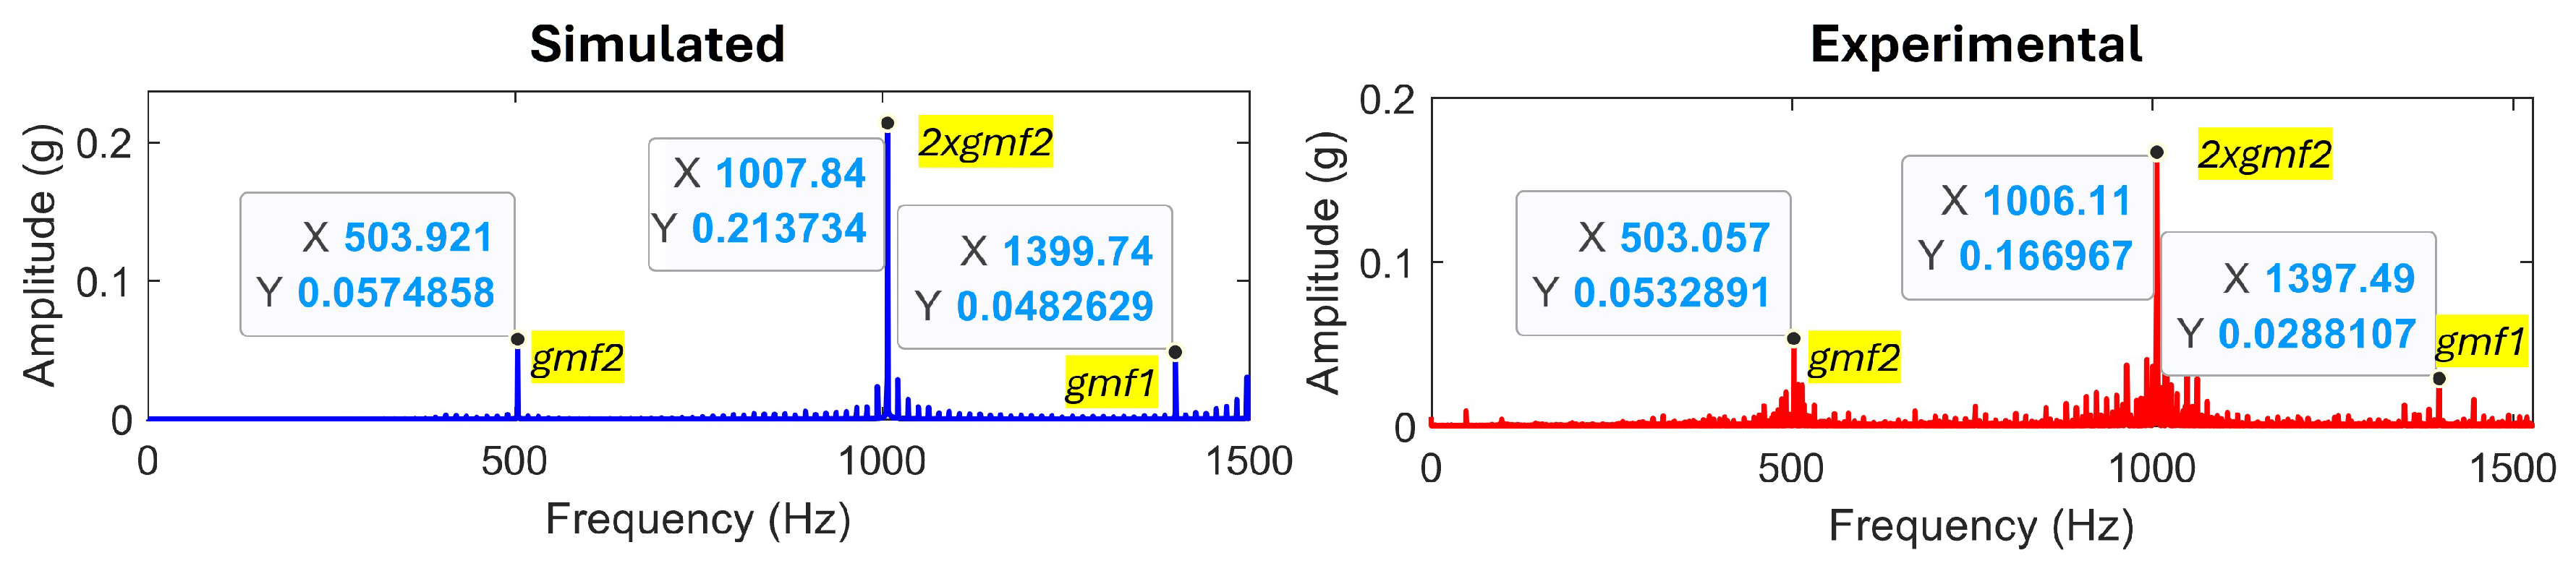
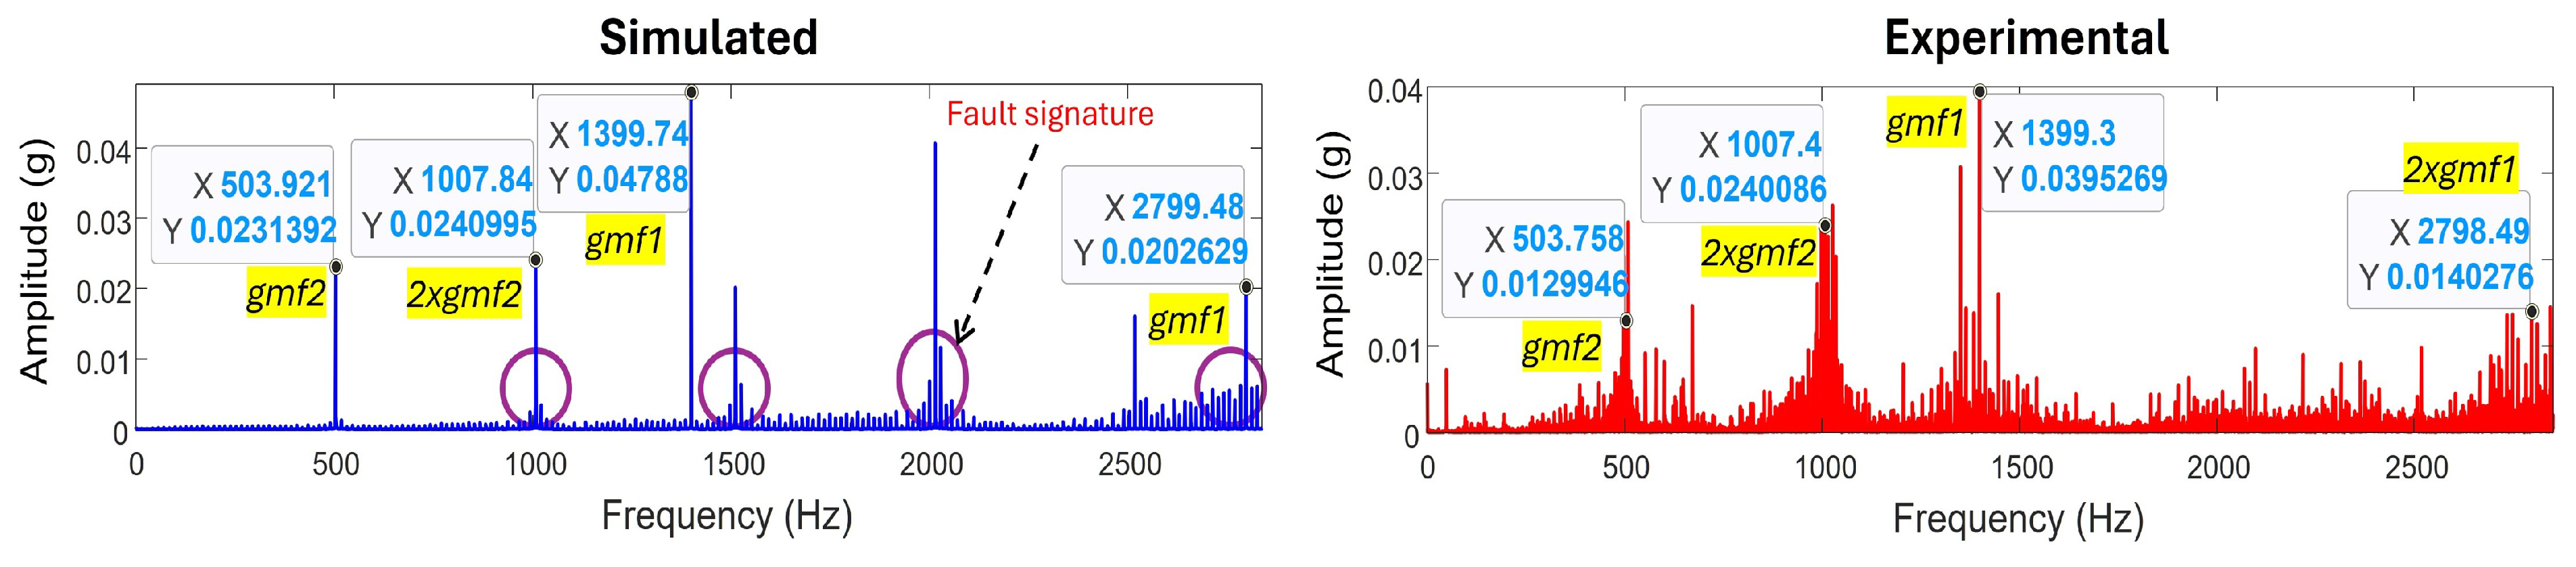
3.2. Approach Validation Under Healthy Conditions
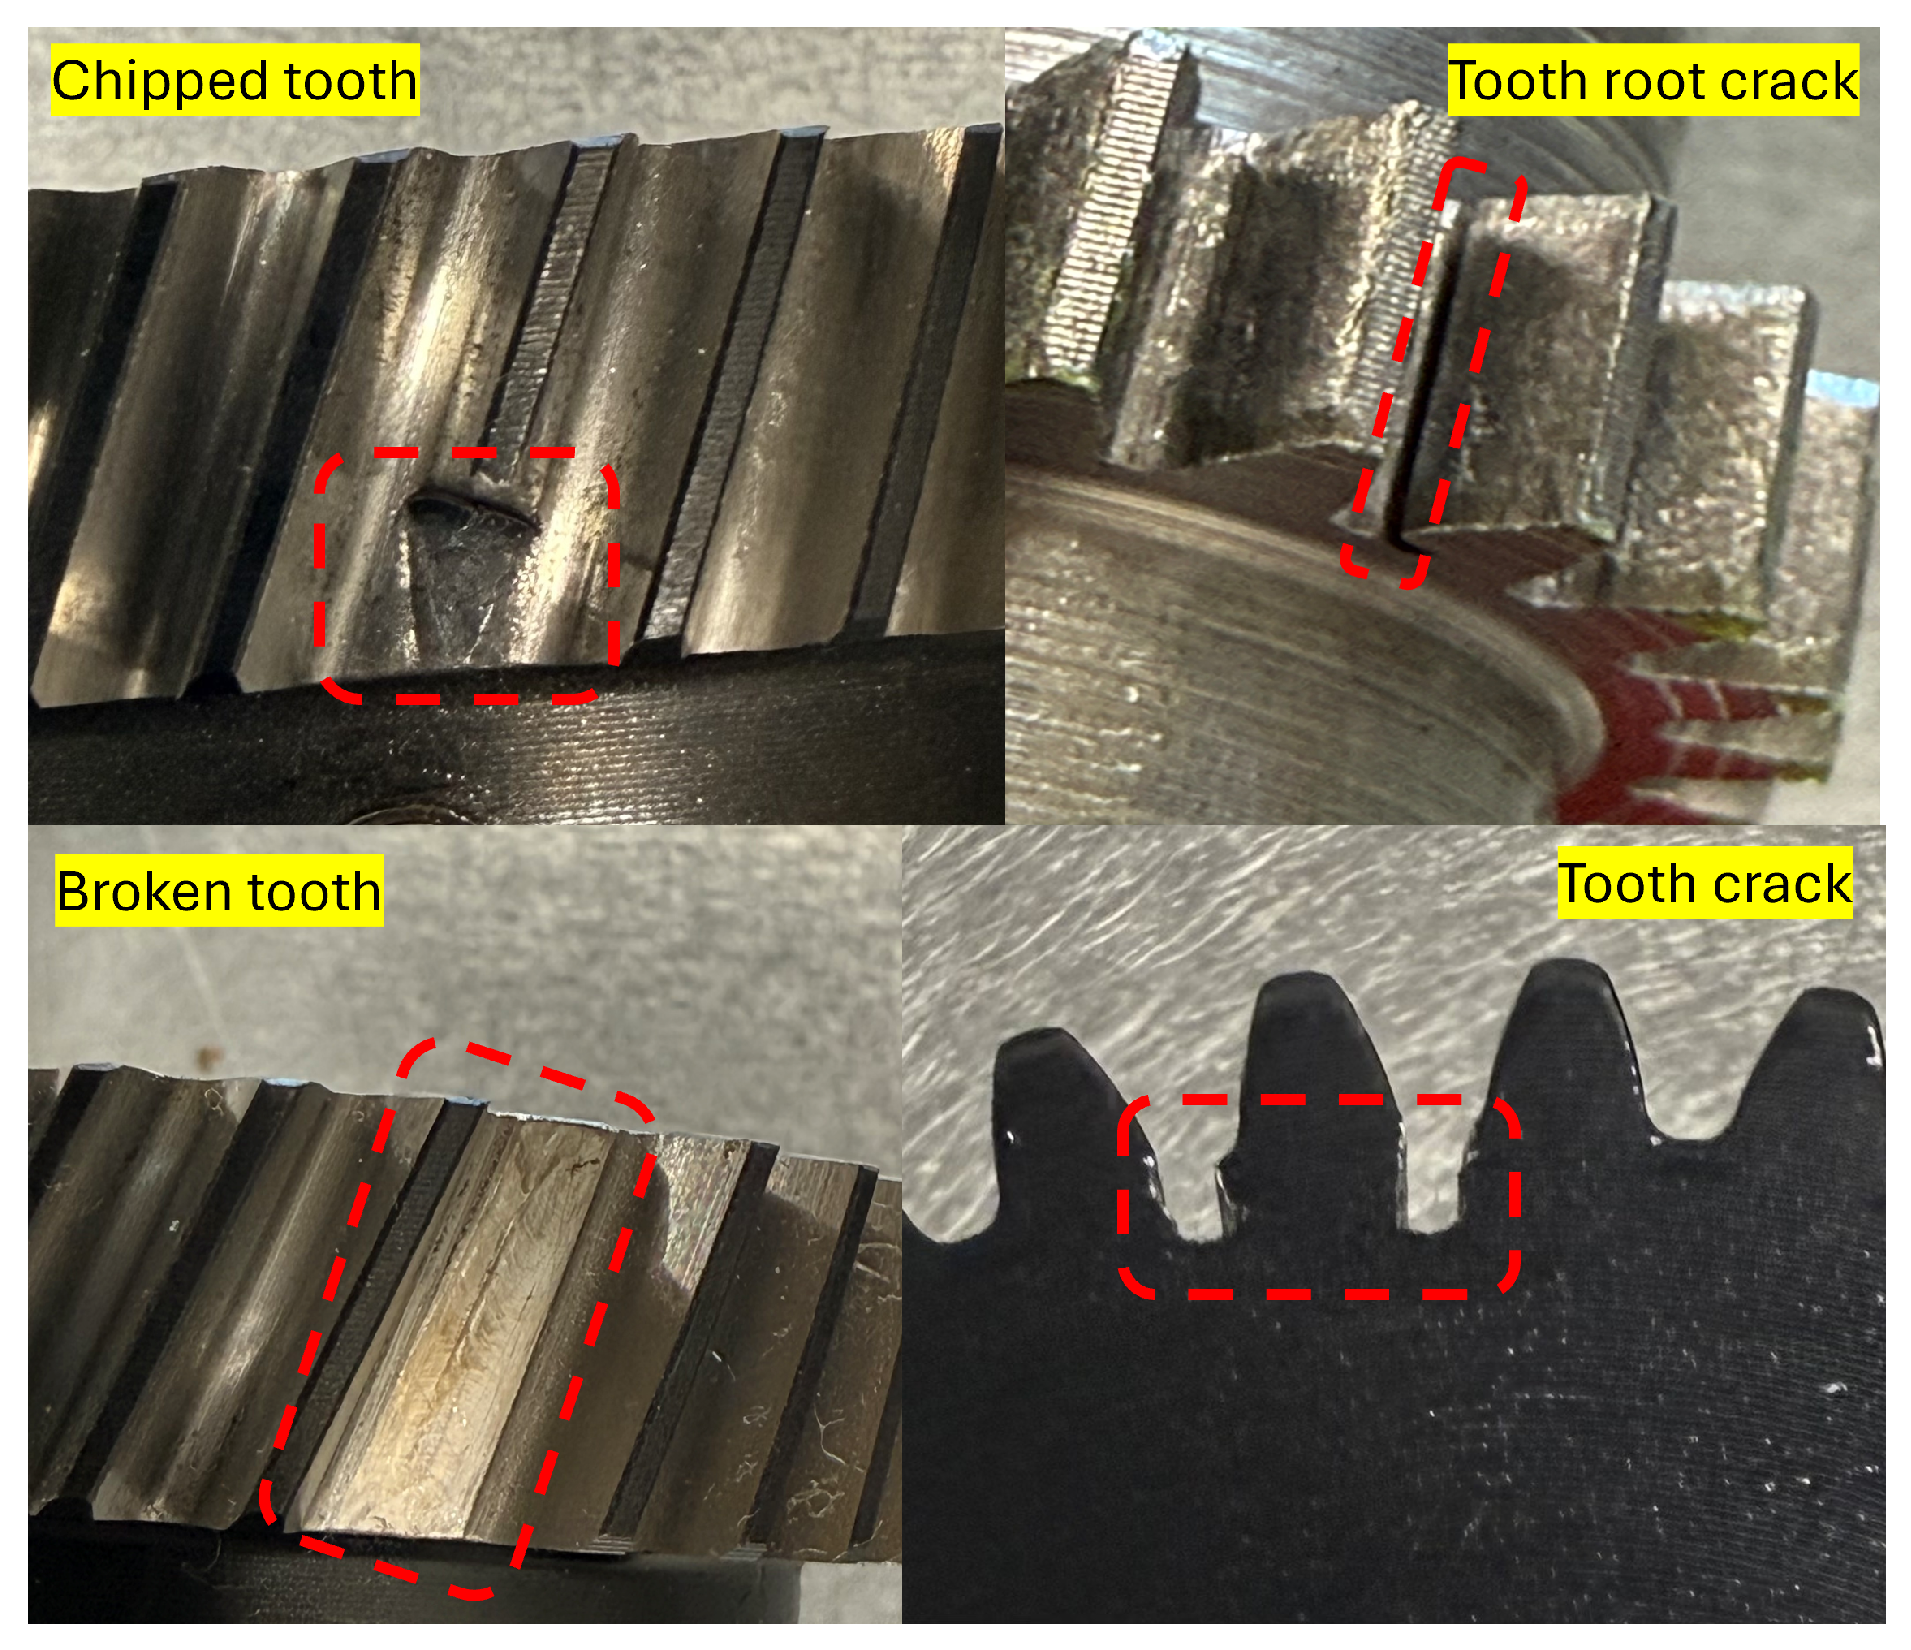
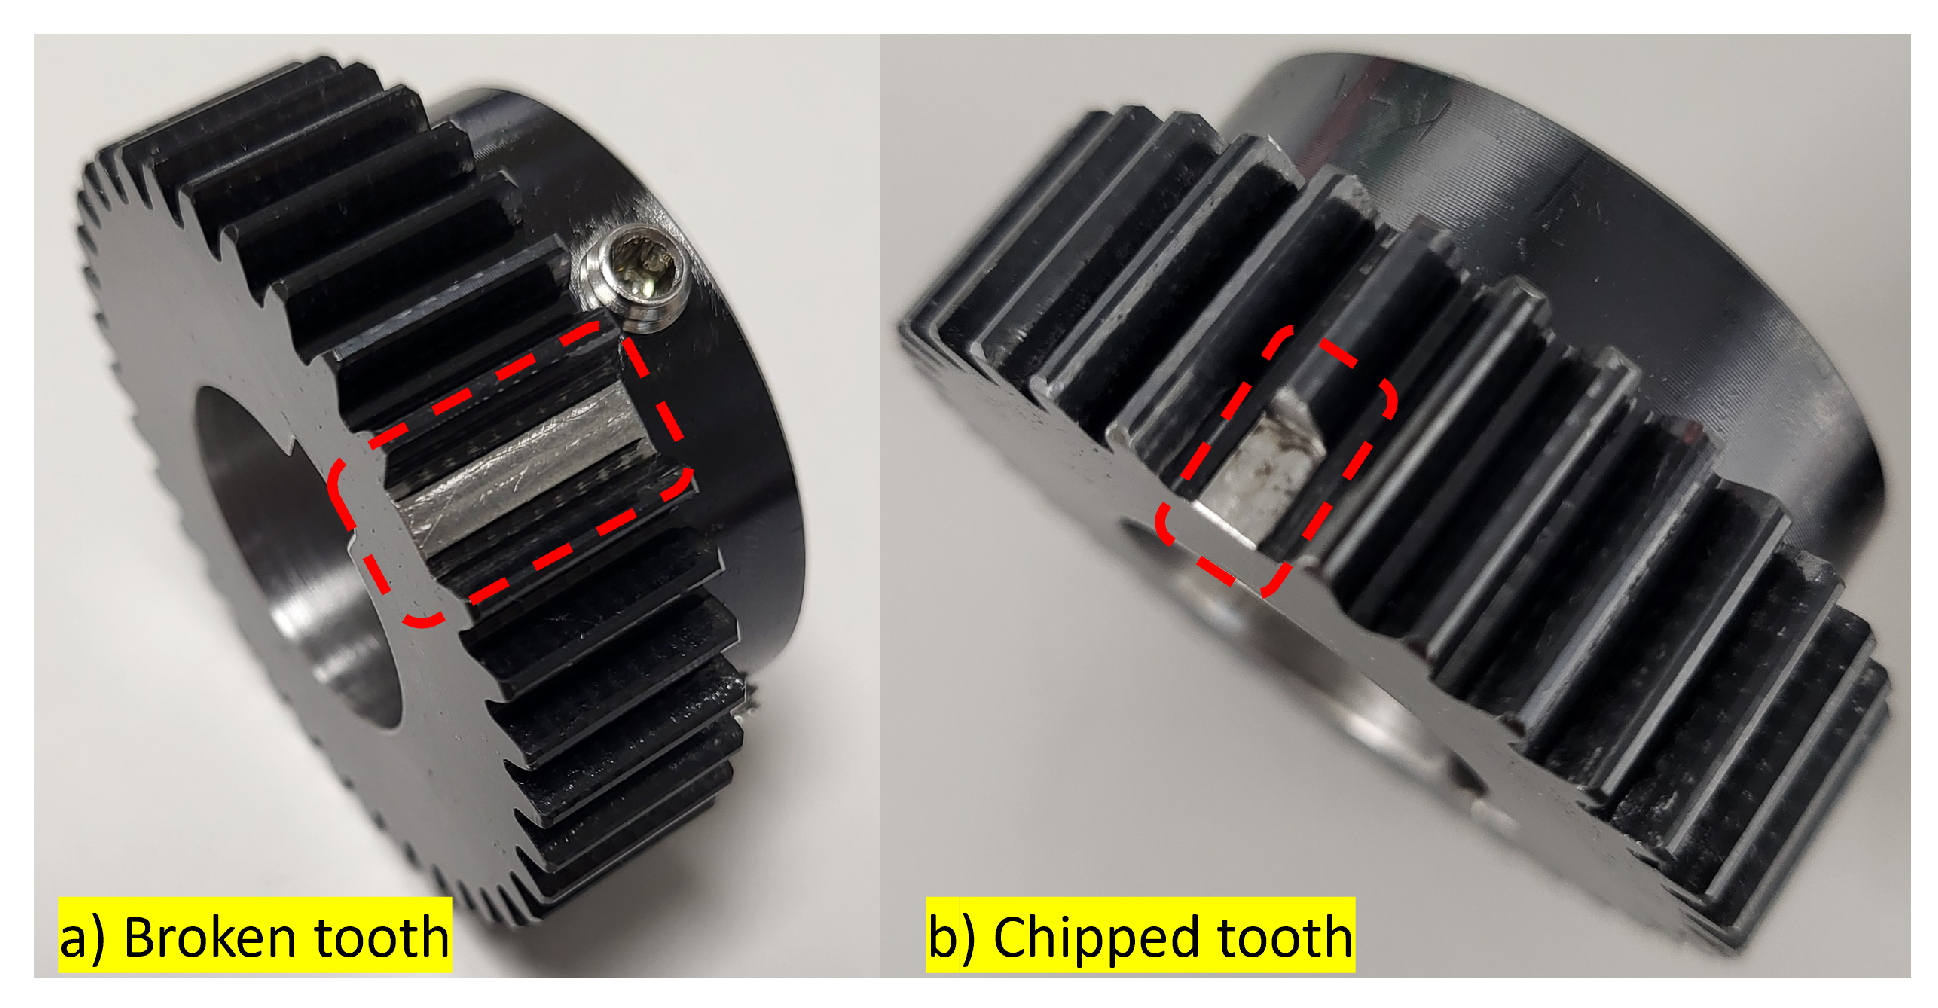
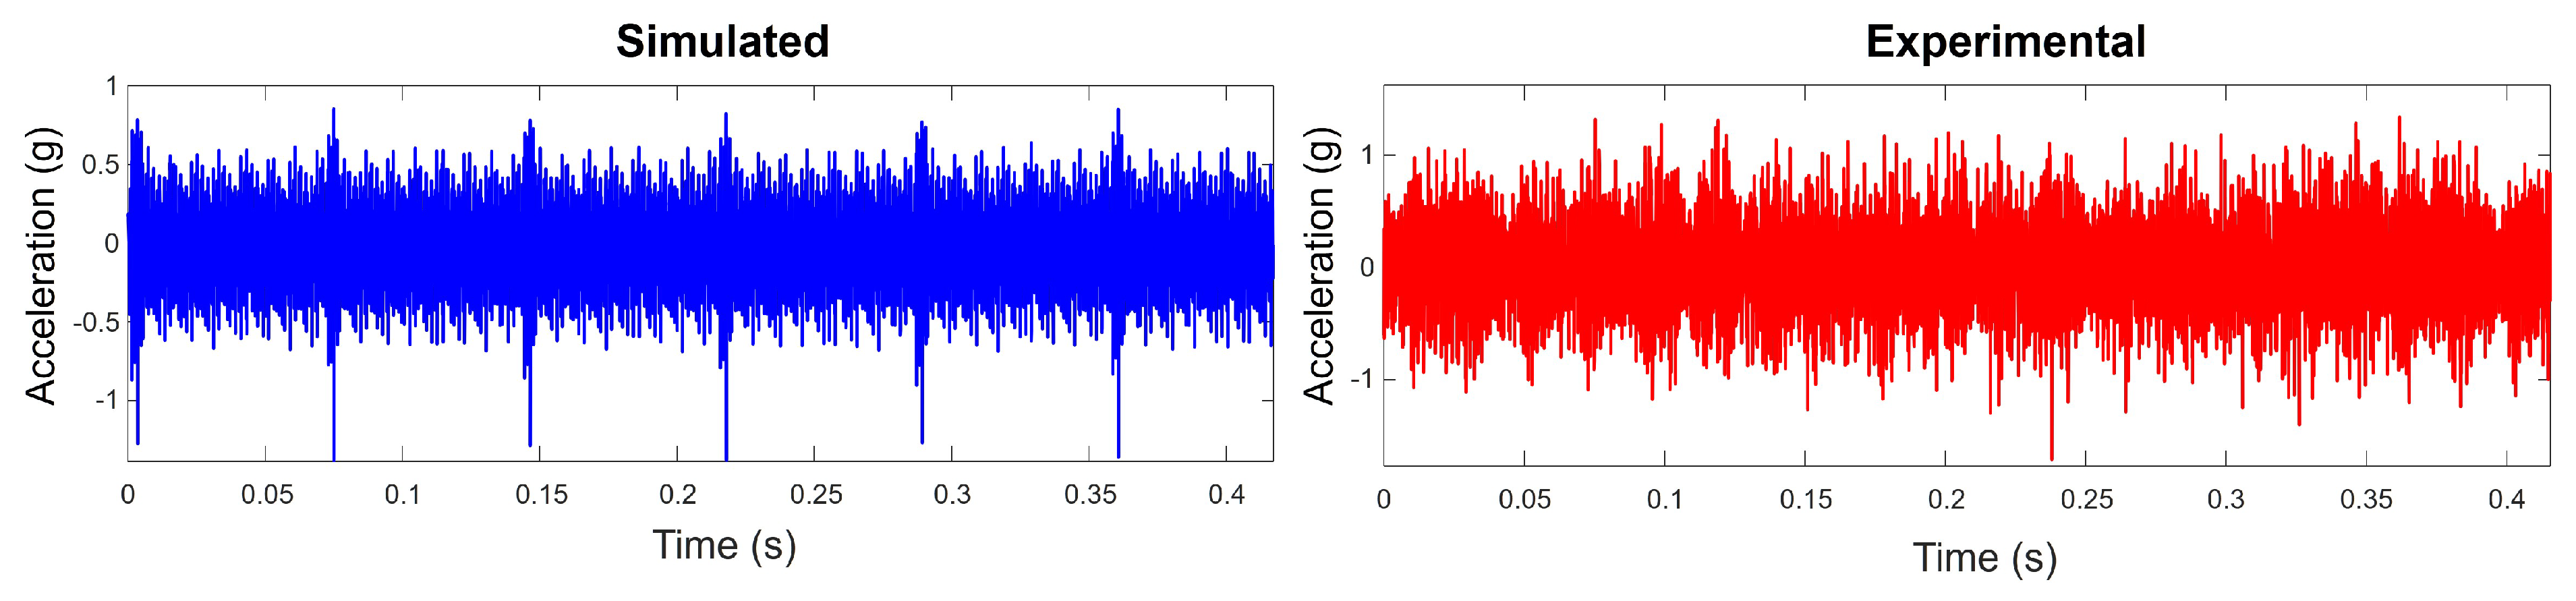
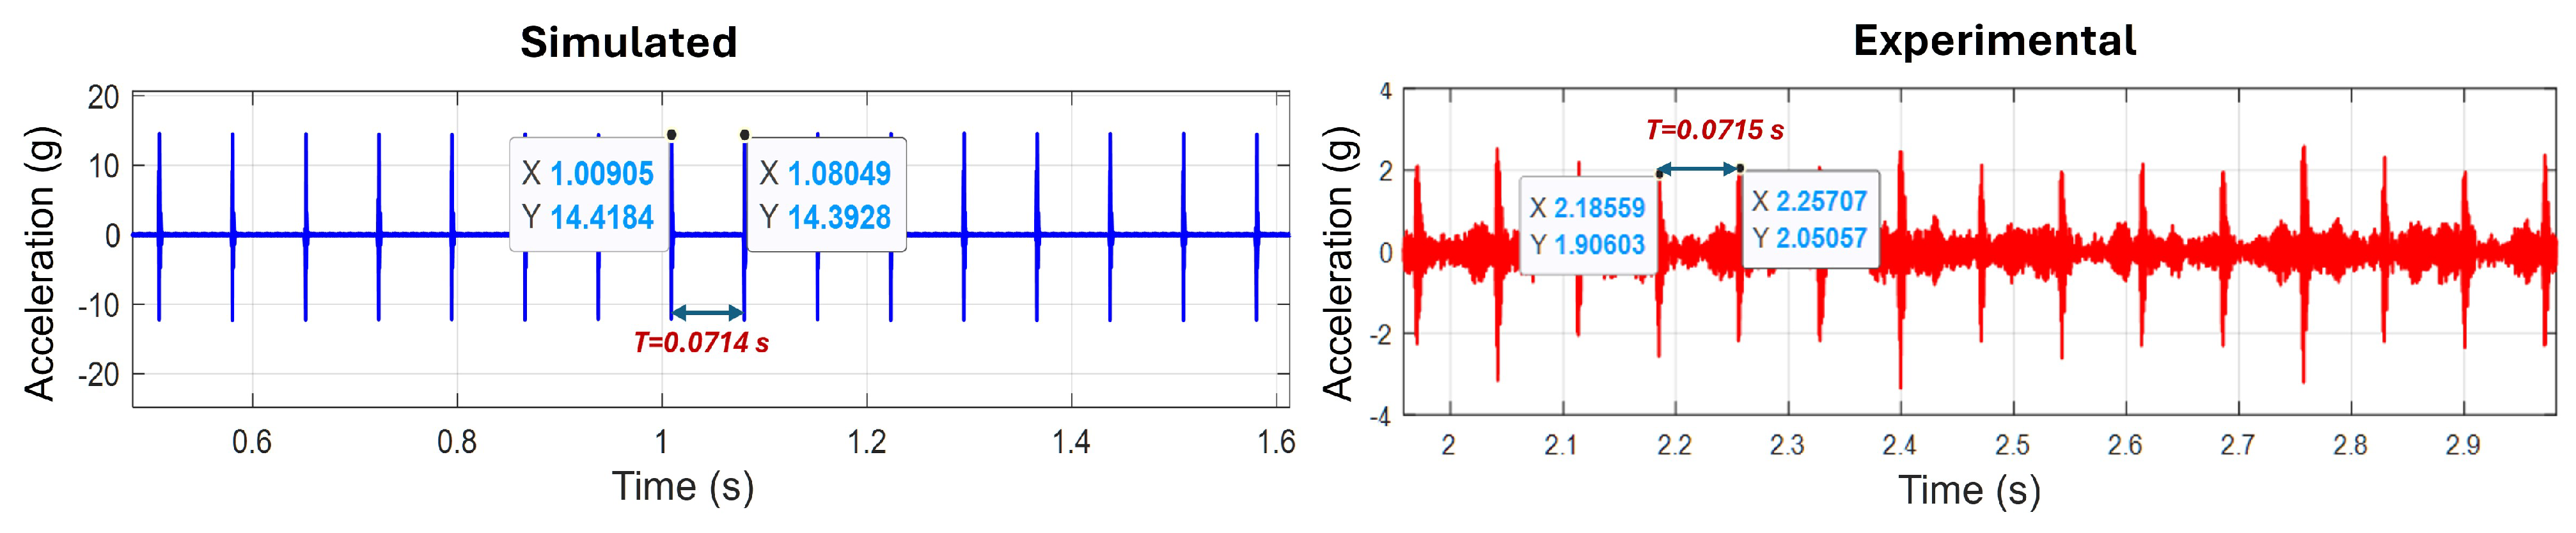
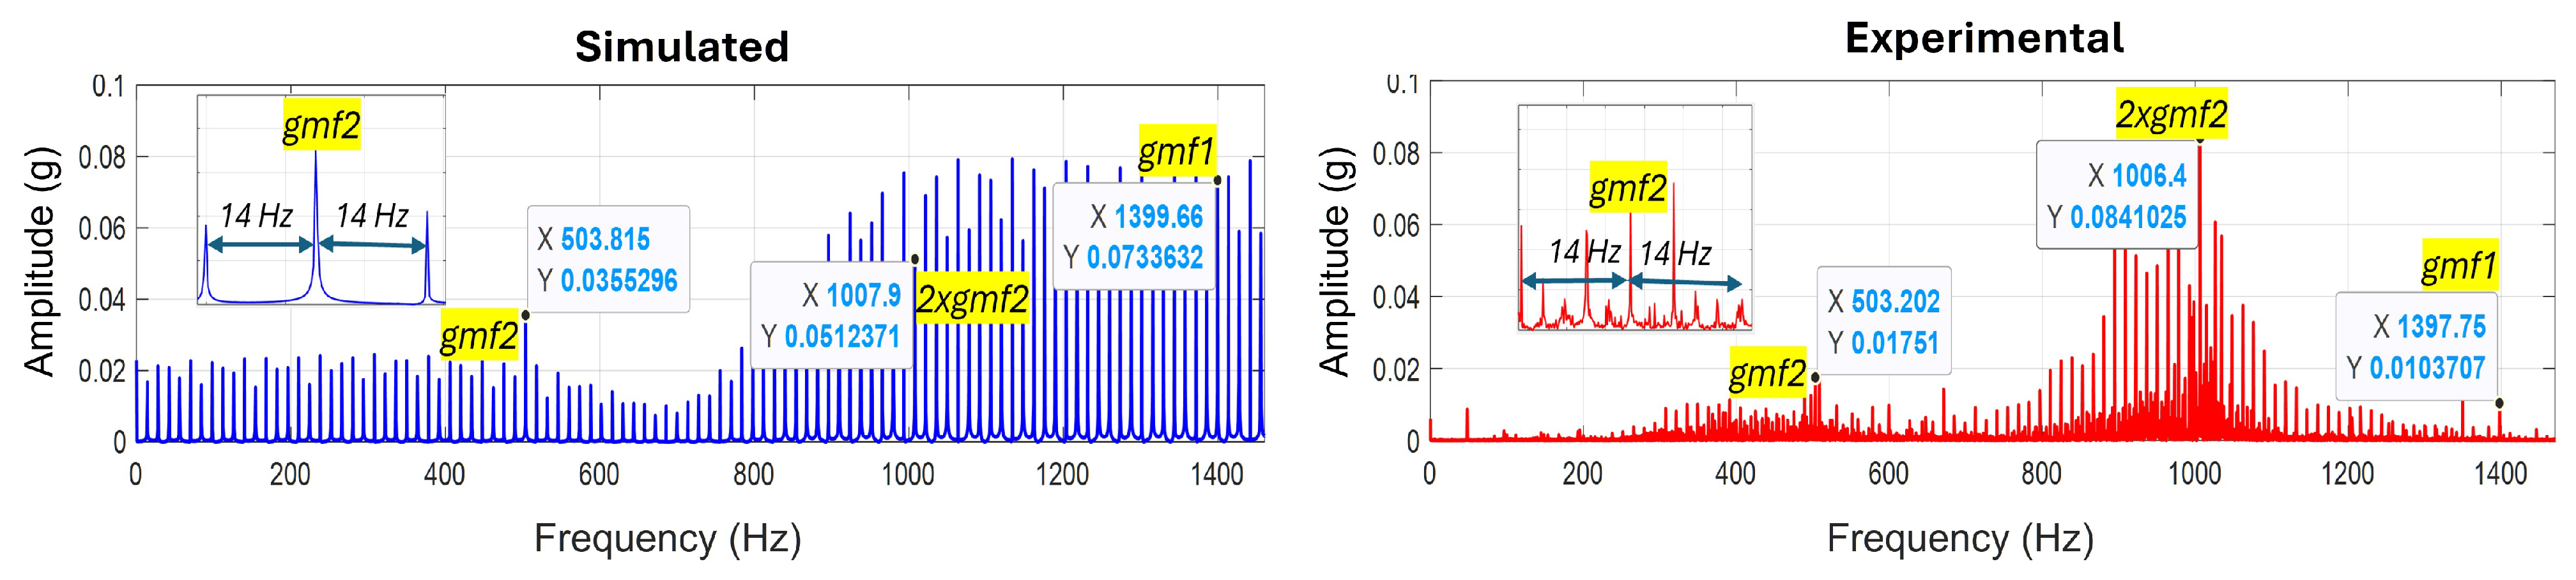
3.3. Approach Validation Under Faulty Conditions
3.3.1. Chipped Gear Fault
3.3.2. Broken Tooth Gear Fault
3.4. General Discussion
- 1.
- Conducting modal analysis to develop transfer functions that account for vibration transmission paths from gear teeth to sensors through various gearbox components, including shafts and housing structures.
- 2.
- Implementing systematic calibration protocols to develop high-fidelity digital twins capable of accurately simulating a diverse range of gear fault scenarios under industrial conditions.
- 3.
- Expanding the investigation to include other fault morphologies, particularly initiated root cracks and progressive wear patterns, to enhance diagnostic capabilities.
- 4.
- Integrating additional factors such as friction, lubrication, and tool wear effects into the simulation framework to improve its industrial applicability.
4. Conclusions
Author Contributions
Funding
Data Availability Statement
Conflicts of Interest
Abbreviations
| TVMS | Time-Varying Mesh Stiffness |
| FEM | Finite Element Method |
| FE | finite element |
| R-FEM | Refined Finite Element Method |
| C-FEM | Conventional Finite Element Method |
| CBM | condition-based monitoring |
| DOFs | degrees of freedom |
| RP | reference point |
| 3D | three-dimensional |
| EMP | electromagnetic particle |
| GWMA | Gaussian Weighted Moving Average |
| GMF | gear mesh frequency |
References
- Liang, X.; Zuo, M.J.; Feng, Z. Dynamic modeling of gearbox faults: A review. Mech. Syst. Signal Process. 2018, 98, 852–876. [Google Scholar] [CrossRef]
- Mohammed, O.D.; Rantatalo, M.; Aidanpää, J.O.; Kumar, U. Vibration signal analysis for gear fault diagnosis with various crack progression scenarios. Mech. Syst. Signal Process. 2013, 41, 176–195. [Google Scholar] [CrossRef]
- Lei, Y.; Lin, J.; Zuo, M.J.; He, Z. Condition monitoring and fault diagnosis of planetary gearboxes: A review. Measurement 2014, 48, 292–305. [Google Scholar] [CrossRef]
- Salameh, J.P.; Cauet, S.; Etien, E.; Sakout, A.; Rambault, L. Gearbox condition monitoring in wind turbines: A review. Mech. Syst. Signal Process. 2018, 111, 251–264. [Google Scholar] [CrossRef]
- Qurthobi, A.; Maskeliūnas, R.; Damaševičius, R. Detection of mechanical failures in industrial machines using overlapping acoustic anomalies: A systematic literature review. Sensors 2022, 22, 3888. [Google Scholar] [CrossRef]
- Li, W.; Zhai, P.; Tian, J.; Luo, B. Thermal analysis of helical gear transmission system considering machining and installation error. Int. J. Mech. Sci. 2018, 149, 1–17. [Google Scholar] [CrossRef]
- Chaari, F.; Fakhfakh, T.; Haddar, M. Analytical modelling of spur gear tooth crack and influence on gearmesh stiffness. Eur. J. Mech.-A/Solids 2009, 28, 461–468. [Google Scholar] [CrossRef]
- Wang, S.; Zhu, R. An improved mesh stiffness calculation model for cracked helical gear pair with spatial crack propagation path. Mech. Syst. Signal Process. 2022, 172, 108989. [Google Scholar] [CrossRef]
- El Yousfi, B.; Soualhi, A.; Medjaher, K.; Guillet, F. New approach for gear mesh stiffness evaluation of spur gears with surface defects. Eng. Fail. Anal. 2020, 116, 104740. [Google Scholar] [CrossRef]
- Ma, H.; Zeng, J.; Feng, R.; Pang, X.; Wang, Q.; Wen, B. Review on dynamics of cracked gear systems. Eng. Fail. Anal. 2015, 55, 224–245. [Google Scholar] [CrossRef]
- Ma, H.; Pang, X.; Zeng, J.; Wang, Q.; Wen, B. Effects of gear crack propagation paths on vibration responses of the perforated gear system. Mech. Syst. Signal Process. 2015, 62, 113–128. [Google Scholar] [CrossRef]
- Shen, Z.; Qiao, B.; Yang, L.; Luo, W.; Chen, X. Evaluating the influence of tooth surface wear on TVMS of planetary gear set. Mech. Mach. Theory 2019, 136, 206–223. [Google Scholar] [CrossRef]
- Saxena, A.; Parey, A.; Chouksey, M. Effect of shaft misalignment and friction force on time varying mesh stiffness of spur gear pair. Eng. Fail. Anal. 2015, 49, 79–91. [Google Scholar] [CrossRef]
- Luo, Y.; Baddour, N.; Liang, M. Effects of gear center distance variation on time varying mesh stiffness of a spur gear pair. Eng. Fail. Anal. 2017, 75, 37–53. [Google Scholar] [CrossRef]
- Wang, Q.; Zhao, B.; Fu, Y.; Kong, X.; Ma, H. An improved time-varying mesh stiffness model for helical gear pairs considering axial mesh force component. Mech. Syst. Signal Process. 2018, 106, 413–429. [Google Scholar] [CrossRef]
- Ma, H.; Pang, X.; Feng, R.; Zeng, J.; Wen, B. Improved time-varying mesh stiffness model of cracked spur gears. Eng. Fail. Anal. 2015, 55, 271–287. [Google Scholar] [CrossRef]
- Wang, J.; Yang, J.; Lin, Y.; He, Y. Analytical investigation of profile shifts on the mesh stiffness and dynamic characteristics of spur gears. Mech. Mach. Theory 2022, 167, 104529. [Google Scholar] [CrossRef]
- Li, Z.; Zhang, J.; Song, H.; Zhu, R.; Ma, H. Time-varying mesh stiffness calculation of spiral bevel gear with spalling defect. Mech. Mach. Theory 2024, 193, 105571. [Google Scholar] [CrossRef]
- Li, Y.; Li, G.; Wang, Z.; Mayfield, W. On gear time-varying meshing stiffness calculation considering indexing feeds and processing characteristics of gear shaping processing. Precis. Eng. 2024, 91, 418–432. [Google Scholar] [CrossRef]
- Yu, Y.; Shi, J.; Shen, C.; Luo, Y.; Wang, T.; Zhu, Z. Dynamic modelling of gearbox with multiple localized defects and its coupled vibration analysis. Mech. Syst. Signal Process. 2022, 180, 109469. [Google Scholar] [CrossRef]
- Huangfu, Y.; Chen, K.; Ma, H.; Li, X.; Han, H.; Zhao, Z. Meshing and dynamic characteristics analysis of spalled gear systems: A theoretical and experimental study. Mech. Syst. Signal Process. 2020, 139, 106640. [Google Scholar] [CrossRef]
- El Yousfi, B.; Soualhi, A.; Medjaher, K.; Guillet, F. Electromechanical modeling of a motor–gearbox system for local gear tooth faults detection. Mech. Syst. Signal Process. 2022, 166, 108435. [Google Scholar] [CrossRef]
- Mahapatra, S.; Mohanty, A.R. Improved Time-Varying Tooth Stiffness Calculation in Cracked Spur Gear Using Modified Limiting Line. J. Vib. Eng. Technol. 2024, 12, 8311–8336. [Google Scholar] [CrossRef]
- Li, H.; Tang, J.; Chen, S.; Ding, H.; Sun, Z.; Rong, K. Analytical calculation of mesh stiffness for spiral bevel gears with an improved global tooth deformation model. Mech. Mach. Theory 2024, 191, 105492. [Google Scholar] [CrossRef]
- Zeng, Y.; Zhu, J.; Han, Y.; Qiu, D.; Huang, W.; Xu, M. Dynamic Modeling and Numerical Analysis of Gear Transmission System with Localized Defects. Machines 2025, 13, 272. [Google Scholar] [CrossRef]
- Kumar, R.; Roy, S.K. Mathematical modeling for detecting variable gear tooth cracks in a windturbine gearbox operating under a ramp-up wind speed. Eng. Res. Express 2025, 7, 015545. [Google Scholar] [CrossRef]
- Yang, S.; Tan, J.; Zhu, C.; Liu, Y.; Zhou, Y.; Li, C.; Liao, B. Dynamic modeling and analysis of wind turbine gear-bearing coupling system considering tooth root crack and slicing coupling effect. Proc. Inst. Mech. Eng. Part C JOurnal Mech. Eng. Sci. 2025, 239, 2791–2808. [Google Scholar] [CrossRef]
- Moghadam, F.K.; Rebouças, G.F.d.S.; Nejad, A.R. Digital twin modeling for predictive maintenance of gearboxes in floating offshore wind turbine drivetrains. Forsch. Ingenieurwesen 2021, 85, 273–286. [Google Scholar] [CrossRef]
- Lu, Q.; Huang, X.; Wu, G.; Shen, X.; Zhu, D. Digital Twin-Driven Water-wave Information Transmission and Recurrent Acceleration Network for Remaining Useful Life Prediction of Gear Box. Eng. Res. Express 2025, 7, 025202. [Google Scholar] [CrossRef]
- Habbouche, H.; Amirat, Y.; Benkedjouh, T.; Benbouzid, M. Digital twin-based gearbox fault diagnosis using variational mode decomposition and dynamic vibration modeling. Measurement 2025, 246, 116669. [Google Scholar] [CrossRef]
- Feng, K.; Xiao, H.; Zhang, J.; Ni, Q. A digital twin methodology for vibration-based monitoring and prediction of gear wear. Wear 2025, 205806. [Google Scholar] [CrossRef]
- Xu, T.; Zhang, X.; Sun, W.; Wang, B. Intelligent Operation and Maintenance of Wind Turbines Gearboxes via Digital Twin and Multi-Source Data Fusion. Sensors 2025, 25, 1972. [Google Scholar] [CrossRef] [PubMed]
- Verma, J.G.; Kumar, S.; Kankar, P.K. Crack growth modeling in spur gear tooth and its effect on mesh stiffness using extended finite element method. Eng. Fail. Anal. 2018, 94, 109–120. [Google Scholar] [CrossRef]
- Marafona, J.D.; Marques, P.M.; Martins, R.C.; Seabra, J.H. Mesh stiffness models for cylindrical gears: A detailed review. Mech. Mach. Theory 2021, 166, 104472. [Google Scholar] [CrossRef]
- El Yousfi, B.; Soualhi, A.; Medjaher, K.; Guillet, F. A New Analytical Method for Modeling the Effect of Assembly Errors on a Motor-Gearbox System. Energies 2021, 14, 4993. [Google Scholar] [CrossRef]
- Wan, Z.; Cao, H.; Zi, Y.; He, W.; Chen, Y. Mesh stiffness calculation using an accumulated integral potential energy method and dynamic analysis of helical gears. Mech. Mach. Theory 2015, 92, 447–463. [Google Scholar] [CrossRef]
- Sainsot and, P.; Velex, P.; Duverger, O. Contribution of gear body to tooth deflections—A new bidimensional analytical formula. J. Mech. Des. 2004, 126, 748–752. [Google Scholar] [CrossRef]
- Liang, X.; Zhang, H.; Zuo, M.J.; Qin, Y. Three new models for evaluation of standard involute spur gear mesh stiffness. Mech. Syst. Signal Process. 2018, 101, 424–434. [Google Scholar] [CrossRef]
- Howard, I.; Jia, S.; Wang, J. The dynamic modelling of a spur gear in mesh including friction and a crack. Mech. Syst. Signal Process. 2001, 15, 831–853. [Google Scholar] [CrossRef]
- Ma, H.; Pang, X.; Feng, R.; Wen, B. Evaluation of optimum profile modification curves of profile shifted spur gears based on vibration responses. Mech. Syst. Signal Process. 2016, 70, 1131–1149. [Google Scholar] [CrossRef]


| Parameter | Pinion | Gear |
|---|---|---|
| Number of teeth (Z) | 19 | 31 |
| Base circle radius (mm) | 28.3 | 46.2 |
| Module (mm) | 3.2 | |
| Pressure angle | 20° | |
| Face width (mm) | 38.1 | |
| Young’s modulus (MPa) | 2.068 × 10⁵ | |
| Poisson’s ratio | 0.3 | |
| Parameter | Pinion 1 | Gear 1 | Pinion 2 | Gear 2 |
|---|---|---|---|---|
| Number of teeth | 29 | 100 | 36 | 90 |
| Bore radius (mm) | 10 | 15 | 10 | 15 |
| Base circle radius (mm) | – | 70.4770 | – | 63.4293 |
| Face width (mm) | 15 | |||
| Modulus (mm) | 1.5 | |||
| Parameter | First Stage | Second Stage | Bearings | Motor |
|---|---|---|---|---|
| Pinion mass (kg) | 0.16 | 0.294 | – | – |
| Gear mass (kg) | 1.74 | 1.79 | – | – |
| Pinion inertia (kg·m2) | 4.76 × 10⁻⁵ | 1.21 × 10⁻⁴ | – | – |
| Gear inertia (kg·m2) | 4.82 × 10⁻³ | 3.89 × 10⁻³ | – | – |
| Motor inertia (kg·m2) | – | – | – | 6.63 × 10⁻³ |
| Bearing stiffness (N/m) | – | – | 6.56 × 10⁸ | – |
| Bearing damping (N·s/m) | – | – | 1.8 × 10³ | – |
| Young’s modulus (MPa) | 2.068 × 10⁵ | |||
| Poisson’s ratio | 0.3 | |||
Disclaimer/Publisher’s Note: The statements, opinions and data contained in all publications are solely those of the individual author(s) and contributor(s) and not of MDPI and/or the editor(s). MDPI and/or the editor(s) disclaim responsibility for any injury to people or property resulting from any ideas, methods, instructions or products referred to in the content. |
© 2025 by the authors. Licensee MDPI, Basel, Switzerland. This article is an open access article distributed under the terms and conditions of the Creative Commons Attribution (CC BY) license (https://creativecommons.org/licenses/by/4.0/).
Share and Cite
El Amli, A.; El Yousfi, B.; Soualhi, A.; Guillet, F. A Novel Hybrid FEM–Dynamic Modeling Approach for Enhanced Vibration Diagnostics in a Two-Stage Spur Gearbox. Energies 2025, 18, 2176. https://doi.org/10.3390/en18092176
El Amli A, El Yousfi B, Soualhi A, Guillet F. A Novel Hybrid FEM–Dynamic Modeling Approach for Enhanced Vibration Diagnostics in a Two-Stage Spur Gearbox. Energies. 2025; 18(9):2176. https://doi.org/10.3390/en18092176
Chicago/Turabian StyleEl Amli, Amine, Bilal El Yousfi, Abdenour Soualhi, and François Guillet. 2025. "A Novel Hybrid FEM–Dynamic Modeling Approach for Enhanced Vibration Diagnostics in a Two-Stage Spur Gearbox" Energies 18, no. 9: 2176. https://doi.org/10.3390/en18092176
APA StyleEl Amli, A., El Yousfi, B., Soualhi, A., & Guillet, F. (2025). A Novel Hybrid FEM–Dynamic Modeling Approach for Enhanced Vibration Diagnostics in a Two-Stage Spur Gearbox. Energies, 18(9), 2176. https://doi.org/10.3390/en18092176