


Molecular Simulation Study of Gas–Water Adsorption Behavior and Mobility Evaluation in Ultra-Deep, High-Pressure Fractured Tight Sandstone Reservoirs


 ,
, 
Abstract
1. Introduction
2. Methods
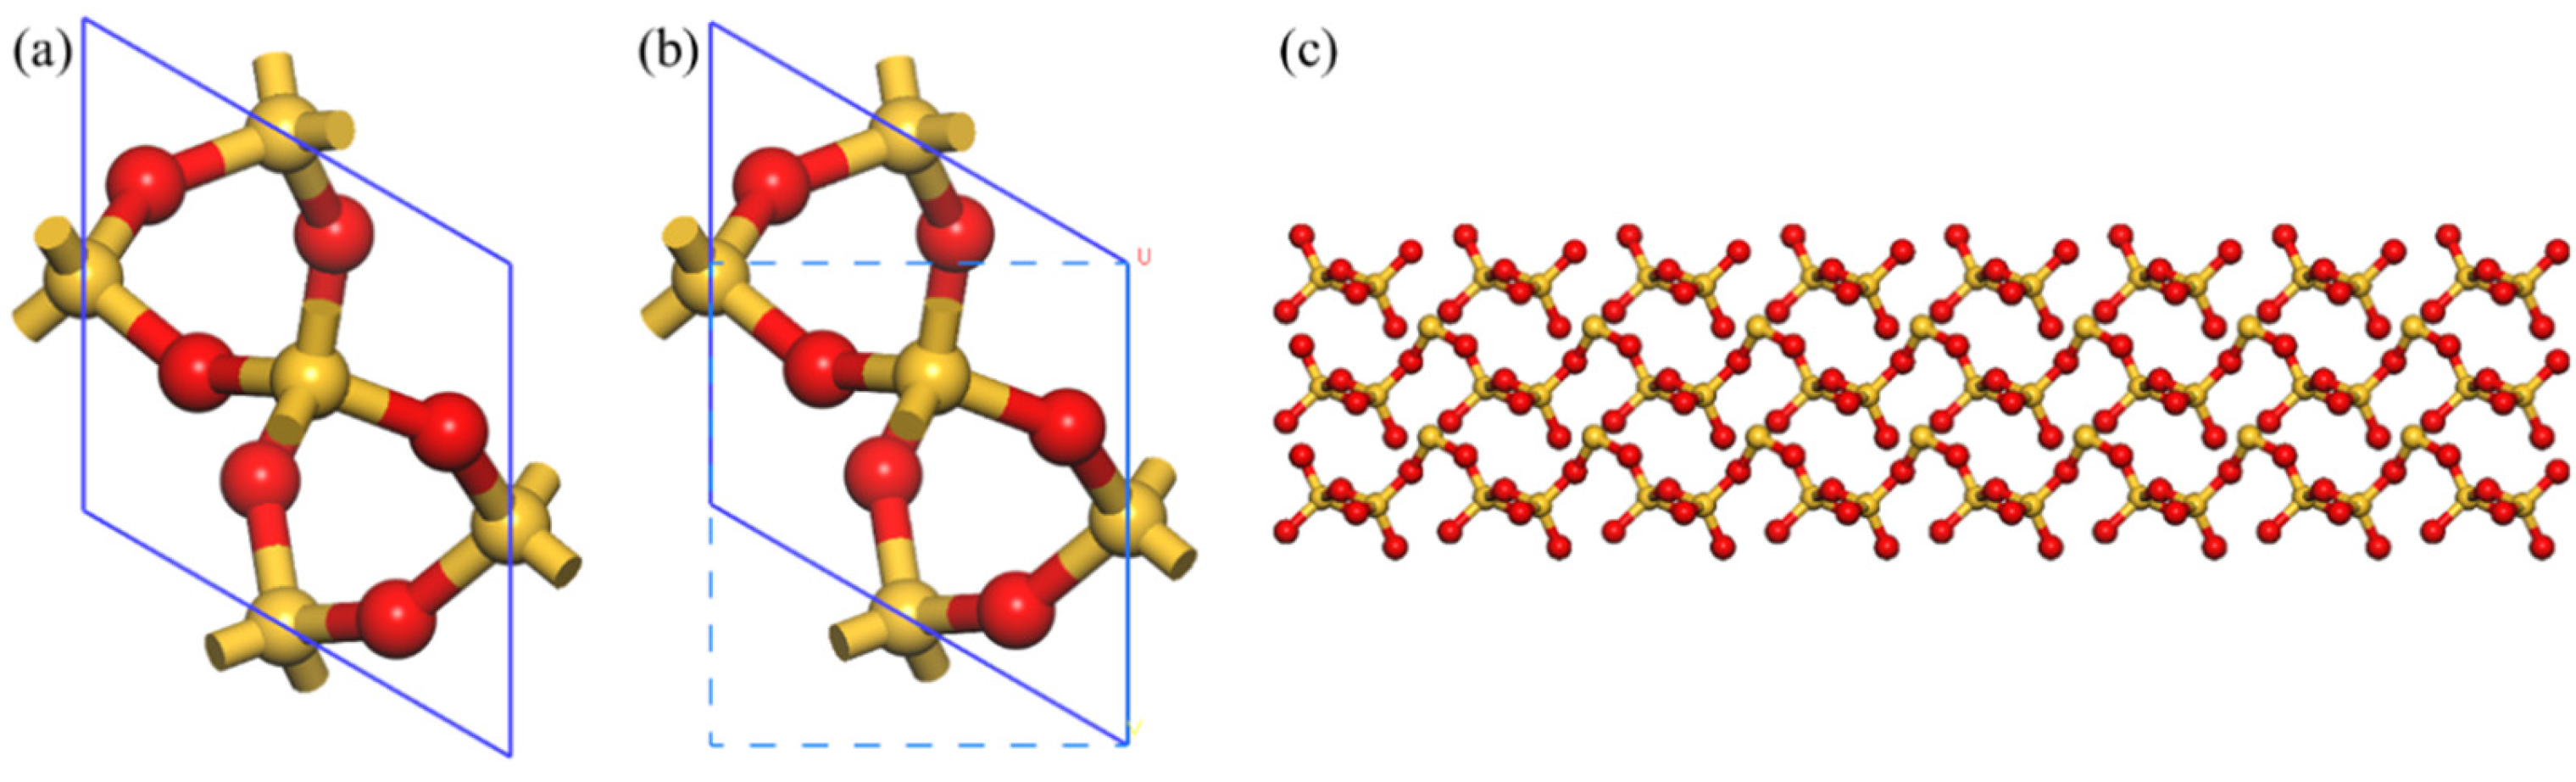
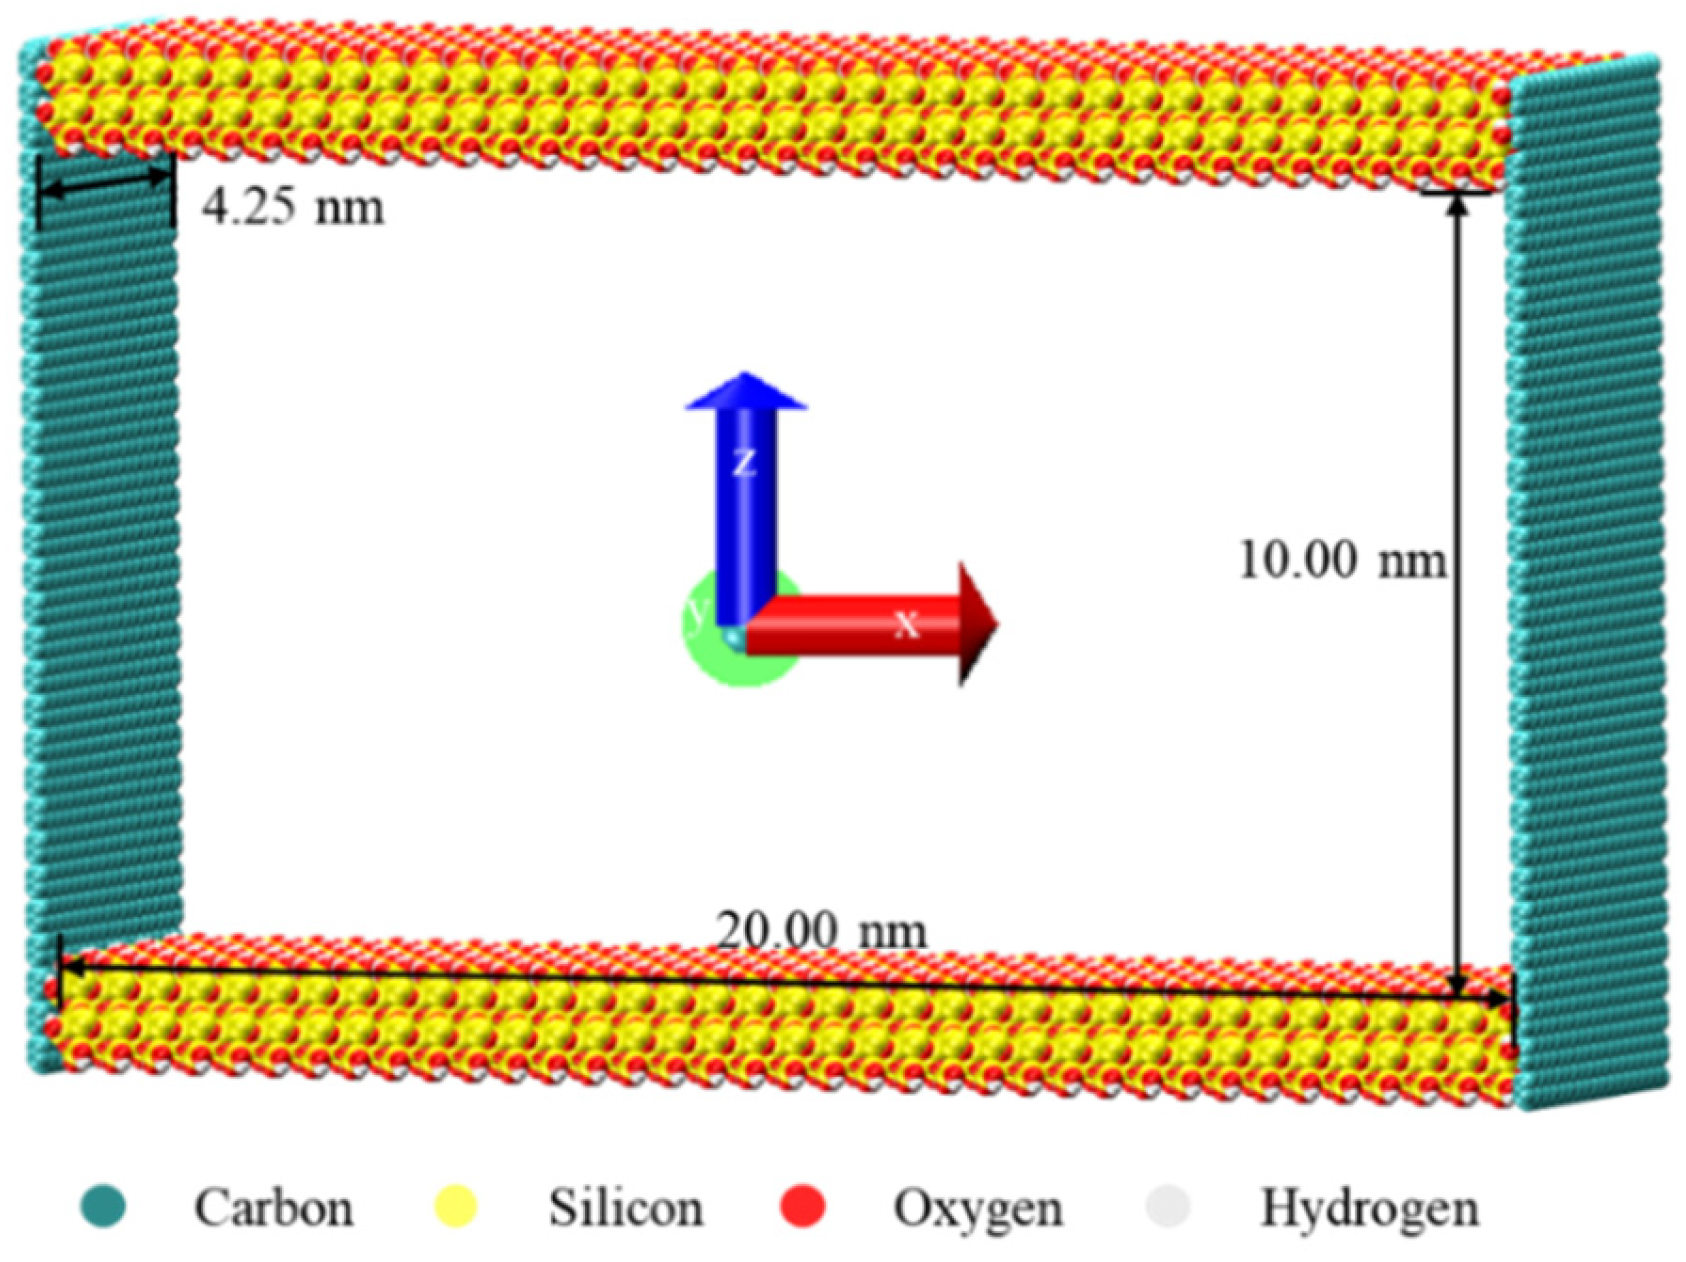
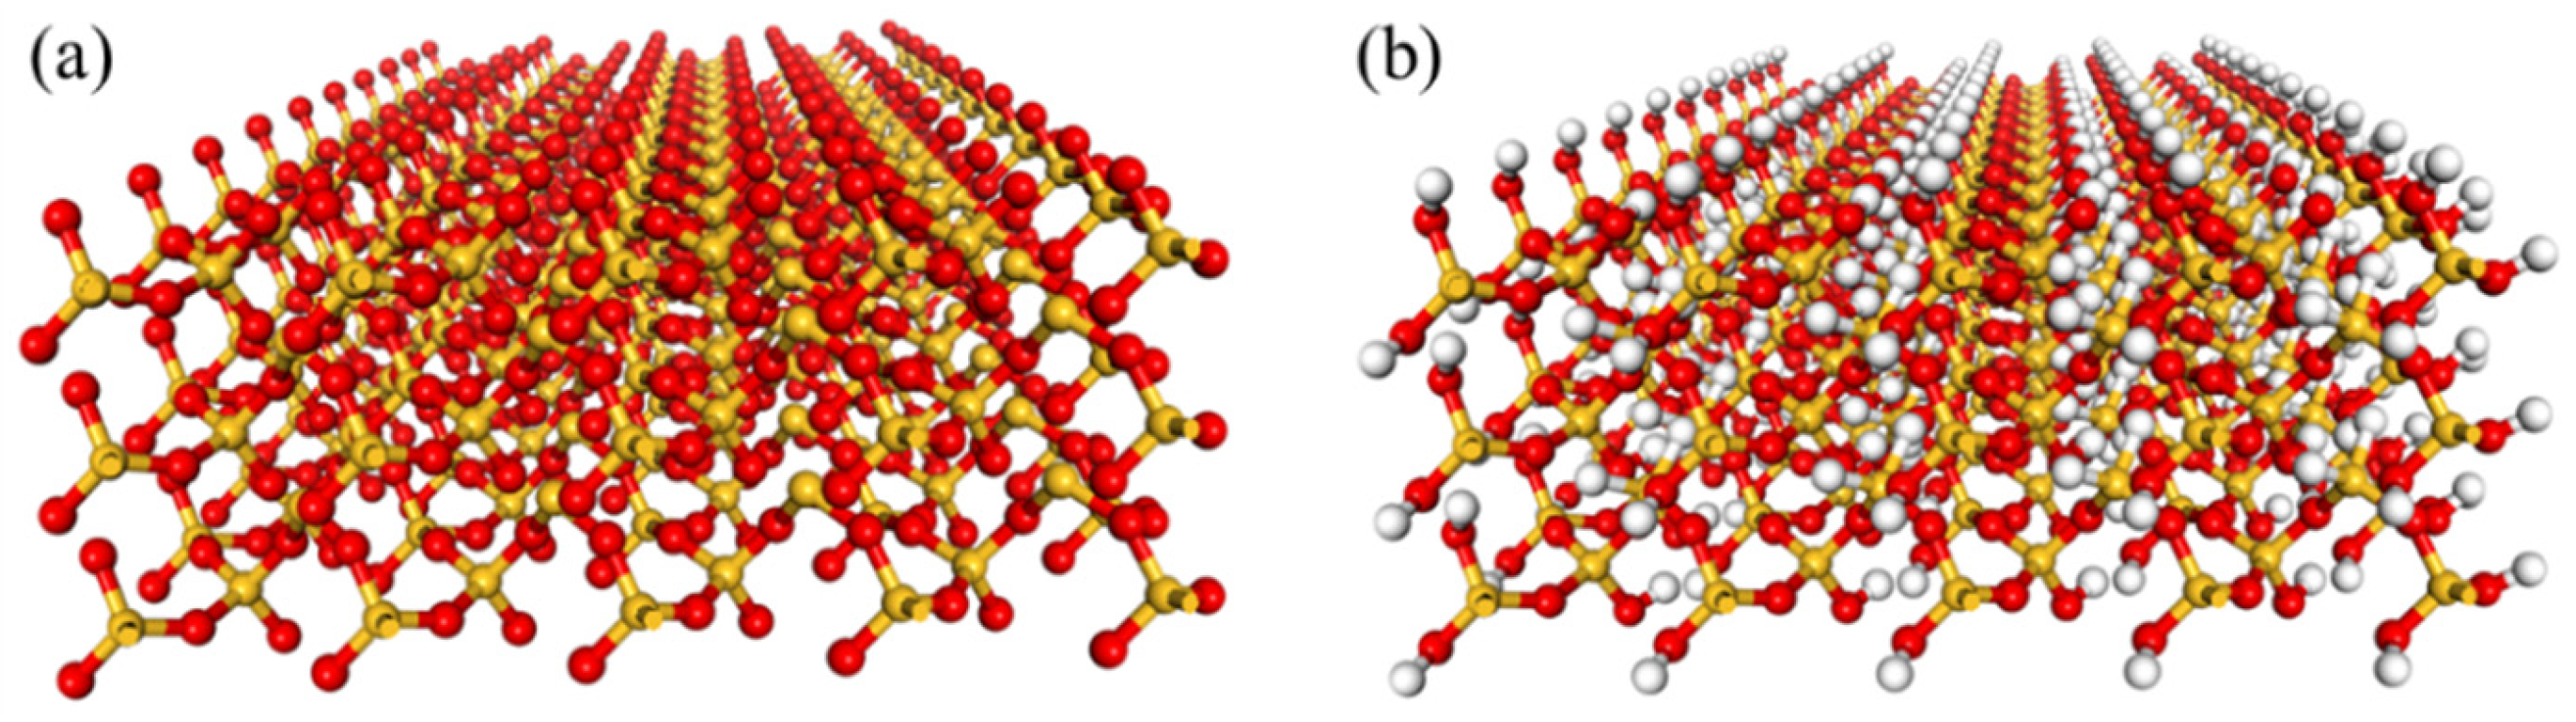
2.1. Model
2.2. Simulation Details
3. Result and Discussion
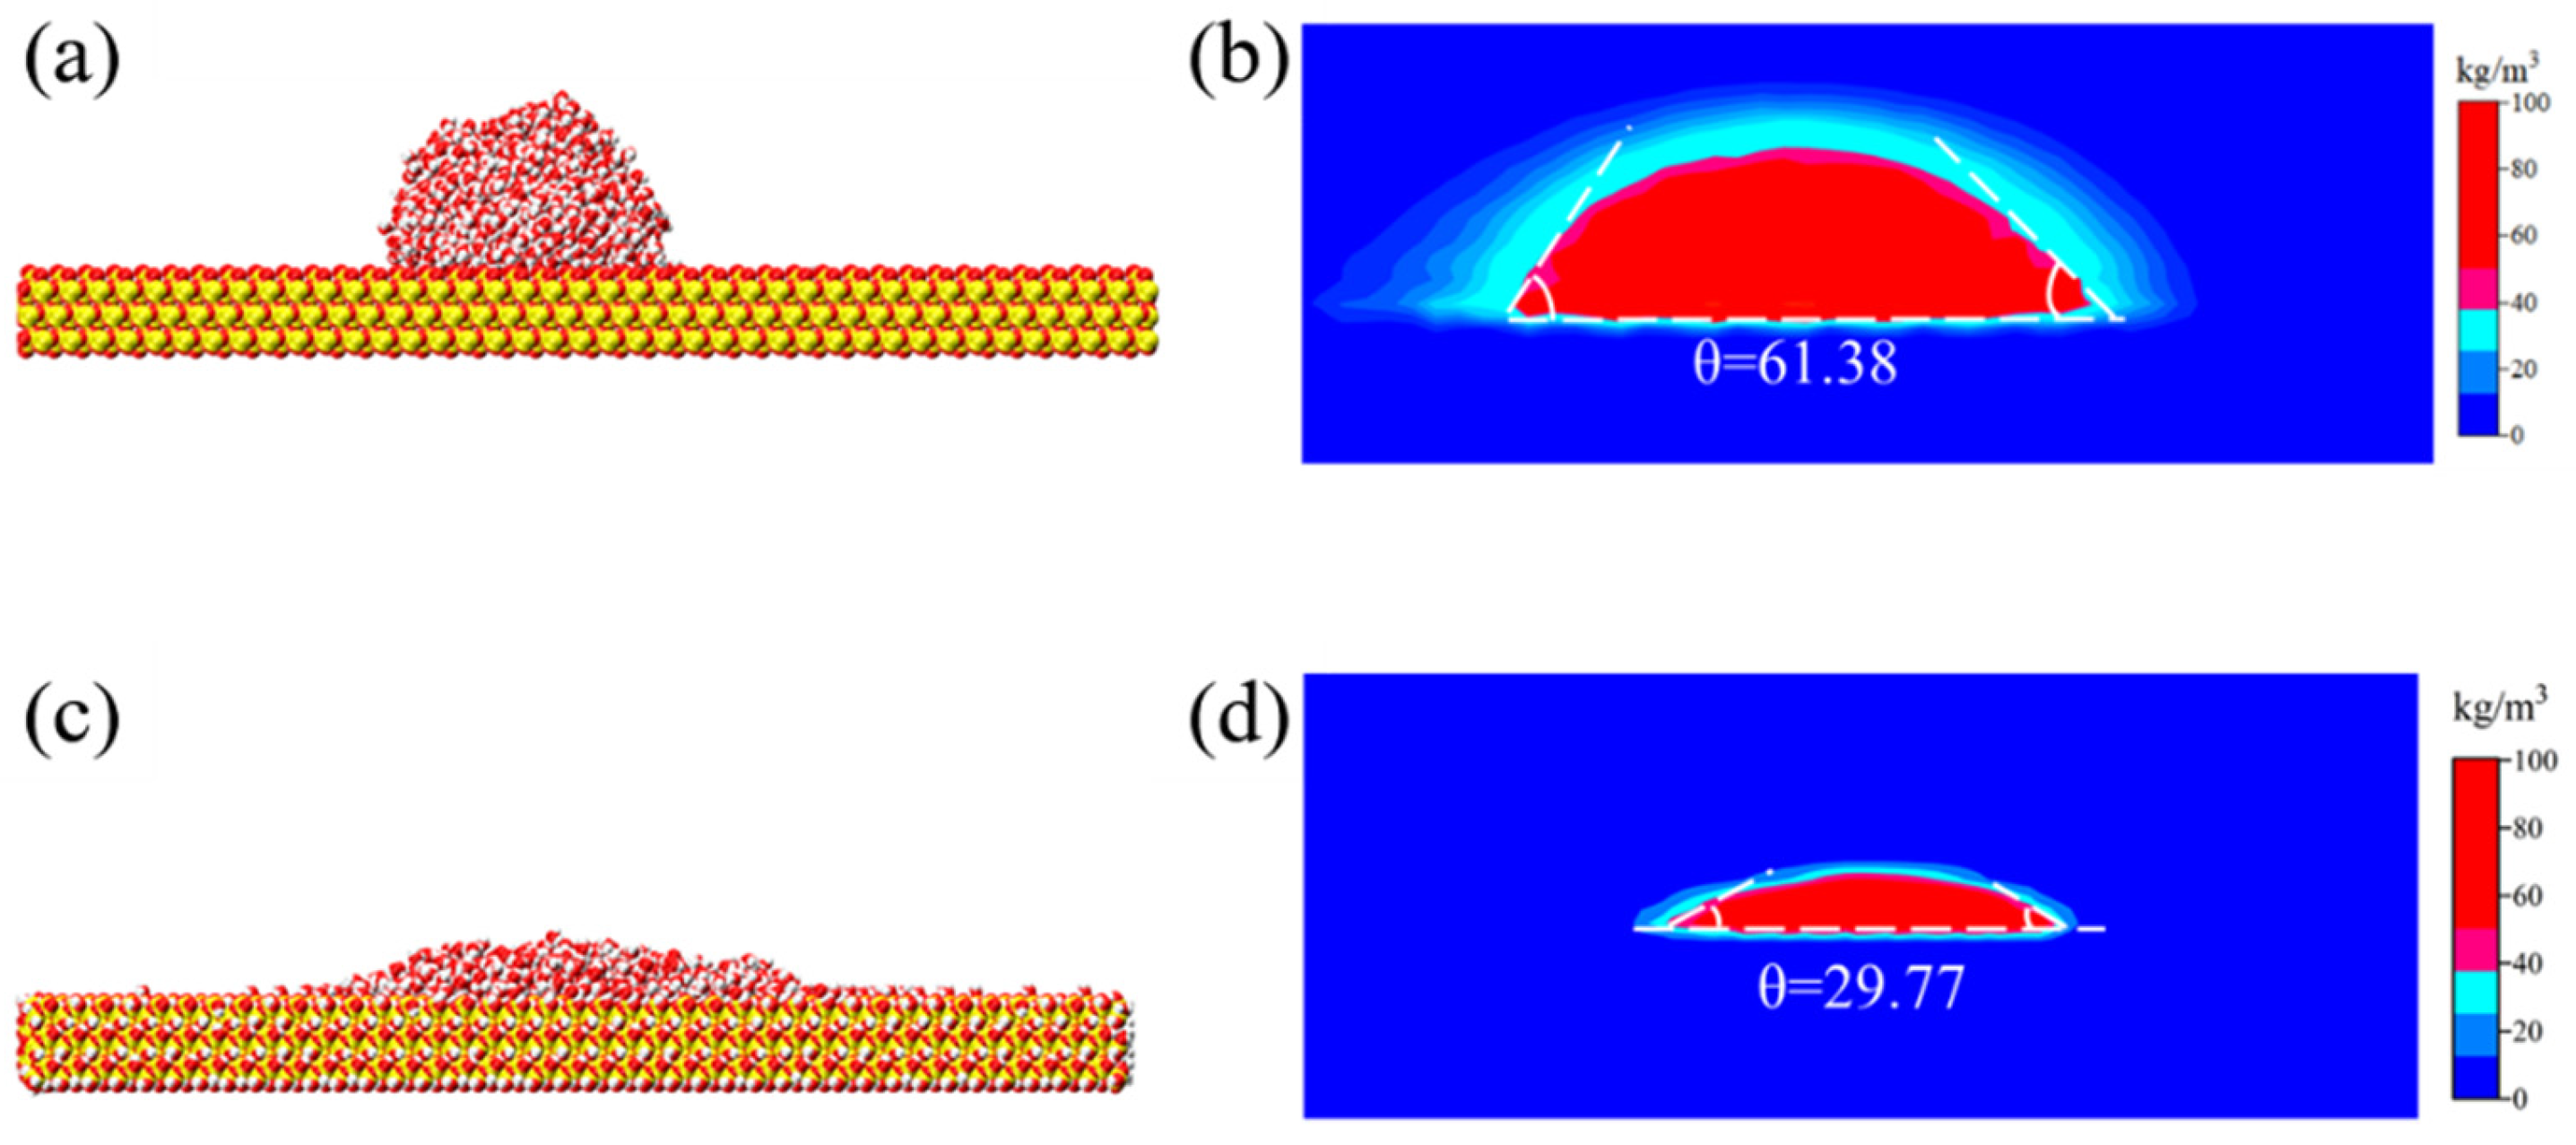
3.1. Wettability Adjustment
3.2. Density Distribution
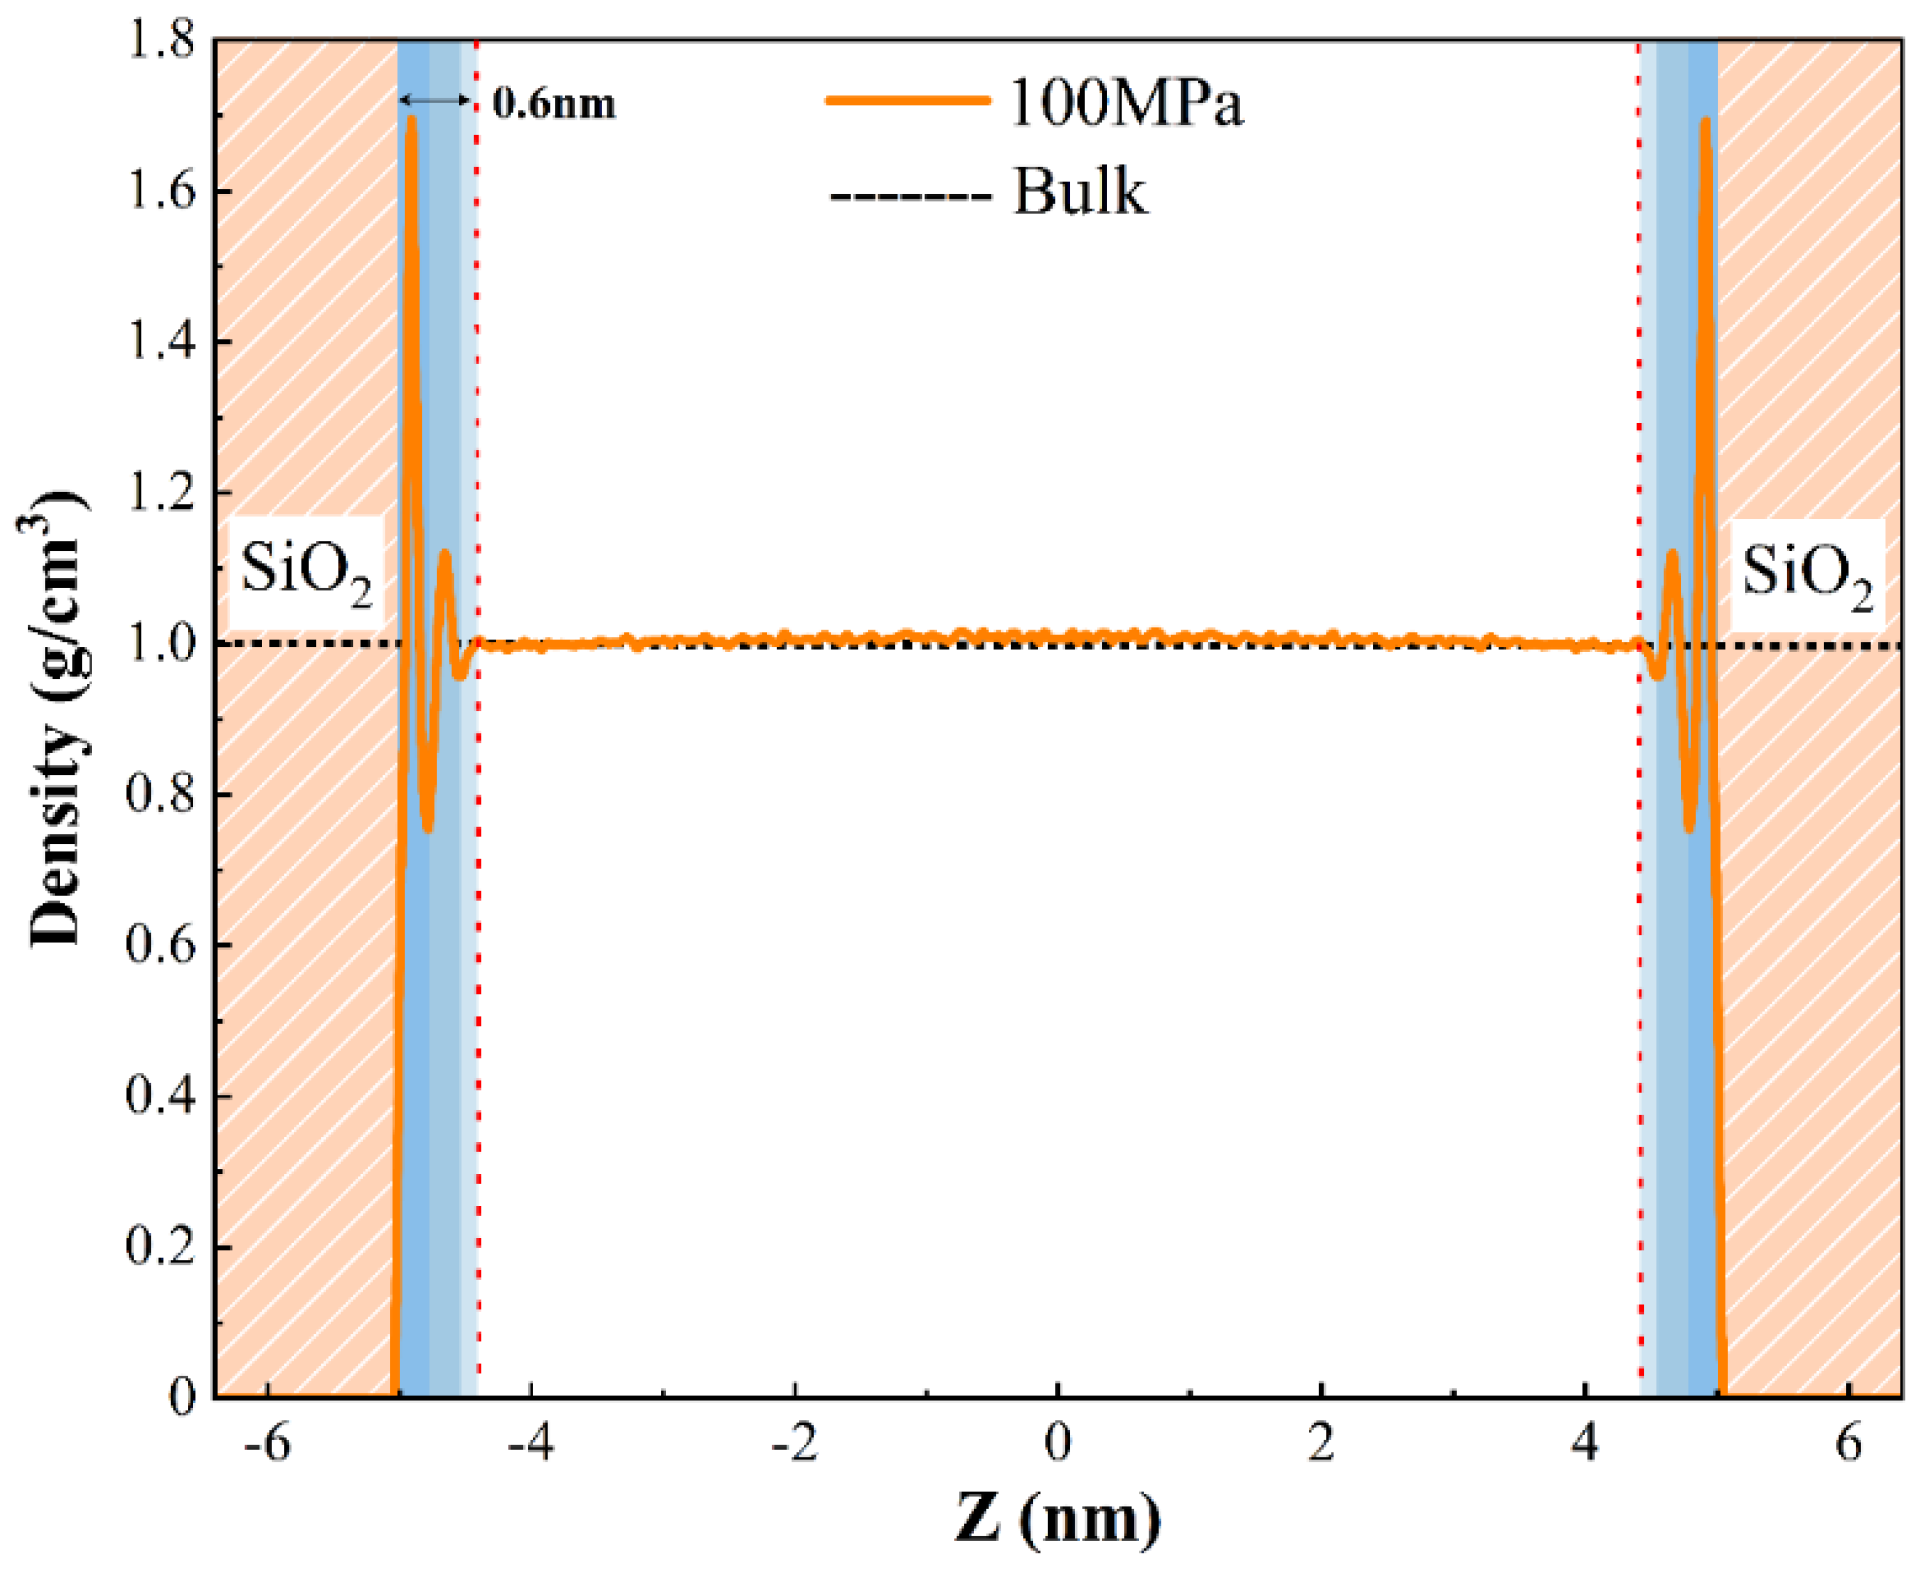
3.2.1. The Density Distribution of Pure H2O
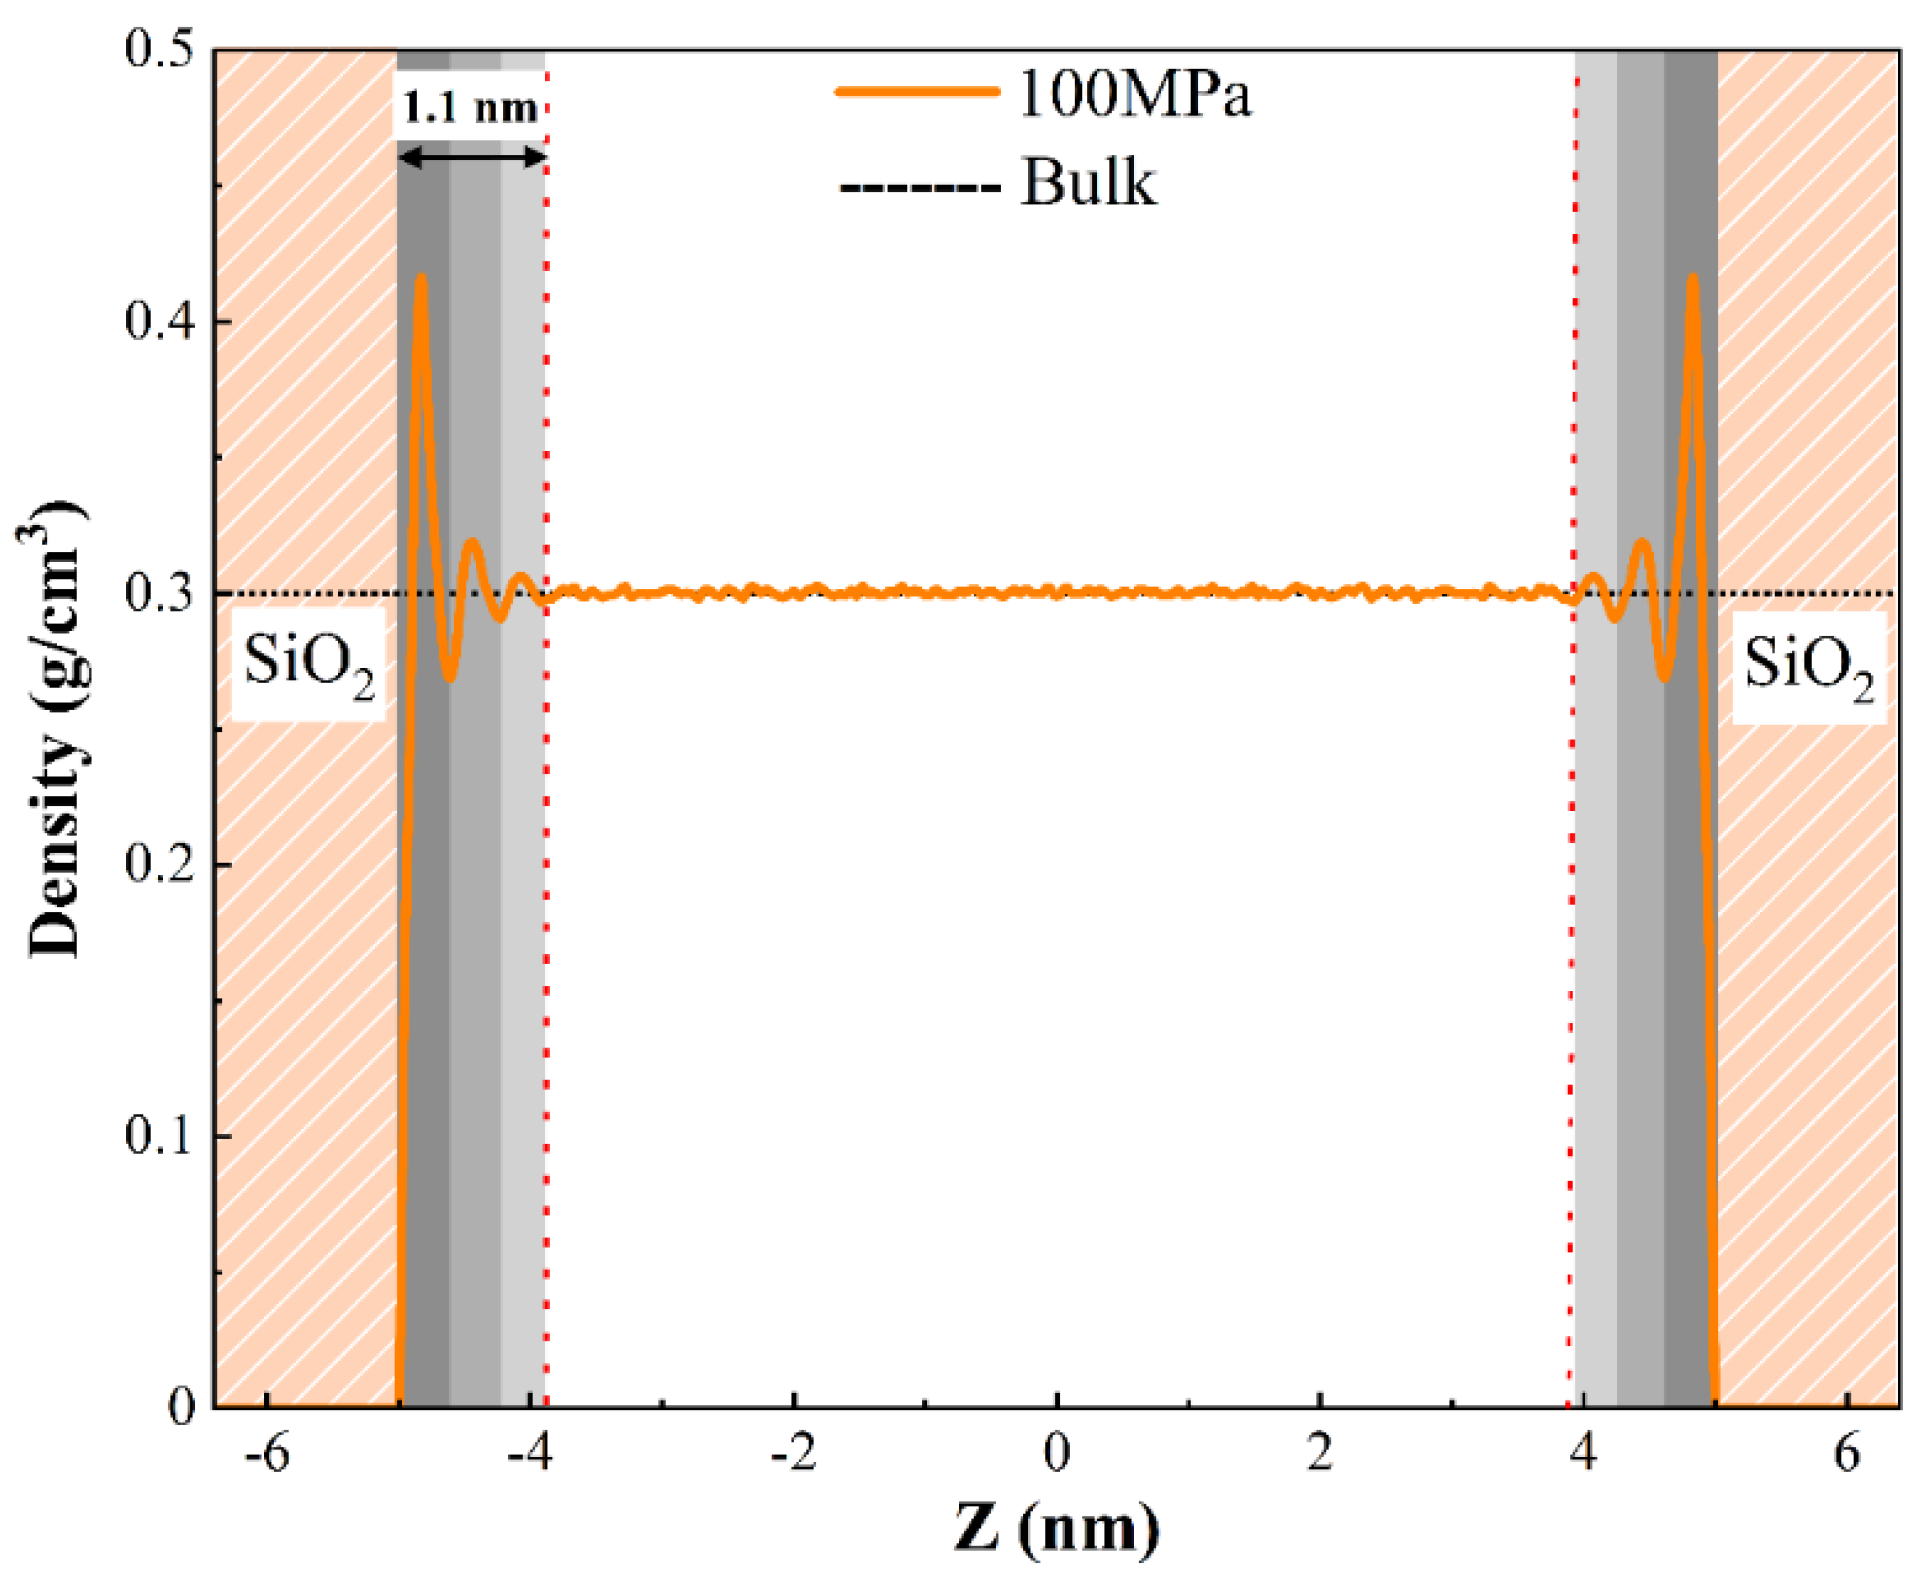
3.2.2. The Density Distribution of Pure CH4
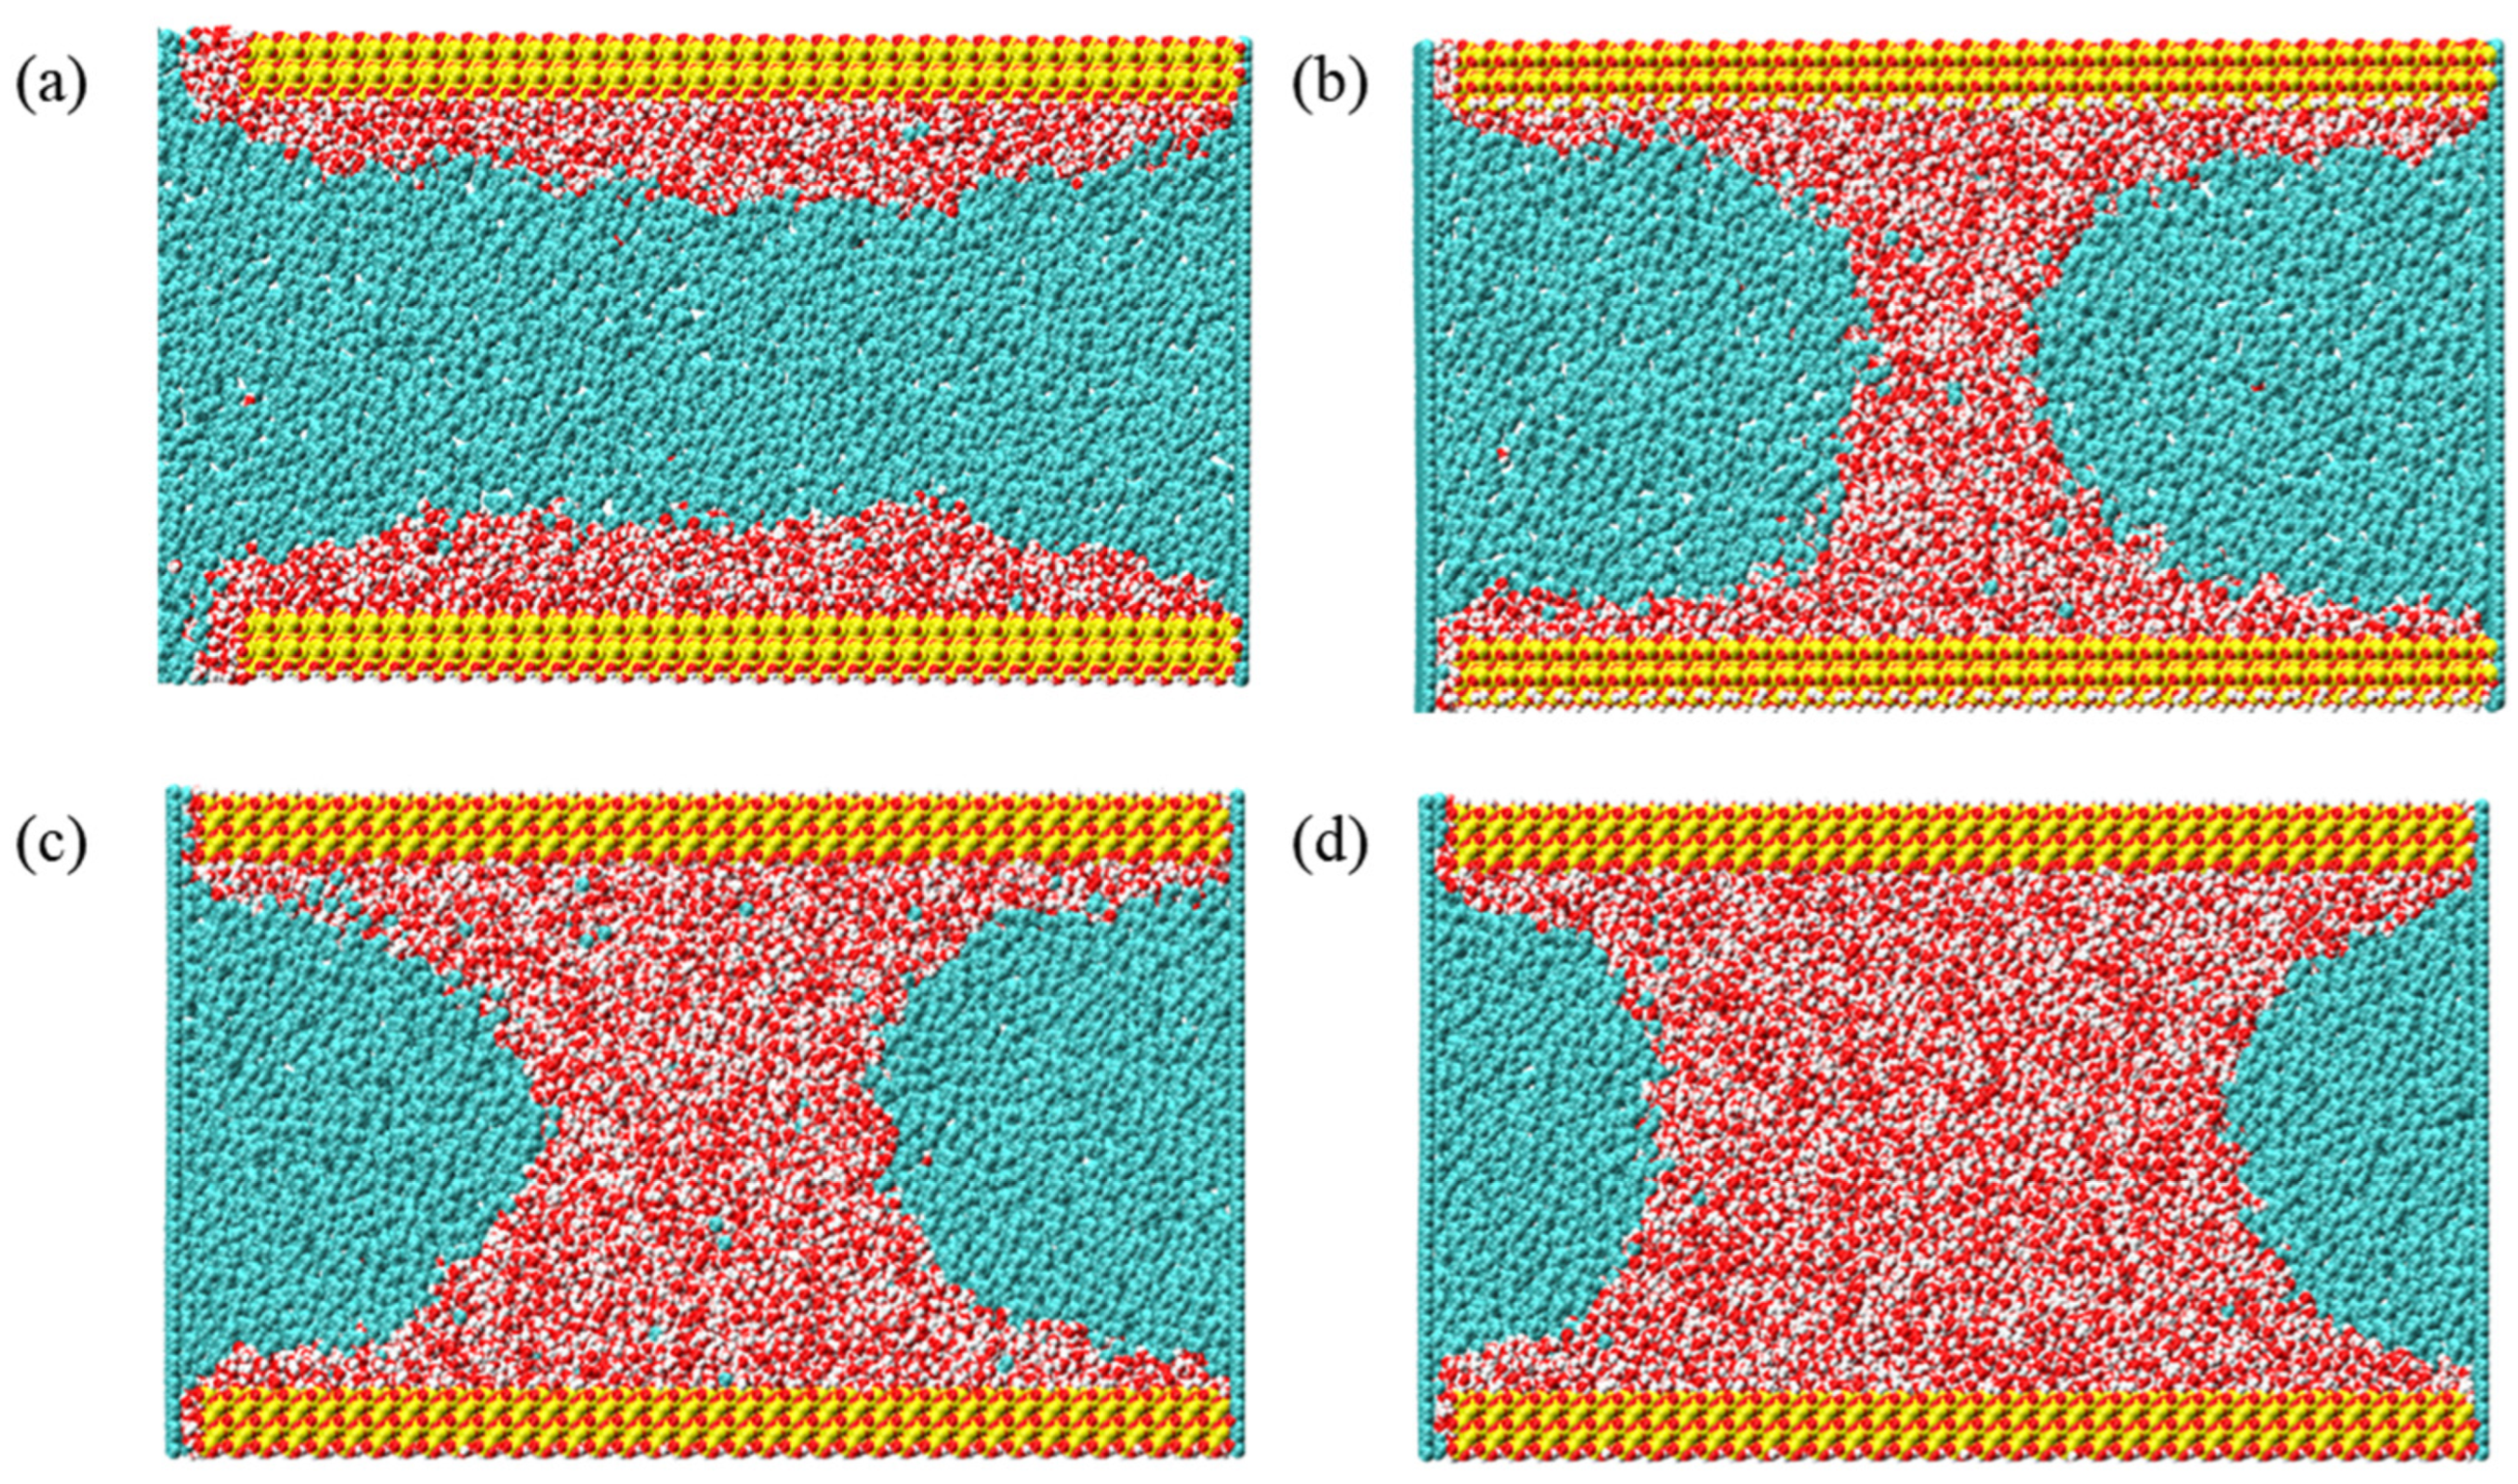
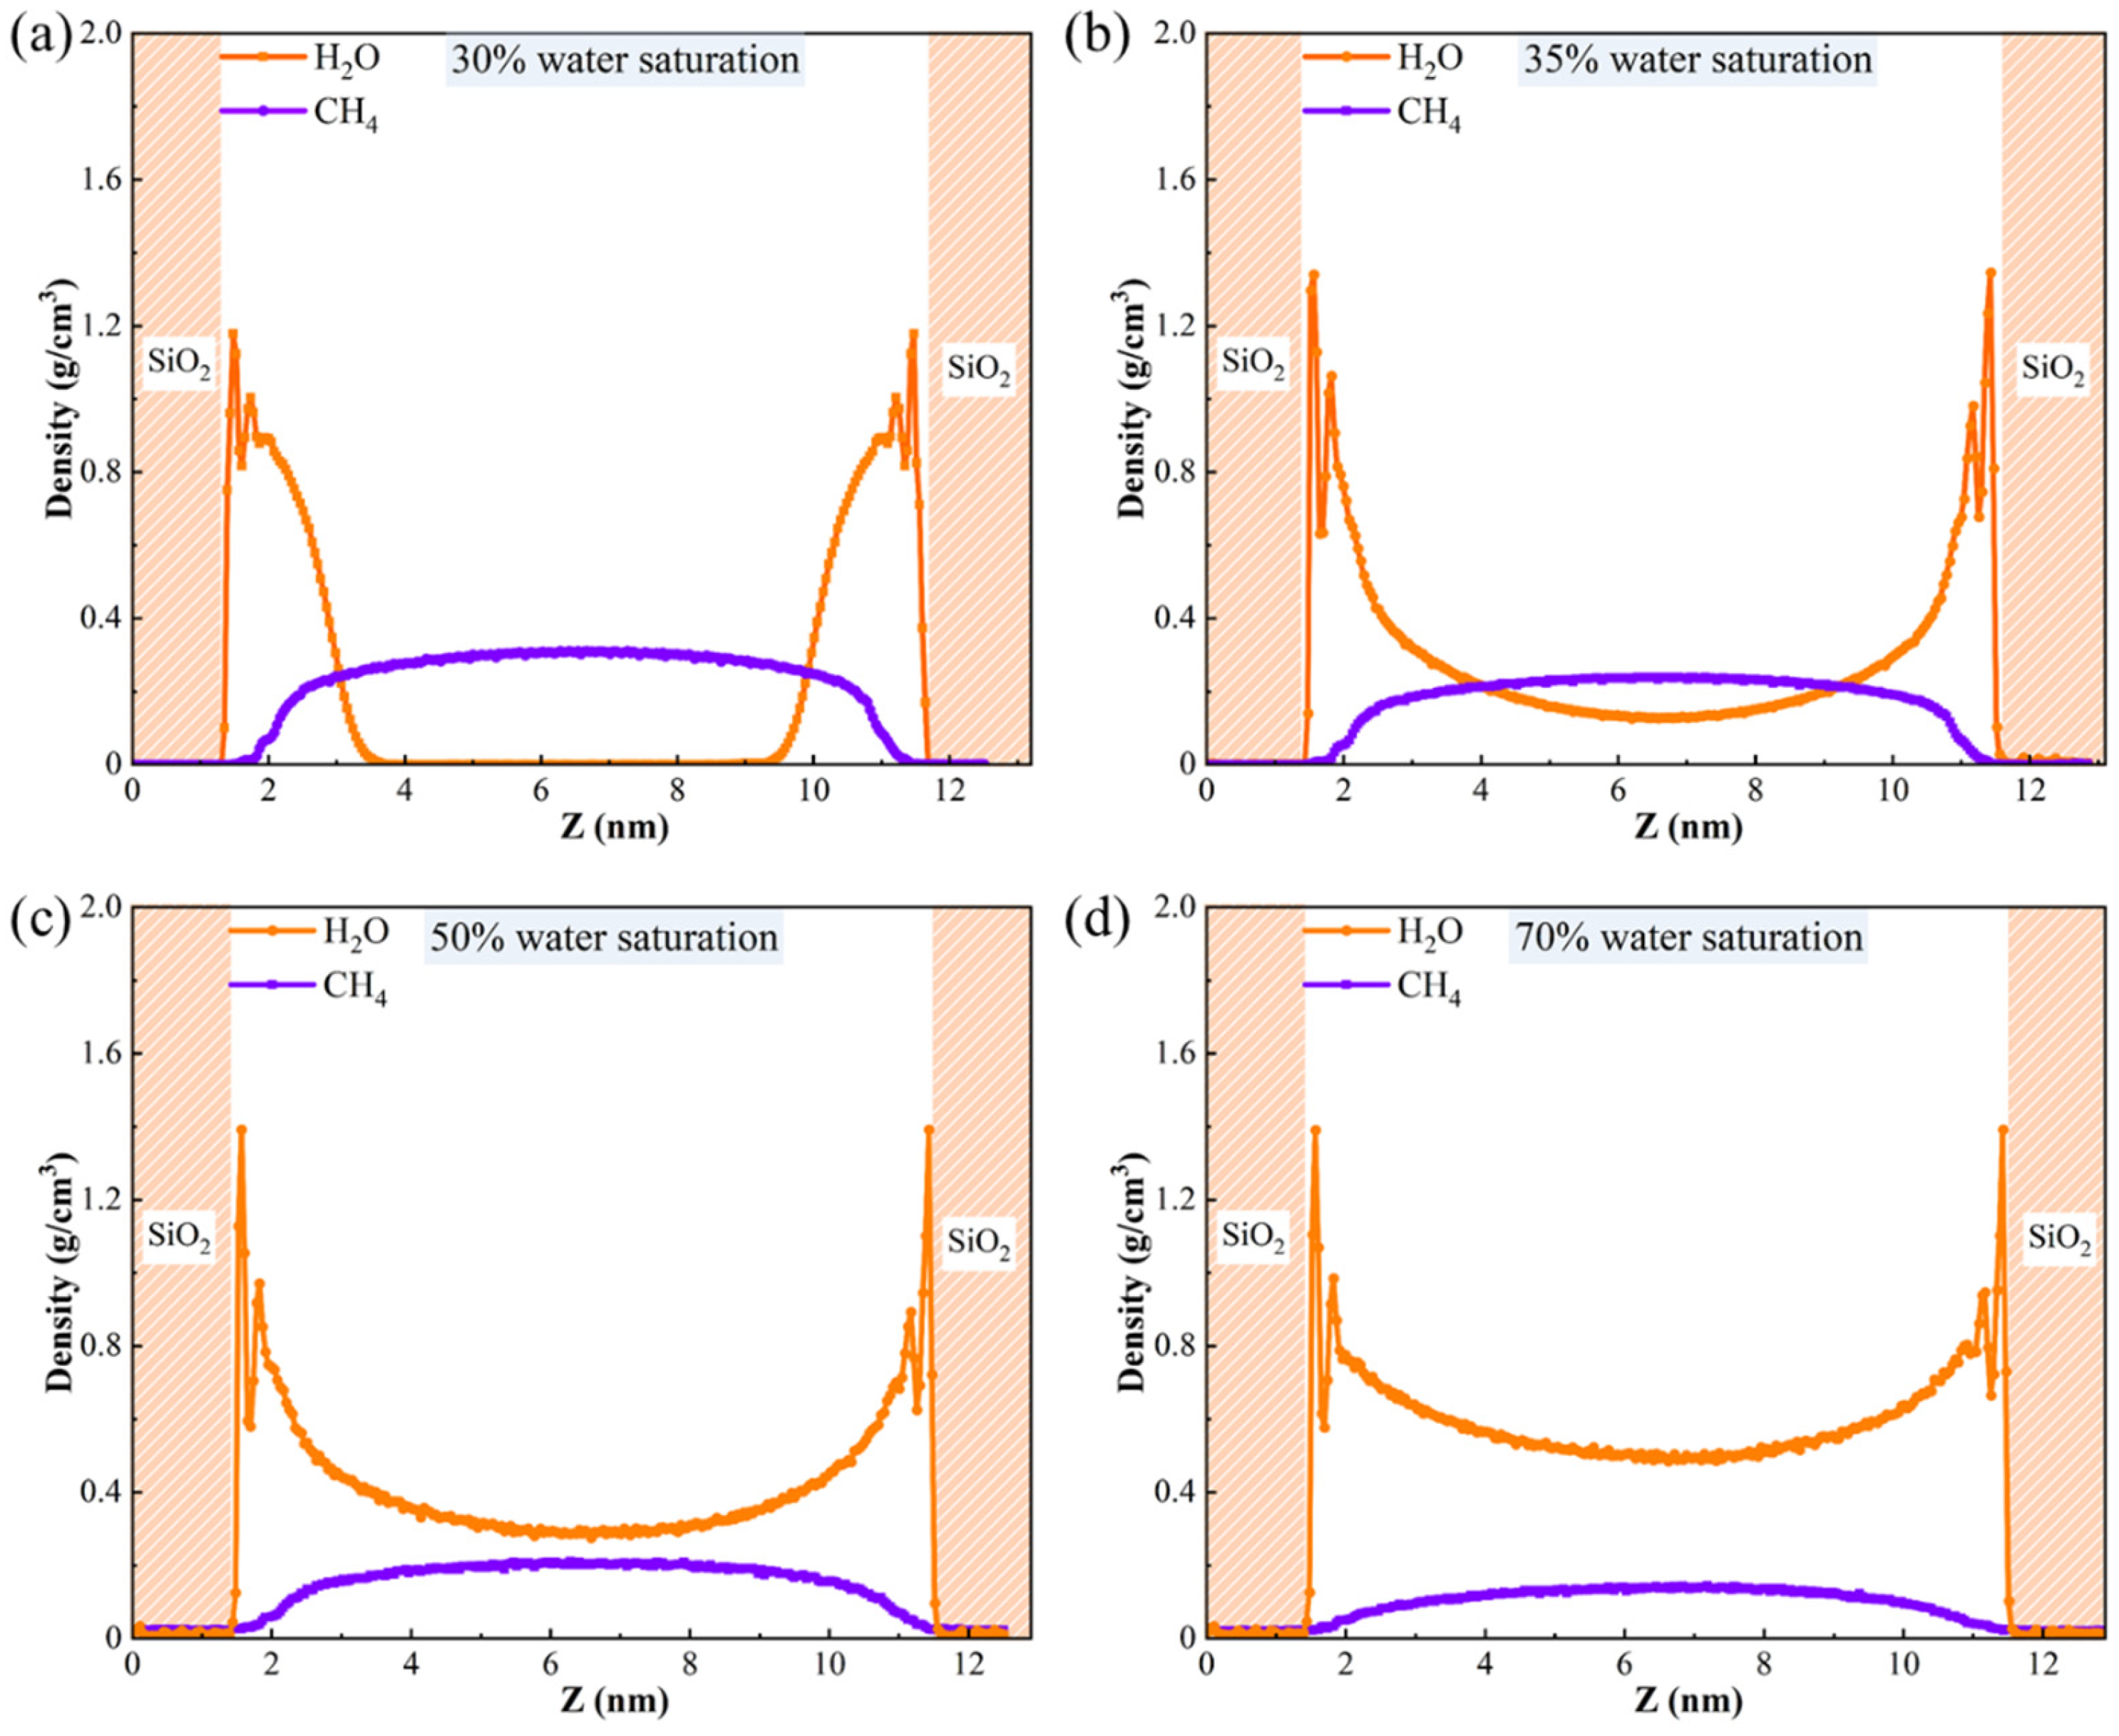
3.2.3. The Density Distribution of Gas-Water Under Different Water Saturation Conditions
3.3. Mobility Evaluation
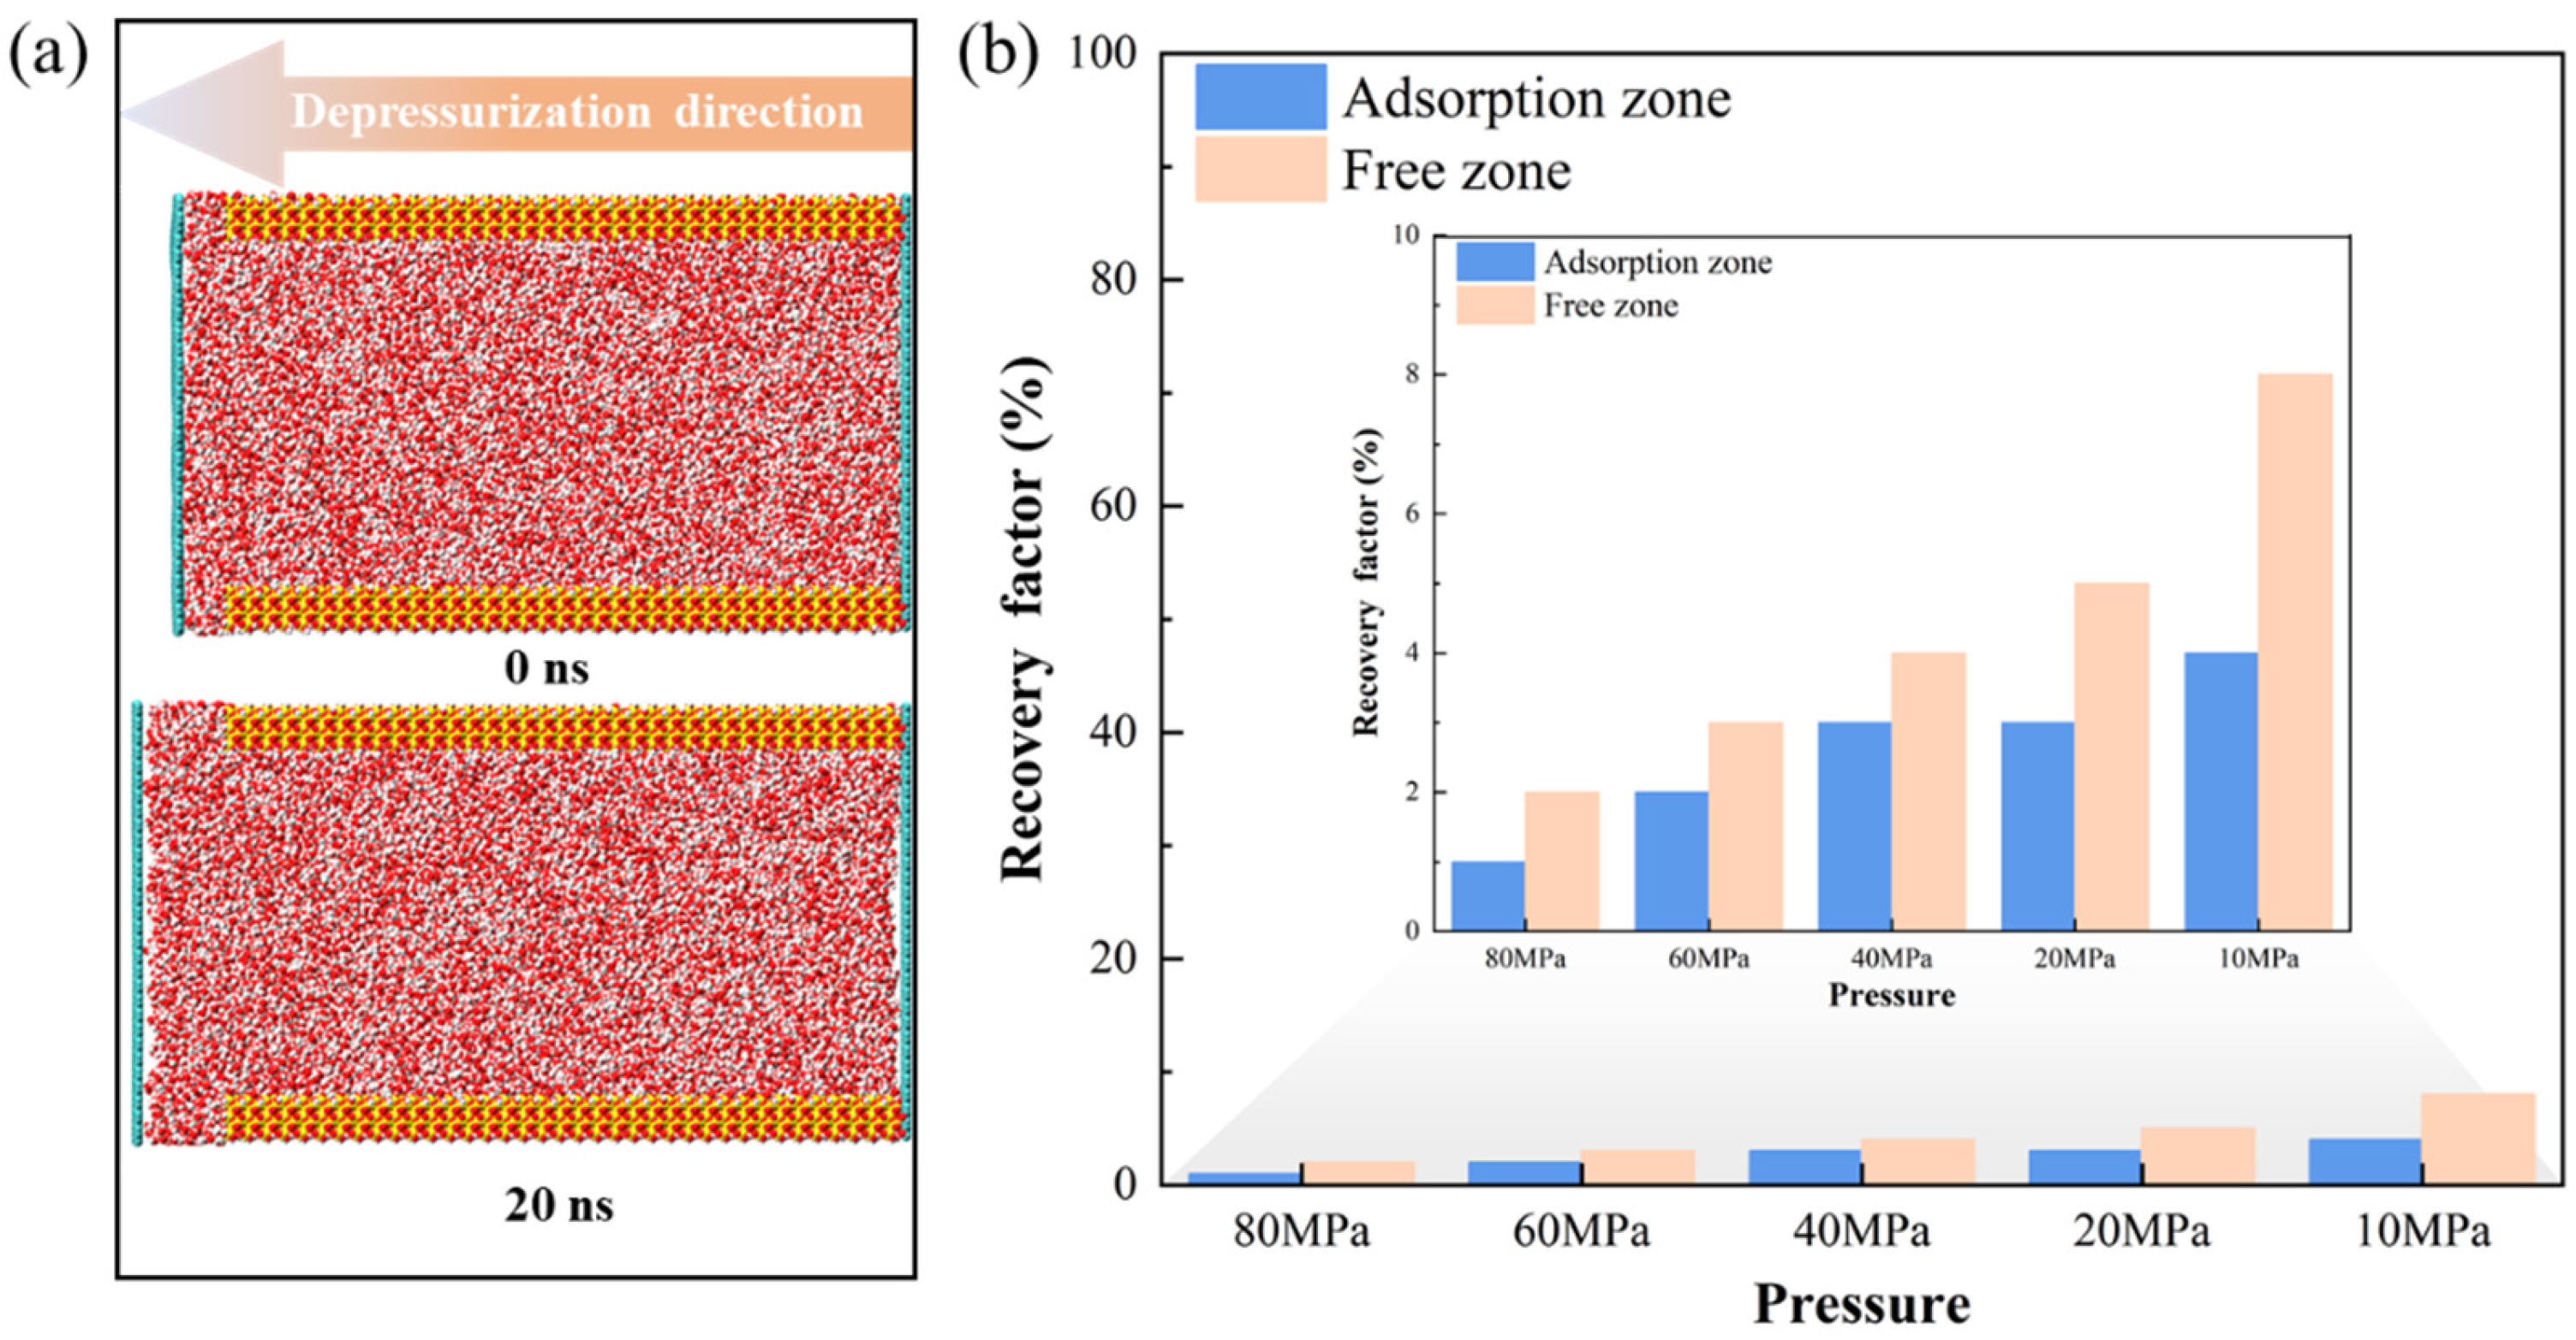
3.3.1. Mobility Evaluation of Pure H2O
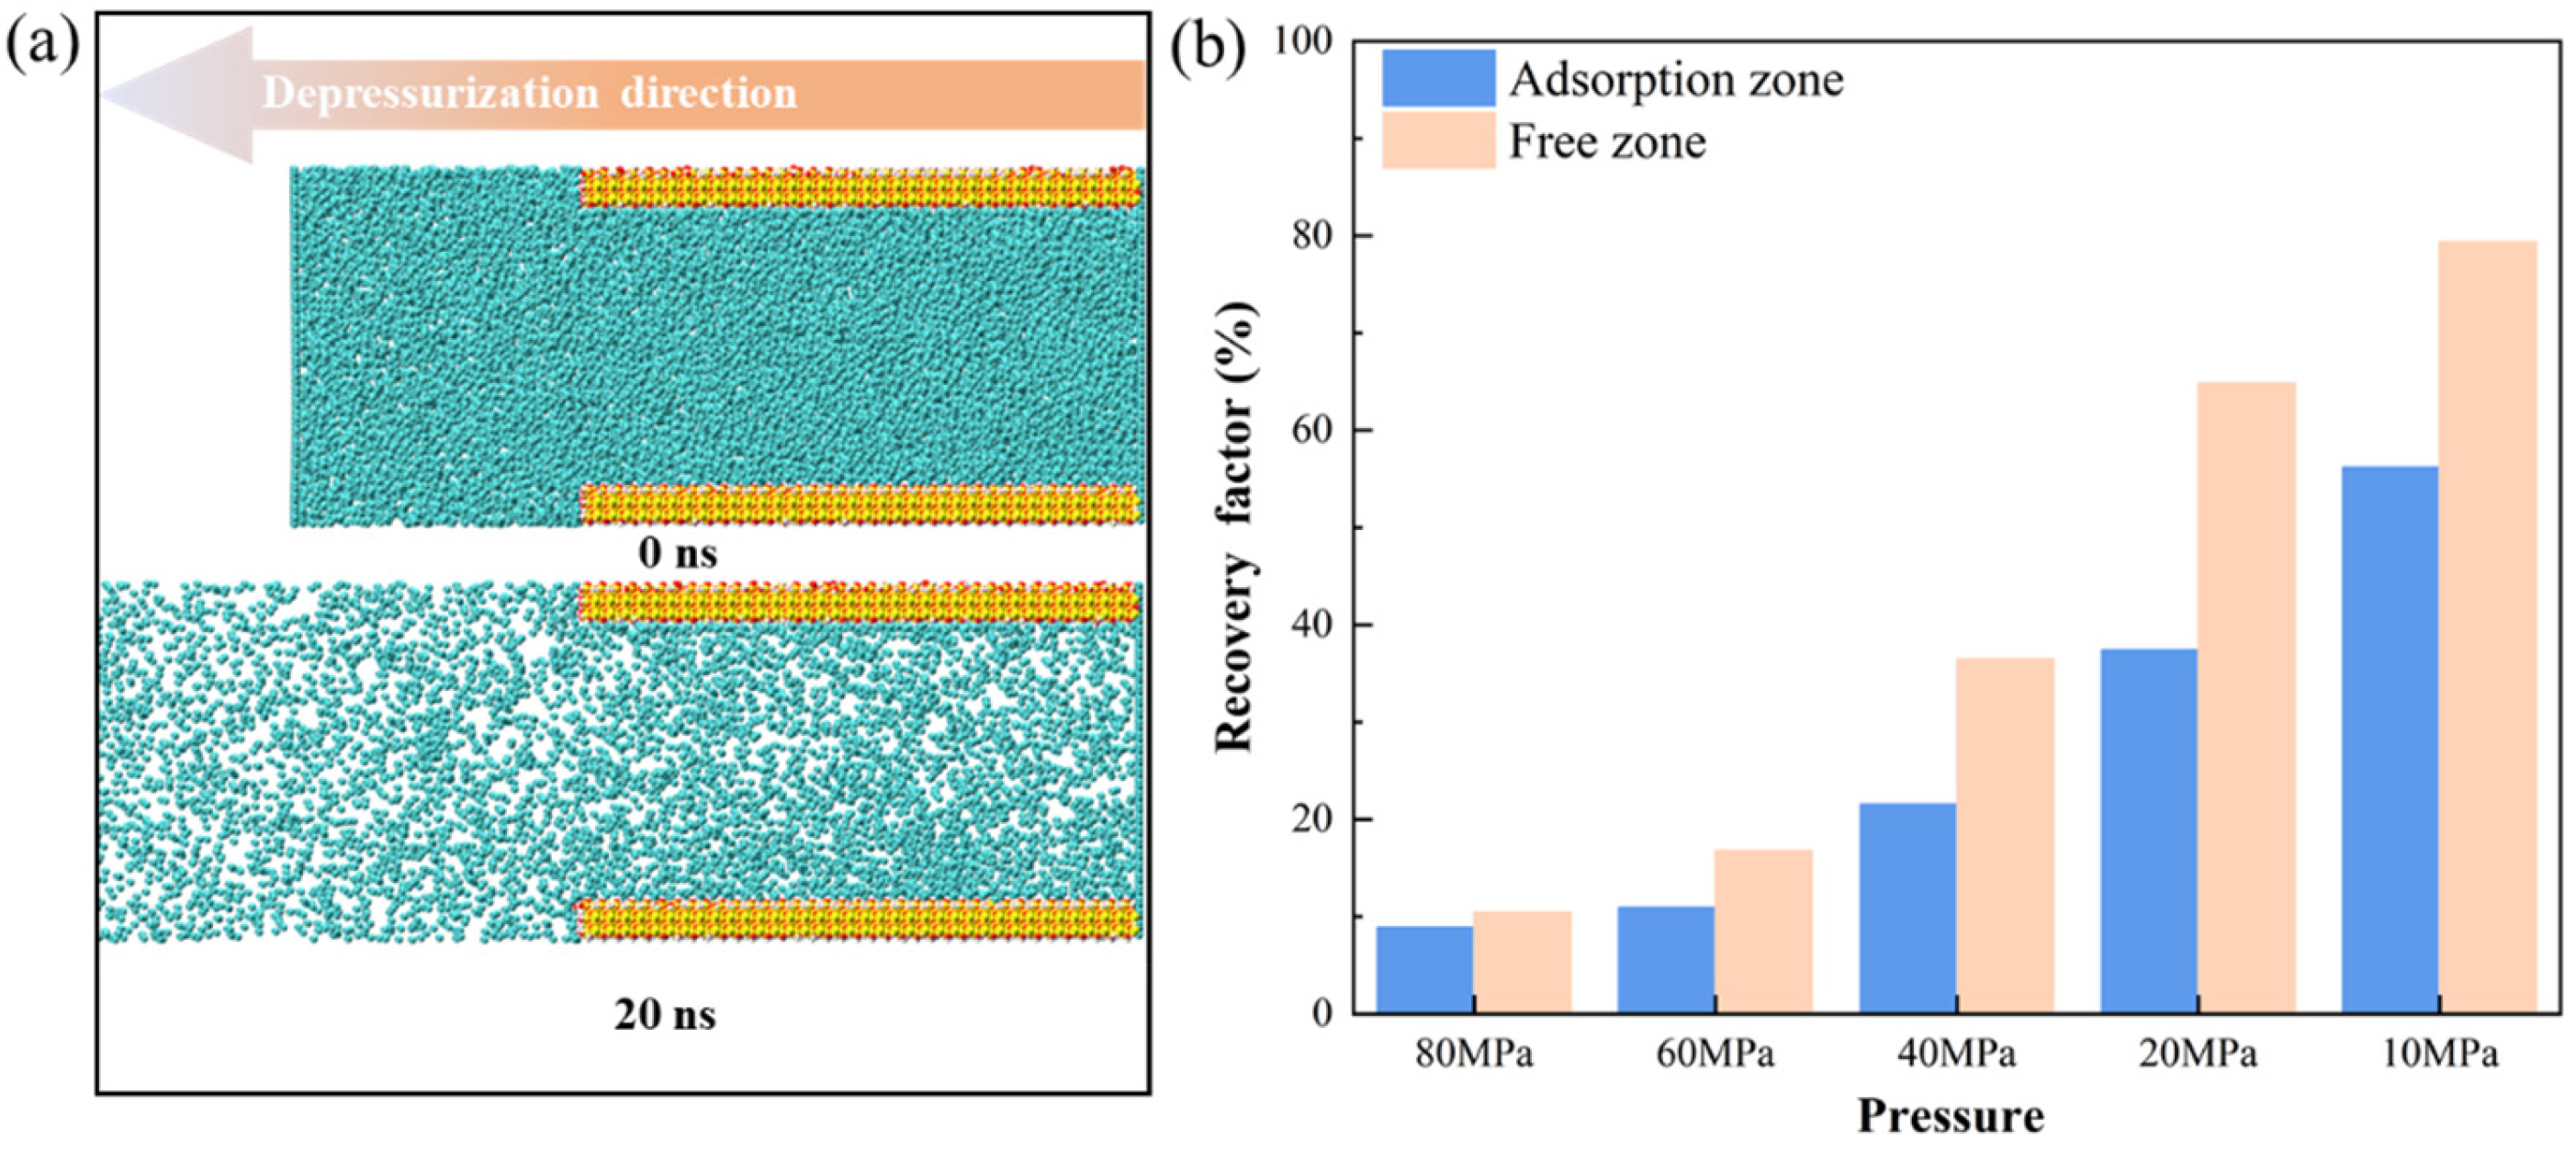
3.3.2. Mobility Evaluation of Pure CH4
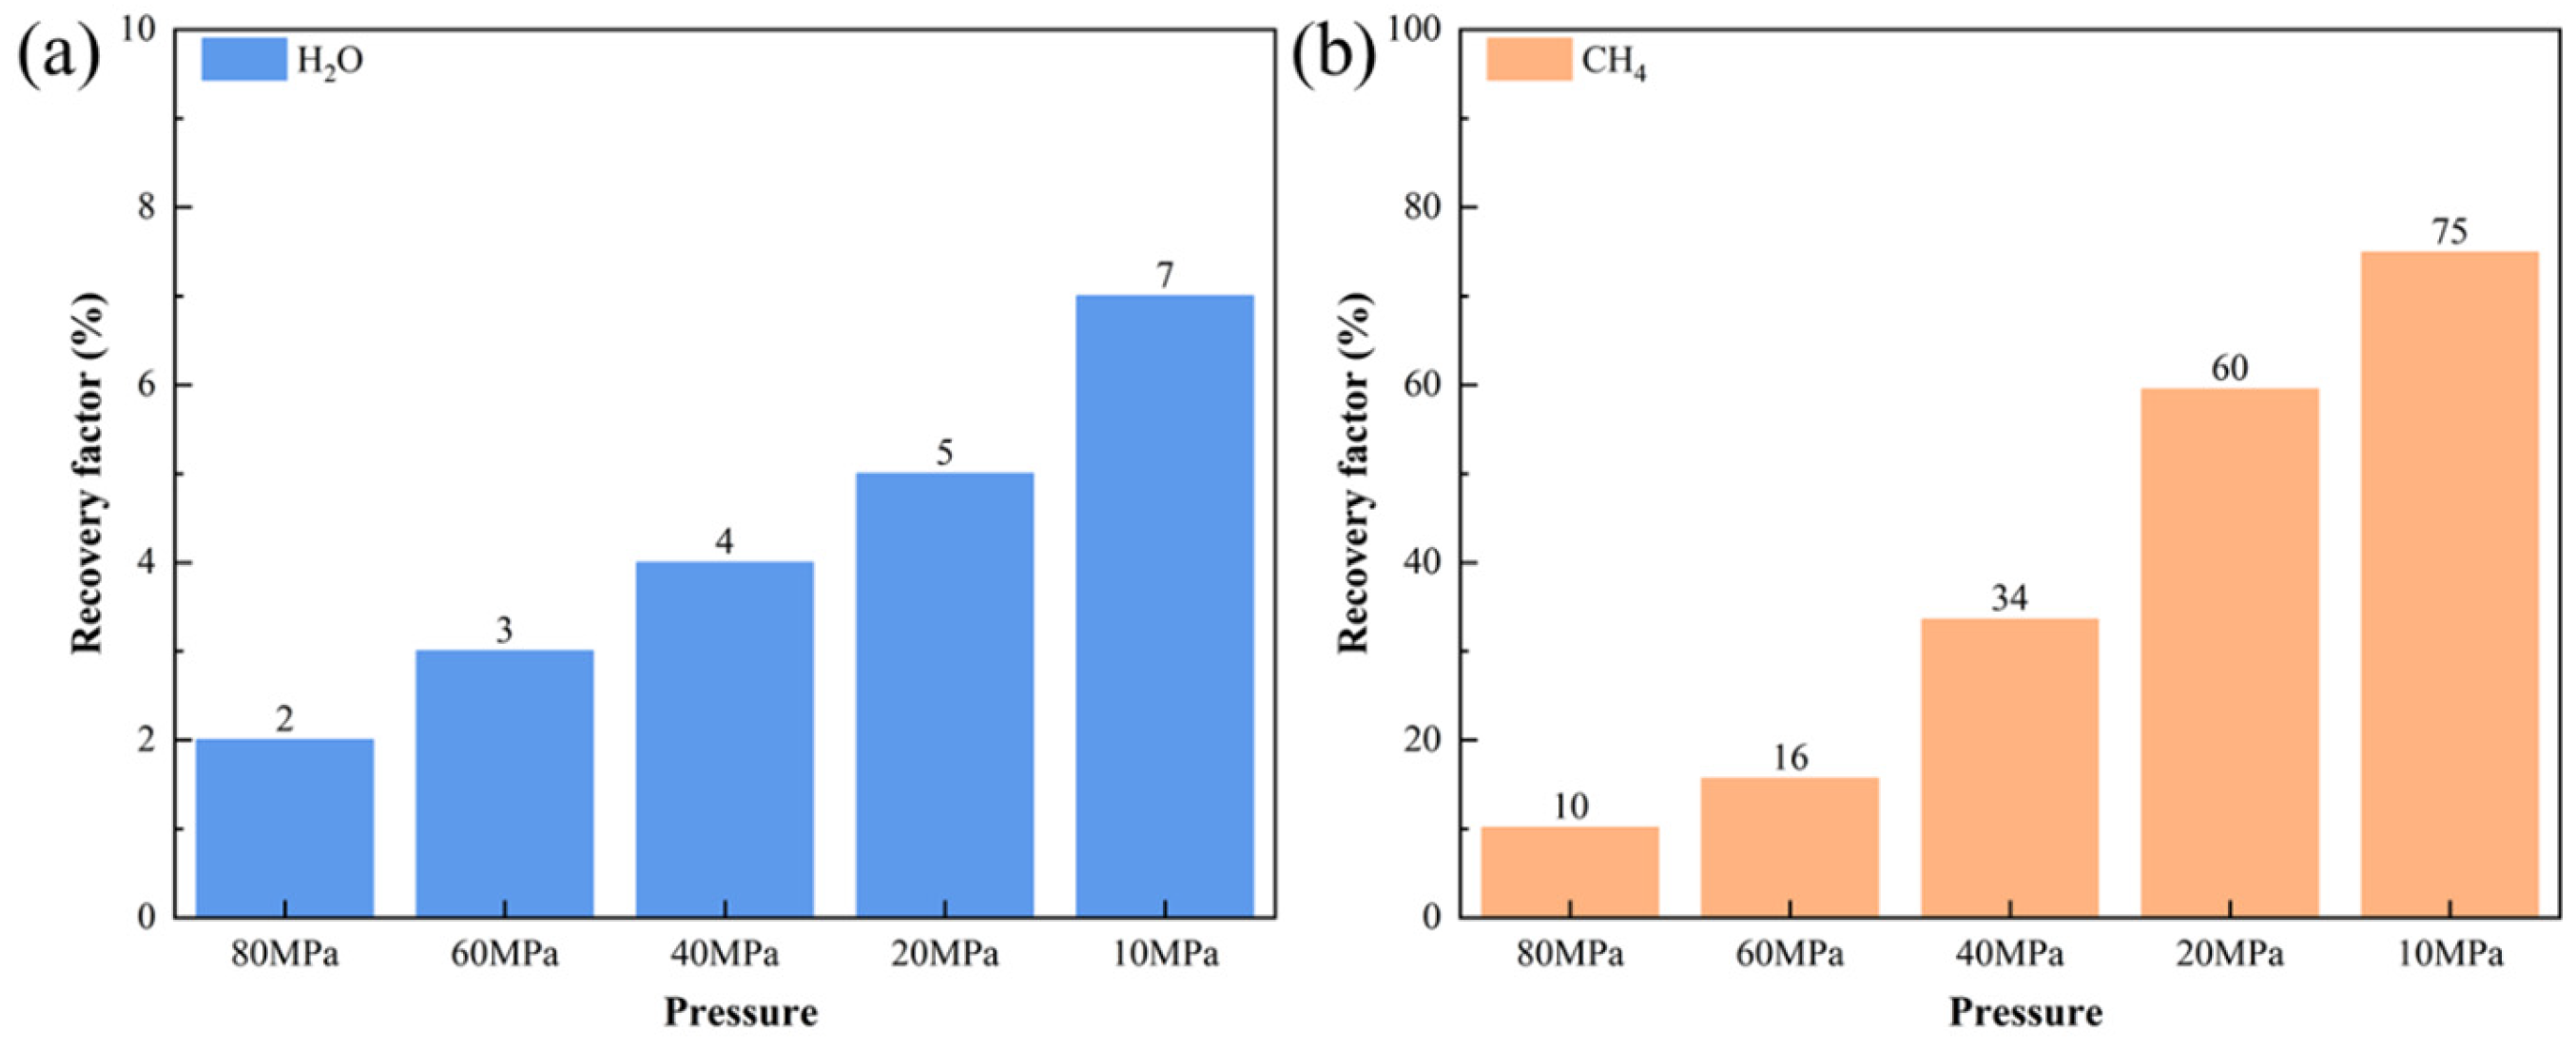
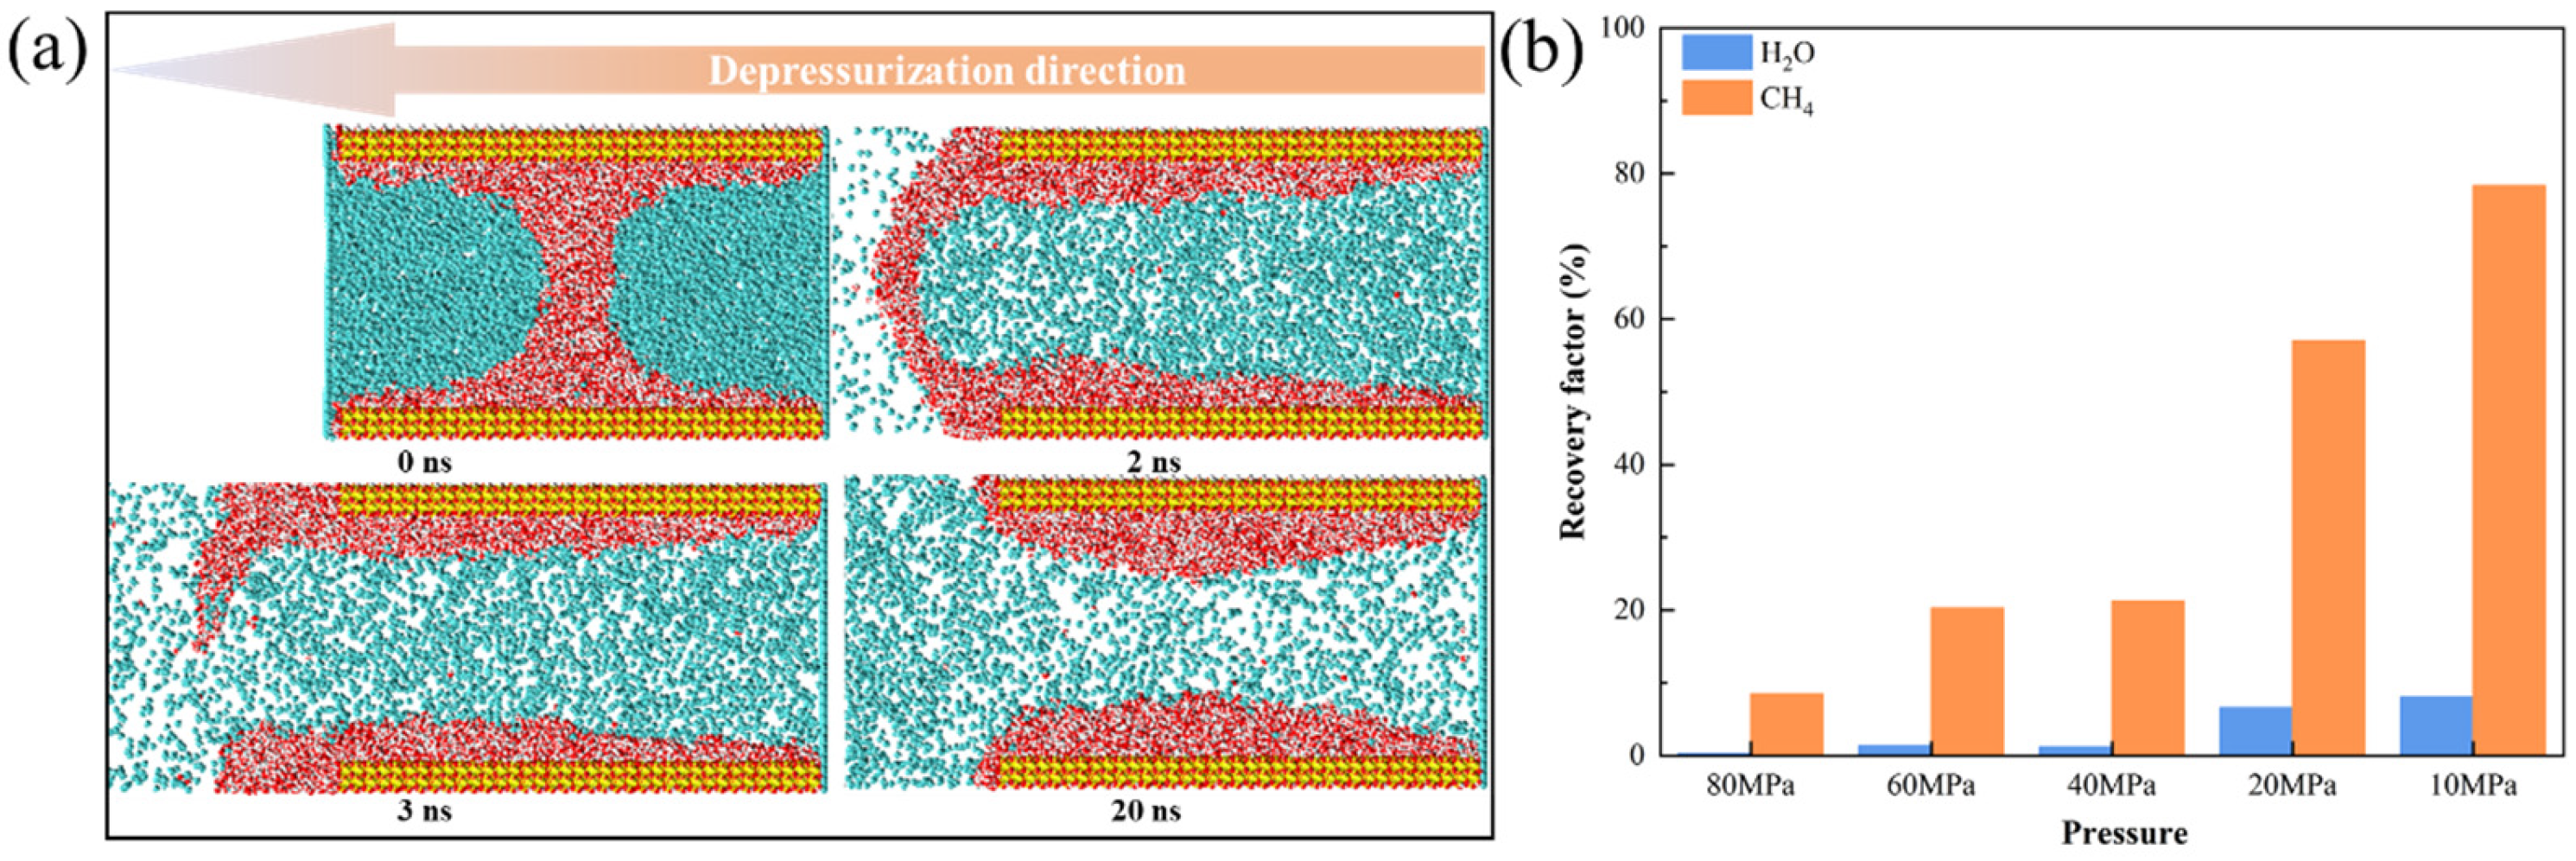
3.3.3. Mobility Evaluation of Gas-Water Under Different Water Saturation Conditions
4. Conclusions
Author Contributions
Funding
Data Availability Statement
Conflicts of Interest
References
- He, D.; Jia, C.; Zhao, W.; Xu, F.; Luo, X.; Liu, W.; Tang, Y.; Gao, S.; Zheng, X.; Li, D.; et al. Research progress and key issues of ultra-deep oil and gas exploration in China. Pet. Explor. Dev. 2023, 50, 1333–1344. [Google Scholar] [CrossRef]
- Guo, X.; Zhao, L.; Han, W.; Zhou, L.; Huang, Z.; Sun, X.; Yang, X.; Zhang, T.; Zhang, C. Geochemistry of Formation Water and Implications for Ultradeep Tight Sandstone of DK Gas Field in Kuqa Depression. Geofluids 2022, 2022, 6514733. [Google Scholar] [CrossRef]
- Lai, J.; Wang, G.; Chai, Y.; Xin, Y.; Wu, Q.; Zhang, X.; Sun, Y. Deep burial diagenesis and reservoir quality evolution of high-temperature, high-pressure sandstones: Examples from Lower Cretaceous Bashijiqike Formation in Keshen area, Kuqa depression, Tarim basin of China. AAPG Bull. 2017, 101, 829–862. [Google Scholar] [CrossRef]
- Zhao, L.B.; Yang, X.J.; Chang, L.J.; Zhang, T.H. Tri-media reservoir characteristic of fractured tight gas reservoir of gasfield A, Kuqa Depression, Tarim Basin. Nat. Gas Geosci. 2017, 28, 209–218. [Google Scholar] [CrossRef]
- Jiang, T.; Sun, X. Development of Keshen ultra-deep and ultra-high pressure gas reservoirs in the kuqa foreland basin, Tarim Basin: Understanding points and technical countermeasures. Nat. Gas Ind. 2018, 6, 16–24. [Google Scholar] [CrossRef]
- Wang, R.; Zhang, C.; Chen, D.; Yang, F.; Li, H.; Li, M. Microscopic Seepage Mechanism of Gas and Water in Ultra-Deep Fractured Sandstone Gas Reservoirs of Low Porosity: A Case Study of Keshen Gas Field in Kuqa Depression of Tarim Basin, China. Front. Earth Sci. 2022, 10, 893701. [Google Scholar] [CrossRef]
- He, X.; Wang, C.; Chang, B.; Cao, Z.; Tang, H. A Dynamic Reserve Evaluation Method for an Ultra-Deep Fractured Tight Sandstone Gas Reservoir. Energies 2024, 17, 2648. [Google Scholar] [CrossRef]
- Lei, Q.; Xu, Y.; Yang, Z.; Cai, B.; Wang, X.; Zhou, L.; Liu, H.; Xu, M.; Wang, L.; Li, S. Progress and development directions of stimulation techniques for ultra-deep oil and gas reservoirs. Pet. Explor. Dev. 2021, 48, 221–231. [Google Scholar] [CrossRef]
- Li, Q.; Li, Q.; Wu, J.; Li, X.; Li, H.; Cheng, Y. Wellhead Stability During Development Process of Hydrate Reservoir in the Northern South China Sea: Evolution and Mechanism. Processes 2025, 13, 40. [Google Scholar] [CrossRef]
- Li, Q.; Li, Q.; Cao, H.; Wu, J.; Wang, F.; Wang, Y. The Crack Propagation Behaviour of CO2 Fracturing Fluid in Unconventional Low Permeability Reservoirs: Factor Analysis and Mechanism Revelation. Processes 2025, 13, 159. [Google Scholar] [CrossRef]
- Zhang, R.; Tang, Y. Molecular dynamics simulation on the density distribution and multilayer adsorption of methane in nanopores. Phys. Fluids 2024, 36, 122001. [Google Scholar] [CrossRef]
- Ren, J.H.; Ren, X.H.; Song, H.Q.; Han, D.L.; Wang, C.C.; Sheng, G.L.; Lv, F.W. Adsorption and diffusion characteristics of methane in nanopores based on molecular simulation. Acta Pet. Sin. 2020, 41, 1366–1375. [Google Scholar] [CrossRef]
- Zhang, H. Nanoscale Transport of Multicomponent Fluids in Shales. Ph.D. Thesis, Virginia Polytechnic Institute and State University, Blacksburg, VA, USA, 2025. [Google Scholar]
- Xiong, J.; Liu, X.; Liang, L.; Zeng, Q. Adsorption of methane in organic-rich shale nanopores: An experimental and molecular simulation study. Fuel 2017, 200, 299–315. [Google Scholar] [CrossRef]
- Zhang, L.; Zhang, T.; Zhao, Y. Methane Adsorption in Nanoporous Shale. In Modelling in Nanoporous Shale; Advances in Oil and Gas Exploration & Production; Springer: Cham, Switzerland, 2024; pp. 71–83. [Google Scholar] [CrossRef]
- Passey, Q.R.; Bohacs, K.M.; Esch, W.L.; Klimentidis, R.; Sinha, S. From oil-prone source rock to gas-producing shale reservoir–geologic and petrophysical characterization of unconventional shale-gas reservoirs. In Proceedings of the SPE International Oil and Gas Conference and Exhibition in China, Beijing, China, 8–10 June 2010; SPE: Richardson, TX, USA, 2010. [Google Scholar]
- Shi, J.; Zhang, L.; Li, Y.; Yu, W.; He, X.; Liu, N.; Li, X.; Wang, T. Diffusion and Flow Mechanisms of Shale Gas through Matrix Pores and Gas Production Forecasting. In Proceedings of the SPE Unconventional Resources Conference Canada, Calgary, AB, Canada, 5–7 November 2013; OnePetro: Richardson, TX, USA, 2013. [Google Scholar] [CrossRef]
- Li, J.; Li, X.; Wang, X.; Li, Y.; Wu, K.; Shi, J.; Yang, L.; Feng, D.; Zhang, T.; Yu, P. Water distribution characteristic and effect on methane adsorption capacity in shale clay. Int. J. Coal Geol. 2016, 159, 135–154. [Google Scholar] [CrossRef]
- Jin, Z.; Firoozabadi, A. Effect of water on methane and carbon dioxide sorption in clay minerals by Monte Carlo simulations. Fluid Phase Equilibria 2014, 382, 10–20. [Google Scholar] [CrossRef]
- Liu, J.; Wen, Y.; Jiang, L.; Yuan, H.; Liu, Z.; Shui, Z.; Wang, B.; Yan, X. Molecular dynamics simulation of micro mechanisms of gas and water migration and diffusion in shale reservoirs. Colloids Surf. Physicochem. Eng. Asp. 2024, 682, 132865. [Google Scholar] [CrossRef]
- Xie, C.; Huang, J.; Jiang, S.; Zhao, H.; Wu, Z. Effect of Water Content and Salinity on CH4/CO2 Competitive Adsorption in Organic and Clay Nanopores: A Molecular Perspective. Energy Fuels 2024, 38, 23507–23518. [Google Scholar] [CrossRef]
- Zhang, L.; Yan, W.; Fu, J.; Cai, S.; Liang, H. Methane Gas Transport in Ca-MMT Shale Nanoslits Considering Water Content Effects: Insights from Molecular Dynamics Simulations. Langmuir 2024, 40, 25110–25117. [Google Scholar] [CrossRef]
- Zhang, Z.; Qiu, M.; Zhang, D. Analytical simulation of the simultaneous adsorption process of methane and water vapor in shales. Geosystem Eng. 2025, 28, 31–45. [Google Scholar] [CrossRef]
- Cygan, R.T.; Liang, J.-J.; Kalinichev, A.G. Molecular Models of Hydroxide, Oxyhydroxide, and Clay Phases and the Development of a General Force Field. J. Phys. Chem. B 2004, 108, 1255–1266. [Google Scholar] [CrossRef]
- Berendsen, H.J.C.; Grigera, J.R.; Straatsma, T.P. The missing term in effective pair potentials. J. Phys. Chem. 1987, 91, 6269–6271. [Google Scholar] [CrossRef]
- Eggimann, B.L.; Sunnarborg, A.J.; Stern, H.D.; Bliss, A.P.; Siepmann, J.I. An Online Parameter and Property Database for the TraPPE Force Field. Mol. Simul. 2014, 40, 101–105. [Google Scholar] [CrossRef]
- Jorgensen, W.L.; Maxwell, D.S.; Tirado-Rives, J. Development and Testing of the OPLS All-Atom Force Field on Conformational Energetics and Properties of Organic Liquids. J. Am. Chem. Soc. 1996, 118, 11225–11236. [Google Scholar] [CrossRef]
- Abraham, M.J.; Murtola, T.; Schulz, R.; Páll, S.; Smith, J.C.; Hess, B.; Lindahl, E. GROMACS: High performance molecular simulations through multi-level parallelism from laptops to supercomputers. SoftwareX 2015, 1, 19–25. [Google Scholar] [CrossRef]
- Martínez, L.; Andrade, R.; Birgin, E.G.; Martínez, J.M. PACKMOL: A package for building initial configurations for molecular dynamics simulations. J. Comput. Chem. 2009, 30, 2157–2164. [Google Scholar] [CrossRef]
- Humphrey, W.; Dalke, A.; Schulten, K. VMD: Visual molecular dynamics. J. Mol. Graph. 1996, 14, 33–38. [Google Scholar] [CrossRef]
- Wang, Z.; Yu, C.; Zhao, J.; Guo, P.; Liu, H. Molecular dynamics simulation for quantitative characterization of wettability transition on silica surface. J. Mater. Res. Technol. 2022, 19, 4371–4380. [Google Scholar] [CrossRef]
- Xu, J.; Zhan, S.; Wang, W.; Su, Y.; Wang, H. Molecular dynamics simulations of two-phase flow of n-alkanes with water in quartz nanopores. Chem. Eng. J. 2022, 430, 132800. [Google Scholar] [CrossRef]

Disclaimer/Publisher’s Note: The statements, opinions and data contained in all publications are solely those of the individual author(s) and contributor(s) and not of MDPI and/or the editor(s). MDPI and/or the editor(s) disclaim responsibility for any injury to people or property resulting from any ideas, methods, instructions or products referred to in the content. |
© 2025 by the authors. Licensee MDPI, Basel, Switzerland. This article is an open access article distributed under the terms and conditions of the Creative Commons Attribution (CC BY) license (https://creativecommons.org/licenses/by/4.0/).
Share and Cite
Liu, Y.; Pei, X.; Yang, F.; Zhong, J.; Dai, L.; Wang, C.; Zhou, T.; Li, Y.; Xiao, S. Molecular Simulation Study of Gas–Water Adsorption Behavior and Mobility Evaluation in Ultra-Deep, High-Pressure Fractured Tight Sandstone Reservoirs. Energies 2025, 18, 2175. https://doi.org/10.3390/en18092175
Liu Y, Pei X, Yang F, Zhong J, Dai L, Wang C, Zhou T, Li Y, Xiao S. Molecular Simulation Study of Gas–Water Adsorption Behavior and Mobility Evaluation in Ultra-Deep, High-Pressure Fractured Tight Sandstone Reservoirs. Energies. 2025; 18(9):2175. https://doi.org/10.3390/en18092175
Chicago/Turabian StyleLiu, Yongfu, Xuehao Pei, Fenglai Yang, Junjie Zhong, Li Dai, Cuili Wang, Tingya Zhou, Yijia Li, and Sa Xiao. 2025. "Molecular Simulation Study of Gas–Water Adsorption Behavior and Mobility Evaluation in Ultra-Deep, High-Pressure Fractured Tight Sandstone Reservoirs" Energies 18, no. 9: 2175. https://doi.org/10.3390/en18092175
APA StyleLiu, Y., Pei, X., Yang, F., Zhong, J., Dai, L., Wang, C., Zhou, T., Li, Y., & Xiao, S. (2025). Molecular Simulation Study of Gas–Water Adsorption Behavior and Mobility Evaluation in Ultra-Deep, High-Pressure Fractured Tight Sandstone Reservoirs. Energies, 18(9), 2175. https://doi.org/10.3390/en18092175